research openaccess pitch-informedsoloandaccompaniment
TRANSCRIPT
Cano et al. EURASIP Journal on Advances in Signal Processing 2014, 2014:23http://asp.eurasipjournals.com/content/2014/1/23
RESEARCH Open Access
Pitch-informed solo and accompanimentseparation towards its use in music educationapplicationsEstefanía Cano1*, Gerald Schuller2 and Christian Dittmar1
Abstract
We present a system for the automatic separation of solo instruments and music accompaniment in polyphonicmusic recordings. Our approach is based on a pitch detection front-end and a tone-based spectral estimation. Weassess the plausibility of using sound separation technologies to create practice material in a music educationcontext. To better understand the sound separation quality requirements in music education, a listening test wasconducted to determine the most perceptually relevant signal distortions that need to be improved. Results from thelistening test show that solo and accompaniment tracks pose different quality requirements and should be optimizeddifferently. We propose and evaluate algorithm modifications to better understand their effects on objectiveperceptual quality measures. Finally, we outline possible ways of optimizing our separation approach to better suitthe requirements of music education applications.
1 IntroductionSound source separation is the signal processing task thatdeals with the extraction of unknown signals or sourcesfrom an audio mixture. In the case of musical signals, apossible sound source separation task would be to obtainindependent signals for the saxophone, piano, bass, andpercussion, given a recording or audio mixture of a jazzquartet.This paper focuses on a particular case of sound source
separation called solo and accompaniment separation,also referred to as lead or main instrument separation orde-soloing. For this specific task, the goal is to separate theaudio mix into two sources only: the main instrument orsolo and the accompaniment. The accompaniment refersto one or more instruments playing along with the solo.In the jazz quartet example, solo and accompanimentseparation would result in an independent track for thesaxophone (assuming that the saxophone plays the solopart in the track) and an accompaniment track composedof the piano, bass, and percussion. As the term backing
*Correspondence: [email protected] Institute for Digital Media Technology IDMT, Ilmenau 98693,GermanyFull list of author information is available at the end of the article
track is commonly used in the audio production commu-nity to refer to the accompaniment tracks, these two termsare used interchangeably throughout the paper. For thesolo/accompaniment separation task, the solo is assumedto be the instrument playing themain melody of the piece.In an attempt to have a clear definition to work with, themusic information retrieval (MIR) community commonlyrefers to main melody as the single (monophonic) pitchsequence that a listener might reproduce if asked to whis-tle or hum a piece of polyphonic music and that a listenerwould recognize as being the ‘essence’ of that music [1].After many years of sound separation research, results
suggest that separation performance can be improvedwhen prior information about the sources is available. Theinclusion of known information about the sources in theseparation scheme is referred to as informed sound sourceseparation (ISS) and comprises, among others, the use ofmusical instrument digital interface (MIDI)-like musicalscores, the use of pitch tracks of one or several sources,oracle sound separation where the original sources areavailable, and the extraction of model parameters fromtraining data of a particular sound source. The reader isreferred to [2] for a general overview of informed soundsource separation approaches.
© 2014 Cano et al.; licensee Springer. This is an Open Access article distributed under the terms of the Creative CommonsAttribution License (http://creativecommons.org/licenses/by/2.0), which permits unrestricted use, distribution, and reproductionin any medium, provided the original work is properly cited.
Cano et al. EURASIP Journal on Advances in Signal Processing 2014, 2014:23 Page 2 of 19http://asp.eurasipjournals.com/content/2014/1/23
The system described in this paper attempts to sep-arate solo instruments from music accompaniment inpolyphonic music using pitch as prior information.This approach will be referred to as pitch-informedsolo/accompaniment separation.
2 Research goals and paper outline2.1 Research goalWe attempt to develop of a system for solo and accom-paniment separation to be used in the music educationcontext. The system should be capable of separating maininstruments from music accompaniment, regardless ofthe type of solo instrument used, musical genre of thetrack, or type of music accompaniment. For the soloinstrument, only pitched instruments are considered andno attempt is made to separate percussive instruments.We focus on the monophonic case, where the solo instru-ment is assumed to play only one note at a time. Onlythe single-channel or monaural separation problem isaddressed where no spatial or panning information canbe used. The algorithm should be lightweight and pro-cessing times should be minimized to allow its use inreal-world applications. The usability of our algorithm in‘music education and practice’ applications is addressedby considering efficiency and quality requirements inthis context and proposing algorithm enhancements tomeet such requirements. A perceptual listening test inthe context of musical instrument learning is conductedto obtain practical insights on how to optimize our algo-rithm for this context. Refer to Section 5 for a shortintroduction about the use of MIR technologies in musiceducation.
2.2 Main contributionsThe main contributions of this research work are listedin the following categorized as major and minor contri-butions. Major contributions: (1) an efficient method forpitch-informed solo/accompaniment separation based onspectral estimation of tone objects. The tone-based pro-cessing is a musically meaningful segmentation of theaudio signal that allows the inclusion of known charac-teristics of instrumental tones such as the post-processingstage presented in Subsubsection 4.1.5 and commonamplitude modulation presented in Subsection 4.3 and(2) a novel method to include common amplitude mod-ulation (CAM) characteristics in the separation scheme.Minor contributions: (3) a novel listening test setupto evaluate the use of solo/accompaniment separationin music education applications. Results from the lis-tening test give clear directions on how to optimizeseparation algorithms to meet quality requirement ofmusic education applications, and (4) collection of a newdataset for solo/accompaniment separation where bothvocal and instrumental solos from different genres are
included. The dataset is publicly available to the researchcommunity.
2.3 Paper outlineTo introduce the reader to the state-of-the-art of separa-tion research and put our approach into context, a briefoverview of current sound source separation approachesis provided in Section 3. In Section 4, the details ofthe proposed system are described and its evaluationis presented in Subsection 4.2. Algorithm modificationsand their evaluation are presented in Subsection 4.3. InSection 5, we evaluate the use of solo/accompanimentseparation in ‘music education’ applications. Final com-ments and future directions are presented in Section 6.
3 Related workSeveral techniques have been proposed in the literaturefor the solo and accompaniment separation task. Eachapproach takes advantage of different signal properties ormodels the separation problem in slightly different ways:sparsity constraints, spatial cues, source models, and priorinformation are all different approaches that have beenapplied in the separation task.Signal sparsity for example, has been exploited in several
approaches. In [3], a system for singing voice separationis proposed where the singing voice is modeled as a high-rank but sparse signal in the time-frequency domain. Onthe other hand, the accompaniment is modeled as a low-rank signal due to its assumed repetitive structure. Robustprincipal component analysis (RPCA) is used as factor-ization scheme to extract the desired sources. Anotherapproach that takes advantage of the repetitive structureof the accompaniment is presented in [4]. The systemfirst identifies the repeating period p of the signal usingan autocorrelation approach to calculate a beat spectrum.The algorithm thenmodels the repeating segment S as theelement-wise median of the r segments of length p in thespectrogram. The repeating patterns are finally extractedusing a soft masking approach.Other approaches have used spatial cues for source
localization to perform the separation task. In [5], anapproach for singing voice extraction in stereo recordingsis presented. Here, panning information in conjunctionwith a probabilistic pitch tracking approach is used. Alatency of 250 ms is achieved allowing online process-ing. Other approaches that have used spatial cues in theseparation task are presented in [6] and [7].Source/filtermodels are often used tomodel solo instru-
ments and the voice. The system described in [8] proposesa mid-level representation of the audio signal assuming aninstantaneous mixture model (IMM) of the target sourceand the residual. The solo instrument is represented witha source/filter model where the source carries pitch infor-mation and the filter timbral information. Non-negative
Cano et al. EURASIP Journal on Advances in Signal Processing 2014, 2014:23 Page 3 of 19http://asp.eurasipjournals.com/content/2014/1/23
matrix factorization (NMF) and soft masking are used toextract the final signals.Pitch has also been used as prior information when
performing separation. Some approaches make use of f 0(fundamental frequency) sequences extracted with pitchdetection algorithms as front-ends. Others, directly useMIDI-like symbolic music representations. While usingpitch detection is a flexible approach that only requires theoriginal mix, separation performance completely relieson the results obtained from the pitch detection front-end. Score-informed separation removes the difficultiesinherent to pitch extraction but also comes with its ownchallenges. Due to artistic liberties taken in musical per-formances, audio recordings will never be completely syn-chronized with music scores. It is then necessary, beforeany separation is attempted, to align score and audio asprecisely as possible. A common approach to address thisissue is the use of dynamic time warping (DTW) to findthe optimal match between the two sequences. In [9]for example, a system for high-resolution synchroniza-tion of audio streams via chroma-based onset features ispresented. In [10], the authors present a score-informedseparation algorithm based on probabilistic latent com-ponent analysis (PLCA). PLCA can be understood as aprobabilistic interpretation of NMF which decomposesthe magnitude spectrogram as a sum of outer productsof spectral and temporal components; its major bene-fit being the possibility to incorporate prior distributionsin the decomposition. The system uses score informa-tion to separate the harmonic instruments in the audiomix and DTW to synchronize the score to the audiotrack. Synthesized versions of the score parts correspond-ing to each audio source are decomposed into temporaland spectral components using PLCA. These componentsare then used as prior distributions in the PLCA decom-position of the original mix. In [11], a method for soloinstrument separation in stereo recordings is proposed.The system uses MIDI-like scores of the lead instrumentas prior information and chroma-based DTW to addressglobal misalignments between the score and the audiosignal. A MIDI confidence measure is proposed to dealwith small-scale misalignments. The confidence measuregives a lower weight to attack and offset regions of eachnote and a higher weight to the sustained part of thenotes. The aligned score information is used as a roughpitch estimate of the lead instrument and used to guidea pitch tracking stage. A two-step Viterbi algorithm isused to refine the pitch track obtained from the score.For each frame, a set of probabilities is computed basedon the score information, pitch likelihood, and a transi-tion probability based on frequency continuity. The firstViterbi step delivers one f 0 value per frame; the sec-ond Viterbi step finds the best path in the matrix. Aharmonic mask and a pan-frequency mask are used to
filter the solo instrument from the mixture. The systemis tested on a specially produced dataset of 13 excerptswhere the solo instrument is played by a human per-former and centrally panned. The accompaniment is spa-tially distributed and synthetically produced with soundlibraries. Other score-informed separation approaches arepresented in [12] and [13], and a thorough overviewof score-informed separation approaches is presentedin [14].An interesting approach is presented in [15] where
computational auditory scene analysis (CASA) elementsare introduced in the separation scheme. The systemattempts to separate sound sources in monaural record-ings usingmulti-pitch information of the sources obtainedeither from a MIDI-like score or from the multi-pitchdetection algorithm presented by Klapuri in [16]. Themulti-pitch information is used to differentiate over-lapped harmonics from non-overlapped ones. This is per-formed by assuming harmonicity of the sources and bythe use of a frequency threshold that assigns a set offrequency bins to a given harmonic. Harmonic masksare created for each of the sources by first refining thepitch estimates as the weighted average of the instan-taneous frequency of the harmonics divided by theirharmonic number. A new set of frequency bins is thenassigned to each harmonic based on the refined pitchestimate. In the case of overlapped harmonics, the CAMprinciple (which is further explained in Subsection 4.3)is applied in a least square estimation. The underlyingassumption here is that the amplitude envelopes of theharmonic components of a source are correlated. In thissystem, the envelope of the strongest non-overlapped har-monic is used to estimate the envelopes of the overlappedones. The system is evaluated with a dataset createdfrom 20 MIDI files of Bach quartets where either twoor three of the voices are created by inserting instru-ment notes taken from the RWC music instrumentsdataset.One of the main difficulties of pitch-informed sound
separation is the fact that errors in the pitch detectionstage inevitably propagate to the separation stage. Bear-ing this in mind, some approaches have been proposedfor supervised pitch extraction with a consequent separa-tion scheme [17-19]. In [20] for example, a probabilisticmodel of the constant Q transform (CQT) is proposedfor the estimation of polyphonic pitch content. Notes aremodeled with time-frequency activations and normalizedharmonic spectra. A sparseness prior is introduced forthe note activations to guarantee that the data will berepresented with the least amount of active notes possi-ble. Through a specially designed interface, the user canchoose the pitches to be extracted by clicking on them.Separation is performed with time-frequency masking inthe CQT domain.
Cano et al. EURASIP Journal on Advances in Signal Processing 2014, 2014:23 Page 4 of 19http://asp.eurasipjournals.com/content/2014/1/23
Tensor factorization approaches have also been pro-posed to address the separation task [21]. In [22], a gen-eralized coupled tensor factorization (GCTF) approachis used to jointly include harmonic information from anapproximate score and spectral information from instru-ment recordings. The system uses music scores as priorinformation but relaxes the alignment constraint betweenscore and audio. The authors showed that a strict align-ment between audio and score is not necessary when noteco-occurrences, which are the same in the score and audiosignal, are exploited.Some systems have been proposed that use existing
example signals to perform separation. In [23], prior infor-mation is given in the form of multi-track signals of acover interpretation of the song that guide the separa-tion process. In [24], the user provides a version of thetarget source by humming the desired melody line. Sim-ilarly, in [25], an approach for common signal extractionis proposed with the goal of extracting a common musicaccompaniment among a set of soundtracks with lyrics indifferent languages. The common signal is in this case, theaccompaniment music plus effects which is the same in allthe soundtracks.
4 Proposed systemIn the following sections, our proposed method isdescribed and evaluated. First, an overview of the sys-tem is presented where each of the processing stages isdescribed. The performance of the algorithm is then eval-uated on a new dataset described in Subsubsection 4.2.1.To place our algorithm in context of state-of-the-artapproaches, results from the Signal Separation EvaluationCampaign (SiSEC 2013) are presented. Finally, a series ofalgorithm variations are described and their effects on thequality of resulting tracks are evaluated.
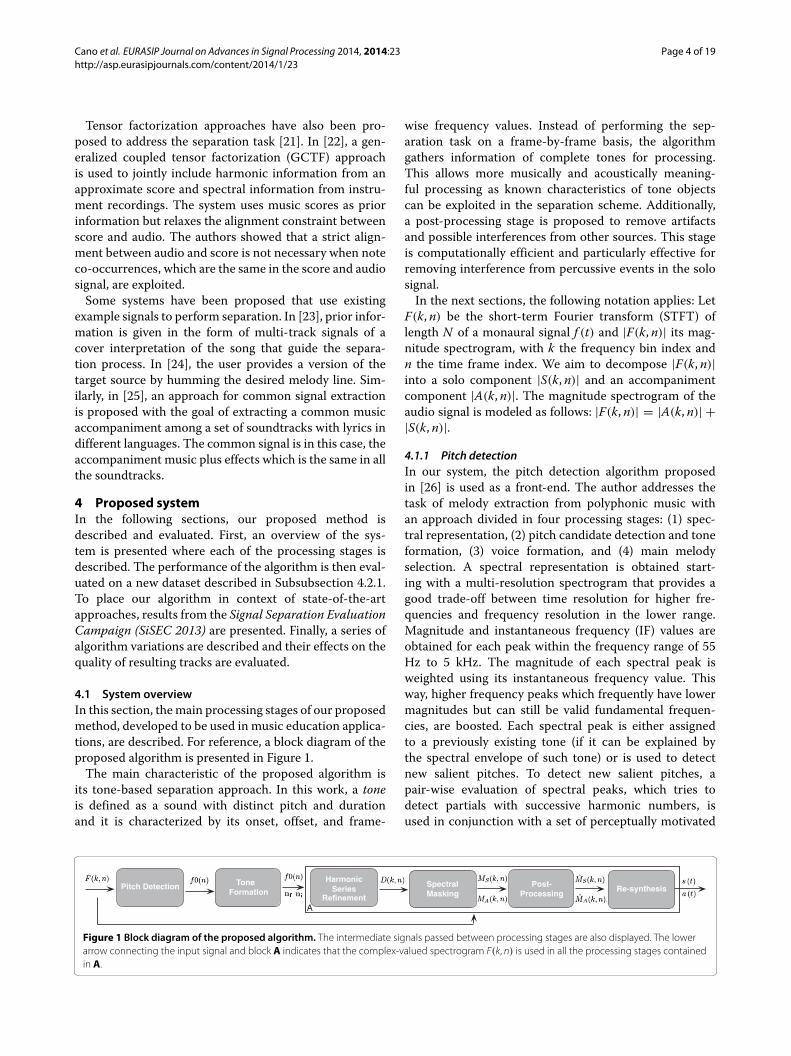
4.1 System overviewIn this section, themain processing stages of our proposedmethod, developed to be used in music education applica-tions, are described. For reference, a block diagram of theproposed algorithm is presented in Figure 1.The main characteristic of the proposed algorithm is
its tone-based separation approach. In this work, a toneis defined as a sound with distinct pitch and durationand it is characterized by its onset, offset, and frame-
wise frequency values. Instead of performing the sep-aration task on a frame-by-frame basis, the algorithmgathers information of complete tones for processing.This allows more musically and acoustically meaning-ful processing as known characteristics of tone objectscan be exploited in the separation scheme. Additionally,a post-processing stage is proposed to remove artifactsand possible interferences from other sources. This stageis computationally efficient and particularly effective forremoving interference from percussive events in the solosignal.In the next sections, the following notation applies: Let
F(k, n) be the short-term Fourier transform (STFT) oflength N of a monaural signal f (t) and |F(k, n)| its mag-nitude spectrogram, with k the frequency bin index andn the time frame index. We aim to decompose |F(k, n)|into a solo component |S(k, n)| and an accompanimentcomponent |A(k, n)|. The magnitude spectrogram of theaudio signal is modeled as follows: |F(k, n)| = |A(k, n)| +|S(k, n)|.4.1.1 Pitch detectionIn our system, the pitch detection algorithm proposedin [26] is used as a front-end. The author addresses thetask of melody extraction from polyphonic music withan approach divided in four processing stages: (1) spec-tral representation, (2) pitch candidate detection and toneformation, (3) voice formation, and (4) main melodyselection. A spectral representation is obtained start-ing with a multi-resolution spectrogram that provides agood trade-off between time resolution for higher fre-quencies and frequency resolution in the lower range.Magnitude and instantaneous frequency (IF) values areobtained for each peak within the frequency range of 55Hz to 5 kHz. The magnitude of each spectral peak isweighted using its instantaneous frequency value. Thisway, higher frequency peaks which frequently have lowermagnitudes but can still be valid fundamental frequen-cies, are boosted. Each spectral peak is either assignedto a previously existing tone (if it can be explained bythe spectral envelope of such tone) or is used to detectnew salient pitches. To detect new salient pitches, apair-wise evaluation of spectral peaks, which tries todetect partials with successive harmonic numbers, isused in conjunction with a set of perceptually motivated
Tone Formation
Pitch DetectionHarmonic
Series Post-
ProcessingSpectralMasking
Re-synthesis
A
Figure 1 Block diagram of the proposed algorithm. The intermediate signals passed between processing stages are also displayed. The lowerarrow connecting the input signal and block A indicates that the complex-valued spectrogram F(k, n) is used in all the processing stages containedin A.
Cano et al. EURASIP Journal on Advances in Signal Processing 2014, 2014:23 Page 5 of 19http://asp.eurasipjournals.com/content/2014/1/23
ratings. These ratings include a harmonicity thresholddefined as a maximum deviation of 120 cents from theexact harmonic interval between the peaks, a measureto guarantee a degree of spectral smoothness, and aharmonic impact measure that reduces the impact ofhigher harmonics. In the voice formation stage, each voiceis characterized by its magnitude and frequency range.A tone is assigned to a voice if it passes the magni-tude threshold and lies within the frequency range ofthe voice. After different voices have been created, themost salient stream is selected as the main melody. Incases where no clear difference exists between the mag-nitude of two voices, a frequency weighting is appliedthat gives lower weight to voices in the lower frequencyrange.During pitch extraction, an analysis frame of 46 ms
was used in conjunction with a hop size of 5.8 ms. Thepitch detection algorithm returns fundamental frequencysequences f 0(n) of the main melody on a frame-by-framebasis. Unpitched frames are marked with f 0(n) = 0 Hz.
4.1.2 Tone formationThe goal of the tone formation stage is to createtone objects from the f 0(n) sequence delivered by thepitch detection stage. The importance of the tone-based separation is that it allows a musically meaningfulsegmentation of the audio signal. This segmentationtakes advantage of known characteristics of musicaltones (such as the post-processing stage presented inSubsubsection 4.1.5 and the common amplitude modula-tion approach described in Subsection 4.3). Furthermore,it yields an efficient processing with minimal memoryrequirements.The raw f 0 estimates from the pitch detection stage
are analyzed over time to create tone objects. When nomelody is detected, the pitch detection stage delivers f 0values equal to 0 Hz. A new tone is only started whenan f 0 value in the [65 Hz, 2,000 Hz] range is found. Thisrange roughly corresponds to 5 octaves starting in C2 andending in B6. After the start of a tone has been detected,a moving average filter of length La = 3 frames is usedto calculate the mean frequency value ˆf 0(n) in the timeinterval defined by the filter length La. That is:
ˆf 0(n) = 1La
La−1∑j=0
f 0(n − j) (1)
The end of a tone is defined either by a new f 0 = 0 Hz(no tone was detected) or by a mean frequency variationlarger than a semitone (a new tone has started). Low andhigh semitone intervals from ˆf 0(n) are calculated usingthe cent units of measure. The interval is then given by[ ˆf 0(n)/2(100/1,200) , 2(100/1,200) ˆf 0(n)]. To remove any spu-rious tones, a minimum tone length of 100 ms which is
roughly a 16th note at 140 bpm is defined. After this stage,each tone object is defined by its start frame ni, end framenf , and an IF value for each of the frames in the tone.Capturing frame-wise IF values allows minor pitch varia-tions that can occur within a tone. We define ni and nf asthe vectors containing the start and end frames of all thedetected tones, respectively.
4.1.3 Harmonic series estimationThe goal of this stage is to construct a harmonic seriesthat represents the solo instrument and that is consistentwith the tone objects found in the previous stage. Twounderlying principles are used: (1) each harmonic com-ponent is allowed to have an independent deviation fromthe calculated ideal location of the harmonic, i.e., multi-ple integer of the fundamental frequency. (2) The acousticdifferences between the voice, string, and wind instru-ments need to be considered when harmonic componentsare located. Namely, inharmonicity characteristics differbetween instrument families. A well known characteristicof conical bore instruments, for example, is the flatten-ing of upper resonances in relation to the fundamentalcomponent due to open end corrections in the tone holelattice [27]. In contrast, string instruments experienceinharmonicty patterns that deviate to the higher end ofthe calculated harmonic location [28]. The harmonic esti-mation stage is kept consistent with either lower or higherdeviations from harmonic locations but never a mix ofboth.We use the index p as the partial index, with p = 1
representing the fundamental frequency and p = pmaxrepresenting the highest partial considered in each tone.We also define kp(n) as the frequency bin of the ideal par-tial location of partial p (calculated as integer multipleof the fundamental frequency). Finally, we define δmax asthe maximum frequency deviation that each partial p isallowed to have from its ideal harmonic location.For each time frame n in the range defined by [ni, nf ],
where ni is the initial detected frame of the tone, and nfis the final frame of the tone, we define a frequency bandgiven by [kp(n) − δmax, kp(n) + δmax] where we searchfor the observed partial location. We conduct an iterativesearch in the vicinity of the ideal partial location kp(n) forall partials with partial index p = 2, . . . , pmax. For eachpartial index p, the search returns the frequency bin kp(n)
where we detect the observed harmonic with the largestamplitude. A detection mask D(k, n), where we mark theobserved harmonics with 1 for each frame, is defined fork in the [1,N/2] range:
D(k, n) ={1 if k = kp(n)
0 otherwise(2)
Cano et al. EURASIP Journal on Advances in Signal Processing 2014, 2014:23 Page 6 of 19http://asp.eurasipjournals.com/content/2014/1/23
4.1.4 Spectral maskingAfter the complete harmonic series has been estimated,initial binary spectral masks for the solo MS(k, n) andaccompaniment MA(k, n) are created. At this stage, eachtime-frequency tile is defined either as part of the soloinstrument or part of the accompaniment. To compensatefor spectral leakage in the time-frequency transform, a tol-erance band � centered at the observed partial locationkp(n), is included in the masking procedure. Thus, for afrequency range kp(n) − � ≤ k ≤ kp(n) + � and timeframe n ∈ [ni, nf ] we have:
(MS(k, n),MA(k, n)) ={
(1, 0) if D(k, n) = 1(0, 1) otherwise
(3)
4.1.5 Post-processingThe post-processing stage evaluates each tone as a wholeand addresses the following: (1) attack frames, and (2)interference of transients in the solo signals.The pitch detection algorithm requires a few processing
frames before a valid f 0 value can be detected. This delayis because clear spectral peaks are needed for the estima-tion, and this mostly happens in the sustained part of thetone.To compensate for this inherent delay, a region of 70 ms
before the initially found start of each tone ni, is modified.The observed harmonic structure MS(k, ni) in frame ni isreplicated in all the frames 70 ms before ni.Overlapping of spectral information from different
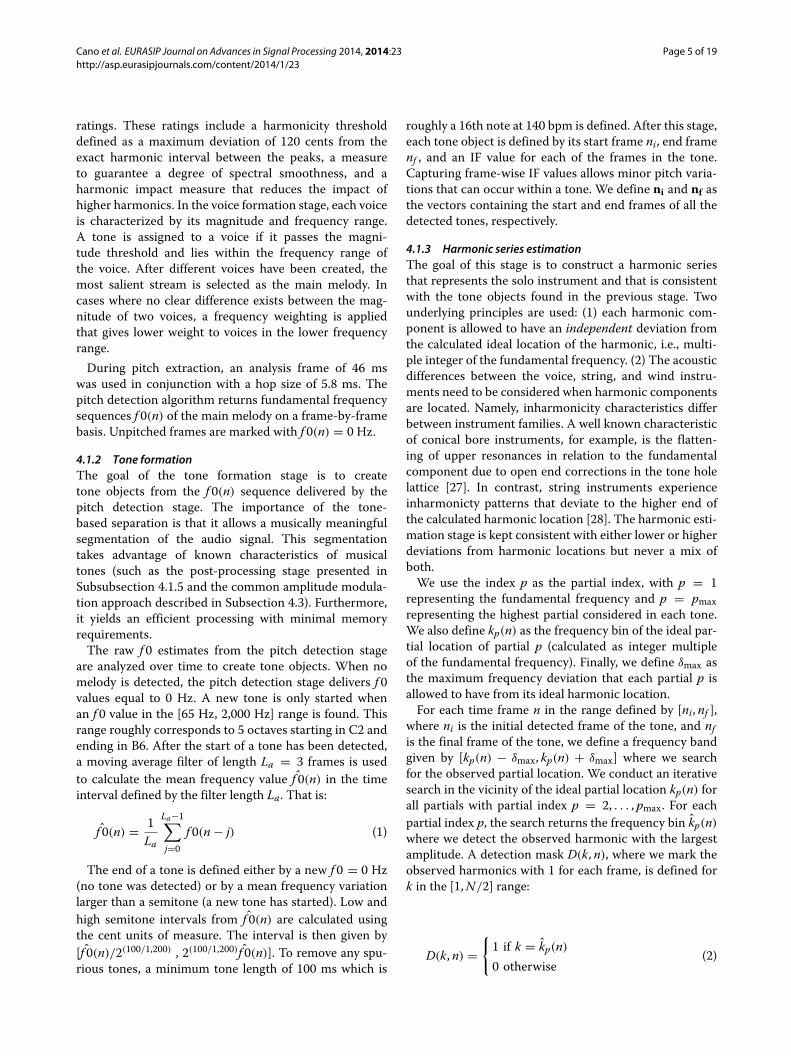
sources often causes percussion hits and attacks fromother sources to be detected as part of a tone of thetarget source. Bearing in mind that percussion onsetsare evident in the spectrogram as vertical events occur-ring in a short time interval [29], an additional analysisis performed where sudden magnitude peaks occurringsimultaneously in several harmonic components, aredetected.An example saxophone tone where such events can
be observed is shown in Figure 2. The figure shows theestimated tone before post-processing. The red arrowsindicate two percussive hits that were initially estimated aspart of the solo signal. Even when the magnitudes of theseevents are not particularly large in comparison to thelower partials of the tone, the perceptual impact of suchevents is considerable, being in most cases clearly audibleand disturbing. It can be observed that these events arecommon to all harmonics and occur in a short interval oftime.To detect these transients in the solo signal, the tempo-
ral envelope of each partial, denoted ep(n), is smoothedwith a median filter of length L. Let M denote medianfiltering. The smoothed magnitude envelopes are thusobtained as follows: ep(n) = M{ep(n), L}. The smoothedmagnitude envelopes ep(n) are normalized to the [0, 1]
range. As the perceptual impact of transients is strongerfor higher partials, we define plow as the lowest partialindex considered for the detection of transients. Thisanalysis is only performed for partials with partial indexp > plow. We define a magnitude threshold γL, and forall partials with partial index p > plow, we detect thetime frames where the normalized smoothed magnitudeenvelopes have amplitudes larger than γL. As the suddenmagnitude peaks should be simultaneously observed inseveral partials, we define minp as the minimum numberof partials where a magnitude value larger than γL has tobe observed for the event to be considered a transient.To remove the detected transients, the value of the solo
spectral mask MS(k, n) in the time frame where the tran-sient was detected is replaced by the mean magnitudevalue of the normalized smoothed magnitude envelope μein the L time frames before the transient was detected:Let kt and nt be the frequency bin and time frame wherethe transient was detected, respectively. The mean valueμe is then calculated as follows: μe = 1
L∑L
j=1 ep(nt − j).The new value of the spectral mask is then given byMS(kt , nt) = μe. This introduces a smoothness constraintin the temporal envelopes of the partials. The numberof time frames that determine the smoothness constraintof the temporal envelopes is given by the filter length L.The new spectral mask is no longer binary and is denotedMS(k, n). The accompaniment mask is also recalculated asMA(k, n) = 1 − MS(k, n).The effect of the transient removal stage can be
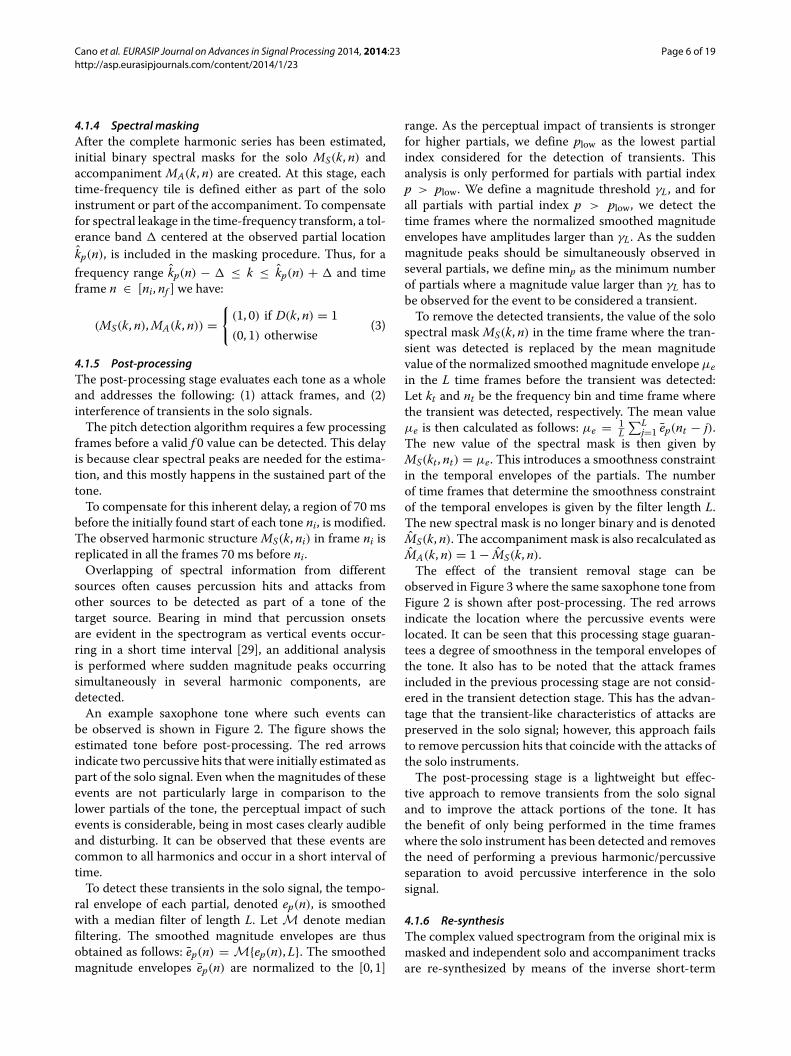
observed in Figure 3 where the same saxophone tone fromFigure 2 is shown after post-processing. The red arrowsindicate the location where the percussive events werelocated. It can be seen that this processing stage guaran-tees a degree of smoothness in the temporal envelopes ofthe tone. It also has to be noted that the attack framesincluded in the previous processing stage are not consid-ered in the transient detection stage. This has the advan-tage that the transient-like characteristics of attacks arepreserved in the solo signal; however, this approach failsto remove percussion hits that coincide with the attacks ofthe solo instruments.The post-processing stage is a lightweight but effec-
tive approach to remove transients from the solo signaland to improve the attack portions of the tone. It hasthe benefit of only being performed in the time frameswhere the solo instrument has been detected and removesthe need of performing a previous harmonic/percussiveseparation to avoid percussive interference in the solosignal.
4.1.6 Re-synthesisThe complex valued spectrogram from the original mix ismasked and independent solo and accompaniment tracksare re-synthesized by means of the inverse short-term
Cano et al. EURASIP Journal on Advances in Signal Processing 2014, 2014:23 Page 7 of 19http://asp.eurasipjournals.com/content/2014/1/23
20 40 60 80 100 120 140 160 180
5
10
15
20
10
20
30
40
50
60
70
80
90
Harmonic N
umber
Estimated saxophone tone before prost−processing
Time Frame
Mag
nitu
de
Figure 2 Estimated saxophone tone before post-processing. The red arrows indicate the places where elements from two percussive eventsare mistakenly taken as being part of the solo instrument.
Fourier transform (ISTFT). In our approach, no attemptis made to estimate the phase of the target sources, andthe phase of the original mix is used for re-synthesis ofboth sources. The solo and accompaniment spectrogramsare given by S(k, n) = F(k, n) ⊗ MS(k, n) and A(k, n) =F(k, n) ⊗ MA(k, n), respectively. Here, ⊗ denotes theHadamard product. The resulting solo and accompani-ment tracks are then s(t) = ISTFT (S(k, n)) and a(t) =ISTFT (A(k, n)).
4.2 EvaluationIn this section, the performance of our proposed methodis evaluated. Three important factors were considered for
this evaluation. (1) As algorithm robustness under var-ious signal conditions is of critical importance for ourproposed application, special effort was made to cre-ate a dataset as varied as possible containing both vocaland instrumental tracks. (2) The quality of both the soloand the accompaniment tracks are of critical importancefor the proposed application, and for that matter, theevaluation and analysis of results are always conductedseparately for solo and accompaniment tracks. (3) Bear-ing in mind that quality requirements are different forall applications, the importance of each of the qualitymeasures is highly dependent on the application at hand.For this matter, the general quality of the signals as
20 40 60 80 100 120 140 160 180
5
10
15
20
10
20
30
40
50
60
70
80
90
Harmonic Number
Estimated saxophone tone after post−processing
Time Frames
Mag
nitu
de
Figure 3 Estimated saxophone tone same as in Figure 2 after the post-processing stage has been applied. The red arrows indicate theplaces where elements from two percussive events had been originally assigned to the solo instrument. As can be observed, the post-processingstage greatly reduces the interference from percussive hits in the solo signal.
Cano et al. EURASIP Journal on Advances in Signal Processing 2014, 2014:23 Page 8 of 19http://asp.eurasipjournals.com/content/2014/1/23
well as the particular distortion measures (explained inSubsubsection 4.2.2) are analyzed independently.
4.2.1 DatasetTo guarantee robustness in the performance of our algo-rithm over a wide range of signal conditions, musicalgenres, and instrumentations, a new dataset ofmulti-trackrecordings was collected. Several important factors wereconsidered when collecting the dataset. (1) All the signalshad to be copyright-free to allow the dataset to be madepublicly available. (2) Both vocal and instrumental trackshad to be included. The new dataset contains both femaleand male singers, as well as instrumental solos from theclarinet, saxophone, trumpet, electric guitar, acoustic gui-tar, whistle, and kazoo. (3) Different musical genres suchas classical, pop, rock, and jazz were included in the newdataset. In particular, different instrumentations includ-ing percussive instruments were considered. Percussiveinstruments have proven to be challenging in solo instru-ment separation often creating undesired artifacts andtransients in the solo signals.The dataset is composed of 17 multi-track recordings:
10 tracks with vocal solos and 7 tracks with differentinstrumental solos. The recordings were collected fromdifferent sources: SiSEC [30], TRIOS Dataset [31], andCCMixter [32]. All the signals were re-mixed to obtainsolo, backing, and mix signals. The dataset used and adescription of the individual signals are available on ourproject website [33].
4.2.2 ResultsThe PEASS toolbox [34] was used to evaluate qualityof the separated signals. This toolbox presents a fam-ily of four objective measures to assess the perceptualsalience of the target distortion, interference, and arti-facts. The family of objective measures is composed of theoverall perceptual score (OPS), the target-related percep-tual score (TPS), the interference-related perceptual score(IPS), and the artifacts-related perceptual score (APS). Allthe measures take values from 0 to 100 with higher valuesindicating better perceptual quality. The PEASS toolkitwas chosen for the evaluation as it is the only available setof quality measures that incorporates both objective andsubjective elements. Furthermore, this toolkit is widelyused in the separation community and it is the cho-sen evaluation method in public separation campaigns asSiSEC (see Subsubsection 4.2.4 for more information onthe SiSEC campaigns). Using state-of-the-art quality mea-sures allows comparison of results with other approaches.Additionally, the resulting signals are also made availablefor listening on our results website [33].The entire dataset was processed with our method, and
perceptual quality measures were calculated. The follow-ing processing parameters were used: pmax = 25 based on
observations of different instrument spectra.Wind instru-ments in particular can exhibit up to 25 clear harmoniccomponents. The tolerance band was set to � = 1. Largervalues of � would result in perceptible interference fromother sources in the target source. For the post-processingstage, plow = 9 was selected as higher values showed tobe too restrictive and failed to remove certain percussiveinterferences. The minimum number of partials used fortransient detection was set to minp = 6. A filter lengthvalue L = 5 and γL = 0.6 were used as they showed to bea good balance between proper handling of spectral leak-age and magnitude variations in magnitude envelopes. Ananalysis frame of 46 ms was used in conjunction with ahop size of 5.8 ms.In order to better assess the performance of our pro-
posed method, all the tracks from the dataset were manu-ally processed by musical experts to extract ground truthpitch information. The Songs2See Editor interface [19]was used for this matter. The pitch sequences of the soloinstrument were manually corrected up to the time andfrequency precision offered by the software; however, aframe-wise precision cannot be guaranteed. The extractedground truth pitch sequences were used as prior infor-mation for our proposed method (bypassing the pitchdetection stage), and separation was conducted for thecomplete dataset.The resulting objective perceptual measures are pre-
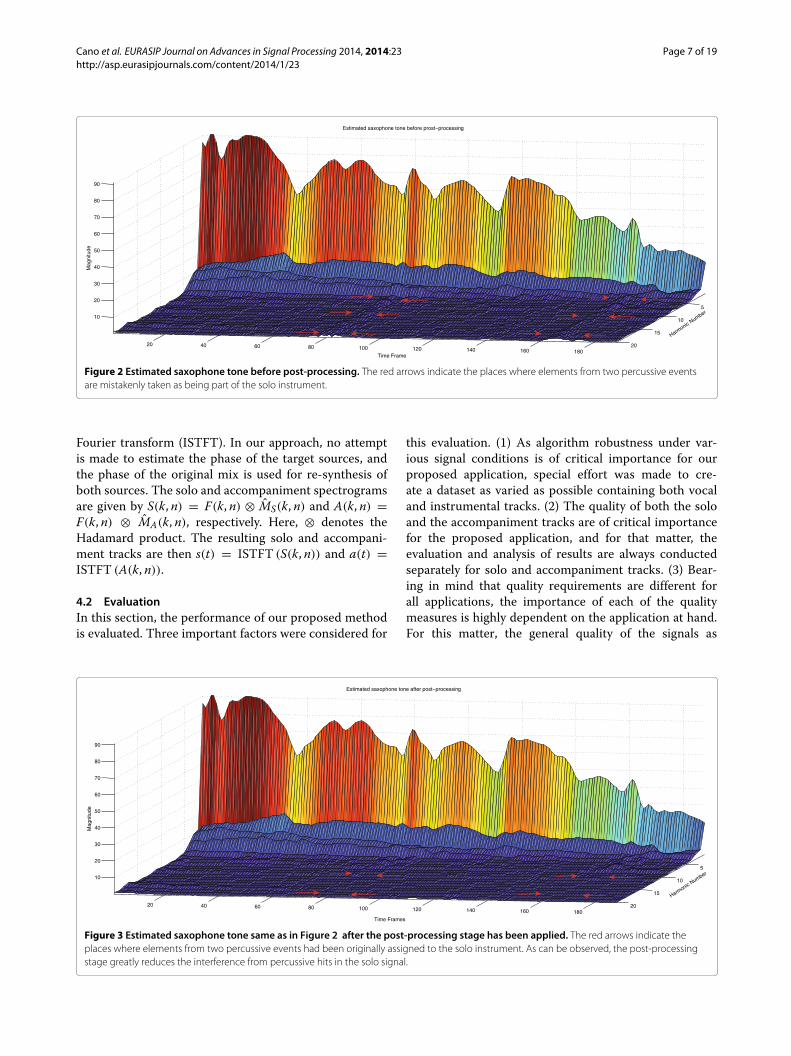
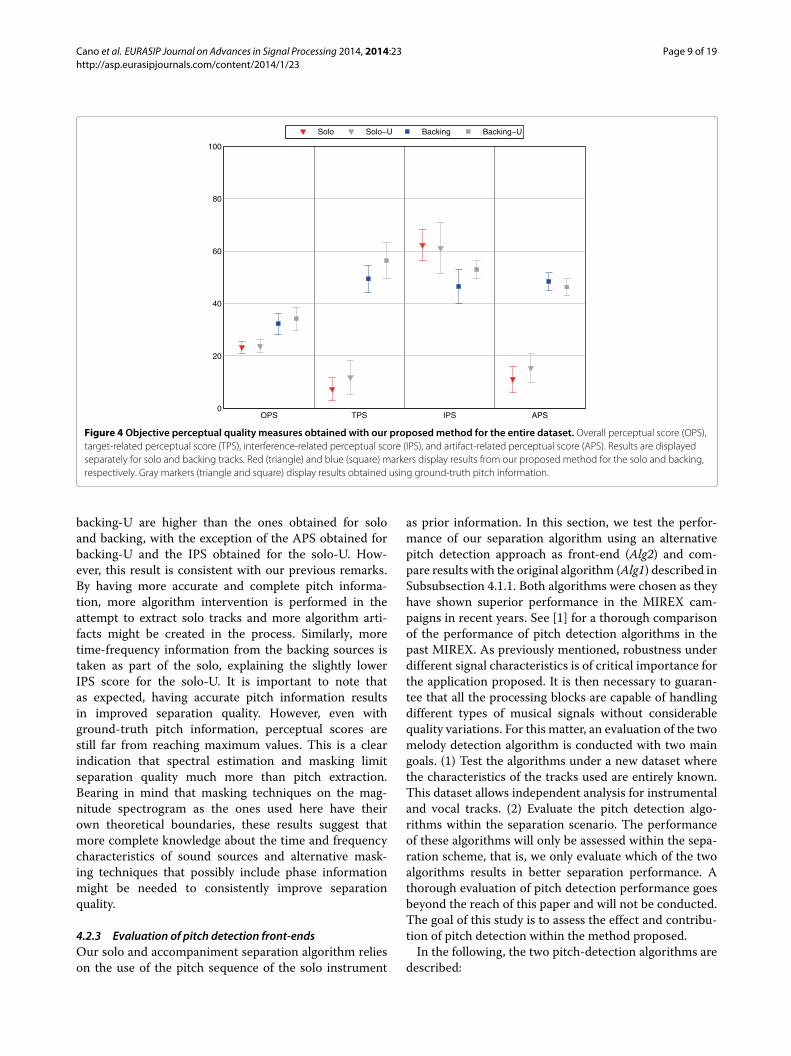
sented in Figure 4. Results are displayed separately forthe solo and backing tracks both with the fully auto-matic method and with ground-truth pitch information.Mean values with 95% confidence intervals are pre-sented. In this section, results for the automatic algorithmwill be referred to as solo and backing. Results usingground-truth information will be referred to as solo-U andbacking-U.Consistently high IPS were obtained for the solo signals.
This evidences the fact that special care was taken, spe-cially in the post-processing stage (Subsubsection 4.1.5),to remove all traces of interference in the solo signals.However, such IPS scores come at the expense of lowTPS and APS. These results suggest that our spectralestimation approach might be too strict, resulting in tar-get sources reconstructed out of accurate but restrictedtime-frequency information. For the backing tracks, morehomogeneous measures were obtained. Results for thebacking tracks show high TPS as well as high APS. Theseresults support once again the fact that a very conser-vative solo extraction approach has been taken, resultingin a minimum amount of intervention for the extractionof backing tracks and resulting in high APS and TPSscores.Important conclusions can also be drawn by analyz-
ing the scores obtained with ground truth information.As expected, all the scores obtained for solo-U and
Cano et al. EURASIP Journal on Advances in Signal Processing 2014, 2014:23 Page 9 of 19http://asp.eurasipjournals.com/content/2014/1/23
OPS TPS IPS APS0
20
40
60
80
100
Solo Solo−U Backing Backing−U
Figure 4 Objective perceptual quality measures obtained with our proposedmethod for the entire dataset. Overall perceptual score (OPS),target-related perceptual score (TPS), interference-related perceptual score (IPS), and artifact-related perceptual score (APS). Results are displayedseparately for solo and backing tracks. Red (triangle) and blue (square) markers display results from our proposed method for the solo and backing,respectively. Gray markers (triangle and square) display results obtained using ground-truth pitch information.
backing-U are higher than the ones obtained for soloand backing, with the exception of the APS obtained forbacking-U and the IPS obtained for the solo-U. How-ever, this result is consistent with our previous remarks.By having more accurate and complete pitch informa-tion, more algorithm intervention is performed in theattempt to extract solo tracks and more algorithm arti-facts might be created in the process. Similarly, moretime-frequency information from the backing sources istaken as part of the solo, explaining the slightly lowerIPS score for the solo-U. It is important to note thatas expected, having accurate pitch information resultsin improved separation quality. However, even withground-truth pitch information, perceptual scores arestill far from reaching maximum values. This is a clearindication that spectral estimation and masking limitseparation quality much more than pitch extraction.Bearing in mind that masking techniques on the mag-nitude spectrogram as the ones used here have theirown theoretical boundaries, these results suggest thatmore complete knowledge about the time and frequencycharacteristics of sound sources and alternative mask-ing techniques that possibly include phase informationmight be needed to consistently improve separationquality.
4.2.3 Evaluation of pitch detection front-endsOur solo and accompaniment separation algorithm relieson the use of the pitch sequence of the solo instrument
as prior information. In this section, we test the perfor-mance of our separation algorithm using an alternativepitch detection approach as front-end (Alg2) and com-pare results with the original algorithm (Alg1) described inSubsubsection 4.1.1. Both algorithms were chosen as theyhave shown superior performance in the MIREX cam-paigns in recent years. See [1] for a thorough comparisonof the performance of pitch detection algorithms in thepast MIREX. As previously mentioned, robustness underdifferent signal characteristics is of critical importance forthe application proposed. It is then necessary to guaran-tee that all the processing blocks are capable of handlingdifferent types of musical signals without considerablequality variations. For this matter, an evaluation of the twomelody detection algorithm is conducted with two maingoals. (1) Test the algorithms under a new dataset wherethe characteristics of the tracks used are entirely known.This dataset allows independent analysis for instrumentaland vocal tracks. (2) Evaluate the pitch detection algo-rithms within the separation scenario. The performanceof these algorithms will only be assessed within the sepa-ration scheme, that is, we only evaluate which of the twoalgorithms results in better separation performance. Athorough evaluation of pitch detection performance goesbeyond the reach of this paper and will not be conducted.The goal of this study is to assess the effect and contribu-tion of pitch detection within the method proposed.In the following, the two pitch-detection algorithms are
described:
Cano et al. EURASIP Journal on Advances in Signal Processing 2014, 2014:23 Page 10 of 19http://asp.eurasipjournals.com/content/2014/1/23
1. Algorithm 1: pitch estimation by pair-wiseevaluation of spectral peaksThe first algorithm to be evaluated is the systempresented in [26] which was thoroughly described inSubsubsection 4.1.1.
2. Algorithm 2: melody extraction using pitch contourcharacterizationIn [1], the authors propose a method for melodyextraction from polyphonic music by pitch contourextraction and characterization. In this approach,pitch contours are defined as time continuoussequences of f 0 candidates grouped based onauditory streaming cues such as harmonicity, pitchcontinuity, and exclusive allocation. This approachis divided in four processing stages: (1) sinusoidextraction, (2) salience function, (3) pitch contourcreation, and (4) melody selection. For the sinusoidextraction, an equal loudness filter is first applied toenhance the frequencies to which the humanauditory system is more sensitive. The STFT isapplied and IF and instantaneous amplitude valuesare obtained using phase differences. In order toobtain a salience function, an approach whichcomputes the salience of a given frequency as thesum of the weighted magnitudes at integer multiplesof that frequency is used. A compression parameterand a magnitude threshold are defined to prune thepeak candidates and a frequency range of 55 Hz to1.76 kHz is considered. To create the pitchcontours, initial peak candidates are filtered using asalience threshold and a deviation threshold. Thesalience threshold is computed in relation to thehighest peak in the frame, and the deviationthreshold is calculated using the salience mean andstandard deviation of all remaining peaks. The finalpeaks are grouped into contours using heuristicsbased on auditory streaming cues. For each contoura set of features is calculated: pitch mean, pitchstandard deviation, contour mean salience, contourtotal salience, contour salience deviation, length,and vibrato presence. For the melody selectionstage, an initial voicing detection stage determineswhen the main melody is present and when it is notby setting a voicing threshold slightly below theaverage contour mean salience. Octave errors arealso addressed by comparing pitch trajectories,which in case of octave relationships, will be almostidentical with an octave separation. The correctcontour is always assumed to be the most salient ofthe two and has to be somehow continuous with theother melody contours. If more than one contourare still present in a certain frame, the melody isselected as the peak belonging to the contour withthe highest total salience.
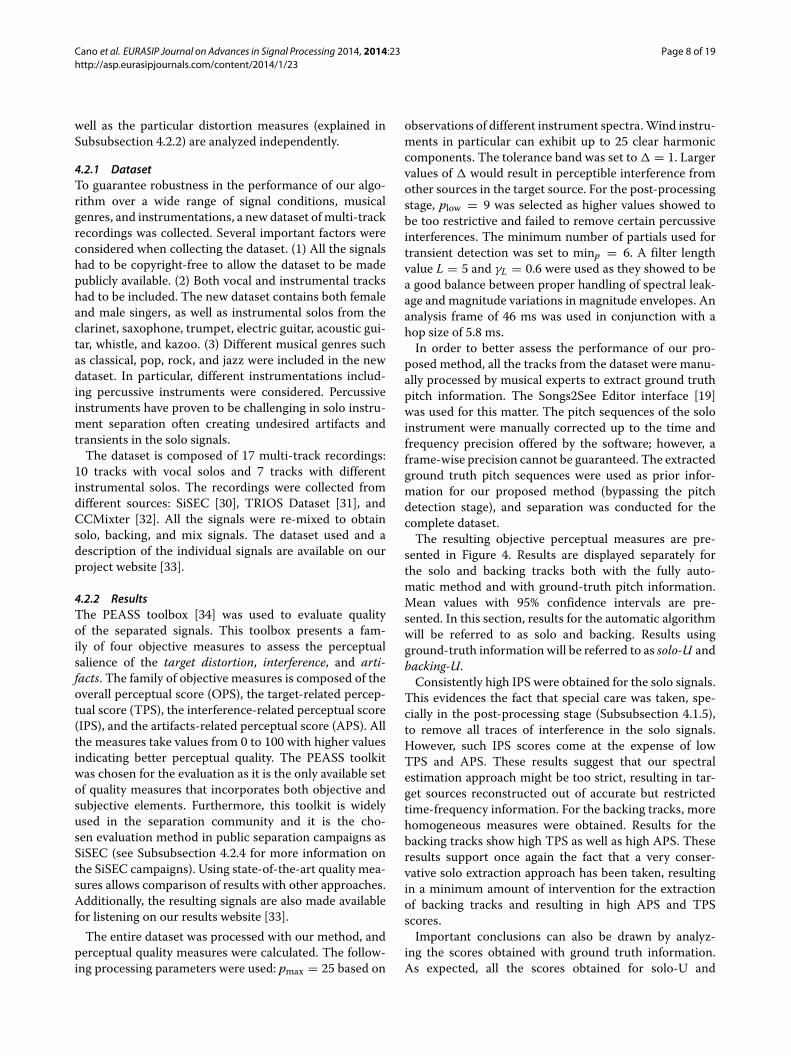
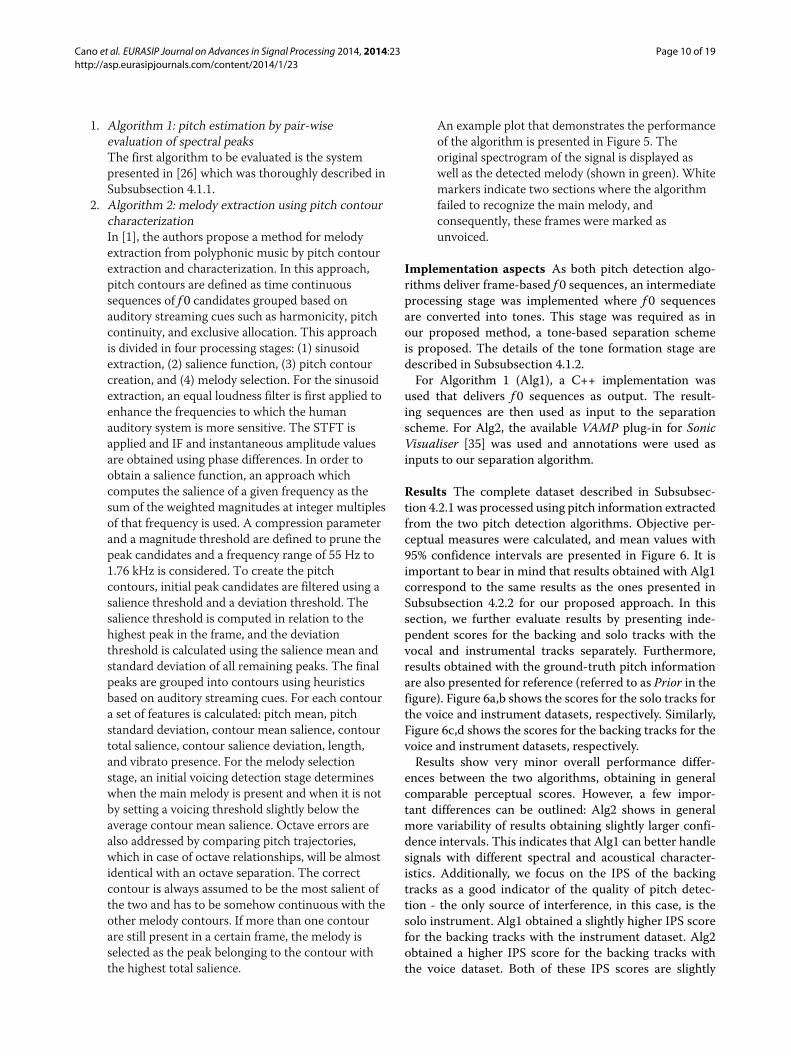
An example plot that demonstrates the performanceof the algorithm is presented in Figure 5. Theoriginal spectrogram of the signal is displayed aswell as the detected melody (shown in green). Whitemarkers indicate two sections where the algorithmfailed to recognize the main melody, andconsequently, these frames were marked asunvoiced.
Implementation aspects As both pitch detection algo-rithms deliver frame-based f 0 sequences, an intermediateprocessing stage was implemented where f 0 sequencesare converted into tones. This stage was required as inour proposed method, a tone-based separation schemeis proposed. The details of the tone formation stage aredescribed in Subsubsection 4.1.2.For Algorithm 1 (Alg1), a C++ implementation was
used that delivers f 0 sequences as output. The result-ing sequences are then used as input to the separationscheme. For Alg2, the available VAMP plug-in for SonicVisualiser [35] was used and annotations were used asinputs to our separation algorithm.
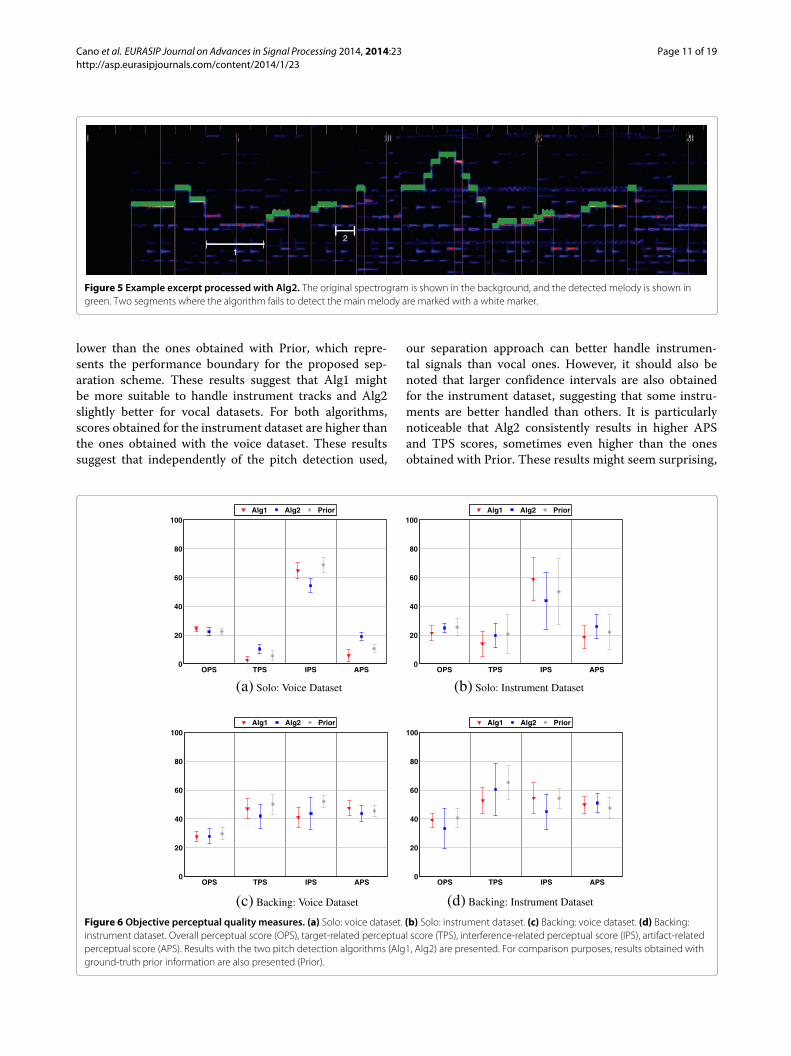
Results The complete dataset described in Subsubsec-tion 4.2.1 was processed using pitch information extractedfrom the two pitch detection algorithms. Objective per-ceptual measures were calculated, and mean values with95% confidence intervals are presented in Figure 6. It isimportant to bear in mind that results obtained with Alg1correspond to the same results as the ones presented inSubsubsection 4.2.2 for our proposed approach. In thissection, we further evaluate results by presenting inde-pendent scores for the backing and solo tracks with thevocal and instrumental tracks separately. Furthermore,results obtained with the ground-truth pitch informationare also presented for reference (referred to as Prior in thefigure). Figure 6a,b shows the scores for the solo tracks forthe voice and instrument datasets, respectively. Similarly,Figure 6c,d shows the scores for the backing tracks for thevoice and instrument datasets, respectively.Results show very minor overall performance differ-
ences between the two algorithms, obtaining in generalcomparable perceptual scores. However, a few impor-tant differences can be outlined: Alg2 shows in generalmore variability of results obtaining slightly larger confi-dence intervals. This indicates that Alg1 can better handlesignals with different spectral and acoustical character-istics. Additionally, we focus on the IPS of the backingtracks as a good indicator of the quality of pitch detec-tion - the only source of interference, in this case, is thesolo instrument. Alg1 obtained a slightly higher IPS scorefor the backing tracks with the instrument dataset. Alg2obtained a higher IPS score for the backing tracks withthe voice dataset. Both of these IPS scores are slightly
Cano et al. EURASIP Journal on Advances in Signal Processing 2014, 2014:23 Page 11 of 19http://asp.eurasipjournals.com/content/2014/1/23
1
2
Figure 5 Example excerpt processed with Alg2. The original spectrogram is shown in the background, and the detected melody is shown ingreen. Two segments where the algorithm fails to detect the main melody are marked with a white marker.
lower than the ones obtained with Prior, which repre-sents the performance boundary for the proposed sep-aration scheme. These results suggest that Alg1 mightbe more suitable to handle instrument tracks and Alg2slightly better for vocal datasets. For both algorithms,scores obtained for the instrument dataset are higher thanthe ones obtained with the voice dataset. These resultssuggest that independently of the pitch detection used,
our separation approach can better handle instrumen-tal signals than vocal ones. However, it should also benoted that larger confidence intervals are also obtainedfor the instrument dataset, suggesting that some instru-ments are better handled than others. It is particularlynoticeable that Alg2 consistently results in higher APSand TPS scores, sometimes even higher than the onesobtained with Prior. These results might seem surprising,
OPS TPS IPS APS0
20
40
60
80
100Alg1 Alg2 Prior
OPS TPS IPS APS0
20
40
60
80
100Alg1 Alg2 Prior
OPS TPS IPS APS0
20
40
60
80
100Alg1 Alg2 Prior
OPS TPS IPS APS0
20
40
60
80
100Alg1 Alg2 Prior
(a) Solo: Voice Dataset (b) Solo: Instrument Dataset
(c) Backing: Voice Dataset (d) Backing: Instrument Dataset
Figure 6 Objective perceptual quality measures. (a) Solo: voice dataset. (b) Solo: instrument dataset. (c) Backing: voice dataset. (d) Backing:instrument dataset. Overall perceptual score (OPS), target-related perceptual score (TPS), interference-related perceptual score (IPS), artifact-relatedperceptual score (APS). Results with the two pitch detection algorithms (Alg1, Alg2) are presented. For comparison purposes, results obtained withground-truth prior information are also presented (Prior).
Cano et al. EURASIP Journal on Advances in Signal Processing 2014, 2014:23 Page 12 of 19http://asp.eurasipjournals.com/content/2014/1/23
but careful analysis of the extracted audio tracks show thatAlg2 somehow benefits longer and more continuous pitchcontours [33]. This allows the spectral estimation to bet-ter characterize each of the tones and to capture moreaccurately their attacks and releases. This comes at thecost of slightly lower IPS scores for the solo. As alreadymentioned in Subsection 4.2, our proposed method, andthus Alg1, might be too strict in the discrimination of thetime-frequency information assigned to the solo and thisbecomes clear with the perceptual scores with low APSand TPS scores. Finally, resulting signals have also shownthat Alg2 can discriminate more accurately voiced fromunvoiced segments in the tracks, but octave errors occurmore often.
4.2.4 Algorithm performance and state-of-the-artapproaches
The performance of our proposed algorithm was com-pared to state-of-the-art approaches under the SignalSeparation Evaluation Campaign (SiSEC 2013) in the Pro-fessionally Produced Music Recordings task. The pitchdetection method used for this evaluation was Alg1.A total of 15 algorithms were submitted and evaluated
under a common dataset. The full table of results andalgorithm details can be found at the campaign’s website[36]. It has to be noted that the dataset used in this cam-paign is entirely composed of commercial vocal tracks,and no instrumental solos are used in the evaluation. InTable 1, the results obtained with our proposed methodand with three other algorithms designed for separation ofsolo instruments (or specifically singing voice) frommusicaccompaniment are presented for reference. The resultsfrom vocal extraction on the test datasets are presented.The algorithm Marxer1 is a low-latency main instru-
ment separation approach for stereo mixtures presentedin [5] and described in Section 3. The authors reportthat the algorithm allows real-time performance. Themethod uses a probabilistic pitch extraction approach inconjunction with panning masks to perform separation.The algorithm Marxer2 is presented in [37], and it is anNMF-based approach which extends the work of [8] tospecifically address the problem of singing voice extrac-tion and fricative modeling in the separation scheme.The authors report a performance time of approximately
Table 1 Results from the SiSEC13 Evaluation Campaign forvocal extraction on the test dataset
Cano Marxer1 Marxer2 REPET
OPS 19.5 22.0 20 22.8
TPS 5.0 49.3 18.2 54.6
IPS 62.0 49.5 64.1 35.7
APS 8.7 29.3 16.5 49.4
three times the length of the audio segment. Finally, theREPET algorithm presented in [4] takes advantage of therepetitive structure of most commercial songs to separatesinging voice from music accompaniment. The authorsreport processing times of 0.04 s for 1 s of audio on a3.4-GHz computer.Our proposed method has a processing time of 0.25 s
for 1 s of audio on a 2.6-GHz computer, allowing real-time processing. As previously explained, our algorithmseparates solo instruments from their music accompa-niment on monaural (single-channel) mixtures withoutmaking any assumptions of the type of solo instrumentto be separated. Furthermore, our approach only usesspectral information from the previous time frames ofthe tone to perform separation. This minimizes memoryusage as the only spectral information saved in memoryis the one that corresponds to the current tone. Addition-ally, processing is efficient as spectrogram calculations areonly performed on a tone by tone basis, avoiding largematrix operations which can be computationally demand-ing. Our algorithm obtained comparable OPS scores tothe other approaches described, exhibiting particularlyhigh IPS scores at the expense of lower APT and TPSscores.
4.3 Algorithm variations and performance analysisIn [38], we presented a study that evaluates the perfor-mance of our proposed method when processing param-eters of the algorithm are slightly modified, but its mainprocessing chain remains unchanged. The main goals ofthis study were on the one hand, to get a better under-standing of the behavior and performance of the algo-rithm under different conditions, and on the other hand,to find ways of maximizing perceptual quality of sepa-rated solo and backing tracks under our current approach.Here, we extend this evaluation to include our currentlylarger dataset, an alternative weighting approach for har-monic amplitude envelopes, and a second pitch detectionfront end (Alg2 described in Subsubsection 4.2.3). Themain goal behind this analysis is to clearly understand theeffects of each of the algorithmmodifications on the qual-ity of separated tracks. We focus not only on the generalperceptual quality (OPS) but also on the effects on eachof the distortions measures (APS, IPS, TPS). This anal-ysis becomes very relevant when separation algorithmsneed to be optimized to meet the quality requirements ofa certain application. If we assume for example that forautomatic music transcription, interferences from othersources should be minimized to obtain better results, thenthe algorithm variation which maximizes the IPS score isthe most suitable one for such an application. Our goalis to conduct such an analysis for the particular case ofmusic education applications. In this section, the effectsof the algorithm variations are analyzed. In Section 5,
Cano et al. EURASIP Journal on Advances in Signal Processing 2014, 2014:23 Page 13 of 19http://asp.eurasipjournals.com/content/2014/1/23
the use of separation technologies in music education isaddressed.The following four algorithm versions are considered
and evaluated with the two pitch detection front-ends:
(a) Proposed algorithm: as presented in Section 4.(b) Data-driven CAM: even though amplitude
envelopes of musical instruments have proven to bedifficult to model, different harmonics of the samesource exhibit similar amplitude envelopes and canbe, in many cases, highly correlated. This is knownas CAM, and it is an important cue in humanauditory perception [39]. Being CAM an observedcharacteristic in musical instrument spectra, someseparation approaches have attempted to includeCAM in their processing chains. In [15] for example,CAM is used as a mean to resolve overlappedharmonic components in a least squares estimationframework. In [40], the authors propose aspectro-temporal modeling of harmonic magnitudesand test their method on isolated instrument notes.They also test their estimation algorithm in theseparation context by creating random mixes of amaximum of six instrumental tones.To impose CAM in the estimation of solo signals, itis necessary to first obtain a reference temporalenvelope that all the harmonic components of thetone should follow. However, as opposed to [15] and[40] where prior knowledge of the f 0s of all thesources allowed the differentiation between cleanand overlapped envelopes, this prior information isnot available in our proposed method. In oursolo/accompaniment separation context,determining where harmonic components overlap isnot plausible without having a good idea of thespectral content of the other sources. Similarly,
extracting clean envelope information from at leastone of the harmonics is not straightforward either asthe presence of other sources is impossible topredict in our current approach. Consequently, wepropose to use CAM in a different way. Weintroduce CAM into our system by estimating thepartial magnitude envelope which is most similar toall other partial envelopes and use it as a referenceto impose CAM in our spectral estimation. It worksin the following way. (1) We first estimate thetemporal magnitude envelopes of all partials asdescribed in Subsubsection 4.1.3; (2) as estimationof lower partials is more robust than for higher ones,only the first pCAM partials are used at this stage.The goal is to find the partial among the first pCAMpartials, whose temporal envelope has the highestmean cross-correlation with the other pCAM − 1envelopes. For this matter, we calculate thecross-correlation rij between the temporal envelopesof the i th and j th partials for all i, j ≤ pCAM andi �= j. (3) We calculate the mean cross-correlation rpfor each partial by averaging the pCAM − 1cross-correlation coefficients rij obtained for eachpartial. The partial with the maximum meancross-correlation rp is taken as the reference. Thatis, pref = argmax
p
(rp
). (4) The temporal envelope of
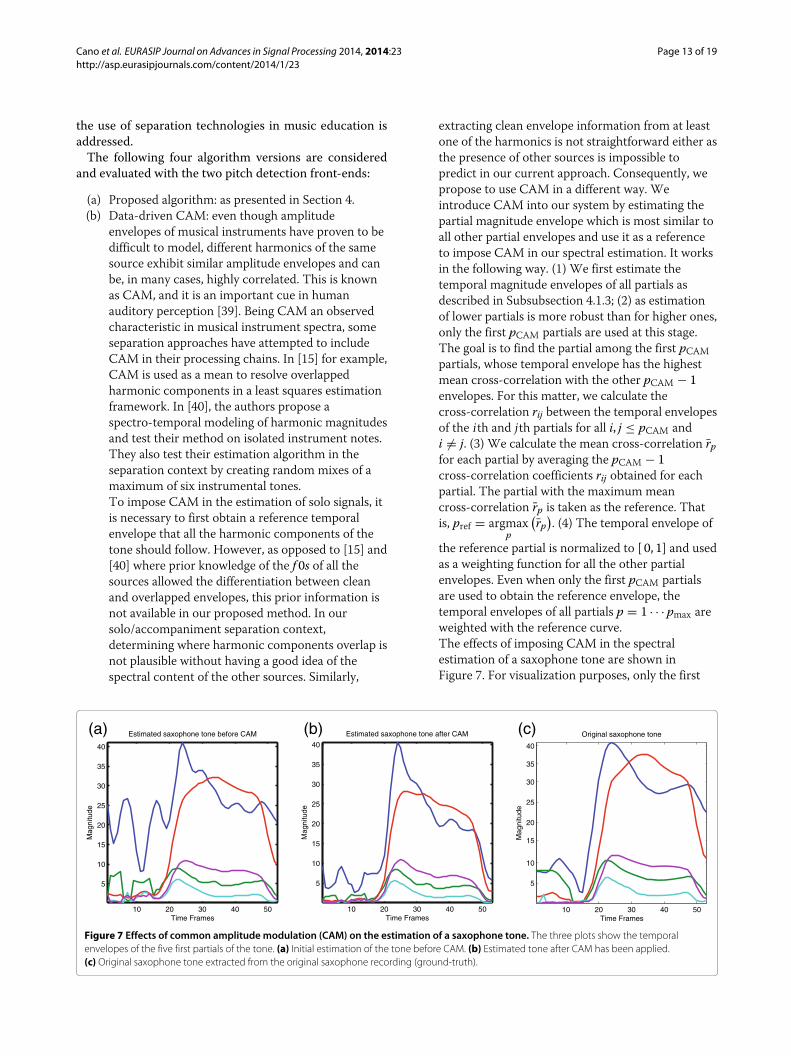
the reference partial is normalized to [ 0, 1] and usedas a weighting function for all the other partialenvelopes. Even when only the first pCAM partialsare used to obtain the reference envelope, thetemporal envelopes of all partials p = 1 · · · pmax areweighted with the reference curve.The effects of imposing CAM in the spectralestimation of a saxophone tone are shown inFigure 7. For visualization purposes, only the first
10 20 30 40 50
5
10
15
20
25
30
35
40
Estimated saxophone tone before CAM
Time Frames
Mag
nitu
de
10 20 30 40 50
5
10
15
20
25
30
35
40
Estimated saxophone tone after CAM
Time Frames
Mag
nitu
de
10 20 30 40 50
5
10
15
20
25
30
35
40
Original saxophone tone
Mag
nitu
de
Time Frames
(a) (b) (c)
Figure 7 Effects of common amplitude modulation (CAM) on the estimation of a saxophone tone. The three plots show the temporalenvelopes of the five first partials of the tone. (a) Initial estimation of the tone before CAM. (b) Estimated tone after CAM has been applied.(c) Original saxophone tone extracted from the original saxophone recording (ground-truth).
Cano et al. EURASIP Journal on Advances in Signal Processing 2014, 2014:23 Page 14 of 19http://asp.eurasipjournals.com/content/2014/1/23
five partials of the tone are shown. In Figure 7a, theestimated tone before CAM is displayed. InFigure 7b, the estimated tone after CAM is shown.Finally, in Figure 7c, the original tone taken from theoriginal saxophone recording (ground-truth) isshown for reference. It can be seen that the useCAM results in temporal envelopes closer to theoriginal ones. Particularly noticeable is its effect onthe f 0 envelope (blue curve) where the estimation ofthe initial time frames of the tone are clearlyaffected by overlapping of spectral components ofother sources. This causes the initial estimation toshow considerable differences with the originaltone. However, the use of CAM reduces the impactof initial misestimations and results in solo signalswith reduced interference from other sources.
(c) Wiener masking: the final masking stage describedin Subsubsection 4.1.4 is replaced by a soft maskingapproach based on Wiener filtering. Additionally,range compression is applied to the magnitudespectrogram. In [29] and [41] for example, rangecompression has been applied as it resulted in betterperceptual quality of separation. In this case, thespectral components are raised to the power of 0.3as informal listening test showed that betterseparation quality was obtained than with a series ofvalues tested between 0.3 and 2.
(d) Noise spectrum: the spectral estimation stage in ourproposed method models tone objects under theassumption that tones exhibit a harmonic behavior.However, it is clear that noise-like elements can alsobe present in tone objects, e.g., attacks in windinstruments, fricative sounds in voice signals,bow/string interaction in string instruments,mechanical interactions in instruments related tokey and hammer movement. To model these eventswithin our spectral estimation, a noise spectrum isincluded in every tone object. After all harmoniccomponents of the tone have been determined asexplained in Subsubsection 4.1.3, the included noisespectrum is limited to the frequency bins rangingfrom p = 1 to p = pmax. This is meant to minimizeinterference from other sources in the extractedsolo. Similar approaches have also been used in [8].
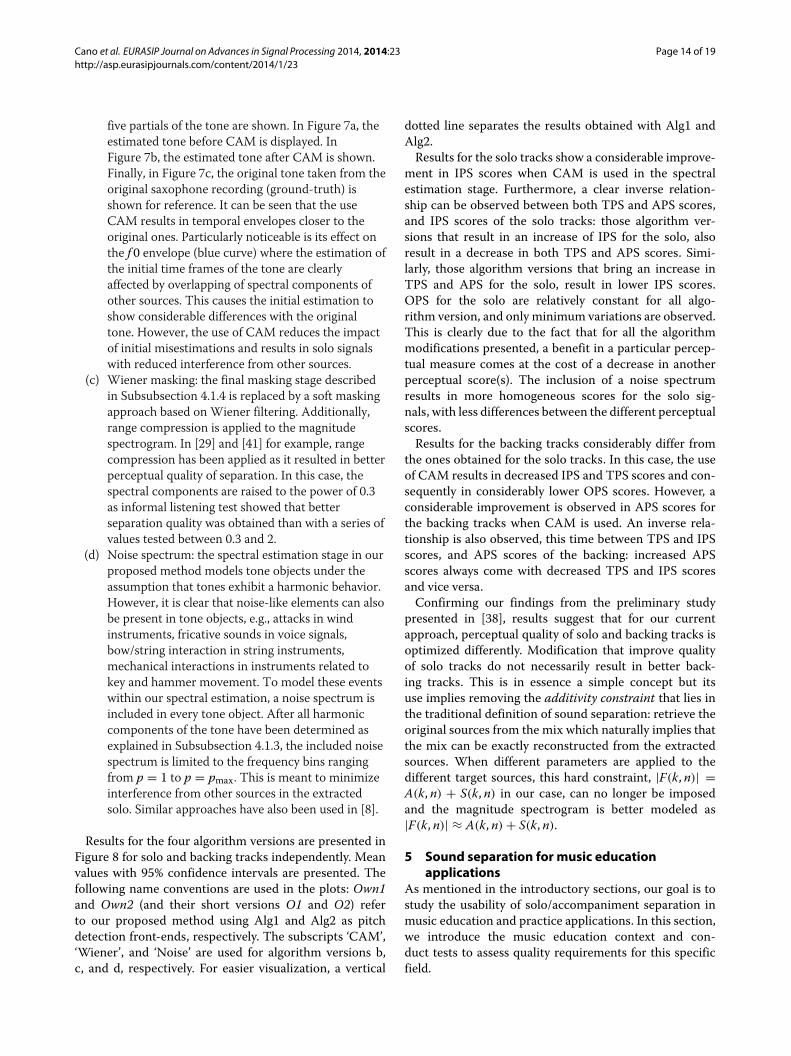
Results for the four algorithm versions are presented inFigure 8 for solo and backing tracks independently. Meanvalues with 95% confidence intervals are presented. Thefollowing name conventions are used in the plots: Own1and Own2 (and their short versions O1 and O2) referto our proposed method using Alg1 and Alg2 as pitchdetection front-ends, respectively. The subscripts ‘CAM’,‘Wiener’, and ‘Noise’ are used for algorithm versions b,c, and d, respectively. For easier visualization, a vertical
dotted line separates the results obtained with Alg1 andAlg2.Results for the solo tracks show a considerable improve-
ment in IPS scores when CAM is used in the spectralestimation stage. Furthermore, a clear inverse relation-ship can be observed between both TPS and APS scores,and IPS scores of the solo tracks: those algorithm ver-sions that result in an increase of IPS for the solo, alsoresult in a decrease in both TPS and APS scores. Simi-larly, those algorithm versions that bring an increase inTPS and APS for the solo, result in lower IPS scores.OPS for the solo are relatively constant for all algo-rithm version, and only minimum variations are observed.This is clearly due to the fact that for all the algorithmmodifications presented, a benefit in a particular percep-tual measure comes at the cost of a decrease in anotherperceptual score(s). The inclusion of a noise spectrumresults in more homogeneous scores for the solo sig-nals, with less differences between the different perceptualscores.Results for the backing tracks considerably differ from
the ones obtained for the solo tracks. In this case, the useof CAM results in decreased IPS and TPS scores and con-sequently in considerably lower OPS scores. However, aconsiderable improvement is observed in APS scores forthe backing tracks when CAM is used. An inverse rela-tionship is also observed, this time between TPS and IPSscores, and APS scores of the backing: increased APSscores always come with decreased TPS and IPS scoresand vice versa.Confirming our findings from the preliminary study
presented in [38], results suggest that for our currentapproach, perceptual quality of solo and backing tracks isoptimized differently. Modification that improve qualityof solo tracks do not necessarily result in better back-ing tracks. This is in essence a simple concept but itsuse implies removing the additivity constraint that lies inthe traditional definition of sound separation: retrieve theoriginal sources from the mix which naturally implies thatthe mix can be exactly reconstructed from the extractedsources. When different parameters are applied to thedifferent target sources, this hard constraint, |F(k, n)| =A(k, n) + S(k, n) in our case, can no longer be imposedand the magnitude spectrogram is better modeled as|F(k, n)| ≈ A(k, n) + S(k, n).
5 Sound separation for music educationapplications
As mentioned in the introductory sections, our goal is tostudy the usability of solo/accompaniment separation inmusic education and practice applications. In this section,we introduce the music education context and con-duct tests to assess quality requirements for this specificfield.
Cano et al. EURASIP Journal on Advances in Signal Processing 2014, 2014:23 Page 15 of 19http://asp.eurasipjournals.com/content/2014/1/23
Own1 O1_CAM O1_Wiener O1_Noise Own2 O2_CAM O2_Wiener O2_Noise0
20
40
60
80
100
OPS TPS IPS APS
(a) Solo: Complete Dataset
Own1 O1_CAM O1_Wiener O1_Noise Own2 O2_CAM O2_Wiener O2_Noise0
20
40
60
80
100
OPS TPS IPS APS
(b) Backing: Complete Dataset
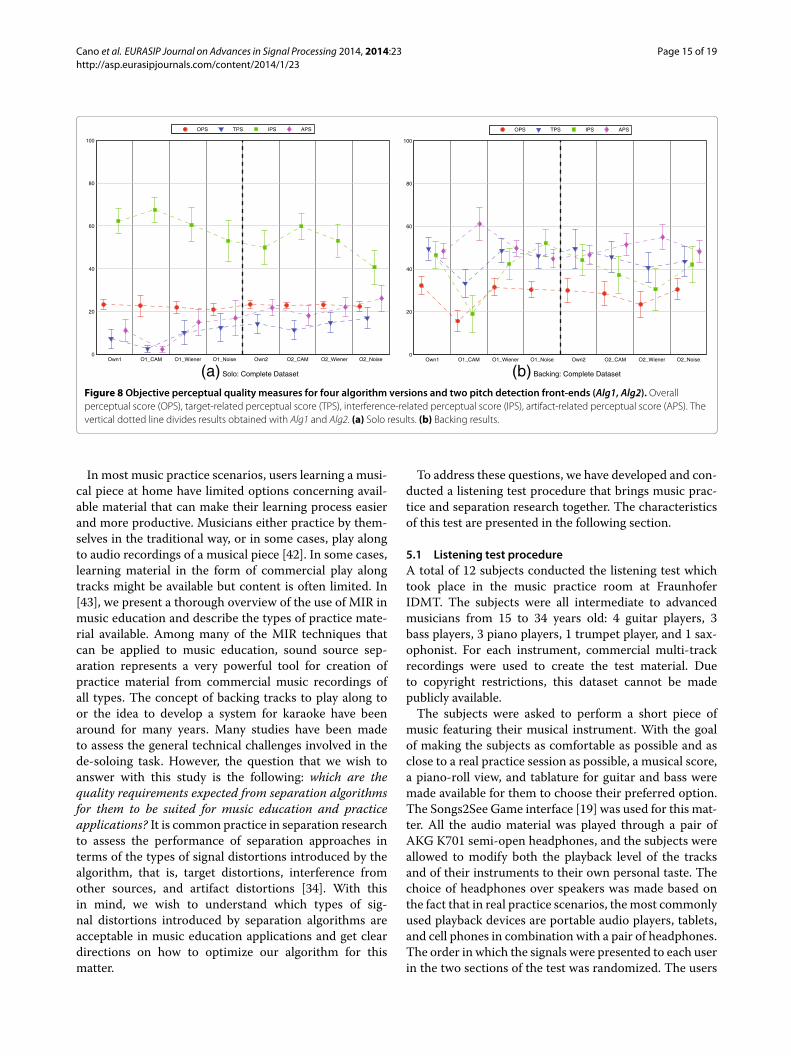
Figure 8 Objective perceptual quality measures for four algorithm versions and two pitch detection front-ends (Alg1, Alg2). Overallperceptual score (OPS), target-related perceptual score (TPS), interference-related perceptual score (IPS), artifact-related perceptual score (APS). Thevertical dotted line divides results obtained with Alg1 and Alg2. (a) Solo results. (b) Backing results.
In most music practice scenarios, users learning a musi-cal piece at home have limited options concerning avail-able material that can make their learning process easierand more productive. Musicians either practice by them-selves in the traditional way, or in some cases, play alongto audio recordings of a musical piece [42]. In some cases,learning material in the form of commercial play alongtracks might be available but content is often limited. In[43], we present a thorough overview of the use of MIR inmusic education and describe the types of practice mate-rial available. Among many of the MIR techniques thatcan be applied to music education, sound source sep-aration represents a very powerful tool for creation ofpractice material from commercial music recordings ofall types. The concept of backing tracks to play along toor the idea to develop a system for karaoke have beenaround for many years. Many studies have been madeto assess the general technical challenges involved in thede-soloing task. However, the question that we wish toanswer with this study is the following: which are thequality requirements expected from separation algorithmsfor them to be suited for music education and practiceapplications? It is common practice in separation researchto assess the performance of separation approaches interms of the types of signal distortions introduced by thealgorithm, that is, target distortions, interference fromother sources, and artifact distortions [34]. With thisin mind, we wish to understand which types of sig-nal distortions introduced by separation algorithms areacceptable in music education applications and get cleardirections on how to optimize our algorithm for thismatter.
To address these questions, we have developed and con-ducted a listening test procedure that brings music prac-tice and separation research together. The characteristicsof this test are presented in the following section.
5.1 Listening test procedureA total of 12 subjects conducted the listening test whichtook place in the music practice room at FraunhoferIDMT. The subjects were all intermediate to advancedmusicians from 15 to 34 years old: 4 guitar players, 3bass players, 3 piano players, 1 trumpet player, and 1 sax-ophonist. For each instrument, commercial multi-trackrecordings were used to create the test material. Dueto copyright restrictions, this dataset cannot be madepublicly available.The subjects were asked to perform a short piece of
music featuring their musical instrument. With the goalof making the subjects as comfortable as possible and asclose to a real practice session as possible, a musical score,a piano-roll view, and tablature for guitar and bass weremade available for them to choose their preferred option.The Songs2See Game interface [19] was used for this mat-ter. All the audio material was played through a pair ofAKG K701 semi-open headphones, and the subjects wereallowed to modify both the playback level of the tracksand of their instruments to their own personal taste. Thechoice of headphones over speakers was made based onthe fact that in real practice scenarios, themost commonlyused playback devices are portable audio players, tablets,and cell phones in combination with a pair of headphones.The order in which the signals were presented to each userin the two sections of the test was randomized. The users
Cano et al. EURASIP Journal on Advances in Signal Processing 2014, 2014:23 Page 16 of 19http://asp.eurasipjournals.com/content/2014/1/23
were asked to rate how comfortable they felt practicing themusical piece with each of the different signal versions.The listening test consisted of a training phase and an
evaluation phase. During the training phase, the userswere given a short introduction to the listening tests,its goals, and evaluation procedure. Furthermore, theusers were presented with test material (example signalsfrom the listening test) so they could make themselvesfamiliar with the types of signals and distortions in theevaluation.The evaluation stage was composed of two sections:
(1) solo track evaluation and (2) backing track evaluation.In the two evaluation sections, subjects were presentedwith four different versions of solo and backing tracks, aswell as the original recording (mix). Three signal versions(v1, v2, v3) where created so that each one specificallydescribed one of the signal distortions (interference, arti-facts, target). The fourth version (v4) was obtained withour proposed separation algorithm. The original record-ing (mix) was always used as a comparison, as in mostmusic practice scenarios, this track is the only one avail-able to the users. To create versions 1, 2, and 3, a similarapproach as the one proposed in [34] was taken:
1. Artifacts: this version was obtained as the sum of theoriginal target signal and an artifacts signal. Theartifacts signal was created by randomly taking 1% ofthe time-frequency coefficients of the target source(and thus setting 99% of the time-frequencycoefficients to zero) and synthesizing this very sparsesignal. The loudness of the artifacts signal wasadjusted to that of the target. This artifacts signal isthen added to the original target signal (clean) to
artificially create a signal with artifact distortions.Randomly taking 1% of the time-frequencycoefficients results in a very sparse time-frequencyrepresentation that sounds like clicks, breaks, andmusical noise when re-synthesized.
2. Target: this version was crated by low-pass filteringthe original source signal to a 3.5-kHz cutofffrequency and by randomly setting 20% of thetime-frequency coefficients to zero.
3. Interference: this version was obtained as the sum ofthe original source signal and an interference signal.The interference signal in this case is the backingtrack, whose loudness was adjusted to that of thetarget.
In the first section of the test (solo track evaluation), theusers were asked to practice the musical piece and play itas fluidly as possible with the aid of the solo track versions.In the second section of the test (backing track evalua-tion), the users were asked to play the given melody withthe accompaniment of the backing tracks (as resemblinga real musical scenario). The subjects were then asked toevaluate the provided backing tracks. All ratings in thelistening test that were performed in a continuous scalefrom 0 to 100 were additional descriptive hints and weregiven as follows: Bad (0 to 20), Poor (20 to 40), Fair (40to 60), Good (60 to 80), and Excellent (80 to 100) [44].Users were also allowed to submit any comments that theyfound relevant about their experience in the listening test.
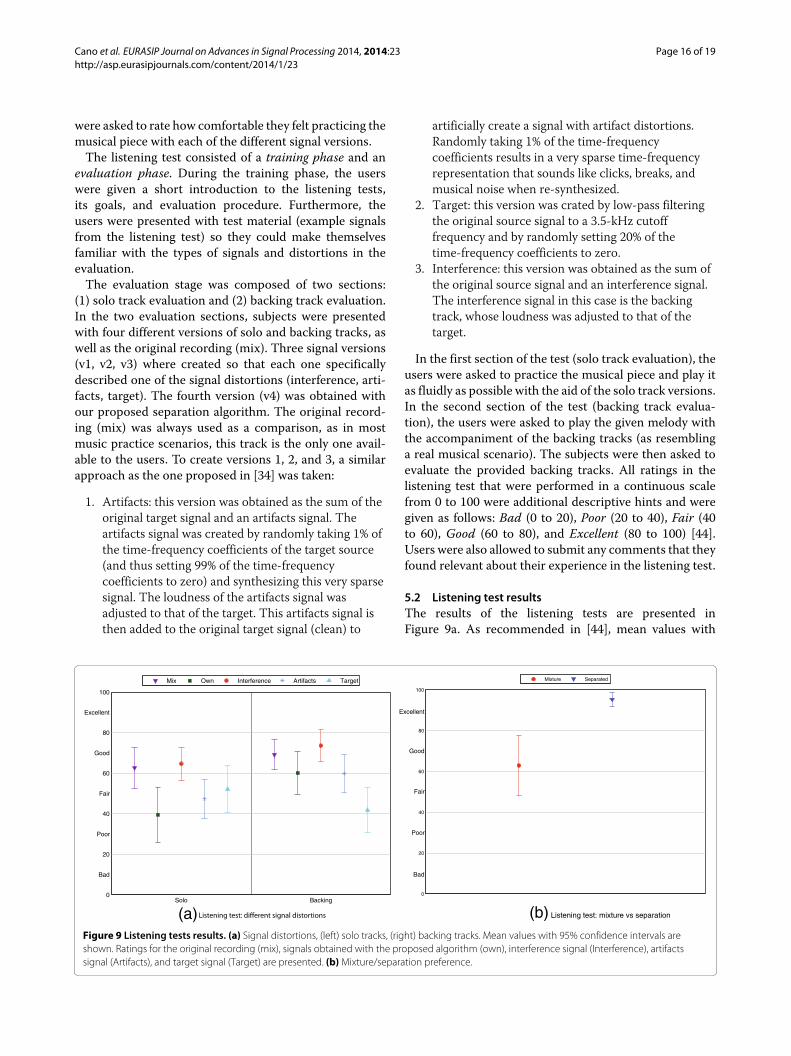
5.2 Listening test resultsThe results of the listening tests are presented inFigure 9a. As recommended in [44], mean values with
Solo Backing0
Bad
20
Poor
40
Fair
60
Good
80
Excellent
100
Mix Own Interference Artifacts Target
Bad
Poor
Fair
Good
Excellent
0
20
40
60
80
100
Mixture Separated
(b) Listening test: mixture vs separation(a)Figure 9 Listening tests results. (a) Signal distortions, (left) solo tracks, (right) backing tracks. Mean values with 95% confidence intervals areshown. Ratings for the original recording (mix), signals obtained with the proposed algorithm (own), interference signal (Interference), artifactssignal (Artifacts), and target signal (Target) are presented. (b)Mixture/separation preference.
Cano et al. EURASIP Journal on Advances in Signal Processing 2014, 2014:23 Page 17 of 19http://asp.eurasipjournals.com/content/2014/1/23
95% confidence intervals are presented for the originalrecording (mix) and the four signal versions (interference,artifacts, target, own). Results for the solo signals are pre-sented in the left pane of the figure and results for thebacking on the right.For both the solo and accompaniment tracks, the high-
est mean scores were obtained by the interference signal,being the mean values in both cases, very close to the onesobtained by the mix. This evidences the importance ofpreserving the signal’s quality with a minimum of intro-duced artifacts, regardless of the fact that traces of theother source are still present. Mean values for the soloshow that users find the artifacts signal most disturbingduring practice time. Subjects’ comments after the listen-ing test emphasized the fact that artifacts are distractingand make it more difficult to keep the rhythm. For thebacking tracks, target distortions are most disturbing. Theimportance of a clear bass to follow was mentioned bythe users and due to the somehow smoothed (low-passfiltered) target versions, onsets and bass notes were nolonger so clear. The solo tracks obtained with the pro-posed algorithm received the lowest mean values with afairly large variance between users. A possible explanationfor such a large variation might be that different musicalinstruments pose different quality requirements for thesolo signal. One can imagine for example, that a bass anda trumpet player might look for different signal character-istics. However, no final conclusions in this sense can bedrawn with a sample size of this kind, and further experi-ments need to be conducted in that direction. The backingtracks extracted with the proposed algorithm, on the other
hand, obtained mean values superior to the target andartifacts signals.The high mean values obtained for the reference mix
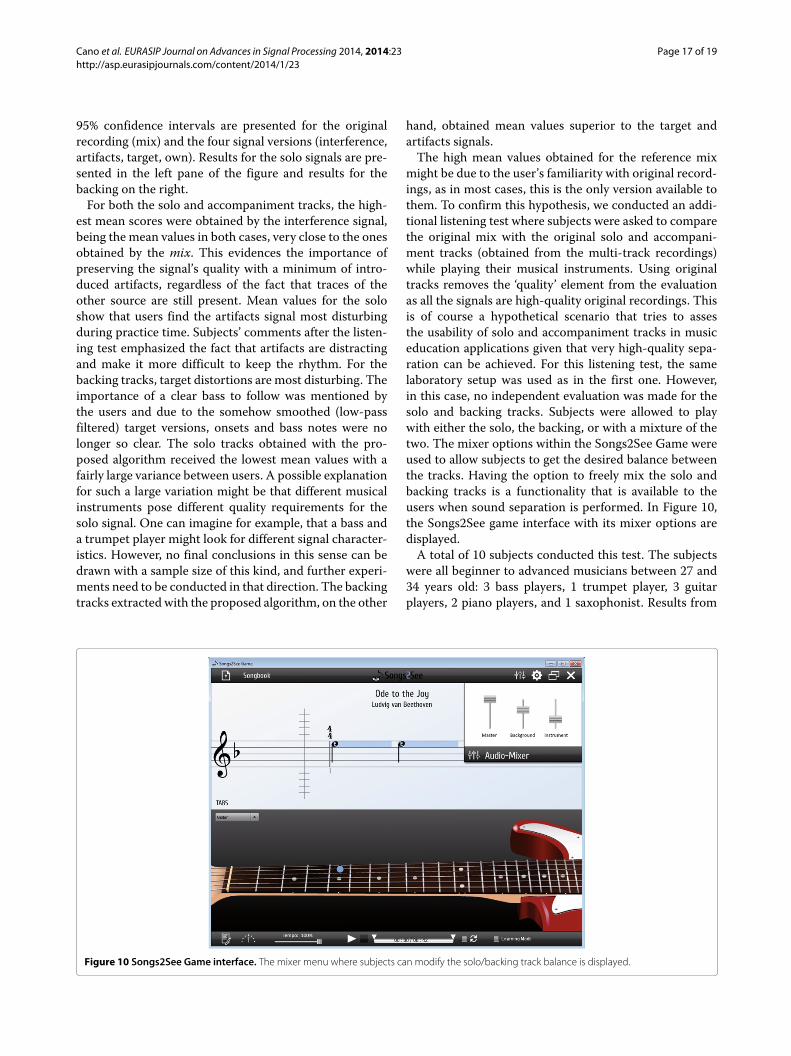
might be due to the user’s familiarity with original record-ings, as in most cases, this is the only version available tothem. To confirm this hypothesis, we conducted an addi-tional listening test where subjects were asked to comparethe original mix with the original solo and accompani-ment tracks (obtained from the multi-track recordings)while playing their musical instruments. Using originaltracks removes the ‘quality’ element from the evaluationas all the signals are high-quality original recordings. Thisis of course a hypothetical scenario that tries to assesthe usability of solo and accompaniment tracks in musiceducation applications given that very high-quality sepa-ration can be achieved. For this listening test, the samelaboratory setup was used as in the first one. However,in this case, no independent evaluation was made for thesolo and backing tracks. Subjects were allowed to playwith either the solo, the backing, or with a mixture of thetwo. The mixer options within the Songs2See Game wereused to allow subjects to get the desired balance betweenthe tracks. Having the option to freely mix the solo andbacking tracks is a functionality that is available to theusers when sound separation is performed. In Figure 10,the Songs2See game interface with its mixer options aredisplayed.A total of 10 subjects conducted this test. The subjects
were all beginner to advanced musicians between 27 and34 years old: 3 bass players, 1 trumpet player, 3 guitarplayers, 2 piano players, and 1 saxophonist. Results from
Figure 10 Songs2See Game interface. The mixer menu where subjects can modify the solo/backing track balance is displayed.
Cano et al. EURASIP Journal on Advances in Signal Processing 2014, 2014:23 Page 18 of 19http://asp.eurasipjournals.com/content/2014/1/23
the listening test are displayed in Figure 9b. Mean val-ues with 95% confidence intervals are presented. Resultsclearly show that subjects prefer having the possibilityof playing with separated tracks than with the origi-nal mix. Performing separation allows users to controlthe playback levels depending on their skills and prefer-ences: completely mute the solo, add a little of the soloto the backing track for reference, or re-mix the tracksagain to get the mix. The separated tracks obtained amean value of 95.22 and a confidence interval of only3.3. The mixture obtained a mean value of 62.88 witha slightly large confidence interval of 14.87. This listen-ing test confirms the somehow expected results that theuse of sound separation in music education applicationsbrings beneficial functionalities for the practice sessions.This results are also supported by the great availability ofmusic education practice literature, where solo and back-ing tracks (specially recorded for this purpose) are avail-able. See [43] for a thorough overview of music educationmaterial.
6 ConclusionsIn this work, we propose an efficient method for pitch-informed solo/accompaniment separation based on atone-based estimation of the solo instrument and a post-processing stage that addresses transient-like interfer-ences in the solo signals, attack sections, and the use ofCAM in the estimation of the harmonic components of atone.We designed and conducted a listening test proce-
dure to evaluate the plausibility of using such separa-tion techniques within a music education context. Resultsfrom the listening test revealed that quality require-ments for the solo and backing tracks are different,and such differences should be considered if a separa-tion method is to be optimized for this particular appli-cation.Two pitch detection front-ends as well as different
algorithm modifications were evaluated with the goal ofgetting a better understanding of their impact in the per-ceptual quality of separated tracks. As evidenced in thelistening test results, higher APS and TPS scores for thesolo is a desired outcome if we aim at optimizing ourmethod for its use in music education applications. Sim-ilarly, results from the listening test also showed thatminimizing interference from other sources in the solosignal does not play a major role. With this in mind,Alg2 as a pitch detection front-end slightly benefits qual-ity requirements of music education applications. The useof CAM has shown an important improvement of theAPS score of the backing track which is a desirable out-come if the separation algorithm is optimized for musiceducation applications. Similarly, the use of noise spec-trum for the solo track shows an improvement in TPS
and APS scores which is also a desired outcome for musiceducation applications.Future research directions include further evaluation
of the differences in spectral characteristics and qualityrequirements of different musical instruments and thevoice and better characterization of musical instrumenttones both in time and frequency within the separationapproach.
Competing interestsThe authors declare that they have no competing interests.
Author details1Fraunhofer Institute for Digital Media Technology IDMT, Ilmenau 98693,Germany. 2Technical University of Ilmenau, Ilmenau 98693, Germany.
Received: 18 June 2013 Accepted: 4 February 2014Published: 27 February 2014
References1. J Salamon, E Gómez, Melody extraction from polyphonic music signals
using pitch contour characteristics. IEEE Trans. Audio Speech Lang.Process. 20(6), 1759–1770 (2012)
2. A Liutkus, JL Durrieu, L Daudet, G Richard, An overview of informed audiosource separation, in 14th International Workshop on Image and AudioAnalysis for Multimedia Interactive Services (WIAMIS 2013): 3-5 July 2013(Paris), pp. 3–6
3. PS Huang, SD Chen, P Smaragdis, M Hasegawa-Johnson, Singing-voiceseparation from monaural recordings using robust principal componentanalysis, in IEEE International Conference on Acoustics, Speech, and SignalProcessing (ICASSP 2012): 25-30 March 2012 (Kyoto), pp. 57–60
4. Z Rafii, B Pardo, REpeating Pattern Extraction Technique (REPET): a simplemethod for music/voice separation. IEEE Trans. Audio Speech Lang.Process. 21, 73–84 (2013)
5. R Marxer, J Janer, J Bonada, Low-latency instrument separation inpolyphonic audio using timbre models, in Latent Variable Analysis andSignal Separation, Volume 7191, ed. by F Theis, A Cichocki, A Yeredor, andM Zibulevsky (Springer, Heidelberg, 2012), pp. 314–321
6. NQK Duong, E Vincent, R Gribonval, Under-determined reverberant audiosource separation using a full-rank spatial covariance model. IEEE Trans.Audio Speech Lang. Process. 18(7), 1830–1840 (2010)
7. A Liutkus, A Ozerov, R Badeau, G Richard, Spatial coding-based informedsource separation, in 20th European Signal Processing Conference (EUSIPCO2012): 27-31 August 2012 (Bucharest), pp. 2407–2411
8. JL Durrieu, B David, G Richard, A musically motivated mid-levelrepresentation for pitch estimation and musical audio source separation.IEEE J. Selected Topics Signal Process. 5(6), 1180–1191 (2011)
9. S Ewert, M Müller, P Grosche, High resolution audio synchronization usingchroma onset features, in IEEE International Conference on Acoustics,Speech, and Signal Processing (ICASSP 2009): April 19-24, 2009 (Taipei),pp. 1869–1872
10. J Ganseman, P Scheunders, GJ Mysore, JS Abel, Evaluation of ascore-informed source separation system, in 11th International Society forMusic Information Retrieval Conference (ISMIR 2010) (Utrecht, Netherlands,August 9–13, 2010)
11. JJ Bosch, K Kondo, R Marxer, J Janer, Score-informed and timbreindependent lead instrument separation in real-world scenarios, in 20thEuropean Signal Processing Conference (EUSIPCO 2012), Volume 25(Bucharest, Romania, 27-31 August 2012), pp. 2417–2421
12. J Fritsch, MD Plumbley, Score informed audio source separation usingconstrained nonnegative matrix factorization and score synthesis, in IEEEInternational Conference on Acoustics, Speech, and Signal Processing (ICASSP2013) (Vancouver, Canada, 26-31 May 2013), pp. 888–891
13. Z Duan, B Pardo, Soundprism : an online system for score-informedsource separation of music audio. IEEE J. Selected Topics Signal Process.5(6), 1205–1215 (2011)
14. S Ewert, M Müller, Score-informed source separation for music signals, inMultimodal Music Processing, Volume 3, ed. by M Müller, M Goto, and MSchedl (Dagstuhl Publishing, Schloss Dagstuhl, 2012), pp. 73–94
Cano et al. EURASIP Journal on Advances in Signal Processing 2014, 2014:23 Page 19 of 19http://asp.eurasipjournals.com/content/2014/1/23
15. Y Li, J Woodruff, D Wang, Monaural musical sound separation based onpitch and common amplitude modulation. IEEE Trans. Acoustics SpeechSignal Process. 17(7), 1361–1371 (2009)
16. AP Klapuri, Multiple fundamental frequency estimation based onharmonicity and spectral smoothness. IEEE Trans. Speech Audio Process.11(6), 804–816 (2003)
17. JL Durrieu, J-P Thiran, Musical audio source separation based onuser-selected F0 track, in Latent Variable Analysis and Signal Separation,Volume 7191, ed. by F Theis, A Cichocki, A Yeredor, and M Zibulevsky(Springer, Heidelberg, 2012), pp. 438–445
18. D FitzGerald, User assisted separation using tensor factorisations, in 20thEuropean Signal Processing Conference (EUSIPCO 2012) (Bucharest,Romania, 27-31 August 2012), pp. 2412–2416
19. E Cano, C Dittmar, S Grollmisch, Songs2See: learn to play by playing, in12th International Society for Music Information Retrieval Conference (ISMIR2011) (Miami, USA, 24-28 October 2011)
20. B Fuentes, R Badeau, G Richard, Blind harmonic adaptive decompositionapplied to supervised source separation, in 20th European SignalProcessing Conference (EUSIPCO 2012) (Bucharest, Romania, 27-31 August2012), pp. 2654–2658
21. D FitzGerald, M Cranitch, E Coyle, Extended nonnegative tensorfactorisation models for musical sound source separation. Comput. Intell.Neurosci. 2008(2), 1–15 (2008)
22. U Simsekli, AT Cemgil, Score guided musical source separation usinggeneralized coupled tensor factorization, in 20th European SignalProcessing Conference (EUSIPCO 2012) (Bucharest, Romania, 27-31 August2012), pp. 2639–2643
23. T Gerber, M Dutasta, L Girin, C Févotte, Professionally-produced musicseparation guided by covers, in 13th International Society for MusicInformation Retrieval Conference (ISMIR 2012) (Porto, Portugal, 8-12October 2012), pp. 85–90
24. P Smaragdis, GJ Mysore, Separation by humming : user-guided soundextraction from monophonic mixtures, in 2009 IEEEWorkshop onApplications of Signal Processing to Audio and Acoustics (WASPAA 2009)(New Paltz, NY, 18-21 October 2009)
25. P Leveau, S Maller, JJ Burred, X Juareguiberry, Convolutive common audiosignal extraction, in 2011 IEEEWorkshop on Applications of SignalProcessing to Audio and Acoustics (WASPAA 2011) (New Paltz, NY,16-19 October 2011), pp. 165–168
26. K Dressler, Pitch estimation by the pair-wise evaluation of spectral peaks,in AES 42nd International Conference on Semantic Audio (Ilmenau,Germany, 22-24 July 2011), pp. 1–10
27. E Cano, C Cheng, Melody line detection and source separation in classicalsaxophone recordings, in 12th International Conference on Digital AudioEffects (1-4 September DAFx-09) (Como, Italy, 2009), pp. 1–6
28. NH Fletcher, TD Rossing, The Physics of Musical Instruments, 2nd edition(Springer, New York, 1998)
29. N Ono, K Miyamoto, JL Roux, Separation of a monaural audio signal intoharmonic/percussive components by complementary diffusion onspectrogram, in 16th European Signal Processing Conference (EUSIPCO2008) (Lausanne, Switzerland, 25-28 August 2008), pp. 1–4
30. SiSEC, SiSEC Dataset (2010). http://sisec.wiki.irisa.fr/tiki-index.php?page=Professionally%20produced%20music%20recordings.Accessed 10 Jan 2013
31. J Fritsch, TRIOS Dataset (2012). http://c4dm.eecs.qmul.ac.uk/rdr/handle/123456789/27. Accessed 20 Feb 2013
32. CCMixter, CCMixter (2013). http://dig.ccmixter.org/. Accessed 12 Feb 201333. E Cano, Solo and accompaniment separation results (2013). http://www.
idmt.fraunhofer.de/en/Departments_and_Groups/smt/solo_and_accompaniment_separation.html. Accessed 12 June 2013
34. V Emiya, E Vincent, N Harlander, V Hohmann, Subjective and objectivequality assessment of audio source separation. IEEE Trans. Audio SpeechLang. Process. 19(7), 2046–2057 (2011)
35. QMU Centre for Digital Music, Sonic Visualiser (2013). http://www.sonicvisualiser.org/. Accessed 10 May 2013
36. SiSEC, SiSEC 2013 Results (2011). http://www.onn.nii.ac.jp/sisec13/evaluation_result/MUS/testMUS2013.htm. Accessed 01 Oct 2013
37. J Janer, R Marxer, Separation of unvoiced fricatives in singing voicemixtures with music semi-supervised NMF, in 16th InternationalConference on Digital Audio Effects (DAFx-13) (Maynooth, Ireland,2-5 September 2013), pp. 1–4
38. E Cano, C Dittmar, G Schuller, Re-thinking sound separation: priorinformation and additivity constraint in separation algorithms, in 16thInternational Conference on Digital Audio Effects (DAFx-13) (Maynooth,Ireland, 2-5 September 2013), pp. 1–7
39. AS Bregman, Auditory Scene Analysis (The MIT Press, Cambridge, 1990)40. D Gunawan, D Sen, Separation of harmonic musical instrument notes
using spectro-temporal modeling of harmonic magnitudes andspectrogram inversion with phase optimization. J. Audio Eng. Soc (AES).60(12) (2012)
41. D Fitzgerald, Harmonic/percussive separation using median filtering, in13th International Conference on Digital Audio Effects (DAFx-10) (1, Graz,Austria, 6-10 September 2010), pp. 10–13
42. D Stowell, S Dixon, MIR in school? Lessons from ethnographicobservation of secondary school music classes, in 12th InternationalSociety for Music Information Retrieval Conference (ISMIR 2011) (Miami, USA,24-28 October 2011)
43. C Dittmar, E Cano, J Abesser, S Grollmisch, Music information retrievalmeets music education, inMultimodal Music Processing, Volume 3, ed. byM Müller, M Goto, and M Schedl (Dagstuhl Publishing, 2012), pp. 95–120
44. ITU, RECOMMENDATION ITU-R BS. 1534-1 method for the subjectiveassessment of intermediate quality level of coding systems. Tech. rep.(2003)
doi:10.1186/1687-6180-2014-23Cite this article as: Cano et al.: Pitch-informed solo and accompanimentseparation towards its use inmusic education applications. EURASIP Journalon Advances in Signal Processing 2014 2014:23.
Submit your manuscript to a journal and benefi t from:
7 Convenient online submission
7 Rigorous peer review
7 Immediate publication on acceptance
7 Open access: articles freely available online
7 High visibility within the fi eld
7 Retaining the copyright to your article
Submit your next manuscript at 7 springeropen.com