research paper the influence of youth role against the
TRANSCRIPT

International Journal of Research & Review (www.ijrrjournal.com) 28
Vol.5; Issue: 10; October 2018
International Journal of Research and Review www.ijrrjournal.com E-ISSN: 2349-9788; P-ISSN: 2454-2237
Research Paper
The Influence of Youth Role against the
Development of Handicraft Industry in District of
Kualuh Hulu, North Labuhanbatu Regency
Mhd. Isnen Harahap1, Robert Sibarani
2, Rujiman
2
1Postgraduate Students atUniversity of North Sumatera, Indonesia 2Postgraduate Lecturer atUniversity of North Sumatera, Indonesia
Corresponding Author: Mhd. Isnen Harahap
ABSTRACT
This research is based on the background of current youth conditions and problems, such as the
prevalence of drug abuse and HIV/AIDS, promiscuity, thuggery and violence, resulting in a lack of awareness of the youth of the social and economic environment of society. This research aims to
know and analyze how the role of youth to the development of handicraft industry in District of
Kualuh Hulu, North Labuhanbatu regency and to know and analyze the influence of youth role on the development of handicraft industry in District of Kualuh Hulu, North Labuhanbatu regency. The type
of research used in this research is quantitative descriptive with a sample of 96 respondents.
Populations and samples in this study were youths in Hanna Plantation Village, District of Kualuh
Hulu, North Labuhanbatu regency aged 16-30 years and data collection techniques through primary data (questionnaire and survey) and secondary. The research method used is Hypothesis Test and
Multiple Linear Regression. The results showed that (1) Youth participated in the Development of
Handicraft Industry in district of Kualuh Hulu, North Labuhanbatu regency was proven by positive and constructive activities they did, such as Entrepreneurship Training, Craft Making Training,
Village Development Seminar and social activities, such as Commemoration of National Day and
Religious Day, Village Social Events and Drug Extension, (2) Independent variable (agent of change,
agent of development, and agent of modernization) simultaneously have a significant positive effect on dependent variable (Development of Handicraft Industry). Partially agent of change and agent of
development have a significant positive effect, while agent of modernization variable has positive
effect not significantly on the development of handicraft industry in district of Kualuh Hulu, North Labuhanbatu regency, (3) Influence of youth role to the development of handicraft industry in sales
growth, capital, labor growth, market growth and profit growth are very high, i.e., respectively 85,2
%, 78,1 %, 72,4%, 78,8 % and 78,7 %, this explains that the role of youth towards the development of handicraft industry in district of Kualuh Hulu, North Labuhanbatu regency is positive, meaning that
the independent variable of agent of change, agent of development, and agent of modernization is
considered important and must be improved again.
Key Words: Agent of change, Agent of development, Agent of modernization, Industrial Development
of Handicrafts
INTRODUCTION
Indonesia is a pluralistic country, a
country that has a lot of ethnicity, ethnicity,
language. It is noted that the Indonesian
nation consists of hundreds of tribes or
ethnicities who live on more than 13,000
islands, hundreds of regional languages,
hundreds of cultures or customs, and many
religions. This multidimensional plurality
has thus far formed a very beautiful and

Mhd. Isnen Harahap et.al. The Influence of Youth Role against the Development of Handicraft Industry in
District of Kualuh Hulu, North Labuhanbatu Regency
International Journal of Research & Review (www.ijrrjournal.com) 29
Vol.5; Issue: 10; October 2018
enchanting Indonesian mosaic in one
container of the Unitary Republic of
Indonesia based on Pancasila and the 1945
Constitution (Tanjung, 2012: 1). Indonesian
pluralism is automatically proportional to
the area and population. Indonesia is the
13th largest country in the world and
occupies the first position of the largest
country in Southeast Asia with an area of
1,990,250 Km square (BPS, Indonesia in
figures, 2015). Indonesia's natural wealth
must be well utilized by the population, with
the flourishing of diverse crops that will
improve the economy of the community. In
fact, it is not only the production of plants
that are expected to improve the economy,
the waste produced by plants can be used by
the community to be processed into
economic value and increase household
income. Many of the crop waste products
that can be modified into goods of economic
value with creative and high artistic touch.
One example is waste from oil palm
plantations that can be processed into
handicrafts of economic value. The
population of Indonesia, which is spread
from Indonesia's zero point, namely Sabang
to Merauke, reaches 255,182,144 people
(BPS, Indonesia in figures, 2015) and this
number is converted to percent of the total
population in the world, which is 3.5
percent of the world's population. The large
number of population puts Indonesia in the
fourth position of the world's largest
population below the United States, which
occupies the third position next in India and
second place in China.
The composition of the number of
young people in Indonesia in 2015 totaled
64 million people, or 25% of the total
population of Indonesia in 2015 which
reached 255 million people (BPS, Indonesia
in figures, 2015). A huge potential and very
potential to drive the wheels of nation and
state development. This very large number
of young people is not impossible to make
this nation compete in the international
arena and make Indonesia famous in the
eyes of the world, but on the contrary this
will also be a big problem if the huge
numbers of young people actually bring
problems to the nation. Youth issues are still
so many at the moment, including apathy
tendencies, hedonism which leads to
negative actions such as drinking, drugs,
free sex and even away from religious
values.
According to Law No. 40 of 2009
concerning Youth, the definition of youth is:
"Indonesian citizens entering an important
period of growth and development aged 16
(sixteen) to 30 (thirty) years." Indonesian
citizens categorized as youth are citizens
aged between 16-30 years. Young people
have a big role in the occurrence of social
changes in the surrounding environment and
in the wider domain, but before young
people try to position themselves as agents
of change, they must make sure they are
ready to become a generation of change, not
even becomes the object of the problem that
occurs in his environment. Young people
must begin to explore the distinctive
character he has, because basically every
young man has unique characteristics,
including creative, critical, optimistic, and
able to adapt to the times plays a role in
social change in the environment. There are
at least three roles of youth in Peru social
materials, namely as change agents (agent
of change), development agents (agent of
development) and modernization agents
(agents of modernization) (Rusmana, 2016)
The craft industry is one type of work that
develops in human life. In Indonesia the
work industry continues to experience
development and receives considerable
attention from the government, small
industry is one of the village community
development strategies, so it needs to be
developed to increase employment
opportunities. Ariawati (in Hermana, 2016:
5) added that small-scale industry is a
business sector that is the foundation of
Indonesian people's hopes, considering that
more than 99% of businesses in Indonesia
are classified as small-scale industries and
absorb 88,30% of all workers.
Small industry is an integral part of
the national business world that has the
Mhd. Isnen Harahap et.al. The Influence of Youth Role against the Development of Handicraft Industry in
District of Kualuh Hulu, North Labuhanbatu Regency
International Journal of Research & Review (www.ijrrjournal.com) 30
Vol.5; Issue: 10; October 2018
position, potential and role that are very
important and strategic in building
economic power from the bottom and is
Bottom Up. Small businesses are business
activities that are able to expand
employment and provide broad economic
services to the community and are able to
encourage the rate of economic growth and
regional development (Tripriyono, 2008: 3)
Small-scale industrial development needs to
be improved and expanded because it has
great potential in the development process,
especially in absorbing labor and expanding
employment when compared to other
industrial groups. This is because small
industries are often associated with small
capital, low technology, traditional character
and a low level of efficiency.
North Labuhanbatu Regency is a
new regency resulting from the regency of
Labuhanbatu. North Labuhanbatu Regency
was formed based on the Law of the
Republic of Indonesia Number 23 of 2008
concerning the establishment of North
Labuhanbatu Regency in North Sumatra
Province. North Labuhanbatu Regency has
sufficient potential to develop small
industries, especially the handicraft
industry, namely in the Hanna Plantation
Village, Kualuh Hulu District, considering
that this village is in the territory of PT.
Perkebunan Nusantara (PTPN III) with oil
palm plants. The dominant handicraft
industry in Kualuh Hulu Sub district is the
result of the waste of palm oil harvesting,
namely broom sticks, food placemat and
food. The Hanna Plantation Village is a
village located on the southern edge of
Kualuh Hulu District. The Hanna Plantation
Village is a village in the area of PT.
Perkebunan Nusantara (PTPN III) with oil
palm plantations; the waste produced by
palm oil harvesting is processed by the
community into crafts. The increase in the
quantity of handicrafts and the willingness
to produce handicrafts in the Hanna
Plantation Village is still not significant
from year to year, this can be seen from the
variations in production from year to year
that have not changed and each type of craft
that is carried out is still imitating each
other.
The community in the Hanna
Plantation village is still largely focused as
an employee at PT. Perkebunan Nusantara
(PTPN III). The percentage of the
population working on the plantation is
almost 85% of the total population. It can
almost be observed that the income of the
people in this village is still not at a
reasonable level, because only as employees
and this is a problem that is constantly faced
by the community in the Hanna Plantation
village. Because of these economic
problems, there is a small part of society
that adds income by making handicrafts
with simple creativity made from plantation
waste. The number of craftsmen in the
village is also still quite small, this is
because there are still most people consider
that the craft business is not very promising.
Even the handicraft industry players
themselves still face many problems in the
craft manufacturing process, these problems
include: (1) lack of capital for business
development, (2) limited marketing access,
this is related to market share information,
(3) product problems that relating to product
quality, (5) technology, (6) business
management, (7) labor. (Source: Hanna
Plantation Village Head, interview,
December 4, 2017).
Another important issue is the
orientation of the community which almost
happens in all plantation employees that the
community expects even requires their
children to become their successors as
Keryawan on plantations or as civil servants
(PNS) in the government. This stigma is
awakened because employees feel that
looking for a job is a difficult thing and
there is no certainty of income, if you
become an employee or civil servant it is
certain that you get a salary every month.
This hope is the obstacle for the community
and the younger generation to develop the
handicraft industry, even though the raw
materials are so abundant and the progress
of the era that requires society in general no

Mhd. Isnen Harahap et.al. The Influence of Youth Role against the Development of Handicraft Industry in
District of Kualuh Hulu, North Labuhanbatu Regency
International Journal of Research & Review (www.ijrrjournal.com) 31
Vol.5; Issue: 10; October 2018
exception young people to dare to venture
into the business world.
Increasing the quantity of
handicrafts and providing an understanding
of the importance of small businesses in the
Hanna Plantation Village is a must for
expanding employment opportunities,
opening business opportunities, increasing
income, fostering the ability and
independence of the community,
considering that there are also sufficient raw
materials. The role of youth is highly
expected in this situation, where young
people are expected to be able to provide
enlightenment with new ideas and ideas and
provide understanding to the community,
especially housewives that by producing
handicrafts with sufficient quantities will
increase income and improve the economy
of the community.
Literature Review and Hypothesis
Development
Youth
The quality of a nation can be seen
from the quality of its youth, because the
younger generation is the successor and heir
of the nation in the future. The young
generation must have strong character and
discipline to build their nation and country,
have a high personality, the spirit of
nationalism, never give up, be able to
understand knowledge and technology to
compete globally. Internationally, the World
Health Organization (WHO) mentions
young people as young people with a age
limit of 10 to 24 years while the age of 10-
19 years is called adolescence or
adolescents. In the International Youth Year
held in 1985 defined youth as residents aged
15 to 24 years. Referring to the Youth Law
Number 40 of 2009 article 1 paragraph 1,
Youth is an Indonesian citizen entering an
important period of growth and
development aged 16 (sixteen) to 30 (thirty)
years (Source: Law No. 40 Year 2009)
Based on the above understanding, it can be
concluded that youth are human beings aged
16-30 years who have an important role in
development both physically and non-
physically because young people have
knowledge, skills, characters and networks.
The role of Youth Youth actually have a strategic role
and function in accelerating development as
well as in the process of national and state
life. Youth are actors in development. The
good and bad of a country is seen from the
quality of its youth, because the younger
generation is the successor and heir to the
nation and the State. The young generation
must have a strong character to build their
nation and country, have a high personality,
the spirit of nationalism, competitive spirit,
able to understand knowledge and
technology to compete globally. Youth also
need to pay attention that they have a
function as Agent of change, moral force
and social control so that the function can be
useful for the community.
In the process of nation building,
youth is a moral force, social control and
agent of change as a manifestation of its
function, role, characteristics and strategic
position in national development. Therefore,
the responsibility and strategic role of youth
in all dimensions of development needs to
be increased within the framework of
regional and national development in
accordance with the values contained in
Law Number 25 of 2004 concerning the
National Development Planning System
(SPPN) by promoting democratic aspects,
justice, participatory, togetherness, equality,
and independence in realizing development.
The Role of Small Industries in Rural
Community Economic Development
According to Usman (1998), the role
of small businesses in the national economy
can at least be seen from three things,
namely in the formation of national income,
its role in the absorption of labor and its role
as a buffer. The small business sector such
as the craft industry is believed to be a
sector that can lead other sectors in an
economy towards progress. Industrial
products always have a high exchange or
are more profitable and create greater added
value compared to other sector products.
This is because the industrial sector has a
Mhd. Isnen Harahap et.al. The Influence of Youth Role against the Development of Handicraft Industry in
District of Kualuh Hulu, North Labuhanbatu Regency
International Journal of Research & Review (www.ijrrjournal.com) 32
Vol.5; Issue: 10; October 2018
very diverse product variety and is able to
provide high marginal benefits to the wearer
(Dumairy, 1996: 227).
Small business is an integral part of
the national business world which has a
very important position, potential and role
and is very strategic in building economic
power from below and is Bottom Up. Small
businesses are business activities that are
able to expand employment and provide
broad economic services to the community
and are able to drive the rate of economic
growth. Small-scale industries and folk
handicrafts that are mostly in rural areas can
play an important role for economic
development because they provide
employment for villagers, provide
additional income, and in some cases are
able to produce goods needed by local
people and the surrounding area more
efficiently and more cheap compared to
large industries (Mubyarto, 2001).
Youth must be present and provide
solutions to people's economic problems
with their roles. As an agent of change, an
agent of development and an agent of
modernization, youth must be able to
change their surroundings into something
new and good for society. In its enormous
capacity and role, youth must have qualified
human resources. The role of youth is
expected to become even a necessity to
contribute to the process of filling and
improving the economy of a region for
regional development and development
even nationally. Through the expertise,
ideas, courage, ideas and creativity of youth,
youth are expected to be able to sustain
development both locally, regionally and
even nationally. Youth is expected to be the
front guard in increasing economic
resources, strengthening sports, arts and
culture and implementing entrepreneurship
education to the community to channel their
ideas and creativity to the surrounding
environment.
Handicraft Industry is an effort in an
effort to increase economic resources and
strengthen arts and culture. Handicrafts
require high-level ideas and creativity like
what is owned by youth in general, through
which young people can make real
movements in increasing the economic
resources of the community by actively
creating and carrying out handicraft
improvements. Through handicrafts, it is not
impossible that economic problems that
today strangle the neck can be a solution in
enlightening life. Handicrafts made with
high creativity and artistic value will make
these items become high economic value as
well. Based on the thinking framework
above, the writer can formulate the
following hypothesis: The role of Youth has
a positive and significant effect on the
Development of the Handicraft Industry in
Kualuh Hulu Subdistrict, North
Labuhanbatu District.
MATERIALS & METHODS
The type of research used in this
research is quantitative descriptive.
Quantitative descriptive research aims to
describe, explain, or summarize various
conditions, situations, phenomena according
to the incident as it is about the Role of
Youth Against the Development of the
Handicraft Industry in Kualuh Hulu District,
North Labuhanbatu District (Sugiyono,
2010). The populations studied in this
research were all young people in the Hanna
Plantation Village, Kualuh Hulu Subdistrict,
North Labuhanbatu Regency, which were
96 people. Because the number of
population in this study amounted to less
than 100 people, the sample used in this
study was the total number of existing
populations that became the object / subject
of the study. In accordance with what was
stated by Sugiyono (2011) that the number
of samples expected to represent 100% of
the population is the same as the number of
members of the population itself. In other
words, this study is a population research or
census study. Based on this, the total
sampling method was used by taking a
sample of all the youth in the Hanna
Plantation Village, Kualuh Hulu District,
North Labuhanbatu Regency, totaling 96
people to be sampled.

Mhd. Isnen Harahap et.al. The Influence of Youth Role against the Development of Handicraft Industry in
District of Kualuh Hulu, North Labuhanbatu Regency
International Journal of Research & Review (www.ijrrjournal.com) 33
Vol.5; Issue: 10; October 2018
The Influence of Youth's Role on the
Development of the Handicraft
Industry with Sales Growth
Classic Assumption Testing
- Normality test
Normality test aims to determine the
normal or not distribution of residual
factors. There are two ways to detect
whether residuals are normally distributed
or not, namely by graph analysis and
statistical tests. Graph analysis is with a
histogram graph and looking at normal
probability plots by comparing the
cumulative distribution with normal
distribution. Normal distribution will form a
diagonal straight line and plotting residual
data will compare with diagonal lines. In
addition, to see the residual normality can
be done with a histogram graph that
compares observations with normal
distributions that approach normal
distribution.
Figure 1: Normal P-Plot of Regression Standardized Residual
PP
The results of the normal plot graph
in Figure 1 can be concluded that the data
spread around the diagonal line and follow
the direction of the diagonal line. This
shows that residual data is normally near
normal distribution.
- Multicollinearity Test
Multicollinearity test was conducted to test
whether the regression model found
correlation between independent variables.
If there is a correlation, it is called a
problem of multicollinearity. A good
regression model should not have a
correlation between independent variables.
Testing whether or not there is a symptom
of multicollinearity is done by paying
attention to the value of the correlation
matrix produced during data processing as
well as the VIF (Variance Inflation Factor)
and Tolerance-yes values. VIF value is less
than 10 and tolerance is more than 0.10, it
indicates that there is no symptom of
multicollinearity. So that it can be
concluded that the regression model does
not occur in multicollinearity problems.
Table 1: The results of multicollinearity testing influence the
role of youth in the development of small industries in sales
growth
Coefficientsa
Model Collinearity Statistics
Tolerance VIF
1 (Constant)
Agent of Change .971 1.030
Agent of Development .882 1.134
Agent of Modernization .902 1.108
a. Dependent Variable: Sales growth
Source: Processed from primary data
The analysis results can be seen that
the VIF and tolerance values are as follows,
the Agent of Change variable has a VIF
value of 1.030 and a tolerance of 0.971. The
Agent of Development variable has a VIF
value of 1.134 and tolerance of 0.882. The
Agent of Modernization variable has a VIF
value of 1.108 and tolerance of 0.902.
The results of the analysis above can
be seen that the tolerance value of all
independent variables (Agent of Change,
Agent of Development, Agent of
Modernization) is more than 0.10 and the
VIF value is less than 10 so it can be
concluded that the independent variables do
not occur multicollinearity, so the model has
met classical assumption requirements in
regression analysis, this is due to the
existing provisions that if the VIF value is
<10 and tolerance > 0.10, then there is no
multicollinearity symptom and the values
obtained from the calculation are in
accordance with the provision of VIF and
tolerance values.
Heteroscedasticity test
Heteroscedasticity test aims to test
whether the regression model occurs
variance inequality from residual one
observation to another observation. A good

Mhd. Isnen Harahap et.al. The Influence of Youth Role against the Development of Handicraft Industry in
District of Kualuh Hulu, North Labuhanbatu Regency
International Journal of Research & Review (www.ijrrjournal.com) 34
Vol.5; Issue: 10; October 2018
regression model is homoscedasticity or
heteroscedasticity does not occur.
Heteroscedasticity test is done by looking at
the presence of certain patterns on the
Scatterplot graph.
Figure 2.: Sales Growth Scatterplots Chart
The scatterplot graph results in
Figure 2. show that the points spread
randomly and spread both above and below
the number 0 on the Y axis and do not form
a certain regular pattern, it can be concluded
that there is no heteroscedasticity in the
regression model. So, it can be concluded
that the regression model fulfills the
assumption test requirements.
Hypothesis testing
Determination Coefficient Test Results
(R²)
The determination coefficient is used
to test the goodness-fit of the regression
model that can be seen from the R square
value. To determine the influence of the role
of youth as Agent of Change, Agent of
Development, the Agent of Modernization
on the development of the craft industry in
sales growth can be seen through the
magnitude of the coefficient of
determination.
Table 2: The results of testing the coefficient of determination influence the role of youth on the development of the craft industry in
sales growth
Model Summaryb
Model R R Square Adjusted R Square Std. Error of the Estimate
1 .890a .852 .844 1.096
a. Predictors: (Constant), Agent of Modernization, Agent of Change, Agent of Development
b. Dependent Variable: Sales Growth
Source: Processed from primary data
The results of the calculation of the
R Square value of 0.852 means that 85.2%
of the development of handicrafts in sales
growth can be influenced by the variable
(Agent of Change, Agent of Development,
Agent of Modernization) above, the
remaining 14.8% is explained by other
variables which is not examined.
Simultaneous Test Results (Test F)
Simultaneous test is used to determine the
extent to which the independent variable (X)
used is able to influence the dependent
variable (Y).
Table 3: The results of simultaneous testing (test-F) influence the role of youth on the development of the craft industry in sales
growth
ANOVAb
Model Sum of Squares Df Mean Square F Sig.
1 Regression 19.897 3 6.632 5.517 .000a
Residual 110.603 92 1.202
Total 130.500 95
a. Predictors: (Constant), Agent of Modernization, Agent of Change, Agent of Development
b. Dependent Variable: sales growth
Source: Processed from primary data
Simultaneous statistical tests are
shown by comparing the calculated F values
with F table values. The value of F table
with a confidence level of 95 percent is
2.47. In the table above shows that in the
equation, F arithmetic 5,517 is greater than
F table. Probability level of 0,000. Then it
can be concluded that P = 0,000 <α = 0,05
which means Ha is accepted. This explains
that the independent variable (Agent of
Mhd. Isnen Harahap et.al. The Influence of Youth Role against the Development of Handicraft Industry in
District of Kualuh Hulu, North Labuhanbatu Regency
International Journal of Research & Review (www.ijrrjournal.com) 35
Vol.5; Issue: 10; October 2018
Change, Agent of Development, Agent of
Modernization) simultaneously has a
significant positive effect on the
development of the craft industry in sales
growth.
Partial Test Results (t-Test)
Partial statistical test with a critical t
value at df = (n-k), where n is the number of
samples and k is the number of independent
variables including constants. To test the
partial regression coefficients individually
from each independent variable can be seen
below.
Table 4: The partial test results (t-test) influence the role of youth on the development of the craft industry in sales growth
Coefficientsa
Model Unstandardized Coefficients Standardized Coefficients T Sig.
B Std. Error Beta
1 (Constant) -2.076 .763 -1.650 .102
Agent of Change .168 .079 .208 2.139 .000
Agent of Development .444 .165 .274 2.684 .000
Agent of Modernization .132 .186 .072 .710 .179
a. Dependent Variable: Sales growth
Source: Processed from primary data
In the table the results of the statistical test t
are obtained, as follows:
a. The Agent of Change variable shows t-
count = 2.139 and t-table 1.660 with a
probability level of 0.000. Thus it can be
concluded that P = 0,000 <α = 0,05, so
Ho's hypothesis is rejected and accepts
Ha's hypothesis that the Agent of
Change variable has a significant
positive effect on the development of the
craft industry in sales growth.
b. The Agent of Development variable
shows t-count = 2.684 and t-table 1.660
with a probability level of 0.000. Thus it
can be concluded that P = 0,000 <α =
0,05, then Ho's hypothesis is rejected
and accepts Ha's hypothesis that the
Agent of Development variable has a
significant positive effect on the
development of the craft industry in
sales growth.
c. The Agent of Modernization variable
shows t-count = 0.710 and t-table 1.660
with a probability level of 0.179. Thus it
can be concluded that P = 0.179> α =
0.05, then Ho's hypothesis accepts and
Ha's hypothesis is rejected which states
that the Agent of Modernization variable
has no significant positive effect on the
development of the craft industry in
sales growth.
The Influence of Youth's Role on the
Development of the Handicraft
Industry in Capital Growth
Classic Assumption Testing
a. Normality test
Normality test aims to determine the normal
or not distribution of residual factors. There
are two ways to detect whether residuals are
normally distributed or not, namely by
graph analysis and statistical tests. Graph
analysis is with a histogram graph and
looking at normal probability plots by
comparing the cumulative distribution with
normal distribution. Normal distribution
will form a diagonal straight line and
plotting residual data will compare with
diagonal lines. In addition, to see the
residual normality can be done with a
histogram graph that compares observations
with normal distributions that approach
normal distribution.
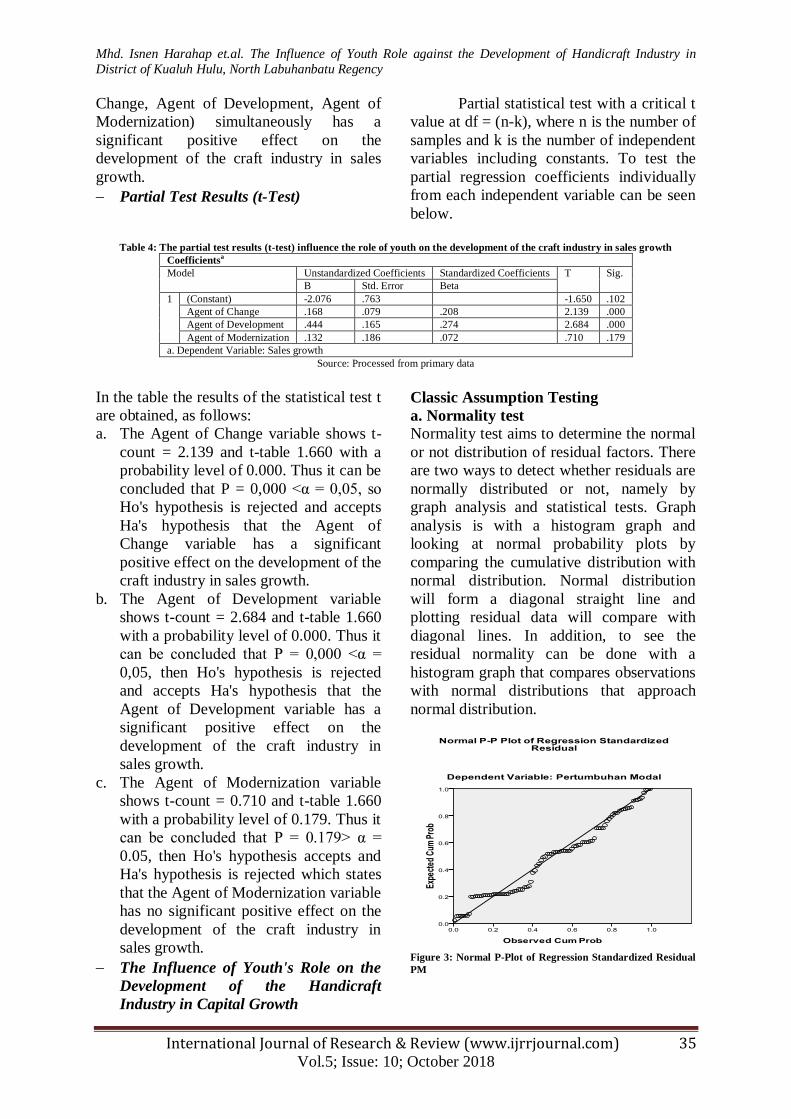
Figure 3: Normal P-Plot of Regression Standardized Residual
PM

Mhd. Isnen Harahap et.al. The Influence of Youth Role against the Development of Handicraft Industry in
District of Kualuh Hulu, North Labuhanbatu Regency
International Journal of Research & Review (www.ijrrjournal.com) 36
Vol.5; Issue: 10; October 2018
The results of the normal graph plot show in
Figure 3. It can be concluded that the data
spread around the diagonal line and follow
the direction of the diagonal line. This
shows that residual data is normally near
normal distribution.
Multicollinearity Test
Multicollinearity test was conducted to test
whether the regression model found
correlation between independent variables.
If there is a correlation, it is called a
problem of multicollinearity. A good
regression model should not have a
correlation between independent variables.
Testing whether or not there is a symptom
of multicollinearity is done by paying
attention to the value of the correlation
matrix produced during data processing as
well as the VIF (Variance Inflation Factor)
and Tolerance-yes values. VIF value is less
than 10 and tolerance is more than 0.10, it
indicates that there is no symptom of
multicollinearity. So that it can be
concluded that the regression model does
not occur in multicollinearity problems.
Table 5: The results of multicollinearity testing influence the
role of youth on the development of the Handicraft Industry in
capital growth
Coefficientsa
Model Collinearity Statistics
Tolerance VIF
1 (Constant)
Agent of Change .971 1.030
Agent of Development .882 1.134
Agent of Modernization .902 1.108
a. Dependent Variable: Pertumbuhan Modal
Source: Processed from primary data
The analysis results can be seen that
the VIF and tolerance values are as follows,
the Agent of Change variable has a VIF
value of 1.030 and a tolerance of 0.971. The
Agent of Development variable has a VIF
value of 1.134 and tolerance of 0.882. The
Agent of Modernization variable has a VIF
value of 1.108 and tolerance of 0.902.
The results of the analysis above can
be seen that the tolerance value of all
independent variables (Agent of Change,
Agent of Development, Agent of
Modernization) is more than 0.10 and the
VIF value is less than 10 so it can be
concluded that the independent variables do
not occur multicollinearity, so the model has
met classical assumption requirements in
regression analysis, this is due to the
existing provisions that if the VIF value is
<10 and tolerance> 0.10, then there is no
multicollinearity symptom and the values
obtained from the calculation are in
accordance with the provision of VIF and
tolerance values.
Heteroscedasticity test
Heteroscedasticity test aims to test whether
the regression model occurs variance
inequality from residual one observation to
another observation. A good regression
model is homoscedasticity or
heteroscedasticity does not occur.
Heteroscedasticity test is done by looking at
the presence of certain patterns on the
Scatterplot graph.
Figure 4.: Chart of Capital Growth Scatterplots
The scatterplot graph results in
Figure 4 shows that the points spread
randomly and spread both above and below
the number 0 on the Y axis and do not form
a certain regular pattern. It can be concluded
that there is no heteroscedasticity in the
regression model. So, it can be concluded
that the regression model fulfills the
assumption test requirements.
Hypothesis testing
Determination Coefficient Test Results
(R²)
The determination coefficient is used
to test the goodness-fit of the regression
model that can be seen from the R square
value. To determine the influence of the role
Mhd. Isnen Harahap et.al. The Influence of Youth Role against the Development of Handicraft Industry in
District of Kualuh Hulu, North Labuhanbatu Regency
International Journal of Research & Review (www.ijrrjournal.com) 37
Vol.5; Issue: 10; October 2018
of youth as Agent of Change, Agent of
Development, the Agent of Modernization
on the development of the craft industry in
capital growth can be seen through the
magnitude of the coefficient of
determination.
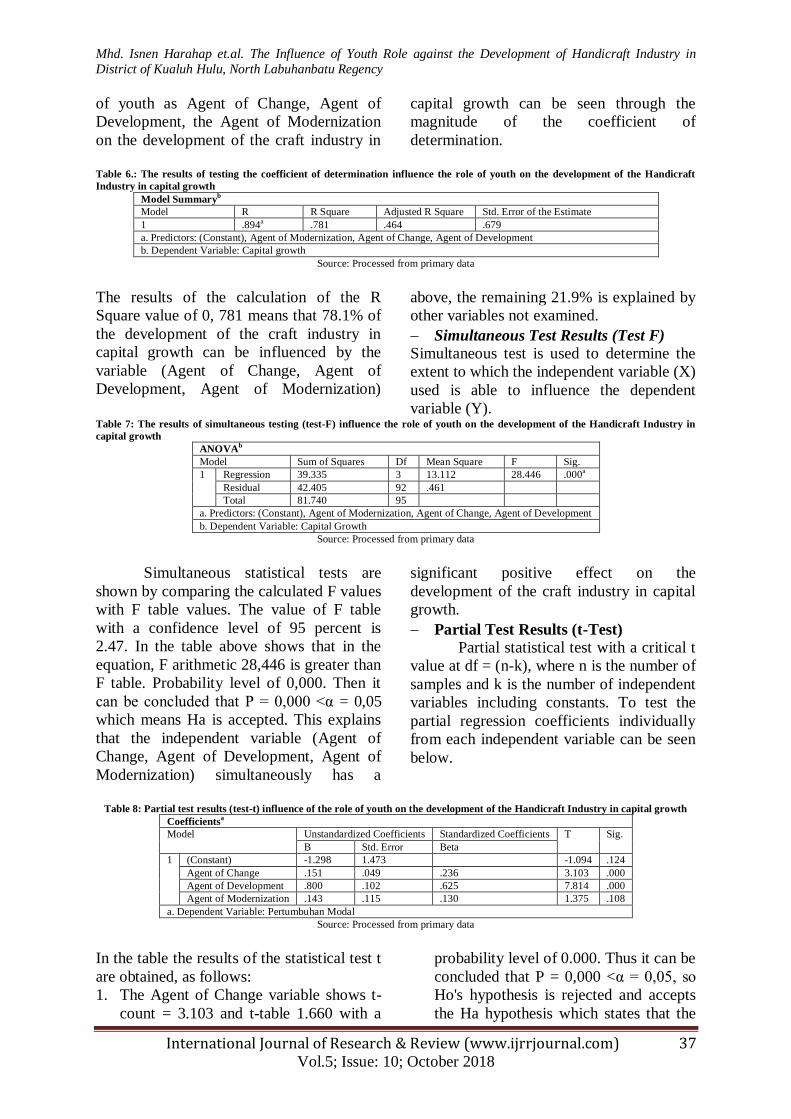
Table 6.: The results of testing the coefficient of determination influence the role of youth on the development of the Handicraft
Industry in capital growth
Model Summaryb
Model R R Square Adjusted R Square Std. Error of the Estimate
1 .894a .781 .464 .679
a. Predictors: (Constant), Agent of Modernization, Agent of Change, Agent of Development
b. Dependent Variable: Capital growth
Source: Processed from primary data
The results of the calculation of the R
Square value of 0, 781 means that 78.1% of
the development of the craft industry in
capital growth can be influenced by the
variable (Agent of Change, Agent of
Development, Agent of Modernization)
above, the remaining 21.9% is explained by
other variables not examined.
Simultaneous Test Results (Test F)
Simultaneous test is used to determine the
extent to which the independent variable (X)
used is able to influence the dependent
variable (Y). Table 7: The results of simultaneous testing (test-F) influence the role of youth on the development of the Handicraft Industry in
capital growth
ANOVAb
Model Sum of Squares Df Mean Square F Sig.
1 Regression 39.335 3 13.112 28.446 .000a
Residual 42.405 92 .461
Total 81.740 95
a. Predictors: (Constant), Agent of Modernization, Agent of Change, Agent of Development
b. Dependent Variable: Capital Growth
Source: Processed from primary data
Simultaneous statistical tests are
shown by comparing the calculated F values
with F table values. The value of F table
with a confidence level of 95 percent is
2.47. In the table above shows that in the
equation, F arithmetic 28,446 is greater than
F table. Probability level of 0,000. Then it
can be concluded that P = 0,000 <α = 0,05
which means Ha is accepted. This explains
that the independent variable (Agent of
Change, Agent of Development, Agent of
Modernization) simultaneously has a
significant positive effect on the
development of the craft industry in capital
growth.
Partial Test Results (t-Test)
Partial statistical test with a critical t
value at df = (n-k), where n is the number of
samples and k is the number of independent
variables including constants. To test the
partial regression coefficients individually
from each independent variable can be seen
below.
Table 8: Partial test results (test-t) influence of the role of youth on the development of the Handicraft Industry in capital growth
Coefficientsa
Model Unstandardized Coefficients Standardized Coefficients T Sig.
B Std. Error Beta
1 (Constant) -1.298 1.473 -1.094 .124
Agent of Change .151 .049 .236 3.103 .000
Agent of Development .800 .102 .625 7.814 .000
Agent of Modernization .143 .115 .130 1.375 .108
a. Dependent Variable: Pertumbuhan Modal
Source: Processed from primary data
In the table the results of the statistical test t
are obtained, as follows:
1. The Agent of Change variable shows t-
count = 3.103 and t-table 1.660 with a
probability level of 0.000. Thus it can be
concluded that P = 0,000 <α = 0,05, so
Ho's hypothesis is rejected and accepts
the Ha hypothesis which states that the

Mhd. Isnen Harahap et.al. The Influence of Youth Role against the Development of Handicraft Industry in
District of Kualuh Hulu, North Labuhanbatu Regency
International Journal of Research & Review (www.ijrrjournal.com) 38
Vol.5; Issue: 10; October 2018
Agent of Change variable has a
significant positive effect on the
development of the craft industry in
capital growth.
2. The Agent of Development variable
shows t-count = 7.814 and t-table 1.660
with a probability level of 0.000. Thus it
can be concluded that P = 0,000 <α =
0,05, so Ho's hypothesis is rejected and
accepts Ha's hypothesis that the Agent
of Development variable has a
significant positive effect on the
development of the craft industry in
capital growth.
3. The Agent of Modernization variable
shows t-count = 1.375 and t-table 1.660
with a probability level of 0.108. Thus it
can be concluded that P = 0.108> α =
0.05, then the Ho hypothesis is accepted
and rejected by the Ha hypothesis which
states that the Agent of Modernization
variable has no significant positive
effect on the development of the craft
industry in capital growth.
Effect of the Role of Youth on the
Development of Handicraft Industry in
Labor Growth
Classic Assumption Testing
Normality test
Normality test aims to determine the
normal or not distribution of residual
factors. There are two ways to detect
whether residuals are normally distributed
or not, namely by graph analysis and
statistical tests. Graph analysis is with a
histogram graph and looking at normal
probability plots by comparing the
cumulative distribution with normal
distribution. Normal distribution will form a
diagonal straight line and plotting residual
data will compare with diagonal lines. In
addition, to see the residual normality can
be done with a histogram graph that
compares observations with normal
distributions that approach normal
distribution.
The results of the normal graph
display plot in Figure 5. It can be concluded
that the data spread around the diagonal line
and follow the direction of the diagonal line.
This shows that residual data is normally
near normal distribution.
Figure 5: Normal P-Plot of Regression Standardized Residual
CAR
Multicollinearity Test
Multicollinearity test was conducted to
test whether the regression model found
correlation between independent variables.
If there is a correlation, it is called a
problem of multicollinearity. A good
regression model should not have a
correlation between independent variables.
Testing whether or not there is a symptom
of multicollinearity is done by paying
attention to the value of the correlation
matrix produced during data processing as
well as the VIF (Variance Inflation Factor)
and Tolerance-yes values. VIF value is less
than 10 and tolerance is more than 0.10, it
indicates that there is no symptom of
multicollinearity. So that it can be
concluded that the regression model does
not occur in multicollinearity problems.
Table 9: The results of multicollinearity testing influence the
role of youth in the development of the craft industry in the
growth of labor
Coefficientsa
Model Collinearity
Statistics
Tolerance VIF
1 (Constant)
Agent of Change .971 1.030
Agent of Development .882 1.134
Agent of Modernization .902 1.108
a. Dependent Variable: Growth of labor
Source: Processed from primary data
Mhd. Isnen Harahap et.al. The Influence of Youth Role against the Development of Handicraft Industry in
District of Kualuh Hulu, North Labuhanbatu Regency
International Journal of Research & Review (www.ijrrjournal.com) 39
Vol.5; Issue: 10; October 2018
The analysis results can be seen that
the VIF and tolerance values are as follows,
the Agent of Change variable has a VIF
value of 1.030 and a tolerance of 0.971. The
Agent of Development variable has a VIF
value of 1.134 and tolerance of 0.882. The
Agent of Modernization variable has a VIF
value of 1.108 and tolerance of 0.902.
The results of the analysis above can
be seen that the tolerance value of all
independent variables (Agent of Change,
Agent of Development, Agent of
Modernization) is more than 0.10 and the
VIF value is less than 10 so it can be
concluded that the independent variables do
not occur multicollinearity, so the model has
met classical assumption requirements in
regression analysis, this is due to the
existing provision that if the VIF value is
<10 and tolerance > 0.10, then there is no
multicollinearity symptom and the values
obtained from the calculation are in
accordance with the provisions of VIF and
tolerance values.
Heteroscedasticity test
Heteroscedasticity test aims to test whether
the regression model occurs variance
inequality from residual one observation to
another observation. A good regression
model is homoscedasticity or
heteroscedasticity does not occur.
Heteroscedasticity test is done by looking at
the presence of certain patterns on the
Scatterplot graph.
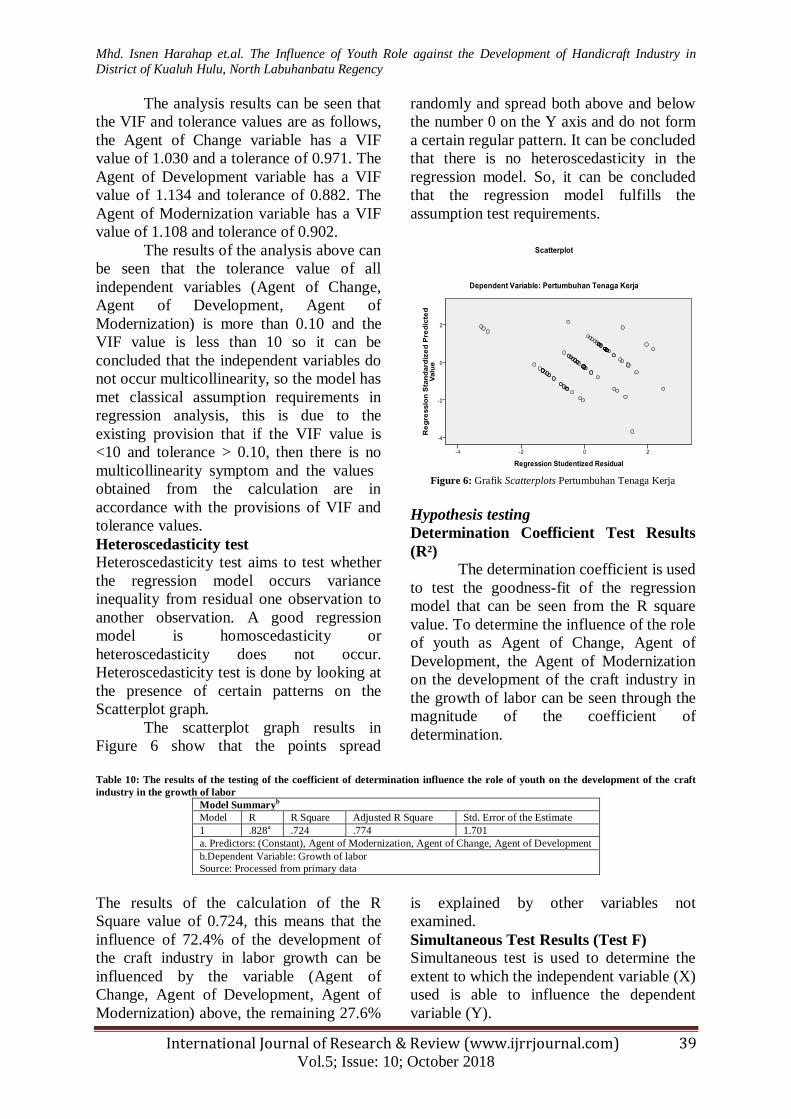
The scatterplot graph results in
Figure 6 show that the points spread
randomly and spread both above and below
the number 0 on the Y axis and do not form
a certain regular pattern. It can be concluded
that there is no heteroscedasticity in the
regression model. So, it can be concluded
that the regression model fulfills the
assumption test requirements.
Figure 6: Grafik Scatterplots Pertumbuhan Tenaga Kerja
Hypothesis testing
Determination Coefficient Test Results
(R²)
The determination coefficient is used
to test the goodness-fit of the regression
model that can be seen from the R square
value. To determine the influence of the role
of youth as Agent of Change, Agent of
Development, the Agent of Modernization
on the development of the craft industry in
the growth of labor can be seen through the
magnitude of the coefficient of
determination.
Table 10: The results of the testing of the coefficient of determination influence the role of youth on the development of the craft
industry in the growth of labor
Model Summaryb
Model R R Square Adjusted R Square Std. Error of the Estimate
1 .828a .724 .774 1.701
a. Predictors: (Constant), Agent of Modernization, Agent of Change, Agent of Development
b.Dependent Variable: Growth of labor
Source: Processed from primary data
The results of the calculation of the R
Square value of 0.724, this means that the
influence of 72.4% of the development of
the craft industry in labor growth can be
influenced by the variable (Agent of
Change, Agent of Development, Agent of
Modernization) above, the remaining 27.6%
is explained by other variables not
examined.
Simultaneous Test Results (Test F)
Simultaneous test is used to determine the
extent to which the independent variable (X)
used is able to influence the dependent
variable (Y).

Mhd. Isnen Harahap et.al. The Influence of Youth Role against the Development of Handicraft Industry in
District of Kualuh Hulu, North Labuhanbatu Regency
International Journal of Research & Review (www.ijrrjournal.com) 40
Vol.5; Issue: 10; October 2018
Table 11: The results of simultaneous testing (test-F) influence the role of youth on the development of the craft industry in the
growth of labor
ANOVAb
Model Sum of Squares Df Mean Square F Sig.
1 Regression 29.398 3 9.799 19.920 .000a
Residual 45.258 92 .492
Total 74.656 95
a. Predictors: (Constant), Agent of Modernization, Agent of Change, Agent of Development
b. Dependent Variable: Growth of labor
Source: Processed from primary data
Simultaneous statistical tests are
shown by comparing the calculated F values
with F table values. The value of F table
with a confidence level of 95 percent is
2.47. In the table above shows that in the
equation, the calculated F 19.920 is greater
than F table. Probability level of 0,000.
Then it can be concluded that P = 0,000 <α
= 0,05 which means Ha is accepted. This
explains that the independent variable
(Agent of Change, Agent of Development,
Agent of Modernization) simultaneously has
a significant positive effect on the
development of the craft industry in the
growth of the workforce.
Partial Test Results (t-Test)
Partial statistical test with a critical t
value at df = (n-k), where n is the number of
samples and k is the number of independent
variables including constants. To test the
partial regression coefficients individually
from each independent variable can be seen
below.
Table 12 : The partial test results (test-t) influence the role of youth on the development of the craft industry in the growth of labor
Coefficientsa
Model Unstandardized Coefficients Standardized Coefficients T Sig.
B Std. Error Beta
1 (Constant) -1.458 1.188 -.682 .320
Agent of Change .288 .150 .245 2.761 .000
Agent of Development .280 .106 .229 2.649 .000
Agent of Modernization .190 .119 .095 1.290 .153
a. Dependent Variable: Growth of labor
Source: Processed from primary data
In the table the results of the statistical test t
are obtained, as follows:
1. The Agent of Change variable shows t-
count = 2.761 and t-table 1.660 with a
probability level of 0.000. Thus it can be
concluded that P = 0,000> α = 0,05, then
Ho's hypothesis is rejected and accepts
the Ha hypothesis which states that the
Agent of Change variable has a
significant positive effect on the
development of the craft industry in the
growth of labor.
2. The Agent of Development variable
shows t-count = 2.469 and t-table 1.660
with a probability level of 0.000. Thus it
can be concluded that P = 0,000 <α =
0,05, so Ho's hypothesis is rejected and
accepts Ha's hypothesis that the Agent
of Development variable has a
significant positive effect on the
development of the craft industry in the
growth of labor.
3. The Agent of Modernization variable
shows t-count = 1.290 and t-table 1.660
with a probability level of 0.153. Thus it
can be concluded that P = 0.153> α =
0.05, the Ho hypothesis is accepted and
rejected by the Ha hypothesis which
states that the Agent of Modernization
variable has no significant positive
effect on the development of the craft
industry in the growth of labor.
Effect of the Role of Youth on the
Development of Handicraft Industry in
Market Growth
Classic Assumption Testing
Normality test
Normality test aims to determine the normal
or not distribution of residual factors. There

Mhd. Isnen Harahap et.al. The Influence of Youth Role against the Development of Handicraft Industry in
District of Kualuh Hulu, North Labuhanbatu Regency
International Journal of Research & Review (www.ijrrjournal.com) 41
Vol.5; Issue: 10; October 2018
are two ways to detect whether residuals are
normally distributed or not, namely by
graph analysis and statistical tests. Graph
analysis is with a histogram graph and
looking at normal probability plots by
comparing the cumulative distribution with
normal distribution. Normal distribution
will form a diagonal straight line and
plotting residual data will compare with
diagonal lines. In addition, to see the
residual normality can be done with a
histogram graph that compares observations
with normal distributions that approach
normal distribution.
Figure 7.: Normal P-Plot of Regression Standardized Residual
P. Market
The results of the normal plot graph in
Figure 7 can be concluded that the data
spread around the diagonal line and follow
the direction of the diagonal line. This
shows that residual data is normally near
normal distribution.
- Multicollinearity Test
Multicollinearity test was conducted
to test whether the regression model found
correlation between independent variables.
If there is a correlation, it is called a
problem of multicollinearity. A good
regression model should not have a
correlation between independent variables.
Testing whether or not there is a symptom
of multicollinearity is done by paying
attention to the value of the correlation
matrix produced during data processing as
well as the VIF (Variance Inflation Factor)
and Tolerance-yes values. VIF value is less
than 10 and tolerance is more than 0.10, it
indicates that there is no symptom of
multicollinearity. So that it can be
concluded that the regression model does
not occur in multicollinearity problems.
Table 13 : The results of multicollinearity testing influence the
role of youth in the development of the craft industry in
market growth
Coefficientsa
Model Collinearity
Statistics
Tolerance VIF
1 (Constant)
Agent of Change .971 1.030
Agent of Development .882 1.134
Agent of Modernization .902 1.108
a. Dependent Variable: Market growth
Source: Processed from primary data
The analysis results can be seen that
the VIF and tolerance values are as follows,
the Agent of Change variable has a VIF
value of 1.030 and a tolerance of 0.971. The
Agent of Development variable has a VIF
value of 1.134 and tolerance of 0.882. The
Agent of Modernization variable has a VIF
value of 1.108 and tolerance of 0.902.
The results of the analysis above can
be seen that the tolerance value of all
independent variables (Agent of Change,
Agent of Development, Agent of
Modernization) is more than 0.10 and the
VIF value is less than 10 so it can be
concluded that the independent variables do
not occur multicollinearity, so the model
meets classical assumption requirements in
regression analysis, this is due to the
existing provision that if the VIF value is
<10 and tolerance> 0.10, then there is no
multicollinearity symptom and the values
obtained from the calculation are in
accordance with the provisions of VIF and
tolerance values.
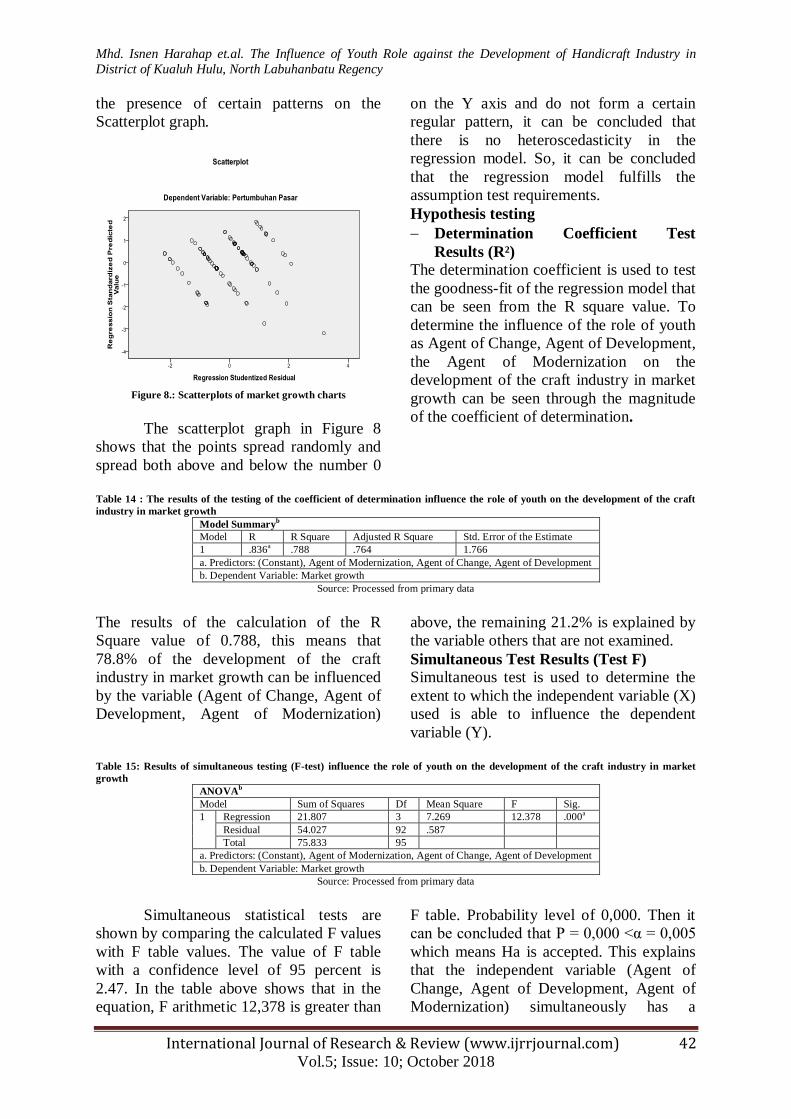
Heteroscedasticity test
Heteroscedasticity test aims to test
whether the regression model occurs
variance inequality from residual one
observation to another observation. A good
regression model is homoscedasticity or
heteroscedasticity does not occur.
Heteroscedasticity test is done by looking at
Mhd. Isnen Harahap et.al. The Influence of Youth Role against the Development of Handicraft Industry in
District of Kualuh Hulu, North Labuhanbatu Regency
International Journal of Research & Review (www.ijrrjournal.com) 42
Vol.5; Issue: 10; October 2018
the presence of certain patterns on the
Scatterplot graph.
Figure 8.: Scatterplots of market growth charts
The scatterplot graph in Figure 8
shows that the points spread randomly and
spread both above and below the number 0
on the Y axis and do not form a certain
regular pattern, it can be concluded that
there is no heteroscedasticity in the
regression model. So, it can be concluded
that the regression model fulfills the
assumption test requirements.
Hypothesis testing
Determination Coefficient Test
Results (R²)
The determination coefficient is used to test
the goodness-fit of the regression model that
can be seen from the R square value. To
determine the influence of the role of youth
as Agent of Change, Agent of Development,
the Agent of Modernization on the
development of the craft industry in market
growth can be seen through the magnitude
of the coefficient of determination.
Table 14 : The results of the testing of the coefficient of determination influence the role of youth on the development of the craft
industry in market growth
Model Summaryb
Model R R Square Adjusted R Square Std. Error of the Estimate
1 .836a .788 .764 1.766
a. Predictors: (Constant), Agent of Modernization, Agent of Change, Agent of Development
b. Dependent Variable: Market growth
Source: Processed from primary data
The results of the calculation of the R
Square value of 0.788, this means that
78.8% of the development of the craft
industry in market growth can be influenced
by the variable (Agent of Change, Agent of
Development, Agent of Modernization)
above, the remaining 21.2% is explained by
the variable others that are not examined.
Simultaneous Test Results (Test F)
Simultaneous test is used to determine the
extent to which the independent variable (X)
used is able to influence the dependent
variable (Y).
Table 15: Results of simultaneous testing (F-test) influence the role of youth on the development of the craft industry in market
growth
ANOVAb
Model Sum of Squares Df Mean Square F Sig.
1 Regression 21.807 3 7.269 12.378 .000a
Residual 54.027 92 .587
Total 75.833 95
a. Predictors: (Constant), Agent of Modernization, Agent of Change, Agent of Development
b. Dependent Variable: Market growth
Source: Processed from primary data
Simultaneous statistical tests are
shown by comparing the calculated F values
with F table values. The value of F table
with a confidence level of 95 percent is
2.47. In the table above shows that in the
equation, F arithmetic 12,378 is greater than
F table. Probability level of 0,000. Then it
can be concluded that P = 0,000 <α = 0,005
which means Ha is accepted. This explains
that the independent variable (Agent of
Change, Agent of Development, Agent of
Modernization) simultaneously has a
Mhd. Isnen Harahap et.al. The Influence of Youth Role against the Development of Handicraft Industry in
District of Kualuh Hulu, North Labuhanbatu Regency
International Journal of Research & Review (www.ijrrjournal.com) 43
Vol.5; Issue: 10; October 2018
significant positive effect on the
development of the craft industry in market
growth.
Partial Test Results (t-Test)
Partial statistical test with a critical t
value at df = (n-k), where n is the number of
samples and k is the number of independent
variables including constants. To test the
partial regression coefficients individually
from each independent variable can be seen
below.
Table 16 : Partial test results (t-test) influence the role of youth on the development of the craft industry in market growth
Coefficientsa
Model Unstandardized Coefficients Standardized Coefficients T Sig.
B Std. Error Beta
1 (Constant) -2.353 1.533 -1.033 .106
Agent of Change .216 .055 .351 3.926 .000
Agent of Development .446 .116 .361 3.855 .000
Agent of Modernization .135 .110 .045 1.268 .289
a. Dependent Variable: Market growth
Source: Processed from primary data
In the table the results of the statistical test t
are obtained, as follows:
1. The Agent of Change variable shows t-
count = 3.926 and t-table 1.660 with a
probability level of 0.000. Thus it can be
concluded that P = 0,000 <α = 0,05, so
Ho's hypothesis is rejected and accepts
the Ha hypothesis which states that the
Agent of Change variable has a
significant positive effect on the
development of the craft industry in
market growth.
2. The Agent of Development variable
shows t-count = 3.855 and t-table 1.660
with a probability level of 0.000. Thus it
can be concluded that P = 0,000 <α =
0,05, so Ho's hypothesis is rejected and
accepts Ha's hypothesis that the Agent
of Development variable has a
significant positive effect on the
development of the handicraft industry
in market growth.
3. The Agent of Modernization variable
shows t-count = 1.268 and t-table 1.660
with a probability level of 0.289. Thus it
can be concluded that P = 0.289> α =
0.05, the Ho hypothesis is accepted and
rejected by Ha hypothesis which states
that the Agent of Modernization variable
has a significant and no significant
positive effect on the development of the
craft industry in market growth.
The Influence of Youth's Role on the
Development of Handicraft Industry in
Profit Growth
Classic Assumption Testing
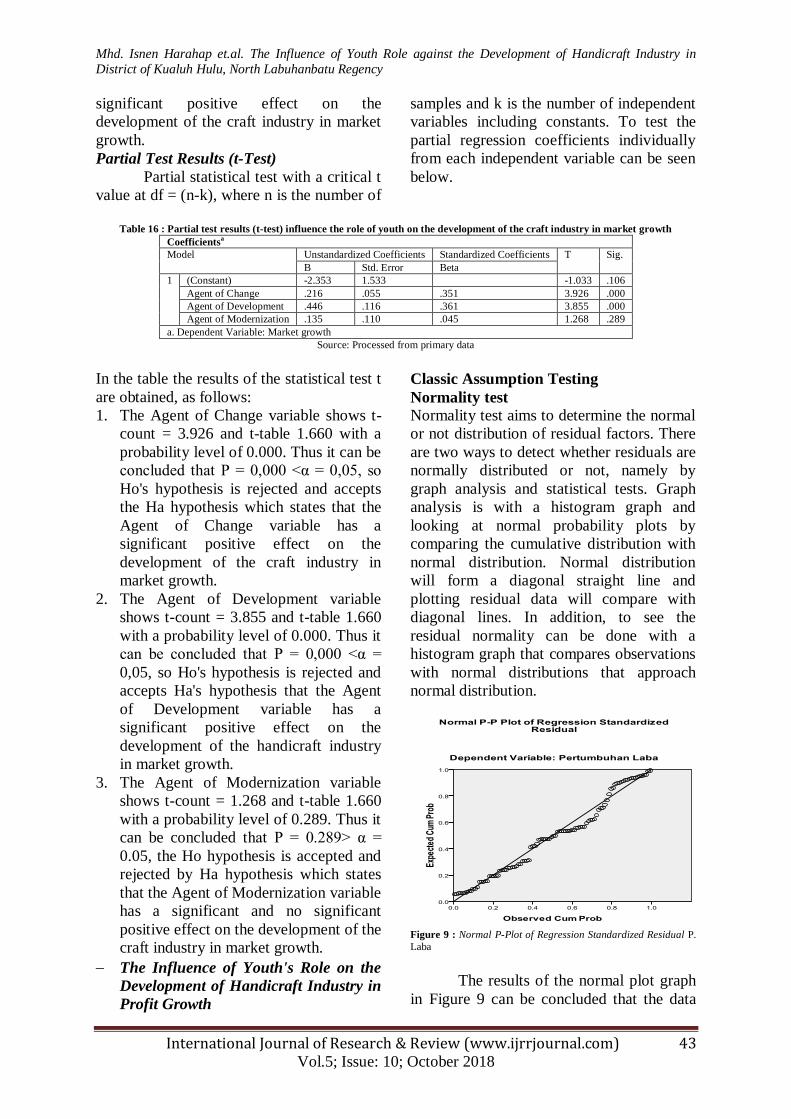
Normality test
Normality test aims to determine the normal
or not distribution of residual factors. There
are two ways to detect whether residuals are
normally distributed or not, namely by
graph analysis and statistical tests. Graph
analysis is with a histogram graph and
looking at normal probability plots by
comparing the cumulative distribution with
normal distribution. Normal distribution
will form a diagonal straight line and
plotting residual data will compare with
diagonal lines. In addition, to see the
residual normality can be done with a
histogram graph that compares observations
with normal distributions that approach
normal distribution.
Figure 9 : Normal P-Plot of Regression Standardized Residual P.
Laba
The results of the normal plot graph
in Figure 9 can be concluded that the data

Mhd. Isnen Harahap et.al. The Influence of Youth Role against the Development of Handicraft Industry in
District of Kualuh Hulu, North Labuhanbatu Regency
International Journal of Research & Review (www.ijrrjournal.com) 44
Vol.5; Issue: 10; October 2018
spread around the diagonal line and follow
the direction of the diagonal line. This
shows that residual data is normally near
normal distribution.
Multicollinearity Test
Multicollinearity test was conducted
to test whether the regression model found
correlation between independent variables.
If there is a correlation, it is called a
problem of multicollinearity. A good
regression model should not have a
correlation between independent variables.
Testing whether or not there is a symptom
of multicollinearity is done by paying
attention to the value of the correlation
matrix produced during data processing as
well as the VIF (Variance Inflation Factor)
and Tolerance-yes values. VIF value is less
than 10 and tolerance is more than 0.10, it
indicates that there is no symptom of
multicollinearity. So that it can be
concluded that the regression model does
not occur in multicollinearity problems.
Tabel 17 : The results of multicollinearity testing influence the
role of youth in the development of the craft industry in profit
growth
Coefficientsa
Model Collinearity
Statistics
Tolerance VIF
1 (Constant)
Agent of Change .971 1.030
Agent of Development .882 1.134
Agent of Modernization .902 1.108
a. Dependent Variable: Profit growth
Source: Processed from primary data
The analysis results can be seen that
the VIF and tolerance values are as follows,
the Agent of Change variable has a VIF
value of 1.030 and a tolerance of 0.971. The
Agent of Development variable has a VIF
value of 1.134 and tolerance of 0.882. The
Agent of Modernization variable has a VIF
value of 1.108 and tolerance of 0.902.
The results of the analysis above can
be seen that the tolerance value of all
independent variables (Agent of Change,
Agent of Development, Agent of
Modernization) is more than 0.10 and the
VIF value is less than 10 so it can be
concluded that the independent variables do
not occur multicollinearity, so the model has
met classical assumption requirements in
regression analysis, this is due to the
existing provisions that if the VIF value is
<10 and tolerance > 0.10, then there is no
multicollinearity symptom and the values
obtained from the calculation are in
accordance with the provision of VIF and
tolerance values.
Heteroscedasticity Test
Heteroscedasticity test aims to test
whether the regression model occurs
variance inequality from residual one
observation to another observation. A good
regression model is homoscedasticity or
heteroscedasticity does not occur.
Heteroscedasticity test is done by looking at
the presence of certain patterns on the
Scatterplot graph.
Figure 10.: Graph of earnings growth Scatterplots
The scatterplot graph results in
Figure 10 shows that the points spread
randomly and spread both above and below
the number 0 on the Y axis and do not form
a certain regular pattern, it can be concluded
that there is no heteroscedasticity in the
regression model. So, it can be concluded
that the regression model fulfills the
assumption test requirements.
Hypothesis testing
Determination Coefficient Test Results
(R²)
The determination coefficient is used to test
the goodness-fit of the regression model that
can be seen from the R square value. To
determine the influence of the role of youth
as Agent of Change, Agent of Development,
the Agent of Modernization on the
development of the craft industry in profit
Mhd. Isnen Harahap et.al. The Influence of Youth Role against the Development of Handicraft Industry in
District of Kualuh Hulu, North Labuhanbatu Regency
International Journal of Research & Review (www.ijrrjournal.com) 45
Vol.5; Issue: 10; October 2018
growth can be seen through the magnitude of the coefficient of determination.
Table 18: The results of testing the coefficient of determination influence the role of youth on the development of the craft industry
in profit growth
Model Summaryb
Model R R Square Adjusted R Square Std. Error of the Estimate
1 .895a .787 .657 1.250
a. Predictors: (Constant), Agent of Modernization, Agent of Change, Agent of Development
b. Dependent Variable: Profit growth
Source: Processed from primary data
The results of the calculation of the
R Square value of 0.787, this means that the
influence of 78.7% of the development of
the craft industry in profit growth can be
influenced by the variable (Agent of
Change, Agent of Development, Agent of
Modernization) above, the remaining 21.3%
is explained by the variable others that are
not examined.
Simultaneous Test Results (Test F)
Simultaneous test is used to determine the
extent to which the independent variable (X)
used is able to influence the dependent
variable (Y).
Table 19: Results of simultaneous testing (test -F) influence the role of youth on the development of the craft industry in profit
growth
ANOVAb
Model Sum of Squares Df Mean Square F Sig.
1 Regression 113.664 3 114.555 13.913 .000a
Residual 143.826 92 1.563
Total 157.490 95
a. Predictors: (Constant), Agent of Modernization, Agent of Change, Agent of Development
b. Dependent Variable: Profit growth
Source: Processed from primary data
Simultaneous statistical tests are
shown by comparing the calculated F values
with F table values. The value of F table
with a confidence level of 95 percent is
2.47. In the table above shows that in the
equation, F arithmetic 13,913 is greater than
F table. Probability level of 0,000. Then it
can be concluded that P = 0,000 <α = 0,05
which means Ha is accepted. This explains
that the independent variable (Agent of
Change, Agent of Development, Agent of
Modernization) simultaneously has a
significant positive effect on the
development of the craft industry in profit
growth.
Partial Test Results (t-Test)
Partial statistical test with a critical t value
at df = (n-k), where n is the number of
samples and k is the number of independent
variables including constants. To test the
partial regression coefficients individually
from each independent variable can be seen
below.
Table 20 : The partial test results (test-t) influence the role of youth on the development of the handicraft industry in profit growth
Coefficientsa
Model Unstandardized Coefficients Standardized Coefficients T Sig.
B Std. Error Beta
1 (Constant) -1.171 1.870 -.745 .167
Agent of Change .149 .090 .168 3.665 .000
Agent of Development .380 .189 .214 4.016 .000
Agent of Modernization .126 .112 .053 .120 .205
a. Dependent Variable: Profit growth
Source: Processed from primary data
In the table the results of the statistical test t
are obtained, as follows:
1. The Agent of Change variable shows t-
count = 3.665 and t-table 1.660 with a
probability level of 0.000. Thus it can be
concluded that P = 0,000 <α = 0,05, then
Ho's hypothesis is rejected and accepts
the Ha hypothesis which states that the
Agent of Change variable has a
significant positive effect on the

Mhd. Isnen Harahap et.al. The Influence of Youth Role against the Development of Handicraft Industry in
District of Kualuh Hulu, North Labuhanbatu Regency
International Journal of Research & Review (www.ijrrjournal.com) 46
Vol.5; Issue: 10; October 2018
development of the handicraft industry
in profit growth.
2. The Agent of Development variable
shows t-count = 4.016 and t-table 1.660
with a probability level of 0.000. Thus it
can be concluded that P = 0,000 <α =
0,05, then Ho's hypothesis is rejected
and accepts the Ha hypothesis which
states that the Agent of Development
variable has a significant positive effect
on the development of the handicraft
industry in profit growth.
3. The Agent of Modernization variable
shows t-count = 0.12 and t-table 1.660
with a probability level of 0.205. Thus it
can be concluded that P = 0.205> α =
0.05, the Ho hypothesis is accepted and
rejected by the Ha hypothesis which
states that the Agent of Modernization
variable has no significant positive
effect on the development of the craft
industry in profit growth.
RESULT
Influence of the role of youth as
agent of change, agent of development, and
agent of modernization towards the
development of the craft industry in Kualuh
Hulu Subdistrict North Labuhan District in
sales growth, capital, labor, market, and
profit simultaneously significant with the
equation f calculated 5,517, 28,446 , 19,920,
12,378, and 13,913. Partially the agent of
change and agent of development has a
significant positive effect, while the agent of
modernization has no significant positive
effect on the development of the craft
industry in Kualuh Hulu District, North
Labuhanbatu Regency.
The percentage of the influence of
the role of youth on the development of the
craft industry in Kualuh Hulu Subdistrict,
North Labuhanbatu Regency is also very
high, this can be seen from the high value of
R Square in each calculation. The influence
of the role of youth on the development of
the craft industry in sales growth was
¬85.2%, while the remaining 14.8% was
explained by other variables not examined
in this study. The influence of the role of
youth on the development of the handicraft
industry in capital growth of ¬78.1%, while
the remaining 21.9% is explained by other
variables that are not examined is examined
in this study. The influence of the role of
youth on the development of the handicraft
industry in the labor growth of 72.4%, while
the remaining 27.6% explained by other
variables not examined was examined in
this study. The influences of the role of
youth on the development of the handicraft
industry in the market growth of 78.8%,
while the remaining 21.2% is explained by
other variables that are not examined are
examined in this study. Then the influence
of the role of youth on the development of
the handicraft industry in the growth profit
amounted to 78.7%, while the remaining
21.3% explained by other variables that
were not examined were examined in this
study.
Based on the results of the tests
described above, it is clear that the role of
Youth has a positive and significant effect
on the development of the Handicraft
Industry in Kualuh Hulu Subdistrict, North
Labuhanbatu Regency. This is because the
test results show considerable value and this
explains that the youth influences the
Development of the Handicraft Industry in
Kualuh Hulu District, North Labuhanbatu
Regency.
Apart from the results of the
calculation of the role of the youth and the
influence of the role of the youth, all of us
agree that youth is the successor of the
Indonesian nation's development wheel
because youth are the target of thinkers to
be better than the past because of the future
of the nation's youth. Youth must use their
position to build young resources from the
community to have knowledge and
competition to compete in people's lives.
Youth are leaders of the future
nation. Nation assets that will determine
death or life, forward or backward,
victorious or destroyed, prosperous or
miserable of a nation. Youth provide a very
important role in the change of the
Indonesian nation starting from the nation's

Mhd. Isnen Harahap et.al. The Influence of Youth Role against the Development of Handicraft Industry in
District of Kualuh Hulu, North Labuhanbatu Regency
International Journal of Research & Review (www.ijrrjournal.com) 47
Vol.5; Issue: 10; October 2018
journey which is divided into several phases
such as the phase of the struggle for
independence, the phase of maintaining
independence or the Old Order phase, the
New Order phase and the reform phase
filled by the power of youth. The strength of
the young man lies in his enthusiasm that
never despairs in the dynamics of
movement, struggle and work in various
fields both political, economic, social,
cultural and so on
Youth have an important position in
nation building. They become major human
resources, strategic groups with the vitality
of agent of change in the life of nation,
society and state. He also became the heir to
the future regeneration of national
civilization because of that youth must be
placed as a strategic and potential group for
national leadership which is a productive
resource of development in the political,
economic, social, cultural, defense and
security fields. youth must be positioned as
the owner of idealism that can determine the
paradigm of the entire life of the nation,
state and society. Thus, youth are placed as
agents of change in making very
fundamental changes even though it turns
out that youth as one of the centers of
alternative change are often the foundation
and hope, if the role of change that should
be carried out by the State is not satisfactory
or constrained by various problems.
Problems in the era of globalization
that occur in various aspects of life greatly
affect youth competitiveness. So that young
people both directly and indirectly are
required to have good skills in the form of
practical skills and skills that use high
technology to be able to compete in creating
employment / developing the type of work
they are currently living.
These problems are faced with
complex development challenges. At the
very least, the development challenges of
the youth sector in the future will be the
emergence of a democratic movement and
the era of globalization which will bring
new problems in the youth sector. This will
have an impact on the issue of national
identity and integrity among youth which
will threaten the unity and unity of the
nation. Another challenge is the lack of
formulation of youth sector development
policies in a harmonious, comprehensive,
integrated and coordinated manner between
policies at the national level and policies at
the regional level.
To overcome these problems, there
is one solution that can be implemented,
namely by exploring the potential of the
village. This potential can be in the form of
natural resources, large population with
productive age, and others. The basic capital
that has been owned before can be
manifested in productive businesses,
entrepreneurship development that does not
yet exist or entrepreneurship improvement
that has existed so far. Villagers must be
convinced that they are actually capable and
worthy of a higher level of welfare.
It's just that productive efforts from
the village must be developed so as not to
stop in the middle of the road. Therefore,
there is a need for sustainable community
development. The existence of related
parties is very necessary, for example
additional capital, expansion of marketing,
increased ability in business /
entrepreneurship (management) and so on
and this can be overcome by youth, with
their networks and connections can provide
input on how to obtain additional capital by
submitting loans as well as improving
entrepreneurial skills by making trainings
and direct practice in making types of crafts
that have better quality and selling value
compared to previous products. The role of
youth must be able to change the bad
conditions that occur in society, with a
myriad of abilities and pioneers they have.
Young people are expected to produce
positive things and activities in the midst of
society, especially in villages and in
Indonesia in general. With the
empowerment of youth in all activities and
aspects of development, it actually becomes
an initial milestone towards success.
Mhd. Isnen Harahap et.al. The Influence of Youth Role against the Development of Handicraft Industry in
District of Kualuh Hulu, North Labuhanbatu Regency
International Journal of Research & Review (www.ijrrjournal.com) 48
Vol.5; Issue: 10; October 2018
CONCLUSION
From the results of the testing and
discussion of the results of the study, the
following conclusions can be drawn:
1. Youth play a role in the Development of
the Handicraft Industry in Kualuh Hulu
Subdistrict, North Labuhanbatu Regency
as evidenced by the positive and
constructive activities they carry out,
including Entrepreneurship Training,
Handicraft Making Training centered on
product differentiation and an increasing
number of crafts, Development
Workshops and Seminars Villages and
other social activities, such as
Commemoration of National Day and
Religious Day, Village Social Service
and Narcotics Counseling.
2. The influence of the role of youth as
agents of change, agent of development,
and agent of modernization
simultaneously have a significant
positive effect on the development of the
handicraft industry in Kualuh Hulu
District, North Labuhan District in sales
growth, capital, labor, market, and
profit. Partially the influence of the role
of youth as agents of change and agent
of development, has a significant
positive effect on the development of the
craft industry in Kualuh Hulu
Subdistrict North Labuhanbatu District,
while the role of youth as the agent of
modernization has no significant
positive effect on the development of the
craft industry in Kualuh Hulu District
North Regency Labuhanbatu.
3. Percentage of the influence of the role of
youth on the development of the
handicraft industry in sales growth,
capital growth, labor growth, market
growth and profit growth in Kualuh
Hulu Subdistrict North Labuhanbatu
District is very high, ie each of 85.2%,
78.1%, 72.4%, 78.8% and 78.7%, this
explains that the role of youth towards
the development of the craft industry in
Kualuh Hulu Subdistrict North
Labuhanbatu District is positive,
meaning the role of youth as agents of
change, agent of development, and agent
of modernization are considered
important and must be improved again.
REFERENCES
(https://www.bps.go.id/ )
Arikunto, Suharsini. 2006. Prosedur Penelitian.
Edisi Revisi. PT. Rineka Cipta. Yogyakarta
Dumairy. 1996. Perekonomian Indonesia.
Erlangga. Jakarta
Erlina. 2010, 2011. Metodologi Penelitian :
Untuk Akuntansi. USU Press. Medan
Ghozali, Imam. 2005. Aplikasi Analisis
Multivariate dengan program SPSS. Badan
Penerbit Universitas Diponegoro. Semarang
Hermana, Rizky. 2016. Peran Industri Sektor
Kerajinan Terhadap Pengembangan Wilayah di
Kecamatan Tanjung Morawa Kabupaten Deli
Serdang
Husaini, Usman. 1998. Manajemen Teori,
Praktik dan Riset. Bumi Aksara. Jakarta
Mubyarto. 2001. Prospek Otonomi Daerah dan
Perekonomian Indonesia Pasca Krisis Ekonomi.
BPFE UGM. Yogyakarta
Rusmana. 2016. Tiga Peran Pemuda Dalam
Perubahan Sosial.
Sugiyono. 2006, 2010, 2011. Metodologi
Penelitian Kuantitatif Kualitatif dan RND. Alfa
Beta. Bandung
Tanjung, Akbar. 2012. Moratorium Politik Menuju Rekonsiliasi Nasional. Golkar Press.
Jakarta
Tripriyono, Agus. 2008. Peranan Industri Kecil
Makanan dan Minuman Terhadap
Pembangunan Ekonomi Wilayah Serdang
Bedagai (Studi Kasus Pasar Bengel Kecamatan
Perbaungan)
Undang-Undang No. 25 Tahun 2004 tentang
Sistem perencanaan pembangunan Nasional
Undang-Undang Republik Indonesia Nomor 40
Tahun 2009 Tentang Kepemudaan
******
How to cite this article: Harahap I, Sibarani
R et.al. The influence of youth role against the
development of handicraft industry in district of Kualuh Hulu, North Labuhanbatu regency. International Journal of Research and Review. 2018; 5(10):28-48.