research report 053 - health and safety executive · hse health & safety executive...
TRANSCRIPT

HSE Health & Safety
Executive
Ship/platform collision incident database (2001)
Prepared by Serco Assurance for the Health and Safety Executive 2003
RESEARCH REPORT 053

HSE Health & Safety
Executive
Ship/platform collision incident database (2001)
J K Robson Serco Assurance
Culham Abingdon
Oxfordshire OX14 3ED
United Kingdom
This report covers work carried out by MaTSU at the request of the Offshore Division of the Health and Safety Executive (HSE) to update the database of collision incidents on the UKCS and the collision frequency analysis provided in the report of MaTR0447.
Data has been collected from a number of collision incident record sources to confirm or complete previous records and to expand the database up to October 2001. The database has expanded from 494 records in MaTR0447 to 557 records. The database of operating experience has been recompiled and extended to encompass all mobile and fixed installations operating on the UKCS and takes into account recent abandonments.
The database has been sorted into incidents involving “passing vessels” and “attendant vessels”. Fortunately, over the whole period of the study, collision incidents involving the former have occurred only 8 times. Nonetheless, the potential exists for major structural damage, possibly even catastrophic, from even a glancing blow by a passing merchant vessel.
As in the previous report (OTO 1999/080) the main database only includes actual collisions and does not include ‘near misses’. However, in an attempt to gain a better understanding as to the scale and nature of the ‘near miss’ events, this report (Appendices E, F and G) does include ‘near miss’ data from a variety of sources; and interprets the findings in section 6.
This report and the work it describes were funded by the HSE. Its contents, including any opinions and/or conclusions expressed, are those of the authors alone and do not necessarily reflect HSE policy.
HSE BOOKS

© Crown copyright 2003
First published 2003
ISBN 0 7176 2679 2
All rights reserved. No part of this publication may bereproduced, stored in a retrieval system, or transmitted inany form or by any means (electronic, mechanical,photocopying, recording or otherwise) without the priorwritten permission of the copyright owner.
Applications for reproduction should be made in writing to:Licensing Division, Her Majesty's Stationery Office, St Clements House, 2-16 Colegate, Norwich NR3 1BQ or by e-mail to [email protected]
ii

Executive Summary
This report covers work carried out by MaTSU at the request of the Offshore Division of the Health and Safety Executive to update the database of collision incidents on the UKCS and the collision frequency analysis provided in the report of MaTR0447.
Data has been collected from a number of collision incident record sources to confirm or complete previous records and to expand the database up to October 2001. The database has expanded from 494 records in MaTR0447 to 557 records. The database of operating experience has been recompiled and extended to encompass all mobile and fixed installations operating on the UKCS and takes into account recent abandonments.
By combining data of collision incidents with installation operating experience, it has been possible to establish the variation of incident frequency with time, and the likely confidence limits that may be placed on them. This has been done for each of the major installation types. This variation has been considered for all incidents and, separately, for those resulting in damage categorised as moderate or severe. The definition of moderate being damage requiring repair in the medium (up to 6 months) or longer term (over 6 months); and severe being damage affecting the integrity of an installation sufficient to require repair in the immediate or short term (up to 1 month).
With certain exceptions, i.e., in 1997, in the last 5 years the mean incident frequency has generally shown a downward trend, particularly for those incidents that resulted in moderate or severe damage.
The database has been sorted into incidents involving “passing vessels” and “attendant vessels”. Fortunately, over the whole period of study, collision incidents involving the former have occurred only 8 times. Nonetheless, the potential exists for major structural damage, possibly even catastrophic, from even a glancing blow by a passing merchant vessel.
The probability of a collision incident per installation year for all incidents, those by passing vessels and for those where the installation/rig required repair were found to be:
Summary of mean incident frequencies of all reported incidents and moderate or severe damage category incidents (all vessel types)
All reported incidents/year Incidents resulting in moderate or severe damage/year
All installations 0.0987 0.0152
Fixed installations 0.0630 0.0095
Semi-submersibles 0.2379 0.0487
Jack-ups 0.1413 0.0054
Mean incident frequency: 1975 to 31/10/2001
Installation/rig type
iii

Summary of mean incident frequencies of all reported incidents and moderate or severe damage category incidents (passing vessels)
All reported incidents/year Incidents resulting in moderate or severe damage/year
All installations 0.0014 0.0004
Fixed installations 0.0012 0.0002
Semi-submersibles 0.0000 0.0000
Jack-ups 0.0054 0.0018
Mean incident frequency: 1975 to 31/10/2001
Installation/rig type
Notwithstanding the figures quoted in the tables above, data interpretation should be carried out with caution as it is highly likely that some degree of under reporting of incidents has occurred. Primarily this is thought to be of those incidents where little or no damage resulted to the installation, however, it may also include more serious incidents to normally unattended installations.
As in the previous report (OTO 1999 080) the main database only includes actual collisions and does not include 'near misses'. However, in an attempt to gain a better understanding as to the scale and nature of 'near miss' events, this report (Appendices E, F and G) does include 'near miss' data from a variety of sources; and interprets the findings in Section 6. In recent work by the HSE, UKOOA and others the definition of 'near miss' has been agreed to be 'the approach by any vessel that caused any part of the Duty Holder's emergency response plan to be activated'. Though it has not been possible to strictly apply that definition to this data, an attempt has been made to interpret the data in the light of that definition. Using such an interpretation it was found that there were 14 such events. These ranged in severity from a precautionary mustering of personnel to an actual down manning of an installation.
Collision threat causation factors have been developed from the “primary cause” field in the database, though almost exclusively, this information comes from personnel on board the installation and may lack subjectivity. Nonetheless, the primary cause of the majority of incidents involving “attendant vessels” was linked to some form of control failure; either human or mechanical while watchkeeping failure was assessed as the primary cause in each “passing vessel” incident.
The most frequent ‘activity’ that attendant vessels were engaged on when a collision with an installation occurred was “cargo transfer”, although “approaching installation” also figured highly, perhaps also being the precursor to cargo operations.
Geographical location was found to have an effect on the likelihood of a “passing vessel” collision and it appears that installations in the Southern North Sea are at greater risk than those in other areas. This is perhaps understandable considering the traffic density in this area compared to the other relatively remote areas of the UKCS.
iv

Contents
1 Introduction 1
2 Compilation of Database 2
2.1 COLLISION INCIDENT DATABASE 22.2 CODING AND CATEGORIES 3
2.2.1 Information source & Other source confirms 32.2.2 Installation damage class 3
2.3 DATA ON OPERATING EXPERIENCE 4
3 Analysis of Historical Data 6
3.1 INTRODUCTION 63.2 VARIATION OF INCIDENT FREQUENCY WITH TIME 6
3.2.1 All installations 73.2.2 Fixed installations 163.2.3 Floating installations 22
3.2.3.1 Floating Production, Storage and Offloading andFloating Storage Units 29
3.2.4 Jack-ups 303.2.5 Summary of incident frequencies 36
3.3 OPERATING CIRCUMSTANCES 373.4 CAUSATION FACTORS 383.5 GEOGRAPHICAL DISTRIBUTION 39
4 Discussion 41
4.1 INCIDENT FREQUENCIES 414.2 DATA COMPLETENESS 414.3 PASSING VESSELS 414.4 PRIMARY CAUSE 42
5 Analysis of Platform Supply Vessel Fleet andCommercial Shipping Trends on the UKCS 43
5.1 INTRODUCTION 435.2 PLATFORM SUPPLY VESSELS 435.3 COMMERCIAL SHIPPING BETWEEN UKCS AND U.K. 485.4 EMERGENCY RESPONSE AND RESCUE VESSELS 49
v

6 ‘Near Miss’ Information 51
6.1 INTRODUCTION 516.2 ‘ORION’ USING KEYWORD “POS COLLISION OFF" 526.3 ‘ORION’ SZI SECTION AND OIR9A REPORTS 526.4 ERRVA WARNING OFF REPORTS 526.5 ANALYSIS OF ‘NEAR MISS’ DATA 536.6 ANALYSIS OF SZI AND ERRVA DATA 54
6.6.1 Number of reports 546.6.2 Number of ERRV reporting (ERRVA data only) 546.6.3 Number of serious warnings (ERRVA data only) 546.6.4 Reports by geographical location (combined data) 546.6.5 Type classification of threatening vessel (combined data) 556.6.6 Gross registered tonnage of threatening vessels (combined
data) 556.6.7 Radar range at first detection (ERRVA data only) 566.6.8 Radar range at first detection in prevailing sea condition
(ERRVA data only) 566.6.9 Range at closest point of approach (combined data) 576.6.10 Time of day of incident (combined data) 58
7 Conclusion 59
8 References 61
APPENDICES 63
Appendix A - Ship/Platform Collision Incident Database – Passing Vessels 64
Appendix A - Ship/Platform Collision Incident Database – Attendant Vessels 67
Appendix B - Commercial Shipping Between UKCS and U.K. 98
Appendix C - Commercial Cargo on Emergency Response and Rescue Vessels 101
Appendix D – ‘Near Miss’ Database 105
Appendix E – Safety Zone Infringement List 112
Appendix F – ERRVA Warning Off Reports 116
vi

Tables
Table 1: Operating experience for fixed installations and mobile units on the UKCS 5
Table 2: Damage resulting from incidents to all installations per year 7
Table 3: Incidents per year by all vessel types 8
Table 4: Incidents per month by vessel type 10
Table 5: Frequency of all reported incidents to all installations per year 12
Table 6: Frequency of moderate or severe damage to all installations per year13
Table 7: Mean and cumulative frequency of all reported incidents to all installations 14
Table 8: Damage resulting from incidents to fixed installations by year 16
Table 9: Frequency of all reported incidents to fixed installations per year 18
Table 10: Frequency of moderate or severe damage to fixed installations per year 19
Table 11: Mean and cumulative frequency of all reported incidents to fixed installations 20
Table 12: Damage resulting from incidents to floating installations by year 23
Table 13: Frequency of all reported incidents to floating installations per year 24
Table 14: Frequency of moderate or severe damage to floating installations per year 26
Table 15: Mean and cumulative frequency of all reported incidents to floating installations 27
Table 16: Damage resulting from incidents to jack-up installations by year 31
Table 17: Frequency of all reported incidents to jack-up installations per year 32
Table 18: Frequency of moderate or severe damage to jack-up installations per year 33
Table 19: Mean and cumulative frequency of all reported incidents to jack-up installations 34
Table 20: Summary of mean incident frequencies of all reported incidents and moderate or severe damage category incidents (all vessel types) 36
Table 21: Summary of mean incident frequencies of all reported incidents and moderate or severe damage category incidents (passing vessels) 36
Table 22: Operating circumstances at time of incident 37
Table 23: Primary cause factors 38
vii

Table 24: Geographical distribution of incidents 39
Table 25: ‘Near Miss’ Data Analysis 53
Figures
Figure 1:
Figure 2:
Figure 3:
Figure 4:
Figure 5:
Figure 6:
Figure 7:
Figure 8:
Figure 9:
Figure 10:
Figure 11:
Figure 12:
Figure 13:
Figure 14:
Figure 15:
Figure 16:
Figure 17:
Figure 18:
Figure 19:
Fixed installations and mobile rig utilisation 4
Damage resulting from incidents to all installations per year 8
Incidents per year by all vessel types 10
Incidents per month by vessel type 11
Frequency of all reported incidents to all installations per year 15
Frequency of moderate or severe damage to all installations per year 15
Mean and cumulative frequency of all reported incidents to all installations 15
Damage resulting from incidents to fixed installations per year 21
Frequency of all reported incidents to fixed installations per year 21
Frequency of moderate or severe damage to fixed installation per year 21
Mean and cumulative frequency of all reported incidents to fixed installations 22
Damage resulting from incidents to floating installations by year 24
Frequency of all reported incidents to floating installations per year 28
Frequency of moderate or severe damage to floating installations per year 28
Mean and cumulative frequency of all reported incidents to floating installations 28
Damage resulting from incidents to jack-up installations by year 30
Frequency of all reported incidents to jack-up installations per year 35
Frequency of moderate or severe damage to jack-up installations per year 35
Mean and cumulative frequency of all reported incidents to jack-up installations 35
viii

Figure 20: Geographical distribution of incidents 40
Figure 21: All offshore supply vessels average dimensions over time 45
Figure 22: UKCS offshore supply vessels average dimensions over time 45
Figure 23: All offshore supply vessels average tonnages over time 46
Figure 24: UKCS offshore supply vessels average tonnages over time 46
Figure 25: All offshore supply vessel flags over time 47
Figure 26: UKCS offshore supply vessel flags over time 47
Figure 27: Vessels carrying commercial cargo between U.K. ports and UKCS 49
Figure 28: ERRV carrying commercial cargo between U.K. ports and UKCS 50
Figure 29: Warning Off Reports by geographical location 54
Figure 30: Gross registered tonnage of threatening vessel 55
Figure 31: Radar range at first detection 56
Figure 32: Radar range at first detection in prevailing sea condition 57
Figure 33: Range at closest point of approach 57
Figure 34: Time of day of incidents 58
ix

x

1 Introduction
A database of vessel/platform collision incidents on the United Kingdom Continental Shelf (UKCS) was originally created for the Health & Safety Executive, Offshore Safety Division (OSD) in 1985. It has subsequently been amended and extended on several occasions, in 1995 (MaTR0321) when it also underwent rigorous qualitative checking and most recently in 1997 (MaTR0447) when it was updated with incidents in intervening years.
MaTSU were requested by OSD to update the previous data evaluation exercise contained in MaTR0447 and also to search through various data sources to extend the database to include incidents which have occurred since the last review. The compilation of the database is described in more detail in Section 2 of this report.
Information has been extracted from the database to establish the variation of incident frequency with time for different types of offshore oil and gas installations and for different vessel types. The resulting analysis of incident statistics is necessarily broad, in line with the likely accuracy of the data, and is presented in Section 3 of this report.
An assessment of the implications of the results of analysis is presented in Section 4.
At OSD’s request an analysis of the world fleet of platform support vessels (PSV) was carried out. The data used for this exercise came from information held by the Maritime Statistics Collection Agency, an organisation administered by the Department of Transport, Local Government and the Regions (DTLR) to collect information on the quantity and nature of commercial cargo passing through the UK’s major ports. Using this information it was possible to:
• Quantify the number, size and type of vessels that have carried cargo between the UK’s major ports and the UKCS and hence develop a guideline measure of vessels that transit UKCS oil fields as part of their normal activities;
• Develop an understanding of the way in which PSV dimensions and tonnages have changed in recent years;
• Identify the extent to which stand-by vessels (SBV) have been utilised for carrying cargo to/from offshore installations on the UKCS.
The results of these analyses are presented in Section 5.
The database only contains details of collision incidents that have actually occurred. There exists a separate record of incidents which, although not resulting in actual contact between vessel and installation, resulted in a so called “near miss”. This is discussed further in Section 6.
The conclusions to the report are contained in Section 7.
1

2 Compilation of Database
2.1 COLLISION INCIDENT DATABASE
For this study an incident has been defined as a reported impact in terms of the OIR/9A incident report, between a vessel and a fixed or mobile installation (jack-up or semisubmersible).
The original 1985 collision incident database was compiled from studies performed by the National Maritime Institute Ltd. (NMI) (Refs. 1 and 2) and the International Association of Drilling Contractors (IADC) (Ref. 3). An update in 1991 by Advanced Mechanics and Engineering Limited (AME) (Ref. 4) used incident records taken from OSD’s OIR/9A files.
The Collision Incident Database produced under MaTSU reports MaTR0321 (1995) and MaTR0447 (1997) (Refs. 5 and 6) have been extended and further cross-checked. The complete database is included as Appendix A to this report wherein a total of 557 incidents of vessels contacting offshore oil and gas installations have been recorded in the period from 1 January 1975 to 31 October 2001. These data have been developed from a number of sources; the prime source being that recorded in the “Information Source” field. Where data have been supplemented or confirmed from an independent source this have been recorded in the “Other Source Confirms” field. Collision incidents confirmed (in part or whole) or added in the current study have been extracted from the following sources:
• Marine Accident Investigation Branch (MAIB) using the search criteria “offshore installations - collisions and contacts” - (Ref. 7).
• ‘Orion’ Safety System of the OSD using search criteria “collision”, “ impact”, “contact”, “collide”, “hit”, “landed”- (Ref. 8).
• World Offshore Accident Database (WOAD) using search criteria “collision”, “contact” - (Ref. 9).
Despite the large literature search a number of inconsistencies and unconfirmed data have been highlighted within the database. A series of asterisk (**) adjacent to an entry indicate the following areas of concern:
*** Rig Registration No. could not be confirmed from information provided by OSD.
**** Vessel name, type or gross tonnage could not be confirmed by Anchor Handling Tugs and Supply Vessels of the World (Ref. 10), Stand-by Vessels of the World (Ref. 11) or Lloyd’s Maritime Directory 1986 (Ref. 12).
***** In the author’s opinion text entries appear to be incomplete, erroneous or inconsistent but due to the lack of other data sources have been retained.
The database contained in Appendix A has been compiled according to the following sort criteria:
2

First: “Passing Vessel” (vessels which should not have contravened the safety zone) and “Attendant Vessel” (vessels working in the vicinity of the installation) categories.
Second: Severity of “Installation Damage Class”, severe, moderate, minor, none, unspecified, not applicable.
Third: Date of incident.
2.2 CODING AND CATEGORIES
For clarity and ease of interpretation the use of codes within the fields has been kept to a minimum.
2.2.1 Information source & Other source confirms • DEn Data extracted from Draft Report MaTR0141 - (Ref. 13); • OTN 92 235 Data extracted from OTN 92 235 - (Ref. 14). • LMIS Data supplied to MaTSU by Lloyds Maritime Information Service –
(Ref. 15); • NMI National Maritime Institute Ltd. - (Ref. 1, 2); • HSE Data supplied by OSD - (Ref. 16); • BOMEL Data extracted from Billington Osborne-Moss Engineering Limited –
Drawing No. C/587/R002.22 - (Ref. 17); • MAIB Data supplied to MaTSU by Marine Accident Investigation Branch –
(Ref. 7); • WOAD World Offshore Accident Database - (Ref. 9).
2.2.2 Installation damage class In order to permit more meaningful evaluation of the database all incidents have been placed into a damage severity category, labelled “Installation Damage Class”, in accordance with the following criteria. In some instances, where the damage class was not originally reported or was clearly inaccurate, the category has been assigned by the author based on the extent of reported damage and the criticality of the member involved:
Severe: Damage affecting the integrity of an installation sufficient to require repair in the immediate or short term (up to 1 month). Where the actual date of repair could not be determined then the criticality of the damage damaged member was considered where this was available. In the absence of other repair information damage to non redundant members was considered severe;
Moderate: Damage requiring repair in the medium (up to 6 months) or longer term (over 6 months);
Minor: Damage not affecting the integrity of the installation;None: No damage occurred;Unspecified: Damage believed to have occurred but was not specified in reports;Not Applic.: Report of incident which was not applicable to installation’s structure.
3

2.3 DATA ON OPERATING EXPERIENCE
For the purposes of this study an installation is defined as a fixed platform or group of platforms linked by bridges or walkways and may be of either steel or concrete construction. Operating experience of fixed installations is presented in “installation years” rather than platform years because in the southern North Sea a supply vessel, for example, is only likely to approach those platforms installed with a crane or living quarters when carrying cargo. In these circumstances it would be unrealistic to include every individual platform in the count of operating experience as not all will be visited by vessels.
Operating experience of fixed structures has been determined using information provided by OSD. This contained the ‘start-up’ date and ‘abandonment’ date, where appropriate.
Mobile rig operating experience on the United Kingdom Continental Shelf (UKCS) has been determined from information provided by Rigzone (Ref. 18) and refers to any jackup, semi-submersible or variant. The operating experience of semi-submersible or monohull production facilities and floating storage units (as supplied by OSD) has been added to the monthly figure to determine the total experience of this type of unit.
A summary of operating experience for fixed installations/complex and mobile units over the period of study is contained in Table 1 (overleaf) and represented graphically in Figure 1.
0
50
100
150
200
250
300
1988 2001
Y e a r
Num
ber
of
inst
alla
tion
s
Jack -up
Semi-submersible
F ixed
1975 1976 1977 1978 1979 1980 1981 1982 1983 1984 1985 1986 1987 1989 1990 1991 1992 1993 1994 1995 1996 1997 1998 1999 2000
Figure 1: Fixed installations and mobile rig utilisation
4

Table 1: Operating experience for fixed installations and mobile units on the UKCS
Mean installations operating in year Operating experience: date of installation to year end (installation years)
Year Jack-up Semisubmersible Fixed TOTAL Jack-up Semi
submersible Fixed TOTAL
1975 26.4 60.5 88.8 1.9 26.4 60.5 88.8
1976 19.6 70.5 92.6 4.4 46.0 131.0 181.4
1977 22.8 77.3 102.0 6.3 68.8 208.4 283.5
1978 17.6 84.3 103.3 7.7 86.4 292.7 386.8
1979 15.5 89.4 106.5 101.9 382.1 493.3
1980 19.9 91.2 113.2 11.4 121.8 473.3 606.5
1981 23.7 93.6 120.7 14.8 145.5 566.9 727.2
1982 28.0 99.9 132.4 19.3 173.5 666.8 859.6
1983 29.7 104.3 142.2 27.5 203.2 771.1 1001.8
1984 16.2 35.9 112.6 164.7 43.7 239.1 883.7 1166.5
1985 18.3 38.0 120.7 177.0 62.0 277.1 1004.4 1343.5
1986 14.7 26.6 127.3 168.6 76.7 303.7 1131.7 1512.1
1987 13.9 24.0 136.3 174.2 90.6 327.7 1268.0 1686.3
1988 20.2 32.0 142.5 194.7 110.8 359.7 1410.5 1881.0
1989 23.0 31.9 155.3 210.2 133.8 391.6 1565.8 2091.2
1990 48.4 52.8 160.4 261.5 182.2 444.4 1726.2 2352.8
1991 43.3 57.4 180.3 281.1 225.6 501.8 1906.5 2633.8
1992 42.3 44.3 185.3 271.9 267.8 546.1 2091.9 2905.8
1993 36.6 40.3 193.5 270.4 304.4 586.4 2285.4 3176.1
1994 33.4 30.1 212.5 276.0 337.8 616.4 2497.9 3452.1
1995 32.8 34.9 221.3 289.0 370.6 651.4 2719.1 3741.1
1996 33.5 43.3 225.5 302.4 404.1 694.7 2944.7 4043.5
1997 37.6 44.9 234.5 317.0 441.7 739.6 3179.1 4360.4
1998 36.8 46.3 241.4 324.6 478.6 785.9 3420.5 4685.0
1999 29.9 35.4 253.6 318.9 508.5 821.4 3674.2 5004.0
2000 29.4 34.5 261.5 325.4 537.9 855.9 3935.6 5329.4 2001 32.0 40.0 267.8 339.8 559.2 882.6 4203.5 5645.3
Pro rata to 31/10/01
1.9
2.5
1.9
1.4
1.6 9.3
2.1
3.4
4.5
8.2
5

3 Analysis of Historical Data
3.1 INTRODUCTION
This Section presents an analysis of collision incident statistics for the UKCS in the period from 1 January 1975 to 31 October 2001. For statistical analysis purposes a total incident population of 557 has been used throughout. When determining incident frequencies for 2001 installation operating experience has been prorated to 31 October of that year.
Data were analysed for all reported incidents and separately for those classified as moderate or severe, to investigate any trends which might exist. While it is reasonable to anticipate that not all minor incidents would be reported, it is believed that most, if not all, incidents resulting in moderate or severe installation damage should have been. Thus, there should be increased confidence in the observed trends in the more serious incidents. Additionally, incidents resulting in moderate or severe damage are more likely to exceed normal operational loading and are therefore of greater interest in comparing design against accidental damage.
The main areas covered in this Section are:
• Variation of incident frequency and confidence limits with time for different damage categories and types of installations;
• Variation of incident numbers with time for different types of vessels.
Where possible tables, graphs or histograms have been used to illustrate the various aspects of collision incidents that have occurred.
As in other studies (Refs. 19 and 20) it has been assumed that the incident likelihood follows a Poisson distribution. With this assumption 5% and 95% confidence limits for fixed installations and mobile rigs have been calculated and are shown in Figures 5, 6, 9, 10, 13, 14, 17 and 18. The interval between the limits reflects the number of incidents and causes the line connecting the upper and lower confidence limit to be longer where there are fewer incidents. 5% and 95% confidence limits have been calculated using accepted methodology (note Refs. 19 and 20) including those occasions where no collision incidents have been reported.
3.2 VARIATION OF INCIDENT FREQUENCY WITH TIME
The variation of incident frequency with time for fixed installations and mobile units have been analysed both together and separately. Incident frequencies for all reported incidents and those categorised as resulting in moderate or severe damage have also been analysed separately.
6

3.2.1 All installations Table 2 and Figure 2 summarise the number and damage category of all recorded incidents to fixed installations and mobile units, by year, since 1975. Seventeen incidents were classed as severe, 69 incidents as moderate and the remainder classed under minor or no damage, including 55 incidents where the damage was not specified but is believed to be minor or none.
Table 2: Damage resulting from incidents to all installations per year
Installation damage class
Year None Minor Moderate Severe Unspecified Not Applicable TOTAL
1975 0 6 4 1 0 0 11
1976 2 2 0 0 0 16
1977 0 7 2 0 0 22
1978 1 7 0 0 0 20
1979 5 6 0 1 0 31
1980 4 9 4 1 0 31
1981 6 3 1 1 0 38
1982 8 7 0 0 0 29
1983 8 3 1 0 0 28
1984 4 9 5 0 1 0 19
1985 4 1 4 2 0 22
1986 5 9 4 0 1 0 19
1987 1 6 0 0 1 0 8
1988 2 7 0 1 0 0 10
1989 2 1 0 1 0 22
1990 5 3 1 1 1 30
1991 6 2 1 3 0 27
1992 5 2 1 3 0 39
1993 5 1 0 2 0 22
1994 6 0 0 5 0 21
1995 4 4 0 0 6 0 14
1996 2 6 1 0 1 0 10
1997 1 9 1 0 7 0 18
1998 0 7 0 0 10 0 17
1999 5 7 0 0 3 0 15
2000 1 8 0 0 3 0 12
2001 1 3 0 0 2 0 6
TOTAL 1
16.7% 57.8% 12.4% 3.1% 9.9% 0.2% 100%
12
13
12
19
13
27
14
16
11
18
19
15
28
14
10
93 322 69 17 55 557
To 31 October 2001
7

Figure 2: Damage resulting from incidents to all installations per year
0
5
10
15
20
25
30
35
40
45
1975 1976 1977 1978 1979 1980 1981 1982 1983 1984 1985 1986 1987 1988 1989 1990 1991 1992 1993 1994 1995 1996 1997 1998 1999 2000 2001
Year o f inc idents
Num
ber
of
inci
den
ts
Not Applicable
Unspecif ied
S e v e r e
Moderate
Minor
None
A summary and chart of impact vessel types is produced as Table 3 and Figure 3. This indicates that the vast majority of incidents, as would be expected, have occurred with attendant vessels. Of the attendant vessels, 353 incidents were with “Supply Vessels”, 87 were “Stand-By Vessels” with the remaining being either “Unspecified”, with 35 incidents or “Other Attendant Vessels”, 74 incidents. The latter category comprising the following vessel types:
• Anchor handler 18 incidents • Barge (pushed by tug) 1 incident • Diver support 36 incidents • Maintenance 1 incident • Merchant tanker (approaching/at loading terminal) 9 incidents • Research 3 incidents • Survey 2 incidents • Tug 4 incidents
Table 3: Incidents per year by all vessel types
Collision vessel type
Year Supply vessels Stand-by vessels
Other attendant Passing vessels Unspecified
vessels TOTAL
1975 7 0 0 0 4 11
1976 13 1 2 0 0 16
1977 12 3 3 0 4 22
1978 19 0 0 0 1 20
1979 16 7 7 0 1 31
1980 20 0 4 0 7 31
8

Table 3: (continued) Collision vessel type
Year Supply vessels Stand-by vessels
Other attendant Passing vessels Unspecified
vessels TOTAL
1981 4 4 1 3 38
1982 4 2 0 2 29
1983 1 5 1 1 28
1984 2 5 2 0 19
1985 9 5 6 1 1 22
1986 1 2 0 4 19
1987 4 4 0 0 0 8
1988 5 2 1 2 0 10
1989 7 3 0 0 22
1990 1 0 1 30
1991 4 2 0 0 27
1992 7 3 0 0 39
1993 4 2 0 0 22
1994 5 3 0 0 21
1995 6 2 5 1 0 14
1996 7 1 1 0 1 10
1997 7 4 3 0 4 18
1998 1 5 0 1 17
1999 2 1 0 0 15
2000 8 1 3 0 0 12
2001 1 4 1 0 0 6
TOTAL 87 74 8
63.4% 15.6% 13.3% 1.4% 6.3% 100%
26
21
20
10
12
12
17 11
21
29
16
13
10
12
353 35 557
To 31 October 2001
In view of the potentially catastrophic consequences of a ‘passing vessel’ collision on the integrity of an installation, details of the 8 incidents where this has occurred have been separated from the ‘attendant vessels’ incidents in the database presented in Appendix A. The sort criteria of the database in Appendix A are outlined in more detail in Section 2.1 of this report.
9

0
5
10
15
20
25
30
35
40
45
Year o f inc idents
Num
ber
of
inci
den
ts
Unspeci f ied vessels
Pass ing vesse ls
Stand-by vesse ls
Supply vesse ls
1975 1976 1977 1978 1979 1980 1981 1982 1983 1984 1985 1986 1987 1988 1989 1990 1991 1992 1993 1994 1995 1996 1997 1998 1999 2000 2001
O ther attendant
Figure 3: Incidents per year by all vessel types
Table 4 and Figure 4 summarise the trend for incidents occurring with respect to month for all different vessel types. Despite several slight anomalies, possibly caused by the small number of data for some vessel categories, broadly speaking more incidents have occurred during the period October to February. For supply vessels engaged in cargo transfer this is perhaps understandable when weather conditions are more likely to be adverse with high winds and storms. Conversely, in the months normally associated with better weather (July to September) the incidence of stand-by vessel collision has increased, possibly caused by more installation overside work being carried out and the need for close support. The months between May and October also see an increase in the number of incidents involving diver support vessels when annual inspections and repairs to installations tend to take place.
Table 4: Incidents per month by vessel type
Collision vessel type
Month Supply vessels
Stand-by vessels
Other attendant
Passing vessels
Unspecified vessels TOTAL
January 43 9 5 1 2 60 10.8%
February 41 3 5 1 1 51 9.4%
March 29 6 2 1 1 39 7.0%
April 7 7 0 0 39 7.0%
May 29 7 0 0 47 8.4%
June 17 3 2 2 1 25 4.5%
25
11
10

Table 4: (continued)
Collision vessel type
Month Supply vessels
Stand-by vessels
Other attendant
Passing vessels
Unspecified vessels TOTAL
July 21 11 12 2 0 46 8.3%
August 26 7 3 1 0 37 6.6%
September 25 12 9 0 0 46 8.3%
October 32 8 7 0 1 48 8.6%
November 27 8 6 0 0 41 7.4%
December 36 3 4 0 1 44 7.9%
Unspecified 2 3 1 0 28 34 6.1%
TOTAL 353 87 74 8 557 100%
63.4% 13.3% 1.4% 6.3%
35
15.6% To 31 October 2001
0
10
20
30
40
50
60
70
January March July September November Unspecified
Month of inc idents
Num
ber
of
inci
den
ts
Unspeci f ied vesse ls
Pass ing vesse ls
S tand -by vesse l s
May
O ther attendant
Supply v e s s e ls
Figure 4: Incidents per month by vessel type
Tables 5 and 6 respectively, show the mean frequency and confidence limits of all reported incidents and those categorised as resulting in moderate or severe damage occurring to all installations by year. Table 7 summarises the mean frequency in the year in question and also cumulatively to any year end from 1975. Figures 5, 6 and 7 graphically represent the variation in the results summarised in these tables.
11

Table 5: Frequency of all reported incidents to all installations per year
Number of incidents
Mean installations Incident frequency (per installation per year)
Year in year (r) operating in year
(T) 5% confidence
limit Mean = (r/T) 95% confidence limit
1975 88.8 0.20 0.12 0.07
1976 92.6 0.26 0.17 0.11
1977 102.0 0.31 0.22 0.15
1978 103.3 0.28 0.19 0.13
1979 106.5 0.39 0.29 0.21
1980 113.2 0.37 0.27 0.20
1981 120.7 0.41 0.31 0.24
1982 132.4 0.30 0.22 0.16
1983 142.2 0.27 0.20 0.14
1984 164.7 0.17 0.12 0.08
1985 177.0 0.18 0.12 0.08
1986 168.6 0.17 0.11 0.07
1987 8 174.2 0.08 0.05 0.02
1988 194.7 0.09 0.05 0.03
1989 210.2 0.15 0.10 0.07
1990 261.5 0.16 0.11 0.08
1991 281.1 0.13 0.10 0.07
1992 271.9 0.19 0.14 0.11
1993 270.4 0.12 0.08 0.06
1994 276.0 0.11 0.08 0.05
1995 289.0 0.08 0.05 0.03
1996 302.4 0.06 0.03 0.02
1997 317.0 0.08 0.06 0.04
1998 324.6 0.08 0.05 0.03
1999 318.9 0.07 0.05 0.03
2000 325.4 0.06 0.04 0.02
2001 6 339.8 0.03 0.02 0.01
11
16
22
20
31
31
38
29
28
19
22
19
10
22
30
27
39
22
21
14
10
18
17
15
12
To 31 October 2001
12

Table 6: Frequency of moderate or severe damage to all installations per year
Number of incidents
Mean installations Incident frequency (per installation per year)
Year in year (r) operating in year
(T) 5% confidence
limit Mean = (r/T) 95% confidence limit
1975 5 88.8 0.12 0.06 0.02
1976 2 92.6 0.07 0.02 0.00
1977 9 102.0 0.15 0.09 0.05
1978 7 103.3 0.13 0.07 0.03
1979 6 106.5 0.11 0.06 0.02
1980 13 113.2 0.18 0.11 0.07
1981 4 120.7 0.08 0.03 0.01
1982 7 132.4 0.10 0.05 0.02
1983 4 142.2 0.06 0.03 0.01
1984 5 164.7 0.06 0.03 0.01
1985 5 177.0 0.06 0.03 0.01
1986 4 168.6 0.05 0.02 0.01
1987 0 174.2 0.02 0.00 #N/A
1988 1 194.7 0.02 0.01 0.00
1989 1 210.2 0.02 0.00 0.00
1990 4 261.5 0.04 0.02 0.01
1991 3 281.1 0.03 0.01 0.00
1992 3 271.9 0.03 0.01 0.00
1993 1 270.4 0.02 0.00 0.00
1994 0 276.0 0.01 0.00 #N/A
1995 0 289.0 0.01 0.00 #N/A
1996 1 302.4 0.02 0.00 0.00
1997 1 317.0 0.01 0.00 0.00
1998 0 324.6 0.01 0.00 #N/A
1999 0 318.9 0.01 0.00 #N/A
2000 0 325.4 0.01 0.00 #N/A
2001 0 339.8 0.01 0.00 #N/A
To 31 October 2001
13

Table 7: Mean and cumulative frequency of all reported incidents to all installations
Year Number of
incidents in year (r)
Cumulative number of
incidents (r1)
Mean installations
operating in year (T)
Cumulative operating
experience (T1)
Incident frequency ( = r/T)
Cumulative incident
frequency (= r1/T1)
1975 11 11 88.8 88.8 0.12 0.12
1976 16 27 92.6 181.4 0.17 0.15
1977 22 49 102.0 283.5 0.22 0.17
1978 20 69 103.3 386.8 0.19 0.18
1979 31 100 106.5 493.3 0.29 0.20
1980 31 131 113.2 606.5 0.27 0.22
1981 38 169 120.7 727.2 0.31 0.23
1982 29 198 132.4 859.6 0.22 0.23
1983 28 226 142.2 1001.8 0.20 0.23
1984 19 245 164.7 1166.5 0.12 0.21
1985 22 267 177.0 1343.5 0.12 0.20
1986 19 286 168.6 1512.1 0.11 0.19
1987 8 294 174.2 1686.3 0.05 0.17
1988 10 304 194.7 1881.0 0.05 0.16
1989 22 326 210.2 2091.2 0.10 0.16
1990 30 356 261.5 2352.8 0.11 0.15
1991 27 383 281.1 2633.8 0.10 0.15
1992 39 422 271.9 2905.8 0.14 0.15
1993 22 444 270.4 3176.1 0.08 0.14
1994 21 465 276.0 3452.1 0.08 0.13
1995 14 479 289.0 3741.1 0.05 0.13
1996 10 489 302.4 4043.5 0.03 0.12
1997 18 507 317.0 4360.4 0.06 0.12
1998 17 524 324.6 4685.0 0.05 0.11
1999 15 539 318.9 5004.0 0.05 0.11
2000 12 551 325.4 5329.4 0.04 0.10
2001 6 557 339.8 5645.3 0.02 0.10
To 31 October 2001
14

Figure 5: Frequency of all reported incidents to all installations per year
0.00
0.05
0.10
0.15
0.20
0.25
0.30
0.35
0.40
0.45
1975 1976 1977 1978 1979 1980 1981 1982 1983 1984 1985 1986 1987 1988 1989 1990 1991 1992 1993 1994 1995 1996 1997 1998 1999 2000 2001
Year of incident
Inci
den
t fr
eque
ncy
Mean = ( r /T )
9 5 % c o n f i d e n c e l i m i t
5 % c o n f i d e n c e l i m i t
Figure 6: Frequency of moderate or severe damage to all installations per year
0.00
0.02
0.04
0.06
0.08
0.10
0.12
0.14
0.16
0.18
0.20
1975 1976 1977 1978 1979 1980 1981 1982 1983 1984 1985 1986 1987 1988 1989 1990 1991 1992 1993 1994 1995 1996 1997 1998 1999 2000 2001
Year of incident
Inci
den
t fr
eque
ncy
Mean = ( r /T )
9 5 % c o n f i d e n c e l i m i t
5 % c o n f i d e n c e l i m i t
Figure 7: Mean and cumulative frequency of all reported incidents to all installations
0.00
0.05
0.10
0.15
0.20
0.25
0.30
0.35
1975 1976 1977 1978 1979 1980 1981 1982 1983 1984 1985 1986 1987 1988 1989 1990 1991 1992 1993 1994 1995 1996 1997 1998 1999 2000 2001
Year o f i nc iden ts
Inci
den
t fr
eque
ncy
Cumulative incident frequency (= r1/T1)
Incident frequency ( = r/T)
15

There is a large spread in the annual incident frequency but generally the number of reported incidents tends to increase to a peak in 1981 before declining quite rapidly to a minimum in 1987. A second, lesser, peak occurred in 1992 before declining again. The rise in the mean incident frequency in 1992 can almost entirely be accounted for by the rise in the number of reported incidents involving semi-submersibles, and to a lesser extent jack-ups. This is broadly in line with the increase in mobile rig utilisation during this period with its attendant collision risks, for example when anchor handling.
Though the average, all incident frequency, has fluctuated considerably over the period of study the probability is on average 0.099 per year. Using the total operating experience this equates to 1 incident every 10.14 installation years or approximately 33 per annum for the current year level of installation activity. The analysis for reported incidents resulting in damage categorised as moderate or severe indicates the probability is on average 0.015 per year (1 incident every 65.64 years or approximately 5 every year for the current level of installation activity). These statistics are clearly at odds with the actual number of recorded incidents in recent years and highlight the general improvements made in support vessel operating practices.
3.2.2 Fixed installations To provide a more meaningful statistical base, especially for installation types with smaller populations, the following types of installation have been included in this category. A total of 268 incidents were recorded where the installation type was stated to be in this category, or could be determined to be, with the following breakdown:
• Fixed steel installation 243 incidents • Fixed concrete installation 20 incidents • Tension leg platform 2 incidents • Unspecified installation type 3 incidents
Table 8 and Figure 8 summarise the number and damage category of all incidents occurring to fixed installations. Eight incidents were classed as severe, 32 incidents as moderate and the remainder classed under minor or no damage, including 22 incidents where the damage was not specified but is believed to be minor or none.
Table 8: Damage resulting from incidents to fixed installations by year
Installation damage class
Year None Minor Moderate Severe Unspecified Not Applicable TOTAL
1975 0 1 3 1 0 0 5
1976 2 1 1 0 0 0 4
1977 0 7 4 1 0 0 12
1978 0 1 3 0 0 0 4
1979 4 2 0 0 0 16
1980 1 9 6 2 1 0 19
10
16

Table 8: (continued) Installation damage class
Year None Minor Moderate Severe Unspecified Not Applicable TOTAL
1981 3 2 0 1 0 27
1982 3 6 0 0 0 19
1983 4 8 1 1 0 0 14
1984 0 5 0 0 1 0 6
1985 3 9 0 2 1 0 15
1986 5 8 2 0 0 0 15
1987 0 5 0 0 0 0 5
1988 0 1 0 0 0 0 1
1989 1 8 0 0 0 0 9
1990 2 2 0 0 0 16
1991 1 4 0 1 1 0 7
1992 1 9 0 0 2 0 12
1993 1 4 0 0 1 0 6
1994 1 8 0 0 1 0 10
1995 3 1 0 0 5 0 9
1996 2 5 0 0 1 0 8
1997 1 3 0 0 3 0 7
1998 0 2 0 0 2 0 4
1999 3 3 0 0 1 0 7
2000 1 6 0 0 1 0 8
2001 1 2 0 0 0 0 3
TOTAL 163 8 0 268
16.0% 60.8% 11.9% 3.0% 8.2% 0.0% 100%
21
10
12
43 32 22
To 31 October 2001
Tables 9 and 10 show respectively, the mean frequency and confidence limits of all reported incidents and those categorised as resulting in moderate or severe damage occurring to fixed installations by year. Table 11 summarises the mean frequency in the year in question and also cumulatively to any year end from 1975. Figures 9, 10 and 11 graphically represent the variation in the results summarised in these tables.
17

Table 9: Frequency of all reported incidents to fixed installations per year
Number of incidents
Mean installations Incident frequency (per installation per year)
Year in year (r) operating in year
(T) 5% confidence
limit Mean = (r/T) 95% confidence limit
1975 5 60.5 0.17 0.08 0.03
1976 4 70.5 0.13 0.06 0.02
1977 12 77.3 0.25 0.16 0.09
1978 4 84.3 0.11 0.05 0.02
1979 16 89.4 0.27 0.18 0.11
1980 19 91.2 0.31 0.21 0.14
1981 27 93.6 0.40 0.29 0.20
1982 19 99.9 0.28 0.19 0.12
1983 14 104.3 0.21 0.13 0.08
1984 6 112.6 0.11 0.05 0.02
1985 15 120.7 0.19 0.12 0.08
1986 15 127.3 0.18 0.12 0.07
1987 5 136.3 0.08 0.04 0.01
1988 1 142.5 0.03 0.01 0.00
1989 9 155.3 0.10 0.06 0.03
1990 16 160.4 0.15 0.10 0.06
1991 7 180.3 0.07 0.04 0.02
1992 12 185.3 0.10 0.06 0.04
1993 6 193.5 0.06 0.03 0.01
1994 10 212.5 0.08 0.05 0.03
1995 9 221.3 0.07 0.04 0.02
1996 8 225.5 0.06 0.04 0.02
1997 7 234.5 0.06 0.03 0.01
1998 4 241.4 0.04 0.02 0.01
1999 7 253.6 0.05 0.03 0.01
2000 8 261.5 0.06 0.03 0.02
2001 3 267.8 0.03 0.01 0.00
To 31 October 2001
18

Table 10: Frequency of moderate or severe damage to fixed installations per year
Number of incidents
Mean installations Incident frequency (per installation per year)
Year in year (r) operating in year
(T) 5% confidence
limit Mean = (r/T) 95% confidence limit
1975 4 60.5 0.15 0.07 0.02
1976 1 70.5 0.07 0.01 0.00
1977 5 77.3 0.14 0.06 0.03
1978 3 84.3 0.09 0.04 0.01
1979 2 89.4 0.07 0.02 0.00
1980 8 91.2 0.16 0.09 0.04
1981 2 93.6 0.07 0.02 0.00
1982 6 99.9 0.12 0.06 0.03
1983 2 104.3 0.06 0.02 0.00
1984 0 112.6 0.03 0.00 #N/A
1985 2 120.7 0.05 0.02 0.00
1986 2 127.3 0.05 0.02 0.00
1987 0 136.3 0.02 0.00 #N/A
1988 0 142.5 0.02 0.00 #N/A
1989 0 155.3 0.02 0.00 #N/A
1990 2 160.4 0.04 0.01 0.00
1991 1 180.3 0.03 0.01 0.00
1992 0 185.3 0.02 0.00 #N/A
1993 0 193.5 0.02 0.00 #N/A
1994 0 212.5 0.01 0.00 #N/A
1995 0 221.3 0.01 0.00 #N/A
1996 0 225.5 0.01 0.00 #N/A
1997 0 234.5 0.01 0.00 #N/A
1998 0 241.4 0.01 0.00 #N/A
1999 0 253.6 0.01 0.00 #N/A
2000 0 261.5 0.01 0.00 #N/A
2001 0 267.8 0.01 0.00 #N/A
To 31 October 2001
19

Table 11: Mean and cumulative frequency of all reported incidents to fixed installations
Year Number of incidents in
year (r)
Cumulative number of
incidents (r1)
Mean installations operating in
year (T)
Cumulative operating
experience (T1)
Incident frequency ( = r/T)
Cumulative incident
frequency (= r1/T1)
1975 5 5 60.5 60.5 0.08 0.08
1976 4 9 70.5 131.0 0.06 0.07
1977 12 21 77.3 208.4 0.16 0.10
1978 4 25 84.3 292.7 0.05 0.09
1979 16 41 89.4 382.1 0.18 0.11
1980 19 60 91.2 473.3 0.21 0.13
1981 27 87 93.6 566.9 0.29 0.15
1982 19 106 99.9 666.8 0.19 0.16
1983 14 120 104.3 771.1 0.13 0.16
1984 6 126 112.6 883.7 0.05 0.14
1985 15 141 120.7 1004.4 0.12 0.14
1986 15 156 127.3 1131.7 0.12 0.14
1987 5 161 136.3 1268.0 0.04 0.13
1988 1 162 142.5 1410.5 0.01 0.11
1989 9 171 155.3 1565.8 0.06 0.11
1990 16 187 160.4 1726.2 0.10 0.11
1991 7 194 180.3 1906.5 0.04 0.10
1992 12 206 185.3 2091.9 0.06 0.10
1993 6 212 193.5 2285.4 0.03 0.09
1994 10 222 212.5 2497.9 0.05 0.09
1995 9 231 221.3 2719.1 0.04 0.08
1996 8 239 225.5 2944.7 0.04 0.08
1997 7 246 234.5 3179.1 0.03 0.08
1998 4 250 241.4 3420.5 0.02 0.07
1999 7 257 253.6 3674.2 0.03 0.07
2000 8 265 261.5 3935.6 0.03 0.07
2001 3 268 267.8 4203.5 0.01 0.06
To 31 October 2001
20

Figure 8: Damage resulting from incidents to fixed installations per year
0
5
10
15
20
25
30
1975 1976 1977 1978 1979 1980 1981 1982 1983 1984 1985 1986 1987 1988 1989 1990 1991 1992 1993 1994 1995 1996 1997 1998 1999 2000 2001
Year o f i nc iden ts
Num
ber
of
inci
den
ts
Not Applicable
Unspecif ied
S e v e r e
Moderate
Minor
None
Figure 9: Frequency of all reported incidents to fixed installations per year
0.00
0.05
0.10
0.15
0.20
0.25
0.30
0.35
0.40
0.45
1975 1976 1977 1978 1979 1980 1981 1982 1983 1984 1985 1986 1987 1988 1989 1990 1991 1992 1993 1994 1995 1996 1997 1998 1999 2000 2001
Year of incident
Inci
den
t fr
eque
ncy
Mean = ( r /T )
9 5 % c o n f i d e n c e l i m i t
5 % c o n f i d e n c e l i m i t
Figure 10: Frequency of moderate or severe damage to fixed installation per year
21
0.00
0.02
0.04
0.06
0.08
0.10
0.12
0.14
0.16
0.18
1975 1976 1977 1978 1979 1980 1981 1982 1983 1984 1985 1986 1987 1988 1989 1990 1991 1992 1993 1994 1995 1996 1997 1998 1999 2000 2001
Year of incident
Inci
den
t fr
eque
ncy
Mean = ( r /T )
9 5 % c o n f i d e n c e l i m i t
5 % c o n f i d e n c e l i m i t

Figure 11: Mean and cumulative frequency of all reported incidents to fixed installations
0.00
0.05
0.10
0.15
0.20
0.25
0.30
0.35
1975 1976 1977 1978 1979 1980 1981 1982 1983 1984 1985 1986 1987 1988 1989 1990 1991 1992 1993 1994 1995 1996 1997 1998 1999 2000 2001
Year o f i nc iden ts
Inci
den
t fr
eque
ncy
Cumulative incident frequency (= r1/T1)
Incident frequency ( = r/T)
Apart from 1978, in the early years of the study the mean incident frequency rose dramatically until 1981. Subsequent to this the incident frequency rose and fell over a relatively narrow range caused by an erratic number of incidents occurring each year and, prior to 1994, a reasonably consistent increase in the number of installations operating.
Over the whole period of study the probability of an incident occurring is on average 0.064 per year (1 incident every 15.68 years or approximately 17every year for the current level of installation activity). The analysis for reported incidents resulting in damage categorised as moderate or severe indicates the probability is on average 0.009 per year (1 incident every 105.09 years or approximately 2.5 every year for the current level of installation activity). Recent experience indicates that these figures are an exaggeration of the actual number and are probably skewed by the larger incident frequencies in the early years of study adversely affecting the figure for the current level of activity.
3.2.3 Floating installations Once again for statistical purposes a number of different installation types have been included in this category. All, however, are either floating units or such that the surface part can move with the action of the sea, i.e., articulated loading columns or single point moorings. A total of 210 incidents were recorded to installations of this type, with the following breakdown:
• Semi-submersible drilling 158 incidents • Semi-submersible production 6 incidents • Semi-submersible crane barge 2 incidents • Semi-submersible emergency support 3 incidents • Semi-submersible mobile support 5 incidents • Semi-submersible accommodation 16 incidents
22

• Single buoy mooring 3 incidents • Single point mooring 3 incidents • Articulated loading column 1 incident • Floating production and storage 10 incidents • Floating storage 1 incident • Drill ship 1 incident • Barge 1 incident
Table 12 and Figure 12 summarise the number and damage category of all incidents occurring to floating installations. Eight incidents were classed as severe, 35 incidents as moderate and the remainder resulting in minor or no damage, including 20 incidents where the damage was not specified but is believed to be minor or none.
Table 12: Damage resulting from incidents to floating installations by year
Installation damage class
Year None Minor Moderate Severe Unspecified Not Applicable TOTAL
1975 0 4 0 0 0 0 4
1976 0 1 0 0 0 11
1977 0 5 3 1 0 0 9
1978 0 4 0 0 0 14
1979 1 9 4 0 1 0 15
1980 3 4 3 2 0 0 12
1981 3 6 1 1 0 0 11
1982 3 4 1 0 0 0 8
1983 3 6 2 0 0 0 11
1984 1 4 4 0 0 0 9
1985 0 0 1 2 0 0 3
1986 0 0 2 0 0 0 2
1987 0 1 0 0 1 0 2
1988 0 2 0 0 0 0 2
1989 0 6 1 0 1 0 8
1990 1 5 1 1 0 1 9
1991 3 7 2 0 2 0 14
1992 1 2 1 1 0 19
1993 1 9 1 0 1 0 12
1994 2 1 0 0 3 0 6
1995 1 1 0 0 0 0 2
1996 0 1 1 0 0 0 2
1997 0 5 1 0 2 0 8
1998 0 4 0 0 4 0 8
10
10
14
23

Table 12: (continued) Installation damage class
Year None Minor Moderate Severe Unspecified Not Applicable TOTAL
1999 0 3 0 0 1 0 4
2000 0 2 0 0 1 0 3
2001 0 0 0 0 2 0 2
TOTAL 23 123 35 8 1 210
11.0% 58.6% 16.7% 3.8% 9.5% 0.5% 100%
20
To 31 October 2001
Figure 12: Damage resulting from incidents to floating installations by year
0
2
4
6
8
10
12
14
16
18
20
1975 1976 1977 1978 1979 1980 1981 1982 1983 1984 1985 1986 1987 1988 1989 1990 1991 1992 1993 1994 1995 1996 1997 1998 1999 2000 2001
Year o f i nc iden ts
Num
ber
of
inci
den
ts
Not Applicable
Unspecif ied
S e v e r e
Moderate
Minor
None
The mean frequency and confidence limits of all reported incidents and those categorised as resulting in moderate or severe damage occurring to semi-submersibles by year are summarised in Tables 13 and 14 respectively. Table 15 summarises the mean frequency in the year in question and also cumulatively to any year end from 1975. Figures 13, 14 and 15 graphically represent the variation in these results.
Table 13: Frequency of all reported incidents to floating installations per year
Number of incidents
Mean installations Incident frequency (per installation per year)
Year in year (r) operating in year
(T) 5% confidence
limit Mean = (r/T) 95% confidence limit
1975 4 26.4 0.35 0.15 0.05
1976 19.6 0.93 0.56 0.31
1977 9 22.8 0.69 0.39 0.21
1978 17.6 1.24 0.80 0.48
1979 15.5 1.49 0.97 0.60
11
14
15
24

Table 13: (continued) Number of incidents
Mean installations Incident frequency (per installation per year)
Year in year (r) operating in year
(T) 5% confidence
limit Mean = (r/T) 95% confidence limit
1980 19.9 0.98 0.60 0.35
1981 23.7 0.77 0.46 0.26
1982 8 28.0 0.52 0.29 0.14
1983 29.7 0.61 0.37 0.21
1984 9 35.9 0.44 0.25 0.13
1985 3 38.0 0.20 0.08 0.02
1986 2 26.6 0.24 0.08 0.01
1987 2 24.0 0.26 0.08 0.01
1988 2 32.0 0.20 0.06 0.01
1989 8 31.9 0.45 0.25 0.12
1990 9 52.8 0.30 0.17 0.09
1991 57.4 0.38 0.24 0.15
1992 44.3 0.63 0.43 0.28
1993 40.3 0.48 0.30 0.17
1994 6 30.1 0.39 0.20 0.09
1995 2 34.9 0.18 0.06 0.01
1996 2 43.3 0.15 0.05 0.01
1997 8 44.9 0.32 0.18 0.09
1998 8 46.3 0.31 0.17 0.09
1999 4 35.4 0.26 0.11 0.04
2000 3 34.5 0.22 0.09 0.02
2001 2 40.0 0.16 0.05 0.01
12
11
11
14
19
12
To 31 October 2001
25

Table 14: Frequency of moderate or severe damage to floating installations per year
Number of incidents
Mean installations Incident frequency (per installation per year)
Year in year (r) operating in year
(T) 5% confidence
limit Mean = (r/T) 95% confidence limit
1975 0 26.4 0.11 0.00 #N/A
1976 1 19.6 0.24 0.05 0.00
1977 4 22.8 0.40 0.18 0.06
1978 4 17.6 0.52 0.23 0.08
1979 4 15.5 0.59 0.26 0.09
1980 5 19.9 0.53 0.25 0.10
1981 2 23.7 0.27 0.08 0.01
1982 1 28.0 0.17 0.04 0.00
1983 2 29.7 0.21 0.07 0.01
1984 4 35.9 0.26 0.11 0.04
1985 3 38.0 0.20 0.08 0.02
1986 2 26.6 0.24 0.08 0.01
1987 0 24.0 0.12 0.00 #N/A
1988 0 32.0 0.09 0.00 #N/A
1989 1 31.9 0.15 0.03 0.00
1990 2 52.8 0.12 0.04 0.01
1991 2 57.4 0.11 0.03 0.01
1992 3 44.3 0.17 0.07 0.02
1993 1 40.3 0.12 0.02 0.00
1994 0 30.1 0.10 0.00 #N/A
1995 0 34.9 0.09 0.00 #N/A
1996 1 43.3 0.11 0.02 0.00
1997 1 44.9 0.11 0.02 0.00
1998 0 46.3 0.06 0.00 #N/A
1999 0 35.4 0.08 0.00 #N/A
2000 0 34.5 0.09 0.00 #N/A
2001 0 40.0 0.07 0.00 #N/A
To 31 October 2001
26

Table 15: Mean and cumulative frequency of all reported incidents to floating installations
Year Number of
incidents in year (r)
Cumulative number of
incidents (r1)
Mean installations
operating in year (T)
Cumulative operating
experience (T1)
Incident frequency ( = r/T)
Cumulative incident
frequency (= r1/T1)
1975 4 4 26.4 26.4 0.15 0.15
1976 11 15 19.6 46.0 0.56 0.33
1977 9 24 22.8 68.8 0.39 0.35
1978 14 38 17.6 86.4 0.80 0.44
1979 15 53 15.5 101.9 0.97 0.52
1980 12 65 19.9 121.8 0.60 0.53
1981 11 76 23.7 145.5 0.46 0.52
1982 8 84 28.0 173.5 0.29 0.48
1983 11 95 29.7 203.2 0.37 0.47
1984 9 104 35.9 239.1 0.25 0.43
1985 3 107 38.0 277.1 0.08 0.39
1986 2 109 26.6 303.7 0.08 0.36
1987 2 111 24.0 327.7 0.08 0.34
1988 2 113 32.0 359.7 0.06 0.31
1989 8 121 31.9 391.6 0.25 0.31
1990 9 130 52.8 444.4 0.17 0.29
1991 14 144 57.4 501.8 0.24 0.29
1992 19 163 44.3 546.1 0.43 0.30
1993 12 175 40.3 586.4 0.30 0.30
1994 6 181 30.1 616.4 0.20 0.29
1995 2 183 34.9 651.4 0.06 0.28
1996 2 185 43.3 694.7 0.05 0.27
1997 8 193 44.9 739.6 0.18 0.26
1998 8 201 46.3 785.9 0.17 0.26
1999 4 205 35.4 821.4 0.11 0.25
2000 3 208 34.5 855.9 0.09 0.24
2001 2 210 40.0 882.6 0.05 0.24
To 31 October 2001
27

Figure 13: Frequency of all reported incidents to floating installations per year
0.00
0.20
0.40
0.60
0.80
1.00
1.20
1.40
1.60
1975 1976 1977 1978 1979 1980 1981 1982 1983 1984 1985 1986 1987 1988 1989 1990 1991 1992 1993 1994 1995 1996 1997 1998 1999 2000 2001
Year of incident
Inci
den
t fr
eque
ncy
Mean = ( r /T )
9 5 % c o n f i d e n c e l i m i t
5 % c o n f i d e n c e l i m i t
Figure 14: Frequency of moderate or severe damage to floating installations per year
0.00
0.10
0.20
0.30
0.40
0.50
0.60
0.70
1975 1976 1977 1978 1979 1980 1981 1982 1983 1984 1985 1986 1987 1988 1989 1990 1991 1992 1993 1994 1995 1996 1997 1998 1999 2000 2001
Year of incident
Inci
den
t fr
eque
ncy
Mean = ( r /T )
9 5 % c o n f i d e n c e l i m i t
5 % c o n f i d e n c e l i m i t
Figure 15: Mean and cumulative frequency of all reported incidents to floating installations
0.00
0.20
0.40
0.60
0.80
1.00
1.20
1975 1976 1977 1978 1979 1980 1981 1982 1983 1984 1985 1986 1987 1988 1989 1990 1991 1992 1993 1994 1995 1996 1997 1998 1999 2000 2001
Year o f i nc iden ts
Inci
den
t fr
eque
ncy
Cumulative incident frequency (= r1/T1)
Incident frequency ( = r/T)
28

Overall there is a large spread in the annual incident frequency. The number of reported incidents increased to a peak in 1979 before declining to a minimum in the years 1986 to 1988. An increase in the annual incident frequency then occurred up to a second, lesser, peak in 1992, this generally being in line with the increase in semi-submersible utilisation. A minimum frequency occurred in 1995 and 1996, however, in more recent years the frequency has again increased before gradually decreasing again.
Over the whole period of study the probability of an incident occurring is on average 0.238 per year (1 incident every 4.20 years or approximately 9 every year for the current level of installation activity). The analysis for reported incidents resulting in damage categorised as moderate or severe indicates the probability is on average 0.049 per year (1 incident every 20.53 years or approximately 2 every year for the current level of installation activity). Recent experience indicates that these figures are an exaggeration of the actual number.
The probability of a floating installation suffering damage categorised as moderate or severe is five times more likely than that for fixed installations and nine times more likely than for jack-ups. The reasons for this increased susceptibility are not clear however, it may be explained by floating installations being mobile and therefore it is possible that they may be prone to errors in manoeuvrability or slight movement while moored. Increased risk may also result from the need for anchor handling, which other types of installations do not require, as this is likely to bring attendant vessels into close proximity more frequently leading to the possibility of collision. Further investigation of the database reveals that anchor handling was given as the “Operating Circumstance” in 18 of 180 incidents where this data was recorded for floating installations.
3.2.3.1 Floating Production, Storage and Offloading and Floating Storage Units Over approximately the last decade the UKCS has seen an increasing trend towards the use of floating production, storage and offloading (FPSO) and floating storage units (FSU) as a cost effect method, particularly in deep waters, of producing and holding oil prior to transfer to onshore terminals
As the data set has expanded it was considered appropriate to look at this class of installation in greater detail than is possible when they are incorporated within the large ‘Floating Installations’ grouping. Accordingly, an overview of the incidents affecting FPSO has been developed:
• 10 incidents to FPSOs and 1 incident to a FSU since 1992 (1 in 1992, 3 in 1993, 4 in 1997 and 3 in 1998).
• 3 incidents occurred in February, 1 incident in March, 2 incidents in April, 2 incidents in July, 1 incident in August and 2 incidents in September.
• 5 incidents occurred in the ‘Central North Sea’, 3 incidents in the ‘Northern North Sea’, 2 incidents ‘West of Shetlands’ and the location was ‘unspecified’ in 1 incident.
• 1 incident with an anchor handler, 1 incident with a stand by vessel, 6 with a supply vessel and 3 incidents with an offloading shuttle tanker.
• 3 incidents resulted in ‘unspecified’ damage to the FPSO and 8 incidents resulted in ‘minor’ damage.
29

• ‘Anchor handling’ was the operating circumstance in 2 incidents, ‘bunkering operations in 1 incident, ‘cargo transfer’ (cargo of the colliding vessel being transferred to the FPSO/FSU) in 5 incidents and oil transfer to the shuttle tanker in 3 incidents.
• ‘Mechanical control failure’ (i.e., bowthruster failure, D.P. control failure, D.P. failure) was the primary cause in 4 incidents; ‘human control failure’ was the primary cause in 3 incidents (i.e., misjudgement, operator error); ‘external factors’ (i.e., weather conditions) was the primary cause in 2 incidents and was ‘unspecified’ in 2 incidents.
3.2.4 Jack-ups A total of 79 incidents were recorded to installations of this type. Table and Figure 16 summarise the number and damage category of all incidents occurring to jack-ups. One incident (Glomar Labrador 1/Irving Forest - 23/06/88) was classed as severe, 2 incidents as moderate and the remainder resulting in minor or no damage, including 13 incidents where the damage was not specified but is believed to be minor or none.
Figure 16: Damage resulting from incidents to jack-up installations by year
0
1
2
3
4
5
6
7
8
9
1975 1976 1977 1978 1979 1980 1981 1982 1983 1984 1985 1986 1987 1988 1989 1990 1991 1992 1993 1994 1995 1996 1997 1998 1999 2000 2001
Year o f i nc iden ts
Num
ber
of
inci
den
ts
Not Applicable
Unspecif ied
S e v e r e
Moderate
Minor
None
30

Table 16: Damage resulting from incidents to jack-up installations by year
Installation damage class
Year None Minor Moderate Severe Unspecified Not Applicable TOTAL
1975 0 1 1 0 0 0 2
1976 0 1 0 0 0 0 1
1977 0 1 0 0 0 0 1
1978 1 1 0 0 0 0 2
1979 0 0 0 0 0 0 0
1980 0 0 0 0 0 0 0
1981 0 0 0 0 0 0 0
1982 2 0 0 0 0 0 2
1983 1 2 0 0 0 0 3
1984 3 0 1 0 0 0 4
1985 1 2 0 0 1 0 4
1986 0 1 0 0 1 0 2
1987 1 0 0 0 0 0 1
1988 2 4 0 1 0 0 7
1989 1 4 0 0 0 0 5
1990 2 2 0 0 1 0 5
1991 2 4 0 0 0 0 6
1992 3 5 0 0 0 0 8
1993 3 1 0 0 0 0 4
1994 3 1 0 0 1 0 5
1995 0 2 0 0 1 0 3
1996 0 0 0 0 0 0 0
1997 0 1 0 0 2 0 3
1998 0 1 0 0 4 0 5
1999 2 1 0 0 1 0 4
2000 0 0 0 0 1 0 1
2001 0 1 0 0 0 0 1
TOTAL 27 36 2 1 13 0
34.2% 45.6% 2.5% 1.3% 16.5% 0.0% 100%
79
To 31 October 2001
The mean frequency and confidence limits of all reported incidents and those categorised as resulting in moderate or severe by year are summarised in Tables 17 and 18 respectively. Table 19 summarises the mean frequency in the year in question and also cumulatively to any year end from 1975. Figures 17, 18 and 19 graphically represent the variation in these results.
31

Table 17: Frequency of all reported incidents to jack-up installations per year Number of incidents
Mean installations Incident frequency (per installation per year)
Year in year (r) operating in year
(T) 5% confidence
limit Mean = (r/T) 95% confidence limit
1975 2 3.31 1.05 0.19
1976 1 1.90 0.40 0.02
1977 1 2.50 0.53 0.03
1978 2 4.50 1.43 0.25
1979 0 1.87 0.00 #N/A
1980 0 1.43 0.00 #N/A
1981 0 0.88 0.00 #N/A
1982 2 1.40 0.44 0.08
1983 3 0.95 0.37 0.10
1984 4 16.2 0.57 0.25 0.08
1985 4 18.3 0.50 0.22 0.07
1986 2 14.7 0.43 0.14 0.02
1987 1 13.9 0.34 0.07 0.00
1988 7 20.2 0.65 0.35 0.16
1989 5 23.0 0.46 0.22 0.09
1990 5 48.4 0.22 0.10 0.04
1991 6 43.3 0.27 0.14 0.06
1992 8 42.3 0.34 0.19 0.09
1993 4 36.6 0.25 0.11 0.04
1994 5 33.4 0.31 0.15 0.06
1995 3 32.8 0.24 0.09 0.02
1996 0 33.5 0.09 0.00 #N/A
1997 3 37.6 0.21 0.08 0.02
1998 5 36.8 0.29 0.14 0.05
1999 4 29.9 0.31 0.13 0.05
2000 1 29.4 0.16 0.03 0.00
2001 1 32.0 0.15 0.03 0.00
1.9
2.5
1.9
1.4
1.6
2.1
3.4
4.5
8.2
To 31 October 2001
32

Table 18: Frequency of moderate or severe damage to jack-up installations per year
Number of incidents
Mean installations Incident frequency (per installation per year)
Year in year (r) operating in year
(T) 5% confidence
limit Mean = (r/T) 95% confidence limit
1975 1 2.50 0.53 0.03
1976 0 1.20 0.00 #N/A
1977 0 1.58 0.00 #N/A
1978 0 2.14 0.00 #N/A
1979 0 1.87 0.00 #N/A
1980 0 1.43 0.00 #N/A
1981 0 0.88 0.00 #N/A
1982 0 0.67 0.00 #N/A
1983 0 0.37 0.00 #N/A
1984 1 16.2 0.29 0.06 0.00
1985 0 18.3 0.16 0.00 #N/A
1986 0 14.7 0.20 0.00 #N/A
1987 0 13.9 0.22 0.00 #N/A
1988 1 20.2 0.23 0.05 0.00
1989 0 23.0 0.13 0.00 #N/A
1990 0 48.4 0.06 0.00 #N/A
1991 0 43.3 0.07 0.00 #N/A
1992 0 42.3 0.07 0.00 #N/A
1993 0 36.6 0.08 0.00 #N/A
1994 0 33.4 0.09 0.00 #N/A
1995 0 32.8 0.09 0.00 #N/A
1996 0 33.5 0.09 0.00 #N/A
1997 0 37.6 0.08 0.00 #N/A
1998 0 36.8 0.08 0.00 #N/A
1999 0 29.9 0.10 0.00 #N/A
2000 0 29.4 0.10 0.00 #N/A
2001 0 32.0 0.09 0.00 #N/A
1.9
2.5
1.9
1.4
1.6
2.1
3.4
4.5
8.2
To 31 October 2001
33

Table 19: Mean and cumulative frequency of all reported incidents to jack-up installations
Year Number of
incidents in year (r)
Cumulative number of
incidents (r1)
Mean installations
operating in year (T)
Cumulative operating
experience (T1)
Incident frequency ( = r/T)
Cumulative incident
frequency (= r1/T1)
1975 2 2 1.9 1.9 1.05 1.05
1976 1 3 2.5 4.4 0.40 0.68
1977 1 4 1.9 6.3 0.53 0.63
1978 2 6 1.4 7.7 1.43 0.78
1979 0 6 1.6 9.3 0.00 0.65
1980 0 6 2.1 11.4 0.00 0.53
1981 0 6 3.4 14.8 0.00 0.41
1982 2 8 4.5 19.3 0.44 0.41
1983 3 11 8.2 27.5 0.37 0.40
1984 4 15 16.2 43.7 0.25 0.34
1985 4 19 18.3 62.0 0.22 0.31
1986 2 21 14.7 76.7 0.14 0.27
1987 1 22 13.9 90.6 0.07 0.24
1988 7 29 20.2 110.8 0.35 0.26
1989 5 34 23.0 133.8 0.22 0.25
1990 5 39 48.4 182.2 0.10 0.21
1991 6 45 43.3 225.6 0.14 0.20
1992 8 53 42.3 267.8 0.19 0.20
1993 4 57 36.6 304.4 0.11 0.19
1994 5 62 33.4 337.8 0.15 0.18
1995 3 65 32.8 370.6 0.09 0.18
1996 0 65 33.5 404.1 0.00 0.16
1997 3 68 37.6 441.7 0.08 0.15
1998 5 73 36.8 478.6 0.14 0.15
1999 4 77 29.9 508.5 0.13 0.15
2000 1 78 29.4 537.9 0.03 0.15
2001 1 79 32.0 559.2 0.03 0.14
To 31 October 2001
34
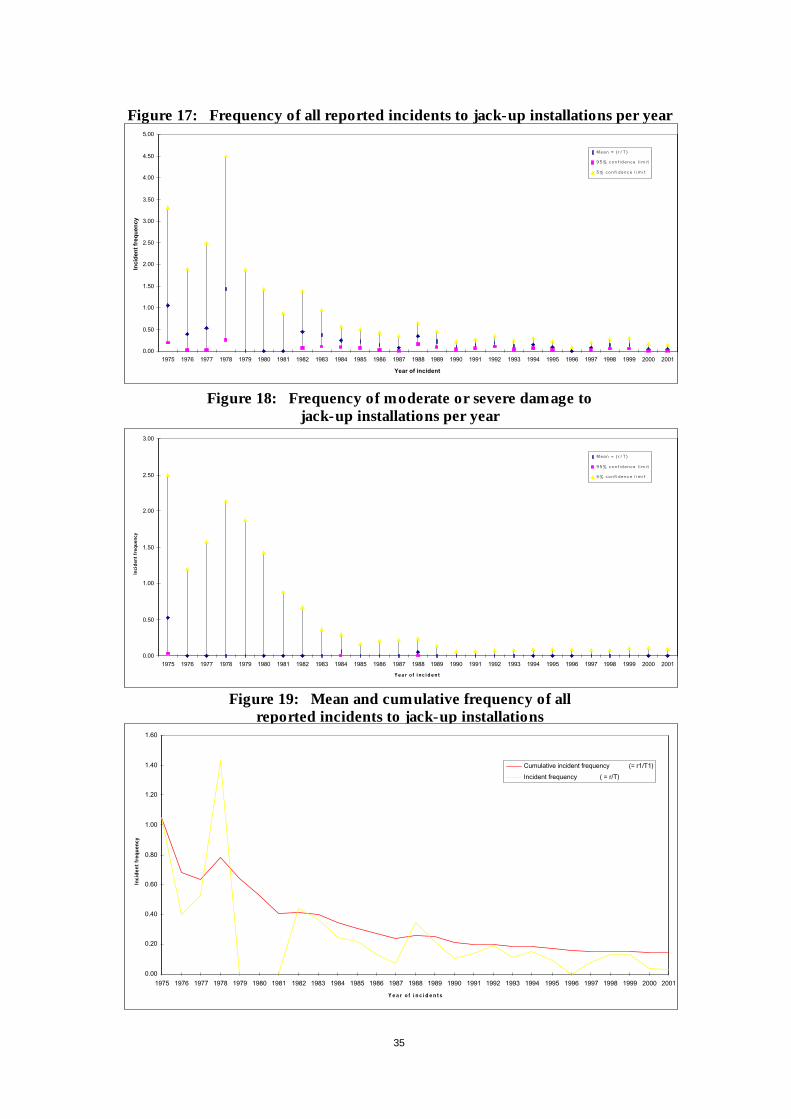
Figure 17: Frequency of all reported incidents to jack-up installations per year
0.00
0.50
1.00
1.50
2.00
2.50
3.00
3.50
4.00
4.50
5.00
1975 1976 1977 1978 1979 1980 1981 1982 1983 1984 1985 1986 1987 1988 1989 1990 1991 1992 1993 1994 1995 1996 1997 1998 1999 2000 2001
Year of incident
Inci
den
t fr
equ
ency
Mean = ( r /T )
9 5 % c o n f i d e n c e l i m i t
5 % c o n f i d e n c e l i m i t
Figure 18: Frequency of moderate or severe damage to jack-up installations per year
0.00
0.50
1.00
1.50
2.00
2.50
3.00
1975 1976 1977 1978 1979 1980 1981 1982 1983 1984 1985 1986 1987 1988 1989 1990 1991 1992 1993 1994 1995 1996 1997 1998 1999 2000 2001
Year of incident
Inci
den
t fr
eque
ncy
Mean = ( r /T )
9 5 % c o n f i d e n c e l i m i t
5 % c o n f i d e n c e l i m i t
Figure 19: Mean and cumulative frequency of all reported incidents to jack-up installations
0.00
0.20
0.40
0.60
0.80
1.00
1.20
1.40
1.60
1975 1976 1977 1978 1979 1980 1981 1982 1983 1984 1985 1986 1987 1988 1989 1990 1991 1992 1993 1994 1995 1996 1997 1998 1999 2000 2001
Year o f i nc iden ts
Inci
den
t fr
eque
ncy
Cumulative incident frequency (= r1/T1)
Incident frequency ( = r/T)
35

The relatively small jack-up population, especially in the early years of the study, has to a degree devalued the data. Post 1983 jack-up utilisation increased four fold from two years previously and thereafter mean incident frequency remained within a reasonably narrow band in relation to the constraints imposed by a small population.
Over the whole period of study the probability of an incident occurring is on average 0.141 per year (1 incident every 7.08 years or approximately 4.5 every year for the current level of installation activity). The analysis for reported incidents resulting in damage categorised as moderate or severe indicates the probability is on average 0.005 per year (1 incident every 186.4 years or approximately 1 every 6 years for the current level of installation activity). Recent experience indicates that these figures are an exaggeration of the actual number and is probably skewed by the larger incident frequencies in the early years of study adversely affecting the figure for the current level of activity.
3.2.5 Summary of incident frequencies A summary of incident frequencies for all vessel types and those involving passing vessels is presented as Table 20 and Table 21, respectively. The tables have been generated using both the number of all recorded incidents and those which only resulted in damage classified as severe or moderate. Installation types have been analysed both cumulatively and separately.
Table 20: Summary of mean incident frequencies of all reported incidents and moderate or severe damage category incidents (all vessel types)
Installation/rig type All reported incidents/year Incidents resulting in moderate or severe damage/year
0.0987 0.0152
Fixed installations 0.0638 0.0095
Semi-submersibles 0.2379 0.0487
Jack-ups 0.1413 0.0054
Mean incident frequency: 1975 to 31/10/2001
All installations
Table 21: Summary of mean incident frequencies of all reported incidents and moderate or severe damage category incidents (passing vessels)
Installation/rig type All reported incidents/year Incidents resulting in moderate or severe damage/year
0.0014 0.0004
Fixed installations 0.0012 0.0002
Semi-submersibles 0.0000 0.0000
Jack-ups 0.0054 0.0018
Mean incident frequency: 1975 to 31/10/2001
All installations
36

3.3 OPERATING CIRCUMSTANCES A wide variety of ‘operating circumstances’ have been reported by those making the collision incident report. In the context of the database the operating circumstance is a fairly broad grouping of categories of what activity the vessel was engaged in when the collision occurred. Table 22 presents an overview of the activities that were reported together with a measure of what proportion of the total number of incidents a particular operating circumstance was mentioned.
The most common type of activity leading to a collision with the installation is one involving the transfer of cargo whereas the second most frequent involves vessels that are approaching the installation, possibly to transfer cargo. This is not surprising as it is by far the most frequent occurrence that puts a vessel into close proximity to an installation and one that requires the vessel to maintain station with respect to the installation. Depending on the level of vessel’s equipment, i.e., dynamic positioning, conventional thrusters or a standard propeller and rudder, the possibility of excursion and contact with the installation is more or less likely to occur.
Table 22: Operating circumstances at time of incident Operating circumstances Number of occurences
Anchor Handling 18 3.2%
Approaching Installation 103 18.5%
Awaiting Cargo Transfer 1 0.2%
Bunkering Operations 4 0.7%
Cargo Loading 11 2.0%
Cargo Transfer 128 23.0%
Cargo Unloading 63 11.3%
Cargo Unloading - Containers 11 2.0%
Close Support 29 5.2%
Departing Installation 6 1.1%
Disconnecting Towing Line 1 0.2%
Diving Operations 23 4.1%
Loading Crude Oil 5 0.9%
Maintenance 1 0.2%
Man Overboard Drill 2 0.4%
Passing Cargo Vessel 2 0.4%
Passing Fishing Vessel 5 0.9%
Passing Supply Vessel 1 0.2%
Personnel Transfer 6 1.1%
Rock Dumping 1 0.2%
Surveying 4 0.7%
Towing 1 0.2%
Unspecified 131 23.5%
TOTALS 557 100.0%
To 31 October 2001
37

3.4 CAUSATION FACTORS The database contains a “Primary Cause” field wherein the perceived cause of the incident has been stated. These data have been recorded for 375 incidents. Although the database records the primary cause as precisely as possible, to gain a clearer understanding of the causation factors the primary causes have been broken down into 4 main categories. In the author’s opinion, analysis of the primary cause field has yielded the main categories to be; external factors; mechanical control failure; human control failure; watchkeeping failure. Table 23 lists the primary cause and number within each category.
Table 23: Primary cause factors External factors Mechanical control failure Human control failure Watchkeeping failure Unspecified
Sub-categories Number of occurrence Sub-categories Number of
occurrence Sub-categories Number of occurrence Sub-categories Number of
occurrence Number of occurrence
Anchor Dragged 11 Anchor Chain
Broke 1
D.P. Operator Error
1 Post/Operation
Neglected 15 182
Anchor Dragged Due Weather 2 Autopilot Failure 2
Error in Mooring Procedure
2 - - -
Obscured Vision 1 Bowthruster
Failure 2 Manoeuvring Misjudgement 3 - - -
Poor Visibility 1 Clutch Failure 1 Misjudgement 124 - - -
Weather Conditions
67 Crane Failure 1 Misjudgement by
Poor Visibility 2 - - -
- -D.P. Computer
Failure 2
Misjudgement by Poor Weather 1 - - -
- -D.P. Control
Failure 7 Operator Error 18 - - -
- -D.P. Electrical
Failure 3 Untangling Nets 1 - - -
- - D.P. Failure 17 - - - - -
- -D.P. Remote
Control Failure 1 - - - - -
- -D.P. Thruster
Failure 4 - - - - -
- - Electrical Failure 4 - - - - -
- -Engine Control
Failure 26 - - - - -
- - Engine Failure 3 - - - - -
- -Engine Power
Failure 13 - - - - -
- - Mooring Failure 9 - - - - -
- - Power Failure 4 - - - - -
- - Propeller Failure 1 - - - - -
- - Rudder Misaligned 1 - - - - -
- -Steering Control
Failure 1 - - - - -
- - Steering Failure 4 - - - - -
- -Thruster Control
Failure 3 - - - - -
- -Thruster Electrical
Failure 1 - - - - -
- - Thruster Failure 9 - - - - -
- - Total Power Loss 6 - - - - -
TOTALS 82 - 126 - 152 - 15 182
14.7% - 22.6% - 27.3% - 2.7% 32.7%
To 31 October 2001
38

Analysis of the results indicates, as perhaps is to be expected, that the majority of incidents involving “attendant vessels” has a primary cause linked to some form of control failure; be it either human or mechanical. Furthermore, while the category of external factors contains predominantly environmental causes, it may be argued that these too should fall within the human control failure as perhaps the operation should have been aborted or postponed if conditions were so severe so as to possibly lead to a collision.
Watchkeeping failure was assessed as the primary cause in each “passing vessel” incident. Unfortunately, the precise nature of the watchkeeping failure is unknown, and is unlikely to remain so unless an impartial, third party investigation into the full circumstances of the accident is initiated and reported.
3.5 GEOGRAPHICAL DISTRIBUTION
For the purposes of this analysis all installation types have been combined. Jack-up installations are rarely used in the Northern North Sea, and similarly semi-submersibles are less likely in the shallower waters of the Southern North Sea. To analyse the data by individual installation types may suggest that some types have experienced less incidents in certain areas, when in reality their populations are very small.
A simple comparison of the number of incidents occurring in each sector of the UKCS has been produced in Table 24 and graphically in Figure 20. These highlight those areas that have historically suffered most incidents, however, it should be viewed against the very different levels of activity between sectors. Unless the number of incidents is compared with the total number of installations operating in that sector a relative frequency is impossible to determine. Unfortunately, sector activity throughout the period of study is difficult to achieve with any degree of accuracy as mobile units move location frequently even when engaged under the same contract.
Table 24: Geographical distribution of incidents
Sector Number Percentage
Northern North Sea 105 18.85%
Central North Sea 144 25.85%
Southern North Sea 149 26.75%
English Channel 3 0.54%
Celtic Sea 2 0.36%
Morecambe Bay 17 3.05%
West of Shetlands 2 0.36%
Unspecified 135 24.24%
Incidents
To 31 October 2001
39

Figure 20: Geographical distribution of incidents
0
20
40
60
80
100
120
140
160
Northern North Sea
Central North Sea
Southern North Sea
English Channel
Celtic Sea Morecambe Bay
West of Shetlands
Unspecified
Sector
Nu
mb
er o
f in
cid
ents
Of particular interest is the geographical distribution of “passing vessel” incidents as these tend to be more location specific than those of “attendant vessels”. The 8 passing vessels incidents all occurred in the Southern North Sea.
40

4 Discussion
4.1 INCIDENT FREQUENCIES
In the period since 1992 the mean incident frequency has generally shown a downward trend, particularly for those incidents which, in accordance with the outlined criteria, result in moderate or severe damage. For the most part this may be due to the adoption of improved working practices by installation operators and of better standards of attendant vessel repair and maintenance by their owners/operators. The exception to this is the frequency of incidents to semi-submersibles, where, in 1996 and 1997, the frequency increased slightly resulting in an almost constant cumulative incident frequency . The reasons for this increase could not be explained, other than perhaps to suggest that there was a degree of under reporting in the previous years.
4.2 DATA COMPLETENESS
Despite exhaustive cross-checking, a number of otherwise unsubstantiated incidents are contained within the database. While this is perhaps to be expected in the early part of the study it has even occurred in more recent years (post 1990), predominantly for incidents where little or no damage has resulted. To some extent this is not surprising. Individual O.I.M.’s are responsible for the completion of OIR/9A forms, and where a minor contact has occurred, possibly not resulting in any damage to the installation, the need to complete a report may not be apparent. In this respect it is believed that the database has suffered a degree of under-reporting such that undue confidence should not be placed in the completeness of the ‘minor’, ‘unspecified’ and ‘none’ damage categories. Further, these concerns are compounded by the unknown accuracy of incidents to normally unattended installations.
The quantification of confidence in the various damage categories is extremely difficult to predict with accuracy. Using only the ‘minor’, unspecified’, and ‘none’ damage categories, if the number of incidents where a confirming source is recorded is compared to the total number, the figure is 31.7% (149 confirmed of 470 incidents). Conversely, where damage categorised as ‘moderate’ or ‘severe’ has occurred, the same method produces a figure of 48.8% (42 confirmed of 86 incidents). When the years 1991-2001 are considered (1991 being the year in which the MAIB database, as a supporting source, commenced) figures of 30.7% and 78% are produced for, respectively, ‘minor’, unspecified’, ‘none’; and ‘moderate’, ‘severe’ categories.
4.3 PASSING VESSELS
Fortunately, over the whole period of study, collision incidents involving “passing vessels” have occurred very infrequently. Of the 557 recorded incidents only 8 have involved passing vessels and either fixed steel or jack-up installations; that other installation types have not been involved would seem to be fortuitous rather than due to anything inherent in their design. The potential for severe damage, possibly even catastrophic, is greatly
41

increased when passing vessels infringe the 500 metres safety zone, whether by accident or design. The kinetic energy possessed by passing cargo vessels and tankers may result in even a glancing blow causing major structural damage. The potential for a passing vessel to collide with an installation is to a large extent outside the control of the installation operator and its attendant stand-by vessel, though if timely action is taken to warn an errant vessel it may be possible to influence their actions.
All passing vessel collisions have occurred in the Southern North Sea and to some extent this is not surprising. The waters in this area are more densely populated with passing commercial shipping traffic engaged on domestic coastal voyages, shorts sea international traffic between UK ports and the near continent and long international voyages between ‘foreign’ ports and North European ports. To this should be added the large numbers of inshore and near water fishing vessels from both East Coast UK and near continent ports.
Coupled to the increase in traffic density is the need for much of this traffic to follow traffic lanes rather than being able to follow their courses at will. Many of the traffic lanes are in the form of International Maritime Organisation (IMO) adopted traffic separation schemes whereas others have developed over time and are now ‘customary’ routes.
The historic development of the oil and gas industry in the region has seen a relatively large number of installations in locations in fairly close proximity to the traffic lanes, both customary and mandatory, and what is perhaps more surprising are the relatively few passing vessel incidents when viewed against this backdrop. Certainly, based on anecdotal evidence of vessel/vessel collisions it is felt the incident frequency for vessel/platform collisions is far lower than for vessel/vessel collisions in the same area. However, this assumption is not based on any formal analysis rather than on the MAIB’s simple accident data not taking into account populations etc.
It can be argued that in some respects the existence of large numbers of vessels and installations in close proximity ought to lead to a heightened awareness among vessel watchkeepers compared to areas where vessels/installations are less numerous. Unfortunately, the passing vessel data do not reinforce this argument and it appears that installations in the Southern North Sea are at greater risk than those in other areas; probably because the increased awareness of vessel watchkeepers fails to keep pace with the increase in risk in congested areas.
4.4 PRIMARY CAUSE
In apportioning a “primary cause” to an incident great faith has been placed in the contents of the OIR/9A forms. Almost exclusively, these have been completed by personnel on board the installation who may, or may not, have contacted those on board the relevant vessel to determine their opinion of the circumstances. It is quite possible that where, for instance, the primary cause is stated to be ‘judgement’, this may be the Offshore Installation Manager’s (O.I.M.) assessment based on second hand information from those witnessing the incident, rather than after discussion with subject vessel’s Master.
42
5 Analysis of Platform Supply Vessel Fleet and Commercial Shipping Trends on the UKCS
5.1 INTRODUCTION
With the entering into statute of The Statistical Returns (Carriage of Goods and Passengers by Sea) Regulations 1997 (S.I. No. 2330/97) and the advent of the Maritime Statistics Collection Agency (MARSTATS) on 1 January 2000 it has become possible to develop information about a number of factors that may have an impact on ship/platform collision incidents generally. At HSE’s request data about several related issues were obtained from the data set held by MARSTATS of behalf of the Department of Transport, Local Government and the Regions (DTLR).
Information about the number of voyages into and out of U.K. ports from/to the UKCS, the identity of the vessels involved and the type of cargo carried by those vessels has been extracted from MARSTATS. The statutory duty on shipping lines or their agents to supply the information is limited to cargo loaded/discharged at the U.K.’s ‘major’ ports. These are defined as ports having a total annual throughput exceeding 1 million tonnes, of which there are 52 in the U.K. There is no reporting requirement for vessels loading/discharging in ports that handle less than 1 million per year, of which several are involved in the offshore oil and gas industry, for example, Montrose and Lowestoft, therefore it is certain that the data analysed does not represent all offshore traffic. Furthermore, although it is a legal requirement for shipping lines or their agents to supply the data it is almost inevitable that there may be a degree of under reporting in even the ‘major’ ports; the extent of which is not known with certainty. Bearing these in mind, the figures presented below represent the minimum estimate of vessels actively engaged in platform supply operations or shuttle tanker activity.
5.2 PLATFORM SUPPLY VESSELS
For some time there has been an unsubstantiated belief among some in HSE that the development of platform supply vessels (PSV) over time has led to a gradual increase in size, both in terms of their external dimensions and tonnages. The Maritime Statistics Collection Agency holds a listing of all currently registered commercial vessels together with detailed information about their type, dimensions, tonnages, year of build, speed and flag etc. Although information about a vessel’s displacement is not included in the MARSTATS fleet list, at HSE’s request an attempt has also been made to determine this by using the other available parameters as well as an assumed block coefficient of 0.77. The block coefficient figure was chosen in consultation with staff within HSE.
Using the primary search criterion of ‘type = offshore supply’ an extract of the fleet list was taken to assess how the main vessel criteria have changed. The search produced a total of 2827 current vessels. The oldest vessel listed as ‘offshore supply’ was built in 1943 and
43

of the vessels built between then and 1960 only 33 are listed as current. For statistical purposes vessels built prior to 1961 have been excluded.
It is stressed that the information produced depends entirely on the correct classification of vessel type within the fleet list. It is believed, for instance, that a number of vessels that are now working as Emergency Response and Rescue Vessels (ERRV) but where previously PSV still retain their original classification as ‘offshore supply’. Furthermore, some vessels that are actually diver support vessels are classified as ‘offshore supply’. The latter misclassification will have a bearing on the analyses, particularly on the comparison of vessel dimensions, because of the generally larger size of these vessels that will tend to increase the averages disproportionately. Notwithstanding this, the figures presented are believed to give a good appreciation of the trends in changing of vessel dimensions/tonnages if not a comparison in absolute terms.
Although the fleet list held by MARSTATS contains a large number of vessels listed as ‘offshore supply’ there are a number of gaps within the data and where certain of the parameters for a particular vessel are unknown then a ‘0’ is recorded. This has occurred in for various parameters i.e., dimensions, tonnages, speed etc. To avoid skewing the results of the parameter analysis it has been necessary to exclude those vessels where a parameter is unknown. For example, of the 35 vessels listed as being built in 1997 the vessel’s length was not known in 1 case and the deadweight not known in 6 cases. The average vessel length for 1997 built vessels was based on the 34 vessels where this was known and, similarly, for the deadweight, was based on 29 vessels.
Parallel analyses were carried out to derive the average parameters for all vessels classified as ‘offshore supply’ and, separately, for those reported as active on the UKCS since 1 January 2000 through MARSTATS. This was based on their year of build.
A graphical representation of the year on year average of the main vessel dimensions and speed is presented in Figure 21 for all vessels listed as ‘offshore supply’ and in Figure 22 for those that have been active on the UKCS. Similarly, Figures 23 and 24 present a representation of the year on year average of tonnages.
Although the information in the graphs is as accurate as the raw data allows, it should be remembered that certain factors may have an influence on how the data appear. This is particularly true, for example, in 1990 when there were only 5 new builds and all were of approximately the same dimensions. This has led to an apparent anomaly in the data compared to the preceding and following years. In an attempt to minimise the effects of such occurrences a linear trend line has been inserted over each parameter. This has the effect of calculating the least squares fit for a line represented by the equation:
y = mx + b where m is the slope and b is the intercept.
As will be noted, there has been an increase to varying degrees in all the assessed parameters over time. This is the case for both all the current offshore supply vessels and those active on the UKCS.
44

Figure 21: All offshore supply vessels average dimensions over time
Figure 22: UKCS offshore supply vessels average dimensions over time
0
10
20
30
40
50
60
70
80
90
1961
1963
1965
1967
1969
1971
1973
1975
1977
1979
1981
1983
1985
1987
1989
1991
1993
1995
1997
1999
2001
Year of Build
Leng
th/B
read
th/D
raft
(m
)
0
5
10
15
20
25
30
Ave
rage
Spe
ed (
knot
s)
Average Length
Average Breadth
Average Draught
Average Speed
0
10
20
30
40
50
60
70
80
90
1966
1969
1970
1971
1972
1973
1974
1975
1976
1977
1978
1979
1980
1981
1982
1983
1984
1985
1986
1987
1990
1991
1992
1993
1994
1995
1996
1997
1998
1999
2000
Year of Build
Leng
th/B
read
th/D
raft
(m
)
0
5
10
15
20
25
30
Ave
rage
Spe
ed (
knot
s)
Average Length
Average Breadth
Average Draught
Average Speed
NB: The apparent omission of data for 1967 – 1968 and 1988 – 1989 occurred because there were no vessels built in these years operating on the UKCS and reporting cargo through MARSTATS. The inclusion of ‘zero’ data for these years would have unjustly skewed the average figures and trend lines.
45

Figure 23: All offshore supply vessels average tonnages over time
Figure 24: UKCS offshore supply vessels average tonnages over time
0
1000
2000
3000
4000
5000
6000
7000
8000
1961
1963
1965
1967
1969
1971
1973
1975
1977
1979
1981
1983
1985
1987
1989
1991
1993
1995
1997
1999
2001
Year of Build
Gro
ss/D
eadw
eigh
t/D
ispl
acem
ent
Tonn
age
Average Gross Tonnage
Average Deadweight
Average Assumed Displacement
0
1000
2000
3000
4000
5000
6000
7000
8000
9000
10000
1966
1969
1970
1971
1972
1973
1974
1975
1976
1977
1978
1979
1980
1981
1982
1983
1984
1985
1986
1987
1990
1991
1992
1993
1994
1995
1996
1997
1998
1999
2000
Year of Build
Gro
ss/D
eadw
eigh
t/D
ispl
acem
ent
Tonn
age
Average Gross Tonnage
Average Deadweight
Average Assumed Displacement
NB: The apparent omission of data for 1967 – 1968 and 1988 – 1989 occurred because there were no vessels built in these years operating on the UKCS and reporting cargo through MARSTATS. The inclusion of ‘zero’ data for these years would have unjustly skewed the average figures and trend lines.
Other information held in the fleet list refers to a vessel’s current flag. Using data correct as of 30 June 2001 the entire fleet of ‘offshore supply’ and those active on the UKCS have been assessed in terms of their flag. For ease of representation all flags have been divided into groups based on the continents, i.e., Europe, Asia, Africa, America and Australia/Oceania and grouped according to the vessels year of build.
46

It will be noted that the majority of vessels operating on the UKCS appear to be of more recent build than the world fleet average and the majority are registered in European countries. It is perhaps to be expected that vessels operating in European waters would be registered in European countries and no inference should be drawn from this.
Figure 25: All offshore supply vessel flags over time
Figure 26: UKCS offshore supply vessel flags over time
0
20
40
60
80
100
120
140
1961
19
63
1965
19
67
1969
19
71
1973
19
75
1977
19
79
1981
19
83
1985
19
87
1989
19
91
1993
19
95
1997
19
99
2001
Year of Build
No.
Bui
lt in
Yea
r
Flag Group 1 (Europe) Flag Group 2 (Asia) Flag Group 3 (Africa) Flag Group 4 (America) Flag Group 5 (Australia and Oceania)
0
5
10
15
20
25
1966
1969
1970
1971
1972
1973
1974
1975
1976
1977
1978
1979
1980
1981
1982
1983
1984
1985
1986
1987
1990
1991
1992
1993
1994
1995
1996
1997
1998
1999
2000
Year of Build
No.
Bui
lt in
Yea
r
Flag Group 1 (Europe) Flag Group 2 (Asia) Flag Group 3 (Africa) Flag Group 4 (America) Flag Group 5 (Australia and Oceania)
NB: The apparent omission of data for 1967 – 1968 and 1988 – 1989 occurred because there were no vessels built in these years operating on the UKCS and reporting cargo through MARSTATS. The inclusion of ‘zero’ data for these years would have unjustly skewed the average figures and trend lines.
47

5.3 COMMERCIAL SHIPPING BETWEEN UKCS AND U.K.
In an effort to develop and understanding of the magnitude of commercial vessel traffic between the UKCS and various ports on the U.K. mainland the MARSTATS was requested to provide a breakdown of all vessels where the port of loading/unloading was the UKCS. It was intended that this would capture all voyages where, for instance, cargo or stores were carried out to offshore installations or brought back from them. Further, that all occurrences of shuttle tanker operations between UKCS loading terminals and U.K. ports could be analysed.
As with all other data obtained from MARSTATS it should be borne in mind that the responsibility for reporting rests with the shipping lines or their agents and so the data analysed represents the minimum amount of traffic in and around installations on the UKCS.
Another limitation is the absence of data on vessels in ballast and also those where although the loading port may have been on the UKCS the discharge port may be outside the U.K. There is no requirement for shipping lines or agents to make statistical returns to MARSTATS when a vessel is not carrying cargo nor when it does not come to a U.K. port.
In conclusion, it is highly likely there are an even greater number of voyages where cargo is being carried not to mention vessels in ballast.
A breakdown of the results, sorted by U.K. port and then year/quarter, is presented in Appendix B. It provides the number of voyages by vessels of various deadweight groupings. The deadweight referred to is the maximum of the vessel, i.e., loaded to the summer loadline, and does not necessarily represent the vessel’s deadweight at the time the voyage occurred.
Figure 27, overleaf, is a graphical representation of the total number of voyages where cargo was carried between U.K. ports and the UKCS in the period between 1 January 2000 and 30 June 2001. It demonstrates that Aberdeen is the busiest port in terms of number of voyages followed by Peterhead. However, when the graph is compared with the table in Appendix B it shows that the bulk of the voyages are carried out by relatively small vessels compared to other ports that are used as discharge ports for shuttle tankers, such as the Sullom Voe, Milford Haven, River Humber, River Mersey and Scapa Flow.
48

Figure 27: Vessels carrying commercial cargo between U.K. ports and UKCS
0
5000
10000
15000
20000
25000
Aberd
een
Cromar
ty Firth
Dunde
e
Firth of
For
th
Great
Yarmou
th
Hartle
pool
Heysh
am
Milford
Hav
en
Peterh
ead
River C
lyde
River H
umbe
r
River M
erse
y
River T
ees
River T
hames
River T
yne
Scapa
Flow
Sheer
ness
Southa
mpton
Sullom
Voe
U.K. port
Nu
mb
er o
f vo
yag
es b
y ve
ssel
s <1
5000
to
nn
esd
ead
wei
gh
t
0
50
100
150
200
250
Nu
mb
er o
f vo
yag
es b
y ve
ssel
s >1
5000
to
nn
esd
ead
wei
gh
t
<15000 tonnes dead w eight
>15000 tonnes dead w eight
5.4 EMERGENCY RESPONSE AND RESCUE VESSELS
HSE made a further request of the MARSTATS in an attempt to quantity the number and extent of commercial cargo being carried on ERRV.
Shipping lines or agents are required to supply details of the cargo carried to/from U.K. ports by ERRV in just the same manner as for all other vessels and data analysis was undertaken using information about the identity of ERRV provided by HSE. It is understood that ERRV vessel identities, in the form of their LRN, was provided to HSE via a recent research project. MARSTATS was interrogated using the LRN provided by HSE to determine how many of the ERRV had also been reported as carrying commercial cargo to or from the UKCS.
The results of the search produced a total of 17 different vessels having made a total of 154 voyages into a U.K. port from the UKCS and 176 outward voyages. A total of 5703 tonnes of predominantly general cargo was brought into the U.K. and 7382 tonnes was taken out to the UKCS. A listing of these, detailing the number of voyages, the year and quarter when the voyage occurred, the U.K. port where the vessel arrived at or sailed from, whether it was inwards or outwards and the type and tonnage of cargo, is presented in Appendix C.
A graphical representation of the comparison of ports used for ERRV vessels when carrying commercial cargo is presented in Figure 28. This demonstrates that in terms of both the number of voyages and cargo tonnage Great Yarmouth is the most usual port of loading/discharge for ERRV while Aberdeen is the second most usual.
49

Figure 28: ERRV carrying commercial cargo between U.K. ports and UKCS
0
20
40
60
80
100
120
140
160
180
200
Aberdeen Great Yarmouth Heysham Immingham Liverpool Peterhead Bay
U.K. port
Nu
mb
er o
f vo
yag
es
0
1000
2000
3000
4000
5000
6000
7000
Car
go
to
nn
age
Voyages
Tonnage
50

6 ‘Near Miss’ Information
6.1 INTRODUCTION
In the 1997 review of the database the view was put forward that a large body of anecdotal evidence exists to suggest that ‘near misses’ occur frequently in all areas of the UKCS which, in the context of that report, was defined as an infringements of the 500 metre safety zone. At the time it was also concluded that a more comprehensive reporting of such incidents by surface installations would lead to a better understanding of the magnitude of the problem and may well lead to conclusions about the causation factors involved. In this respect, the causation factors for ‘near misses’ could well be similar to those resulting in a “passing vessel” collision as in many cases it is believed that these occurrences are the result of poor watchkeeping on board the vessel or the failure to recover from a dangerous situation.
In an attempt to develop a better understanding of the ‘near miss’ situation a number of new initiatives have been implemented in the period between the compilation of the 1997 review and this report:
• HSE ‘Orion’ system using search keyword “POS COLLISION OFF" (28 incidents – 14 classified as ‘near miss’ – 14 classified as not ‘near miss’)
• HSE ‘Orion’ system SZI section and OIR9A reports (59 incidents – not possible to determine whether ‘near miss’)
• ERRVA Warning Off Reports (246 incidents – not possible to determine whether ‘near miss’)
In the period between 1996 and 1999 HSE (OD) Legal and Strategy Team were responsible for Safety Zone Infringement Database (SZI), however since 1999 HSE Inspection Teams have been responsible for collating safety zone infringement information within their jurisdictions.
Furthermore, HSE have recently revisited their definition of the term ‘near miss’ and determined that only incidents that lead to the activation of any part of the Duty Holder’s Emergency Response Plan should be classified as a ‘near miss’. This is a better criterion for definition than, for example, one that refers to an approaching vessel’s closest point of approach (CPA) because of the different external factors and circumstances prevalent in different areas of the UKCS. The busier waters of the Southern North Sea will lead to many more close approaches by vessels than West of Shetlands where a potentially errant vessel may cause alarm more readily because it is a relatively rare event.
Although the reporting routes outlined above have led to an increasing amounts of reports being received by HSE and ERRVA, many of which yield important information about an event, it is somewhat debatable whether all should be classified as a ‘near miss’ within the confines of the recent definition. Some of the doubt is centred on the inability to determine whether an installation’s Emergency Response Plan was activated purely from the information contained within the report; this is particularly true for the ERRVA
51

Warning Off Reports which it appears are completed and filed by the ERRV without recourse to the installation.
Bearing this in mind, it is therefore not straightforward to compile an accurate overview of the magnitude of the ‘near miss’ situation when so few of the reports contain information enabling the occurrence to be determined. However, for the purposes of data analysis, it has been decided to assess the records where it was possible to determine if a ‘near miss’ occurred separately from those where it was not, i.e. data in Section 6.2 was analysed separately from that in Sections 6.3 and 6.4.
6.2 ‘ORION’ USING KEYWORD “POS COLLISION OFF"
So far as being able to determine whether a ‘near miss’ actually occurred using the new definition, the information gathered by HSE and stored on the ‘Orion’ system using the keyword “POS COLLISION OFF" forms a better guide. This is because the amount of free text permitted in the report enables a good assessment of whether a '‘near miss'’ actually occurred even though it may not be explicit.
A search produced 28 records that were found to be relevant to the scope of this report, though several others were produced that were considered beyond the scope, for example reports of helicopter collisions offshore. From the reports it was possible to determine that 14 incidents had occurred where part of the Duty Holder’s Emergency Response Plan would have been activated.
A more extensive analysis of this data is contained in Section 6.5. A complete list of the data from the 28 records of the ‘near miss’ database, beginning on 17 June 1996 and ending on 15 October 2001, is contained in Appendix D.
6.3 ‘ORION’ SZI SECTION AND OIR9A REPORTS
Information from these sources, particularly the OIR9A forms are submitted by installations and are primarily a factual account of an event that may be used for follow up enforcement activities. Data in the SZI section of ‘Orion’ appears to come from the OIR9A forms however the narrative section of the entry is somewhat limited. However, by inspection of the relevant original OIR9A form it is possible to develop a full understanding of events.
Analysis of this data is contained in Section 6.6. A list of the data from the 59 records of the SZI section of ‘Orion’ and the OIR9A reports, beginning on 29 December 1995 and ending on 24 February 2000, is contained in Appendix E.
6.4 ERRVA WARNING OFF REPORTS
Although the ERRVA Warning Off Reports appear to be less helpful in assessing ‘near misses’, they do offer some important information about other factors that perhaps is beyond the scope of their original intention. Primarily, data may be developed about the
52

efficiency of ERRV radar under different environmental conditions as the data provides the range of first detection of an approaching vessel.
The absence of qualitative data concerning the whether an incident was a ‘near miss’ within the HSE definition should not be seen as a criticism of the ERRVA members or their vessel crews, rather than of the Warning Off Report forms they complete. Apart from a short section about what prompted the warning off action, whether on the vessel’s own initiative or at an OIM’s request, there is very little information about EERV/platform interaction prior to, during, or after an event.
A further area in which the ERRVA Warning Off Report may be used to provide meaningful data is if information about the range from the installation at which an approaching vessel took avoiding action. Such information would be useful to both Duty Holders and the HSE in their development of procedure to manage collision risk.
Analysis of this data is contained in Section 6.6. A list of the data from the 246 records of the EERVA Warning Off Reports, beginning on 17 April 2001 and ending on 6 January 2002, is contained in Appendix F.
6.5 ANALYSIS OF ‘NEAR MISS’ DATA (POS COLLISION OFF)
The relatively small number of incidents under this heading has resulted in the data being presented in tabular format.
Table 25: ‘Near Miss’ Data Analysis 'Near Miss' Not 'Near Miss'
Number of reports 14 14
Northern North Sea 2 14.29% 3 21.43% Central North Sea 2 14.29% 4 28.57%
Sector Southern North Sea 5 35.71% 4 28.57% Morecambe Bay 1 7.14% 0 0.00% West of Shetlands 0 0.00% 1 7.14% Unspecified 4 28.57% 2 14.29% Anchor Handler 0 0.00% 1 7.14% Barge 2 14.29% 0 0.00% Cargo 1 7.14% 0 0.00%
Threatening Diver Support 0 0.00% 2 14.29% vessel Fishing 3 21.43% 1 7.14% type Research 0 0.00% 1 7.14%
Stand By 0 0.00% 3 21.43% Supply 1 7.14% 3 21.43% Tanker 3 21.43% 3 21.43% Unspecified 4 28.57% 0 0.00% Less than 500 2 14.29% 1 7.14% 500 - 1500 2 14.29% 3 21.43%
Threatening 1500 - 5000 0 0.00% 5 35.71% vessel 5000 - 15000 1 7.14% 0 0.00% size 15000 - 50000 2 14.29% 0 0.00%
Over 50000 0 0.00% 2 14.29% Unspecified 7 50.00% 3 21.43% 00:00 to 04:00 1 7.14% 1 7.14% 04:00 to 08:00 3 21.43% 2 14.29%
Time 08:00 to 12:00 3 21.43% 2 14.29% of 12:00 to 16:00 3 21.43% 2 14.29% incident 16:00 to 20:00 0 0.00% 4 28.57%
20:00 to 24:00 4 28.57% 3 21.43% Unspecified 0 0.00% 0 0.00%
53

6.6 ANALYSIS OF SZI AND ERRVA DATA
6.6.1 Number of reports • Total reports from SZI/OIR9A 59 records • Total reports from ERRVA 246 records
6.6.2 Number of ERRV reporting (ERRVA data only) • Total ERRV in UKCS fleet 146 vessels • Total ERRVA reporting 32 vessels
The UKCS EERV fleet has been determined from the output from the HSE’s recently completed DC Deployment Database project. The actual number of vessels in use at any time will probably differ from this total because of vessel lay-ups, out of service for repairs, scrapping or sale and removal from the UKCS. An accurate number for the UKCS fleet and hence the percentage of vessels reporting can be obtained from ERRVA.
6.6.3 Number of serious warnings (ERRVA data only) • The criterion for this is where no 8 records
communications were established
The inclusion of this data is somewhat subjective. With the current format of ERRVA warning off reporting there is little to rank what should be considered a ‘serious’ incident compared to other events.
6.6.4 Reports by geographical location (combined data) • Northern North Sea 63 records • Central North Sea 83 records • Southern North Sea 120 records • Morecambe Bay 21 records • Unspecified 18 records
54
Figure 29: Warning Off Reports by geographical location
0
20
40
60
80
100
120
140
Northern North Sea Southern North Sea Morecambe Bay Unspecified
Geographical location
Nu
mb
er o
f in
cid
ents
Central North Sea

6.6.5 Type classification of threatening vessel (combined data) • Total reports of Cargo vessels 89 records • Total reports of Derrick Barges 1 record • Total reports of Diver Support vessels 2 records • Total reports of Drilling vessels 1 record • Total reports of Fishery Protection vessels 1 record • Total reports of Fishing vessels 141 records • Total reports of Passenger vessels 1 record • Total reports of Research vessels 1 record • Total reports of Sail Training vessels 3 records • Total reports of Stand By vessels 2 records • Total reports of Supply vessels 24 records • Total reports of Tankers 14 records • Total reports of Tugs 2 records • Total reports of Yachts 13 records • Total reports of Unspecified vessels 10 records
6.6.6 Gross registered tonnage of threatening vessels (combined data) • Gross tonnage less than 500 g.r.t. 57 records • Gross tonnage between 500 – 1500 g.r.t. 36 records • Gross tonnage between 1500 – 5000 g.r.t. 79 records • Gross tonnage between 5000 – 15000 g.r.t. 10 records • Gross tonnage between 15000 – 50000 g.r.t. 2 records • Gross tonnage greater than 50000 g.r.t. 2 records • Unspecified gross tonnage 119 records
Figure 30: Gross registered tonnage of threatening vessel
0
20
40
60
80
100
120
140
<500 500 - 1500 1500 - 5000 5000 - 15000 >50000 Unspecified
Gross registered tonnage
Nu
mb
er o
f ve
ssel
s
15000 - 50000
55

6.6.7 Radar range at first detection (ERRVA data only) • First detection at less than 2.0 miles 5 records • First detection between 2.0 to 4.0 miles 10 records • First detection between 4.0 to 6.0 miles 32 records • First detection between 6.0 to 8.0 miles 76 records • First detection between 8.0 to 10.0 miles 42 records • First detection at greater than 10.0 miles 59 records • Unspecified range of first detection 22 records
Figure 31: Radar range at first detection
0
10
20
30
40
50
60
70
80
<2.0 miles 2.0 - 4.0 miles 4.0 - 6.0 miles 8.0 - 10.0 miles Unspecified
Range at first detection
Nu
mb
er o
f in
cid
ents
6.0 - 8.0 miles >10.0 miles
6.6.8 Radar range at first detection in prevailing sea condition (ERRVA data only) Data in Figure 32 appears as it does because of the normal seagoing practice of reporting the sea condition to the nearest 0.5 metre of wave height. Indeed, it is considered extremely difficult to be even more precise when attempting to determine the wave height from a vessel’s deck or bridge when the vessel is rolling/pitching in a seaway.
Bearing the foregoing in mind, there appears not to be a clearly discernible trend from an analysis of this data. Radar detection range was in most cases good regardless of the prevailing sea condition although if further analysis was undertaken, particularly with respect to the size, type, construction material and aspect of the target vessel, better information may be available. For example, the detection of large, angular, steel vessels, such as car carriers or container vessels will inevitably be better at longer ranges and in worse weather conditions than the detection of smaller fibreglass or wooden fishing vessels at shorter ranges and in less severe weather.
56

Figure 32: Radar range at first detection in prevailing sea condition
0.0
2.0
4.0
6.0
8.0
10.0
12.0
14.0
16.0
18.0
0.0 1.0 2.0 3.0 4.0 5.0 6.0 Sea condition (metres)
Ran
ge
at f
irst
det
ecti
on
(m
iles)
6.6.9 Range at closest point of approach (combined data) • CPA less than 0.5 mile 169 records • CPA between 0.5 - 1.0 mile 62 records • CPA between 1.0 - 2.0 miles 53 records • CPA between 2.0 - 3.0 miles 5 records • CPA greater 3.0 miles 1 record • Unspecified CPA 15 records
Figure 33: Range at closest point of approach
0
20
40
60
80
100
120
140
160
180
<0.5 miles 0.5 - 1.0 mile 1.0 - 2.0 miles 2.0 - 3.0 miles >3.0 miles Unspecified
Closest point of approach
Nu
mb
er o
f in
cid
ents
57
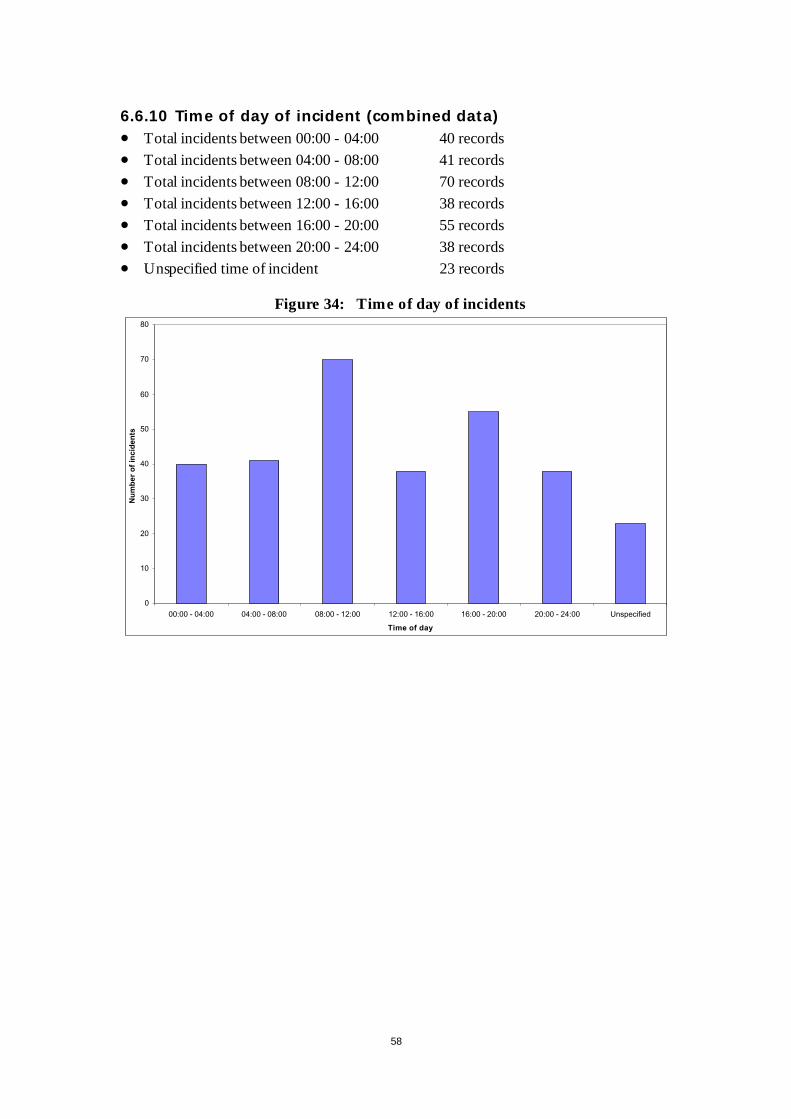
6.6.10 Time of day of incident (combined data) • Total incidents between 00:00 - 04:00 40 records • Total incidents between 04:00 - 08:00 41 records • Total incidents between 08:00 - 12:00 70 records • Total incidents between 12:00 - 16:00 38 records • Total incidents between 16:00 - 20:00 55 records • Total incidents between 20:00 - 24:00 38 records • Unspecified time of incident 23 records
Figure 34: Time of day of incidents
0
10
20
30
40
50
60
70
80
00:00 - 04:00 04:00 - 08:00 08:00 - 12:00 12:00 - 16:00 16:00 - 20:00 20:00 - 24:00 Unspecified
Time of day
Nu
mb
er o
f in
cid
ents
58

7 Conclusion
The database contains a compilation of ship/platform collision data from several widely differing sources and as such probably represents the most complete record of collision incidents on the UKCS.
Data interpretation should be carried out with caution as it is highly likely that some degree of under reporting of incidents has occurred. Primarily this is thought be of those incidents where little or no damage resulted to the installation, however, may also include more serious incidents to normally unattended installations.
Bearing in mind the likely confidence with which the database should be viewed, it is important to stress that it represents the “best case” so far as the frequency of incidents is concerned. In reality it is likely that the frequency of incidents which result in less serious damage should be higher than indicated in this report. In more recent years it is believed that a much higher degree of accuracy has been achieved, particularly for more serious incidents, such that it provides a useful starting point from which to address the issue of vessel collision and its mitigation.
Due to their increasing usage over the last decade and as the data set has expanded and an analysis of accidents involving FPSO and FSU was carried out. Although only 10 incidents have been reported, oil transfer to a shuttle tanker was the operating circumstance on 3 occasions. The point of note with these incidents was the potential for seriousness. Shuttle tankers are predominantly large vessels and even a slow speed collision can have very serious consequences because of the kinetic energy involved. In mitigation, it is believed that shuttle tankers have a high degree of sophistication in their manoeuvring and propulsion equipment and properly trained, experienced and certified crew therefore the likelihood of a incident may be less than for other vessels that routinely approach FPSO and FSU.
At HSE’s request a number of other analyses have been undertaken. These have utilised data from the Maritime Statistics Collection Agency (MARSTATS) and primarily dealt with the number and size of commercial cargo carrying vessels that may have cause to be in and around offshore installations on the UKCS. While it is likely that the figures presented are an understatement of the actual number, they do go some way in at least beginning to quantify the population of vessels that UKCS installations may encounter.
Separately, but using the same MARSTATS data source, information was developed about the extent of cargo carrying activities on EERV between U.K. ports and the UKCS. While not strictly within the scope of the update to the ship/platform collision database as the vessels could be expected to be in the vicinity of the installations, it will give HSE some information about how widespread this newly adopted and growing activity has become when before all that existed was anecdotal evidence.
One of the conclusions of the 1997 report suggested that “A more comprehensive reporting of ‘near misses’ by surface installations would lead to a better understanding of the magnitude of the problem, and may well lead to conclusions about the causation
59

factors involved.” Since the last update of the ship/platform collision incident database a larger data set of ‘near miss’ incidents has been collated by both the HSE and, since April 2001, by ERRVA. The latter source of data should more properly be considered as ‘warning off’ because it contains little to independently support the new definition of a ‘near miss’, i.e., when any part of an installation’s emergency response plan is activated. Notwithstanding this, the ‘warning off’ data is still valuable in it’s own right as it helps to:
• Quantify the amount of potentially errant traffic. • Provide information on the range at which approaching vessels may take avoiding
actions. • Outline the effectiveness of radio contact or other means to warn of installation’s
presence.
This report has addressed the issue of near misses in more detail than in previous issues and concluded that the data set of such incidents is increasing. Even though the definition of a ‘near miss’ has been made clearer there were still 14 such events. These ranged in severity from a precautionary mustering of personnel to an actual downmanning of an installation.
Data from other sources such as the Canadian and United States Coast Guards that were included in the previous version of the database have been removed. Unfortunately, when the database was last updated differences in the method of presentation and in the amount and diversity of data prevented a full analysis so it was decided to not include it in the report on this occasion.
60

8 References
1. National Maritime Institute Ltd., “Collision of Attendant Vessels with Offshore Installations Part 1. General Description and Principal Results”, Offshore Technology Report OTH 84 208, 1985.
2. National Maritime Institute Ltd., “Collision of Attendant Vessels with Offshore Installations Part 2. Detailed Calculations”, Offshore Technology Report OTH 84 209, 1985.
3. International Association of Drilling Contractors (IADC) “IADC MODI Accident Survey Boat Collisions in the North Sea”, Interim Report to NEW Committee, May 1984.
4. Revision of Offshore Collision Incident Database for the Health and Safety Executive, Advanced Mechanics and Engineering Limited (AME), (Project 2661).
5. Marine Technology Support Unit, MaTR0321 “Update of Collision Incident Database”, (1995)”.
6. Marine Technology Support Unit, MaTR0447 “Update of Collision Incident Database”, (1997)”.
7. Marine Incident Database, Marine Accident Investigation Branch, Department of Transport.
8. ‘Orion’ Safety System, Offshore Safety Division of Health & Safety Executive.
9. World Offshore Accident Database.
10. Anchor Handling Tugs and Supply Vessels of the World, Oilfield Publications Limited. ISBN 1 870945 68 9.
11. Stand-by Vessels of the World, Oilfield Publications Limited. ISBN 1 870945 24.
12. Lloyd’s Maritime Directory 1986, Lloyds of London Press Ltd. ISBN 1- 85044076 X.
13. Marine Technology Support Unit, Draft Report MaTR 0141 “Review of the Offshore Collision Incident Database and Report.
14. Lloyd’s Register of Shipping, “Study of Major Damage to UK Fixed Steel Platform Jackets”, Offshore Technology Report OTN 92 235, 1992.
15. Casualty Database, Lloyds Maritime Information Service.
16. ‘SUN’ Safety System, Offshore Safety Division of Health & Safety Executive.
17. Billington Osborne-Moss Engineering Limited - Drawing No. C/587/R002.22.
61

18. http://www.search.rigzone.com
19. de la Mare, R.F. and Anderson, O, “Pipeline Reliability”, Veritas Report 80-0572,Oslo, 1980, pp. 51-52.
20. “Protection of Offshore Installations Against Impact”, Offshore TechnologyReport OTN 88 235, 1988.
62

Appendices
CONTENTS
Appendix A Ship/Platform Collision Incident Database – Passing Vessels Appendix A Ship/Platform Collision Incident Database – Attendant Vessels Appendix B Commercial Shipping Between UKCS and U.K. Appendix C Commercial Cargo on Emergency Response and Rescue Vessels Appendix D ‘Near Miss’ Database Appendix E Safety Zone Infringement List Appendix F ERRVA Warning Off Reports
63
App
endi
x A
Sh
ip/P
latf
orm
Col
lisio
n In
cide
nt D
atab
ase
Pass
ing
Ves
sel C
ollis
ions
64

Con
sec.
N
o.
Info
rmat
ion
Sour
ce
Dat
e (d
d/m
m/y
r)
Yea
r M
onth
Lo
catio
n In
stal
latio
n T
ype
Impa
ct
Ves
sel T
ype
Impa
ct
Ori
enta
tion
Sea
Con
ditio
n
Ves
sel
Spee
d (k
nots
) O
pera
ting
Cir
cum
stan
ces
Prim
ary
Cau
se
Impa
ct P
oint
In
stal
latio
n D
amag
e St
iffen
er
Dam
age
Plat
e D
ents
Inst
alla
tion
Dam
age
Cla
ss
PASS
ING
VES
SEL
CO
LLIS
ION
S
1 D
En
26/0
6/85
19
85
June
So
uthe
rn
Fixe
d St
eel
Supp
ly
Bow
C
alm
13
Pa
ssin
g Su
pply
Ves
sel
Post
/Ope
ratio
n N
egle
cted
D
iago
nal B
race
B
end
and
Den
ts
-Y
es
Seve
re
2 D
En
23/0
6/88
19
88
June
So
uthe
rn
Jack
-Up
Mer
chan
t C
argo
B
ow
--
Pass
ing
Car
go V
esse
l Po
st/O
pera
tion
Neg
lect
ed
Leg
Cho
rd
Seve
red
Yes
Y
es
Seve
re
3 D
En
21/0
7/81
19
81
July
So
uthe
rn
Fixe
d St
eel
Fish
ing
Bow
1
5 Pa
ssin
g Fi
shin
g V
esse
l Po
st/O
pera
tion
Neg
lect
ed
Land
ing
Stat
ion
Den
t -
No
Min
or
4 D
En
05/0
7/83
19
83
July
So
uthe
rn
Fixe
d St
eel
Mer
chan
t C
argo
Si
de
Cal
m
10
Pass
ing
Car
go V
esse
l Po
st/O
pera
tion
Neg
lect
ed
Oth
er S
tbd.
Sid
e M
inor
-
-M
inor
5 D
En
26/0
8/84
19
84
Aug
ust
Sout
hern
Fi
xed
Stee
l Fi
shin
g B
ow
--
Pass
ing
Fish
ing
Ves
sel
Post
/Ope
ratio
n N
egle
cted
Fe
nder
Fe
nder
-
-M
inor
6 H
SE
15/0
1/95
19
95
Janu
ary
Sout
hern
Fi
xed
Stee
l Fi
shin
g -
3.5
-Pa
ssin
g Fi
shin
g V
esse
l Po
st/O
pera
tion
Neg
lect
ed
Leg
B2
Min
or
No
No
Min
or
7 D
En
16/0
2/84
19
84
Febr
uary
So
uthe
rn
Jack
-Up
Fish
ing
Bow
-
-Pa
ssin
g Fi
shin
g V
esse
l Po
st/O
pera
tion
Neg
lect
ed
Leg
Rig
ging
N
one
No
No
Non
e
8 D
En
20/0
3/88
19
88
Mar
ch
Sout
hern
Ja
ck-U
p Fi
shin
g -
--
Pass
ing
Fish
ing
Ves
sel
Post
/Ope
ratio
n N
egle
cted
Le
g C
hord
N
one
No
No
Non
e
65

Con
sec.
N
o.
Inst
alla
tion
Dam
age
Det
ails
Rep
aire
d R
epai
r Det
ails
Ves
sel
Dam
age
Cla
ss
Ves
sel D
amag
e D
etai
ls O
ther
So
urce
C
onfir
ms
PASS
ING
VES
SEL
CO
LLIS
ION
S
1 Im
pact
ed h
oriz
onta
l and
ver
tica
l cro
ss b
race
on
row
2 b
etw
een
legs
A2
and
B2,
sev
ere
bend
(up
to 2
0") i
n br
ace
mem
ber
at -
18' t
o +
27' l
evel
s and
slig
ht b
end
(7")
to h
oriz
onta
l br
ace
at +
27'.
Min
or d
ents
in w
ay.
Yes
C
ompl
ete
repl
acem
ent o
f upp
er h
alf v
erti
cal c
ross
bra
ce o
n ro
w 2
. Box
pla
ting
of d
ente
d ar
eas.
Se
vere
Se
vere
dam
age
to s
tarb
oard
sid
e of
bow
(cr
ushi
ng o
f pl
atin
g/fr
ames
). P
roce
eded
to
port
fo
r re
pair
s.
HSE
, LM
IS,
OT
N 9
2 23
5 &
BO
ME
L
2 Se
vere
dam
age
to a
5.5
m s
ectio
n of
1 le
g re
nder
ed h
elid
eck
unsa
fe a
nd p
erso
nnel
had
to
be e
vacu
ated
. Y
es
70 to
nnes
stee
lwor
k re
new
ed.
Seve
re
Fore
cast
le a
bove
wat
erlin
e, w
indl
ass d
estr
oyed
and
1 a
ncho
r lo
st.
HSE
, W
OA
D &
LM
IS
3 V
ertic
al m
embe
r of
boa
t lan
ding
stag
e be
nt 0
.9 m
out
ove
r 1.
2 -
1.5
m.
--
Seve
re
Bow
s sto
ve in
. H
SE
4 Sl
ight
dam
age.
-
-M
inor
A
ft p
ort s
ide
at 5
m a
bove
wat
erlin
e.
HSE
& L
MIS
5 B
oat
fend
er r
ippe
d of
f no
rth-
wes
t le
g, d
amag
e to
cel
lar
deck
dra
in l
ine,
tor
n m
oori
ng
rope
. -
-M
inor
D
ent i
n tr
awle
r.
HSE
6 5'
2 pa
int s
crap
ed o
ff le
g B
2.
--
Mod
erat
e U
nspe
cifie
d hu
ll da
mag
e in
clud
ing
leak
s in
star
boar
d di
esel
tank
. W
OA
D
7 -
No
-Se
vere
W
oode
n bo
ws c
aved
-in,
taki
ng in
wat
er.
HSE
8 Im
pact
at +
55m
leve
l, no
dam
age.
N
o -
Non
e -
-
66

App
endi
x A
Sh
ip/P
latf
orm
Col
lisio
n In
cide
nt D
atab
ase
Att
enda
nt V
esse
l Col
lisio
ns
67

Con
sec.
N
o.
Info
rmat
ion
Sour
ce
Dat
e (d
d/m
m/y
r) Y
ear
Mon
th
Loca
tion
Inst
alla
tion
Typ
e Im
pact
V
esse
l Typ
e Im
pact
O
rien
tatio
n Se
a C
ondi
tion
Ope
ratin
g C
ircu
mst
ance
s Pr
imar
y C
ause
Im
pact
Poi
nt
Inst
alla
tion
Dam
age
Stiff
ener
D
amag
e Pl
ate
Den
ts In
stal
latio
n D
amag
e C
lass
AT
TEN
DA
NT
VES
SEL
CO
LLIS
ION
S
9 D
En
29/0
8/75
19
75
Aug
ust
Cen
tral
Fi
xed
Stee
l Su
pply
B
ow
1.5
App
roac
hing
Ins
talla
tion
P
ost/
Ope
ratio
n N
egle
cted
D
iago
nal B
race
Se
vere
d an
d B
ent
No
Yes
Se
vere
10
DE
n 12
/04/
77
1977
A
pril
Sout
hern
Fi
xed
Stee
l A
ncho
r H
andl
er
--
-M
isju
dgem
ent
Dia
gona
l Bra
ce
Seve
red
and
Tea
r N
o N
o Se
vere
11
DE
n 05
/11/
77
1977
N
ovem
ber
Sout
hern
Se
mi-
Subm
ersi
ble
Acc
omm
odat
ion
Supp
ly
Ster
n -
Car
go T
rans
fer
Wea
ther
Con
ditio
ns
Dia
gona
l Bra
ce
Seve
red
and
Cra
ck
No
Yes
Se
vere
12
OT
N 9
2 23
5 19
80
1980
-
Sout
hern
Fi
xed
Stee
l -
--
--
Fend
er
Seve
red
and
Wel
d C
rack
N
o N
o Se
vere
13
WO
AD
15
/05/
80
1980
M
ay
Cen
tral
Se
mi-
Subm
ersi
ble
Pro
duct
ion
Supp
ly
--
Car
go U
nloa
ding
-
Col
umn
-N
o N
o Se
vere
14
DE
n 02
/06/
80
1980
Ju
ne
Sout
hern
Fi
xed
Stee
l Su
pply
St
ern
1.0
App
roac
hing
Ins
talla
tion
C
lutc
h Fa
ilure
D
iago
nal B
race
Se
vere
d an
d W
eld
Cra
ck
No
No
Seve
re
15
WO
AD
18
/12/
80
1980
D
ecem
ber
-Se
mi-
Subm
ersi
ble
Dri
lling
Su
pply
-
5.0
Car
go T
rans
fer
Stee
ring
Fai
lure
C
olum
n S-
2 B
end
with
Tea
r Y
es
Yes
Se
vere
16
DE
n 03
/10/
81
1981
O
ctob
er
Cen
tral
Se
mi-
Subm
ersi
ble
Dri
lling
Su
pply
-
4.0
Car
go T
rans
fer
-D
iago
nal B
race
C
3 D
ent
No
Yes
Se
vere
17
DE
n 16
/07/
83
1983
Ju
ly
Sout
hern
Fi
xed
Stee
l Su
pply
B
ow
-A
ppro
achi
ng I
nsta
llatio
n E
ngin
e C
ontr
ol F
ailu
re
Dia
gona
l Bra
ce
Ben
d w
ith H
ole
No
Yes
Se
vere
18
DE
n 05
/01/
85
1985
Ja
nuar
y C
entr
al
Sem
i-Su
bmer
sibl
e D
rilli
ng
Supp
ly
Ster
n -
Car
go U
nloa
ding
D
.P. O
pera
tor
Err
or
Col
umn
Stbd
. C
entr
e D
ent w
ith C
rack
Y
es
Yes
Se
vere
19
DE
n 10
/01/
85
1985
Ja
nuar
y So
uthe
rn
Fixe
d St
eel
Supp
ly
Ster
n 2.
0 C
argo
Unl
oadi
ng
Wea
ther
Con
diti
ons
Dia
gona
l Bra
ce
Den
t with
Wel
d C
rack
N
o N
o Se
vere
20
DE
n 26
/09/
85
1985
Se
ptem
ber
Cen
tral
Se
mi-
Subm
ersi
ble
Mob
ile S
uppo
rt
Supp
ly
--
App
roac
hing
Ins
talla
tion
M
isju
dgem
ent b
y P
oor
Vis
ibili
ty
Col
umn
PA
D
ent
Yes
Y
es
Seve
re
21
DE
n 12
/10/
90
1990
O
ctob
er
Cen
tral
Se
mi-
Subm
ersi
ble
Dri
lling
Su
pply
-
-C
argo
Tra
nsfe
r -
Col
umn
CP
C4
Den
t with
Hol
e N
o Y
es
Seve
re
22
DE
n 05
/01/
91
1991
Ja
nuar
y So
uthe
rn
Fixe
d St
eel
Stan
d-B
y St
bd. S
ide
3.0
App
roac
hing
Ins
talla
tion
M
isju
dgem
ent
Dia
gona
l Bra
ce
Seve
red
and
Cra
ck
Yes
Y
es
Seve
re
23
DE
n 19
/04/
92
1992
A
pril
-Se
mi-
Subm
ersi
ble
Dri
lling
Su
pply
-
-A
ncho
r H
andl
ing
Mis
judg
emen
t -
Uns
peci
fied
No
No
Seve
re
24
OT
N 9
2 23
5 19
75
1975
-
Sout
hern
Fi
xed
Stee
l -
--
--
-B
end
wit
h W
eld
Cra
ck
No
No
Mod
erat
e
25
OT
N 9
2 23
5 19
75
1975
-
Sout
hern
Fi
xed
Stee
l -
--
--
Hor
izon
tal B
race
B
end
with
Wel
d C
rack
N
o N
o M
oder
ate
26
OT
N 9
2 23
5 19
75
1975
-
Sout
hern
Fi
xed
Stee
l -
--
--
-W
eld
Cra
ck
No
No
Mod
erat
e
27
DE
n 20
/09/
75
1975
Se
ptem
ber
Cen
tral
Ja
ck-U
p Su
pply
-
--
--
Den
t with
Cra
ck
Yes
Y
es
Mod
erat
e
28
NM
I 19
76
1976
N
ovem
ber
Sout
hern
Fi
xed
Stee
l Su
rvey
Si
de
3.0
-E
ngin
e C
ontr
ol F
ailu
re
-U
nspe
cifie
d N
o N
o M
oder
ate
29
DE
n 14
/08/
76
1976
A
ugus
t N
orth
ern
Sem
i-Su
bmer
sibl
e D
rilli
ng
Supp
ly
Bow
-
-M
isju
dgem
ent
Col
umn
P2/
3 D
ent w
ith H
ole
Yes
Y
es
Mod
erat
e
30
OT
N 9
2 23
5 19
77
1977
-
Sout
hern
Fi
xed
Stee
l -
--
--
-Se
vere
d N
o N
o M
oder
ate
31
OT
N 9
2 23
5 19
77
1977
-
Sout
hern
Fi
xed
Stee
l -
--
--
-B
end
wit
h W
eld
Cra
ck
No
No
Mod
erat
e
32
OT
N 9
2 23
5 19
77
1977
-
Sout
hern
Fi
xed
Stee
l -
--
--
-W
eld
Cra
ck
No
No
Mod
erat
e
33
DE
n 11
/02/
77
1977
Fe
brua
ry
Nor
ther
n Se
mi-
Subm
ersi
ble
Acc
omm
odat
ion
Supp
ly
--
--
-Li
febo
at
No
No
Mod
erat
e
34
DE
n 18
/02/
77
1977
Fe
brua
ry
-Se
mi-
Subm
ersi
ble
Acc
omm
odat
ion
Supp
ly
Ster
n 4.
5 C
argo
Unl
oadi
ng
Eng
ine
Con
trol
Fai
lure
C
olum
n P
C2
Den
t with
Hol
e Y
es
Yes
M
oder
ate
35
DE
n 19
/04/
77
1977
A
pril
Sout
hern
Fi
xed
Stee
l St
and-
By
--
App
roac
hing
Ins
talla
tion
M
isju
dgem
ent
Dia
gona
l Bra
ce
Ben
d N
o N
o M
oder
ate
36
DE
n 23
/04/
77
1977
A
pril
Nor
ther
n Se
mi-
Subm
ersi
ble
Dri
lling
St
and-
By
Ster
n 3.
3 A
ppro
achi
ng I
nsta
llati
on
Mis
judg
emen
t C
olum
n C
1 B
end
and
Den
t Y
es
Yes
M
oder
ate
37
NM
I 19
78
1978
D
ecem
ber
Cen
tral
Se
mi-
Subm
ersi
ble
Dri
lling
Su
pply
B
ow
--
Aut
opilo
t Fa
ilure
-
Uns
peci
fied
No
No
Mod
erat
e
38
NM
I 19
78
1978
D
ecem
ber
Nor
ther
n Fi
xed
Stee
l Su
pply
St
ern
3.5
Car
go T
rans
fer
--
Uns
peci
fied
No
No
Mod
erat
e
39
OT
N 9
2 23
5 19
78
1978
-
Sout
hern
Fi
xed
Stee
l -
--
--
Cro
ss B
race
W
eld
Cra
ck
No
No
Mod
erat
e
40
DE
n 10
/01/
78
1978
Ja
nuar
y -
Sem
i-Su
bmer
sibl
e D
rilli
ng
Supp
ly
Ster
n 3.
3 A
ppro
achi
ng I
nsta
llati
on
Mis
judg
emen
t C
olum
n SA
D
ent w
ith H
ole
Yes
Y
es
Mod
erat
e
41
DE
n 05
/02/
78
1978
Fe
brua
ry
Sout
hern
Fi
xed
Stee
l Su
pply
-
-P
erso
nnel
Tra
nsfe
r M
isju
dgem
ent
Rise
r D
ent
No
Yes
M
oder
ate
42
DE
n 16
/06/
78
1978
Ju
ne
Nor
ther
n Se
mi-
Subm
ersi
ble
Dri
lling
Su
pply
St
ern
3.5
Car
go U
nloa
ding
M
oori
ng F
ailu
re
Col
umn
3/4
Den
t with
Hol
e N
o Y
es
Mod
erat
e
43
DE
n 05
/08/
78
1978
A
ugus
t C
entr
al
Sem
i-Su
bmer
sibl
e P
rodu
ctio
n Su
pply
-
-C
argo
Unl
oadi
ng
-C
olum
n N
o 25
D
ent w
ith W
eld
Cra
ck
Yes
Y
es
Mod
erat
e
44
NM
I 19
79
1979
O
ctob
er
Cen
tral
Se
mi-
Subm
ersi
ble
Dri
lling
Su
pply
-
3.5
App
roac
hing
Ins
talla
tion
M
isju
dgem
ent
Col
umn
C
Den
t Y
es
No
Mod
erat
e
45
BO
ME
L 19
79
1979
-
Sout
hern
Fi
xed
Stee
l -
--
--
Dia
gona
l Bra
ce
Ben
d an
d D
ent
No
Yes
M
oder
ate
46
DE
n 28
/06/
79
1979
Ju
ne
Sout
hern
Fi
xed
Stee
l Su
pply
B
ow
1.0
App
roac
hing
Ins
talla
tion
E
lect
rica
l Fai
lure
D
iago
nal B
race
B
end
and
Den
t N
o Y
es
Mod
erat
e
68

Con
sec.
N
o.
Inst
alla
tion
Dam
age
Det
ails
Rep
aire
d R
epai
r Det
ails
Ves
sel
Dam
age
Cla
ss
Ves
sel D
amag
e D
etai
ls O
ther
Sou
rce
Con
firm
s
AT
TEN
DA
NT
VES
SEL
CO
LLIS
ION
S
9 T
wo
brac
es d
amag
ed (
18"
x 0.
5" a
nd 2
0" x
0.5
").
36"
brac
e be
nt.
2 br
aces
det
ache
d (2
4" x
0.
5" a
nd 1
2" x
0.5
") a
nd b
ent t
owar
ds c
entr
e of
jack
et. 3
6" x
1.3
75"
diag
onal
torn
aw
ay.
Dam
age
betw
een
20' -
35'
leve
ls. N
on r
edun
dant
mem
ber.
Y
es
Ext
ensiv
e re
pair
nee
ded.
Bra
ce b
etw
een
row
s 3
and
4 re
plac
ed in
197
6.
Min
or
-W
OA
D, O
TN
92
235
&
BO
ME
L
10
Cro
ss b
raci
ng o
n ro
w A
at e
leva
tion
+17
' sev
ered
at A
1 an
d fe
ll of
f to
seab
ed. R
edun
dant
m
embe
r. 4
50m
m lo
ng te
ar in
leg
A1
in w
ay o
f wel
d to
bra
ce. N
on r
edun
dant
mem
ber.
Y
es
Bra
ce r
epla
ced
in 1
978.
-
-O
TN
92
235
&
BO
ME
L
11
One
end
of l
eg m
embe
r vi
rtua
lly s
ever
ed o
ther
end
had
2 x
13m
m c
rack
s in
cro
ss m
embe
r at
11
'. Y
es
Dam
aged
mem
ber
rem
oved
. -
--
12
Hor
izon
tal b
arge
bum
per
supp
ort t
orn
out o
f leg
A1
at +
9' e
leva
tion
caus
ing
wel
d cr
ack
of
tota
l 800
mm
leng
th. N
on r
edun
dant
mem
ber.
Y
es
Leg
rein
forc
ing
plat
e fit
ted
in 1
981.
-
--
13
Uns
peci
fied
seve
re d
amag
e.
Yes
T
owed
to y
ard
for
repa
ir.
--
-
14
Ver
tical
dia
gona
l and
hor
izon
tal b
race
on
row
B b
etw
een
legs
B3
and
B4
seve
red
at le
g B
3 at
20
' ele
vatio
n. H
ole
435m
m x
690
mm
(W
x L
). C
rack
s in
wel
ds o
n un
derw
ater
nod
es o
f leg
B3
for
both
bra
cing
s be
twee
n le
gs B
3 an
d B
4. N
on r
edun
dant
mem
bers
. Y
es
Mem
ber
repl
aced
and
rep
air
clam
ped
in 1
980.
-
-O
TN
92
235
&
BO
ME
L
15
14' l
ong
x 6"
dee
p ga
sh in
S-2
col
umn
at 8
4' e
leva
tion.
Rin
g fr
ame
in w
ay b
ent.
Life
boat
sm
ashe
d; d
avit
and
dec
k un
der
lifeb
oat b
ent.
Y
es
-Se
vere
U
nspe
cifie
d he
avy
dam
age.
-
16
Den
t to
2.44
m b
race
C3.
1.8
3m x
5.4
9m x
0.4
6m (H
x W
x D
). LR
S ca
se 1
/1.0
24.
Yes
U
rgen
t rep
airs
nee
ded.
Dec
ided
bra
ce d
amag
e ha
d ef
fect
ive
tota
l los
s of
com
p st
reng
th, w
ell
shut
-in
and
rig
evac
uate
d.
--
HSE
17
Bra
ce b
etw
een
legs
B2
and
B3
at +
16' e
leva
tion
clos
e to
leg
B3.
Mem
bers
ben
t inw
ards
and
do
wnw
ards
by
4' a
nd fl
atte
ned,
torn
and
dis
tort
ed b
raci
ng. H
oled
at 1
6' le
vel.
Yes
U
nder
wat
er in
spec
tion
requ
ired
plu
s M
PI
of n
ode
wel
ds. T
empo
rary
rep
air
follo
wed
by
perm
anen
t rep
air
in 1
983/
84.
--
HSE
& O
TN
92
235
18
Den
t 7"
x 8"
x 1
2" (
H x
W x
D)
at 6
5' le
vel.
4 in
tern
al s
tiffe
ners
twist
ed. R
ing
gird
er b
uckl
ed
and
frac
ture
d. B
ulkh
ead
buck
led
over
20"
. Y
es
Ren
ewal
of p
lati
ng, s
tiffe
ners
and
frac
ture
d bu
lkhe
ad.
--
HSE
19
Bra
ce b
etw
een
legs
A3
& A
4 in
dent
ed 0
.15m
x 0
.15m
x 0
.05m
(H x
W x
D) B
race
ben
t by
15".
Wel
d cr
acks
foun
d.
Yes
B
raci
ng r
epai
red
in 1
985,
MP
I in
spec
tion
of n
ode
wel
ds.
--
OT
N 9
2 23
5,
BO
ME
L &
HSE
20
Den
t of c
olum
n pl
atin
g 3.
75m
x 4
.5m
x 0
.55m
(H
x W
x D
), 3
vert
ical
stif
fene
rs b
uckl
ed, 4
da
mag
ed, 1
rin
g st
iffen
er s
ever
ely
dam
aged
. Y
es
Tem
pora
ry r
epai
rs u
nder
take
n pe
ndin
g re
pair
of b
oth
plat
ing
and
stiff
ener
s.
Mod
erat
e D
amag
e to
bre
ast p
late
, dec
k pl
ates
at b
ow fo
repe
ak h
atch
and
to fo
rem
ast.
-
21
36"
gash
in s
hell
plat
ing.
18"
- 2
4" in
dent
in s
ide
shel
l. -
--
-H
SE
22
Hor
izon
tal b
race
on
row
A b
etw
een
legs
A2
- A
3 se
vere
d at
A3
end
leav
ing
hole
, ind
ente
d 90
0mm
x 6
50m
m x
120
mm
(H x
W x
D),
bow
ed 8
0mm
. 3 o
ther
s dam
aged
. Fra
ctur
ed w
elds
on
leg
A3;
hor
izon
tal b
race
she
ared
, kne
e jo
int f
latt
ened
and
she
ared
. Red
unda
nt m
embe
r.
Yes
M
embe
r re
mov
ed le
avin
g a
1.5m
stu
b at
leg
A2.
Rep
air
plat
e in
stal
led
over
hol
e in
199
1.
Seve
re
4' -
5' g
ash
abov
e w
ater
line
in b
ow s
ectio
n. T
owed
to W
ither
nsea
by
"Bre
ydon
Eid
er"
for
tem
pora
ry r
epai
rs a
nd la
ter
to L
owes
toft
. O
TN
92
235,
W
OA
D &
LM
IS
23
Uns
peci
fied
seve
re d
amag
e. S
truc
ture
at G
reat
Yar
mou
th a
wai
ting
tow
whe
n in
cide
nt
occu
rred
. -
--
-M
AIB
24
Wel
ds o
f hor
izon
tal b
race
bet
wee
n le
gs B
4 an
d B
5 cr
acke
d at
bot
h en
ds (
B4
for
45%
ci
rcum
fere
nce,
B5
for
75%
cir
cum
fere
nce)
at +
11' e
leva
tion.
Bra
ce b
ent 9
".
Yes
M
embe
r re
plac
ed in
197
4.
--
-
25
600m
m lo
ng x
6m
m d
eep
wel
d cr
ack
on h
oriz
onta
l bra
ce o
n ro
w 1
bet
wee
n le
gs A
1 an
d B
1 at
+
7.5'
ele
vatio
n. M
embe
r bu
ckle
d by
2'.
Red
unda
nt m
embe
r.
Yes
R
epla
ced
by n
ew m
embe
r w
ith r
edes
igne
d en
d co
nnec
tions
in 1
974.
-
--
26
11"
long
wel
d cr
ack
at jo
int o
n ho
rizo
ntal
bra
ce m
embe
r on
row
A b
etw
een
legs
A3
and
A4
at
-1.5
' ele
vatio
n.
Yes
R
epla
cem
ent i
nser
t pie
ce in
198
1.
--
BO
ME
L
27
Col
lided
with
ver
tical
col
umn
No.
22,
den
t 36"
x 1
' x 2
" (L
x W
x D
). 6"
long
frac
ture
on
ring
st
iffen
er.
--
--
-
28
Uns
peci
fied
dam
age.
Y
es
--
--
29
Den
t and
inte
rnal
dam
age
to c
entr
e po
rt c
olum
n. P
latin
g pe
netr
ated
in p
ort c
entr
e co
lum
n.
--
--
-
30
Hor
izon
tal b
race
mem
ber
on r
ow B
bet
wee
n le
g B
6 an
d B
7 at
B7
pulle
d ou
t of l
eg c
an a
t +11
' el
evat
ion.
Red
unda
nt m
embe
r.
Yes
M
embe
r re
plac
ed w
ith r
edes
igne
d jo
int i
n 19
78.
--
BO
ME
L
31
14"
long
wel
d cr
ack
and
4" -
6"
bend
on
diag
onal
bra
ce m
embe
r on
row
A b
etw
een
legs
A3
and
A4
at +
38.5
' ele
vatio
n.
Yes
B
race
rep
lace
d in
198
0.
--
-
32
18"
long
wel
d cr
ack
on h
oriz
onta
l bra
ce o
n ro
w 1
bet
wee
n le
gs A
1 an
d B
1 at
+7.
5' e
leva
tion.
R
edun
dant
mem
ber.
Y
es
Cra
cks
rew
elde
d an
d sp
lit s
leev
e in
stal
led
in 1
977.
-
--
33
Dam
age
to d
eck
and
lifeb
oat b
elow
dec
k.
--
--
-
34
Den
t 3.0
5m x
3.0
5m x
0.3
m (H
x W
x D
) bet
wee
n 4'
- 6
' abo
ve w
ater
line.
3 h
oriz
onta
l st
iffen
ers
set i
n an
d di
stor
ted.
Pla
ting
frac
ture
d 50
mm
at h
oriz
onta
l stif
fene
r.
--
--
-
35
Cro
ss-m
embe
r 10
' abo
ve w
ater
line
bent
, dis
tort
ion
of s
pide
r-de
ck.
--
--
-
36
Plat
ing
dent
ed 0
.84m
x 0
.41m
x 0
.025
m (
H x
W x
D).
Stiff
ener
rin
g be
nt 5
0mm
upw
ards
and
br
oken
aw
ay fr
om p
lati
ng.
Yes
-
Min
or
Not
ser
ious
, rep
aire
d du
ring
ann
ual i
nspe
ctio
n.
-
37
Uns
peci
fied
dam
age.
Y
es
--
--
38
Uns
peci
fied
dam
age.
Y
es
--
--
39
Sign
ifica
nt c
rack
on
vert
ical
cro
ss b
race
on
row
A b
etw
een
legs
A4
(-21
' ele
vatio
n) a
nd A
3 (+
22' e
leva
tion)
. Y
es
Split
sle
eve
inst
alle
d in
197
9.
--
BO
ME
L
40
Stiff
ener
buc
kled
and
par
tially
torn
ove
r 5'
. Rin
g st
iffen
er a
t 90'
buc
kled
bet
wee
n st
iffen
ers
6 an
d 7.
8 m
m h
ole
in p
lati
ng.
--
--
-
41
Den
t in
24"
OD
x 0
.688
" W
T r
iser
0.35
6m x
0.2
5m x
0.0
37m
(H x
W x
D).
Yes
R
iser
ope
rate
d at
dow
nrat
ed p
ress
ure
pend
ing
met
allu
rgic
al r
epor
t. -
--
42
Inde
nt o
f aft
sid
e of
col
umn
3 an
d fo
re s
ide
of c
olum
n 4.
Pla
ting
pene
trat
ed.
Yes
-
Mod
erat
e T
empo
rary
rep
airs
effe
cted
, shi
p ya
rd r
epai
rs r
equi
red.
-
43
Ver
tical
stif
fene
r tw
iste
d an
d 4"
den
t on
colu
mn
No.
25,
3"
dent
on
colu
mn
No.
24.
Y
es
Slee
ve w
elde
d in
pla
ce in
198
0.
--
BO
ME
L
44
Den
t 1.7
5m x
1.7
5m x
0.1
7m (H
x W
x D
) bet
wee
n ri
ng st
iffen
ers 3
and
4. W
ebs o
n st
iffen
ers
bulg
ed, n
o cr
acks
. Y
es
--
--
45
Ver
tical
dia
gona
l bra
ce o
n ro
w A
bet
wee
n le
gs A
1 an
d A
2 in
dent
ed 1
6" x
10"
x 3
" (H
x W
x
D)
and
bent
inw
ards
by
3".
Yes
Sl
eeve
wel
ded
in p
lace
in 1
980.
-
-O
TN
92
235
46
Hor
izon
tal b
race
on
row
4 b
etw
een
legs
C4
and
D4
crac
ked,
ben
t and
inde
nted
, dam
age
to
spid
er d
eck.
Y
es
Req
uest
ed b
y LR
S. B
race
rep
lace
d in
197
9.
--
OT
N 9
2 23
5
69

Con
sec.
N
o.
47
Info
rmat
ion
Sour
ce
Dat
e (d
d/m
m/y
r) Y
ear
Mon
th
Loca
tion
Inst
alla
tion
Typ
e Im
pact
V
esse
l Typ
e Im
pact
O
rien
tatio
n Se
a C
ondi
tion
Ope
ratin
g C
ircu
mst
ance
s Pr
imar
y C
ause
Im
pact
Poi
nt
Inst
alla
tion
Dam
age
Stiff
ener
D
amag
e Pl
ate
Den
ts In
stal
latio
n D
amag
e C
lass
AT
TEN
DA
NT
VES
SEL
CO
LLIS
ION
S D
En
06/1
1/79
19
79
Nov
embe
r -
Sem
i-Su
bmer
sibl
e D
rilli
ng
Supp
ly
Ster
n 4.
0 C
argo
Unl
oadi
ng
Wea
ther
Con
diti
ons
Col
umn
CSC
4 D
ent
Yes
Y
es
Mod
erat
e
48
DE
n 14
/11/
79
1979
N
ovem
ber
Cha
nnel
Se
mi-
Subm
ersi
ble
Dri
lling
St
and-
By
Ster
n 2.
5 A
ppro
achi
ng I
nsta
llati
on
Pro
pelle
r Fa
ilure
C
olum
n B
4 D
ent
Yes
Y
es
Mod
erat
e
49
NM
I 19
/11/
79
1979
N
ovem
ber
Cen
tral
Se
mi-
Subm
ersi
ble
Dri
lling
A
ncho
r H
andl
er
Ster
n 3.
5 -
--
Uns
peci
fied
No
No
Mod
erat
e
50
NM
I 19
80
1980
M
ay
Cen
tral
Se
mi-
Subm
ersi
ble
Dri
lling
Su
pply
St
ern
2.5
Car
go T
rans
fer
Mis
judg
emen
t C
olum
n C
D
ent
Yes
Y
es
Mod
erat
e
51
NM
I 19
80
1980
O
ctob
er
Nor
ther
n Se
mi-
Subm
ersi
ble
Dri
lling
Su
pply
Si
de
6.2
Car
go T
rans
fer
--
Uns
peci
fied
No
No
Mod
erat
e
52
OT
N 9
2 23
5 19
80
1980
-
Sout
hern
Fi
xed
Stee
l -
--
--
-D
ent w
ith W
eld
Cra
ck
No
Yes
M
oder
ate
53
OT
N 9
2 23
5 19
80
1980
-
Sout
hern
Fi
xed
Stee
l -
--
-W
eath
er C
ondi
tions
-
Ben
d N
o N
o M
oder
ate
54
BO
ME
L 19
80
1980
-
Sout
hern
Fi
xed
Stee
l -
--
-W
eath
er C
ondi
tions
-
Ben
d w
ith C
rack
N
o N
o M
oder
ate
55
OT
N 9
2 23
5 19
80
1980
-
Sout
hern
Fi
xed
Stee
l -
--
--
-B
end
and
Den
t N
o Y
es
Mod
erat
e
56
DE
n 05
/05/
80
1980
M
ay
-Se
mi-
Subm
ersi
ble
Dri
lling
Su
pply
-
-A
ppro
achi
ng I
nsta
llati
on
-C
olum
n P
1 D
ent
Yes
Y
es
Mod
erat
e
57
DE
n 20
/10/
80
1980
O
ctob
er
Nor
ther
n Fi
xed
Con
cret
e Su
pply
St
ern
7.0
App
roac
hing
Ins
talla
tion
M
isju
dgem
ent
Leg
C4
Cra
cked
Con
cret
e N
o N
o M
oder
ate
58
DE
n 10
/11/
80
1980
N
ovem
ber
Nor
ther
n Fi
xed
Con
cret
e Su
pply
-
2.7
Car
go U
nloa
ding
M
oori
ng F
ailu
re
Leg
C4
Cra
cked
Con
cret
e N
o N
o M
oder
ate
59
OT
N 9
2 23
5 19
81
1981
-
Sout
hern
Fi
xed
Stee
l -
--
--
-H
ole
No
No
Mod
erat
e
60
BO
ME
L 19
81
1981
-
Sout
hern
Fi
xed
Stee
l -
--
--
Leg
Den
t N
o Y
es
Mod
erat
e
61
DE
n 10
/02/
81
1981
Fe
brua
ry
Cen
tral
Se
mi-
Subm
ersi
ble
Dri
lling
Su
pply
-
3.0
Car
go U
nloa
ding
E
ngin
e C
ontr
ol F
ailu
re
Col
umn
SC2
Den
t with
Hol
e Y
es
Yes
M
oder
ate
62
BO
ME
L 19
82
1982
-
Sout
hern
Fi
xed
Stee
l Su
pply
-
--
-Le
g D
ent w
ith H
ole
No
Yes
M
oder
ate
63
OT
N 9
2 23
5 19
82
1982
-
Sout
hern
Fi
xed
Stee
l -
--
--
Cro
ss B
race
W
eld
Cra
ck
No
No
Mod
erat
e
64
OT
N 9
2 23
5 19
82
1982
-
Sout
hern
Fi
xed
Stee
l -
--
--
-D
ent w
ith H
ole
No
No
Mod
erat
e
65
DE
n 25
/03/
82
1982
M
arch
N
orth
ern
Fixe
d St
eel
Supp
ly
-2.
75
Car
go T
rans
fer
Mis
judg
emen
t A
4 Le
g Fe
nder
N
o N
o M
oder
ate
66
NM
I 09
/07/
82
1982
Ju
ly
Sout
hern
Fi
xed
Stee
l St
and-
By
--
Clo
se S
uppo
rt
-P
latf
orm
U
nspe
cifie
d N
o N
o M
oder
ate
67
DE
n 18
/07/
82
1982
Ju
ly
Nor
ther
n Se
mi-
Subm
ersi
ble
Dri
lling
Su
pply
-
-B
unke
ring
Ope
ratio
ns
Mis
judg
emen
t D
iago
nal B
race
Se
vere
d an
d D
ent
No
Yes
M
oder
ate
68
DE
n 18
/10/
82
1982
O
ctob
er
Sout
hern
Fi
xed
Stee
l Su
pply
St
ern
1.0
App
roac
hing
Ins
talla
tion
A
ncho
r D
ragg
ed
Leg
Dia
gona
l B
race
B
end
and
Den
t N
o Y
es
Mod
erat
e
69
BO
ME
L 19
83
1983
-
Cen
tral
Fi
xed
Stee
l D
iver
Sup
port
-
--
-Le
g D
ent w
ith H
ole
No
Yes
M
oder
ate
70
DE
n 10
/03/
83
1983
M
arch
C
entr
al
Sem
i-Su
bmer
sibl
e D
rilli
ng
Supp
ly
Side
2.
25
Car
go U
nloa
ding
C
onta
iner
s D
.P. T
hrus
ter
Failu
re
Col
umn
C/D
D
ent
No
Yes
M
oder
ate
71
DE
n 09
/11/
83
1983
N
ovem
ber
Nor
ther
n Se
mi-
Subm
ersi
ble
Dri
lling
Su
pply
St
ern
-A
ppro
achi
ng I
nsta
llati
on
Mis
judg
emen
t C
olum
n SC
4 H
ole
No
Yes
M
oder
ate
72
DE
n 10
/05/
84
1984
M
ay
Nor
ther
n Se
mi-
Subm
ersib
le D
rilli
ng
Div
er S
uppo
rt
Bow
-
Div
ing
Ope
ratio
ns
D.P
. Ele
ctri
cal F
ailu
re
Col
umn
SF
Den
t N
o N
o M
oder
ate
73
DE
n 28
/08/
84
1984
A
ugus
t N
orth
ern
Sem
i-Su
bmer
sibl
e D
rilli
ng
Supp
ly
Side
1.
3 A
ppro
achi
ng I
nsta
llati
on
Eng
ine
Pow
er F
ailu
re
Col
umn
P3
Den
t Y
es
Yes
M
oder
ate
74
DE
n 10
/11/
84
1984
N
ovem
ber
Sout
hern
Ja
ck-U
p D
iver
Sup
port
-
2.75
A
ppro
achi
ng I
nsta
llati
on
D.P
. Fai
lure
O
ther
Stb
d. S
ide
Hol
e N
o Y
es
Mod
erat
e
75
DE
n 16
/11/
84
1984
N
ovem
ber
Nor
ther
n Si
ngle
Buo
y M
oori
ng
Mer
chan
t T
anke
r B
ow
4.4
App
roac
hing
Ins
talla
tion
E
ngin
e C
ontr
ol F
ailu
re
Buo
y D
ent
Yes
Y
es
Mod
erat
e
76
DE
n 30
/11/
84
1984
N
ovem
ber
Cen
tral
Se
mi-
Subm
ersi
ble
Dri
lling
Su
pply
-
4.0
Car
go U
nloa
ding
M
isju
dgem
ent
Col
umn
5 D
ent w
ith C
rack
Y
es
Yes
M
oder
ate
77
DE
n 17
/01/
85
1985
Ja
nuar
y N
orth
ern
Sem
i-Su
bmer
sibl
e D
rilli
ng
Supp
ly
Ster
n -
Car
go U
nloa
ding
E
ngin
e C
ontr
ol F
ailu
re
Col
umn
B4
Den
t Y
es
Yes
M
oder
ate
78
BO
ME
L 19
86
1986
-
Sout
hern
Fi
xed
Stee
l -
--
--
Bra
ce
Wel
d C
rack
N
o N
o M
oder
ate
79
OT
N 9
2 23
5 19
86
1986
-
Cen
tral
Fi
xed
Stee
l -
--
--
-Se
vere
d an
d D
ent
No
No
Mod
erat
e
80
DE
n 22
/01/
86
1986
Ja
nuar
y -
Sem
i-Su
bmer
sibl
e D
rilli
ng
Supp
ly
--
--
Dia
gona
l Bra
ce
C3
Den
t Y
es
Yes
M
oder
ate
81
DE
n 17
/04/
86
1986
A
pril
Cen
tral
Se
mi-
Subm
ersi
ble
Dri
lling
Su
pply
-
-A
ppro
achi
ng I
nsta
llati
on
Mis
judg
emen
t by
Poo
r V
isib
ility
C
olum
n 2
Den
t Y
es
Yes
M
oder
ate
82
DE
n 28
/08/
89
1989
A
ugus
t C
entr
al
Sem
i-Su
bmer
sibl
e D
rilli
ng
Supp
ly
Side
-
Car
go U
nloa
ding
M
isju
dgem
ent
Col
umn
C
Den
t Y
es
Yes
M
oder
ate
83
BO
ME
L 19
90
1990
-
Nor
ther
n Fi
xed
Stee
l -
--
--
-B
end
No
No
Mod
erat
e
70
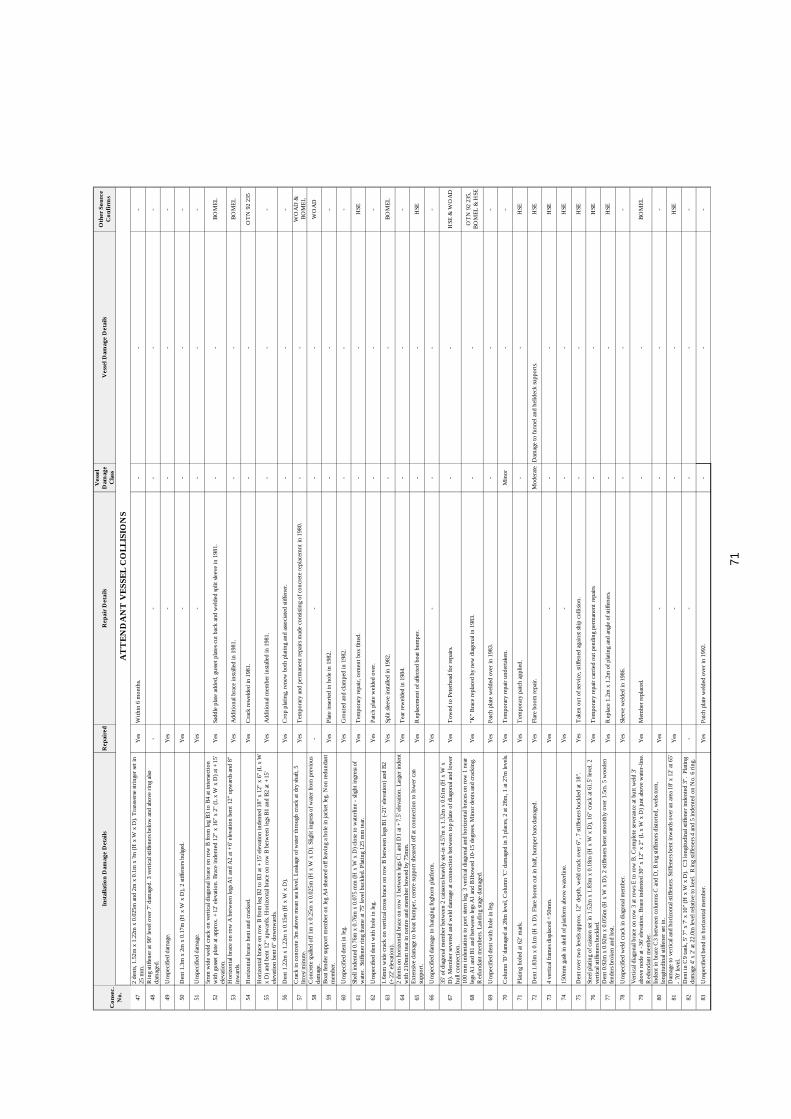
Con
sec.
N
o.
47
Inst
alla
tion
Dam
age
Det
ails
Rep
aire
d R
epai
r Det
ails
Ves
sel
Dam
age
Cla
ss
Ves
sel D
amag
e D
etai
ls O
ther
Sou
rce
Con
firm
s
AT
TEN
DA
NT
VES
SEL
CO
LLIS
ION
S 2
dent
s, 1.
52m
x 1
.22m
x 0
.025
m a
nd 2
m x
0.1
m x
?m
(H x
W x
D).
Tra
nsve
rse
stri
nger
set i
n 25
mm
. Y
es
With
in 6
mon
ths.
-
--
48
Rin
g st
iffen
er a
t 90'
leve
l ove
r 7'
dam
aged
. 3 v
ertic
al s
tiffe
ners
bel
ow a
nd a
bove
rin
g al
so
dam
aged
. -
--
--
49
Uns
peci
fied
dam
age.
Y
es
--
--
50
Den
t 1.3
m x
2m
x 0
.17m
(H x
W x
D),
2 st
iffen
ers b
ulge
d.
Yes
-
--
-
51
Uns
peci
fied
dam
age.
Y
es
--
--
52
5mm
wid
e w
eld
crac
k on
ver
tical
dia
gona
l bra
ce o
n ro
w B
from
leg
B3
to B
4 at
inte
rsec
tion
with
gus
set p
late
at a
ppro
x. +
12' e
leva
tion.
Bra
ce in
dent
ed 1
2" x
16"
x 2
" (L
x W
x D
) at
+15
' el
evat
ion.
Y
es
Sadd
le p
late
add
ed, g
usse
t pla
tes
cut b
ack
and
wel
ded
split
sle
eve
in 1
981.
-
-B
OM
EL
53
Hor
izon
tal b
race
on
row
A b
etw
een
legs
A1
and
A2
at +
6' e
leva
tion
bent
12"
upw
ards
and
8"
inw
ards
. Y
es
Add
itio
nal b
race
inst
alle
d in
198
1.
--
BO
ME
L
54
Hor
izon
tal b
race
ben
t and
cra
cked
. Y
es
Cra
ck r
ewel
ded
in 1
981.
-
-O
TN
92
235
55
Hor
izon
tal b
race
on
row
B fr
om le
g B
2 to
B3
at +
15' e
leva
tion
inde
nted
18"
x 1
2" x
6"
(L x
W
x D
) an
d be
nt 1
2" u
pwar
ds. H
oriz
onta
l bra
ce o
n ro
w B
bet
wee
n le
gs B
1 an
d B
2 at
+15
' el
evat
ion
bent
6"
dow
nwar
ds.
Yes
A
dditi
onal
mem
ber
inst
alle
d in
198
1.
--
-
56
Den
t 1.2
2m x
1.2
2m x
0.1
5m (H
x W
x D
). Y
es
Cro
p pl
atin
g, r
enew
bot
h pl
atin
g an
d as
soci
ated
sti
ffene
r.
--
-
57
Cra
ck in
con
cret
e 3m
abo
ve m
ean
sea
leve
l. Le
akag
e of
wat
er th
roug
h cr
ack
at d
ry s
haft
, 5
litre
s/m
inut
e.
Yes
T
empo
rary
and
per
man
ent r
epai
rs m
ade
cons
istin
g of
con
cret
e re
plac
emnt
in 1
980.
-
-W
OA
D &
B
OM
EL
58
Con
cret
e sp
alle
d of
f 1m
x 0
.25m
x 0
.025
m (
H x
W x
D).
Slig
ht in
gres
s of
wat
er fr
om p
revi
ous
dam
age.
-
--
-W
OA
D
59
Boa
t fen
der
supp
ort m
embe
r on
leg
A4
shea
red
off l
eavi
ng a
hol
e in
jack
et le
g. N
on r
edun
dant
m
embe
r.
Yes
P
late
inse
rted
in h
ole
in 1
982.
-
--
60
Uns
peci
fied
dent
in le
g.
Yes
G
rout
ed a
nd c
lam
ped
in 1
982.
-
--
61
Shel
l ind
ente
d 0.
76m
x 0
.76m
x 0
.075
mm
(H
x W
x D
) cl
ose
to w
ater
line
- sli
ght i
ngre
ss o
f w
ater
. St
iffen
er r
ing
fram
e at
75'
leve
l buc
kled
. Pla
ting
125
mm
tear
. Y
es
Tem
pora
ry r
epai
r, c
emen
t box
fitt
ed.
--
HSE
62
Uns
peci
fied
dent
with
hol
e in
leg.
Y
es
Pat
ch p
late
wel
ded
over
. -
--
63
1.6m
m w
ide
crac
k on
ver
tical
cro
ss b
race
on
row
B b
etw
een
legs
B1
(-21
' ele
vatio
n) a
nd B
2 (+
22' e
leva
tion)
. Y
es
Split
sle
eve
inst
alle
d in
198
2.
--
BO
ME
L
64
2 de
nts
on h
oriz
onta
l bra
ce o
n ro
w 1
bet
wee
n le
gs C
1 an
d D
1 at
+7.
5' e
leva
tion.
Lar
ger
inde
nt
with
210
mm
tear
in c
entr
e an
d m
embe
r bo
wed
by
75m
m.
Yes
T
ear
rew
elde
d in
198
4.
--
-
65
Ext
ensi
ve d
amag
e to
boa
t bum
per,
cen
tre
supp
ort s
hear
ed o
ff at
con
nect
ion
to lo
wer
can
su
ppor
t.
Yes
R
epla
cem
ent o
f affe
cted
boa
t bum
per.
-
-H
SE
66
Uns
peci
fied
dam
age
to h
angi
ng fo
ghor
n pl
atfo
rm.
Yes
-
--
-
67
35' o
f dia
gona
l mem
ber
betw
een
2 ca
isson
s he
avily
set
-in
4.57
m x
1.5
2m x
0.6
1m (
H x
W x
D
). M
embe
r se
vere
d an
d w
eld
dam
age
at c
onne
ctio
n be
twee
n to
p pl
ate
of d
iago
nal a
nd lo
wer
hu
ll co
nnec
tion.
Y
es
Tow
ed to
Pet
erhe
ad fo
r re
pair
s.
--
HSE
& W
OA
D
68
100
mm
inde
ntat
ion
to p
ort s
tern
leg.
3 v
ertic
al d
iago
nal a
nd h
oriz
onta
l bra
ces
on r
ow 1
nea
r le
gs A
1 an
d B
1 an
d be
twee
n le
gs A
1 an
d B
1bow
ed 1
0-15
deg
rees
. Min
or d
ents
and
cra
ckin
g.
Red
unda
nt m
embe
rs. L
andi
ng s
tage
dam
aged
. Y
es
"K"
Bra
ce r
epla
ced
by n
ew d
iago
nal i
n 19
83.
--
OT
N 9
2 23
5,
BO
ME
L &
HSE
69
Uns
peci
fied
dent
with
hol
e in
leg.
Y
es
Pat
ch p
late
wel
ded
over
in 1
983.
-
--
70
Col
umn
'D' d
amag
ed a
t 28m
leve
l, C
olum
n 'C
' dam
aged
in 3
pla
ces,
2 a
t 28m
, 1 a
t 27m
leve
ls.
Yes
T
empo
rary
rep
air
unde
rtak
en.
Min
or
--
71
Pla
ting
hol
ed a
t 62'
mar
k.
Yes
T
empo
rary
pat
ch a
pplie
d.
--
HSE
72
Den
t 1.8
3m x
0.1
m (
H x
D).
Fla
re b
oom
cut
in h
alf,
bum
per
bars
dam
aged
. Y
es
Flar
e bo
om r
epai
r.
Mod
erat
e D
amag
e to
funn
el a
nd h
elid
eck
supp
orts
. H
SE
73
4 ve
rtic
al fr
ames
dis
plac
ed +
50m
m.
Yes
-
--
HSE
74
150m
m g
ash
in s
hell
of p
latf
orm
abo
ve w
ater
line.
Y
es
--
-H
SE
75
Den
t ove
r tw
o le
vels
appr
ox. 1
2" d
epth
, wel
d cr
ack
over
6",
7 s
tiffe
ners
buc
kled
at 1
8".
Yes
T
aken
out
of s
ervi
ce, s
tiffe
ned
agai
nst s
hip
colli
sion
. -
-H
SE
76
Stee
l pla
ting
of c
aiss
on s
et in
1.5
2m x
1.8
3m x
0.1
8m (
H x
W x
D),
16"
crac
k at
61.
5' le
vel.
2 ve
rtic
al s
tiffe
ners
buc
kled
. Y
es
Tem
pora
ry r
epai
r ca
rrie
d ou
t pen
ding
per
man
ent r
epai
rs.
--
HSE
77
Den
t 0.9
2m x
0.9
2m x
0.0
56m
(H x
W x
D).
2 st
iffen
ers b
ent s
moo
thly
ove
r 1.
5m. 5
woo
den
fend
ers
brok
en a
nd lo
st.
Yes
R
epla
ce 1
.2m
x 1
.2m
of p
latin
g an
d an
gle
of s
tiffe
ners
. -
-H
SE
78
Uns
peci
fied
wel
d cr
ack
in d
iago
nal m
embe
r.
Yes
Sl
eeve
wel
ded
in 1
986.
-
--
79
Ver
tical
dia
gona
l bra
ce o
n ro
w 3
at r
ows
E to
row
B. C
ompl
ete
seve
ranc
e at
but
t wel
d 3'
ab
ove
node
at -
36' e
leva
tion.
Bra
ce in
dent
ed 3
0" x
12"
x 2
" (L
x W
x D
) ju
st a
bove
wat
er-l
ine.
R
edun
dant
mem
ber.
Y
es
Mem
ber
repl
aced
. -
-B
OM
EL
80
Inde
nt in
bra
ce C
3 be
twee
n co
lum
ns C
and
D, R
ing
stiff
ener
s di
stor
ted,
web
s to
rn,
long
itudi
nal s
tiffe
ner
set i
n.
Yes
-
--
-
81
Dam
age
to v
ertic
al a
nd h
oriz
onta
l stif
fene
rs. S
tiffe
ners
ben
t inw
ards
ove
r an
are
a 18
' x 1
2' a
t 65'
-
70' l
evel
. Y
es
--
-H
SE
82
Den
t in
C9
tank
, 5' 7
" x
7' x
10"
(H
x W
x D
). C
3 lo
ngitu
dina
l stif
fene
r in
dent
ed 3
". P
latin
g da
mag
e 4'
x 2
' at 2
2.0m
leve
l rel
ativ
e to
kee
l. R
ing
stiff
ener
s 4
and
5 in
dent
ed o
n N
o. 6
rin
g.
--
--
-
83
Uns
peci
fied
bend
in h
oriz
onta
l mem
ber.
Y
es
Pat
ch p
late
wel
ded
over
in 1
992.
-
--
71

Con
sec.
84
Info
rmat
ion
Dat
e V
esse
l Typ
e Im
pact
Se
a O
pera
ting
Dam
age
Den
ts In
stal
latio
n
Cla
ss
AT
TEN
DA
NT
VES
SEL
CO
LLIS
ION
S D
En
29/0
5/90
19
90
May
C
entr
al
Sem
i-Su
bmer
sibl
e D
rilli
ng
Supp
ly
Ster
n -
Anc
hor
Han
dlin
g M
isju
dgem
ent
Leg
Rac
k H
ole
No
Yes
M
oder
ate
85
DE
n 22
/07/
90
1990
Ju
ly
Sout
hern
Fi
xed
Stee
l Su
pply
B
ow
1.4
Car
go U
nloa
ding
M
isju
dgem
ent
Leg
and
Bri
dge
Min
or
No
No
Mod
erat
e
86
DE
n 10
/02/
91
1991
Fe
brua
ry
Cen
tral
Se
mi-
Subm
ersi
ble
Dri
lling
Su
pply
St
bd. Q
uart
er
2.0
Car
go U
nloa
ding
M
isju
dgem
ent
Stbd
. Fw
d. L
eg
Den
t Y
es
Yes
M
oder
ate
87
DE
n 11
/10/
91
1991
O
ctob
er
Cen
tral
Se
mi-
Subm
ersi
ble
Dri
lling
Su
pply
W
ing
Flar
eboo
m
Dav
it
Cai
sson
A
ncho
r
93
OT
N 9
2 23
5 19
75
1975
-
Sout
hern
Fi
xed
Stee
l -
--
--
-B
end
and
Den
t N
o Y
es
Min
or
94
DE
n 16
/01/
75
1975
Ja
nuar
y C
entr
al
Sem
i-Su
bmer
sibl
e D
rilli
ng
Supp
ly
--
App
roac
hing
Ins
talla
tion
M
isju
dgem
ent
Col
umn
SC4
Den
t N
o Y
es
Min
or
95
DE
n 17
/01/
75
1975
Ja
nuar
y -
Sem
i-Su
bmer
sibl
e D
rilli
ng
Supp
ly
Ster
n -
App
roac
hing
Ins
talla
tion
M
oori
ng F
ailu
re
Col
umn
P2
Den
t N
o Y
es
Min
or
96
DE
n 08
/03/
75
1975
M
arch
-
Sem
i-Su
bmer
sible
Dri
lling
Su
pply
-
-A
ppro
achi
ng I
nsta
llati
on
Stee
ring
Fai
lure
C
olum
n P
C2
Den
t N
o Y
es
Min
or
97
DE
n 19
/06/
75
1975
Ju
ne
Cen
tral
Se
mi-
Subm
ersi
ble
Dri
lling
Su
pply
St
ern
-Pe
rson
nel T
rans
fer
Mis
judg
emen
t C
olum
n F
Den
t with
Cra
ck
Yes
Y
es
Min
or
98
DE
n 25
/10/
75
1975
O
ctob
er
Bay
99
NM
I 19
76
1976
M
ay
Cen
tral
Se
mi-
Subm
ersi
ble
Dri
lling
Su
pply
-
-C
argo
Tra
nsfe
r -
-M
inor
N
o N
o M
inor
100
NM
I 19
76
1976
Ju
ne
Cen
tral
Ja
ck-U
p Su
pply
-
1.5
App
roac
hing
Ins
talla
tion
W
eath
er C
ondi
tion
s La
ndin
g St
atio
n Fe
nder
N
o N
o M
inor
101
NM
I 19
76
1976
Ju
ly
Cen
tral
Se
mi-
Subm
ersi
ble
Dri
lling
Su
pply
St
ern
0.5
Dis
conn
ectin
g T
owin
g
102
DE
n 25
/02/
76
1976
Fe
brua
ry
-Se
mi-
Subm
ersi
ble
Dri
lling
Su
pply
-
-C
argo
Unl
oadi
ng
Mis
judg
emen
t C
olum
n D
ent
Yes
Y
es
Min
or
103
DE
n 25
/02/
76
1976
Fe
brua
ry
-Se
mi-
Subm
ersi
ble
Dri
lling
Su
pply
-
-C
argo
Unl
oadi
ng
Mis
judg
emen
t C
olum
n D
ent w
ith C
rack
Y
es
Yes
M
inor
104
DE
n 17
/03/
76
1976
M
arch
-
Sem
i-Su
bmer
sible
Dri
lling
Su
pply
-
3.7
Car
go U
nloa
ding
A
ncho
r C
hain
Bro
ke
Col
umn
SFC
D
ent
Yes
Y
es
Min
or
105
DE
n 08
/04/
76
1976
A
pril
-Se
mi-
Subm
ersi
ble
Dri
lling
M
aint
enan
ce
--
--
-D
ent
No
Yes
M
inor
106
DE
n 11
/04/
76
1976
A
pril
Cen
tral
Se
mi-
Subm
ersi
ble
Dri
lling
Su
pply
-
-A
ppro
achi
ng I
nsta
llati
on
Mis
judg
emen
t C
olum
n SC
4 D
ent
No
Yes
M
inor
107
DE
n 12
/04/
76
1976
A
pril
Nor
ther
n Se
mi-
Subm
ersi
ble
Dri
lling
Su
pply
-
-D
epar
ting
Ins
talla
tion
M
oori
ng F
ailu
re
Dia
gona
l Bra
ce
Den
t N
o Y
es
Min
or
108
DE
n 18
/09/
76
1976
Se
ptem
ber
Nor
ther
n Se
mi-
Subm
ersi
ble
Dri
lling
Su
pply
B
ow
-C
argo
Tra
nsfe
r -
Col
umn
Den
t N
o Y
es
Min
or
109
DE
n 17
/10/
76
1976
O
ctob
er
Nor
ther
n Fi
xed
Stee
l Su
pply
Si
de
3.0
Car
go U
nloa
ding
W
eath
er C
ondi
tion
s St
abbi
ng G
uide
M
inor
N
o N
o M
inor
110
DE
n 25
/10/
76
1976
O
ctob
er
Cen
tral
Se
mi-
Subm
ersi
ble
Dri
lling
Su
pply
-
2.5
App
roac
hing
Ins
talla
tion
E
ngin
e C
ontr
ol F
ailu
re
Col
umn
SC2
Den
t N
o Y
es
Min
or
111
NM
I 19
77
1977
Ja
nuar
y N
orth
ern
Fixe
d St
eel
Supp
ly
Side
-
Car
go T
rans
fer
--
Min
or
No
No
Min
or
112
NM
I 19
77
1977
Fe
brua
ry
Nor
ther
n Fi
xed
Stee
l Su
pply
Si
de
3.5
Car
go T
rans
fer
--
Min
or
No
No
Min
or
113
NM
I 19
77
1977
M
arch
C
entr
al
Sem
i-Su
bmer
sibl
e D
rilli
ng
Supp
ly
Ster
n 1.
0 A
ppro
achi
ng I
nsta
llati
on
Mis
judg
emen
t -
Min
or
No
No
Min
or
114
NM
I 19
77
1977
M
ay
Cen
tral
Se
mi-
Subm
ersi
ble
Dri
lling
Su
pply
St
ern
2.5
Car
go T
rans
fer
Tot
al P
ower
Los
s -
Min
or
No
No
Min
or
115
NM
I 19
77
1977
Se
ptem
ber
Sout
hern
Ja
ck-U
p B
arge
-
1.0
Car
go T
rans
fer
-Le
g M
inor
N
o N
o M
inor
116
OT
N 9
2 23
5 19
77
1977
-
Sout
hern
Fi
xed
Stee
l -
--
--
-B
end
No
No
Min
or
117
NM
I 14
/01/
77
1977
Ja
nuar
y -
Sem
i-Su
bmer
sibl
e D
rilli
ng
Stan
d-B
y B
ow
2.0
Man
Ove
rboa
rd D
rill
--
Min
or
No
No
Min
or
118
DE
n 21
/03/
77
1977
M
arch
N
orth
ern
Sem
i-Su
bmer
sibl
e D
rilli
ng
Supp
ly
Bow
3.
0 C
argo
Tra
nsfe
r -
Col
umn
Den
t Y
es
Yes
M
inor
119
DE
n 06
/05/
77
1977
M
ay
Nor
ther
n Fi
xed
Con
cret
e D
iver
Sup
port
-
-D
ivin
g O
pera
tions
A
ncho
r D
ragg
ed
Leg
3 M
inor
N
o N
o M
inor
120
DE
n 07
/05/
77
1977
M
ay
Nor
ther
n Fi
xed
Stee
l Su
pply
St
ern
2.0
Car
go U
nloa
ding
P
ost/
Ope
rati
on N
egle
cted
Pi
le S
leev
e D
ent
No
Yes
M
inor
121
DE
n 07
/10/
77
1977
O
ctob
er
Nor
ther
n Fi
xed
Con
cret
e Su
pply
-
--
--
Fend
er
No
No
Min
or
122
DE
n 22
/11/
77
1977
N
ovem
ber
Sout
hern
Fi
xed
Stee
l Su
pply
-
5.0
Car
go U
nloa
ding
A
ncho
r D
ragg
ed
-M
inor
N
o N
o M
inor
72

Con
sec.
N
o.
84
Inst
alla
tion
Dam
age
Det
ails
Rep
aire
d R
epai
r Det
ails
Ves
sel
Cla
ss
Oth
er S
ourc
e
AT
TEN
DA
NT
VES
SEL
CO
LLIS
ION
S 1"
dia
met
er h
ole
in h
ull p
late
. Le
ak r
ate
of 3
tons
/hou
r. D
amag
e to
dri
ll w
ater
tank
. -
--
-H
SE
85
No
dam
age
to c
ompr
esso
r pl
atfo
rm. 1
tubu
lar
supp
ort o
n br
idge
bet
wee
n A
P a
nd A
C
plat
form
s fla
tten
ed. D
amag
e to
pip
elin
e ri
ser
guar
d; s
tair
way
bet
wee
n m
ain
and
cella
r de
ck;
plat
form
dec
king
and
gra
ting;
fend
ers.
10"
fire
mai
n ru
ptur
ed. H
alon
act
ivat
ed.
--
Min
or
Ves
sel's
sup
erst
ruct
ure,
rig
ging
and
sta
rboa
rd fu
nnel
wer
e in
con
tact
with
cel
lar
deck
and
co
nnec
ting
brid
ge.
HSE
& W
OA
D
86
Inde
ntat
ion
in s
tarb
oard
forw
ard
leg,
1m
x 2
m x
0.3
m (
H x
W x
D).
Ass
ocia
ted
fram
es a
nd
floor
buc
kled
, wat
erti
ght i
nteg
rity
inta
ct.
--
--
HSE
, WO
AD
&
MA
IB
87
Por
t fla
re b
oom
twis
ted
and
crus
hed.
-
-M
inor
Sm
all h
ole
in p
ort f
unne
l and
slig
ht d
amag
e to
bri
dge
win
g.
HSE
88
Dam
age
to fl
are
boom
. Y
es
Com
plet
e re
furb
ishm
ent o
f boo
m s
ectio
n.
Mod
erat
e B
ent f
unne
l, ra
dar
dam
age,
mas
t dam
age.
H
SE
89
Wre
cked
life
boat
. -
--
-H
SE
90
Inde
ntat
ion
18"
x 20
' x 1
8' (
D x
H x
W)
area
. Spl
it 29
" x
2" (
L x
W)
at 7
5' le
vel.
Inte
rnal
st
iffen
ers
in w
ay b
ent a
nd c
rack
ed.
-U
nkno
wn.
-
-M
AIB
91
Tw
o in
dent
atio
ns in
she
ll of
Col
umn
2 an
d di
stor
tion
of in
tern
al v
ertic
al s
tiffe
ners
in w
ay.
--
--
-
92
Col
umn
shel
l pla
ting
inde
nted
12'
x 8
' x 1
0" a
t app
rox.
6' a
bove
wat
er li
ne. S
ever
al v
ertic
al a
nd
one
hori
zont
al in
tern
al s
tiffe
ners
in w
ay a
re d
isto
rted
. -
--
--
93
Hor
izon
tal b
race
on
row
1 b
etw
een
legs
A1
and
B1
at +
20' e
leva
tion
inde
nted
150
mm
and
10
0mm
(de
ep)
and
bent
8".
N
o -
--
-
94
Shel
l pla
ting
dent
ed 1
.22m
x 1
.83m
x 0
.1m
(H
x W
x D
) ju
st a
bove
wat
erlin
e.
--
--
-
95
Den
t 0.6
1m x
0.6
1m x
0.1
5m (H
x W
x D
). -
--
--
96
Den
t 1.5
2m x
0.9
1m x
0.1
5m (
H x
W x
D)
at b
ulkh
ead
betw
een
lock
er a
nd p
ump
room
. -
--
--
97
Den
t 0.9
1m x
0.6
1m x
0.1
8m (
H x
W x
D)
at 5
0' d
raug
ht. 2
ver
tical
rib
s be
nt. W
eld
crac
ks.
--
--
-
98
Supe
rfic
ial d
amag
e to
leg
chor
d.
--
Seve
re
Ext
ensi
ve d
amag
e to
bow
, new
bow
req
uire
d.
WO
AD
99
Uns
peci
fied
min
or d
amag
e.
--
Min
or
Slig
ht d
amag
e to
ves
sel r
ubbi
ng s
trak
e.
-
100
Boa
t lan
ding
des
troy
ed.
Yes
-
--
-
101
Uns
peci
fied
min
or d
amag
e.
--
--
-
102
V-s
hape
d de
nt in
pla
ting
1.22
m h
oriz
onta
lly. V
ertic
al s
tiffe
ner
set b
ack
250m
m 1
75m
m x
10
0mm
x 9
.5m
m (H
x W
x D
). C
ircu
mfe
renc
e st
iffen
ers b
uckl
ed 5
50m
m e
ither
side
. -
--
--
103
V-s
hape
d de
nt in
pla
ting
2.44
m h
oriz
onta
lly. V
ertic
al s
tiffe
ner
set b
ack
300
mm
. 3 v
ertic
al
angl
e st
iffen
ers d
ente
d 17
5mm
x 1
00m
m x
9.5
mm
(H x
W x
D).
Wel
d cr
ack.
-
--
--
104
Shel
l den
ted
9" in
9.7
5m d
iam
eter
col
umn.
1 h
oriz
onta
l and
4 v
ertic
al fr
ames
dam
aged
. Le
g re
mai
ned
wat
er ti
ght.
--
--
-
105
Den
ting
of c
olum
n.
--
--
-
106
Plat
ing
dent
ed 0
.3m
x 0
.3m
x 0
.05m
(H
x W
x D
) at
74'
ele
vatio
n.
--
--
-
107
Den
t in
diag
onal
mem
ber
0.91
m x
0.9
1m x
0.1
5m (H
x W
x D
). -
--
--
108
Den
t at d
eck
5 le
vel,
3.5m
x 4
m x
0.4
2m (
H x
W x
D),
Dam
age
to b
oat m
oori
ng p
ad e
ye a
nd
tie s
tiffe
ning
web
bac
king
it, p
unct
ure
0.08
m x
0.2
0m.
--
--
-
109
Uns
peci
fied
min
or d
amag
e.
--
Seve
re
Hol
ed c
ausi
ng s
igni
fican
t flo
odin
g.
-
110
Col
lided
twic
e; 1
st. n
o da
mag
e to
boa
t bum
per.
Den
t on
seco
nd c
ollis
ion
betw
een
first
and
se
cond
rin
g fr
ames
at 8
3' d
raft,
0.9
1m x
1.0
7m x
0.0
64 m
(H x
W x
D).
--
--
-
111
Uns
peci
fied
min
or d
amag
e.
--
--
-
112
Uns
peci
fied
min
or d
amag
e.
--
--
-
113
Uns
peci
fied
min
or d
amag
e.
No
--
--
114
Uns
peci
fied
min
or d
amag
e.
--
--
-
115
4 co
llisi
ons,
bar
ge b
eing
pus
hed
by a
tug.
-
--
--
116
Ver
tical
dia
gona
l bra
ce o
n ro
w B
from
leg
B2
to d
iago
nal b
race
bet
wee
n le
gs B
1 an
d B
2 be
nt
6".
No
--
--
117
Uns
peci
fied
min
or d
amag
e.
--
--
-
118
2 D
ents
, one
1.2
4m x
2.4
8m x
0.1
m (H
x W
x D
) 1m
abo
ve w
ater
line,
stiff
ener
set d
own
75m
m o
ver
3.1m
leng
th.
--
--
-
119
Dam
age
to fi
re m
ain,
foam
mai
n an
d ha
ndra
ils.
No
--
--
120
Den
t in
sleev
e 0.
8m x
0.8
m x
0.1
m (H
x W
x D
) at 1
m a
bove
wat
erlin
e.
--
--
-
121
Hit
nor
th le
g ca
usin
g da
mag
e to
bum
pers
. -
--
--
122
Min
or d
amag
e to
bot
h pl
atfo
rms
only
sup
erfic
ial.
--
Min
or
Min
or d
amag
e to
sta
rboa
rd h
ull p
lati
ng, s
uper
stru
ctur
e an
d m
ast.
-
73

Con
sec.
N
o.
123
Info
rmat
ion
Sour
ce
Dat
e (d
d/m
m/y
r) Y
ear
Mon
th
Loca
tion
Inst
alla
tion
Typ
e Im
pact
V
esse
l Typ
e Im
pact
O
rien
tatio
n Se
a C
ondi
tion
Ope
ratin
g C
ircu
mst
ance
s Pr
imar
y C
ause
Im
pact
Poi
nt
Inst
alla
tion
Dam
age
Stiff
ener
D
amag
e Pl
ate
Den
ts In
stal
latio
n D
amag
e C
lass
AT
TEN
DA
NT
VES
SEL
CO
LLIS
ION
S N
MI
17/1
2/77
19
77
Dec
embe
r C
entr
al
Sem
i-Su
bmer
sibl
e D
rilli
ng
Supp
ly
--
Car
go T
rans
fer
Mis
judg
emen
t D
iago
nal B
race
M
inor
N
o N
o M
inor
124
NM
I 19
78
1978
M
arch
C
entr
al
Sem
i-Su
bmer
sibl
e D
rilli
ng
Supp
ly
Ster
n 1.
0 A
ppro
achi
ng I
nsta
llati
on
Mis
judg
emen
t -
Min
or
No
No
Min
or
125
NM
I 19
78
1978
Ju
ne
Cen
tral
Se
mi-
Subm
ersi
ble
Dri
lling
Su
pply
St
ern
2.5
Car
go T
rans
fer
Mis
judg
emen
t D
iago
nal B
race
M
inor
N
o N
o M
inor
126
NM
I 19
78
1978
Ju
ly
Cen
tral
Se
mi-
Subm
ersi
ble
Dri
lling
Su
pply
-
1.5
-E
ngin
e C
ontr
ol F
ailu
re
-M
inor
N
o N
o M
inor
127
NM
I 19
78
1978
Ju
ly
Cen
tral
Se
mi-
Subm
ersi
ble
Dri
lling
Su
pply
Si
de
2.0
Car
go T
rans
fer
--
Min
or
No
No
Min
or
128
NM
I 19
78
1978
D
ecem
ber
Cen
tral
Ja
ck-U
p Su
pply
Si
de
3.66
C
argo
Tra
nsfe
r -
-D
ent
No
No
Min
or
129
DE
n 04
/01/
78
1978
Ja
nuar
y C
entr
al
Sem
i-Su
bmer
sibl
e D
rilli
ng
Supp
ly
Ster
n 3.
0 A
ppro
achi
ng I
nsta
llati
on
Mis
judg
emen
t C
olum
n SC
4 D
ent
No
Yes
M
inor
130
DE
n 02
/02/
78
1978
Fe
brua
ry
Nor
ther
n Fi
xed
Stee
l Su
pply
-
3.0
App
roac
hing
Ins
talla
tion
W
eath
er C
ondi
tions
Fe
nder
Fe
nder
N
o N
o M
inor
131
DE
n 02
/02/
78
1978
Fe
brua
ry
Cen
tral
Se
mi-
Subm
ersi
ble
Dri
lling
Su
pply
-
3.0
Car
go U
nloa
ding
W
eath
er C
ondi
tions
C
olum
n SC
4 D
ent
Yes
Y
es
Min
or
132
NM
I 13
/02/
78
1978
Fe
brua
ry
Cen
tral
Se
mi-
Subm
ersi
ble
Dri
lling
Su
pply
-
1.5
-M
isju
dgem
ent
Dia
gona
l Bra
ce
Den
t N
o Y
es
Min
or
133
NM
I 14
/02/
78
1978
Fe
brua
ry
Cen
tral
Se
mi-
Subm
ersi
ble
Dri
lling
Su
pply
-
--
-St
orag
e T
ank
Den
t N
o Y
es
Min
or
134
NM
I 31
/03/
78
1978
M
arch
C
entr
al
Sem
i-Su
bmer
sibl
e D
rilli
ng
Supp
ly
-1.
5 C
argo
Tra
nsfe
r -
Stor
age
Tan
k D
ent
No
Yes
M
inor
135
DE
n 16
/08/
78
1978
A
ugus
t C
entr
al
Sem
i-Su
bmer
sibl
e D
rilli
ng
Supp
ly
Ster
n -
App
roac
hing
Ins
talla
tion
M
isju
dgem
ent
Col
umn
SC4
Den
t Y
es
Yes
M
inor
136
DE
n 01
/01/
79
1979
Ja
nuar
y So
uthe
rn
Fixe
d St
eel
Stan
d-B
y -
-C
argo
Unl
oadi
ng
Wea
ther
Con
diti
ons
Land
ing
Stat
ion
Min
or
No
No
Min
or
137
DE
n 19
79
1979
Fe
brua
ry
Nor
ther
n Fi
xed
Stee
l Su
pply
St
ern
2.0
Car
go T
rans
fer
Wea
ther
Con
ditio
ns
Dec
k M
inor
N
o N
o M
inor
138
NM
I 19
79
1979
M
arch
C
entr
al
Sem
i-Su
bmer
sibl
e D
rilli
ng
Supp
ly
Ster
n 3.
0 A
ppro
achi
ng I
nsta
llati
on
Mis
judg
emen
t -
Min
or
No
No
Min
or
139
NM
I 19
79
1979
M
ay
Nor
ther
n Fi
xed
Stee
l Su
pply
Si
de
3.5
Car
go T
rans
fer
Wea
ther
Con
ditio
ns
-M
inor
N
o N
o M
inor
140
NM
I 19
79
1979
Se
ptem
ber
Cen
tral
Se
mi-
Subm
ersi
ble
Dri
lling
Su
pply
St
ern
1.5
Car
go T
rans
fer
--
Min
or
No
No
Min
or
141
NM
I 19
79
1979
N
ovem
ber
Cen
tral
Se
mi-
Subm
ersi
ble
Dri
lling
Su
pply
St
ern
2.0
Car
go T
rans
fer
Eng
ine
Con
trol
Fai
lure
-
Min
or
No
No
Min
or
142
NM
I 16
/01/
79
1979
Ja
nuar
y C
entr
al
Sem
i-Su
bmer
sibl
e D
rilli
ng
Anc
hor
Han
dler
St
ern
3.0
App
roac
hing
Ins
talla
tion
E
ngin
e Fa
ilure
-
Min
or
No
No
Min
or
143
DE
n 03
/02/
79
1979
Fe
brua
ry
Nor
ther
n Fi
xed
Stee
l Su
pply
Si
de
4.5
Car
go T
rans
fer
Wea
ther
Con
ditio
ns
Fend
er
Fend
er
No
No
Min
or
144
NM
I 11
/03/
79
1979
M
arch
C
entr
al
Sem
i-Su
bmer
sibl
e D
rilli
ng
Supp
ly
--
Car
go T
rans
fer
Mis
judg
emen
t D
iago
nal B
race
D
ent
No
Yes
M
inor
145
DE
n 17
/03/
79
1979
M
arch
So
uthe
rn
Fixe
d St
eel
Supp
ly
Side
2.
0 A
ppro
achi
ng I
nsta
llati
on
Moo
ring
Fai
lure
R
iser
Den
t N
o Y
es
Min
or
146
DE
n 02
/05/
79
1979
M
ay
Nor
ther
n Fi
xed
Stee
l St
and-
By
--
--
G2
Leg
Den
t N
o Y
es
Min
or
147
DE
n 11
/05/
79
1979
M
ay
Cen
tral
Se
mi-
Subm
ersi
ble
Acc
omm
odat
ion
Div
er S
uppo
rt
Side
-
Div
ing
Ope
ratio
ns
D.P
. Thr
uste
r Fa
ilure
Le
g SW
M
inor
N
o N
o M
inor
148
DE
n 07
/09/
79
1979
Se
ptem
ber
Nor
ther
n Fi
xed
Con
cret
e D
iver
Sup
port
Si
de
-A
ppro
achi
ng I
nsta
llati
on
D.P
. Fai
lure
Le
g 3
Min
or
No
No
Min
or
149
NM
I 11
/09/
79
1979
Se
ptem
ber
Nor
ther
n Se
mi-
Subm
ersi
ble
Dri
lling
Su
pply
-
5.0
Car
go T
rans
fer
-St
orag
e T
ank
Den
t N
o Y
es
Min
or
150
DE
n 16
/10/
79
1979
O
ctob
er
Sout
hern
Fi
xed
Stee
l St
and-
By
Side
-
App
roac
hing
Ins
talla
tion
M
isju
dgem
ent
Rise
r B
end
No
No
Min
or
151
DE
n 23
/10/
79
1979
O
ctob
er
Cen
tral
Fi
xed
Stee
l St
and-
By
--
Clo
se S
uppo
rt
Wea
ther
Con
ditio
ns
Dec
k D
ent
No
Yes
M
inor
152
NM
I 27
/11/
79
1979
N
ovem
ber
Nor
ther
n Se
mi-
Subm
ersi
ble
Dri
lling
St
and-
By
Bow
3.
0 M
an O
verb
oard
Dri
ll E
ngin
e Po
wer
Fai
lure
-
Min
or
No
No
Min
or
153
DE
n 07
/12/
79
1979
D
ecem
ber
Sout
hern
Fi
xed
Stee
l Su
pply
St
ern
1.0
Dep
arti
ng I
nsta
llati
on
Man
oeuv
ring
Mis
judg
emen
t La
ndin
g St
atio
n Fe
nder
N
o N
o M
inor
154
NM
I 21
/12/
79
1979
D
ecem
ber
Cen
tral
Se
mi-
Subm
ersi
ble
Dri
lling
A
ncho
r H
andl
er
Ster
n 2.
5 A
ppro
achi
ng I
nsta
llati
on
-C
olum
n M
inor
N
o N
o M
inor
155
NM
I 19
80
1980
Ju
ly
Cen
tral
Fi
xed
Stee
l D
iver
Sup
port
Si
de
-D
ivin
g O
pera
tions
D
.P. F
ailu
re
-M
inor
N
o N
o M
inor
156
NM
I 19
80
1980
N
ovem
ber
Cen
tral
Fi
xed
Stee
l Su
pply
Si
de
5.5
Car
go T
rans
fer
--
Min
or
No
No
Min
or
157
NM
I 19
80
1980
D
ecem
ber
Cen
tral
Fi
xed
Stee
l Su
pply
-
2.75
C
argo
Tra
nsfe
r -
-M
inor
N
o N
o M
inor
158
OT
N 9
2 23
5 19
80
1980
-
Sout
hern
Fi
xed
Stee
l -
--
--
Leg
D2
Den
t N
o Y
es
Min
or
159
OT
N 9
2 23
5 19
80
1980
-
Sout
hern
Fi
xed
Stee
l -
--
--
-D
ent
No
Yes
M
inor
160
NM
I 07
/01/
80
1980
Ja
nuar
y N
orth
ern
Sem
i-Su
bmer
sibl
e D
rilli
ng
Supp
ly
-1.
5 C
argo
Tra
nsfe
r M
isju
dgem
ent
Dia
gona
l Bra
ce
Den
t N
o Y
es
Min
or
161
DE
n 18
/04/
80
1980
A
pril
Nor
ther
n Fi
xed
Stee
l Su
pply
-
6.0
Car
go U
nloa
ding
W
eath
er C
ondi
tion
s -
Min
or
No
No
Min
or
74

Con
sec.
N
o.
123
Inst
alla
tion
Dam
age
Det
ails
Rep
aire
d R
epai
r Det
ails
Ves
sel
Cla
ss
Oth
er S
ourc
e
AT
TEN
DA
NT
VES
SEL
CO
LLIS
ION
S P
aint
scr
aped
. -
--
--
124
Uns
peci
fied
min
or d
amag
e.
--
--
-
125
Wav
e lif
ted
ster
n in
to t
he d
iago
nal,
boat
had
mov
ed t
oo fa
r ba
ck.*
****
-
--
--
126
Uns
peci
fied
min
or d
amag
e.
--
--
-
127
Uns
peci
fied
min
or d
amag
e.
--
--
-
128
--
--
--
129
2 de
nts 1
.32m
x 0
.89m
x 0
.025
m a
nd 0
.76m
x 0
.46m
x 0
.019
m (H
x W
x D
) at 7
6' h
eigh
t fro
m
keel
. Min
or d
amag
e to
boa
t bum
per.
-
--
--
130
Seve
re d
amag
e to
boa
t bum
per.
-
--
--
131
Tw
o de
nts 1
.65m
x 1
.22m
x 0
.18m
and
0.7
4m x
0.4
1m x
0.0
7m (H
x W
x D
). 2n
d ri
ng fr
ame
dent
ed 5
58m
m x
203
mm
x 5
0mm
. -
--
--
132
Den
t 0.3
m x
0.3
m x
0.0
3m (H
x W
x D
) to
diag
onal
. -
--
--
133
Den
t 1.6
m x
1.6
m x
0.2
m (H
x W
x D
) in
brin
e ta
nk 2
4m a
bove
kee
l. -
--
--
134
Den
t 1.1
m x
0.2
m x
0.0
5m (H
x W
x D
) to
9 ta
nk 2
3.5m
abo
ve k
eel.
--
--
-
135
2 de
nts 1
.17m
x 0
.76m
x 0
.1m
and
2.1
3m x
1.8
3m x
?m
(H x
W x
D).
2 fr
ame
stiff
ener
s da
mag
ed w
ith 3
05m
m x
25m
m d
ents
. -
--
--
136
Pai
nt s
crap
ed fr
om 4
ver
tical
mem
bers
. N
o -
Mod
erat
e D
amag
ed d
eck
plat
es a
nd in
tern
al le
akag
e.
-
137
Uns
peci
fied
min
or d
amag
e.
--
--
-
138
Uns
peci
fied
min
or d
amag
e.
--
--
-
139
Uns
peci
fied
min
or d
amag
e.
--
--
-
140
Uns
peci
fied
min
or d
amag
e.
--
--
-
141
Bri
dge
of v
esse
l app
eare
d to
be
unm
anne
d w
hen
colli
sion
occ
urre
d.**
***
--
--
-
142
Uns
peci
fied
min
or d
amag
e.
--
--
-
143
Dam
age
to b
oat b
umpe
r in
clud
ing
tear
ing
of d
oubl
er p
late
, no
dam
age
to s
truc
tura
l mem
bers
. -
-Se
vere
1m
gas
h in
hul
l, lo
st c
omm
unic
atio
ns a
nten
nae.
-
144
Den
t 0.3
m x
0.3
m x
0.0
3m (
H x
W x
D)
to 2
dia
gona
ls at
24.
5m a
bove
kee
l. -
--
--
145
75m
m d
ents
in d
iago
nal b
raci
ng a
t spi
der
leve
l, ri
ser
bent
100
mm
out
of l
ine.
-
--
--
146
Den
ted
pile
gui
de.
--
--
-
147
Han
drai
l sec
tion
dam
aged
. -
-M
inor
V
esse
l los
t rad
io a
eria
l. -
148
Slig
ht s
cori
ng o
f pla
tfor
m.
--
--
-
149
Den
t 2m
x 0
.3m
(H
x W
) in
C-9
tank
24m
abo
ve k
eel.
--
--
-
150
Gas
ris
er d
ispl
aced
by
225
mm
. -
Ope
rato
r in
tend
s to
fit r
iser
gua
rd.
--
-
151
Ext
erna
l pla
ting
of p
acka
ge s
light
ly b
uckl
ed, n
o co
ntac
t wit
h st
ruct
ural
mem
bers
. N
o C
aref
ul in
spec
tion
of a
ll pl
ant i
n af
fect
ed a
rea.
-
--
152
Uns
peci
fied
min
or d
amag
e.
--
--
-
153
6" c
rack
in w
eld
at to
p of
one
ver
tical
met
al fe
nder
. Y
es
--
--
154
Uns
peci
fied
min
or d
amag
e.
--
--
-
155
Uns
peci
fied
min
or d
amag
e.
--
--
-
156
Uns
peci
fied
min
or d
amag
e.
--
--
-
157
Uns
peci
fied
min
or d
amag
e.
--
--
-
158
Leg
inde
nted
18"
x 6
" x
2" (
L x
W x
D)
at s
ea le
vel.
No
--
--
159
Inde
nt 1
50m
m x
50m
m (
L x
D)
on v
ertic
al d
iago
nal b
race
bet
wee
n le
gs B
1 an
d A
1.
No
--
--
160
Den
t to
C-3
dia
gona
l 27
m a
bove
kee
l. -
--
--
161
Tri
vial
dam
age
to h
andr
ail o
nly.
-
-N
one
No
dam
age.
-
75
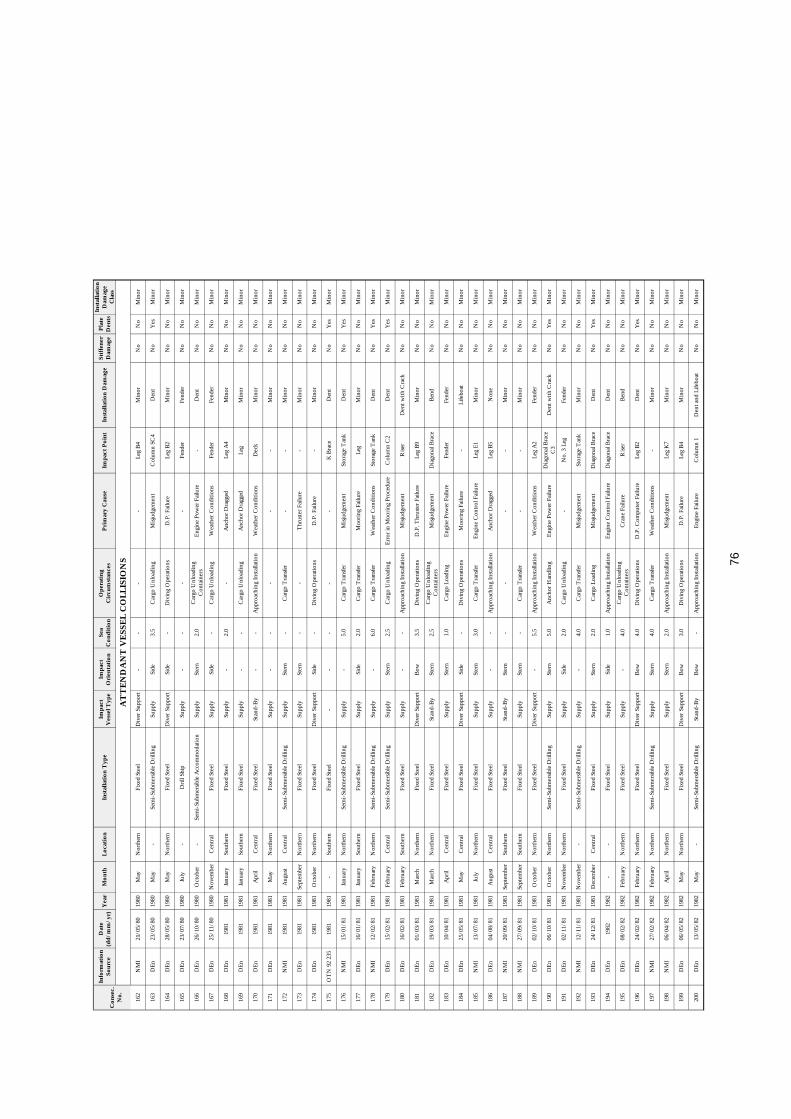
Con
sec.
N
o.
162
Info
rmat
ion
Sour
ce
Dat
e (d
d/m
m/y
r) Y
ear
Mon
th
Loca
tion
Inst
alla
tion
Typ
e Im
pact
V
esse
l Typ
e Im
pact
O
rien
tatio
n Se
a C
ondi
tion
Ope
ratin
g C
ircu
mst
ance
s Pr
imar
y C
ause
Im
pact
Poi
nt
Inst
alla
tion
Dam
age
Stiff
ener
D
amag
e Pl
ate
Den
ts In
stal
latio
n D
amag
e C
lass
AT
TEN
DA
NT
VES
SEL
CO
LLIS
ION
S N
MI
21/0
5/80
19
80
May
N
orth
ern
Fixe
d St
eel
Div
er S
uppo
rt
--
--
Leg
B4
Min
or
No
No
Min
or
163
DE
n 23
/05/
80
1980
M
ay
-Se
mi-
Subm
ersi
ble
Dri
lling
Su
pply
Si
de
3.5
Car
go U
nloa
ding
M
isju
dgem
ent
Col
umn
SC4
Den
t N
o Y
es
Min
or
164
DE
n 28
/05/
80
1980
M
ay
Nor
ther
n Fi
xed
Stee
l D
iver
Sup
port
Si
de
-D
ivin
g O
pera
tions
D
.P. F
ailu
re
Leg
B2
Min
or
No
No
Min
or
165
DE
n 23
/07/
80
1980
Ju
ly
-D
rill
Ship
Su
pply
-
--
-Fe
nder
Fe
nder
N
o N
o M
inor
166
DE
n 26
/10/
80
1980
O
ctob
er
-Se
mi-
Subm
ersi
ble
Acc
omm
odat
ion
Supp
ly
Ster
n 2.
0 C
argo
Unl
oadi
ng
Con
tain
ers
Eng
ine
Pow
er F
ailu
re
-D
ent
No
No
Min
or
167
DE
n 25
/11/
80
1980
N
ovem
ber
Cen
tral
Fi
xed
Stee
l Su
pply
Si
de
-C
argo
Unl
oadi
ng
Wea
ther
Con
diti
ons
Fend
er
Fend
er
No
No
Min
or
168
DE
n 19
81
1981
Ja
nuar
y So
uthe
rn
Fixe
d St
eel
Supp
ly
-2.
0 -
Anc
hor
Dra
gged
Le
g A
4 M
inor
N
o N
o M
inor
169
DE
n 19
81
1981
Ja
nuar
y So
uthe
rn
Fixe
d St
eel
Supp
ly
--
Car
go U
nloa
ding
A
ncho
r D
ragg
ed
Leg
Min
or
No
No
Min
or
170
DE
n 19
81
1981
A
pril
Cen
tral
Fi
xed
Stee
l St
and-
By
--
App
roac
hing
Ins
talla
tion
W
eath
er C
ondi
tion
s D
eck
Min
or
No
No
Min
or
171
DE
n 19
81
1981
M
ay
Nor
ther
n Fi
xed
Stee
l Su
pply
-
--
--
Min
or
No
No
Min
or
172
NM
I 19
81
1981
A
ugus
t C
entr
al
Sem
i-Su
bmer
sibl
e D
rilli
ng
Supp
ly
Ster
n -
Car
go T
rans
fer
--
Min
or
No
No
Min
or
173
DE
n 19
81
1981
Se
ptem
ber
Nor
ther
n Fi
xed
Stee
l Su
pply
St
ern
--
Thr
uste
r Fa
ilure
-
Min
or
No
No
Min
or
174
DE
n 19
81
1981
O
ctob
er
Nor
ther
n Fi
xed
Stee
l D
iver
Sup
port
Si
de
-D
ivin
g O
pera
tions
D
.P. F
ailu
re
-M
inor
N
o N
o M
inor
175
OT
N 9
2 23
5 19
81
1981
-
Sout
hern
Fi
xed
Stee
l -
--
--
K B
race
D
ent
No
Yes
M
inor
176
NM
I 15
/01/
81
1981
Ja
nuar
y N
orth
ern
Sem
i-Su
bmer
sibl
e D
rilli
ng
Supp
ly
-5.
0 C
argo
Tra
nsfe
r M
isju
dgem
ent
Stor
age
Tan
k D
ent
No
Yes
M
inor
177
DE
n 16
/01/
81
1981
Ja
nuar
y So
uthe
rn
Fixe
d St
eel
Supp
ly
Side
2.
0 C
argo
Tra
nsfe
r M
oori
ng F
ailu
re
Leg
Min
or
No
No
Min
or
178
NM
I 12
/02/
81
1981
Fe
brua
ry
Nor
ther
n Se
mi-
Subm
ersi
ble
Dri
lling
Su
pply
-
6.0
Car
go T
rans
fer
Wea
ther
Con
ditio
ns
Stor
age
Tan
k D
ent
No
Yes
M
inor
179
DE
n 15
/02/
81
1981
Fe
brua
ry
Cen
tral
Se
mi-
Subm
ersi
ble
Dri
lling
Su
pply
St
ern
2.5
Car
go U
nloa
ding
E
rror
in M
oori
ng P
roce
dure
C
olum
n C
2 D
ent
No
Yes
M
inor
180
DE
n 16
/02/
81
1981
Fe
brua
ry
Sout
hern
Fi
xed
Stee
l Su
pply
-
-A
ppro
achi
ng I
nsta
llati
on
Mis
judg
emen
t R
iser
Den
t with
Cra
ck
No
No
Min
or
181
DE
n 01
/03/
81
1981
M
arch
N
orth
ern
Fixe
d St
eel
Div
er S
uppo
rt
Bow
3.
5 D
ivin
g O
pera
tions
D
.P. T
hrus
ter
Failu
re
Leg
B9
Min
or
No
No
Min
or
182
DE
n 19
/03/
81
1981
M
arch
N
orth
ern
Fixe
d St
eel
Stan
d-B
y St
ern
2.5
Car
go U
nloa
ding
C
onta
iner
s M
isju
dgem
ent
Dia
gona
l Bra
ce
Ben
d N
o N
o M
inor
183
DE
n 10
/04/
81
1981
A
pril
Cen
tral
Fi
xed
Stee
l Su
pply
St
ern
1.0
Car
go L
oadi
ng
Eng
ine
Pow
er F
ailu
re
Fend
er
Fend
er
No
No
Min
or
184
DE
n 25
/05/
81
1981
M
ay
Cen
tral
Fi
xed
Stee
l D
iver
Sup
port
Si
de
-D
ivin
g O
pera
tions
M
oori
ng F
ailu
re
-Li
febo
at
No
No
Min
or
185
NM
I 13
/07/
81
1981
Ju
ly
Nor
ther
n Fi
xed
Stee
l Su
pply
St
ern
3.0
Car
go T
rans
fer
Eng
ine
Con
trol
Fai
lure
Le
g E
1 M
inor
N
o N
o M
inor
186
DE
n 04
/08/
81
1981
A
ugus
t C
entr
al
Fixe
d St
eel
Supp
ly
--
App
roac
hing
Ins
talla
tion
A
ncho
r D
ragg
ed
Leg
B5
Non
e N
o N
o M
inor
187
NM
I 20
/09/
81
1981
Se
ptem
ber
Sout
hern
Fi
xed
Stee
l St
and-
By
Ster
n -
--
-M
inor
N
o N
o M
inor
188
NM
I 27
/09/
81
1981
Se
ptem
ber
Sout
hern
Fi
xed
Stee
l Su
pply
St
ern
-C
argo
Tra
nsfe
r -
-M
inor
N
o N
o M
inor
189
DE
n 02
/10/
81
1981
O
ctob
er
Nor
ther
n Fi
xed
Stee
l D
iver
Sup
port
-
5.5
App
roac
hing
Ins
talla
tion
W
eath
er C
ondi
tions
Le
g A
2 Fe
nder
N
o N
o M
inor
190
DE
n 06
/10/
81
1981
O
ctob
er
Nor
ther
n Se
mi-
Subm
ersi
ble
Dri
lling
Su
pply
St
ern
5.0
Anc
hor
Han
dlin
g E
ngin
e Po
wer
Fai
lure
D
iago
nal B
race
C
3 D
ent w
ith C
rack
N
o Y
es
Min
or
191
DE
n 02
/11/
81
1981
N
ovem
ber
Nor
ther
n Fi
xed
Stee
l Su
pply
Si
de
2.0
Car
go U
nloa
ding
-
No.
3 L
eg
Fend
er
No
No
Min
or
192
NM
I 12
/11/
81
1981
N
ovem
ber
-Se
mi-
Subm
ersi
ble
Dri
lling
Su
pply
-
4.0
Car
go T
rans
fer
Mis
judg
emen
t St
orag
e T
ank
Min
or
No
No
Min
or
193
DE
n 24
/12/
81
1981
D
ecem
ber
Cen
tral
Fi
xed
Stee
l Su
pply
St
ern
2.0
Car
go L
oadi
ng
Mis
judg
emen
t D
iago
nal B
race
D
ent
No
Yes
M
inor
194
DE
n 19
82
1982
-
-Fi
xed
Stee
l Su
pply
Si
de
1.0
App
roac
hing
Ins
talla
tion
E
ngin
e C
ontr
ol F
ailu
re
Dia
gona
l Bra
ce
Den
t N
o N
o M
inor
195
DE
n 08
/02/
82
1982
Fe
brua
ry
Nor
ther
n Fi
xed
Stee
l Su
pply
-
4.0
Car
go U
nloa
ding
C
onta
iner
s C
rane
Fai
lure
R
iser
Ben
d N
o N
o M
inor
196
DE
n 24
/02/
82
1982
Fe
brua
ry
Nor
ther
n Fi
xed
Stee
l D
iver
Sup
port
B
ow
4.0
Div
ing
Ope
ratio
ns
D.P
. Com
pute
r Fa
ilure
Le
g B
2 D
ent
No
Yes
M
inor
197
NM
I 27
/02/
82
1982
Fe
brua
ry
Nor
ther
n Se
mi-
Subm
ersi
ble
Dri
lling
Su
pply
St
ern
4.0
Car
go T
rans
fer
Wea
ther
Con
ditio
ns
-M
inor
N
o N
o M
inor
198
NM
I 06
/04/
82
1982
A
pril
Nor
ther
n Fi
xed
Stee
l Su
pply
St
ern
2.0
App
roac
hing
Ins
talla
tion
M
isju
dgem
ent
Leg
K7
Min
or
No
No
Min
or
199
DE
n 06
/05/
82
1982
M
ay
Nor
ther
n Fi
xed
Stee
l D
iver
Sup
port
B
ow
3.0
Div
ing
Ope
ratio
ns
D.P
. Fai
lure
Le
g B
4 M
inor
N
o N
o M
inor
200
DE
n 13
/05/
82
1982
M
ay
-Se
mi-
Subm
ersi
ble
Dri
lling
St
and-
By
Bow
-
App
roac
hing
Ins
talla
tion
E
ngin
e Fa
ilure
C
olum
n 1
Den
t and
Life
boat
N
o N
o M
inor
76

Con
sec.
N
o.
162
Inst
alla
tion
Dam
age
Det
ails
Rep
aire
d R
epai
r Det
ails
Ves
sel
Cla
ss
Oth
er S
ourc
e
AT
TEN
DA
NT
VES
SEL
CO
LLIS
ION
S U
nspe
cifie
d m
inor
dam
age.
-
--
--
163
Den
t 1.8
3m x
1.2
9m x
0.1
m (H
x W
x D
) bet
wee
n 2n
d. a
nd 3
rd. r
ing
fram
es a
t 79'
dra
ft.
--
--
-
164
Pai
nt s
crap
e on
ly v
isib
le d
amag
e.
No
--
--
165
Hea
vy c
onta
ct w
hilst
moo
red
alon
gsid
e (s
ubst
anti
al d
amag
e).
--
--
-
166
3' -
5' a
bove
wat
erlin
e. C
ella
r de
ck c
atw
alk
torn
. 24'
slip
-poi
nt d
ente
d w
ith 6
" in
dent
. -
--
--
167
Par
tial
tear
ing
of b
oat b
umpe
r.
--
--
-
168
Scor
ing
to le
g.
--
--
-
169
Rem
oval
of c
oati
ng o
n pi
ping
. -
--
--
170
Uns
peci
fied
min
or d
amag
e.
--
Min
or
--
171
Uns
peci
fied
min
or d
amag
e.
--
Seve
re
Ves
sel h
oled
abo
ve w
ater
line
in w
ay o
f No.
5 fr
esh
wat
er ta
nk.
-
172
Uns
peci
fied
min
or d
amag
e.
--
--
-
173
Uns
peci
fied
min
or d
amag
e.
--
--
-
174
Uns
peci
fied
min
or d
amag
e.
--
--
-
175
Bra
ce in
dent
ed 3
0" x
17"
x 3
" (L
x W
x D
) at
-9'
ele
vatio
n.
Yes
Fo
llow
ing
furt
her
dam
age
mem
ber
was
rep
lace
d in
198
2.
--
-
176
Den
t 2m
x 2
.2m
x 0
.1m
(H x
W x
D) i
n C
-9 ta
nk a
t 23m
. -
--
--
177
Dam
age
to s
pide
r de
ck s
tair
way
sup
port
/mov
emen
t of r
ope
shoc
k ab
sorb
er c
lam
p.
--
--
-
178
Den
ts in
B-9
tank
at 2
4 m
leve
l 1m
x 1
m x
0.0
5m a
nd 0
.8 x
0.7
m x
0.0
8m (H
x W
x D
). -
--
--
179
Den
t 0.8
m x
0.7
m x
0.0
6m (
H x
W x
D)
at 2
5 m
dra
ft (lo
catio
n ta
nk 2
08).
--
--
HSE
180
24"
rise
r pi
pe in
mon
el s
heat
h de
nted
. C
rack
s in
cla
mp
wel
ds a
t cel
lar
deck
leve
l. -
-M
inor
U
nspe
cifie
d m
inor
dam
age.
H
SE
181
Nav
igat
ion
light
and
par
t of p
latf
orm
dem
olis
hed.
-
--
-H
SE
182
Ben
t 0.1
0m -
0.1
5m.
--
--
-
183
Tim
ber
fend
ers
and
hold
ers
dam
aged
. -
--
-H
SE
184
Dam
age
to h
ull o
f Wes
t No.
1 li
febo
at.
No
-M
oder
ate
Loss
of 3
m m
ast.
HSE
185
Tor
n m
onel
cla
ddin
g an
d da
mag
e to
cru
cifo
rm s
trut
on
E1
leg.
-
--
--
186
Impa
ct c
ause
d pl
atfo
rm to
sha
ke.
No
--
-H
SE
187
Uns
peci
fied
min
or d
amag
e.
--
--
-
188
Uns
peci
fied
min
or d
amag
e.
--
--
-
189
Dis
plac
emen
t of u
pper
can
leg
A2
boat
bum
per,
dam
age
to s
tair
way
sup
port
. -
--
-H
SE
190
Bra
ce C
3 in
dent
ed 0
.45m
x 0
.45m
x 0
.063
m (
H x
W x
D).
Cra
cks
in 3
pla
ces
betw
een
hull
and
stiff
ener
. -
-M
inor
-
HSE
191
Bot
tom
can
of b
umpe
r in
dent
ed a
nd to
p ca
n di
spla
ced.
-
--
-H
SE
192
Pai
nt s
crap
ed o
ff C
-9 t
ank.
-
--
--
193
Elli
ptic
al d
ent,
250m
m x
150
mm
x 7
mm
with
out s
kin
pene
trat
ion.
-
-M
inor
Fe
nder
den
ted,
ste
rn p
latin
g se
t in
0.07
m o
ver
0.9m
. H
SE
194
Smal
l ind
enta
tion
on c
ross
mem
ber
C1
- D
1.
--
Non
e N
o da
mag
e.
-
195
Ris
er b
ent 1
2" -
18"
at 1
0' a
bove
wat
erlin
e, G
2 pi
le g
uide
also
affe
cted
. -
-Se
vere
V
esse
l hul
l pie
rced
by
pile
follo
wer
in tw
o pl
aces
and
loss
of b
oat a
eria
ls.
HSE
196
15' a
bove
wat
erlin
e.
--
Min
or
Slig
ht c
rush
dam
age
to b
ow p
lati
ng.
HSE
197
Uns
peci
fied
min
or d
amag
e.
--
--
-
198
Uns
peci
fied
min
or d
amag
e.
--
--
-
199
Den
ting
of r
edun
dant
con
duit
att
ache
d to
leg.
-
D.P
. ope
rati
onal
pro
cedu
res
alte
red
as a
res
ult o
f inc
iden
t.
Min
or
Scra
ping
of p
aint
. -
200
Uns
peci
fied
dent
s to
dia
gona
l bra
ce a
nd m
ain
deck
sup
port
s. 2
life
boat
s da
mag
ed.
Yes
R
epai
red
at R
otte
rdam
. Se
vere
T
akin
g in
wat
er. T
aken
to L
owes
toft
for
repa
irs.
W
OA
D &
LM
IS
77

Con
sec.
N
o.
201
Info
rmat
ion
Sour
ce
Dat
e (d
d/m
m/y
r) Y
ear
Mon
th
Loca
tion
Inst
alla
tion
Typ
e Im
pact
V
esse
l Typ
e Im
pact
O
rien
tatio
n Se
a C
ondi
tion
Ope
ratin
g C
ircu
mst
ance
s Pr
imar
y C
ause
Im
pact
Poi
nt
Inst
alla
tion
Dam
age
Stiff
ener
D
amag
e Pl
ate
Den
ts In
stal
latio
n D
amag
e C
lass
AT
TEN
DA
NT
VES
SEL
CO
LLIS
ION
S D
En
22/0
5/82
19
82
May
N
orth
ern
Fixe
d St
eel
Supp
ly
Ster
n -
Car
go U
nloa
ding
M
isju
dgem
ent
Dia
gona
l Bra
ce
Min
or
No
No
Min
or
202
DE
n 10
/07/
82
1982
Ju
ly
Sout
hern
Fi
xed
Stee
l St
and-
By
--
App
roac
hing
Ins
talla
tion
W
eath
er C
ondi
tion
s R
iser
Gua
rd
Min
or
No
No
Min
or
203
DE
n 19
/07/
82
1982
Ju
ly
Nor
ther
n Fi
xed
Stee
l Su
pply
-
3.75
C
argo
Unl
oadi
ng
Mis
judg
emen
t Le
g B
1 Fe
nder
N
o N
o M
inor
204
NM
I 17
/09/
82
1982
Se
ptem
ber
Cen
tral
Se
mi-
Subm
ersi
ble
Dri
lling
Su
pply
St
ern
1.0
Car
go T
rans
fer
Wea
ther
Con
ditio
ns
-M
inor
N
o N
o M
inor
205
DE
n 24
/09/
82
1982
Se
ptem
ber
Cen
tral
Fi
xed
Stee
l Su
pply
St
ern
-C
argo
Unl
oadi
ng
Mis
judg
emen
t D
iago
nal B
race
Fe
nder
N
o N
o M
inor
206
HSE
13
/12/
82
1982
D
ecem
ber
Nor
ther
n Fi
xed
Stee
l Su
pply
-
-C
argo
Tra
nsfe
r -
-D
ent
No
Yes
M
inor
207
DE
n 28
/12/
82
1982
D
ecem
ber
Cen
tral
Se
mi-
Subm
ersi
ble
Dri
lling
Su
pply
Si
de
2.5
App
roac
hing
Ins
talla
tion
M
isju
dgem
ent
Col
umn
D
Den
t Y
es
Yes
M
inor
208
OT
N 9
2 23
5 19
83
1983
-
Sout
hern
Fi
xed
Stee
l -
--
--
-D
ent
No
No
Min
or
209
NM
I 21
/01/
83
1983
Ja
nuar
y N
orth
ern
Ten
sion
Leg
Supp
ly
-5.
6 -
-C
olum
n 3
Non
e N
o N
o M
inor
210
DE
n 24
/01/
83
1983
Ja
nuar
y C
entr
al
Sem
i-Su
bmer
sibl
e D
rilli
ng
Supp
ly
Por
t Sid
e -
Car
go U
nloa
ding
C
onta
iner
s W
eath
er C
ondi
tions
C
olum
n SC
2 D
ent
No
Yes
M
inor
211
DE
n 02
/02/
83
1983
Fe
brua
ry
Sout
hern
Ja
ck-U
p Su
pply
Si
de
-C
argo
Unl
oadi
ng
Moo
ring
Fai
lure
B
ow L
eg
Dia
gona
l Bra
ce
Den
t N
o Y
es
Min
or
212
DE
n 05
/02/
83
1983
Fe
brua
ry
Cen
tral
Fi
xed
Stee
l Su
pply
St
ern
3.0
Dep
arti
ng I
nsta
llati
on
Wea
ther
Con
diti
ons
Leg
B3
Uns
peci
fied
No
No
Min
or
213
DE
n 24
/03/
83
1983
M
arch
C
hann
el
Jack
-Up
Supp
ly
Ster
n -
Roc
k D
umpi
ng
Wea
ther
Con
ditio
ns
Dia
gona
l Bra
ce
Min
or
No
No
Min
or
214
DE
n 28
/05/
83
1983
M
ay
Nor
ther
n Se
mi-
Subm
ersi
ble
Dri
lling
Su
pply
-
3.5
Car
go U
nloa
ding
C
onta
iner
s A
ncho
r D
ragg
ed D
ue
Wea
ther
D
iago
nal B
race
D
ent
No
Yes
M
inor
215
DE
n 30
/05/
83
1983
M
ay
Cen
tral
Se
mi-
Subm
ersi
ble
Dri
lling
Su
pply
St
bd. Q
uart
er
1.0
Car
go U
nloa
ding
D
.P. F
ailu
re
Col
umn
SC4
Fend
er
No
No
Min
or
216
DE
n 15
/07/
83
1983
Ju
ly
Nor
ther
n Fi
xed
Stee
l Su
pply
-
-C
argo
Loa
ding
W
eath
er C
ondi
tions
D
iago
nal B
race
A
1 M
inor
N
o N
o M
inor
217
DE
n 17
/07/
83
1983
Ju
ly
Sout
hern
Fi
xed
Stee
l D
iver
Sup
port
-
-D
epar
ting
Ins
talla
tion
W
eath
er C
ondi
tion
s D
iago
nal B
race
M
inor
N
o N
o M
inor
218
DE
n 10
/08/
83
1983
A
ugus
t C
entr
al
Fixe
d St
eel
Div
er S
uppo
rt
Ster
n -
Div
ing
Ope
ratio
ns
D.P
. Ele
ctri
cal F
ailu
re
Leg
B1
Min
or
No
No
Min
or
219
DE
n 16
/08/
83
1983
A
ugus
t C
entr
al
Sem
i-Su
bmer
sibl
e D
rilli
ng
Supp
ly
Side
1.
75
Car
go U
nloa
ding
E
rror
in M
oori
ng P
roce
dure
C
olum
n SC
2 D
ent
Yes
Y
es
Min
or
220
DE
n 03
/10/
83
1983
O
ctob
er
Cen
tral
Fi
xed
Stee
l D
iver
Sup
port
Si
de
-Pe
rson
nel T
rans
fer
Wea
ther
Con
ditio
ns
Leg
SW
Fend
er
No
No
Min
or
221
DE
n 26
/10/
83
1983
O
ctob
er
Cen
tral
Se
mi-
Subm
ersi
ble
Dri
lling
Su
pply
St
ern
-A
ncho
r H
andl
ing
Mis
judg
emen
t C
olum
n P
F D
ent
No
Yes
M
inor
222
DE
n 18
/11/
83
1983
N
ovem
ber
Cen
tral
Se
mi-
Subm
ersi
ble
Dri
lling
Su
pply
-
3.0
App
roac
hing
Ins
talla
tion
D
.P. F
ailu
re
Col
umn
D
Den
t Y
es
Yes
M
inor
223
DE
n 12
/01/
84
1984
Ja
nuar
y N
orth
ern
Fixe
d St
eel
Supp
ly
Bow
-
Car
go U
nloa
ding
E
ngin
e C
ontr
ol F
ailu
re
Leg
Dia
gona
l B
race
M
inor
N
o N
o M
inor
224
DE
n 19
/01/
84
1984
Ja
nuar
y So
uthe
rn
Fixe
d St
eel
Supp
ly
-1.
5 A
ppro
achi
ng I
nsta
llati
on
-Fe
nder
Fe
nder
N
o N
o M
inor
225
DE
n 21
/04/
84
1984
A
pril
Cen
tral
Fi
xed
Stee
l D
iver
Sup
port
St
ern
-D
ivin
g O
pera
tions
D
.P. F
ailu
re
Leg
A3
Den
t N
o Y
es
Min
or
226
DE
n 23
/05/
84
1984
M
ay
Cen
tral
Se
mi-
Subm
ersi
ble
Dri
lling
St
and-
By
--
App
roac
hing
Ins
talla
tion
M
isju
dgem
ent
Col
umn
1/2
Min
or
No
No
Min
or
227
DE
n 30
/05/
84
1984
M
ay
Nor
ther
n Fi
xed
Stee
l St
and-
By
Ster
n 1.
5 A
ppro
achi
ng I
nsta
llati
on
Rud
der
Mis
alig
ned
Leg
A4
Min
or
No
No
Min
or
228
DE
n 14
/07/
84
1984
Ju
ly
Cen
tral
Se
mi-
Subm
ersi
ble
Dri
lling
Su
pply
Si
de
-C
argo
Unl
oadi
ng
Tot
al P
ower
Los
s D
iago
nal B
race
D
ent
No
Yes
M
inor
229
DE
n 08
/10/
84
1984
O
ctob
er
Cen
tral
Se
mi-
Subm
ersi
ble
Pro
duct
ion
Anc
hor
Han
dler
St
ern
2.0
Anc
hor
Han
dlin
g M
isju
dgem
ent
Leg
E
Den
t Y
es
Yes
M
inor
230
DE
n 21
/11/
84
1984
N
ovem
ber
Cen
tral
Se
mi-
Subm
ersi
ble
Dri
lling
Su
pply
-
-C
argo
Unl
oadi
ng
Mis
judg
emen
t C
olum
n SC
2 D
ent
No
Yes
M
inor
231
DE
n 13
/01/
85
1985
Ja
nuar
y So
uthe
rn
Fixe
d St
eel
Stan
d-B
y -
-C
lose
Sup
port
D
.P. E
lect
rica
l Fai
lure
D
iago
nal B
race
M
inor
N
o N
o M
inor
232
DE
n 29
/03/
85
1985
M
arch
So
uthe
rn
Jack
-Up
Supp
ly
--
Car
go U
nloa
ding
-
Leg
No.
3
Wel
d D
amag
e N
o N
o M
inor
233
DE
n 04
/05/
85
1985
M
ay
Sout
hern
Fi
xed
Stee
l D
iver
Sup
port
-
-A
ppro
achi
ng I
nsta
llati
on
Anc
hor
Dra
gged
D
iago
nal B
race
D
ent
Yes
Y
es
Min
or
234
DE
n 11
/05/
85
1985
M
ay
Nor
ther
n Fi
xed
Stee
l D
iver
Sup
port
-
-D
ivin
g O
pera
tions
T
otal
Pow
er L
oss
Leg
B9
Min
or
No
No
Min
or
235
DE
n 04
/06/
85
1985
Ju
ne
Sout
hern
Fi
xed
Stee
l D
iver
Sup
port
-
--
Unt
angl
ing
Net
s La
ndin
g St
atio
n D
ent
No
Yes
M
inor
236
DE
n 11
/07/
85
1985
Ju
ly
Nor
ther
n Fi
xed
Stee
l St
and-
By
Side
C
alm
D
epar
ting
Ins
talla
tion
M
isju
dgem
ent
Leg
E2
Ben
d N
o N
o M
inor
237
DE
n 04
/08/
85
1985
A
ugus
t So
uthe
rn
Jack
-Up
Supp
ly
Ster
n 3.
0 C
argo
Unl
oadi
ng
Con
tain
ers
Mis
judg
emen
t Le
g M
inor
Y
es
No
Min
or
238
DE
n 10
/08/
85
1985
A
ugus
t C
entr
al
Fixe
d St
eel
Stan
d-B
y -
-A
ppro
achi
ng I
nsta
llati
on
Pos
t/O
pera
tion
Neg
lect
ed
Leg
B
Den
t N
o N
o M
inor
239
DE
n 15
/09/
85
1985
Se
ptem
ber
Sout
hern
Fi
xed
Stee
l Su
pply
St
ern
-C
argo
Unl
oadi
ng
D.P
. Fai
lure
La
ndin
g St
atio
n Fe
nder
N
o N
o M
inor
78

Con
sec.
N
o.
201
Inst
alla
tion
Dam
age
Det
ails
Rep
aire
d R
epai
r Det
ails
Ves
sel
Cla
ss
Oth
er S
ourc
e
AT
TEN
DA
NT
VES
SEL
CO
LLIS
ION
S Su
perf
icia
l dam
age
to m
embe
r co
atin
g/pa
intw
ork.
-
--
-H
SE
202
Pai
nt r
emov
ed.
--
--
HSE
203
Slig
ht d
ent i
n st
eel c
an a
roun
d ty
res
of B
1 le
g bo
at b
umpe
r at
3' f
rom
wat
erlin
e.
--
Non
e N
o da
mag
e.
HSE
204
Uns
peci
fied
min
or d
amag
e.
--
--
-
205
Tim
ber
fend
er s
play
ed, m
inor
dam
age
to fe
nder
she
ar p
late
. -
--
-H
SE
206
Seve
re b
uckl
ing
to lo
wer
can
boa
t bum
per.
Gus
set p
late
bet
wee
n st
abbi
ng g
uide
tubu
lar
and
leg
doub
ler
plat
e to
rn o
ff. S
light
den
ting
to le
g.
--
--
-
207
Dam
age
at 2
4m le
vel o
n co
lum
n. D
ent 0
.91m
x 1
.22m
x 0
.05m
(H x
W x
D).
2 de
ck b
eam
s an
d br
acke
ts d
isto
rted
, not
ser
ious
. -
--
-H
SE
208
5 de
nts
on h
oriz
onta
l bra
ce o
n ro
w 1
bet
wee
n le
gs A
1 an
d B
1 at
+7.
5' e
leva
tion.
Wor
st in
dent
25
0mm
x 3
05m
m x
50m
m (L
x W
x D
) with
loca
l cre
asin
g. R
edun
dant
mem
ber.
N
o -
--
-
209
No
dam
age.
N
o In
tern
al e
xam
inat
ion
of c
olum
n w
all b
y O
.I.M
. M
oder
ate
Ves
sel's
boa
t bum
per
badl
y bu
ckle
d ab
ove
wat
erlin
e.
-
210
Den
ting
2m x
2m
x 0
.05m
(H x
W x
D).
80' d
raft
on c
olum
n SC
2 af
t. N
o -
--
HSE
211
Hor
izon
tal m
embe
r da
mag
ed b
y 4"
- 6
" at
175
' lev
el to
geth
er w
ith d
iago
nal m
embe
rs a
ttac
hed
to u
nder
side
of i
t. -
--
-H
SE
212
No
repo
rt o
n da
mag
e. O
ccur
red
just
abo
ve w
ater
line.
-
--
--
213
Min
imal
dam
age
to d
iago
nal b
raci
ng b
etw
een
64' -
74'
leve
l. -
--
-H
SE
214
Bra
cing
col
umn
B to
dec
k no
de 2
inde
nted
0.6
1m x
0.6
1m x
0.1
m (
H x
W x
D)
at 1
m a
bove
w
ater
line.
-
--
-H
SE
215
Slig
ht s
crap
ing
and
inde
ntat
ion
of b
oat b
umpe
r.
No
-M
inor
Sc
rape
d pa
intw
ork.
H
SE
216
Impa
ct o
n le
g A
1, b
race
, spi
der
deck
wal
kway
and
dec
k pl
atin
g on
MSF
. -
--
-H
SE
217
Pai
nt r
emov
ed.
--
--
HSE
218
Bre
akdo
wn
of s
truc
tura
l coa
ting/
rem
oval
of m
arin
e fo
ulin
g.
--
--
-
219
Den
t 1.0
m x
0.8
5m x
0.0
8m (H
x W
x D
) at 2
3.5m
dra
ft. S
tiffe
ner
No.
6 p
ushe
d in
40
mm
. -
--
--
220
No
stru
ctur
al d
amag
e, d
ent i
n SW
moo
ring
fend
er.
--
Mod
erat
e P
latin
g de
nted
0.1
m -
0.1
25m
bet
wee
n fr
ames
ove
r a
1.5m
leng
th.
HSE
221
Den
t 0.4
8m x
0.9
1m x
0.0
25m
(H x
W x
D).
90' l
evel
por
t for
war
d co
lum
n.
--
--
HSE
222
Den
t 1.5
2m x
1.5
2m x
0.1
3m (H
x W
x D
) at 2
4m m
ark.
Den
t in
ring
stiff
ener
. -
-N
one
No
dam
age.
H
SE
223
Som
e pa
int l
oss.
N
o -
Seve
re
Seri
ous
dam
age
to b
ow, f
ract
ured
wel
ds a
nd d
amag
ed s
tiffe
ners
. H
SE
224
Boa
t bum
per
disc
onne
cted
at t
op, s
uspe
cted
bol
t she
ared
on
impa
ct a
nd w
ave
acti
on s
hock
bu
mpe
r fr
ee.
--
--
HSE
225
Inde
ntat
ion
of ja
cket
leg,
min
or p
aint
scu
ff to
leg.
-
-M
inor
D
ent o
n ve
ssel
ste
rn.
HSE
226
Wal
kway
s da
mag
ed, l
oss
of a
cces
s la
dder
and
sco
ring
on
PC
2 st
abili
ty b
liste
r.
No
-M
oder
ate
Mai
n m
ast s
napp
ed o
ff.
HSE
227
Supe
rfic
ial d
amag
e to
leg
atta
chm
ents
(la
dder
/tor
n fe
nder
bra
cket
s).
--
Mod
erat
e 2
punc
ture
s in
ste
rn p
latin
g ab
ove
wat
erlin
e.
HSE
228
150
- 25
0mm
dee
p de
nt in
dia
gona
l bra
ce b
etw
een
bott
om o
f No.
6 c
aiss
on a
nd to
p of
No.
5
cais
son.
. -
--
-H
SE
229
Den
t 1.8
2m x
3.0
m x
0.2
m (
H x
W x
D).
3 of
7 in
tern
al r
ibs
dent
ed in
E9
dry
tank
. -
--
-H
SE
230
75m
m d
eep
dent
at 8
7' d
raug
ht, o
ver
circ
ular
are
a 0.
9m d
iam
eter
. -
--
-H
SE
231
Pro
tect
ive
coat
ing
rem
oved
. -
--
-H
SE
232
Uns
peci
fied
wel
d da
mag
e.
--
--
HSE
233
Den
t 0.2
5m x
0.1
5m x
0.0
5m (H
x W
x D
) at s
ea le
vel.
--
--
HSE
234
Loss
of n
avig
atio
n lig
ht o
n le
g an
d da
mag
e to
mou
ntin
gs.
No
-M
inor
T
rivi
al d
amag
e to
hel
idec
k fe
ncin
g.
HSE
235
Inde
ntat
ion
at w
ater
line.
-
--
--
236
2 di
agon
al w
alkw
ay s
uppo
rts
bent
at +
5m le
vel;
tim
ber
fend
er a
t +3m
dam
aged
and
fend
er
reta
inin
g m
etal
rin
g; a
cces
s la
dder
to s
ea a
t +2.
5m d
amag
ed.
--
--
HSE
237
Slig
ht s
et to
gus
set p
late
bet
wee
n ho
rizo
ntal
and
dia
gona
l bra
cing
s.
--
Min
or
Den
ted
rubb
ing
stra
ke.
HSE
238
Den
t 0.5
m x
0.3
m x
0.1
m (H
x W
x D
). Sl
ight
inde
nt o
f ver
tical
bra
cing
mem
ber.
-
--
-H
SE
239
Min
or d
ent t
o fe
nder
and
som
e pa
int r
emov
al.
--
--
HSE
79
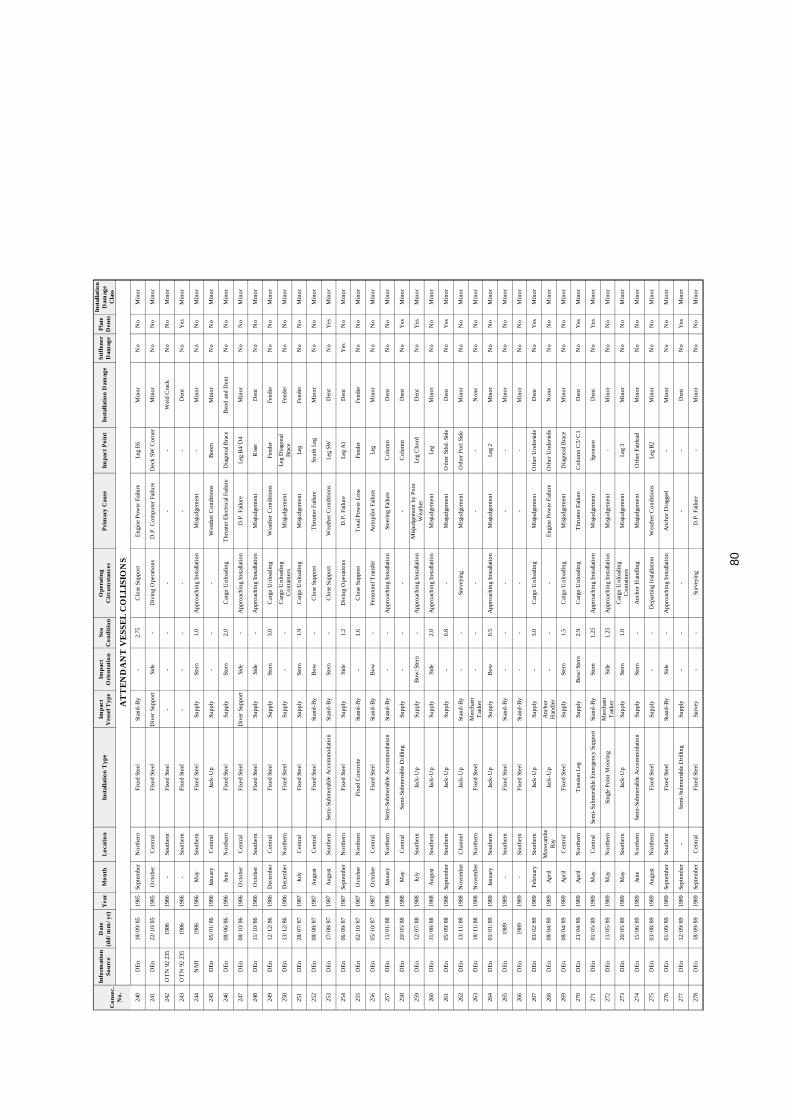
Con
sec.
N
o.
240
Info
rmat
ion
Sour
ce
Dat
e (d
d/m
m/y
r) Y
ear
Mon
th
Loca
tion
Inst
alla
tion
Typ
e Im
pact
V
esse
l Typ
e Im
pact
O
rien
tatio
n Se
a C
ondi
tion
Ope
ratin
g C
ircu
mst
ance
s Pr
imar
y C
ause
Im
pact
Poi
nt
Inst
alla
tion
Dam
age
Stiff
ener
D
amag
e Pl
ate
Den
ts In
stal
latio
n D
amag
e C
lass
AT
TEN
DA
NT
VES
SEL
CO
LLIS
ION
S D
En
18/0
9/85
19
85
Sept
embe
r N
orth
ern
Fixe
d St
eel
Stan
d-B
y -
2.75
C
lose
Sup
port
E
ngin
e Po
wer
Fai
lure
Le
g E
6 M
inor
N
o N
o M
inor
241
DE
n 22
/10/
85
1985
O
ctob
er
Cen
tral
Fi
xed
Stee
l D
iver
Sup
port
Si
de
-D
ivin
g O
pera
tions
D
.P. C
ompu
ter
Failu
re
Dec
k SW
Cor
ner
Min
or
No
No
Min
or
242
OT
N 9
2 23
5 19
86
1986
-
Sout
hern
Fi
xed
Stee
l -
--
--
-W
eld
Cra
ck
No
No
Min
or
243
OT
N 9
2 23
5 19
86
1986
-
Sout
hern
Fi
xed
Stee
l -
--
--
-D
ent
No
Yes
M
inor
244
NM
I 19
86
1986
M
ay
Sout
hern
Fi
xed
Stee
l Su
pply
St
ern
1.0
App
roac
hing
Ins
talla
tion
M
isju
dgem
ent
-M
inor
N
o N
o M
inor
245
DE
n 05
/01/
86
1986
Ja
nuar
y C
entr
al
Jack
-Up
Supp
ly
--
-W
eath
er C
ondi
tions
B
oom
M
inor
N
o N
o M
inor
246
DE
n 08
/06/
86
1986
Ju
ne
Nor
ther
n Fi
xed
Stee
l Su
pply
St
ern
2.0
Car
go U
nloa
ding
T
hrus
ter
Ele
ctri
cal F
ailu
re
Dia
gona
l Bra
ce
Ben
d an
d D
ent
No
No
Min
or
247
DE
n 08
/10/
86
1986
O
ctob
er
Cen
tral
Fi
xed
Stee
l D
iver
Sup
port
Si
de
-A
ppro
achi
ng I
nsta
llati
on
D.P
. Fai
lure
Le
g B
4/D
4 M
inor
N
o N
o M
inor
248
DE
n 11
/10/
86
1986
O
ctob
er
Sout
hern
Fi
xed
Stee
l Su
pply
Si
de
-A
ppro
achi
ng I
nsta
llati
on
Mis
judg
emen
t R
iser
Den
t N
o N
o M
inor
249
DE
n 12
/12/
86
1986
D
ecem
ber
Cen
tral
Fi
xed
Stee
l Su
pply
St
ern
3.0
Car
go U
nloa
ding
W
eath
er C
ondi
tion
s Fe
nder
Fe
nder
N
o N
o M
inor
250
DE
n 13
/12/
86
1986
D
ecem
ber
Nor
ther
n Fi
xed
Stee
l Su
pply
-
-C
argo
Unl
oadi
ng
Con
tain
ers
Mis
judg
emen
t Le
g D
iago
nal
Bra
ce
Fend
er
No
No
Min
or
251
DE
n 28
/07/
87
1987
Ju
ly
Cen
tral
Fi
xed
Stee
l Su
pply
St
ern
1.9
Car
go U
nloa
ding
M
isju
dgem
ent
Leg
Fend
er
No
No
Min
or
252
DE
n 08
/08/
87
1987
A
ugus
t C
entr
al
Fixe
d St
eel
Stan
d-B
y B
ow
-C
lose
Sup
port
T
hrus
ter
Failu
re
Sout
h Le
g M
inor
N
o N
o M
inor
253
DE
n 17
/08/
87
1987
A
ugus
t So
uthe
rn
Sem
i-Su
bmer
sibl
e A
ccom
mod
atio
n St
and-
By
Ster
n -
Clo
se S
uppo
rt
Wea
ther
Con
diti
ons
Leg
SW
Den
t N
o Y
es
Min
or
254
DE
n 06
/09/
87
1987
Se
ptem
ber
Nor
ther
n Fi
xed
Stee
l Su
pply
Si
de
1.2
Div
ing
Ope
ratio
ns
D.P
. Fai
lure
Le
g A
1 D
ent
Yes
N
o M
inor
255
DE
n 02
/10/
87
1987
O
ctob
er
Nor
ther
n Fi
xed
Con
cret
e St
and-
By
-1.
6 C
lose
Sup
port
T
otal
Pow
er L
oss
Fend
er
Fend
er
No
No
Min
or
256
DE
n 05
/10/
87
1987
O
ctob
er
Cen
tral
Fi
xed
Stee
l St
and-
By
Bow
-
Pers
onne
l Tra
nsfe
r A
utop
ilot F
ailu
re
Leg
Min
or
No
No
Min
or
257
DE
n 11
/01/
88
1988
Ja
nuar
y N
orth
ern
Sem
i-Su
bmer
sibl
e A
ccom
mod
atio
n St
and-
By
--
App
roac
hing
Ins
talla
tion
St
eeri
ng F
ailu
re
Col
umn
Den
t N
o N
o M
inor
258
DE
n 20
/05/
88
1988
M
ay
Cen
tral
Se
mi-
Subm
ersi
ble
Dri
lling
Su
pply
-
--
-C
olum
n D
ent
No
Yes
M
inor
259
DE
n 12
/07/
88
1988
Ju
ly
Sout
hern
Ja
ck-U
p Su
pply
B
ow/S
tern
-
App
roac
hing
Ins
talla
tion
M
isju
dgem
ent b
y P
oor
Wea
ther
Le
g C
hord
D
ent
No
Yes
M
inor
260
DE
n 31
/08/
88
1988
A
ugus
t So
uthe
rn
Jack
-Up
Supp
ly
Side
2.
0 A
ppro
achi
ng I
nsta
llati
on
Mis
judg
emen
t Le
g M
inor
N
o N
o M
inor
261
DE
n 05
/09/
88
1988
Se
ptem
ber
Sout
hern
Ja
ck-U
p Su
pply
-
0.8
-M
isju
dgem
ent
Oth
er S
tbd.
Sid
e D
ent
No
Yes
M
inor
262
DE
n 13
/11/
88
1988
N
ovem
ber
Cha
nnel
Ja
ck-U
p St
and-
By
--
Surv
eyin
g M
isju
dgem
ent
Oth
er P
ort S
ide
Min
or
No
No
Min
or
263
DE
n 18
/11/
88
1988
N
ovem
ber
Nor
ther
n Fi
xed
Stee
l M
erch
ant
Tan
ker
--
--
-N
one
No
No
Min
or
264
DE
n 01
/01/
89
1989
Ja
nuar
y So
uthe
rn
Jack
-Up
Supp
ly
Bow
0.
5 A
ppro
achi
ng I
nsta
llati
on
Mis
judg
emen
t Le
g 2
Min
or
No
No
Min
or
265
DE
n 19
89
1989
-
Sout
hern
Fi
xed
Stee
l St
and-
By
--
--
-M
inor
N
o N
o M
inor
266
DE
n 19
89
1989
-
Sout
hern
Fi
xed
Stee
l St
and-
By
--
--
-M
inor
N
o N
o M
inor
267
DE
n 03
/02/
89
1989
Fe
brua
ry
Sout
hern
Ja
ck-U
p Su
pply
-
3.0
Car
go U
nloa
ding
M
isju
dgem
ent
Oth
er U
nder
side
D
ent
No
Yes
M
inor
268
DE
n 08
/04/
89
1989
A
pril
Mor
ecam
be
Bay
Ja
ck-U
p A
ncho
r H
andl
er
--
-E
ngin
e Po
wer
Fai
lure
O
ther
Und
ersi
de
Non
e N
o N
o M
inor
269
DE
n 08
/04/
89
1989
A
pril
Cen
tral
Fi
xed
Stee
l Su
pply
St
ern
1.5
Car
go U
nloa
ding
M
isju
dgem
ent
Dia
gona
l Bra
ce
Min
or
No
No
Min
or
270
DE
n 23
/04/
89
1989
A
pril
Nor
ther
n T
ensio
n Le
g Su
pply
B
ow/S
tern
2.
9 C
argo
Unl
oadi
ng
Thr
uste
r Fa
ilure
C
olum
n C
5/C
1 D
ent
No
Yes
M
inor
271
DE
n 01
/05/
89
1989
M
ay
Cen
tral
Se
mi-
Subm
ersib
le E
mer
genc
y Su
ppor
t St
and-
By
Ster
n 1.
25
App
roac
hing
Ins
talla
tion
M
isju
dgem
ent
Spon
son
Den
t N
o Y
es
Min
or
272
DE
n 11
/05/
89
1989
M
ay
Nor
ther
n Si
ngle
Poi
nt M
oori
ng
Mer
chan
t T
anke
r Si
de
1.25
A
ppro
achi
ng I
nsta
llati
on
Mis
judg
emen
t -
Min
or
No
No
Min
or
273
DE
n 20
/05/
89
1989
M
ay
Sout
hern
Ja
ck-U
p Su
pply
St
ern
1.0
Car
go U
nloa
ding
C
onta
iner
s M
isju
dgem
ent
Leg
3 M
inor
N
o N
o M
inor
274
DE
n 15
/06/
89
1989
Ju
ne
Nor
ther
n Se
mi-
Subm
ersi
ble
Acc
omm
odat
ion
Supp
ly
Ster
n -
Anc
hor
Han
dlin
g M
isju
dgem
ent
Oth
er F
airl
ead
Min
or
No
No
Min
or
275
DE
n 03
/08/
89
1989
A
ugus
t N
orth
ern
Fixe
d St
eel
Supp
ly
--
Dep
arti
ng I
nsta
llati
on
Wea
ther
Con
ditio
ns
Leg
B2
Min
or
No
No
Min
or
276
DE
n 01
/09/
89
1989
Se
ptem
ber
Sout
hern
Fi
xed
Stee
l St
and-
By
Side
-
App
roac
hing
Ins
talla
tion
A
ncho
r D
ragg
ed
-M
inor
N
o N
o M
inor
277
DE
n 12
/09/
89
1989
Se
ptem
ber
-Se
mi-
Subm
ersib
le D
rilli
ng
Supp
ly
--
--
-D
ent
No
Yes
M
inor
278
DE
n 18
/09/
89
1989
Se
ptem
ber
Cen
tral
Fi
xed
Stee
l Su
rvey
-
-Su
rvey
ing
D.P
. Fai
lure
-
Min
or
No
No
Min
or
80

Con
sec.
N
o.
240
Inst
alla
tion
Dam
age
Det
ails
Rep
aire
d R
epai
r Det
ails
Ves
sel
Cla
ss
Oth
er S
ourc
e
AT
TEN
DA
NT
VES
SEL
CO
LLIS
ION
S Fr
actu
re o
f bio
cide
inje
ctio
n lin
e/va
lve.
-
-M
inor
D
amag
ed r
ailin
gs a
mid
ship
s.
-
241
Onl
y m
inor
dam
age
to h
and
rails
. N
o -
Mod
erat
e St
arbo
ard
rada
r m
ast b
roke
n.
HSE
242
5" lo
ng w
eld
crac
k on
join
t bet
wee
n ve
rtic
al d
iago
nal b
race
on
row
2 a
djac
ent t
o le
g D
2 an
d ho
rizo
ntal
mem
ber
at -
20' e
leva
tion.
-
--
--
243
Inde
nt 6
00m
m x
400
mm
x 1
00m
m (L
x W
x D
) on
diag
onal
bra
ce o
n ro
w 3
, 150
mm
bel
ow
join
t at l
eg A
3 at
+18
' ele
vatio
n.
No
--
--
244
Supe
rfic
ial s
crat
ches
on
a pl
atfo
rm m
embe
r.
No
Mem
ber
insp
ecte
d, n
o re
pair
nee
ded.
-
--
245
Por
t bur
ner
boom
/EM
D e
xhau
st li
nes.
-
--
--
246
Bra
ce b
etw
een
legs
B6
and
D6
bow
ed b
y 12
0mm
and
den
ted.
-
-M
inor
P
aint
dam
age.
O
TN
92
235
&
HSE
247
Impa
cted
leg
D4
at 9
m le
vel,
pain
t dam
age
only
. Im
pact
ed le
g B
4, d
amag
e to
Nos
. 2 a
nd 3
fe
nder
s. -
-M
inor
0.
20m
inde
ntat
ion
on p
ort s
ide.
Dam
age
to p
ort s
ide
fuel
tank
No.
22.
-
248
Ris
er p
rote
ctio
n in
dent
ed b
y 1"
. Str
uck
24"
deep
wel
l pro
tect
ion
fram
e ca
usin
g de
nt 0
.25m
x
0.2m
x 0
.05m
(H x
W x
D).
--
--
-
249
Dam
age
to fe
nder
on
SW le
g.
--
Min
or
Slig
ht in
dent
atio
n to
ves
sel r
ubbi
ng b
and.
-
250
A2
boat
bum
per
seve
rely
buc
kled
, 150
mm
tear
in h
oriz
onta
l gus
set p
late
. Slig
ht d
entin
g of
leg
brac
e.
--
--
-
251
Inde
ntat
ion
to fe
nder
pro
tect
ing
NW
leg.
-
-M
inor
D
ent o
n st
ern.
H
SE
252
Ves
sel i
mpa
cted
bet
wee
n le
gs B
5 an
d C
5. D
amag
e to
pai
ntw
ork
and
stru
ctur
e co
atin
g.
--
Min
or
Dam
age
to th
e fo
repe
ak li
ghts
and
fore
mas
t.
HSE
253
Scaf
fold
ing
took
full
brun
t of c
ollis
ion.
Den
t in
SW le
g 3.
5" x
0.5
" x
0.18
8" (
H x
W x
D).
M
arin
e gr
owth
rem
oved
on
diag
onal
cro
ss m
embe
r.
--
--
-
254
8" d
ent i
n ho
rizo
ntal
and
ver
tical
pile
gui
de s
tiffe
ner
at +
4m e
leva
tion.
Low
er la
dder
on
leg
A1
dest
roye
d.
--
Seve
re
Hol
ed a
bove
wat
erlin
e 6'
from
bow
s.
-
255
Col
lisio
n w
ith fe
nder
on
No.
5 le
g, n
o da
mag
e to
pla
tfor
m.
No
-M
inor
T
op m
ast
bent
, nav
igat
ion
light
s sm
ashe
d.
HSE
256
Impa
ct b
etw
een
legs
D2
and
D4.
Wal
kway
s an
d ha
nd r
ails
at +
9m le
vel s
ever
ely
dam
aged
. -
-M
oder
ate
Ext
ensi
ve d
amag
e su
stai
ned
by b
ridg
e in
clud
ing
dam
age
to m
ain
engi
ne c
ontr
ols
and
loss
of
stee
ring
. H
SE, W
OA
D &
LM
IS
257
Den
t ove
r an
d un
der
ring
span
t No.
20,
1.2
m x
0.5
m x
0.1
2m (H
x W
x D
). -
--
--
258
Dam
age
to N
o. 3
por
t col
umn
shel
l pla
ting
3m x
3m
x 0
.1m
(H
x W
x D
). B
oat b
umpe
r (s
et
in 8
" -
12")
and
acc
ess
stai
rway
from
mai
n de
ck to
pla
tfor
m d
amag
ed.
--
--
-
259
Den
t on
bow
leg
chor
d 6"
dia
met
er x
0.5
" at
+14
9' le
vel.
2' b
elow
poi
nt w
here
hor
izon
tal
brac
e m
eets
leg
chor
d.
--
Min
or
Det
ails
unkn
own,
sus
tain
ed d
amag
e ab
ove
wat
erlin
e at
bow
, ste
rn u
ndam
aged
. -
260
Slig
ht d
amag
e to
cra
dle
of d
avit
laun
ched
life
raft
. -
-M
inor
-
-
261
Impa
ct s
tarb
oard
aft
, den
t 0.6
1m x
0.6
1m x
0.1
m (
H x
W x
D).
--
Min
or
--
262
Ves
sel b
ecam
e en
tang
led
in s
ervi
ce h
oses
, 2 x
5"
& 1
x 4"
hos
es to
rn. 1
x 5
" ga
te v
alve
dam
aged
. -
-M
inor
B
ent a
ft m
ast.
-
263
No
dam
age
obse
rved
. N
o -
Min
or
Ves
sel d
amag
ed, d
etai
ls un
know
n.
-
264
Edg
e br
oken
off
toot
h at
leve
l 7 o
n le
g N
o. 2
, fro
nt r
ack.
-
--
--
265
Min
or d
amag
e to
pla
tfor
m.
--
Non
e N
o da
mag
e.
-
266
Pla
tfor
m d
amag
e un
dete
rmin
ed.
--
Min
or
Min
or d
ent t
o st
ern.
-
267
Smal
l den
t an
d sc
ratc
h m
arks
on
rig
bott
om p
lati
ng.
--
Min
or
Uns
peci
fied.
-
268
No
dam
age
repo
rted
. N
o -
Non
e N
o de
tails
, ass
umed
to b
e no
dam
age.
H
SE
269
Coa
ting
dam
age
to a
2' s
quar
e ar
ea o
n di
agon
al c
ross
bra
ce a
t sea
leve
l. -
-M
inor
St
ern
rolle
r su
stai
ned
a 2'
x 2
" de
nt.
-
270
Elli
ptic
al d
amag
e to
C5
10' x
2' x
2"
(H x
W x
D).
36"
x 16
" re
mov
al o
f sur
face
coa
ting.
3"
squa
re fl
atte
ning
of r
adiu
s on
C1.
2' -
3' a
bove
LA
T.
--
Min
or
Dam
age
to r
ubbi
ng s
trak
e.
HSE
271
0.5"
inde
ntat
ion
of s
hell
plat
ing
4m a
bove
wat
er li
ne.
Supe
rfic
ial p
aint
dam
age.
-
-N
one
No
dam
age.
-
272
No
dam
age
to S
PM
bod
y. W
alkw
ay a
nd h
andr
ails
bent
and
tw
iste
d.
--
--
-
273
Sacr
ifici
al a
node
abo
ve w
ater
line
dislo
dged
from
leg
No.
3.
No
-Se
vere
D
amag
e to
ste
rn a
nd N
o. 1
1 ba
llast
wat
er ta
nk p
ierc
ed.
-
274
Tug
hit
No.
7 fa
irle
ad h
eavi
ly.
No
-N
one
No
dam
age.
-
275
Smal
l wal
kway
too
k im
pact
and
par
ted
at s
uppo
rts
at 6
m.
--
Min
or
No
deta
ils.
HSE
276
Pai
nt r
emov
ed fr
om p
latf
orm
bra
cing
. -
-M
inor
Su
perf
icia
l dam
age
occu
rred
to d
iver
's la
ndin
g st
age.
-
277
Cau
sed
inde
nts.
-
--
--
278
No
deta
ils, a
ny d
amag
e ap
pear
s to
be
supe
rfic
ial.
No
--
-H
SE
81

Con
sec.
N
o.
279
Info
rmat
ion
Sour
ce
Dat
e (d
d/m
m/y
r) Y
ear
Mon
th
Loca
tion
Inst
alla
tion
Typ
e Im
pact
V
esse
l Typ
e Im
pact
O
rien
tatio
n Se
a C
ondi
tion
Ope
ratin
g C
ircu
mst
ance
s Pr
imar
y C
ause
Im
pact
Poi
nt
Inst
alla
tion
Dam
age
Stiff
ener
D
amag
e Pl
ate
Den
ts In
stal
latio
n D
amag
e C
lass
AT
TEN
DA
NT
VES
SEL
CO
LLIS
ION
S D
En
21/0
9/89
19
89
Sept
embe
r C
entr
al
Sem
i-Su
bmer
sibl
e D
rilli
ng
Stan
d-B
y B
ow
-A
ppro
achi
ng I
nsta
llati
on
Mis
judg
emen
t Sp
onso
n D
ent
Yes
Y
es
Min
or
280
DE
n 14
/10/
89
1989
O
ctob
er
Cen
tral
Fi
xed
Stee
l Su
pply
-
-A
ppro
achi
ng I
nsta
llati
on
Mis
judg
emen
t H
ose
Min
or
No
No
Min
or
281
DE
n 28
/10/
89
1989
O
ctob
er
Cen
tral
Se
mi-
Subm
ersi
ble
Dri
lling
St
and-
By
--
Clo
se S
uppo
rt
Mis
judg
emen
t C
olum
n E
D
ent a
nd L
ifebo
at
No
Yes
M
inor
282
DE
n 14
/01/
90
1990
Ja
nuar
y So
uthe
rn
Fixe
d St
eel
Stan
d-B
y B
ow
1.0
App
roac
hing
Ins
talla
tion
M
isju
dgem
ent
Land
ing
Stat
ion
Den
t N
o N
o M
inor
283
DE
n 25
/02/
90
1990
Fe
brua
ry
Sout
hern
Fi
xed
Stee
l St
and-
By
Side
2.
25
Clo
se S
uppo
rt
Wea
ther
Con
diti
ons
SW L
eg
Min
or
No
No
Min
or
284
DE
n 14
/03/
90
1990
M
arch
C
entr
al
Sem
i-Su
bmer
sibl
e D
rilli
ng
Anc
hor
Han
dler
-
-A
ncho
r H
andl
ing
-P
onto
on
Den
t N
o N
o M
inor
285
DE
n 21
/03/
90
1990
M
arch
M
orec
ambe
B
ay
Jack
-Up
Supp
ly
Stbd
. Ste
rn
-A
ppro
achi
ng I
nsta
llati
on
Mis
judg
emen
t C
ord
A P
ort L
eg
Min
or
No
No
Min
or
286
DE
n 22
/04/
90
1990
A
pril
Nor
ther
n Fi
xed
Stee
l St
and-
By
--
--
-M
inor
N
o N
o M
inor
287
DE
n 29
/04/
90
1990
A
pril
Nor
ther
n Fi
xed
Stee
l Su
pply
St
ern
--
Eng
ine
Con
trol
Fai
lure
O
ther
N S
ide
Fend
er
No
No
Min
or
288
DE
n 25
/05/
90
1990
M
ay
Cen
tral
Fi
xed
Stee
l Su
pply
St
ern
2.2
Car
go U
nloa
ding
M
isju
dgem
ent
Nor
th-W
est L
eg
Fend
er
No
No
Min
or
289
DE
n 28
/06/
90
1990
Ju
ne
Nor
ther
n Fi
xed
Con
cret
e Su
pply
St
ern
-C
argo
Unl
oadi
ng
Mis
judg
emen
t Le
g M
inor
N
o N
o M
inor
290
DE
n 23
/07/
90
1990
Ju
ly
Nor
ther
n Se
mi-
Subm
ersi
ble
Acc
omm
odat
ion
Supp
ly
Bow
1.
7 C
lose
Sup
port
-
Forw
ard
Anc
hor
Ass
embl
y Le
g 1
Den
t N
o Y
es
Min
or
291
HSE
24
/07/
90
1990
Ju
ly
Sout
hern
Fi
xed
Stee
l St
and-
By
--
--
Sout
h-W
est L
eg
Den
t N
o N
o M
inor
292
DE
n 11
/09/
90
1990
Se
ptem
ber
Cen
tral
Fi
xed
Stee
l St
and-
By
--
Clo
se S
uppo
rt
Ope
rato
r E
rror
K
3 Le
g M
inor
N
o N
o M
inor
293
DE
n 11
/10/
90
1990
O
ctob
er
Cen
tral
Se
mi-
Subm
ersib
le E
mer
genc
y Su
ppor
t Su
pply
Si
de
-C
argo
Tra
nsfe
r O
pera
tor
Err
or
Port
Cen
tre
Col
umn
Den
t Y
es
Yes
M
inor
294
DE
n 18
/10/
90
1990
O
ctob
er
Cen
tral
Se
mi-
Subm
ersi
ble
Dri
lling
St
and-
By
Side
1.
0 C
argo
Loa
ding
W
eath
er C
ondi
tions
C
olum
n 4
Min
or
No
No
Min
or
295
DE
n 22
/10/
90
1990
O
ctob
er
Cen
tral
Fi
xed
Stee
l Su
pply
-
--
--
Min
or
No
No
Min
or
296
HSE
16
/11/
90
1990
N
ovem
ber
-Ja
ck-U
p St
and-
By
--
Car
go T
rans
fer
D.P
. Con
trol
Fai
lure
Le
g M
inor
N
o N
o M
inor
297
DE
n 03
/12/
90
1990
D
ecem
ber
Sout
hern
Fi
xed
Con
cret
e St
and-
By
--
--
-M
inor
N
o N
o M
inor
298
DE
n 07
/12/
90
1990
D
ecem
ber
Cen
tral
Fi
xed
Stee
l Su
pply
St
ern
3.0
Car
go U
nloa
ding
C
onta
iner
s E
ngin
e C
ontr
ol F
ailu
re
Leg
J Fen
der
Fend
er
No
No
Min
or
299
DE
n 09
/12/
90
1990
D
ecem
ber
Cen
tral
Fi
xed
Stee
l Su
pply
St
ern
4.0
Car
go U
nloa
ding
M
isju
dgem
ent
Leg
B3
Min
or
No
No
Min
or
300
DE
n 31
/12/
90
1990
D
ecem
ber
Nor
ther
n Se
mi-
Subm
ersi
ble
Dri
lling
Su
pply
-
4.25
C
argo
Tra
nsfe
r W
eath
er C
ondi
tions
D
iago
nal B
race
D
ent
No
No
Min
or
301
DE
n 01
/01/
91
1991
Ja
nuar
y M
orec
ambe
B
ay
Jack
-Up
Supp
ly
Bow
2.
75
Car
go L
oadi
ng
Mis
judg
emen
t Le
g M
inor
N
o N
o M
inor
302
DE
n 03
/01/
91
1991
Ja
nuar
y C
entr
al
Sem
i-Su
bmer
sibl
e D
rilli
ng
Anc
hor
Han
dler
St
ern
-A
ncho
r H
andl
ing
Tot
al P
ower
Los
s D
iago
nal B
race
N
o. 1
M
inor
N
o N
o M
inor
303
DE
n 03
/01/
91
1991
Ja
nuar
y So
uthe
rn
Jack
-Up
Supp
ly
--
--
-N
one
No
No
Min
or
304
DE
n 21
/01/
91
1991
Ja
nuar
y C
entr
al
Sem
i-Su
bmer
sibl
e D
rilli
ng
Supp
ly
-3.
0 C
argo
Tra
nsfe
r Po
wer
Fai
lure
Fe
nder
on
Leg
3 Fe
nder
N
o Y
es
Min
or
305
DE
n 04
/03/
91
1991
M
arch
M
orec
ambe
B
ay
Jack
-Up
Supp
ly
-2.
0 -
-Po
rt L
eg
Min
or
No
No
Min
or
306
DE
n 09
/03/
91
1991
M
arch
C
entr
al
Sem
i-Su
bmer
sibl
e D
rilli
ng
Supp
ly
Ster
n -
Car
go L
oadi
ng
Eng
ine
Con
trol
Fai
lure
Po
rt C
entr
e C
olum
n D
ent
No
No
Min
or
307
DE
n 18
/03/
91
1991
M
arch
C
entr
al
Sem
i-Su
bmer
sibl
e D
rilli
ng
Supp
ly
-3.
0 C
argo
Tra
nsfe
r -
C C
olum
n D
ent
No
Yes
M
inor
308
DE
n 28
/04/
91
1991
A
pril
Sout
hern
Fi
xed
Stee
l St
and-
By
Side
3.
0 C
lose
Sup
port
M
anoe
uvri
ng M
isju
dgem
ent
Rise
r M
inor
N
o N
o M
inor
309
DE
n 22
/08/
91
1991
A
ugus
t So
uthe
rn
Fixe
d St
eel
Supp
ly
--
--
Dia
gona
l Bra
ce
Ben
d an
d D
ent
No
Yes
M
inor
310
DE
n 31
/08/
91
1991
A
ugus
t N
orth
ern
Fixe
d C
oncr
ete
Supp
ly
--
Car
go T
rans
fer
-C
ell 3
M
inor
N
o N
o M
inor
311
DE
n 04
/09/
91
1991
Se
ptem
ber
Sout
hern
Fi
xed
Stee
l Su
pply
-
--
-SW
Leg
U
nspe
cifie
d N
o N
o M
inor
312
DE
n 21
/10/
91
1991
O
ctob
er
Cen
tral
Se
mi-
Subm
ersi
ble
Pro
duct
ion
Supp
ly
Side
4.
0 C
lose
Sup
port
M
isju
dgem
ent
Leg
C
Den
t Y
es
Yes
M
inor
313
DE
n 07
/11/
91
1991
N
ovem
ber
Cen
tral
Se
mi-
Subm
ersi
ble
Dri
lling
Su
pply
-
-C
argo
Tra
nsfe
r M
isju
dgem
ent
No.
2 S
tbd.
C
aiss
on
Min
or
No
No
Min
or
314
DE
n 18
/11/
91
1991
N
ovem
ber
Sout
hern
Ja
ck-U
p Su
pply
-
--
Mis
judg
emen
t -
Den
t N
o N
o M
inor
315
DE
n 27
/11/
91
1991
N
ovem
ber
Nor
ther
n Se
mi-
Subm
ersi
ble
Dri
lling
Su
pply
St
ern
-C
argo
Tra
nsfe
r M
isju
dgem
ent
No.
2 S
tbd.
C
entr
e C
aiss
on
Den
t N
o Y
es
Min
or
316
DE
n 21
/01/
92
1992
Ja
nuar
y C
entr
al
Sem
i-Su
bmer
sibl
e D
rilli
ng
Supp
ly
Ster
n 4.
0 C
argo
Tra
nsfe
r M
isju
dgem
ent
Stbd
. Col
umn
Min
or
No
No
Min
or
317
DE
n 31
/01/
92
1992
Ja
nuar
y C
entr
al
Sem
i-Su
bmer
sibl
e D
rilli
ng
Supp
ly
Ster
n -
Car
go T
rans
fer
Mis
judg
emen
t C
Col
umn
Den
t N
o Y
es
Min
or
82

Con
sec.
N
o.
279
Inst
alla
tion
Dam
age
Det
ails
Rep
aire
d R
epai
r Det
ails
Ves
sel
Cla
ss
Oth
er S
ourc
e
AT
TEN
DA
NT
VES
SEL
CO
LLIS
ION
S D
entin
g 0.
02m
x 0
.1m
x 0
.02m
(H
x W
x D
) 2m
- 3
m a
bove
sea
leve
l. D
amag
e to
dia
gona
l br
ace.
-
-M
inor
-
-
280
Dam
age
to b
ulk
load
ing
hose
s an
d to
sca
ffold
ing.
-
-M
inor
D
amag
e to
shi
p's
aeri
al.
-
281
Slig
ht d
ent o
n E
9 vo
id ta
nk 1
2" x
43"
x 0
.25"
(H
x W
x D
) at
+22
.2m
leve
l. Li
febo
at h
oled
w
ith tw
o 1.
5m c
rack
s in
sta
rboa
rd fo
rwar
d se
ctio
n.
--
--
-
282
Top
hor
izon
tal b
raci
ng o
n bo
at la
ndin
g si
gnifi
cant
ly d
ente
d. S
light
dam
age
to c
ella
r de
ck
hand
rail.
-
--
-H
SE
283
Pai
nt d
amag
e to
leg
and
dam
age
to s
pide
r de
ck g
rati
ng.
--
Mod
erat
e D
amag
e to
por
t sid
e in
clud
ing
a cr
ack
amid
ship
s. R
adio
aer
ials
and
navi
gati
on li
ghts
da
mag
ed.
HSE
& W
OA
D
284
Pla
ting
dam
age
on s
tarb
oard
pon
toon
. -
--
--
285
Pai
nt d
epos
ited
on
leg.
-
--
-H
SE
286
Uns
peci
fied
min
or d
amag
e.
--
--
-
287
Surf
ace
dam
age
to fe
nder
. -
--
-H
SE
288
2 of
the
8 bo
at fe
nder
s w
ere
dent
ed ju
st a
bove
sea
leve
l and
pos
sibl
e da
mag
e to
coa
ting
. -
-M
inor
D
ent i
n st
ern
of v
esse
l. H
SE
289
Slig
ht d
amag
e to
han
drai
l and
pai
nt m
arks
on
leg.
-
--
--
290
Dam
age
in a
rea
of p
ort a
ncho
r as
sem
bly
1m x
6m
(H
x W
) on
leg
No.
1 o
n po
rt s
ide.
-
-Se
vere
H
ole
in b
ow ju
st b
elow
wat
erlin
e. B
ow m
ast b
ent b
ackw
ards
. 2 ta
nks
belie
ved
to b
e ru
ptur
ed.
HSE
& W
OA
D
291
Leg
acce
ss la
dder
den
ted.
4"
wat
er b
unke
ring
hos
e se
vere
d.
--
Mod
erat
e C
entr
al m
ast s
ever
ely
dam
aged
. -
292
Supe
rfic
ial d
amag
e ap
prox
10'
abo
ve s
ea le
vel o
n ke
g at
sou
th-e
ast c
orne
r.
--
--
WO
AD
293
Plat
ing
roun
ded,
forw
ard
corn
er in
dent
ed 1
m x
1m
x 0
.15m
(H
x W
x D
). In
tern
al v
ertic
al B
P st
iffen
er d
ispl
aced
. -
-M
inor
P
aint
loss
on
port
qua
rter
rub
bing
ban
d.
HSE
294
Min
or d
amag
e to
boa
t bum
per
fram
e.
One
sec
tion
of h
ose
dam
aged
but
no
spill
age.
-
-N
one
No
dam
age.
H
SE
295
Uns
peci
fied
min
or d
amag
e.
--
Min
or
Uns
peci
fied
min
or d
amag
e.
-
296
Mar
k on
leg
at 1
.5m
abo
ve s
ea le
vel.
--
Min
or
3' lo
ng h
ull d
ent.
-
297
Lost
esc
ape
ladd
er, l
ife r
aft a
nd s
usta
ined
sup
erfic
ial d
amag
e.
--
Min
or
Min
imal
dam
age
to v
esse
l fun
nel.
HSE
298
Boa
t bum
per
ring
ben
t upw
ards
. P
aint
dam
age
to le
g.
--
--
HSE
299
Tw
isti
ng o
f acc
ess
ladd
er.
--
Min
or
Supe
rfic
ial d
amag
e.
HSE
300
Def
orm
atio
n da
mag
e to
bra
cing
str
uctu
re b
ut n
o lo
ss o
f str
uctu
ral i
nteg
rity
. -
-N
one
No
dam
age.
H
SE
301
Pai
nt d
amag
e to
leg.
For
war
d po
rt a
ncho
r di
slodg
ed fr
om c
radl
e. 0
.625
" st
eel c
hase
r at
tach
ed
to th
e fo
rwar
d m
oori
ng b
roke
n.
--
Min
or
Dam
age
to m
ast
and
bow
sta
rboa
rd b
ulw
ark.
H
SE &
MA
IB
302
Min
or d
amag
e to
hor
izon
tal b
race
. -
--
-H
SE &
MA
IB
303
No
dam
age
sust
aine
d to
rig
. -
--
--
304
Larg
e de
nt in
ste
el c
over
of t
yre
fend
er p
rote
ctin
g le
g 3.
-
--
-H
SE
305
Hit
por
t leg
cau
sing
sup
erfic
ial d
amag
e.
--
--
HSE
& M
AIB
306
Uns
peci
fied
dent
. -
--
-H
SE
307
Inde
ntat
ion
0.7m
?? x
1.2
m x
1.4
m (
D x
W x
H)
in c
olum
n.**
***
--
--
HSE
308
Gla
ncin
g bl
ow to
pro
duct
ion
plat
form
ris
er g
uard
then
pas
sed
bene
ath
brid
ge li
nkin
g pr
oduc
tion
& d
rilli
ng p
latf
orm
s.
--
--
HSE
309
Ver
tical
dia
gona
l mem
ber
on r
ow B
bet
wee
n el
evat
ions
-3'
and
+20
' bow
ed b
y 90
mm
and
in
dent
ed 1
0mm
. -
--
-H
SE &
OT
N 9
2 23
5
310
No
seri
ous
dam
age.
-
--
-H
SE
311
Uns
peci
fied
min
or d
amag
e.
--
--
-
312
Den
t at 2
0m a
bove
wat
er 2
.5m
x 1
.2m
x 0
.1m
(H
x W
x D
). D
amag
e to
inte
rnal
tank
st
iffen
ing.
Wal
kway
s/ha
ndra
ils d
amag
ed.
--
Min
or
Por
t br
idge
win
g, li
ghts
, fun
nel d
amag
ed. H
ull p
late
s bu
ckle
d. H
oled
at
deck
/hul
l pla
te a
rea.
H
SE &
MA
IB
313
Acc
ess
ladd
er p
latf
orm
buc
kled
and
bra
cket
s pu
lled
from
col
umn.
-
--
-H
SE
314
Slig
ht d
amag
e to
jack
-up
- no
t se
riou
s.
--
--
-
315
Inde
nt in
leg
cais
son
shel
l pla
ting
in w
ay o
f N
o. 9
cai
sson
stif
fene
r ri
ng a
t ver
tical
stif
fene
r N
o.
5.
--
--
HSE
316
Ves
sel n
udge
d N
o. 2
anc
hor
chai
n an
d hi
t sta
rboa
rd c
olum
n.
--
Min
or
-H
SE &
MA
IB
317
Inde
ntat
ion
at 2
2m d
raft
leve
l on
star
boar
d si
de.
--
--
HSE
83

Con
sec.
N
o.
318
Info
rmat
ion
Sour
ce
Dat
e (d
d/m
m/y
r) Y
ear
Mon
th
Loca
tion
Inst
alla
tion
Typ
e Im
pact
V
esse
l Typ
e Im
pact
O
rien
tatio
n Se
a C
ondi
tion
Ope
ratin
g C
ircu
mst
ance
s Pr
imar
y C
ause
Im
pact
Poi
nt
Inst
alla
tion
Dam
age
Stiff
ener
D
amag
e Pl
ate
Den
ts In
stal
latio
n D
amag
e C
lass
AT
TEN
DA
NT
VES
SEL
CO
LLIS
ION
S D
En
05/0
2/92
19
92
Febr
uary
N
orth
ern
Fixe
d St
eel
Supp
ly
--
Car
go T
rans
fer
Mis
judg
emen
t -
Min
or
No
No
Min
or
319
DE
n 05
/02/
92
1992
Fe
brua
ry
Nor
ther
n Fi
xed
Stee
l Su
pply
Si
de
5.0
Car
go U
nloa
ding
M
isju
dgem
ent
Leg
A1
Min
or
No
No
Min
or
320
DE
n 11
/02/
92
1992
Fe
brua
ry
Cen
tral
Se
mi-
Subm
ersi
ble
Dri
lling
Su
pply
-
-C
argo
Tra
nsfe
r M
isju
dgem
ent
-M
inor
N
o Y
es
Min
or
321
DE
n 27
/02/
92
1992
Fe
brua
ry
Nor
ther
n Fi
xed
Stee
l Su
pply
-
--
Mis
judg
emen
t -
Min
or
No
No
Min
or
322
HSE
07
/04/
92
1992
A
pril
-Se
mi-
Subm
ersi
ble
Dri
lling
Su
pply
-
-C
argo
Tra
nsfe
r -
Por
t For
war
d C
olum
n D
ent
Yes
Y
es
Min
or
323
DE
n 23
/04/
92
1992
A
pril
Cen
tral
Se
mi-
Subm
ersi
ble
Mob
ile S
uppo
rt
Supp
ly
--
Anc
hor
Han
dlin
g M
isju
dgem
ent
-M
inor
N
o N
o M
inor
324
DE
n 04
/05/
92
1992
M
ay
Sout
hern
Fi
xed
Stee
l Su
pply
M
ast
-A
ppro
achi
ng I
nsta
llati
on
Eng
ine
Con
trol
Fai
lure
C
ella
r D
eck
Min
or
No
No
Min
or
325
DE
n 07
/05/
92
1992
M
ay
Cen
tral
Se
mi-
Subm
ersi
ble
Dri
lling
Su
pply
-
-A
ncho
r H
andl
ing
Mis
judg
emen
t -
Min
or
No
No
Min
or
326
DE
n 15
/05/
92
1992
M
ay
Cen
tral
Se
mi-
Subm
ersi
ble
Dri
lling
Su
pply
St
ern
3.0
Anc
hor
Han
dlin
g M
isju
dgem
ent
Col
umn
Den
t N
o Y
es
Min
or
327
DE
n 21
/05/
92
1992
M
ay
Sout
hern
Fi
xed
Stee
l Su
pply
St
ern
1.0
App
roac
hing
Ins
talla
tion
M
isju
dgem
ent
Leg
Min
or
No
No
Min
or
328
DE
n 27
/05/
92
1992
M
ay
Nor
ther
n Se
mi-
Subm
ersi
ble
Dri
lling
Su
pply
P
ort S
tern
3.
0 C
argo
Tra
nsfe
r M
isju
dgem
ent
No.
2 P
ort
Col
umn
Fend
er
No
No
Min
or
329
DE
n 31
/05/
92
1992
M
ay
Sout
hern
Ja
ck-U
p Su
pply
Si
de
1.0
-M
isju
dgem
ent
Col
umn
Den
t N
o Y
es
Min
or
330
DE
n 14
/06/
92
1992
Ju
ne
Sout
hern
Ja
ck-U
p St
and-
By
--
-M
isju
dgem
ent
Stbd
. Leg
M
inor
N
o N
o M
inor
331
DE
n 19
/06/
92
1992
Ju
ne
-Se
mi-
Subm
ersi
ble
Acc
omm
odat
ion
Supp
ly
--
Anc
hor
Han
dlin
g M
isju
dgem
ent
-D
ent
No
No
Min
or
332
DE
n 04
/07/
92
1992
Ju
ly
Nor
ther
n Si
ngle
Poi
nt M
oori
ng
Supp
ly
Ster
n -
Car
go T
rans
fer
Wea
ther
Con
ditio
ns
Col
lisio
n B
umpe
rs
Min
or
No
No
Min
or
333
DE
n 04
/08/
92
1992
A
ugus
t So
uthe
rn
Jack
-Up
Stan
d-B
y -
--
Mis
judg
emen
t Le
g ST
3 M
inor
N
o N
o M
inor
334
DE
n 20
/09/
92
1992
Se
ptem
ber
Cen
tral
Fl
oati
ng P
rodu
ctio
n &
Sto
rage
Su
pply
St
ern
-A
ncho
r H
andl
ing
Mis
judg
emen
t P
ort Q
uart
er
Min
or
No
No
Min
or
335
HSE
29
/09/
92
1992
Se
ptem
ber
Cen
tral
Si
ngle
Buo
y M
oori
ng
Mer
chan
t T
anke
r -
-Lo
adin
g C
rude
Oil
D.P
. Con
trol
Fai
lure
Fe
nder
Fe
nder
N
o N
o M
inor
336
DE
n 02
/10/
92
1992
O
ctob
er
Sout
hern
Fi
xed
Stee
l R
esea
rch
Bea
m
-Su
rvey
ing
D.P
. Fai
lure
-
Min
or
No
No
Min
or
337
DE
n 25
/10/
92
1992
O
ctob
er
Mor
ecam
be
Bay
Ja
ck-U
p Su
pply
-
--
-Le
g M
inor
N
o N
o M
inor
338
DE
n 16
/11/
92
1992
N
ovem
ber
Sout
hern
Ja
ck-U
p St
and-
By
--
-M
isju
dgem
ent
Bow
Leg
Cho
rd
Min
or
No
No
Min
or
339
HSE
22
/11/
92
1992
N
ovem
ber
Cen
tral
Fi
xed
Stee
l St
and-
By
Ster
n -
Clo
se S
uppo
rt
Eng
ine
Failu
re
Wes
t Leg
s M
inor
N
o N
o M
inor
340
DE
n 06
/12/
92
1992
D
ecem
ber
Cen
tral
Fi
xed
Stee
l Su
pply
-
2.0
App
roac
hing
Ins
talla
tion
Po
wer
Fai
lure
-
Min
or
No
No
Min
or
341
DE
n 11
/12/
92
1992
D
ecem
ber
Cel
tic S
ea
Sem
i-Su
bmer
sibl
e D
rilli
ng
Supp
ly
Ster
n -
Car
go T
rans
fer
Mis
judg
emen
t C
olum
n D
ent
No
Yes
M
inor
342
DE
n 16
/12/
92
1992
D
ecem
ber
Cen
tral
Se
mi-
Subm
ersi
ble
Dri
lling
Su
pply
-
--
-Fe
nder
Fe
nder
N
o N
o M
inor
343
DE
n 23
/12/
92
1992
D
ecem
ber
Sout
hern
Fi
xed
Stee
l St
and-
By
-2.
0 -
-R
iser
Pla
tfor
m
Fram
e M
inor
N
o N
o M
inor
344
DE
n 11
/01/
93
1993
Ja
nuar
y So
uthe
rn
Fixe
d St
eel
Supp
ly
Funn
el
2.0
Bun
keri
ng O
pera
tions
W
eath
er C
ondi
tions
C
ella
r D
eck
Min
or
No
No
Min
or
345
DE
n 14
/01/
93
1993
Ja
nuar
y N
orth
ern
Sem
i-Su
bmer
sibl
e D
rilli
ng
Supp
ly
Ster
n -
Car
go T
rans
fer
Wea
ther
Con
diti
ons
Cai
sson
1-S
Fe
nder
N
o N
o M
inor
346
HSE
16
/01/
93
1993
Ja
nuar
y So
uthe
rn
Fixe
d St
eel
Stan
d-B
y -
2.0
Car
go T
rans
fer
-C
Spi
der
Dec
k B
end
and
Den
t N
o N
o M
inor
347
HSE
02
/02/
93
1993
Fe
brua
ry
Cen
tral
Se
mi-
Subm
ersi
ble
Dri
lling
Su
pply
P
ort Q
uart
er
-C
argo
Tra
nsfe
r M
isju
dgem
ent
Col
umn
Den
t N
o Y
es
Min
or
348
DE
n 04
/02/
93
1993
Fe
brua
ry
Cen
tral
Se
mi-
Subm
ersi
ble
Dri
lling
Su
pply
-
--
--
Min
or
No
No
Min
or
349
HSE
06
/02/
93
1993
Fe
brua
ry
-Fl
oati
ng P
rodu
ctio
n &
Sto
rage
Su
pply
P
ort S
ide
-B
unke
ring
Ope
ratio
ns
D.P
. Con
trol
Fai
lure
P
ort S
ide
Fend
er
No
No
Min
or
350
DE
n 25
/03/
93
1993
M
arch
C
entr
al
Sem
i-Su
bmer
sibl
e D
rilli
ng
Supp
ly
--
--
-M
inor
N
o N
o M
inor
351
HSE
27
/03/
93
1993
M
arch
N
orth
ern
Floa
ting
Sto
rage
Su
pply
St
ern
3.5
Car
go T
rans
fer
Wea
ther
Con
ditio
ns
Bra
cing
Nod
e M
inor
N
o N
o M
inor
352
HSE
28
/03/
93
1993
M
arch
C
entr
al
Sem
i-Su
bmer
sibl
e M
obile
Sup
port
St
and-
By
Stbd
. Bow
7.
0 C
lose
Sup
port
E
ngin
e C
ontr
ol F
ailu
re
Stbd
. Fw
d.
Inte
rmed
iate
Col
. Sp
lit
No
No
Min
or
353
DE
n 01
/07/
93
1993
Ju
ly
Cen
tral
Fl
oati
ng P
rodu
ctio
n &
Sto
rage
Su
pply
P
ort S
ide
-C
argo
Tra
nsfe
r B
owth
rust
er F
ailu
re
Stbd
. Bow
D
ent
No
Yes
M
inor
354
DE
n 27
/07/
93
1993
Ju
ly
Sout
hern
Ja
ck-U
p St
and-
By
-2.
0 Pe
rson
nel T
rans
fer
-Po
rt F
wd.
Leg
M
inor
N
o N
o M
inor
355
HSE
07
/09/
93
1993
Se
ptem
ber
-Se
mi-
Subm
ersib
le E
mer
genc
y Su
ppor
t Su
pply
-
-C
argo
Tra
nsfe
r St
eeri
ng F
ailu
re
Stbd
. Cen
tre
Col
umn
Min
or
No
No
Min
or
84

Con
sec.
N
o.
318
Inst
alla
tion
Dam
age
Det
ails
Rep
aire
d R
epai
r Det
ails
Ves
sel
Cla
ss
Oth
er S
ourc
e
AT
TEN
DA
NT
VES
SEL
CO
LLIS
ION
S U
nspe
cifie
d m
inor
dam
age.
-
--
-H
SE
319
Ves
sel b
umpe
d SW
leg
(A1)
of i
nsta
llati
on. N
o da
mag
e se
en. I
nsig
nific
ant i
mpa
ct to
pile
gui
de
(not
in u
se).
-
-N
one
No
dam
age.
H
SE
320
Floo
r in
side
Nos
. 3 a
nd 4
anc
hor
win
ch h
ouse
(on
stb
d. fw
d. 3
0' c
olum
n), w
alkw
ay a
roun
d an
d af
t fra
me
supp
ort b
eam
all
forc
ed u
pwar
ds. 3
inde
ntat
ions
on
insi
de o
f col
umn
plat
ing
at
1st.
ring
stif
fene
r. C
olum
n in
tegr
ity in
tact
. -
--
-H
SE
321
Supe
rfic
ial d
amag
e ca
used
to p
latf
orm
. -
--
-M
AIB
322
2
vert
ical
stif
fene
rs in
sam
e ar
ea s
et in
by
sam
e am
ount
.
323
324
A4
and
B4.
325
326
Con
tact
wit
h fo
rwar
d po
rt c
olum
n. I
nden
tati
on to
she
ll pl
atin
g. N
os. 1
& 2
anc
hor
hous
e
327
328
329
330
331
332
333
334
335
336
Col
lided
wit
h FT
P p
latf
orm
legs
C1,
B1,
H1,
and
boa
t bum
pers
and
land
ing.
No
imm
edia
te
337
338
339
340
Dam
age
to N
o. 2
life
boat
and
dav
its;
esc
ape
ladd
er o
n so
uth-
wes
t leg
; 2 d
iago
nal b
raci
ngs
on
341
342
343
HSE
, WO
AD
&
344
345
346
347
348
349
350
351
352
353
354
355
Uns
peci
fied
dam
age
to fo
rwar
d co
rner
of s
pons
on o
n st
arbo
ard
cent
re c
olum
n at
hei
ght o
f
85

356
Sour
ce
Dat
e V
esse
l Typ
e Im
pact
Se
a O
pera
ting
Dam
age
Den
ts In
stal
latio
n
Cla
ss
AT
TEN
DA
NT
VES
SEL
CO
LLIS
ION
S H
SE
29/1
0/93
19
93
Oct
ober
So
uthe
rn
Fixe
d St
eel
Supp
ly
-2.
0 A
ppro
achi
ng I
nsta
llati
on
Mis
judg
emen
t So
uth-
Wes
t Leg
M
inor
N
o N
o M
inor
357
HSE
10
/12/
93
1993
D
ecem
ber
Sout
hern
Fi
xed
Stee
l D
iver
Sup
port
C
rane
Jib
2.
5 D
ivin
g O
pera
tions
O
pera
tor
Err
or
Han
d R
ail
358
HSE
17
/01/
94
1994
Ja
nuar
y So
uthe
rn
Jack
-Up
Supp
ly
-2.
5 C
argo
Tra
nsfe
r -
Stbd
. Fw
d. L
eg
Min
or
No
No
Min
or
359
HSE
11
/03/
94
1994
M
arch
N
orth
ern
Fixe
d C
oncr
ete
Supp
ly
-5.
0 C
argo
Tra
nsfe
r -
Shaf
t 5
Min
or
No
No
Min
or
360
HSE
14
/03/
94
1994
M
arch
N
orth
ern
Fixe
d C
oncr
ete
Supp
ly
Stbd
. Qua
rter
4.
2 A
wai
ting
Car
go T
rans
fer
Mis
judg
emen
t E
xter
nal
361
HSE
10
/04/
94
1994
A
pril
Cen
tral
Fi
xed
Stee
l Su
pply
-
-C
lose
Sup
port
M
isju
dgem
ent
Leg
Min
or
No
No
Min
or
362
HSE
01
/07/
94
1994
Ju
ly
Bay
363
HSE
09
/07/
94
1994
Ju
ly
Nor
ther
n Fi
xed
Stee
l Su
pply
P
ort Q
uart
er
2.9
Car
go T
rans
fer
Eng
ine
Pow
er F
ailu
re
Sout
h-W
est (
A1)
364
HSE
19
/08/
94
1994
A
ugus
t C
entr
al
Fixe
d St
eel
Stan
d-B
y B
ow
--
-C
orne
r
365
HSE
06
/11/
94
1994
N
ovem
ber
-Se
mi-
Subm
ersi
ble
Dri
lling
Su
pply
-
-C
argo
Tra
nsfe
r W
eath
er C
ondi
tions
Fw
d. S
tbd.
Leg
B
end
and
Den
t Y
es
Yes
M
inor
366
HSE
01
/12/
94
1994
D
ecem
ber
Cen
tral
Fi
xed
Stee
l D
iver
Sup
port
C
rane
2.
5 C
argo
Tra
nsfe
r M
isju
dgem
ent
Flar
e T
ower
D
ent
Yes
N
o M
inor
367
HSE
11
/12/
94
1994
D
ecem
ber
Nor
ther
n Fi
xed
Stee
l Su
pply
-
3.0
App
roac
hing
Ins
talla
tion
-B
raci
ngs
Min
or
No
No
Min
or
368
HSE
11
/09/
95
1995
Se
ptem
ber
-Ja
ck-U
p H
andl
er
Forw
ard
Hul
l
369
HSE
17
/11/
95
1995
N
ovem
ber
-Ja
ck-U
p Su
pply
B
ow
4.5
Car
go T
rans
fer
Ope
rato
r E
rror
Po
rt L
eg
Supe
rfic
ial
No
No
Min
or
370
HSE
23
/12/
95
1995
D
ecem
ber
-Se
mi-
Subm
ersi
ble
Dri
lling
Su
pply
St
bd. Q
uart
er
2.4
Car
go T
rans
fer
Obs
cure
d V
isio
n Fo
rwar
d St
bd.
371
HSE
03
/05/
96
1996
M
ay
Nor
ther
n Fi
xed
Stee
l Su
pply
-
-A
ppro
achi
ng I
nsta
llati
on
-Le
g N
E
Supe
rfic
ial
No
No
Min
or
372
HSE
05
/06/
96
1996
Ju
ne
Cen
tral
Fi
xed
Stee
l Su
pply
P
ort Q
uart
er
1.5
Car
go T
rans
fer
D.P
. Con
trol
Fai
lure
Le
g N
E
Pai
nt S
cuffs
N
o N
o M
inor
373
HSE
05
/07/
96
1996
Ju
ly
Sout
hern
Fi
xed
Stee
l Su
pply
-
--
Mis
judg
emen
t Le
g A
2 R
iser
No
No
Min
or
374
HSE
09
/08/
96
1996
A
ugus
t C
entr
al
Fixe
d St
eel
Supp
ly
--
Car
go T
rans
fer
D.P
. Con
trol
Fai
lure
D
2 Le
g M
inor
N
o N
o M
inor
375
HSE
20
/08/
96
1996
A
ugus
t -
Sem
i-Su
bmer
sibl
e D
rilli
ng
Stan
d-B
y St
bd. F
RC
C
olum
n
376
HSE
19
/10/
96
1996
O
ctob
er
Sout
hern
Fi
xed
Stee
l -
--
--
-B
ent F
ende
r N
o N
o M
inor
377
MA
IB
31/0
1/97
19
97
Janu
ary
Cen
tral
Se
mi-
Subm
ersi
ble
Dri
lling
St
and-
By
Ster
n -
Clo
se S
uppo
rt
Ope
rato
r E
rror
B
elow
Boa
t Dec
k P
aint
Dam
age
No
No
Min
or
378
HSE
14
/02/
97
1997
Fe
brua
ry
Sout
hern
Fi
xed
Stee
l -
Qua
rter
-
Car
go T
rans
fer
-D
iago
nal B
race
-
No
No
Min
or
379
HSE
02
/04/
97
1997
A
pril
Nor
ther
n Fl
oati
ng P
rodu
ctio
n &
Sto
rage
Su
pply
-
3.0
Car
go T
rans
fer
Wea
ther
Con
ditio
ns
Pla
te
380
HSE
31
/05/
97
1997
M
ay
Nor
ther
n Fi
xed
Stee
l St
and-
By
Bow
0.
0 C
lose
Sup
port
E
ngin
e Po
wer
Fai
lure
C
aiss
on
381
HSE
26
/07/
97
1997
Ju
ly
Nor
ther
n Fl
oati
ng P
rodu
ctio
n &
Sto
rage
T
anke
r
382
HSE
27
/07/
97
1997
Ju
ly
-Se
mi-
Subm
ersi
ble
Acc
omm
odat
ion
Stan
d-B
y St
bd. F
unne
l -
Car
go T
rans
fer
Ope
rato
r E
rror
P
latf
orm
s
383
HSE
12
/09/
97
1997
Se
ptem
ber
Nor
ther
n Fi
xed
Stee
l Su
pply
St
ern
3.0
Car
go T
rans
fer
Wea
ther
Con
ditio
ns
SW L
eg
Pai
nt S
cuffs
N
o N
o M
inor
384
HSE
20
/09/
97
1997
Se
ptem
ber
Cen
tral
A
rtic
ulat
ed L
oadi
ng C
olum
n Su
pply
St
ern
1.5
Mai
nten
ance
W
eath
er C
ondi
tions
E
scap
e La
dder
D
ent a
nd S
crap
es
No
No
Min
or
385
HSE
10
/12/
97
1997
D
ecem
ber
-Ja
ck-U
p -
--
--
Port
Aft
Leg
Scra
tche
s N
o N
o M
inor
386
HSE
14
/02/
98
1998
Fe
brua
ry
Cen
tral
Fl
oatin
g P
rodu
ctio
n &
Sto
rage
St
and-
By
Por
t Qua
rter
4.
0 C
argo
Tra
nsfe
r -
Por
t Sid
e
387
HSE
07
/04/
98
1998
A
pril
-Se
mi-
Subm
ersi
ble
Dri
lling
Su
pply
-
-C
argo
Tra
nsfe
r -
Forw
ard
Leg
Min
or
No
Yes
M
inor
388
HSE
05
/06/
98
1998
Ju
ne
Sout
hern
Fi
xed
Stee
l -
--
--
N L
eg A
cces
s
389
HSE
05
/07/
98
1998
Ju
ly
-Se
mi-
Subm
ersi
ble
Dri
lling
H
andl
er
390
HSE
15
/07/
98
1998
Ju
ly
-Ja
ck-U
p H
andl
er
391
HSE
31
/07/
98
1998
Ju
ly
Nor
ther
n Fi
xed
Con
cret
e Su
pply
-
-A
ppro
achi
ng I
nsta
llati
on
Bow
thru
ster
Fai
lure
B
unke
r H
ose
392
HSE
25
/09/
98
1998
Se
ptem
ber
Wes
t of
Mer
chan
t B
alla
st T
ank
393
HSE
01
/01/
99
1999
Ja
nuar
y -
Sem
i-Su
bmer
sibl
e D
rilli
ng
Supp
ly
Ster
n 3.
0 C
argo
Tra
nsfe
r O
pera
tor
Err
or
Stbd
. Cen
tre
86

No.
356
Dam
age
Cla
ss
Ves
sel D
amag
e D
etai
ls C
onfir
ms
AT
TEN
DA
NT
VES
SEL
CO
LLIS
ION
S Li
ttle
dam
age.
-
-Se
vere
V
esse
l hol
ed b
y le
g "f
oot p
late
".
-
357
Min
or d
amag
e.
--
Min
or
Non
e.
-
358
Ligh
t pa
int
dam
aged
on
bulw
ark.
-
--
--
359
Pot
able
wat
er a
nd o
il ba
sed
mud
har
d pi
pelin
es p
ulle
d aw
ay fr
om p
latf
orm
at
load
ing
stat
ion.
-
--
--
360
Scaf
fold
wal
kway
ext
erna
l to
M2E
bad
ly t
wis
ted.
Bul
k m
ud a
nd p
otab
le w
ater
har
d pi
pes
and
man
ifold
val
ves
brok
en a
nd/o
r di
spla
ced
and
flexi
ble
hose
s br
oken
. -
-N
one
Non
e.
-
361
Leg
ladd
er b
ent.
--
Min
or
Uns
peci
fied
dent
. -
362
Stru
ctur
al d
amag
e to
sou
th-w
est
navi
gati
on li
ght
stat
ion
and
light
ing
stan
chio
n da
mag
e.
--
Min
or
Mas
t da
mag
ed.
-
363
Pai
nt d
amag
e at
1m
abo
ve w
ater
. -
-M
inor
C
oati
ng d
amag
e.
-
364
Pai
ntw
ork
scra
tche
d.
--
Min
or
Uns
peci
fied
dam
age
to b
ow a
nd r
ailin
gs.
-
365
Inde
ntat
ion
0.25
m x
1.5
m x
2m
(D
x H
x W
) ar
ea a
t 80'
leve
l. 2
inte
rnal
stif
fene
rs in
way
ben
t an
d tw
iste
d.
-U
nkno
wn.
N
one
Non
e -
366
Pai
nt d
amag
e an
d sli
ght
inde
ntat
ion
to b
ase
of a
n in
tern
al d
iago
nal c
ross
bra
ce a
t +
40 m
el
evat
ion.
-
-M
inor
B
ent a
nd b
uckl
ed a
ft c
rane
she
ave
chee
k pl
ate.
-
367
Min
imal
dam
age
to b
raci
ngs
MB
21 a
nd M
B41
. -
--
--
368
Buf
fer
of N
o. 3
life
boat
mis
plac
ed a
nd d
amag
ed b
y co
wl o
n to
p of
ves
sels
port
funn
el. D
avit
out o
f com
mis
sion
; life
boat
pre
viou
sly r
emov
ed th
eref
ore
not d
amag
ed.
--
Min
or
Dam
age
to c
owl o
n to
p of
por
t fun
nel.
-
369
Supe
rfic
ial d
amag
e to
por
t leg
. -
--
--
370
Col
umn
dent
ed in
way
of c
onta
ct. I
nter
nals
dist
orte
d in
way
. -
-N
one
No
dam
age.
-
371
Supe
rfic
ial d
amag
e to
NE
leg.
-
-M
inor
-
-
372
--
--
--
373
3 bo
lts s
prun
g on
red
unda
nt 8
" gl
ycol
ris
er a
ppro
x. 1
2' a
bove
L.A
.T.
--
--
MA
IB
374
--
-M
inor
N
ew jo
ystic
k fit
ted.
Sof
twar
e ad
just
men
ts m
ade
to s
yste
m, r
esul
ting
in im
prov
ed r
eact
ion
times
to c
omm
and
inst
ruct
ion.
Azi
mut
hing
thru
ster
rea
ctio
n in
crea
sed
to m
atch
tran
sver
se
thru
ster
tim
e so
bot
h ac
t in
tand
em a
nd n
ot a
gain
st e
ach
othe
r. O
ther
adj
ustm
-
375
Slig
ht in
dent
atio
n to
col
umn.
Sep
arat
e co
ntac
t wit
h N
os. 5
and
6 a
ncho
r ch
asin
g pe
nnan
ts.
--
Mod
erat
e St
bd. F
RC
and
dav
it b
adly
dam
aged
from
con
tact
wit
h an
chor
cha
sing
pen
nant
s.
-
376
Ben
t boa
t fen
der.
-
-M
inor
B
ent f
ende
r an
d sp
lit w
eld.
-
377
--
-M
inor
P
aint
dam
aged
. -
378
--
--
--
379
Hea
vy in
dent
dam
age
to a
she
ll pl
ate
in w
ay o
f a w
ing
balla
st t
ank.
-
--
--
380
Pro
file
dam
age
to th
e fir
e pu
mp
cais
son.
-
--
--
381
Som
e un
spec
ified
str
uctu
ral d
amag
e.
--
-So
me
unsp
ecifi
ed s
truc
tura
l dam
age.
-
382
Stru
ctur
al d
amag
e to
the
port
and
sta
rboa
rd a
ft li
fera
ft p
latf
orm
s an
d bu
lk h
ose
rack
on
aft e
nd
of u
nit.
--
--
-
383
--
--
--
384
Dam
age
to th
e la
dder
's ve
rtic
als
and
scra
ping
the
oute
r co
ncre
te s
urfa
ce o
f the
inst
alla
tion.
-
--
--
385
Scra
tchi
ng o
n 2
teet
h of
out
boar
d co
rd in
por
t aft
leg.
-
--
Hol
e in
ves
sel "
bash
rai
l".
-
386
Fram
e 93
-94,
sl4
0 be
nd a
ppro
xim
atel
y 3
- 5c
m in
side
wat
er b
alla
st ta
nk 6
por
t. -
--
--
387
Inde
ntio
n to
hul
l 2' x
4' -
no
brea
ch to
tank
. -
--
--
388
--
--
--
389
Som
e tim
ber
splin
teri
ng o
n th
e bo
at b
umpe
r ar
rang
emen
t, no
str
uctu
ral d
amag
e.
--
--
-
390
Smal
l den
t in
wat
er w
ell.
--
Min
or
Tw
o sm
all p
unct
ures
on
port
qua
rter
. -
391
Pla
tfor
m n
orth
sid
e di
esel
bun
ker
hose
bur
st c
ausi
ng a
spi
llage
of a
ppro
xim
atel
y 10
gal
lons
. No
stru
ctur
al d
amag
e.
--
--
-
392
Num
ber
9 st
arbo
ard
wat
er b
alla
st ta
nk a
nd a
ppro
xim
atel
y 5
met
res
of h
andr
ails.
-
--
Dam
aged
pip
ewor
k on
bow
. -
393
Pai
ntw
ork
dam
age
only
. -
--
--
87

Con
sec.
N
o.
394
Info
rmat
ion
Sour
ce
Dat
e (d
d/m
m/y
r) Y
ear
Mon
th
Loca
tion
Inst
alla
tion
Typ
e Im
pact
V
esse
l Typ
e Im
pact
O
rien
tatio
n Se
a C
ondi
tion
Ope
ratin
g C
ircu
mst
ance
s Pr
imar
y C
ause
Im
pact
Poi
nt
Inst
alla
tion
Dam
age
Stiff
ener
D
amag
e Pl
ate
Den
ts In
stal
latio
n D
amag
e C
lass
AT
TEN
DA
NT
VES
SEL
CO
LLIS
ION
S H
SE
11/0
3/99
19
99
Mar
ch
-Se
mi-
Subm
ersib
le D
rilli
ng
Supp
ly
--
App
roac
hing
Ins
talla
tion
-
Stbd
. Leg
s 3
& 4
D
ents
N
o Y
es
Min
or
395
HSE
10
/06/
99
1999
Ju
ne
Nor
ther
n Fi
xed
Stee
l Su
pply
-
-C
argo
Tra
nsfe
r O
pera
tor
Err
or
Dia
gona
l Bra
ce
Pai
nt S
cuffs
N
o N
o M
inor
396
HSE
27
/10/
99
1999
O
ctob
er
-Ja
ck-U
p Su
pply
P
ort S
ide
1.5
Car
go L
oadi
ng
Thr
uste
r Fa
ilure
Po
rt L
eg C
hord
'K
' M
arks
on
Tee
th
No
No
Min
or
397
HSE
12
/12/
99
1999
D
ecem
ber
-Se
mi-
Subm
ersi
ble
Dri
lling
Su
pply
St
ern
-C
argo
Loa
ding
-
Col
umn
B4
Ben
t Fra
mes
Y
es
No
Min
or
398
HSE
16
/12/
99
1999
D
ecem
ber
Nor
ther
n Fi
xed
Stee
l Su
pply
-
2.0
Car
go L
oadi
ng
Thr
uste
r C
ontr
ol F
ailu
re
A5
Boa
t Bum
per
Den
t N
o N
o M
inor
399
HSE
19
/12/
99
1999
D
ecem
ber
Cen
tral
Fi
xed
Stee
l Su
pply
-
-C
argo
Loa
ding
-
No.
4 L
ifebo
at
Pot
able
Wat
er H
ose
No
No
Min
or
400
HSE
12
/01/
00
2000
Ja
nuar
y C
entr
al
Fixe
d St
eel
Supp
ly
Ster
n -
Car
go L
oadi
ng
Ope
rato
r E
rror
Li
febo
at
Life
boat
N
o N
o M
inor
401
HSE
23
/01/
00
2000
Ja
nuar
y N
orth
ern
Fixe
d St
eel
Div
er S
uppo
rt
Cra
ne J
ib
-D
ivin
g O
pera
tions
W
eath
er C
ondi
tions
N
o. 2
Life
boat
Li
febo
at
Yes
N
o M
inor
402
HSE
05
/02/
00
2000
Fe
brua
ry
Cen
tral
Fi
xed
Stee
l Su
pply
M
ast
3.5
Car
go U
nloa
ding
-
SW C
orne
r of
C
ella
r D
eck
Cab
le T
ray
Supp
ort
No
No
Min
or
403
HSE
17
/04/
00
2000
A
pril
-Se
mi-
Subm
ersi
ble
Dri
lling
A
ncho
r H
andl
er
-2.
0 A
ncho
r H
andl
ing
D.P
. Con
trol
Fai
lure
St
bd. A
ft C
aiss
on
Den
ts
Yes
Y
es
Min
or
404
HSE
02
/08/
00
2000
A
ugus
t N
orth
ern
Fixe
d St
eel
Supp
ly
Bow
-
App
roac
hing
Ins
talla
tion
O
pera
tor
Err
or
Eas
t Sid
e P
aint
Scu
ffs
No
No
Min
or
405
HSE
06
/09/
00
2000
Se
ptem
ber
Cen
tral
Se
mi-
Subm
ersi
ble
Pro
duct
ion
Stan
d-B
y B
ridg
e -
App
roac
hing
Ins
talla
tion
-
A1
Stbd
. Fw
d.
Col
umn
Fend
er a
nd L
adde
r N
o N
o M
inor
406
HSE
18
/11/
00
2000
N
ovem
ber
Nor
ther
n Fi
xed
Stee
l Su
pply
-
4.0
App
roac
hing
Ins
talla
tion
T
hrus
ter
Con
trol
Fai
lure
Li
fera
ft P
latf
orm
P
latf
orm
s N
o N
o M
inor
407
HSE
28
/11/
00
2000
N
ovem
ber
Cen
tral
Fi
xed
Stee
l Su
pply
-
-A
ppro
achi
ng I
nsta
llati
on
Eng
ine
Pow
er F
ailu
re
Leg
B1
NW
C
orne
r P
ipew
ork
No
No
Min
or
408
HSE
09
/03/
01
2001
M
arch
-
Jack
-Up
Stan
d-B
y P
ort Q
uart
er
Fend
er
-C
argo
Tra
nsfe
r W
eath
er C
ondi
tions
P
ort A
ft L
eg
Den
t N
o Y
es
Min
or
409
HSE
21
/06/
01
2001
Ju
ne
Cen
tral
Fi
xed
Stee
l D
iver
Sup
port
-
--
-C
ross
Mem
ber
Pain
t Scu
ffs
No
No
Min
or
410
HSE
15
/07/
01
2001
Ju
ly
Sout
hern
Fi
xed
Stee
l St
and-
By
Bow
-
--
SW L
eg
-N
o N
o M
inor
411
NM
I 19
76
1976
D
ecem
ber
Cen
tral
Fi
xed
Stee
l Su
pply
Si
de
1.0
App
roac
hing
Ins
talla
tion
-
-N
one
No
No
Non
e
412
DE
n 23
/03/
76
1976
M
arch
N
orth
ern
Fixe
d C
oncr
ete
Stan
d-B
y Si
de
1.25
C
lose
Sup
port
E
lect
rica
l Fai
lure
Le
g B
7 N
one
No
No
Non
e
413
NM
I 19
78
1978
O
ctob
er
Sout
hern
Ja
ck-U
p Su
pply
-
3.0
Car
go T
rans
fer
Moo
ring
Fai
lure
Le
g B
ow S
ide
Non
e N
o N
o N
one
414
NM
I 19
79
1979
Ju
ne
Cen
tral
Fi
xed
Stee
l Su
pply
-
2.0
Car
go T
rans
fer
--
Non
e N
o N
o N
one
415
DE
n 19
79
1979
Se
ptem
ber
Nor
ther
n Fi
xed
Stee
l D
iver
Sup
port
Si
de
-D
ivin
g O
pera
tions
M
isju
dgem
ent
-N
one
No
No
Non
e
416
DE
n 19
79
1979
-
Cen
tral
Fi
xed
Stee
l St
and-
By
Ster
n -
App
roac
hing
Ins
talla
tion
St
eeri
ng C
ontr
ol F
ailu
re
Leg
A5
Non
e N
o N
o N
one
417
DE
n 08
/04/
79
1979
A
pril
Sem
i-Su
bmer
sibl
e D
rilli
ng
Supp
ly
--
--
-N
one
No
No
Non
e
418
DE
n 07
/07/
79
1979
Ju
ly
Nor
ther
n Fi
xed
Stee
l D
iver
Sup
port
Si
de
-D
ivin
g O
pera
tions
M
isju
dgem
ent
Leg
A
Non
e N
o N
o N
one
419
NM
I 19
80
1980
Ja
nuar
y C
entr
al
Sem
i-Su
bmer
sibl
e M
obile
Sup
port
Su
pply
St
ern
4.0
Car
go T
rans
fer
--
Non
e N
o N
o N
one
420
NM
I 08
/05/
80
1980
M
ay
Cen
tral
Se
mi-
Subm
ersi
ble
Dri
lling
Su
pply
-
2.75
C
argo
Tra
nsfe
r M
isju
dgem
ent
Pon
toon
N
one
No
No
Non
e
421
DE
n 12
/11/
80
1980
N
ovem
ber
Cen
tral
Fi
xed
Stee
l Su
pply
St
ern
1.0
Car
go U
nloa
ding
M
isju
dgem
ent
Leg
A3
Non
e N
o N
o N
one
422
NM
I 19
/11/
80
1980
N
ovem
ber
Cen
tral
Se
mi-
Subm
ersi
ble
Acc
omm
odat
ion
Supp
ly
Ster
n 4.
0 C
argo
Tra
nsfe
r -
Leg
SE
Non
e N
o N
o N
one
423
NM
I 19
81
1981
Fe
brua
ry
Cen
tral
Se
mi-
Subm
ersi
ble
Dri
lling
Su
pply
St
ern
3.0
Car
go T
rans
fer
--
Non
e N
o N
o N
one
424
NM
I 19
81
1981
Se
ptem
ber
Cen
tral
Fi
xed
Stee
l Su
pply
Si
de
-C
argo
Unl
oadi
ng
--
Non
e N
o N
o N
one
425
NM
I 19
81
1981
Se
ptem
ber
Cen
tral
Se
mi-
Subm
ersi
ble
Dri
lling
Su
pply
St
ern
2.0
Car
go T
rans
fer
--
Non
e N
o N
o N
one
426
NM
I 19
81
1981
N
ovem
ber
Cen
tral
Se
mi-
Subm
ersi
ble
Dri
lling
Su
pply
St
ern
2.75
C
argo
Tra
nsfe
r -
-N
one
No
No
Non
e
427
DE
n 05
/01/
81
1981
Ja
nuar
y C
entr
al
Fixe
d St
eel
Supp
ly
Ster
n -
Car
go U
nloa
ding
M
isju
dgem
ent
Leg
A3
Non
e N
o N
o N
one
428
NM
I 20
/07/
81
1981
Ju
ly
Sout
hern
Fi
xed
Stee
l St
and-
By
--
--
Scaf
fold
ing
Non
e N
o N
o N
one
429
NM
I 19
82
1982
Se
ptem
ber
Cen
tral
Se
mi-
Subm
ersi
ble
Dri
lling
Su
pply
St
ern
-C
argo
Tra
nsfe
r -
-N
one
No
No
Non
e
430
DE
n 19
82
1982
D
ecem
ber
Sout
hern
Fi
xed
Stee
l Su
pply
Si
de
2.0
Car
go T
rans
fer
-Fe
nder
Fe
nder
N
o N
o N
one
431
NM
I 19
/02/
82
1982
Fe
brua
ry
Cen
tral
Fi
xed
Stee
l Su
pply
-
3.0
Car
go T
rans
fer
Wea
ther
Con
ditio
ns
Leg
Non
e N
o N
o N
one
432
DE
n 11
/03/
82
1982
M
arch
So
uthe
rn
Jack
-Up
Stan
d-B
y -
-C
argo
Unl
oadi
ng
Anc
hor
Dra
gged
Due
W
eath
er
Leg
Port
N
one
No
No
Non
e
88

Con
sec.
N
o.
394
Inst
alla
tion
Dam
age
Det
ails
Rep
aire
d R
epai
r Det
ails
Ves
sel
Cla
ss
Oth
er S
ourc
e
AT
TEN
DA
NT
VES
SEL
CO
LLIS
ION
S In
dent
atio
n of
the
shel
l pla
ting
res
ulti
ng in
no
pene
trat
ion
of th
e pl
atin
g.
--
--
-
395
Supe
rfic
ial p
aint
scr
ache
s on
the
diag
onal
bra
ce.
--
--
-
396
Whi
te m
etal
mar
ks a
nd s
ome
shav
ed o
ff m
etal
from
ves
sel o
n on
e si
de o
f the
teet
h.
--
Min
or
Uns
peci
fied
hull
dam
age.
-
397
Dam
age
to fi
ve ti
mbe
r fe
nder
s an
d di
stor
ted
fram
es a
nd s
tiffe
ners
. -
--
--
398
Boa
t bu
mpe
r de
nted
and
top
sup
port
pip
e sli
ghtly
kin
ked
on t
he t
op s
ide.
-
--
--
399
Pot
able
wat
er h
ose
part
ed a
nd d
amag
e to
No.
4 li
febo
at.
--
--
-
400
Seri
ous
dam
age
to li
febo
at.
--
--
-
401
Out
er s
kin
of N
o. 2
life
boat
pun
ctur
ed a
nd m
oori
ng p
ins
wre
nche
d fr
om th
e si
de o
f the
boa
t. T
he s
tiffe
ner
is a
lso d
isto
rted
on
the
lifeb
oat l
and
area
sup
port
fram
e.
--
--
-
402
Min
or s
truc
tura
l dam
age
to th
e su
ppor
t fra
me
of c
able
tray
s on
the
sout
h-w
est c
orne
r of
the
Cel
lar
Dec
k.
--
Min
or
Min
or d
amag
e to
the
mas
t and
aer
ials.
-
403
Dam
age
to s
trin
gers
and
ver
tica
l sti
ffner
s an
d se
ttin
g in
of t
he s
hell
plat
ing
at th
e 70
ft d
raft
le
vel.
--
Non
e N
o da
mag
e.
-
404
Pai
nt s
crap
ed o
ff.
--
Min
or
Dam
age
on th
e ve
ssel
's bo
w a
nd b
ulw
arks
. -
405
Slig
ht s
uper
ficia
l dam
age
to th
e co
lum
n fe
nder
and
also
an
acce
ss la
dder
on
No.
2 w
inch
. -
-M
inor
D
amag
e to
the
brid
ge a
nd a
lso d
amag
ed th
e la
unch
dav
it o
f the
por
t FR
C.
-
406
Dam
age
to e
scap
e pl
atfo
rm fo
r th
e lif
eraf
ts, l
ifegu
ard
guid
e w
ires
and
bun
keri
ng h
oses
. -
--
--
407
Dam
age
to fi
re w
ater
mai
n. M
itiga
tion
mea
sure
s in
pla
ce.
--
--
-
408
Tw
o sc
ore
mar
ks a
nd a
sm
all i
nden
tati
on in
leg.
-
--
--
409
Pai
nt r
emov
ed.
--
Min
or
Som
e da
mag
e to
inst
rum
ents
and
to th
e R
OV
laun
ch s
truc
ture
on
the
side
of t
he v
esse
l. -
410
Supe
rfic
ial d
amag
e of
the
plat
form
leg.
-
-M
inor
D
amag
e to
the
focs
le.
-
411
No
dam
age.
N
o -
--
-
412
No
dam
age.
-
-M
inor
Su
perf
icia
l dam
age,
hol
e in
bul
war
k an
d so
me
dam
age
to b
ridg
e.
-
413
No
dam
age.
N
o -
--
-
414
No
dam
age.
N
o -
--
-
415
No
dam
age.
N
o -
--
-
416
No
dam
age.
N
o -
Min
or
Tea
r in
ves
sel r
ubbi
ng b
and
9" x
5"
wid
e.
-
417
No
dam
age.
-
--
--
418
No
dam
age.
N
o -
--
-
419
No
dam
age.
N
o -
--
-
420
No
dam
age.
N
o -
--
-
421
No
dam
age.
N
o -
Min
or
Inde
ntat
ion
on s
tern
of v
esse
l. -
422
No
dam
age.
N
o -
Min
or
Dam
age
to v
esse
l fra
mes
and
pla
ting
. -
423
No
dam
age.
-
--
--
424
No
dam
age.
N
o -
--
-
425
No
dam
age.
N
o -
--
-
426
No
dam
age.
-
--
--
427
Impa
ct s
usta
ined
by
woo
den
bloc
k of
laun
ch r
unne
r.
No
--
--
428
Hit
out
rigg
ed s
caffo
ldin
g.
No
--
--
429
No
dam
age.
-
--
--
430
No
dam
age
repo
rted
. -
--
--
431
No
dam
age.
N
o -
Non
e N
o da
mag
e.
-
432
No
dam
age.
N
o -
Mod
erat
e Sm
all h
ole
in h
ull a
bove
wat
erlin
e.
HSE
89

Con
sec.
N
o.
433
Info
rmat
ion
Sour
ce
Dat
e (d
d/m
m/y
r) Y
ear
Mon
th
Loca
tion
Inst
alla
tion
Typ
e Im
pact
V
esse
l Typ
e Im
pact
O
rien
tatio
n Se
a C
ondi
tion
Ope
ratin
g C
ircu
mst
ance
s Pr
imar
y C
ause
Im
pact
Poi
nt
Inst
alla
tion
Dam
age
Stiff
ener
D
amag
e Pl
ate
Den
ts In
stal
latio
n D
amag
e C
lass
AT
TEN
DA
NT
VES
SEL
CO
LLIS
ION
S N
MI
09/0
4/82
19
82
Apr
il C
entr
al
Fixe
d St
eel
Supp
ly
Ster
n 3.
0 C
argo
Tra
nsfe
r E
ngin
e C
ontr
ol F
ailu
re
Leg
Non
e N
o N
o N
one
434
DE
n 19
/08/
82
1982
A
ugus
t C
entr
al
Sem
i-Su
bmer
sible
Cra
ne B
arge
Su
pply
St
ern
-C
argo
Unl
oadi
ng
Wea
ther
Con
diti
ons
Leg
Stbd
. Sid
e N
one
No
No
Non
e
435
DE
n 29
/08/
82
1982
A
ugus
t So
uthe
rn
Jack
-Up
Supp
ly
Ster
n 3.
0 A
ppro
achi
ng I
nsta
llati
on
Wea
ther
Con
diti
ons
Leg
Port
N
one
No
No
Non
e
436
DE
n 11
/09/
82
1982
Se
ptem
ber
Mor
ecam
be
Bay
Se
mi-
Subm
ersi
ble
Acc
omm
odat
ion
Supp
ly
--
App
roac
hing
Ins
talla
tion
M
isju
dgem
ent
Leg
Bow
Sid
e N
one
No
No
Non
e
437
DE
n 21
/01/
83
1983
Ja
nuar
y N
orth
ern
Fixe
d C
oncr
ete
Supp
ly
-3.
5 C
argo
Tra
nsfe
r W
eath
er C
ondi
tion
s B
reak
wat
er W
all
Non
e N
o N
o N
one
438
DE
n 22
/01/
83
1983
Ja
nuar
y C
entr
al
Sem
i-Su
bmer
sibl
e D
rilli
ng
Supp
ly
--
Car
go U
nloa
ding
E
ngin
e Po
wer
Fai
lure
C
olum
ns C
PC
4 &
PC
2 N
one
No
No
Non
e
439
DE
n 28
/02/
83
1983
Fe
brua
ry
Cen
tral
Fi
xed
Stee
l Su
pply
Si
de
3.0
App
roac
hing
Ins
talla
tion
T
hrus
ter
Failu
re
Fend
er
Non
e N
o N
o N
one
440
DE
n 22
/03/
83
1983
M
arch
C
entr
al
Sem
i-Su
bmer
sibl
e D
rilli
ng
Supp
ly
-3.
5 A
ppro
achi
ng I
nsta
llati
on
Mis
judg
emen
t C
olum
n C
P4
Non
e N
o N
o N
one
441
DE
n 27
/06/
83
1983
Ju
ne
Nor
ther
n Fi
xed
Stee
l Su
pply
-
-Pe
rson
nel T
rans
fer
Wea
ther
Con
ditio
ns
Fend
er
Non
e N
o N
o N
one
442
DE
n 29
/06/
83
1983
Ju
ne
Sout
hern
Ja
ck-U
p St
and-
By
Side
-
App
roac
hing
Ins
talla
tion
M
isju
dgem
ent
Leg
Rac
k N
one
No
No
Non
e
443
DE
n 23
/09/
83
1983
Se
ptem
ber
Nor
ther
n Fi
xed
Stee
l D
iver
Sup
port
-
-D
ivin
g O
pera
tions
D
.P. R
emot
e C
ontr
ol F
ailu
re
Leg
B2
Non
e N
o N
o N
one
444
DE
n 22
/10/
83
1983
O
ctob
er
Cen
tral
Se
mi-
Subm
ersi
ble
Dri
lling
Su
pply
-
-A
ncho
r H
andl
ing
Mis
judg
emen
t N
o. 8
Anc
hor
Cha
in
Non
e N
o N
o N
one
445
DE
n 02
/02/
84
1984
Fe
brua
ry
Mor
ecam
be
Bay
Ja
ck-U
p Su
pply
Si
de
3.0
Car
go U
nloa
ding
C
onta
iner
s W
eath
er C
ondi
tions
Le
g N
one
No
No
Non
e
446
DE
n 09
/05/
84
1984
M
ay
Cen
tral
Se
mi-
Subm
ersi
ble
Mob
ile S
uppo
rt
Supp
ly
Side
3.
0 C
argo
Unl
oadi
ng
Thr
uste
r Fa
ilure
C
olum
n P
F N
one
No
No
Non
e
447
DE
n 06
/10/
84
1984
O
ctob
er
Mor
ecam
be
Bay
Ja
ck-U
p Su
pply
-
--
Wea
ther
Con
ditio
ns
Leg
Non
e N
o N
o N
one
448
DE
n 22
/02/
85
1985
Fe
brua
ry
Nor
ther
n Fi
xed
Con
cret
e R
esea
rch
Ster
n -
Car
go U
nloa
ding
P
oor
Vis
ibili
ty
Bre
akw
ater
Wal
l N
one
No
No
Non
e
449
DE
n 08
/04/
85
1985
A
pril
-Ja
ck-U
p Su
pply
St
ern
-C
argo
Unl
oadi
ng
Mis
judg
emen
t Le
g C
hord
N
one
No
No
Non
e
450
DE
n 27
/07/
85
1985
Ju
ly
Sout
hern
Fi
xed
Stee
l D
iver
Sup
port
Si
de
1.5
App
roac
hing
Ins
talla
tion
M
isju
dgem
ent
Leg
B4
Min
or
No
No
Non
e
451
HSE
18
/09/
85
1985
Se
ptem
ber
Sout
hern
Fi
xed
Stee
l Su
pply
-
-A
ppro
achi
ng I
nsta
llati
on
-B
oat L
andi
ng
Stag
e N
one
No
No
Non
e
452
DE
n 31
/01/
86
1986
Ja
nuar
y C
entr
al
Fixe
d St
eel
Supp
ly
Ster
n 3.
5 C
argo
Unl
oadi
ng
Mis
judg
emen
t SW
Lan
ding
Fe
nder
N
one
No
No
Non
e
453
DE
n 21
/02/
86
1986
Fe
brua
ry
Sout
hern
Fi
xed
Stee
l Su
pply
-
-C
argo
Unl
oadi
ng
Mis
judg
emen
t -
Non
e N
o N
o N
one
454
HSE
03
/03/
86
1986
M
arch
So
uthe
rn
Fixe
d St
eel
Supp
ly
Mas
t -
--
Flar
e B
oom
N
one
No
No
Non
e
455
DE
n 22
/04/
86
1986
A
pril
Cen
tral
Fi
xed
Stee
l Su
pply
-
-A
ppro
achi
ng I
nsta
llati
on
Wea
ther
Con
diti
ons
Dec
k N
one
No
No
Non
e
456
DE
n 24
/04/
86
1986
A
pril
Sout
hern
Fi
xed
Stee
l St
and-
By
--
Div
ing
Ope
ratio
ns
Anc
hor
Dra
gged
Sp
ider
Dec
k M
inor
N
o N
o N
one
457
DE
n 28
/04/
87
1987
A
pril
-Ja
ck-U
p Su
pply
Si
de
-C
argo
Tra
nsfe
r A
ncho
r D
ragg
ed
-N
one
No
No
Non
e
458
DE
n 31
/01/
88
1988
Ja
nuar
y -
Jack
-Up
Supp
ly
Ster
n 3.
75
Car
go U
nloa
ding
W
eath
er C
ondi
tion
s Le
g Po
rt
Non
e N
o N
o N
one
459
DE
n 13
/10/
89
1989
O
ctob
er
Sout
hern
Ja
ck-U
p Su
pply
-
-C
argo
Tra
nsfe
r E
ngin
e C
ontr
ol F
ailu
re
Leg
3 M
inor
N
o N
o N
one
460
DE
n 22
/10/
89
1989
O
ctob
er
Nor
ther
n Fi
xed
Con
cret
e Su
pply
-
-C
argo
Tra
nsfe
r E
ngin
e C
ontr
ol F
ailu
re
Shaf
t N
one
No
No
Non
e
461
DE
n 22
/02/
90
1990
Fe
brua
ry
Sout
hern
Ja
ck-U
p Su
pply
Si
de
2.0
Car
go T
rans
fer
Wea
ther
Con
ditio
ns
Leg
Rac
k N
one
No
No
Non
e
462
DE
n 11
/09/
90
1990
Se
ptem
ber
Cen
tral
Fi
xed
Stee
l St
and-
By
--
--
-N
one
No
No
Non
e
463
DE
n 13
/11/
90
1990
N
ovem
ber
Nor
ther
n Fi
xed
Con
cret
e St
and-
By
--
Clo
se S
uppo
rt
Mis
judg
emen
t Le
g N
W
Non
e N
o N
o N
one
464
DE
n 22
/12/
90
1990
D
ecem
ber
-Ja
ck-U
p Su
pply
-
--
--
Non
e N
o N
o N
one
465
DE
n 22
/12/
90
1990
D
ecem
ber
Cen
tral
Se
mi-
Subm
ersi
ble
Acc
omm
odat
ion
Supp
ly
--
--
-N
one
No
No
Non
e
466
DE
n 18
/04/
91
1991
A
pril
Sout
hern
Ja
ck-U
p Su
pply
-
--
-B
ow L
eg
Non
e N
o N
o N
one
467
DE
n 06
/06/
91
1991
Ju
ne
Cen
tral
Se
mi-
Subm
ersi
ble
Dri
lling
Su
pply
P
ort Q
uart
er
-C
argo
Tra
nsfe
r Po
wer
Fai
lure
St
bd. B
oat
Bum
per
Non
e N
o N
o N
one
468
DE
n 16
/08/
91
1991
A
ugus
t C
entr
al
Jack
-Up
Stan
d-B
y -
-C
lose
Sup
port
E
ngin
e C
ontr
ol F
ailu
re
Stbd
. Leg
N
one
No
No
Non
e
469
DE
n 27
/08/
91
1991
A
ugus
t So
uthe
rn
Sem
i-Su
bmer
sible
Dri
lling
Su
pply
St
bd. S
ide
-C
argo
Tra
nsfe
r -
Forw
ard
Leg
Non
e N
o N
o N
one
470
DE
n 14
/10/
91
1991
O
ctob
er
Sout
hern
Fi
xed
Con
cret
e Su
pply
-
--
-W
est L
eg
Non
e N
o N
o N
one
471
DE
n 21
/10/
91
1991
O
ctob
er
Cen
tral
Se
mi-
Subm
ersi
ble
Dri
lling
Su
pply
-
--
--
Non
e N
o N
o N
one
90

Con
sec.
N
o.
433
Inst
alla
tion
Dam
age
Det
ails
Rep
aire
d R
epai
r Det
ails
Ves
sel
Cla
ss
Oth
er S
ourc
e
AT
TEN
DA
NT
VES
SEL
CO
LLIS
ION
S N
o da
mag
e.
No
--
--
434
No
dam
age.
N
o -
Seve
re
Hol
e in
tank
. H
SE
435
Stru
ck le
g 4
tim
es w
itho
ut d
amag
ing
it.
No
-M
inor
T
rivi
al d
amag
e to
ste
rn r
ubbe
r tr
ailin
g.
HSE
436
No
dam
age.
N
o -
Min
or
Tri
vial
den
t in
vess
el r
ubbi
ng b
ar.
HSE
437
Ves
sel s
truc
k br
eakw
ater
. N
o -
Mod
erat
e Lo
ss o
f aer
ials,
ben
d of
mai
n m
ast t
hrou
gh 5
0 de
gree
s.
-
438
No
dam
age.
-
--
-H
SE
439
No
dam
age.
N
o -
--
-
440
No
dam
age.
-
-Se
vere
H
oled
die
sel t
ank
whi
ch le
aked
. -
441
No
dam
age.
N
o -
--
-
442
No
dam
age.
N
o -
Sunk
H
oled
by
rack
teet
h an
d si
nkin
g he
nce
sunk
by
Nav
y in
pos
itio
n 55
20.
3'N
; 000 5
5.36
'W.
LMIS
443
444
445
446
447
448
449
450
451
452
453
454
455
456
457
458
459
460
461
462
463
464
465
466
467
468
469
470
471
dies
el o
il in
to I
nver
gord
on S
ound
. W
OA
D, M
AIB
91

472
Sour
ce
Dat
e V
esse
l Typ
e Im
pact
Se
a O
pera
ting
Dam
age
Den
ts In
stal
latio
n
Cla
ss
AT
TEN
DA
NT
VES
SEL
CO
LLIS
ION
S D
En
29/0
2/92
19
92
Febr
uary
So
uthe
rn
Fixe
d St
eel
Res
earc
h -
-Su
rvey
ing
Mis
judg
emen
t -
Non
e N
o N
o N
one
473
DE
n 10
/07/
92
1992
Ju
ly
Sout
hern
Ja
ck-U
p St
and-
By
-0.
0 -
Mis
judg
emen
t B
ow L
eg
Non
e N
o N
o N
one
474
DE
n 31
/08/
92
1992
A
ugus
t So
uthe
rn
Jack
-Up
Supp
ly
Stbd
. Qua
rter
2.
0 -
Ele
ctri
cal F
ailu
re
Por
t Leg
N
one
No
No
Non
e
475
DE
n 02
/09/
92
1992
Se
ptem
ber
Sout
hern
Ja
ck-U
p Su
pply
-
3.0
Car
go T
rans
fer
Wea
ther
Con
ditio
ns
Bow
Leg
N
one
No
No
Non
e
476
HSE
20
/12/
92
1992
D
ecem
ber
Cen
tral
Se
mi-
Subm
ersi
ble
Dri
lling
St
and-
By
--
Clo
se S
uppo
rt
Thr
uste
r C
ontr
ol F
ailu
re
Stbd
. Fw
d. 1
8'
477
HSE
06
/02/
93
1993
Fe
brua
ry
-U
nspe
cifie
d Su
pply
-
-B
unke
ring
Ope
ratio
ns
-P
ost S
ide
Fend
er
No
No
Non
e
478
DE
n 24
/03/
93
1993
M
arch
So
uthe
rn
Jack
-Up
Supp
ly
Stbd
. Sid
e 3.
0 C
argo
Tra
nsfe
r W
eath
er C
ondi
tions
P
ort F
wd.
Leg
N
one
No
No
Non
e
479
MA
IB
21/0
7/93
19
93
July
So
uthe
rn
Sem
i-Su
bmer
sible
Cra
ne B
arge
St
and-
By
Por
t Sid
e -
Clo
se S
uppo
rt
Ope
rato
r E
rror
St
bd. S
ide
Non
e N
o N
o N
one
480
HSE
16
/09/
93
1993
Se
ptem
ber
Bay
481
HSE
23
/12/
93
1993
D
ecem
ber
Sout
hern
Ja
ck-U
p Su
pply
St
ern
-C
argo
Tra
nsfe
r W
eath
er C
ondi
tions
Po
rt L
eg
Non
e N
o N
o N
one
482
HSE
24
/02/
94
1994
Fe
brua
ry
Cen
tral
Fi
xed
Stee
l St
and-
By
--
Clo
se S
uppo
rt
Pos
t/O
pera
tion
Neg
lect
ed
Stru
ctur
al
Supp
ort
Non
e N
o N
o N
one
483
WO
AD
03
/04/
94
1994
A
pril
Sout
hern
Ja
ck-U
p Su
pply
St
bd. S
ide
4.0
App
roac
hing
Ins
talla
tion
-
Leg
Non
e N
o N
o N
one
484
HSE
18
/04/
94
1994
A
pril
-Ja
ck-U
p St
and-
By
Stbd
. Sid
e -
Car
go T
rans
fer
Mis
judg
emen
t P
ort B
ow L
eg
Non
e N
o N
o N
one
485
HSE
04
/06/
94
1994
Ju
ne
Sout
hern
Ja
ck-U
p Su
pply
P
ort Q
uart
er
-C
argo
Tra
nsfe
r -
Fwd.
Cor
ner
of
486
HSE
19
/09/
94
1994
Se
ptem
ber
-Se
mi-
Subm
ersib
le D
rilli
ng
Stan
d-B
y -
-C
argo
Tra
nsfe
r E
ngin
e C
ontr
ol F
ailu
re
Anc
hor
Wir
e N
one
No
No
Non
e
487
HSE
20
/12/
94
1994
D
ecem
ber
-Se
mi-
Subm
ersi
ble
Dri
lling
Su
pply
P
ort Q
uart
er
-C
argo
Tra
nsfe
r -
Fair
lead
488
HSE
06
/06/
95
1995
Ju
ne
Cen
tral
Fi
xed
Stee
l St
and-
By
--
Clo
se S
uppo
rt
Pos
t/O
pera
tion
Neg
lect
ed
Nor
th-E
ast L
eg
Non
e N
o N
o N
one
489
HSE
22
/07/
95
1995
Ju
ly
Cen
tral
Fi
xed
Stee
l D
iver
Sup
port
A
eria
ls 3.
5 D
ivin
g O
pera
tions
D
.P. F
ailu
re
Bel
ow L
ifebo
ats
Non
e N
o N
o N
one
490
HSE
06
/09/
95
1995
Se
ptem
ber
Cen
tral
Fi
xed
Stee
l St
and-
By
Aer
ials
-A
ppro
achi
ng I
nsta
llati
on
-B
ridg
e B
etw
een
Pla
tfor
ms
491
HSE
29
/12/
95
1995
D
ecem
ber
Nor
ther
n Si
ngle
Poi
nt M
oori
ng
Tan
ker
492
HSE
16
/07/
96
1996
Ju
ly
Sout
hern
Fi
xed
Stee
l Su
pply
-
-C
argo
Tra
nsfe
r -
Stbd
. Aft
493
MA
IB
03/1
1/96
19
96
Nov
embe
r So
uthe
rn
Fixe
d St
eel
Supp
ly
--
Car
go T
rans
fer
Wea
ther
Con
ditio
ns
Cro
ss M
embe
r W
eed
Rem
oved
N
o N
o N
one
494
HSE
29
/03/
97
1997
M
arch
N
orth
ern
Fixe
d St
eel
Supp
ly
--
Car
go T
rans
fer
Thr
uste
r Fa
ilure
B
7 Le
g 10
ft B
elow
Wat
erlin
e N
o N
o N
one
495
HSE
06
/01/
99
1999
Ja
nuar
y B
ay
496
HSE
23
/03/
99
1999
M
arch
-
Jack
-Up
Supp
ly
Stbd
. Qua
rter
-
App
roac
hing
Ins
talla
tion
-
Cho
rd 'c
' Bow
497
HSE
23
/07/
99
1999
Ju
ly
Sout
hern
Fi
xed
Stee
l St
and-
By
--
App
roac
hing
Ins
talla
tion
-
Bra
ce
Non
e N
o N
o N
one
498
HSE
04
/09/
99
1999
Se
ptem
ber
Cen
tral
Fi
xed
Stee
l Su
pply
M
ast
0.8
Car
go T
rans
fer
Wea
ther
Con
ditio
ns
Wal
kway
499
HSE
30
/10/
99
1999
O
ctob
er
-Ja
ck-U
p St
and-
By
FRC
-
Car
go T
rans
fer
Wea
ther
Con
ditio
ns
Por
t Fw
d. L
eg
Non
e N
o N
o N
one
500
HSE
27
/01/
00
2000
Ja
nuar
y B
ay
501
HSE
28
/10/
01
2001
O
ctob
er
Sout
hern
Fi
xed
Stee
l St
and-
By
-1.
0 C
argo
Tra
nsfe
r -
--
No
No
Non
e
502
LMIS
17
/11/
79
1979
N
ovem
ber
Cen
tral
Se
mi-
Subm
ersi
ble
Dri
lling
Su
pply
-
--
Wea
ther
Con
ditio
ns
--
No
No
Uns
peci
fied
503
HSE
01
/01/
80
1980
Ja
nuar
y So
uthe
rn
Fixe
d St
eel
Div
er S
uppo
rt
--
App
roac
hing
Ins
talla
tion
Eng
ine
Con
trol
Fai
lure
-
-N
o N
o U
nspe
cifie
d
504
HSE
04
/05/
81
1981
M
ay
Sout
hern
Fi
xed
Stee
l Su
pply
-
--
Anc
hor
Dra
gged
St
bd. S
tern
Leg
-
No
No
Uns
peci
fied
505
HSE
06
/10/
84
1984
O
ctob
er
Bay
506
HSE
05
/01/
85
1985
Ja
nuar
y -
Jack
-Up
--
--
Wea
ther
Con
ditio
ns
--
No
No
Uns
peci
fied
507
HSE
16
/09/
85
1985
Se
ptem
ber
Cen
tral
Fi
xed
Stee
l St
and-
By
--
--
--
No
No
Uns
peci
fied
508
HSE
23
/02/
86
1986
Fe
brua
ry
-Ja
ck-U
p T
ug
--
--
Por
t Aft
-
No
No
Uns
peci
fied
509
HSE
20
/12/
87
1987
D
ecem
ber
-Se
mi-
Subm
ersi
ble
Dri
lling
Su
pply
-
--
--
-N
o N
o U
nspe
cifie
d
92

Con
sec.
N
o.
472
Inst
alla
tion
Dam
age
Det
ails
Rep
aire
d R
epai
r Det
ails
Ves
sel
Cla
ss
Oth
er S
ourc
e
AT
TEN
DA
NT
VES
SEL
CO
LLIS
ION
S N
o st
ruct
ural
dam
age.
-
--
-H
SE
473
No
visu
al d
amag
e.
--
Min
or
Uns
peci
fied
min
or d
amag
e.
HSE
& M
AIB
474
No
dam
age
to s
truc
ture
. -
-M
inor
3"
spl
it s
usta
ined
by
vess
el's
stbd
. qua
rter
rub
bing
str
ake.
H
SE
475
No
visu
al d
amag
e to
leg.
-
-M
inor
M
inor
dam
age
to fe
nder
. H
SE
476
No
visi
ble
sign
s of
dam
age.
-
--
--
477
No
dam
age
repo
rted
. -
--
--
478
No
dam
age.
-
-M
inor
Sl
ight
dam
age
to s
tbd.
rub
bing
str
ake.
H
SE
479
No
dam
age.
-
-M
oder
ate
FRC
dam
aged
. -
480
Non
e ap
pare
nt.
--
Mod
erat
e U
nspe
cifie
d ho
le in
hul
l abo
ve w
ater
line.
M
AIB
481
No
dam
age.
N
o -
Min
or
Supe
rfic
ial d
amag
e an
d sli
ght t
eeth
mar
ks to
ste
rn.
-
482
Non
e ap
pare
nt.
--
Mod
erat
e E
xten
sive
dam
age
to s
tarb
oard
rai
ls ar
ound
mon
key
isla
nd, r
adar
sca
nner
and
nav
igat
ion/
radi
o ae
rial
s.
-
483
Aft
er in
vest
igat
ions
no
dam
age
repo
rted
. -
-Se
vere
E
xten
sive
uns
peci
fied
dam
age
to s
tarb
oard
sid
e.
MA
IB &
NSL
484
No
dam
age.
N
o -
Min
or
Smal
l ind
enta
tion
in h
ull.
-
485
No
dam
age.
N
o -
--
MA
IB
486
Non
e sp
ecifi
ed.
--
--
-
487
Non
e ap
pare
nt.
--
Seve
re
Hol
e in
hul
l in
way
of p
otab
le w
ater
tank
. -
488
Non
e ap
pare
nt.
--
Min
or
Uns
peci
fied
min
or d
amag
e.
-
489
Non
e ap
pare
nt.
--
Min
or
Dam
age
to a
eria
ls. R
ecal
led
to A
berd
een.
-
490
Non
e ap
pare
nt.
--
Min
or
Min
or d
amag
e to
aer
ials.
-
491
Non
e ap
pare
nt.
--
--
-
492
Con
tact
did
not
occ
ur. P
otab
le w
ater
hos
e bu
rst a
s ve
ssel
pul
led
clea
r.
--
--
-
493
No
dam
age
repo
rted
. -
-M
oder
ate
Stbd
. rud
der
dam
age.
Ves
sel r
etur
ned
to p
ort.
-
494
No
appa
rent
dam
age
at 6
.5m
leve
l. -
-M
inor
M
inor
pla
te in
dent
atio
n on
por
t bow
app
rox
20 ft
from
the
vess
el s
tem
. M
AIB
495
Con
tact
did
not
occ
ur. P
otab
le w
ater
hos
e bu
rst a
s ve
ssel
dri
fted
cle
ar.
--
--
-
496
No
dam
age
to th
e le
g ch
ord.
-
--
--
497
Non
e ap
pare
nt.
--
Mod
erat
e D
amag
e to
bal
last
tank
. -
498
Non
e ap
pare
nt.
--
Min
or
Nav
igat
ion
light
bro
ken
and
afte
r m
ast b
ent b
y ap
prox
imat
ely
10o .
-
499
No
dam
age
repo
rted
. -
-M
oder
ate
FRC
was
sen
t to
pick
up
mai
l in
mar
gina
l wea
ther
and
in d
oing
so
the
craf
t cam
e in
to c
onta
ct
with
inst
alla
tion.
Cra
ft s
usta
ined
som
e da
mag
e w
hich
req
uire
d on
shor
e re
pair
. -
500
No
appa
rent
dam
age.
-
-M
oder
ate
Ves
sel p
roce
eded
to L
iver
pool
. -
501
No
obvi
ous
dam
age.
-
-N
one
No
dam
age.
-
502
--
-Se
vere
T
owed
to H
auge
sund
for
repa
irs.
Sus
tain
ed h
ole
in h
ull a
nd li
st.
-
503
--
--
--
504
--
--
--
505
--
--
--
506
--
--
--
507
--
--
--
508
--
--
--
509
--
--
--
93

Con
sec.
N
o.
510
Info
rmat
ion
Sour
ce
Dat
e (d
d/m
m/y
r) Y
ear
Mon
th
Loca
tion
Inst
alla
tion
Typ
e Im
pact
V
esse
l Typ
e Im
pact
O
rien
tatio
n Se
a C
ondi
tion
Ope
ratin
g C
ircu
mst
ance
s Pr
imar
y C
ause
Im
pact
Poi
nt
Inst
alla
tion
Dam
age
Stiff
ener
D
amag
e Pl
ate
Den
ts In
stal
latio
n D
amag
e C
lass
AT
TEN
DA
NT
VES
SEL
CO
LLIS
ION
S H
SE
21/0
9/89
19
89
Sept
embe
r -
Sem
i-Su
bmer
sibl
e A
ccom
mod
atio
n St
and-
By
--
--
--
No
No
Uns
peci
fied
511
HSE
25
/12/
90
1990
D
ecem
ber
Sout
hern
Ja
ck-U
p Su
pply
St
bd. S
ide
3.5
Car
go T
rans
fer
Wea
ther
Con
ditio
ns
Port
Leg
-
No
No
Uns
peci
fied
512
HSE
04
/01/
91
1991
Ja
nuar
y C
entr
al
-St
and-
By
--
--
Wes
t Fac
e -
No
No
Uns
peci
fied
513
MA
IB
31/0
1/91
19
91
Janu
ary
-Se
mi-
Subm
ersi
ble
Dri
lling
A
ncho
r H
andl
er
--
--
--
No
No
Uns
peci
fied
514
MA
IB
29/0
8/91
19
91
Aug
ust
Cen
tral
Se
mi-
Subm
ersi
ble
Dri
lling
Su
pply
-
--
--
-N
o N
o U
nspe
cifie
d
515
HSE
15
/05/
92
1992
M
ay
-Se
mi-
Subm
ersi
ble
Dri
lling
Su
pply
-
-C
argo
Tra
nsfe
r E
ngin
e Po
wer
Fai
lure
Fw
d. P
ost
Col
umn
-N
o N
o U
nspe
cifie
d
516
MA
IB
13/0
8/92
19
92
Aug
ust
Nor
ther
n Fi
xed
Stee
l Su
pply
-
--
--
-N
o N
o U
nspe
cifie
d
517
HSE
30
/08/
92
1992
A
ugus
t -
-Su
pply
-
--
-B
ow L
eg
-N
o N
o U
nspe
cifie
d
518
HSE
28
/01/
93
1993
Ja
nuar
y C
entr
al
Sem
i-Su
bmer
sibl
e D
rilli
ng
Supp
ly
Funn
el
-A
ppro
achi
ng I
nsta
llati
on
-A
ncho
r W
inch
C
ab P
latf
orm
-
No
No
Uns
peci
fied
519
HSE
18
/08/
93
1993
A
ugus
t N
orth
ern
Fixe
d C
oncr
ete
Supp
ly
-2.
0 C
argo
Tra
nsfe
r -
--
No
No
Uns
peci
fied
520
HSE
17
/02/
94
1994
Fe
brua
ry
Cen
tral
Se
mi-
Subm
ersi
ble
Pro
duct
ion
Supp
ly
--
--
Por
t Fw
d.
Col
umn
-N
o N
o U
nspe
cifie
d
521
MA
IB
15/0
4/94
19
94
Apr
il M
orec
ambe
B
ay
Bar
ge
Anc
hor
Han
dler
-
--
--
-N
o N
o U
nspe
cifie
d
522
HSE
14
/08/
94
1994
A
ugus
t So
uthe
rn
Jack
-Up
Supp
ly
--
-T
otal
Pow
er L
oss
Fwd.
and
Stb
d.
Legs
-
No
No
Uns
peci
fied
523
MA
IB
21/0
9/94
19
94
Sept
embe
r C
eltic
Sea
Se
mi-
Subm
ersi
ble
Dri
lling
St
and-
By
--
-O
pera
tor
Err
or
--
No
No
Uns
peci
fied
524
HSE
12
/12/
94
1994
D
ecem
ber
Mor
ecam
be
Bay
Fi
xed
Stee
l Su
pply
-
1.5
Car
go T
rans
fer
Mis
judg
emen
t N
o. 1
Life
boat
St
atio
n -
No
No
Uns
peci
fied
525
HSE
03
/01/
95
1995
Ja
nuar
y So
uthe
rn
Jack
-Up
Supp
ly
--
--
--
No
No
Uns
peci
fied
526
HSE
28
/01/
95
1995
Ja
nuar
y N
orth
ern
Fixe
d St
eel
Supp
ly
--
App
roac
hing
Ins
talla
tion
-
Eas
t Cen
tral
St
ruct
ure
-N
o N
o U
nspe
cifie
d
527
HSE
29
/01/
95
1995
Ja
nuar
y So
uthe
rn
Fixe
d St
eel
Supp
ly
-2.
0 C
argo
Tra
nsfe
r -
Spid
er D
eck
-N
o N
o U
nspe
cifie
d
528
LMIS
05
/07/
95
1995
Ju
ly
Sout
hern
Fi
xed
Stee
l D
iver
Sup
port
-
--
--
-N
o N
o U
nspe
cifie
d
529
MA
IB
12/1
0/95
19
95
Oct
ober
C
entr
al
Fixe
d St
eel
Supp
ly
Stbd
. Qua
rter
-
App
roac
hing
Ins
talla
tion
M
isju
dgem
ent
Leg
Fend
er
-N
o N
o U
nspe
cifie
d
530
HSE
07
/11/
95
1995
N
ovem
ber
Sout
hern
Fi
xed
Stee
l A
ncho
r H
andl
er
--
--
--
No
No
Uns
peci
fied
531
HSE
10
/11/
96
1996
N
ovem
ber
Sout
hern
Fi
xed
Stee
l Su
pply
-
-C
argo
Tra
nsfe
r -
B1
Leg
-N
o N
o U
nspe
cifie
d
532
HSE
16
/01/
97
1997
Ja
nuar
y -
Jack
-Up
--
-C
argo
Tra
nsfe
r O
pera
tor
Err
or
--
No
No
Uns
peci
fied
533
MA
IB
23/0
2/97
19
97
Febr
uary
C
entr
al
Floa
ting
Pro
duct
ion
& S
tora
ge
Supp
ly
Ven
t Pip
e -
Car
go T
rans
fer
Ope
rato
r E
rror
C
rane
Hoo
k -
No
No
Uns
peci
fied
534
HSE
03
/03/
97
1997
M
arch
-
Jack
-Up
--
--
--
-N
o N
o U
nspe
cifie
d
535
HSE
28
/07/
97
1997
Ju
ly
Mor
ecam
be
Bay
Fi
xed
Stee
l D
iver
Sup
port
Si
de a
nd M
ast
-D
ivin
g O
pera
tions
E
ngin
e C
ontr
ol F
ailu
re
Leg
and
Rise
r -
No
No
Uns
peci
fied
536
HSE
12
/08/
97
1997
A
ugus
t C
entr
al
Floa
ting
Pro
duct
ion
& S
tora
ge
Mer
chan
t T
anke
r -
-Lo
adin
g C
rude
Oil
D.P
. Fai
lure
St
ern
-N
o N
o U
nspe
cifie
d
537
HSE
25
/10/
97
1997
O
ctob
er
Cen
tral
Fi
xed
Stee
l Su
pply
St
ern
2.5
Car
go T
rans
fer
D.P
. Con
trol
Fai
lure
SW
Leg
-
No
No
Uns
peci
fied
538
HSE
03
/12/
97
1997
D
ecem
ber
Sout
hern
Fi
xed
Stee
l Su
pply
-
--
-Le
g -
No
No
Uns
peci
fied
539
HSE
09
/02/
98
1998
Fe
brua
ry
-Se
mi-
Subm
ersi
ble
Dri
lling
Su
pply
P
ort Q
uart
er
4.0
Car
go T
rans
fer
-P
ort F
orw
ard
and
Cen
tre
Col
umns
-
No
No
Uns
peci
fied
540
HSE
03
/03/
98
1998
M
arch
-
Jack
-Up
Supp
ly
--
--
Dri
lling
C
ondu
ctor
-
No
No
Uns
peci
fied
541
HSE
26
/04/
98
1998
A
pril
Wes
t of
Shet
land
s Fl
oati
ng P
rodu
ctio
n &
Sto
rage
A
ncho
r H
andl
er
--
Anc
hor
Han
dlin
g -
Shel
l Pla
ting
-
No
No
Uns
peci
fied
542
HSE
30
/04/
98
1998
A
pril
-Ja
ck-U
p Su
pply
St
ern
--
Ope
rato
r E
rror
Po
rt A
ft Le
g -
No
No
Uns
peci
fied
543
HSE
14
/05/
98
1998
M
ay
-Ja
ck-U
p Su
pply
-
--
-Po
rt L
eg
-N
o N
o U
nspe
cifie
d
544
HSE
25
/06/
98
1998
Ju
ne
Nor
ther
n Fi
xed
Con
cret
e Su
pply
-
-C
argo
Tra
nsfe
r -
NW
Leg
-C
olum
n 1
-N
o N
o U
nspe
cifie
d
545
HSE
15
/08/
98
1998
A
ugus
t C
entr
al
Sing
le B
uoy
Moo
ring
M
erch
ant
Tan
ker
Por
t Bow
-
Load
ing
Cru
de O
il D
.P. T
hrus
ter
Failu
re
Out
er S
kirt
-
No
No
Uns
peci
fied
546
HSE
22
/11/
98
1998
N
ovem
ber
Sout
hern
Fi
xed
Stee
l Su
pply
-
-C
argo
Tra
nsfe
r -
NE
Leg
-
No
No
Uns
peci
fied
547
HSE
16
/12/
98
1998
D
ecem
ber
-Se
mi-
Subm
ersi
ble
Dri
lling
Su
pply
-
--
-Le
g -
No
No
Uns
peci
fied
548
HSE
24
/12/
98
1998
D
ecem
ber
-Ja
ck-U
p Su
pply
-
-A
ppro
achi
ng I
nsta
llati
on
Eng
ine
Con
trol
Fai
lure
St
bd. C
hord
In
ner
Leg
-N
o N
o U
nspe
cifie
d
94

Con
sec.
N
o.
510
Inst
alla
tion
Dam
age
Det
ails
Rep
aire
d R
epai
r Det
ails
Ves
sel
Cla
ss
Oth
er S
ourc
e
AT
TEN
DA
NT
VES
SEL
CO
LLIS
ION
S -
--
--
-
511
Supe
rfic
ial d
amag
e.
--
Sunk
V
esse
l hol
ed in
stb
d. s
ide
just
aft
of f
unne
l lea
ding
to p
ower
loss
and
eve
ntua
l fou
nder
ing
in
posi
tion
530 0
2'.7
6N; 0
30 01'
.92E
at 1
213
hrs.
on sa
me
day
with
200
m3 o
f die
sel o
il on
boa
rd.
WO
AD
& L
MIS
512
--
--
--
513
--
Inst
alla
tion
at C
rom
arty
Fir
th.
--
-
514
--
--
--
515
--
--
--
516
--
--
--
517
--
--
-M
AIB
518
--
--
--
519
--
-M
oder
ate
Dam
age
to b
ridg
e an
d st
eeri
ng. T
owed
to I
nver
gord
on.
LMIS
520
--
--
--
521
--
-M
inor
-
-
522
--
-M
oder
ate
Hol
e in
No.
5 b
alla
st t
ank.
M
AIB
&
WO
AD
523
--
--
--
524
--
--
--
525
--
--
-M
AIB
526
--
--
--
527
--
--
--
528
--
-Se
vere
V
esse
l hol
ed o
n w
ater
line
in w
ay o
f fue
l tan
k. T
aken
to S
outh
Shi
elds
for
repa
ir.
-
529
--
--
--
530
Dam
age
not s
igni
fican
t. St
ruct
ural
ass
essm
ent c
arri
ed o
ut.
--
--
531
--
--
--
532
--
--
--
533
--
-M
oder
ate
Fuel
tank
ven
t pip
e ri
pped
off.
-
534
--
--
--
535
--
--
--
536
--
--
--
537
--
--
--
538
--
--
--
539
--
-M
oder
ate
Hol
ed o
n po
rt a
ft q
uart
er. P
roce
eded
to A
berd
een
for
repa
irs.
-
540
--
--
--
541
--
--
--
542
--
--
--
543
--
-M
oder
ate
Pos
sibl
y ho
led.
Pro
ceed
ed to
por
t.
-
544
--
--
--
545
--
-M
inor
D
eep
scuf
fing
alon
g 25
met
ers
on p
ort b
ow.
-
546
--
--
--
547
--
--
--
548
--
--
--
95

Con
sec.
N
o.
549
Info
rmat
ion
Sour
ce
Dat
e (d
d/m
m/y
r) Y
ear
Mon
th
Loca
tion
Inst
alla
tion
Typ
e Im
pact
V
esse
l Typ
e Im
pact
O
rien
tatio
n Se
a C
ondi
tion
Ope
ratin
g C
ircu
mst
ance
s Pr
imar
y C
ause
Im
pact
Poi
nt
Inst
alla
tion
Dam
age
Stiff
ener
D
amag
e Pl
ate
Den
ts In
stal
latio
n D
amag
e C
lass
AT
TEN
DA
NT
VES
SEL
CO
LLIS
ION
S H
SE
01/0
3/99
19
99
Mar
ch
Sout
hern
Fi
xed
Stee
l Su
pply
P
ort Q
uart
er
--
-SE
Leg
-
No
No
Uns
peci
fied
550
HSE
29
/04/
99
1999
A
pril
-Se
mi-
Subm
ersi
ble
Dri
lling
Su
pply
-
-A
ncho
r H
andl
ing
Wea
ther
Con
ditio
ns
Anc
hor
-N
o N
o U
nspe
cifie
d
551
HSE
08
/05/
99
1999
M
ay
-Ja
ck-U
p T
ug
--
Tow
ing
-C
rane
Ped
esta
l -
No
No
Uns
peci
fied
552
HSE
30
/01/
00
2000
Ja
nuar
y So
uthe
rn
Fixe
d St
eel
Supp
ly
Stbd
. Qua
rter
-
App
roac
hing
Ins
talla
tion
-
SW L
eg
-N
o N
o U
nspe
cifie
d
553
HSE
20
/04/
00
2000
A
pril
-Se
mi-
Subm
ersi
ble
Dri
lling
Su
pply
St
ern
-A
ppro
achi
ng I
nsta
llatio
n W
eath
er C
ondi
tions
C
olum
n C
4 -
No
No
Uns
peci
fied
554
HSE
19
/07/
00
2000
Ju
ly
-Ja
ck-U
p A
ncho
r H
andl
er
--
Anc
hor
Han
dlin
g T
hrus
ter
Failu
re
--
No
No
Uns
peci
fied
555
HSE
04
/02/
01
2001
Fe
brua
ry
-Se
mi-
Subm
ersi
ble
Dri
lling
Su
pply
-
--
-Le
gs
-N
o N
o U
nspe
cifie
d
556
HSE
02
/05/
01
2001
M
ay
-Se
mi-
Subm
ersi
ble
Dri
lling
St
and-
By
--
Clo
se S
uppo
rt
Ope
rato
r E
rror
St
bd. A
ft
Dia
gona
l Bra
ce
and
Col
umn
-N
o N
o U
nspe
cifie
d
557
DE
n 23
/11/
90
1990
N
ovem
ber
Cen
tral
Se
mi-
Subm
ersi
ble
Dri
lling
St
and-
By
--
--
Buo
y N
one
No
No
Not
A
pplic
able
96

Con
sec.
N
o.
549
Inst
alla
tion
Dam
age
Det
ails
Rep
aire
d R
epai
r Det
ails
Ves
sel
Cla
ss
Oth
er S
ourc
e
AT
TEN
DA
NT
VES
SEL
CO
LLIS
ION
S V
esse
l mad
e gl
anci
ng c
onta
ct.
--
--
-
550
--
-M
oder
ate
Rig
's an
chor
pun
ctur
ed a
hol
e in
one
of t
he b
alla
st ta
nks.
-
551
Min
imal
dam
age
to c
rane
ped
esta
l and
hel
idec
k su
ppor
ts.
--
--
-
552
--
--
--
553
Uns
peci
fied
dam
age
repo
rted
. -
-N
one
No
dam
age.
-
554
Uns
peci
fied
dam
age
repo
rted
in th
e ar
ea o
f pre
load
tank
s N
os. 2
0 an
d 22
. -
--
--
555
--
--
--
556
--
--
--
557
Stru
ck a
ncho
r bu
oy.*
****
-
--
--
97

Appendix B Commercial Shipping Between UKCS and U.K.
98

Maximum Vessel Deadweight (tonnes) 0 - 5000 5001 - 15000 >50000Year Quarter Reporting Port 15001 - 50000 Total Voyages
2000 1 Aberdeen 3519 23 3542 2000 2 Aberdeen 5310 18 5328 2000 3 Aberdeen 4517 42 4559 2000 4 Aberdeen 4200 41 4241 2001 1 Aberdeen 3694 28 3722 2001 2 Aberdeen 846 3 849 2000 1 Cromarty Firth 4 4 2000 2 Cromarty Firth 2 1 1 4 2000 3 Cromarty Firth 9 1 3 13 2000 4 Cromarty Firth 8 3 11 2001 1 Cromarty Firth 5 5 2001 2 Cromarty Firth 12 1 13 2000 1 Dundee 2 2 2000 2 Dundee 5 5 2000 3 Dundee 8 8 2000 4 Dundee 1 1 2000 1 Firth of Forth 3 3 2000 2 Firth of Forth 12 1 13 2000 3 Firth of Forth 2 16 1 19 2000 4 Firth of Forth 8 8 16 2001 1 Firth of Forth 5 5 2001 2 Firth of Forth 2 2 2000 1 Great Yarmouth 391 391 2000 2 Great Yarmouth 533 533 2000 3 Great Yarmouth 655 655 2000 4 Great Yarmouth 515 515 2001 1 Great Yarmouth 338 338 2001 2 Great Yarmouth 28 28 2000 1 Hartlepool 3 3 2000 2 Hartlepool 4 4 2000 1 Heysham 222 222 2000 2 Heysham 228 228 2000 3 Heysham 498 498 2000 4 Heysham 537 537 2001 1 Heysham 588 588 2001 2 Heysham 661 661 2000 1 Milford Haven 21 21 2000 2 Milford Haven 1 24 25 2000 3 Milford Haven 35 35 2000 4 Milford Haven 21 21 2001 1 Milford Haven 20 20 2001 2 Milford Haven 21 21 2000 1 Peterhead 1380 4 1384 2000 2 Peterhead 1738 1738 2000 3 Peterhead 1799 3 1802 2000 4 Peterhead 1675 5 1680 2001 1 Peterhead 2538 1538 2001 2 Peterhead 2099 6 2105 2000 1 River Clyde 1 1 2000 2 River Clyde 1 1 2000 3 River Clyde 2 2 2000 4 River Clyde 2 2 2000 1 River Humber 8 24 32 2000 2 River Humber 10 1 24 35 2000 3 River Humber 12 26 38 2000 4 River Humber 43 4 29 76 2001 1 River Humber 44 22 66 2001 2 River Humber 19 12 31 2000 1 River Mersey 4 27 31 2000 2 River Mersey 8 32 40 2000 3 River Mersey 5 17 22 2000 4 River Mersey 25 25 2001 1 River Mersey 14 14
99
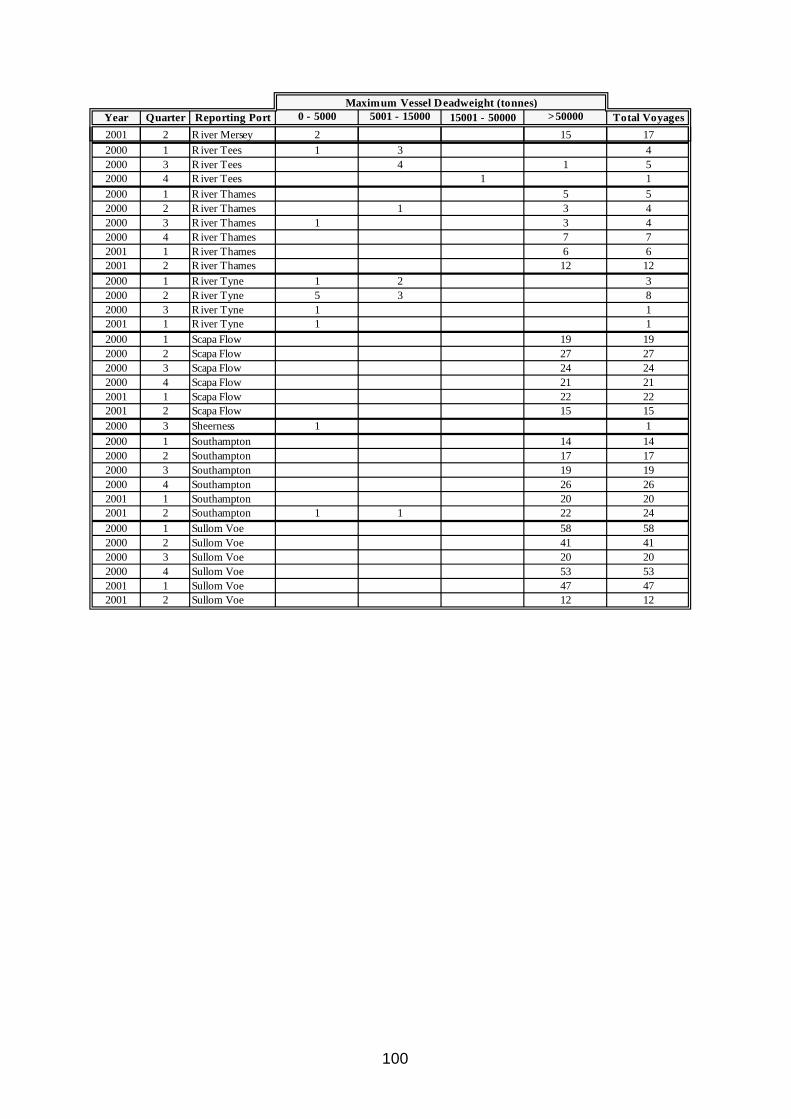
2000 1 Aberdeen 3519 23 3542
Year Quarter Reporting Port 0 - 5000 5001 - 15000 15001 - 50000 >50000 Total Voyages Maximum Vessel Deadweight (tonnes)
2001 2 River Mersey 2 2000 1 River Tees 1 3 4 2000 3 River Tees 4 1 5 2000 4 River Tees 1 1 2000 1 River Thames 5 5 2000 2 River Thames 1 3 4 2000 3 River Thames 1 3 4 2000 4 River Thames 7 7 2001 1 River Thames 6 6 2001 2 River Thames 12 12 2000 1 River Tyne 1 2 3 2000 2 River Tyne 5 3 8 2000 3 River Tyne 1 1 2001 1 River Tyne 1 1 2000 1 Scapa Flow 19 19 2000 2 Scapa Flow 27 27 2000 3 Scapa Flow 24 24 2000 4 Scapa Flow 21 21 2001 1 Scapa Flow 22 22 2001 2 Scapa Flow 15 15 2000 3 Sheerness 1 1 2000 1 Southampton 14 14 2000 2 Southampton 17 17 2000 3 Southampton 19 19 2000 4 Southampton 26 26 2001 1 Southampton 20 20 2001 2 Southampton 1 1 22 24 2000 1 Sullom Voe 58 58 2000 2 Sullom Voe 41 41 2000 3 Sullom Voe 20 20 2000 4 Sullom Voe 53 53 2001 1 Sullom Voe 47 47 2001 2 Sullom Voe 12 12
15 17
100

Appendix C Commercial Cargo on ERRV
101

Year Quarter Reporting Port Direction Voyages Cargo Type Cargo Weight (t)
2000 1 Aberdeen Outwards to UKCS 1 Other General Cargo and Containers less than 20' 2 2000 1 Aberdeen Outwards to UKCS 1 Other General Cargo and Containers less than 20' 2 2000 2 Aberdeen Outwards to UKCS 1 Other General Cargo and Containers less than 20' 5 2000 3 Aberdeen Inwards from UKCS 1 Other General Cargo and Containers less than 20' 61 2000 3 Aberdeen Inwards from UKCS 1 Other General Cargo and Containers less than 20' 25 2000 3 Aberdeen Inwards from UKCS 1 Other General Cargo and Containers less than 20' 41 2000 3 Aberdeen Inwards from UKCS 1 Other General Cargo and Containers less than 20' 13 2000 3 Aberdeen Inwards from UKCS 1 Other General Cargo and Containers less than 20' 71 2000 3 Aberdeen Inwards from UKCS 1 Other General Cargo and Containers less than 20' 79 2000 3 Aberdeen Inwards from UKCS 1 Other General Cargo and Containers less than 20' 26 2000 3 Aberdeen Inwards from UKCS 2 Other General Cargo and Containers less than 20' 14 2000 3 Aberdeen Outwards to UKCS 1 Other General Cargo and Containers less than 20' 37 2000 3 Aberdeen Outwards to UKCS 1 Other General Cargo and Containers less than 20' 52 2000 3 Aberdeen Outwards to UKCS 1 Other General Cargo and Containers less than 20' 6 2000 3 Aberdeen Outwards to UKCS 1 Other General Cargo and Containers less than 20' 39 2000 3 Aberdeen Outwards to UKCS 1 Other General Cargo and Containers less than 20' 81 2000 3 Aberdeen Outwards to UKCS 1 Other General Cargo and Containers less than 20' 44 2000 3 Aberdeen Outwards to UKCS 1 Other General Cargo and Containers less than 20' 27 2000 3 Aberdeen Outwards to UKCS 1 Other General Cargo and Containers less than 20' 21 2000 3 Aberdeen Inwards from UKCS 1 Other General Cargo and Containers less than 20' 10 2000 3 Aberdeen Outwards to UKCS 1 Other General Cargo and Containers less than 20' 7 2000 3 Aberdeen Outwards to UKCS 1 Other General Cargo and Containers less than 20' 19 2000 4 Aberdeen Inwards from UKCS 1 Other General Cargo and Containers less than 20' 3 2000 4 Aberdeen Inwards from UKCS 1 Other Liquid Bulk Products 37 2000 4 Aberdeen Inwards from UKCS 1 Other General Cargo and Containers less than 20' 2 2000 4 Aberdeen Inwards from UKCS 1 Other General Cargo and Containers less than 20' 35 2000 4 Aberdeen Inwards from UKCS 1 Other General Cargo and Containers less than 20' 5 2000 4 Aberdeen Inwards from UKCS 1 Other General Cargo and Containers less than 20' 81 2000 4 Aberdeen Outwards to UKCS 1 Other General Cargo and Containers less than 20' 39 2000 4 Aberdeen Outwards to UKCS 1 Other General Cargo and Containers less than 20' 119 2000 4 Aberdeen Outwards to UKCS 1 Other General Cargo and Containers less than 20' 18 2000 4 Aberdeen Outwards to UKCS 1 Iron and Steel Products 236 2000 4 Aberdeen Outwards to UKCS 1 Other General Cargo and Containers less than 20' 44 2000 4 Aberdeen Inwards from UKCS 1 Other General Cargo and Containers less than 20' 42 2000 4 Aberdeen Inwards from UKCS 1 Other General Cargo and Containers less than 20' 24 2000 4 Aberdeen Outwards to UKCS 1 Other General Cargo and Containers less than 20' 24 2001 1 Aberdeen Inwards from UKCS 1 Other General Cargo and Containers less than 20' 2 2001 1 Aberdeen Inwards from UKCS 1 Other General Cargo and Containers less than 20' 167 2001 1 Aberdeen Inwards from UKCS 1 Other General Cargo and Containers less than 20' 35 2001 1 Aberdeen Inwards from UKCS 1 Other General Cargo and Containers less than 20' 40 2001 1 Aberdeen Inwards from UKCS 1 Other General Cargo and Containers less than 20' 5 2001 1 Aberdeen Inwards from UKCS 1 Other General Cargo and Containers less than 20' 105 2001 1 Aberdeen Inwards from UKCS 1 Iron and Steel Products 68 2001 1 Aberdeen Outwards to UKCS 1 Other General Cargo and Containers less than 20' 4 2001 1 Aberdeen Outwards to UKCS 1 Other General Cargo and Containers less than 20' 18 2001 1 Aberdeen Outwards to UKCS 1 Other General Cargo and Containers less than 20' 47 2001 1 Aberdeen Outwards to UKCS 1 Other General Cargo and Containers less than 20' 2 2001 1 Aberdeen Outwards to UKCS 1 Other General Cargo and Containers less than 20' 4 2001 1 Aberdeen Outwards to UKCS 1 Other General Cargo and Containers less than 20' 20 2001 1 Aberdeen Outwards to UKCS 1 Other General Cargo and Containers less than 20' 16 2001 1 Aberdeen Inwards from UKCS 1 Other General Cargo and Containers less than 20' 22 2001 1 Aberdeen Inwards from UKCS 1 Other General Cargo and Containers less than 20' 89 2001 1 Aberdeen Outwards to UKCS 1 Other General Cargo and Containers less than 20' 2 2001 1 Aberdeen Outwards to UKCS 1 Other General Cargo and Containers less than 20' 61 2001 1 Aberdeen Outwards to UKCS 1 Other General Cargo and Containers less than 20' 9 2001 1 Aberdeen Outwards to UKCS 1 Other General Cargo and Containers less than 20' 56 2001 1 Aberdeen Outwards to UKCS 1 Other General Cargo and Containers less than 20' 26 2001 1 Aberdeen Outwards to UKCS 1 Other General Cargo and Containers less than 20' 20 2001 1 Aberdeen Inwards from UKCS 1 Other General Cargo and Containers less than 20' 3 2001 1 Aberdeen Outwards to UKCS 1 Other General Cargo and Containers less than 20' 68 2001 1 Aberdeen Outwards to UKCS 1 Other General Cargo and Containers less than 20' 6 2001 1 Aberdeen Outwards to UKCS 1 Other General Cargo and Containers less than 20' 27 2001 1 Aberdeen Inwards from UKCS 1 Other General Cargo and Containers less than 20' 5 2001 1 Aberdeen Inwards from UKCS 2 Other General Cargo and Containers less than 20' 16 2001 1 Aberdeen Outwards to UKCS 1 Other General Cargo and Containers less than 20' 91 2001 1 Aberdeen Outwards to UKCS 2 Other General Cargo and Containers less than 20' 79 2001 1 Aberdeen Outwards to UKCS 1 Other General Cargo and Containers less than 20' 19 2001 1 Aberdeen Outwards to UKCS 7 Other General Cargo and Containers less than 20' 67
102

Year Quarter Reporting Port Direction Voyages Cargo Type Cargo Weight (t)
2001 1 Aberdeen Outwards to UKCS 1 Other General Cargo and Containers less than 20' 42 2001 2 Aberdeen Outwards to UKCS 1 Other General Cargo and Containers less than 20' 5 2001 2 Aberdeen Outwards to UKCS 1 Other General Cargo and Containers less than 20' 5 2001 2 Aberdeen Inwards from UKCS 1 Other Dry Bulk 170 2001 2 Aberdeen Inwards from UKCS 1 Other General Cargo and Containers less than 20' 25 2001 2 Aberdeen Inwards from UKCS 1 Iron and Steel Products 16 2001 2 Aberdeen Inwards from UKCS 1 Other General Cargo and Containers less than 20' 70 2001 2 Aberdeen Inwards from UKCS 1 Other General Cargo and Containers less than 20' 112 2001 2 Aberdeen Inwards from UKCS 1 Other General Cargo and Containers less than 20' 21 2001 2 Aberdeen Inwards from UKCS 1 Other General Cargo and Containers less than 20' 112 2001 2 Aberdeen Inwards from UKCS 1 Other General Cargo and Containers less than 20' 112 2001 2 Aberdeen Outwards to UKCS 1 Other General Cargo and Containers less than 20' 42 2001 2 Aberdeen Outwards to UKCS 1 Other General Cargo and Containers less than 20' 11 2001 2 Aberdeen Outwards to UKCS 1 Other General Cargo and Containers less than 20' 1 2001 2 Aberdeen Outwards to UKCS 1 Other General Cargo and Containers less than 20' 1 2001 2 Aberdeen Outwards to UKCS 1 Other General Cargo and Containers less than 20' 1 2001 2 Aberdeen Inwards from UKCS 1 Other General Cargo and Containers less than 20' 102 2001 2 Aberdeen Inwards from UKCS 1 Other General Cargo and Containers less than 20' 34 2001 2 Aberdeen Inwards from UKCS 1 Other General Cargo and Containers less than 20' 20 2001 2 Aberdeen Outwards to UKCS 1 Other General Cargo and Containers less than 20' 101 2001 2 Aberdeen Outwards to UKCS 1 Other General Cargo and Containers less than 20' 20 2001 2 Aberdeen Outwards to UKCS 1 Other General Cargo and Containers less than 20' 55 2001 2 Aberdeen Outwards to UKCS 1 Other General Cargo and Containers less than 20' 2 2001 4 Aberdeen Inwards from UKCS 1 Other General Cargo and Containers less than 20' 23 2000 1 Great Yarmouth Inwards from UKCS 1 Other General Cargo and Containers less than 20' 26 2000 1 Great Yarmouth Inwards from UKCS 1 Other General Cargo and Containers less than 20' 14 2000 1 Great Yarmouth Outwards to UKCS 1 Other General Cargo and Containers less than 20' 6 2000 1 Great Yarmouth Outwards to UKCS 1 Other General Cargo and Containers less than 20' 26 2000 1 Great Yarmouth Outwards to UKCS 1 Other General Cargo and Containers less than 20' 58 2000 1 Great Yarmouth Outwards to UKCS 2 Other General Cargo and Containers less than 20' 80 2000 1 Great Yarmouth Outwards to UKCS 1 Other General Cargo and Containers less than 20' 45 2000 2 Great Yarmouth Inwards from UKCS 1 Other General Cargo and Containers less than 20' 21 2000 2 Great Yarmouth Inwards from UKCS 1 Other General Cargo and Containers less than 20' 22 2000 2 Great Yarmouth Inwards from UKCS 1 Other General Cargo and Containers less than 20' 20 2000 2 Great Yarmouth Inwards from UKCS 1 Other General Cargo and Containers less than 20' 24 2000 2 Great Yarmouth Outwards to UKCS 1 Other General Cargo and Containers less than 20' 23 2000 2 Great Yarmouth Outwards to UKCS 1 Other General Cargo and Containers less than 20' 35 2000 2 Great Yarmouth Outwards to UKCS 1 Other General Cargo and Containers less than 20' 25 2000 2 Great Yarmouth Inwards from UKCS 4 Other General Cargo and Containers less than 20' 119 2000 2 Great Yarmouth Inwards from UKCS 3 Other General Cargo and Containers less than 20' 57 2000 2 Great Yarmouth Inwards from UKCS 3 Other General Cargo and Containers less than 20' 73 2000 2 Great Yarmouth Outwards to UKCS 3 Other General Cargo and Containers less than 20' 105 2000 2 Great Yarmouth Outwards to UKCS 2 Other General Cargo and Containers less than 20' 91 2000 2 Great Yarmouth Outwards to UKCS 3 Other General Cargo and Containers less than 20' 91 2000 3 Great Yarmouth Inwards from UKCS 1 Other General Cargo and Containers less than 20' 33 2000 3 Great Yarmouth Inwards from UKCS 1 Other General Cargo and Containers less than 20' 21 2000 3 Great Yarmouth Inwards from UKCS 1 Other General Cargo and Containers less than 20' 32 2000 3 Great Yarmouth Inwards from UKCS 2 Other General Cargo and Containers less than 20' 30 2000 3 Great Yarmouth Outwards to UKCS 1 Other General Cargo and Containers less than 20' 22 2000 3 Great Yarmouth Outwards to UKCS 1 Other General Cargo and Containers less than 20' 20 2000 3 Great Yarmouth Inwards from UKCS 3 Other General Cargo and Containers less than 20' 135 2000 3 Great Yarmouth Inwards from UKCS 3 Other General Cargo and Containers less than 20' 105 2000 3 Great Yarmouth Inwards from UKCS 2 Other General Cargo and Containers less than 20' 42 2000 3 Great Yarmouth Outwards to UKCS 4 Other General Cargo and Containers less than 20' 169 2000 3 Great Yarmouth Outwards to UKCS 3 Other General Cargo and Containers less than 20' 157 2000 3 Great Yarmouth Outwards to UKCS 2 Other General Cargo and Containers less than 20' 76 2000 3 Great Yarmouth Inwards from UKCS 3 Other General Cargo and Containers less than 20' 18 2000 3 Great Yarmouth Outwards to UKCS 3 Other General Cargo and Containers less than 20' 117 2000 4 Great Yarmouth Inwards from UKCS 1 Other General Cargo and Containers less than 20' 31 2000 4 Great Yarmouth Inwards from UKCS 2 Other General Cargo and Containers less than 20' 16 2000 4 Great Yarmouth Outwards to UKCS 2 Other General Cargo and Containers less than 20' 37 2000 4 Great Yarmouth Outwards to UKCS 1 Other General Cargo and Containers less than 20' 32 2000 4 Great Yarmouth Outwards to UKCS 2 Other General Cargo and Containers less than 20' 20 2000 4 Great Yarmouth Inwards from UKCS 1 Other General Cargo and Containers less than 20' 29 2000 4 Great Yarmouth Inwards from UKCS 2 Other General Cargo and Containers less than 20' 52 2000 4 Great Yarmouth Inwards from UKCS 4 Other General Cargo and Containers less than 20' 116 2000 4 Great Yarmouth Outwards to UKCS 1 Other General Cargo and Containers less than 20' 24 2000 4 Great Yarmouth Outwards to UKCS 2 Other General Cargo and Containers less than 20' 93
103

Year Quarter Reporting Port Direction Voyages Cargo Type Cargo Weight (t)
2000 4 Great Yarmouth Outwards to UKCS 4 Other General Cargo and Containers less than 20' 137 2000 4 Great Yarmouth Outwards to UKCS 2 Other General Cargo and Containers less than 20' 75 2000 4 Great Yarmouth Inwards from UKCS 2 Other General Cargo and Containers less than 20' 97 2000 4 Great Yarmouth Inwards from UKCS 4 Other General Cargo and Containers less than 20' 159 2000 4 Great Yarmouth Inwards from UKCS 6 Other General Cargo and Containers less than 20' 193 2000 4 Great Yarmouth Outwards to UKCS 2 Other General Cargo and Containers less than 20' 102 2000 4 Great Yarmouth Outwards to UKCS 4 Other General Cargo and Containers less than 20' 51 2000 4 Great Yarmouth Outwards to UKCS 6 Other General Cargo and Containers less than 20' 367 2001 1 Great Yarmouth Inwards from UKCS 1 Other General Cargo and Containers less than 20' 23 2001 1 Great Yarmouth Inwards from UKCS 1 Other General Cargo and Containers less than 20' 19 2001 1 Great Yarmouth Outwards to UKCS 1 Other General Cargo and Containers less than 20' 22 2001 1 Great Yarmouth Outwards to UKCS 1 Other General Cargo and Containers less than 20' 19 2001 1 Great Yarmouth Inwards from UKCS 2 Other General Cargo and Containers less than 20' 74 2001 1 Great Yarmouth Inwards from UKCS 2 Other General Cargo and Containers less than 20' 56 2001 1 Great Yarmouth Inwards from UKCS 2 Other General Cargo and Containers less than 20' 80 2001 1 Great Yarmouth Inwards from UKCS 3 Other General Cargo and Containers less than 20' 90 2001 1 Great Yarmouth Inwards from UKCS 2 Other General Cargo and Containers less than 20' 65 2001 1 Great Yarmouth Inwards from UKCS 2 Other General Cargo and Containers less than 20' 98 2001 1 Great Yarmouth Outwards to UKCS 2 Other General Cargo and Containers less than 20' 66 2001 1 Great Yarmouth Outwards to UKCS 2 Other General Cargo and Containers less than 20' 86 2001 1 Great Yarmouth Outwards to UKCS 2 Other General Cargo and Containers less than 20' 96 2001 2 Great Yarmouth Inwards from UKCS 3 Other General Cargo and Containers less than 20' 51 2001 2 Great Yarmouth Outwards to UKCS 3 Other General Cargo and Containers less than 20' 57 2001 2 Great Yarmouth Inwards from UKCS 2 Other General Cargo and Containers less than 20' 92 2001 2 Great Yarmouth Inwards from UKCS 2 Other General Cargo and Containers less than 20' 74 2001 2 Great Yarmouth Inwards from UKCS 4 Other General Cargo and Containers less than 20' 137 2001 2 Great Yarmouth Outwards to UKCS 2 Other General Cargo and Containers less than 20' 89 2001 2 Great Yarmouth Outwards to UKCS 3 Other General Cargo and Containers less than 20' 114 2001 2 Great Yarmouth Outwards to UKCS 4 Other General Cargo and Containers less than 20' 184 2001 3 Great Yarmouth Inwards from UKCS 2 Other General Cargo and Containers less than 20' 89 2001 3 Great Yarmouth Inwards from UKCS 2 Other General Cargo and Containers less than 20' 109 2001 3 Great Yarmouth Inwards from UKCS 2 Other General Cargo and Containers less than 20' 72 2001 3 Great Yarmouth Outwards to UKCS 2 Other General Cargo and Containers less than 20' 85 2001 3 Great Yarmouth Outwards to UKCS 2 Other General Cargo and Containers less than 20' 168 2001 3 Great Yarmouth Outwards to UKCS 2 Other General Cargo and Containers less than 20' 89 2001 4 Great Yarmouth Inwards from UKCS 2 Other General Cargo and Containers less than 20' 98 2001 4 Great Yarmouth Outwards to UKCS 2 Other General Cargo and Containers less than 20' 99 2000 1 Heysham Inwards from UKCS 6 Other General Cargo and Containers less than 20' 85 2000 1 Heysham Outwards to UKCS 6 Other Liquid Bulk Products 1163 2000 1 Heysham Outwards to UKCS 6 Other General Cargo and Containers less than 20' 85 2001 1 Immingham Inwards from UKCS 1 Other General Cargo and Containers less than 20' 21 2001 1 Immingham Outwards to UKCS 1 Other General Cargo and Containers less than 20' 10 2001 1 Immingham Inwards from UKCS 2 Other General Cargo and Containers less than 20' 150 2001 1 Immingham Outwards to UKCS 5 Other General Cargo and Containers less than 20' 96 2001 1 Immingham Outwards to UKCS 1 Other General Cargo and Containers less than 20' 190 2001 2 Immingham Inwards from UKCS 1 Other General Cargo and Containers less than 20' 12 2001 2 Immingham Outwards to UKCS 1 Other General Cargo and Containers less than 20' 17 2001 2 Immingham Inwards from UKCS 4 Other General Cargo and Containers less than 20' 290 2001 2 Immingham Outwards to UKCS 4 Other General Cargo and Containers less than 20' 250 2001 3 Immingham Inwards from UKCS 3 Other General Cargo and Containers less than 20' 276 2000 1 Liverpool Outwards to UKCS 1 Other Liquid Bulk Products 220 2000 1 Peterhead Bay Outwards to UKCS 1 Other Liquid Bulk Products 50 2000 2 Peterhead Bay Inwards from UKCS 1 Other General Cargo and Containers less than 20' 52 2000 2 Peterhead Bay Outwards to UKCS 1 Other General Cargo and Containers less than 20' 72 2000 2 Peterhead Bay Inwards from UKCS 1 Other General Cargo and Containers less than 20' 12 2000 2 Peterhead Bay Outwards to UKCS 1 Other Liquid Bulk Products 56 2000 2 Peterhead Bay Outwards to UKCS 1 Other General Cargo and Containers less than 20' 40 2000 3 Peterhead Bay Inwards from UKCS 1 Other General Cargo and Containers less than 20' 15 2000 3 Peterhead Bay Outwards to UKCS 1 Other General Cargo and Containers less than 20' 54 2000 3 Peterhead Bay Inwards from UKCS 2 Other General Cargo and Containers less than 20' 73 2000 3 Peterhead Bay Outwards to UKCS 2 Other General Cargo and Containers less than 20' 44 2000 3 Peterhead Bay Inwards from UKCS 1 Other General Cargo and Containers less than 20' 62 2000 3 Peterhead Bay Outwards to UKCS 1 Other General Cargo and Containers less than 20' 27
104

App
endi
x D
‘N
ear
Mis
s’ D
atab
ase
105
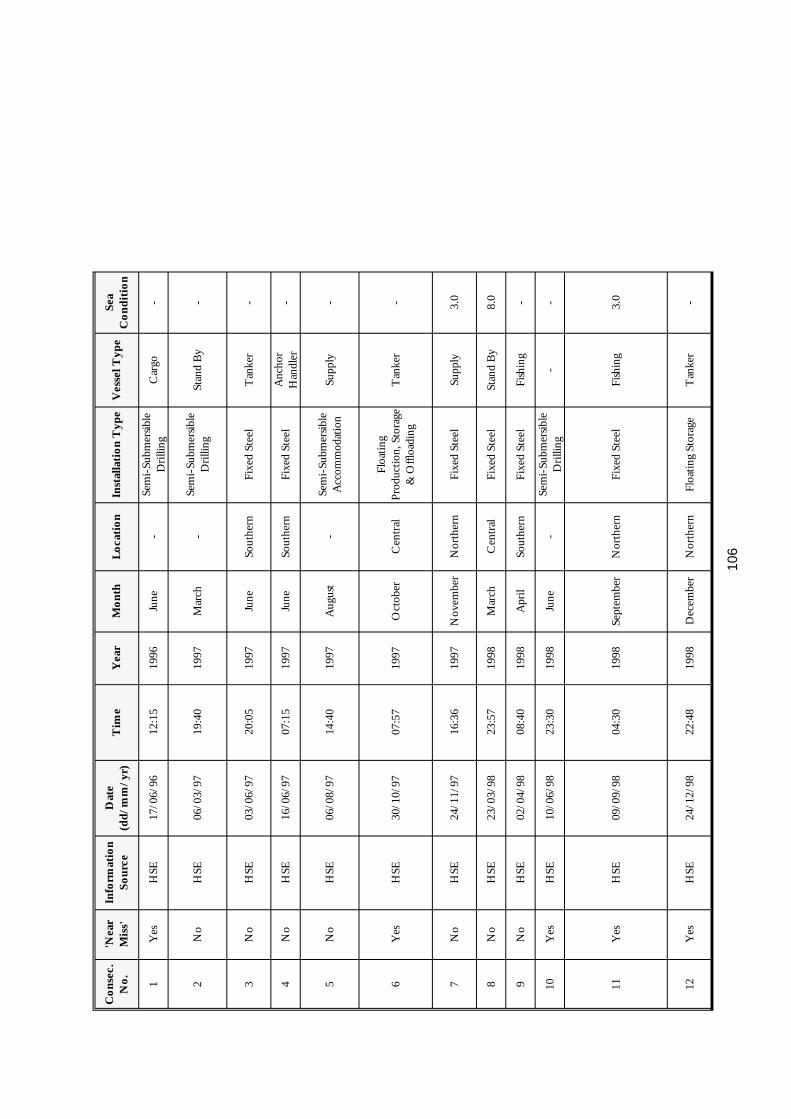
Con
sec.
N
o.
'Nea
r M
iss'
Info
rmat
ion
Sour
ce
Dat
e (d
d/m
m/y
r)
Tim
e Y
ear
Mon
th
Loca
tion
Inst
alla
tion
Typ
e V
esse
l Typ
e Se
a C
ondi
tion
1 Y
es
HSE
17
/06/
96
12:1
5 19
96
June
-
Sem
i-Su
bmer
sibl
e D
rilli
ng
Car
go
-
2 N
o H
SE
06/0
3/97
19
:40
1997
M
arch
-
Sem
i-Su
bmer
sibl
e D
rilli
ng
Stan
d B
y -
3 N
o H
SE
03/0
6/97
20
:05
1997
Ju
ne
Sout
hern
Fi
xed
Stee
l T
anke
r -
4 N
o H
SE
16/0
6/97
07
:15
1997
Ju
ne
Sout
hern
Fi
xed
Stee
l A
ncho
r H
andl
er
-
5 N
o H
SE
06/0
8/97
14
:40
1997
A
ugus
t -
Sem
i-Su
bmer
sibl
e A
ccom
mod
atio
n Su
pply
-
6 Y
es
HSE
30
/10/
97
07:5
7 19
97
Oct
ober
C
entr
al
Floa
ting
Pro
duct
ion,
Sto
rage
&
Offl
oadi
ng
Tan
ker
-
7 N
o H
SE
24/1
1/97
16
:36
1997
N
ovem
ber
Nor
ther
n Fi
xed
Stee
l Su
pply
3.
0
8 N
o H
SE
23/0
3/98
23
:57
1998
M
arch
C
entr
al
Fixe
d St
eel
Stan
d B
y 8.
0
9 N
o H
SE
02/0
4/98
08
:40
1998
A
pril
Sout
hern
Fi
xed
Stee
l Fi
shin
g -
10
Yes
H
SE
10/0
6/98
23
:30
1998
Ju
ne
-Se
mi-
Subm
ersi
ble
Dri
lling
-
-
11
Yes
H
SE
09/0
9/98
04
:30
1998
Se
ptem
ber
Nor
ther
n Fi
xed
Stee
l Fi
shin
g 3.
0
12
Yes
H
SE
24/1
2/98
22
:48
1998
D
ecem
ber
Nor
ther
n Fl
oatin
g St
orag
e T
anke
r -
106

Con
sec.
N
o.
Ope
ratin
g C
ircu
mst
ance
s Pr
imar
y C
ause
Oth
er S
ourc
e C
onfir
ms
1 C
argo
ves
sel l
ost p
ower
and
was
dri
ftin
g to
war
ds th
e ri
g. D
rilli
ng o
pera
tions
susp
ende
d an
d do
wn
man
ning
took
pla
ce. L
ocal
ves
sels
gave
ass
ista
nce
to g
et a
tow
line
att
ache
d an
d pu
ll th
e ve
ssel
cle
ar o
f the
rig
. T
otal
Pow
er L
oss
2
Ves
sel r
epor
ted
engi
ne fa
ilure
whi
le p
ositi
oned
up
win
d of
dri
lling
rig
. Rel
ativ
e be
arin
g ob
serv
atio
n in
dica
ted
vess
el w
ould
dri
ft p
ast
clos
e bu
t not
col
lide
with
rig
. Mon
itori
ng c
ontin
ued.
Sta
nd b
y ve
ssel
pro
ceed
ed w
ith a
ttem
pts t
o pl
ace
tow
line
ont
o ve
ssel
. Tow
w
as se
cure
d an
d C
PA
was
incr
ease
d to
in e
xces
s of 1
00 y
ards
. Tug
arr
ived
on
scen
e an
d se
cure
d to
w li
ne o
n ve
ssel
. Tow
line
had
pa
rtin
g sh
ortly
aft
er b
eing
secu
red.
Ves
sel l
ater
rec
over
ed p
ower
.
Eng
ine
Failu
re
App
endi
x E
(s
ee C
onse
c.
No.
18)
3 T
anke
r w
as p
assi
ng in
stal
latio
n on
SW
cor
ner.
Clo
sest
poi
nt to
inst
alla
tion
was
1.5
nau
tical
mile
s. T
anke
r lo
st a
ll en
gine
pow
er w
hen
due
wes
t of i
nsta
llatio
n an
d st
arte
d to
dri
ft d
irec
tly to
war
ds it
. 10
min
utes
aft
er p
ower
had
bee
n lo
st e
ngin
e po
wer
was
reg
aine
d.
Tan
ker's
clo
sest
poi
nt to
inst
alla
tion
duri
ng th
is p
ower
loss
was
1.0
8 na
utic
al m
iles.
E
ngin
e Fa
ilure
4 W
hilst
pre
pari
ng fo
r ri
g m
ove
of ja
ck u
p dr
illin
g ri
g -
anch
or h
andl
ing
vess
el su
ffere
d to
tal l
oss o
f pow
er. V
esse
l sta
rted
dri
ftin
g an
d na
rrow
ly m
isse
d co
llidi
ng w
ith p
latf
orm
. T
otal
Pow
er L
oss
5
Supp
ly v
esse
l was
in a
pos
ition
at t
he st
ern
of th
e ri
g w
ith a
pot
able
wat
er h
ose
conn
ecte
d tr
ansf
erri
ng p
otab
le w
ater
and
off-
load
ing
cont
aine
rise
d de
ck c
argo
. Ves
sel w
as p
ositi
oned
on
a no
rthe
rly
head
ing
and
in a
ttem
ptin
g to
rep
ositi
on e
ncou
nter
ed m
anoe
uvri
ng
diffi
culti
es a
nd m
ade
cont
act w
ith r
ig's
No.
5 a
ncho
r w
ire
on p
ort a
ft si
de. R
ig w
as d
e-ba
llast
ed to
tran
sit d
raug
ht fo
r w
ire
insp
ectio
n.
Som
e st
rand
dam
age
was
evi
dent
on
No.
5 a
ncho
r w
ire.
Man
oeuv
ring
M
isju
dgem
ent
6
Shut
tle ta
nker
secu
red
to F
PSO
and
GP
S si
gnal
s wer
e po
or a
nd b
oth
DA
RP
S an
d D
GP
S w
ere
dese
lect
ed fr
om D
P c
onso
le. S
hutt
le
mai
ntai
ned
posi
tion
usin
g A
rtem
is o
nly
but t
his f
aile
d fo
r a
shor
t per
iod
and
DP
syst
em r
ever
ted
to 'm
odel
con
trol
'. D
ue to
soft
war
e pr
oble
m th
is c
ause
d sh
uttle
tank
er to
man
oeuv
re a
ster
n ca
usin
g m
oori
ng h
awse
r to
be
tens
ione
d. T
he o
ff-po
sitio
n al
arm
soun
ded
and
cont
rol o
f shu
ttle
est
ablis
hed
by u
sing
DG
PS
abso
lute
syst
em. T
his c
ause
d sh
uttle
to m
anoe
uvre
ahe
ad a
nd st
abili
se in
nor
mal
of
fload
ing
posi
tion.
D.P
. Con
trol
Fa
ilure
7 D
urin
g cr
ane
oper
atio
ns w
ith th
e su
pply
ves
sel a
1 to
nne
cont
aine
r w
as k
nock
ed o
ver
on th
e ve
ssel
dec
k du
e to
sudd
en v
esse
l m
ovem
ent.
Dur
ing
oper
atio
ns to
reg
ain
cont
rol t
he v
esse
l the
n m
oved
clo
se to
the
rise
r ac
cess
tow
er. W
ind
spee
d -
27 k
nots
. D
irec
tion
- 14
4 de
gree
s. W
ave
heig
ht -
3 m
etre
s. V
isibi
lity
- fin
e an
d cl
ear.
Man
oeuv
ring
M
isju
dgem
ent
8 E
ngin
e fa
ilure
of o
ne e
ngin
e on
stan
d by
ves
sel.
Wea
ther
con
ditio
ns 7
-8 m
etre
s sea
s 45
knot
win
ds. V
esse
l una
ble
to c
arry
out
stan
d by
dut
ies a
nd h
ad to
hol
d st
atio
n.
Eng
ine
Failu
re
9 B
eam
traw
ler
ente
red
500
met
res s
afet
y zo
ne w
hile
fish
ing.
P
ost/
Ope
ratio
n N
egle
cted
10
Ves
sel 6
nau
tical
mile
s aw
ay. C
oast
guar
d al
erte
d. H
elic
opte
r av
aila
ble
for
prec
autio
nary
dow
nman
ning
. Sup
ply
vess
el in
fiel
d pr
epar
ed to
take
und
erto
w.
-
11
Stan
dby
vess
el c
onta
cted
inst
alla
tion
cont
rol r
oom
and
info
rmed
them
that
a tr
awle
r ha
d no
eng
ine
pow
er a
nd w
as d
rift
ing
tow
ard
inst
alla
tion
and
curr
ent p
ositi
on w
as 2
mile
s fro
m n
orth
eas
t sid
e of
inst
alla
tion.
Win
d 14
5 de
gree
s, 2
5/30
kno
ts, 2
/3 m
etre
seas
, vi
sibi
lity
poor
in m
ist,
dow
n to
200
met
res i
n pl
aces
, clo
ud c
over
8 o
ktas
. Ano
ther
fish
ing
vess
el w
as o
n lo
catio
n bu
t una
ble
to o
ffer
any
assi
stan
ce. I
nsta
llatio
n O
IM w
as c
alle
d ou
t and
pla
tfor
m e
mer
genc
y pr
oced
ures
for
colli
sion
act
ivat
ed. S
tand
by
vess
el la
unch
ed
it's F
RC
and
the
crew
tran
sfer
red
a ha
ndlin
e fr
om a
ccom
pany
ing
vess
el to
the
drift
ing
vess
el so
that
a 3
" w
ire
tow
line
cou
ld b
e co
nnec
ted
betw
een
the
vess
els.
Acc
ompa
nyin
g ve
ssel
took
up
slack
on
wir
e to
w r
ope
and
vess
el w
as to
wed
pas
t on
inst
alla
tion'
s no
rth
face
at 7
50 m
etre
s,
Eng
ine
Failu
re
12
Inci
dent
occ
urre
d du
ring
nor
mal
cru
de o
il ex
port
tran
sfer
ope
ratio
ns b
etw
een
the
FSU
and
shut
tle ta
nker
. Shu
ttle
tank
er su
ffere
d lo
ss o
f pro
pelle
r pi
tch
cont
rol,
the
prop
elle
r fa
iling
to z
ero
pitc
h w
ith th
e re
sulta
nt lo
ss o
f thr
ust.
Shut
tle ta
nker
late
r re
-est
ablis
hed
pitc
h co
ntro
l and
initi
ated
a p
ump
shut
dow
n by
bre
akin
g th
e te
lem
etry
link
.
Thr
uste
r C
ontr
ol
Failu
re
107

Con
sec.
N
o.
'Nea
r M
iss'
Info
rmat
ion
Sour
ce
Dat
e (d
d/m
m/y
r)
Tim
e Y
ear
Mon
th
Loca
tion
Inst
alla
tion
Typ
e V
esse
l Typ
e Se
a C
ondi
tion
13
No
HSE
03
/01/
99
15:5
8 19
99
Janu
ary
Nor
ther
n Fi
xed
Stee
l St
and
By
-
14
No
HSE
29
/04/
99
05:3
0 19
99
Apr
il C
entr
al
Fixe
d St
eel
Div
er S
uppo
rt
-
15
Yes
H
SE
16/0
5/99
06
:40
1999
M
ay
Sout
hern
Fi
xed
Stee
l T
anke
r -
16
Yes
H
SE
25/0
6/99
20
:32
1999
Ju
ne
Cen
tral
Fi
xed
Stee
l Su
pply
-
17
No
HSE
18
/08/
99
19:1
4 19
99
Aug
ust
Cen
tral
Fl
oatin
g P
rodu
ctio
n Su
pply
-
18
No
HSE
27
/08/
99
03:3
0 19
99
Aug
ust
Sout
hern
Fi
xed
Stee
l D
iver
Sup
port
-
19
Yes
H
SE
02/0
9/99
01
:50
1999
Se
ptem
ber
Sout
hern
Fi
xed
Stee
l -
-
20
No
HSE
17
/09/
99
21:2
0 19
99
Sept
embe
r W
est o
f Sh
etla
nds
Floa
ting
Pro
duct
ion,
Sto
rage
&
Offl
oadi
ng
Tan
ker
2.6
21
Yes
H
SE
26/1
0/99
14
:00
1999
O
ctob
er
Mor
ecam
be
Bay
Ja
ck-U
p Fi
shin
g -
108

Con
sec.
N
o.
Ope
ratin
g C
ircu
mst
ance
s Pr
imar
y C
ause
Oth
er S
ourc
e C
onfir
ms
13
Inst
alla
tion'
s sta
ndby
ves
sel w
as o
bser
ved
from
the
plat
form
not
dis
play
ing
any
navi
gatio
nal l
ight
s. T
he p
latf
orm
was
adv
ised
that
the
stan
dby
vess
el h
ad lo
st a
ll po
wer
and
was
dri
ftin
g to
war
ds th
e pl
atfo
rm. T
he O
IM in
itiat
ed e
mer
genc
y pr
oced
ures
onb
oard
the
plat
form
and
not
ified
HM
Coa
stgu
ard.
A n
earb
y in
stal
latio
n's s
tand
by v
esse
l tra
nsfe
rred
to th
e sc
ene
and
atte
nded
the
drift
ing
vess
el.
Ves
sel d
rift
ed n
orth
of t
he in
stal
latio
n an
d la
ter
repo
rted
that
all
pow
er a
nd m
ain
engi
nes h
ad b
een
rest
ored
. Dri
ftin
g ve
ssel
rep
orte
d th
at th
e lo
ss o
f pow
er w
as d
ue to
a g
ener
ator
trip
ping
cau
sing
all
load
to b
e tr
ansf
erre
d to
ano
ther
gen
erat
or w
hich
then
shut
dow
n du
e to
ove
rloa
d ca
usin
g to
tal l
oss o
f ele
ctri
cal a
nd c
onse
quen
tial l
oss o
f mai
n en
gine
s.
Tot
al P
ower
Los
s
14
Whi
lst m
ovin
g th
e ve
ssel
from
the
sout
hern
side
to th
e ea
ster
n si
de o
f the
pla
tfor
m th
ere
was
a fa
ilure
of t
he sh
ip's
star
boar
d 'ta
ut
wir
e bo
om' c
ausi
ng th
e ve
ssel
to sw
ing
star
boar
d. A
t the
tim
e th
e ve
ssel
was
eng
aged
in R
OV
wor
k at
pla
tfor
m.
D.P
. Con
trol
Fa
ilure
15
Oil
tank
er w
as o
n a
colli
sion
cou
rse
with
inst
alla
tion.
All
radi
o ca
lls w
ent u
nhee
ded
and
10 p
erso
ns e
vacu
ated
from
the
inst
alla
tion.
W
hen
the
tank
er c
hang
ed c
ours
e di
stan
ce fr
om in
stal
latio
n w
as h
alf a
mile
. P
ost/
Ope
ratio
n N
egle
cted
16
Stan
dby
vess
el r
epor
ted
that
a su
pply
ves
sel w
as h
eadi
ng to
war
ds th
e pl
atfo
rm o
n a
poss
ible
col
lisio
n co
urse
and
they
had
bee
n un
able
to
con
tact
the
vess
el. P
latf
orm
GP
A a
nd m
uste
r in
itiat
ed a
nd e
mer
genc
y re
spon
se p
lan
impl
emen
ted.
Con
tact
was
est
ablis
hed
appr
ox
20 m
inut
es b
efor
e th
e cl
oses
t poi
nt o
f app
roac
h an
d th
e ve
ssel
alte
red
cour
se.
Pos
t/O
pera
tion
Neg
lect
ed
17
Supp
ly v
esse
l was
wor
king
car
go a
t an
inst
alla
tion
whe
n an
ala
rm so
unde
d on
the
brid
ge. C
ontr
ol o
f the
ves
sel's
por
t mai
n en
gine
(P
ME
) was
lost
and
ves
sel's
Mas
ter
took
man
ual c
ontr
ol o
f the
ves
sel a
nd c
omm
unic
ated
with
the
Chi
ef E
ngin
eer.
A fu
rthe
r al
arm
on
the
joys
tick
desk
indi
catin
g a
thru
ster
failu
re a
nd th
e M
aste
r m
ade
the
deci
sion
to p
ull c
lear
of t
he in
stal
latio
n. T
he p
latf
orm
dec
k cr
ew w
as w
arne
d by
the
vess
el to
stan
d cl
ear
of th
e po
tabl
e w
ater
hos
e th
at su
bseq
uent
ly p
arte
d. T
he v
esse
l cle
ared
the
inst
alla
tion
to
outs
ide
the
500
met
res z
one
to e
ffect
rep
airs
.
Eng
ine
Con
trol
Fa
ilure
18
RO
V su
ppor
t ves
sel w
as u
sing
pla
tfor
m a
s way
mar
k on
aut
o pi
lot.
Aut
o pi
lot n
ot sw
itche
d of
f unt
il ve
ssel
10
to 6
0 m
etre
s fro
m
inst
alla
tion.
P
ost/
Ope
ratio
n N
egle
cted
19
Hav
ing
faile
d to
mak
e co
ntac
t with
an
appr
oach
ing
vess
el, t
he st
andb
y ve
ssel
laun
ched
the
thei
r fa
st r
escu
e bo
at. T
he F
RC
cam
e al
ongs
ide
the
appr
oach
ing
vess
el.
Pos
t/O
pera
tion
Neg
lect
ed
App
endi
x E
(s
ee C
onse
c.
No.
45)
20
Aft
er a
n oi
l exp
ort t
he sh
uttle
tank
er a
nd F
PSO
ass
umed
fixe
d he
adin
gs c
lose
to th
eir
wea
ther
van
ing
head
ings
and
beg
an
disc
onne
ctio
n op
erat
ion.
Dur
ing
disc
onne
ctio
n th
e E
SD2
auto
mat
ic d
isco
nnec
t fac
ility
was
inhi
bite
d w
hile
cre
w r
econ
nect
ed
mes
seng
er li
nes a
nd p
aid
thes
e ou
t. D
urin
g re
cove
ry o
f oil
expo
rt h
ose
FPSO
exp
erie
nced
red
uctio
n in
ele
ctri
cal p
ower
ava
ilabi
lity;
th
rust
ers a
utom
atic
ally
trip
ped
and
pow
er to
oil
expo
rt h
ose
reel
red
uced
incr
easi
ng ti
me
take
n to
rec
over
hos
e. W
hilst
haw
ser
and
mes
seng
ers w
ere
bein
g re
cove
red,
FP
SO h
eadi
ng c
hang
ed r
apid
ly: 5
5 de
gree
s in
abou
t 2 m
inut
es. S
hutt
le ta
nker
Mas
ter
took
man
ual
cont
rol o
f tan
ker
and
man
oeuv
red
it, u
sing
min
imum
pow
er, t
o sa
fe p
ositi
on e
ndin
g di
scon
nect
ope
ratio
n w
ith sh
ip st
oppe
d 10
- 3
0 m
etre
s aw
ay fr
om F
PSO
at 9
0 de
gree
s diff
eren
ce in
hea
ding
. Win
d SE
, for
ce 3
-4. S
light
/mod
sea
stat
e. S
ea/s
wel
l Ht s
ig 2
.6 m
etre
s,
max
4.6
met
res,
per
iod
8 se
cs. S
wel
l pre
dom
wes
terl
y.
Pow
er F
ailu
re
21
Fish
ing
boat
infr
inge
d th
e in
stal
latio
n's s
afet
y zo
ne w
hen
it ca
me
as c
lose
as 4
0 m
etre
s fro
m th
e SW
cor
ner
of th
e in
stal
latio
n.
Inst
alla
tion
was
eva
cuat
ed b
ut th
e ve
ssel
cou
ld n
ot b
e ra
ised
on
the
radi
o by
the
stan
dby
vess
el.
Pos
t/O
pera
tion
Neg
lect
ed
109

Con
sec.
N
o.
'Nea
r M
iss'
Info
rmat
ion
Sour
ce
Dat
e (d
d/m
m/y
r)
Tim
e Y
ear
Mon
th
Loca
tion
Inst
alla
tion
Typ
e V
esse
l Typ
e Se
a C
ondi
tion
22
No
HSE
28
/11/
99
17:5
2 19
99
Nov
embe
r N
orth
ern
Floa
ting
Pro
duct
ion,
Sto
rage
&
Offl
oadi
ng
Tan
ker
-
23
Yes
H
SE
04/0
1/00
15
:00
2000
Ja
nuar
y So
uthe
rn
Fixe
d St
eel
Bar
ge
-
24
Yes
H
SE
09/0
1/00
22
:00
2000
Ja
nuar
y So
uthe
rn
Fixe
d St
eel
--
25
No
HSE
23
/06/
00
10:0
5 20
00
June
C
entr
al
Fixe
d St
eel
Res
earc
h -
26
Yes
H
SE
05/0
9/00
10
:45
2000
Se
ptem
ber
--
Bar
ge
-
27
Yes
H
SE
15/0
7/01
11
:55
2001
Ju
ly
Sout
hern
Fi
xed
Stee
l -
-
28
Yes
H
SE
15/1
0/01
08
:50
2001
O
ctob
er
-Se
mi-
Subm
ersi
ble
Dri
lling
Fi
shin
g -
110

Con
sec.
N
o.
Ope
ratin
g C
ircu
mst
ance
s Pr
imar
y C
ause
Oth
er S
ourc
e C
onfir
ms
22
Shut
tle ta
nker
was
mak
ing
its a
ppro
ach
in p
repa
ratio
n fo
r ca
rgo
offlo
adin
g. A
t a d
ista
nce
of a
ppro
xim
atel
y 20
0 m
etre
s shu
ttle
tank
er
expe
rien
ced
failu
re o
f mai
n pr
opel
lor
pitc
h co
ntro
l. T
his i
nitia
ted
a se
quen
ce o
f eve
nts w
hich
res
ulte
d in
a 1
00%
ahe
ad p
itch
dem
and
from
the
DP
syst
em. T
he v
esse
l sta
rted
to m
ove
ahea
d an
d m
anua
l con
trol
was
sele
cted
. The
ves
sel w
as st
eere
d to
star
boar
d an
d ar
rest
ed 1
20 m
etre
s fro
m th
e FP
SO's
ster
n at
app
roxi
mat
ely
90 d
egre
es.
D.P
. Com
pute
r Fa
ilure
23
A la
rge
obje
ct w
as si
ghte
d on
a p
oten
tial c
ollis
ion
cour
se w
ith p
latf
orm
. Inv
estig
atio
n fo
und
obje
ct to
be
an R
AF
targ
et p
onto
on
19m
x 4
m x
2.5
m (2
0 to
nnes
). P
onto
on ta
ken
in to
w b
y st
andb
y ve
ssel
unt
il sa
lvag
e ve
ssel
took
con
trol
. P
ost/
Ope
ratio
n N
egle
cted
24
Dri
lling
rig
was
mov
ing
from
the
NW
bel
l loc
atio
n to
the
stan
doff
loca
tion.
Whe
n it
beca
me
free
at t
he N
W b
ell l
ocat
ion,
it
unex
pect
edly
mov
ed to
war
ds th
e w
ellh
ead.
The
foot
prin
t of t
he ja
ck-u
p po
rt le
g ov
erla
pped
the
foot
prin
t of t
he p
rote
ctio
n fr
ame
on th
e w
ellh
ead.
Wel
l and
pip
elin
e w
ere
shut
in a
nd d
epre
ssur
ised
. -
25
Res
earc
h ve
ssel
suffe
red
a lo
ss o
f ste
erin
g w
hilst
insi
de th
e pl
atfo
rm 5
00 m
etre
s zon
e. T
he v
esse
l pul
led
away
und
er r
ever
se p
ower
an
d us
ing
rem
ote
stee
ring
. Clo
sest
app
roac
h to
the
plat
form
was
150
met
res.
St
eeri
ng F
ailu
re
26
An
800
feet
dum
b ba
rge
bein
g to
wed
by
two
tugs
cam
e in
to c
onta
ct w
ith th
e di
ve st
atio
n an
d de
tach
ed it
from
its m
oori
ngs w
hile
a
dive
r w
as o
pera
ting
insi
de c
ell 1
att
ache
d to
the
dive
stat
ion
by a
n um
bilic
al li
ne.T
he d
iver
was
not
inju
red
but w
as im
med
iate
ly
rem
oved
from
the
wat
er a
nd d
ivin
g op
erat
ions
susp
ende
d.
-
27
Flot
el w
as a
t the
stan
d of
f pos
ition
and
was
also
ret
riev
ing
two
of th
e la
st fo
ur a
ncho
rs. A
n un
expe
cted
squa
ll ca
me
thro
ugh
the
area
fr
om a
dir
ectio
n of
200
deg
rees
cau
sing
the
flote
l to
pivo
t in
a di
rect
ion
tow
ards
the
inst
alla
iton.
With
the
back
up r
esou
rces
at h
and,
e.
g. th
e ve
ssel
's pr
opul
sion
and
the
four
anc
hor
hand
ling
vess
els,
the
flote
l was
bro
ught
bac
k un
der
full
cont
rol i
n a
timel
y m
anne
r.
The
air
gap
bet
wee
n th
e flo
tela
nd th
e in
stal
latio
n w
as r
educ
ed. D
urin
g th
is si
tuat
ion
the
inst
alla
tion'
s OIM
was
info
rmed
and
they
de
cide
d to
go
into
ale
rt a
nd sh
utdo
wn
thei
r pl
atfo
rm.
Wea
ther
C
ondi
tions
28
Stan
dby
vess
el r
epor
ted
unid
entif
ied
vess
el a
ppro
achi
ng th
e ri
g, sp
eed
6-8
knot
s, C
PA
0.2
nau
tical
mile
s. W
eath
er w
as th
ick
fog
with
so
uth
east
erly
x 3
0 kn
ot w
ind.
Rig
was
moo
red
to 8
anc
hors
and
dri
lling
12
1/4"
hol
e w
ith w
ater
bas
ed m
ud. U
nide
ntifi
ed v
esse
l ha
d pa
ssed
with
in 0
.5 n
autic
al m
iles o
f nea
rby
inst
alla
tion
and
her
stan
dby
vess
el h
ad b
een
unab
le to
rai
se v
esse
l on
VH
F or
see
it fo
r id
entif
icat
ion.
Sta
ndby
ves
sel
trie
d un
succ
essf
ully
to c
onta
ct o
n V
HF.
Dri
lling
ope
ratio
ns w
ere
susp
ende
d an
d an
chor
win
ches
all
clut
ched
out
in p
repa
ratio
n to
mov
e of
f loc
atio
n. A
berd
een
Coa
stgu
ard
info
rmed
that
app
raoc
hing
ves
sel w
as 1
.8 n
autic
al m
iles f
rom
th
e ri
g C
PA
0.1
2 na
utic
al m
iles.
OIM
inst
ruct
ed st
andb
y ve
ssel
to fi
re fl
ares
acr
oss a
ppra
ochi
ng v
esse
l's b
ow to
war
n ve
ssel
. Aba
ndon
ri
g al
arm
soun
ded.
Mus
ter
at a
ft b
oats
. Men
pos
ition
ed p
ort f
wd.
col
umn
with
flar
es. R
adio
con
tact
est
ablis
hed
and
all h
ands
stoo
d do
wn.
Pos
t/O
pera
tion
Neg
lect
ed
App
endi
x F
(see
Con
sec.
N
o. 1
98)
111

App
endi
x E
Safe
ty Z
one
Infr
inge
men
t Li
st
112

1 2 3 4 5 6 7 8 9 10 11 12 13 14 15 16 17 18 19 20 21 22
Con
sec.
N
o.
Dat
e T
ime
Win
d Sp
eed
Win
d D
irec
tion
Sea
Hei
ght
Sea
Con
ditio
n T
ide
Rat
e T
ide
Dir
ectio
n W
eath
er
Visi
bilit
y N
autic
al
Tw
iligh
t V
esse
l C
ours
e V
esse
l Sp
eed
CPA
H
ow
Mea
sure
d In
trud
er
Typ
e
29/1
2/95
08
17
12
230
0.9
Cal
m
0.4
227
Part
ly C
loud
y >
10
17:0
8 12
0 2.
3 39
0m
Rad
ar
Fish
ing
16/0
1/96
23
20
14-1
6 18
0 1.
5 C
alm
-
-R
ain/
Mist
Pat
ches
2-
3 16
:00
160
-50
m
Visu
al
Fish
ing
08/0
2/96
00
00
5 06
5 1.
5-2
Mod
erat
e 1.
5 16
4 O
verc
ast
3-4
07:2
2 33
5 11
.0
370m
R
adar
Fi
shin
g
21/0
3/96
08
45
15
090
3.0
Mod
erat
e 1.
7 16
1 O
verc
ast/
Dri
zzle
0.
5 06
:00
Stat
iona
ry
0.0
410m
R
adar
Fi
shin
g
31/0
3/96
15
01
15
315
1.5
Mod
erat
e 1.
5 15
3 -
8 -
330
0.5
370m
R
adar
Fi
shin
g
13/0
4/96
19
00
10-1
5 09
0 1.
0 Sl
ight
1.
1 33
7 C
lear
6-
8 -
325
10.0
18
5m
Rad
ar
Gen
eral
C
argo
25/0
4/96
20
55
26
253
2.5-
3 M
oder
ate
--
Cle
ar
8 -
Stat
iona
ry
0.0
0 R
adar
Fi
shin
g
30/0
4/96
17
25
Lt A
irs
Var
iabl
e 1.
0 C
alm
1.
1 13
9 O
verc
ast/
Haz
y 3-
4 18
:52
135
8.0
40m
V
isual
Fi
shin
g
27/0
5/96
16
30
16
330
1.7-
2.5
Mod
erat
e -
-Pa
rtly
Clo
udy
>20
-
170
6.0
0 R
adar
Fi
shin
g
04/0
8/96
14
25
12
195
<1
Cal
m
--
Fine
>
12
-13
5 -
300m
R
adar
Fi
shin
g
27/0
8/96
21
44
--
--
--
--
-St
atio
nary
0.
0 40
0m
Rad
ar
Fish
ing
23/0
9/96
11
00
25
180
1.0
Cal
m
--
Cle
ar
10
-St
atio
nary
0.
0 0
Rad
ar
Fish
ing
25/0
9/96
07
06
15
168
1.0
Mod
erat
e 0.
2 14
7 C
lear
/Mod
erat
e 3
Full
Day
light
14
5 11
.0
450m
R
adar
Fi
shin
g
20/1
1/96
10
25
30
000
3-4
Mod
erat
e 0.
3 28
5 O
verc
ast/
Snow
Sho
wer
s 8
Day
light
01
2 3.
0 47
5m
Rad
ar
Fish
ing
21/1
1/96
16
15
8-10
32
0 1.
0 M
oder
ate
--
Cle
ar
10
-02
0 3.
0 0
Rad
ar
Fish
ing
20/1
2/96
09
30
15-1
8 12
0 2.
0 M
oder
ate
0.5
190
Part
ly C
loud
y/C
lear
8-
10
-15
0 8.
0 25
0m
Visu
al
Fish
ing
26/1
2/96
10
05
10
170
1.0
Cal
m
0.5
167
Part
ly C
loud
y >
10
-St
atio
nary
0.
0 10
0m
Visu
al
Der
rick
B
arge
06/0
3/97
19
49
39
186
3.5
Mod
erat
e -
-Pa
rtly
Clo
udy
10
-02
0 2.
0 10
0m
Visu
al
Stan
d B
y
10/0
3/97
06
15
25
190
3-4
Mod
erat
e 2.
0 01
0 C
loud
y/D
rizz
le
5-6
06:0
0 St
atio
nary
0.
0 0
Visu
al
Fish
ing
25/0
3/97
20
50
20
240
2.0
Mod
erat
e 1.
4 09
7 C
loud
y 12
-
184
8.5
600m
R
adar
G
ener
al
Car
go
30/0
4/97
10
00
13
213
0.5
Cal
m
0.3
000
Fine
/Cle
ar
>10
-
290
11.0
45
0m
Rad
ar
Fish
ing
08/0
5/97
16
55
13
270
1.0
Mod
erat
e 0.
9 27
3 C
loud
y/Fi
ne/C
lear
12
-
Stat
iona
ry
0.0
740m
R
adar
Sa
il T
rain
ing
113

Con
sec.
N
o.
Dat
e T
ime
Win
d Sp
eed
Win
d D
irec
tion
Sea
Hei
ght
Sea
Con
ditio
n T
ide
Rat
e T
ide
Dir
ectio
n W
eath
er
Visi
bilit
y N
autic
al
Tw
iligh
t V
esse
l C
ours
e V
esse
l Sp
eed
CPA
H
ow
Mea
sure
d In
trud
er
Typ
e
23
14/0
6/97
06
30
Lt A
irs
Var
iabl
e 2.
3 C
alm
-
-M
ist/F
og P
atch
es
0.6-
0.8
-V
ario
us
Var
ious
50
0m
-Fi
shin
g
24
26/0
7/97
06
25
14
200
1.5
Slig
ht
1.0
270
Clo
udy/
Fine
>
12
02:2
9 00
0 1.
0 17
0m
Rad
ar
Fish
ing
25
25/0
8/97
14
06
2 27
0 0.
1 Sl
ight
1.
2 09
6 C
loud
y/Fi
ne/C
lear
>
10
-St
atio
nary
0.
0 50
0m
Rad
ar
Fish
ing
26
05/0
9/97
11
50
20
235
1.5
Mod
erat
e 0.
2 04
0 C
loud
y >
10
04:3
2 24
5 1.
0 30
m
Visu
al
Fish
ing
27
11/0
9/97
13
37
20
270
3.0
Con
fuse
d 0.
2 05
2 C
loud
y 8
-00
9 3.
5 42
5m
Rad
ar
Fish
ing
28
21/1
0/97
08
38
15-2
0 06
8 2.
0 M
oder
ate
1.3
329
Scat
tere
d C
loud
>
10
17:3
0 15
0 10
.0
100m
V
isual
Fi
shin
g
29
23/1
0/97
12
02
15
010
1.5
Mod
erat
e 1.
0 12
7 C
loud
y 10
18
:02
122
11.4
27
7m
Rad
ar
Fish
ing
30
23/1
0/97
13
27
15
300
1.5
Cal
m
1.5
146
Part
ly C
loud
y >
10
18:1
5 12
5 5.
0 31
0m
Rad
ar
Fish
ing
31
23/1
1/97
00
10
7-10
11
3 1.
0 M
oder
ate
0.8
128
Cle
ar
10
16:3
0 V
ario
us
-10
0m
Rad
ar
Fish
ing
32
17/0
3/98
08
00
18
248
2.0
Low
0.
4 00
2 Li
ght C
loud
/Cle
ar
>10
04
:43
Stat
iona
ry
0.0
0 R
adar
Fi
shin
g
33
24/0
3/98
19
15
15-2
0 24
0 4.
5-5
Mod
erat
e 1.
0 16
0 O
verc
ast/
Fine
10
-12
19:1
5 27
0 9.
0 0
Rad
ar
Fish
ing
34
04/0
4/98
07
25
16
120
1-1.
5 M
oder
ate
1.1
273
Rai
n/D
rizz
le
4 04
:03
008
-32
0m
Rad
ar
Fish
ing
35
19/0
6/98
02
30
22
270
3.5
Mod
erat
e 0.
3 05
2 C
lear
>
10
-09
0 0.
8 35
0m
Rad
ar
Fish
ing
36
23/0
8/98
13
20
9 01
0 2.
5 G
ood
0.3
190
Rai
n Sh
ower
s >
10
-St
atio
nary
0.
0 0
Rad
ar
Fish
ing
37
11/1
2/98
14
15
18
168
2.0
Goo
d 0.
1 02
7 O
verc
ast/
Rai
n Sh
ower
s 8
-St
atio
nary
0.
0 0
Rad
ar
Fish
ing
38
25/0
1/99
22
15
40
250
4.0
Rou
gh
0.5
308
Clo
udy
8 14
:50
090
10.0
30
m
Rad
ar
Supp
ly
39
18/0
2/99
15
50
12-1
5 27
0 1.
5 M
oder
ate
1.5
182
Clo
ud
-18
:07
255
13.6
43
5m
Rad
ar
Gen
eral
C
argo
40
18/0
2/99
16
05
12-1
5 27
0 1.
5 M
oder
ate
1.5
182
Clo
ud
-18
:07
255
13.6
37
0m
Rad
ar
Gen
eral
C
argo
41
17/0
5/99
19
00
10
110
1.0
Cal
m
0.7
000
Fine
/Cle
ar
10
-07
0 9.
5 20
0m
Rad
ar
Fish
ing
42
19/0
6/99
09
30
15
250
1.5
Slig
ht
0.0
000
Fine
/Cle
ar
>10
-
Stat
iona
ry
0.0
0 V
isual
Fi
shin
g
43
16/0
7/99
04
40
6 23
0 1.
0 M
oder
ate
0.6
310
Clo
udy/
Ove
rcas
t/D
ull
10
-11
5 6.
5 40
0m
Rad
ar
-
44
06/0
8/99
09
15
11
035
1.5
Cal
m
--
Scat
tere
d C
loud
s 10
08
:50
306
10.0
40
0m
Rad
ar
Div
er
Supp
ort
114

Con
sec.
N
o.
Dat
e T
ime
Win
d Sp
eed
Win
d D
irec
tion
Sea
Hei
ght
Sea
Con
ditio
n T
ide
Rat
e T
ide
Dir
ectio
n W
eath
er
Visi
bilit
y N
autic
al
Tw
iligh
t V
esse
l C
ours
e V
esse
l Sp
eed
CPA
H
ow
Mea
sure
d In
trud
er
Typ
e
45
02/0
9/99
01
50
8 24
0 0.
5 Sl
ight
1.
9 00
0 C
lear
6
05:2
8 06
5 9.
2 50
m
Visu
al
Fish
ing
46
06/0
9/99
20
17
Lt A
irs
Var
iabl
e Sl
ight
C
alm
1.
1 35
2 Po
or V
isibi
lity
4-5
04:3
7 23
6 9.
0 18
5m
Rad
ar
Fish
ing
47
13/0
9/99
19
51
5 V
aria
ble
1.0
Slig
ht
0.7
000
Clo
udy/
Fine
/Cle
ar
10
19:0
0 03
6 8.
2 21
1m
Rad
ar
Fish
ing
48
05/1
0/99
18
15
12
340
2.0
-0.
2 11
6 Fe
w C
loud
s/D
ry/C
lear
20
-
Stat
iona
ry
0.0
182m
R
adar
Fi
shin
g
49
06/1
0/99
13
43
10
200
1.0
Cal
m
0.5
040
Clo
ud
>12
18
:13
150
5.0
0 R
adar
Fi
shin
g
50
18/1
0/99
07
30
10
060
1.5
Slig
ht
0.2
250
Part
ly C
loud
y 10
-
-4.
5 48
1m
Rad
ar
Fish
ing
51
27/1
0/99
23
13
28-3
0 20
0 2.
5 R
ough
1.
9 00
0 C
lear
6-
8 -
100
10.7
45
0m
Rad
ar
Bul
k C
arri
er
52
13/1
1/99
12
10
13
-0.
5 M
oder
ate
1.0
171
Clo
udy
6 17
:28
350
4.0
300m
R
adar
Fi
shin
g
53
29/0
1/00
16
37
55-6
0 27
0 10
.0
Mou
ntai
nous
0.
2 15
0 O
verc
ast/
Show
ers
1.5
17:5
3 13
5 -
460m
R
adar
T
anke
r
54
04/0
2/00
05
30
-24
8 4-
5 -
--
Dri
zzle
2-
3 -
--
0 -
-
55
24/0
2/00
06
25
24
283
2.1
Mod
erat
e -
-Pa
rtly
Clo
udy
12
06:3
0 St
atio
nary
0.
0 40
0m
Visu
al
Div
er
Supp
ort
115

App
endi
x F
ERRV
A W
arni
ng O
ff R
epor
ts
116

Con
sec.
N
o.
Dat
e T
ime
of
Firs
t D
etec
tion
Win
d Sp
eed
(kno
ts)
Win
d D
irec
tion
Sea
Wav
e H
eigh
t (m
)
Sea
Dir
ectio
n
Swel
l H
eigh
t (m
)
Swel
l D
irec
tion
Intr
uder
Typ
e In
trud
er
Des
tinat
ion
Firs
t Det
ectio
n R
ange
(mile
s)
Firs
t D
etec
tion
Bea
ring
Se
ctor
Es
timat
ed
Cou
rse
Estim
ated
Sp
eed
(kno
ts)
CPA
to
Inst
alla
tion
(mile
s)
Ran
ge
(mile
s)
Rem
arks
1 17
/04/
01
09:1
5 15
29
2 1
292
2.5
292
Gen
eral
car
go
Aal
borg
6
280
Nor
ther
n 10
9 14
.3
0.5
6 -
2 20
/04/
01
16:2
5 7
000
1 00
0 1.
5 00
0 Fi
shin
g B
rem
erha
ven
--
Nor
ther
n 11
0 13
.4
1.5
8 -
3 21
/04/
01
22:0
0 30
18
0 1
180
2 18
0 Fi
shin
g Fi
shin
g G
roun
ds
6 34
4 N
orth
ern
164
7.4
0.1
6 -
4 22
/04/
01
20:0
0 22
15
7 1
157
1.5
157
Fish
ing
Fish
ing
Gro
unds
-
-N
orth
ern
340
2.2
0.5
4 -
5 23
/04/
01
22:0
0 10
11
2 0.
5 11
2 1
158
Fish
ing
Fish
ing
Gro
unds
-
-N
orth
ern
340
2.2
-4
-
6 13
/05/
01
15:0
0 10
02
2 1.
5 00
0 1
000
Gen
eral
car
go
Unk
now
n 8
090
Nor
ther
n 27
1 10
.7
0.48
6
-
7 16
/05/
01
08:3
0 10
27
0 0.
5 33
8 0.
5 31
5 U
nkno
wn
Irel
and
6 09
0 N
orth
ern
273
10.4
1
6 -
8 27
/05/
01
10:0
0 10
20
0 1
200
1 20
0 Sp
ecia
lised
car
rier
D
enm
ark
--
Nor
ther
n 10
6 13
1
8 -
9 27
/05/
01
11:3
0 10
22
5 1
000
0.5
000
Gen
eral
car
go
--
-N
orth
ern
095
13
1 6
-
10
28/0
5/01
04
:00
20
225
0.5
225
0.5
225
Fish
ing
Fish
ing
Gro
unds
-
-N
orth
ern
038
8 0.
2 6
-
11
28/0
5/01
21
:45
15
202
1 20
2 1
202
Fish
ing
Cla
ymor
e -
-N
orth
ern
047
7 0.
5 6
-
12
29/0
5/01
08
:00
27
247
3.5
225
4 22
5 G
ener
al c
argo
-
6 27
0 N
orth
ern
088
8.5
0.8
6 -
13
29/0
5/01
12
:20
20
315
3 27
0 -
-G
ener
al c
argo
A
berd
een
--
Nor
ther
n 22
0 8.
3 0.
3 8
-
14
29/0
5/01
22
:30
17
280
1 28
0 1
280
Fish
ing
Cla
ymor
e -
-N
orth
ern
010
8 0.
5 6
-
15
01/0
6/01
16
:00
22
225
1 22
5 1.
5 22
5 O
ffsho
re su
pply
Fr
igg
Fiel
d -
-N
orth
ern
037
12.8
0.
5 7.
5 -
16
02/0
6/01
07
:45
35
315
1.5
315
2.5
315
Fish
ing
Faro
es
--
Nor
ther
n 31
8 8
0.5
7 -
17
02/0
6/01
09
:30
30
338
5 00
0 -
338
Gen
eral
car
go
Lond
onde
rry
--
Nor
ther
n 28
8 5.
5 0.
3 6
-
18
02/0
6/01
13
:00
30
340
4.5
340
4.5
340
Fish
ing
Fras
erbu
rgh
--
Nor
ther
n 24
0 7.
5 0
7 -
19
02/0
6/01
13
:15
35
338
4 -
--
Stan
d B
y A
berd
een
--
Nor
ther
n 21
0 10
.4
0.1
8 -
20
04/0
6/01
06
:00
24
270
1 27
0 1.
5 24
8 Fi
shin
g Fi
shin
g G
roun
ds
--
Nor
ther
n 05
4 8.
9 0.
4 7
-
21
04/0
6/01
16
:30
20
270
1 27
0 2
270
Gen
eral
car
go
--
-N
orth
ern
272
7 0.
2 6
-
22
05/0
6/01
18
:15
2 99
9 0.
5 27
0 0.
5 27
0 Fi
shin
g -
--
Nor
ther
n 03
7 10
.2
0.2
11
-
23
05/0
6/01
23
:00
12
202
--
--
Unk
now
n -
--
Nor
ther
n 27
1 10
0.
25
6 -
24
05/0
6/01
-
14
230
1 23
0 0
-G
ener
al c
argo
D
enm
ark
--
Nor
ther
n 08
8 8.
6 0.
1 12
-
25
06/0
6/01
00
:50
10
270
0.5
270
1 27
0 G
ener
al c
argo
Pe
ntla
nd F
irth
-
-N
orth
ern
276
10
0.5
8 -
26
06/0
6/01
18
:30
2 99
9 0.
25
270
0.25
27
0 Fi
shin
g -
--
Nor
ther
n 22
1 9.
4 0.
2 7
-
27
08/0
6/01
15
:15
20
315
1 31
5 2
315
Gen
eral
car
go
--
-N
orth
ern
099
12
0.5
10
-
28
09/0
6/01
19
:05
2 99
9 0
-1
315
Gen
eral
car
go
Pol
and
--
Nor
ther
n 11
0 12
.4
0.2
10.2
-
29
10/0
6/01
17
:00
2 99
9 0
-1
315
Gen
eral
car
go
Tal
in
--
Nor
ther
n 10
0 11
.3
0.25
8
-
30
11/0
6/01
04
:15
15
225
0.5
225
1 22
5 T
ug
Tar
tan
A
--
Nor
ther
n 28
8 5.
2 0.
2 6
-
31
12/0
6/01
08
:15
2 99
9 1
000
1 00
0 Fi
shin
g Pe
terh
ead
--
Nor
ther
n 21
9 9
0.5
6 -
32
14/0
6/01
18
:35
2 99
9 0
-1
315
Fish
ing
Fras
erbu
rgh
--
Nor
ther
n 21
7 8.
5 0.
5 7
-
117

Con
sec.
N
o.
Dat
e T
ime
of
Firs
t D
etec
tion
Win
d Sp
eed
(kno
ts)
Win
d D
irec
tion
Sea
Wav
e H
eigh
t (m
)
Sea
Dir
ectio
n
Swel
l H
eigh
t (m
)
Swel
l D
irec
tion
Intr
uder
Typ
e In
trud
er
Des
tinat
ion
Firs
t Det
ectio
n R
ange
(mile
s)
Firs
t D
etec
tion
Bea
ring
Se
ctor
Es
timat
ed
Cou
rse
Estim
ated
Sp
eed
(kno
ts)
CPA
to
Inst
alla
tion
(mile
s)
Ran
ge
(mile
s)
Rem
arks
33
16/0
6/01
01
:00
10
000
0.5
000
1 00
0 G
ener
al c
argo
Li
verp
ool
--
Nor
ther
n 27
5 11
0.
3 10
-
34
18/0
6/01
06
:00
24
338
1 33
8 2
000
Fish
ing
Fish
ing
Gro
unds
-
-N
orth
ern
032
9.1
0.2
6 -
35
19/0
6/01
19
:30
30
169
1.5
169
2 16
9 Y
acht
-
--
Nor
ther
n 21
7 7.
2 0.
3 6
-
36
20/0
6/01
12
:45
37
270
6 27
0 6
270
Fish
ing
Fish
ing
Gro
unds
-
-N
orth
ern
045
8 -
6 -
37
26/0
6/01
16
:30
15
124
1 12
4 1
-Fi
shin
g -
--
Sout
hern
30
3 5.
8 0.
15
8 -
38
30/0
6/01
02
:30
16
203
2 -
--
Fish
ing
Fish
ing
Gro
unds
5
270
Nor
ther
n 09
0 3.
5 0
6 -
39
01/0
7/01
01
:00
10
315
1 -
--
Fish
ing
Fish
ing
Gro
unds
5
280
Nor
ther
n 10
0 4
0 6
-
40
02/0
7/01
05
:00
10
999
1.5
--
-Fi
shin
g Fi
shin
g G
roun
ds
5 25
5 N
orth
ern
075
7 0
6 -
41
03/0
7/01
10
:30
5 99
9 0.
5 27
0 0.
5 27
0 O
ffsho
re su
pply
-
--
Live
rpoo
l Bay
27
0 15
1.
5 5
-
42
03/0
7/01
10
:45
14
135
1.5
135
--
Gen
eral
car
go
--
-So
uthe
rn
309
12.6
-
--
43
03/0
7/01
13
:15
10
304
0.5
304
0.5
304
Yac
ht
-3.
5 02
5 U
nkno
wn
205
6 0
3.5
-
44
03/0
7/01
19
:30
15
180
1.5
--
-Fi
shin
g Fi
shin
g G
roun
ds
3 00
0 N
orth
ern
180
3 -
6 -
45
04/0
7/01
12
:00
18
090
1.5
090
2 09
0 Fi
shin
g Fi
shin
g G
roun
ds
5.7
156
Unk
now
n 35
7 6.
5 0.
72
5.7
-
46
05/0
7/01
00
:00
10
202
1 -
--
Gen
eral
car
go
Lerw
ick
6 09
0 N
orth
ern
270
9 0
6 -
47
05/0
7/01
08
:10
0 -
--
1 18
0 Y
acht
Fl
oro
3 13
5 N
orth
ern
045
5 0.
3 4
-
48
06/0
7/01
01
:20
0 -
--
--
Fish
ing
Fish
ing
Gro
unds
6
270
Nor
ther
n 00
0 3.
6 0
6 -
49
06/0
7/01
07
:05
10
090
1.5
135
0.5
135
Gen
eral
car
go
New
cast
le
--
Nor
ther
n 20
0 12
0.
7 6
-
50
08/0
7/01
09
:00
15
011
1.5
--
-G
ener
al c
argo
-
8 27
0 N
orth
ern
095
9.6
0.6
8 -
51
08/0
7/01
10
:30
25
236
2 23
6 2
236
Tan
ker
--
-Li
verp
ool B
ay
321
9 0.
25
2.5
-
52
08/0
7/01
-
16
045
3 -
--
Fish
ing
Fish
ing
Gro
unds
-
-N
orth
ern
-3.
5 0.
5 -
-
53
09/0
7/01
20
:35
10
203
1 18
0 1.
5 18
0 Fi
shin
g Fi
shin
g G
roun
ds
--
Sout
hern
30
5 6
0.4
5.2
-
54
10/0
7/01
22
:25
15
180
1.5
180
--
Fish
ing
Gri
msb
y -
-So
uthe
rn
247
7.2
0 9
-
55
10/0
7/01
23
:00
10
135
2 13
5 2
135
Yac
ht
Stav
ange
r -
-N
orth
ern
077
5 0.
5 4
-
56
11/0
7/01
-
20
202
3 20
2 2
202
Sail
Tra
inin
g N
orw
ay
7 18
5 U
nkno
wn
355
10
-7
-
57
12/0
7/01
09
:00
20
315
3 99
9 2
180
Fish
ing
Fish
ing
Gro
unds
-
-N
orth
ern
100
3 0.
2 5
-
58
13/0
7/01
00
:07
12
247
1.5
247
--
Gen
eral
car
go
Hul
l -
-So
uthe
rn
242
8.5
0 12
.55
-
59
13/0
7/01
07
:00
18
338
2.5
338
2.5
338
Fish
ing
--
-N
orth
ern
190
2.4
0.3
7 -
60
15/0
7/01
07
:00
18
304
1.5
270
--
Yac
ht
-7
135
Sout
hern
31
5 5
0.25
7
-
61
15/0
7/01
-
5 99
9 0
-2.
5 -
Fish
ing
-4
045
Nor
ther
n 22
5 8
0 -
-
62
16/0
7/01
13
:15
10
112
0.5
112
0.5
022
Fish
ing
Fish
ing
Gro
unds
-
-N
orth
ern
301
10
0.2
3 -
63
16/0
7/01
19
:35
10
112
1 11
2 -
-C
onta
iner
-
3.5
235
Sout
hern
05
5 15
0.
2 3.
5 -
64
19/0
7/01
06
:00
27
000
3.5
000
3 00
0 Fi
shin
g Fi
shin
g G
roun
ds
2.9
097
Nor
ther
n 19
0 3.
4 1.
2 -
-
118

Con
sec.
N
o.
Dat
e T
ime
of
Firs
t D
etec
tion
Win
d Sp
eed
(kno
ts)
Win
d D
irec
tion
Sea
Wav
e H
eigh
t (m
)
Sea
Dir
ectio
n
Swel
l H
eigh
t (m
)
Swel
l D
irec
tion
Intr
uder
Typ
e In
trud
er
Des
tinat
ion
Firs
t Det
ectio
n R
ange
(mile
s)
Firs
t D
etec
tion
Bea
ring
Se
ctor
Es
timat
ed
Cou
rse
Estim
ated
Sp
eed
(kno
ts)
CPA
to
Inst
alla
tion
(mile
s)
Ran
ge
(mile
s)
Rem
arks
65
19/0
7/01
06
:00
27
000
3.5
000
3 00
0 Fi
shin
g Fi
shin
g G
roun
ds
--
Nor
ther
n 02
5 3.
2 1.
3 -
-
66
19/0
7/01
08
:40
15
326
2 32
6 2
326
Gen
eral
car
go
--
-So
uthe
rn
146
11.2
0.
6 4
-
67
19/0
7/01
15
:00
22
315
2 31
5 2
315
Yac
ht
-1
135
Unk
now
n 31
5 5
0 1
-
68
20/0
7/01
11
:50
13
000
2 00
0 2
000
Fish
ing
--
-So
uthe
rn
078
8.9
0.36
5
-
69
24/0
7/01
00
:15
9 13
5 0.
5 13
5 0.
5 13
5 G
ener
al c
argo
-
--
Sout
hern
13
2 7.
7 0.
25
--
70
24/0
7/01
-
0 -
--
--
Yac
ht
Plea
sure
-
-U
nkno
wn
--
0.2
3.5
-
71
25/0
7/01
18
:00
10
225
0.5
225
0.5
225
Fish
ing
--
-N
orth
ern
040
9 0.
4 7
-
72
26/0
7/01
10
:06
12
202
1 20
2 1
202
Fish
ing
--
-So
uthe
rn
260
9.4
0.1
11.6
-
73
26/0
7/01
17
:30
6 99
9 0.
5 -
--
Fish
ing
UK
10
04
0 U
nkno
wn
220
8.5
0.2
10
-
74
26/0
7/01
18
:30
--
--
--
Fish
ing
--
045
Unk
now
n 22
5 8
0 12
-
75
26/0
7/01
19
:20
3 99
9 -
-1
315
Fish
ing
Fish
ing
Gro
unds
-
-So
uthe
rn
130
6.3
0.3
6.9
-
76
27/0
7/01
17
:30
2 02
2 -
--
-Fi
shin
g Fi
shin
g G
roun
ds
--
Nor
ther
n 19
5 8.
3 0
8 -
77
28/0
7/01
17
:20
5 13
5 0.
5 13
5 -
-G
ener
al c
argo
B
lyth
5
136
Sout
hern
31
6 9
0.2
5 -
78
29/0
7/01
12
:15
5 22
5 0.
5 22
5 0.
5 22
5 G
ener
al c
argo
H
ull
--
Sout
hern
27
0 14
.2
0.25
-
-
79
30/0
7/01
00
:35
30
247
2 22
5 2
225
Fish
ing
--
-N
orth
ern
035
10
0.4
6.5
-
80
30/0
7/01
11
:15
22
236
4 23
6 -
-Fi
shin
g -
5 33
0 N
orth
ern
150
3.4
0.6
5 -
81
31/0
7/01
00
:10
14
270
1.5
270
0.5
270
Fish
ing
Fish
ing
Gro
unds
-
-N
orth
ern
109
2.4
0.5
5 -
82
31/0
7/01
04
:50
14
247
1.5
270
-27
0 Fi
shin
g -
--
Nor
ther
n 04
0 9
0.5
7 -
83
31/0
7/01
05
:30
12
247
1.5
270
-27
0 Fi
shin
g -
--
Nor
ther
n 03
2 9
0.5
8 N
o re
ply
to V
HF.
84
31/0
7/01
10
:15
20
315
2.5
304
--
Fish
ing
Buo
logn
e 6.
5 00
3 N
orth
ern
179
13.4
0.
8 6.
5 -
85
01/0
8/01
19
:30
16
202
1.5
202
--
Gen
eral
car
go
-3
320
Sout
hern
14
0 9
0.2
3 -
86
02/0
8/01
02
:30
15
180
1 18
0 1
180
Yac
ht
Wes
t Sol
e -
-So
uthe
rn
086
6 -
4 -
87
03/0
8/01
00
:25
6 00
0 0
-0.
5 00
0 Fi
shin
g G
rim
sby
--
Sout
hern
24
4 8.
8 0.
15
1.5
-
88
04/0
8/01
00
:01
15
270
3.5
315
--
Fish
ing
Fish
ing
Gro
unds
7
260
Nor
ther
n 07
5 10
.3
0.75
7
-
89
04/0
8/01
22
:15
10
270
0.2
270
0.5
270
Offs
hore
supp
ly
Nel
son
Fiel
d -
-N
orth
ern
326
13.9
1.
2 10
.2
-
90
06/0
8/01
22
:45
8 23
6 -
--
-Fi
shin
g -
--
Nor
ther
n 16
0 3
1 5.
2 -
91
07/0
8/01
23
:20
20
247
2 24
7 1.
5 24
7 Fi
shin
g Fi
shin
g G
roun
ds
--
Sout
hern
30
4 12
.4
0.9
12
-
92
07/0
8/01
-
15
090
2.5
135
--
Fish
ing
Fish
ing
Gro
unds
-
-N
orth
ern
300
2.5
0.28
-
-
93
07/0
8/01
-
8 04
5 -
--
-Fi
shin
g -
--
Nor
ther
n 18
0 2.
2 0.
25
5 -
94
08/0
8/01
06
:45
25
247
2.5
247
2 24
7 Y
acht
-
--
Nor
ther
n 03
0 5
0.1
5 -
95
08/0
8/01
08
:10
26
045
2 04
5 2
045
Fish
ing
--
-N
orth
ern
220
2.2
0.7
4.8
-
96
08/0
8/01
13
:20
27
270
3.5
236
3 23
6 O
ffsho
re su
pply
Ij
mui
den
--
Sout
hern
12
4 9.
4 1
8 -
119

Con
sec.
N
o.
Dat
e T
ime
of
Firs
t D
etec
tion
Win
d Sp
eed
(kno
ts)
Win
d D
irec
tion
Sea
Wav
e H
eigh
t (m
)
Sea
Dir
ectio
n
Swel
l H
eigh
t (m
)
Swel
l D
irec
tion
Intr
uder
Typ
e In
trud
er
Des
tinat
ion
Firs
t Det
ectio
n R
ange
(mile
s)
Firs
t D
etec
tion
Bea
ring
Se
ctor
Es
timat
ed
Cou
rse
Estim
ated
Sp
eed
(kno
ts)
CPA
to
Inst
alla
tion
(mile
s)
Ran
ge
(mile
s)
Rem
arks
97
09/0
8/01
01
:07
15
292
2 29
2 1.
5 29
2 Fi
shin
g Fi
shin
g G
roun
ds
--
Sout
hern
07
1 7.
6 0.
49
7 -
98
09/0
8/01
02
:30
12
338
2 33
8 1.
5 33
8 G
ener
al c
argo
Im
min
gham
-
-So
uthe
rn
240
14.5
1.
29
10
-
99
09/0
8/01
06
:30
15
326
2 32
6 2
326
Sail
Tra
inin
g H
ull
--
Sout
hern
22
9 2.
4 0.
4 -
-
100
09/0
8/01
-
15
326
2 32
6 2
326
Fish
ing
Fish
ing
Gro
unds
-
-So
uthe
rn
284
7.1
0.4
--
101
11/0
8/01
00
:15
10
202
1 20
2 1.
5 20
2 G
ener
al c
argo
-
6 14
1 So
uthe
rn
325
11.8
0.
4 -
-
102
11/0
8/01
00
:35
10
202
1 20
2 1.
5 20
2 Y
acht
H
ull
--
Sout
hern
27
2 4.
4 0.
5 -
-
103
11/0
8/01
-
10
999
1 00
0 -
-Fi
shin
g Fi
shin
g G
roun
ds
--
Nor
ther
n 35
0 8.
5 0.
25
--
104
11/0
8/01
-
10
225
1 27
0 1
270
Yac
ht
--
-N
orth
ern
155
2.5
0.5
4 N
o re
ply
to V
HF.
105
13/0
8/01
20
:10
18
225
2.5
225
--
Fish
ing
Man
tsho
lm
8 30
0 N
orth
ern
118
10.3
0.
25
10
-
106
15/0
8/01
-
10
180
0.5
180
--
Fish
ing
Fras
erbu
rgh
6 04
5 N
orth
ern
210
9 0.
5 6
-
107
16/0
8/01
07
:06
5 99
9 1
135
1.5
090
Fish
ing
--
-N
orth
ern
345
12.6
1
9 -
108
16/0
8/01
08
:10
20
202
1.5
225
1.5
225
Fish
ing
Fish
ing
Gro
unds
3.
2 22
5 U
nkno
wn
999
999
--
-
109
17/0
8/01
02
:45
12
214
1 21
4 1
214
Fish
ing
--
-So
uthe
rn
300
7.7
0.5
6 -
110
17/0
8/01
19
:55
5 22
5 0.
5 22
5 0.
5 22
5 Fi
shin
g Fi
shin
g G
roun
ds
--
Sout
hern
01
4 11
1
5 -
111
18/0
8/01
03
:10
15
202
1.5
202
1.5
202
Tan
ker
Tet
ney
--
Nor
ther
n 18
6 11
.5
2 11
.5
-
112
18/0
8/01
11
:00
14
214
1.5
214
2 21
4 Fi
sher
y Pr
otec
tion
--
-N
orth
ern
181
10
1 10
-
113
18/0
8/01
13
:15
5 21
4 0.
5 21
4 0.
5 21
4 Fi
shin
g Fi
shin
g G
roun
ds
--
Nor
ther
n 19
0 2.
5 0.
3 4
-
114
18/0
8/01
18
:00
15
112
2 11
2 1.
5 11
2 G
ener
al c
argo
A
wai
ting
Ord
ers
--
Sout
hern
14
5 8.
5 0.
27
8.2
-
115
19/0
8/01
09
:35
30
112
5 11
2 5
112
Ro-
Ro
othe
r ca
rgo
Nor
way
-
-N
orth
ern
057
15
0.5
11.4
-
116
19/0
8/01
11
:22
8 13
5 2
135
1 13
5 G
ener
al c
argo
Im
min
gham
-
-So
uthe
rn
254
13
0.99
-
-
117
19/0
8/01
19
:30
20
225
2 18
0 2
180
Gen
eral
car
go
--
-So
uthe
rn
265
7.5
0.25
6.
8 -
118
19/0
8/01
23
:59
15
090
1.5
090
1.5
090
Gen
eral
car
go
--
-So
uthe
rn
268
8.5
0 8
-
119
20/0
8/01
22
:30
15
214
1 21
4 0.
5 21
4 Pa
ssen
ger
Hum
ber
--
Sout
hern
25
8 4.
3 0.
99
8.5
-
120
21/0
8/01
17
:20
10
135
1 13
5 0.
5 13
5 R
esea
rch
--
-So
uthe
rn
357
13.5
0.
77
7 -
121
21/0
8/01
-
20
146
1 99
9 1
135
Fish
ing
Fish
ing
Gro
unds
-
-So
uthe
rn
010
5.3
0.4
--
122
21/0
8/01
-
12
180
1 18
0 1
180
Fish
ing
Fish
ing
Gro
unds
-
-So
uthe
rn
254
8 0.
25
--
123
22/0
8/01
07
:50
8 99
9 -
214
0.5
214
Yac
ht
Dov
er
--
Sout
hern
13
0 9
0.2
4.64
-
124
22/0
8/01
08
:15
5 21
4 0.
5 21
4 0.
5 21
4 T
anke
r H
umbe
r A
ncho
rage
-
-So
uthe
rn
251
12.2
0.
4 12
-
125
22/0
8/01
19
:10
6 13
5 0
-0.
5 13
5 G
ener
al c
argo
H
owde
n D
yke
--
Sout
hern
25
5 11
.5
0.25
16
-
126
23/0
8/01
05
:20
8 13
5 1
180
1 18
0 G
ener
al c
argo
-
8 25
0 N
orth
ern
075
12.5
0.
5 8
Fog.
127
23/0
8/01
08
:30
12
135
1 13
5 0.
5 13
5 G
ener
al c
argo
H
umbe
r -
-So
uthe
rn
274
10
0.45
6.
5 -
128
23/0
8/01
11
:50
5 14
6 1
146
1 14
6 G
ener
al c
argo
-
--
Nor
ther
n 10
8 10
1.
25
0.7
Fog
- V
HF
cont
act o
n 6t
h at
tem
pt.
120

Con
sec.
N
o.
Dat
e T
ime
of
Firs
t D
etec
tion
Win
d Sp
eed
(kno
ts)
Win
d D
irec
tion
Sea
Wav
e H
eigh
t (m
)
Sea
Dir
ectio
n
Swel
l H
eigh
t (m
)
Swel
l D
irec
tion
Intr
uder
Typ
e In
trud
er
Des
tinat
ion
Firs
t Det
ectio
n R
ange
(mile
s)
Firs
t D
etec
tion
Bea
ring
Se
ctor
Es
timat
ed
Cou
rse
Estim
ated
Sp
eed
(kno
ts)
CPA
to
Inst
alla
tion
(mile
s)
Ran
ge
(mile
s)
Rem
arks
129
24/0
8/01
01
:00
9 18
0 1
180
0.5
180
Gen
eral
car
go
Hol
land
-
-So
uthe
rn
090
12
1.1
12
-
130
27/0
8/01
09
:00
16
315
3 31
5 3
315
Yac
ht
--
-Li
verp
ool B
ay
100
4.5
0.5
7 -
131
28/0
8/01
06
:30
20
304
4 30
4 4
304
Offs
hore
supp
ly
Dus
hovi
k -
-N
orth
ern
060
12.7
0.
4 9.
4 -
132
28/0
8/01
-
2 24
7 1.
5 31
5 -
-G
ener
al c
argo
Im
min
gham
6
080
Sout
hern
27
2 9
0.67
6
Ves
sel a
ltere
d co
urse
afte
r be
ing
calle
d by
nam
e. V
ery
poor
Eng
lish.
133
29/0
8/01
20
:00
--
--
--
Gen
eral
car
go
--
-Li
verp
ool B
ay
--
-8
-
134
29/0
8/01
21
:15
15
146
1.5
146
1 14
6 G
ener
al c
argo
B
rem
en
--
Sout
hern
08
0 10
.6
1.3
16
-
135
30/0
8/01
12
:00
4 99
9 0
-0.
3 21
4 G
ener
al c
argo
A
ntw
erp
--
Sout
hern
14
6 9.
5 1.
21
13
-
136
01/0
9/01
08
:00
16
338
2 33
8 2.
5 33
8 Fi
shin
g D
enm
ark
--
Nor
ther
n 12
5 9.
3 1
11.7
-
137
01/0
9/01
22
:00
20
202
2.5
202
2.5
202
Fish
ing
Fish
ing
Gro
unds
6
000
Unk
now
n 18
0 3
0.5
6 -
138
02/0
9/01
09
:45
17
270
2.5
270
2.5
270
Fish
ing
Fish
ing
Gro
unds
-
-N
orth
ern
345
7 0.
2 3.
2 -
139
05/0
9/01
08
:30
12
338
2 31
5 -
-G
ener
al c
argo
C
ontin
ent
6 27
6 So
uthe
rn
999
9.5
0.6
6.5
-
140
07/0
9/01
19
:45
36
270
3 27
0 -
-G
ener
al c
argo
B
ilbao
-
-So
uthe
rn
148
11
1.9
8 -
141
07/0
9/01
21
:30
23
338
2.5
338
3 33
8 Fi
shin
g -
--
Nor
ther
n 00
8 3.
7 1
--
142
08/0
9/01
20
:00
34
338
6 33
8 6
338
Offs
hore
supp
ly
P. B
. Loy
d Jr
. -
-N
orth
ern
185
12
0.1
9.02
-
143
11/0
9/01
11
:15
20
292
2 29
2 2
292
Fish
ing
--
-So
uthe
rn
090
1 1
8 N
o re
gist
ratio
n m
arks
.
144
12/0
9/01
-
17
180
1 18
0 2
180
Gen
eral
car
go
--
-N
orth
ern
117
12.5
2
10
-
145
14/0
9/01
08
:20
18
326
2 32
6 2.
5 32
6 Fi
shin
g -
--
Nor
ther
n 21
1 7
1.7
11
-
146
14/0
9/01
10
:28
12
326
2 32
6 2.
5 32
6 O
ffsho
re su
pply
P.
B. L
oyd
Jr.
--
Nor
ther
n 05
6 12
.9
0.2
10.1
-
147
16/0
9/01
06
:20
30
315
1 31
5 3
315
Bul
k ca
rrie
r -
--
Sout
hern
01
0 8.
5 0.
4 4
-
148
20/0
9/01
00
:35
18
135
1 13
5 1
135
Gen
eral
car
go
--
-Li
verp
ool B
ay
178
13
0.2
8 -
149
20/0
9/01
20
:15
10
000
1 00
0 1
000
Tug
-
--
Live
rpoo
l Bay
06
0 5.
5 0.
5 9
-
150
20/0
9/01
22
:30
10
000
1 00
0 1
000
Gen
eral
car
go
--
-Li
verp
ool B
ay
005
9 0.
25
7 -
151
22/0
9/01
10
:00
8 00
0 0.
5 00
0 1
-Fi
shin
g B
elfa
st
--
Nor
ther
n 26
9 10
.7
0.25
9
-
152
23/0
9/01
09
:10
15
000
2 00
0 1.
5 00
0 G
ener
al c
argo
W
arre
n P
oint
8
090
Nor
ther
n 27
7 11
.5
1.45
8
-
153
24/0
9/01
09
:50
13
045
1.5
000
--
Gen
eral
car
go
Live
rpoo
l 6
090
Nor
ther
n 27
6 11
0.
65
6 -
154
25/0
9/01
09
:30
15
135
1.5
135
2 13
5 G
ener
al c
argo
G
dans
k 10
27
0 N
orth
ern
100
11.2
1.
25
10
-
155
25/0
9/01
10
:30
10
135
1 13
5 2
135
Con
tain
er
Aal
borg
9
270
Nor
ther
n 09
6 12
.6
1.7
9 -
156
26/0
9/01
08
:15
10
090
1 09
0 1
090
Bul
k ca
rrie
r M
albo
rg
9 31
5 N
orth
ern
096
12
1.5
9.77
-
157
26/0
9/01
14
:30
18
090
1.5
090
--
Offs
hore
supp
ly
Ber
gen
--
Nor
ther
n 05
4 13
.6
1 8
-
158
27/0
9/01
00
:05
10
157
1.5
--
-G
ener
al c
argo
-
--
Nor
ther
n 08
0 11
.6
1.8
7 -
159
27/0
9/01
01
:00
10
157
1.5
--
-Fi
shin
g Fi
shin
g G
roun
ds
--
Nor
ther
n 07
3 8.
5 1.
8 8
-
160
30/0
9/01
04
:15
15
202
1 20
2 0.
5 20
2 Fi
shin
g G
rim
sby
--
Sout
hern
25
3 7.
4 0.
68
6 -
121

Con
sec.
N
o.
Dat
e T
ime
of
Firs
t D
etec
tion
Win
d Sp
eed
(kno
ts)
Win
d D
irec
tion
Sea
Wav
e H
eigh
t (m
)
Sea
Dir
ectio
n
Swel
l H
eigh
t (m
)
Swel
l D
irec
tion
Intr
uder
Typ
e In
trud
er
Des
tinat
ion
Firs
t Det
ectio
n R
ange
(mile
s)
Firs
t D
etec
tion
Bea
ring
Se
ctor
Es
timat
ed
Cou
rse
Estim
ated
Sp
eed
(kno
ts)
CPA
to
Inst
alla
tion
(mile
s)
Ran
ge
(mile
s)
Rem
arks
161
30/0
9/01
13
:09
25
180
2.5
180
2 18
0 T
anke
r T
ees
--
Sout
hern
33
0 13
.1
1.1
10
-
162
01/1
0/01
02
:35
39
225
3 22
5 2.
5 22
5 G
ener
al c
argo
-
--
Sout
hern
33
3 9.
7 1.
3 6.
5 -
163
03/1
0/01
04
:10
27
225
3 22
5 2
225
Gen
eral
car
go
Sgah
am
--
Sout
hern
33
6 6.
2 1.
05
16
-
164
03/1
0/01
17
:15
21
225
2.5
225
2 22
5 G
ener
al c
argo
Pe
terh
ead
--
Sout
hern
31
5 7.
1 1.
01
4.1
-
165
03/1
0/01
23
:20
25
225
2.5
225
2 22
5 Fi
shin
g Fi
shin
g G
roun
ds
--
Sout
hern
06
8 8
1.25
14
-
166
04/1
0/01
01
:15
25
236
2 23
6 1.
5 23
6 G
ener
al c
argo
E
lbe
--
Sout
hern
07
2 9.
7 1
12
-
167
04/1
0/01
12
:54
18
236
1.5
236
1 23
6 T
anke
r T
ham
es
--
Sout
hern
13
5 9
1.45
7
-
168
04/1
0/01
13
:30
17
236
0.5
236
1.5
236
Fish
ing
Fish
ing
Gro
unds
-
-So
uthe
rn
185
11.5
0.
25
4 -
169
04/1
0/01
-
15
236
2 24
7 2
247
Fish
ing
--
-So
uthe
rn
170
13
0.25
6
-
170
05/1
0/01
05
:00
20
180
2 18
0 1.
5 18
0 U
nkno
wn
--
-So
uthe
rn
307
9.3
3 6
-
171
05/1
0/01
10
:25
25
180
2.5
180
2 18
0 T
anke
r -
--
Sout
hern
14
1 7.
8 0.
75
11.5
-
172
05/1
0/01
16
:15
25
203
2.5
225
2.5
225
Gen
eral
car
go
Ram
sey
I.O
.M.
--
Live
rpoo
l Bay
29
3 9.
8 0.
23
6 -
173
05/1
0/01
16
:34
18
157
1.5
157
1 15
7 G
ener
al c
argo
G
rim
sby
--
Sout
hern
29
8 18
.1
0.58
12
-
174
06/1
0/01
04
:30
20
202
2.5
202
2 20
2 T
anke
r Im
min
gham
-
-So
uthe
rn
260
13
1.2
14
-
175
06/1
0/01
14
:45
18
180
1.5
180
1 18
0 G
ener
al c
argo
Im
min
gham
-
-So
uthe
rn
315
6.2
1.61
8
-
176
06/1
0/01
22
:45
20
214
2 21
4 2.
5 21
4 T
anke
r H
umbe
r -
-So
uthe
rn
270
13
0.2
6.6
-
177
07/1
0/01
03
:10
28
180
0.5
180
1.5
180
Gen
eral
car
go
Gri
msb
y -
-So
uthe
rn
090
15
0.29
9 6
-
178
07/1
0/01
18
:10
16
157
3 15
7 -
-Fi
shin
g Fi
shin
g G
roun
ds
--
Nor
ther
n 06
2 3
0.25
6
-
179
08/1
0/01
03
:45
50
202
6 20
2 4.
5 20
2 C
onta
iner
R
otte
rdam
-
-So
uthe
rn
154
14.9
1.
55
9 -
180
08/1
0/01
08
:05
37
202
4 20
2 5
202
Fish
ing
--
-So
uthe
rn
310
12
0.2
4.5
-
181
08/1
0/01
16
:45
25
202
3.5
202
3 20
2 T
anke
r A
ntw
erp
--
Nor
ther
n 12
7 10
.6
1.09
12
-
182
09/1
0/01
05
:00
30
214
3 21
4 2.
5 21
4 O
ffsho
re su
pply
-
--
Sout
hern
31
4 11
0.
75
10
-
183
09/1
0/01
17
:45
27
270
2.5
270
2 27
0 G
ener
al c
argo
A
ntw
erp
--
Sout
hern
14
8 9.
9 0.
66
10
-
184
09/1
0/01
17
:50
27
270
2.5
270
2 27
0 D
rilli
ng
Hot
on
--
Sout
hern
07
4 9.
6 0.
64
8.7
-
185
09/1
0/01
18
:30
25
247
2.5
247
2.5
247
Offs
hore
supp
ly
Rot
terd
am
--
Sout
hern
16
2 9
0.1
6 -
186
09/1
0/01
20
:25
10
330
1.5
165
2.5
165
Offs
hore
supp
ly
P. B
. Loy
d Jr
. -
-N
orth
ern
159
7.1
0.3
6.8
-
187
10/1
0/01
07
:00
25
200
2.5
200
2.5
200
Offs
hore
supp
ly
P. B
. Loy
d Jr
. -
-N
orth
ern
050
11
0.1
10
-
188
11/1
0/01
09
:46
18
202
1 20
2 1
202
Con
tain
er
--
-So
uthe
rn
253
12.5
0.
1 7
-
189
11/1
0/01
10
:10
20
180
2 18
0 1
180
Tan
ker
--
-So
uthe
rn
179
12.8
1.
16
12
-
190
11/1
0/01
16
:00
18
191
2 19
1 1.
5 19
1 G
ener
al c
argo
H
alin
gen
--
Sout
hern
09
5 13
.5
0.99
12
La
te r
eply
to c
omm
unic
atio
ns.
191
11/1
0/01
19
:45
26
215
2.5
210
3 21
0 Fi
shin
g -
--
Nor
ther
n 19
1 3.
8 0.
1 7.
02
-
192
12/1
0/01
01
:30
35
214
4 20
2 4
202
Gen
eral
car
go
--
-Li
verp
ool B
ay
318
9 0.
2 8
-
122

Con
sec.
N
o.
Dat
e T
ime
of
Firs
t D
etec
tion
Win
d Sp
eed
(kno
ts)
Win
d D
irec
tion
Sea
Wav
e H
eigh
t (m
)
Sea
Dir
ectio
n
Swel
l H
eigh
t (m
)
Swel
l D
irec
tion
Intr
uder
Typ
e In
trud
er
Des
tinat
ion
Firs
t Det
ectio
n R
ange
(mile
s)
Firs
t D
etec
tion
Bea
ring
Se
ctor
Es
timat
ed
Cou
rse
Estim
ated
Sp
eed
(kno
ts)
CPA
to
Inst
alla
tion
(mile
s)
Ran
ge
(mile
s)
Rem
arks
193
12/1
0/01
09
:00
18
260
4 23
0 5
230
Bul
k ca
rrie
r D
enm
ark
--
Nor
ther
n 12
3 12
.5
1.3
11
-
194
12/1
0/01
10
:40
15
180
1.5
180
1 18
0 Fi
shin
g G
rim
sby
--
Sout
hern
25
5 8.
5 0.
3 8
-
195
13/1
0/01
09
:30
--
--
--
Offs
hore
supp
ly
P. B
. Loy
d Jr
. -
-N
orth
ern
155
7.7
0.1
7.1
-
196
13/1
0/01
-
10
135
1 13
5 0.
5 13
5 T
anke
r H
umbe
r -
-So
uthe
rn
265
10
0.55
10
-
197
14/1
0/01
09
:30
15
190
1.5
210
1.5
210
Offs
hore
supp
ly
--
-N
orth
ern
184
13.4
0.
9 11
.4
-
198
15/1
0/01
08
:00
23
135
2.5
135
2.5
135
Fish
ing
Fish
ing
Gro
unds
12
25
5 N
orth
ern
077
7.8
0.2
12
-
199
15/1
0/01
13
:20
20
157
2 15
7 2
157
Gen
eral
car
go
Wisb
ech
--
Sout
hern
24
3 9.
3 0.
18
5 -
200
15/1
0/01
17
:00
24
157
4.5
157
3 15
7 Fi
shin
g Fi
shin
g G
roun
ds
--
Nor
ther
n 99
9 2
1.9
4.5
-
201
15/1
0/01
-
20
191
2 19
1 2
191
Gen
eral
car
go
Hum
ber
--
Sout
hern
27
0 10
0.
2 8
-
202
16/1
0/01
01
:10
17
225
2 22
5 1.
5 22
5 Fi
shin
g Fi
shin
g G
roun
ds
--
Sout
hern
11
9 11
1.
3 12
La
te r
eply
to c
omm
unic
atio
ns.
203
16/1
0/01
09
:25
18
214
1.5
214
0.5
214
Tan
ker
--
-So
uthe
rn
080
9.7
1.3
14
-
204
16/1
0/01
14
:36
15
214
0.5
214
--
Gen
eral
car
go
--
-So
uthe
rn
014
13
0.1
8.5
-
205
16/1
0/01
15
:00
12
230
2 23
0 2.
5 23
0 O
ffsho
re su
pply
P.
B. L
oyd
Jr.
--
Nor
ther
n 15
8 7
0.1
6.96
-
206
16/1
0/01
19
:00
18
165
2 16
5 2.
5 17
0 O
ffsho
re su
pply
P.
B. L
oyd
Jr.
--
Nor
ther
n 15
2 11
.3
0.2
6.76
-
207
17/1
0/01
16
:20
18
124
1.5
157
--
Fish
ing
Fish
ing
Gro
unds
-
-N
orth
ern
999
2.4
0.6
--
208
18/1
0/01
14
:06
28
130
3 12
0 4
120
Gen
eral
car
go
--
-N
orth
ern
290
10
2 -
-
209
18/1
0/01
16
:20
10
203
1.5
090
1.5
090
Fish
ing
Fran
ce
--
Sout
hern
15
2 14
0.
77
10
-
210
19/1
0/01
21
:00
22
112
3.5
112
3 11
2 Fi
shin
g Fi
shin
g G
roun
ds
--
Nor
ther
n 02
5 2.
6 0.
25
--
211
20/1
0/01
03
:35
14
135
1.5
135
1.5
135
Gen
eral
car
go
Cux
have
n -
-So
uthe
rn
092
7.3
-4
-
212
20/1
0/01
06
:00
21
135
2 09
0 1.
5 09
0 G
ener
al c
argo
T
yne
--
Sout
hern
33
3 8.
1 0.
6 16
-
213
20/1
0/01
19
:47
17
135
2 09
0 1.
5 09
0 T
anke
r Im
min
gham
-
-So
uthe
rn
304
11
1.7
12
-
214
21/1
0/01
14
:30
15
045
1.5
090
1.5
090
Con
tain
er
Bre
men
-
-So
uthe
rn
102
7.7
1.24
10
-
215
22/1
0/01
01
:30
18
022
1 02
2 1
022
Fish
ing
Fish
ing
Gro
unds
-
-So
uthe
rn
080
7 1.
3 3
-
216
22/1
0/01
08
:00
12
330
1.5
--
-Fi
shin
g Fi
shin
g G
roun
ds
0.6
350
Sout
hern
17
4 7.
4 0.
276
8 -
217
22/1
0/01
08
:15
8 14
0 1.
5 12
0 2
120
Offs
hore
supp
ly
P. B
. Loy
d Jr
. -
-N
orth
ern
046
11.5
0.
6 10
.7
-
218
24/1
0/01
01
:15
20
225
2.5
225
--
Gen
eral
car
go
--
-So
uthe
rn
278
10.6
0.
2 7
-
219
24/1
0/01
22
:10
20
170
3 14
0 3.
5 14
0 O
ffsho
re su
pply
P.
B. L
oyd
Jr.
--
Nor
ther
n 00
7 12
.3
2.3
11.1
-
220
24/1
0/01
23
:38
20
170
3 14
0 3.
5 14
0 O
ffsho
re su
pply
P.
B. L
oyd
Jr.
--
Nor
ther
n 14
0 11
.8
1.7
7.17
-
221
27/1
0/01
11
:00
30
220
3 22
0 3.
5 22
0 O
ffsho
re su
pply
P.
B. L
oyd
Jr.
--
Nor
ther
n 04
9 13
.6
0.3
10.8
-
222
27/1
0/01
14
:10
20
191
2 19
1 -
-G
ener
al c
argo
Fe
lixto
we
--
Sout
hern
21
5 11
.2
0.3
5 -
223
03/1
1/01
10
:15
-01
2 -
002
--
Fish
ing
--
-Li
verp
ool B
ay
348
5.5
0.9
6 W
ould
hav
e pa
ssed
insid
e 50
0 m
etre
s zon
e.
224
13/1
1/01
08
:30
--
--
5 36
0 Fi
shin
g Fi
shin
g G
roun
ds
--
Nor
ther
n 35
0 3
0.1
1.5
-
123

Con
sec.
N
o.
Dat
e T
ime
of
Firs
t D
etec
tion
Win
d Sp
eed
(kno
ts)
Win
d D
irec
tion
Sea
Wav
e H
eigh
t (m
)
Sea
Dir
ectio
n
Swel
l H
eigh
t (m
)
Swel
l D
irec
tion
Intr
uder
Typ
e In
trud
er
Des
tinat
ion
Firs
t Det
ectio
n R
ange
(mile
s)
Firs
t D
etec
tion
Bea
ring
Se
ctor
Es
timat
ed
Cou
rse
Estim
ated
Sp
eed
(kno
ts)
CPA
to
Inst
alla
tion
(mile
s)
Ran
ge
(mile
s)
Rem
arks
225
22/1
1/01
09
:25
30
300
3 30
0 3
300
Fish
ing
Fish
ing
Gro
unds
-
-Li
verp
ool B
ay
353
8.5
0.2
3.5
Ves
sel a
ltere
d co
urse
and
pas
sed
0.5
mile
wes
t of
plat
form
with
out p
robl
em.
226
24/1
1/01
18
:40
14
220
1.5
270
1 27
0 O
ffsho
re su
pply
In
defa
tigab
le 2
3C
--
Sout
hern
12
7 10
0.
5 -
-
227
28/1
1/01
05
:37
20
270
4 27
0 3
270
Fish
ing
--
-N
orth
ern
188
11
0.1
8 -
228
28/1
1/01
05
:57
27
260
3 26
0 2.
5 26
0 G
ener
al c
argo
G
erm
any
--
Sout
hern
09
0 11
.5
1.05
14
.1
-
229
29/1
1/01
06
:00
25
220
2.5
220
2 22
0 Fi
shin
g Fi
shin
g G
roun
ds
--
Sout
hern
05
8 8
0.95
6.
75
-
230
29/1
1/01
13
:10
12
220
2 22
0 2
220
Fish
ing
Gri
msb
y -
-So
uthe
rn
261
8 0.
44
0.45
-
231
29/1
1/01
15
:00
20
240
2 22
0 -
-G
ener
al c
argo
Ip
swic
h -
-U
nkno
wn
206
8.3
0.3
8 -
232
30/1
1/01
07
:10
14
160
1 16
0 0.
5 16
0 Fi
shin
g Fr
ance
-
-So
uthe
rn
141
9.2
0.82
8
Ves
sel w
as c
alle
d se
vera
l tim
es w
ith n
o re
spon
se.
FRC
cre
w st
ood
by b
ut d
id n
ot la
unch
. Ves
sel
even
tual
ly a
nsw
ered
to c
alls
on V
HF
Ch.
16.
233
30/1
1/01
09
:25
15
190
1.5
190
0.5
190
Gen
eral
car
go
--
-So
uthe
rn
072
14.8
0.
96
10
Ves
sel a
ltere
d co
urse
as c
onta
cted
.
234
30/1
1/01
16
:00
16
190
1.5
190
1 19
0 G
ener
al c
argo
H
ull
--
Sout
hern
26
0 9.
4 0.
74
11
-
235
02/1
2/01
11
:00
--
--
--
Fish
ing
Fish
ing
Gro
unds
-
-So
uthe
rn
058
8 1.
01
10
-
236
02/1
2/01
17
:30
10
090
1 33
0 1
330
Offs
hore
supp
ly
Gre
at Y
arm
outh
-
-So
uthe
rn
142
12
0 7
-
237
04/1
2/01
02
:05
30
180
2.5
180
2.5
180
Dre
dger
H
umbe
r -
-So
uthe
rn
280
11
1 5
-
238
09/1
2/01
02
:30
17
200
2 20
0 2
200
Fish
ing
Fish
ing
Gro
unds
6
100
Unk
now
n 99
9 6.
5 0.
75
6 A
dvise
d to
giv
e 1
mile
cle
aran
ce w
hen
fishi
ng a
nd
read
ily a
gree
d.
239
12/1
2/01
20
:00
8 19
0 2
230
2.5
230
Offs
hore
supp
ly
Har
ding
-
-N
orth
ern
011
10.2
2
9.21
-
240
12/1
2/01
23
:10
18
050
2 04
5 2
045
Unk
now
n -
--
Sout
hern
19
2 11
-
12
-
241
15/1
2/01
01
:10
12
090
1 09
0 -
-G
ener
al c
argo
-
--
Sout
hern
19
0 12
0.
3 12
-
242
19/1
2/01
00
:05
35
300
4 30
0 4
300
Fish
ing
Fish
ing
Gro
unds
2
045
Unk
now
n 19
0 8
0.5
6 A
dvise
d to
giv
e 1
mile
cle
aran
ce fr
om r
igs w
hen
fishi
ng.
243
19/1
2/01
22
:35
35
020
4 02
0 2
020
Bul
k ca
rrie
r B
razi
l -
-So
uthe
rn
090
12.8
0.
62
14
-
244
06/0
1/02
08
:15
16
120
--
0.5
-Fi
shin
g -
--
Live
rpoo
l Bay
00
0 7
0.4
3.5
Thi
s situ
atio
n w
as in
den
se fo
g.
245
-04
:30
32
155
4.5
160
3 16
0 Fi
shin
g -
--
Nor
ther
n -
--
6 T
his v
esse
l was
not
an
intr
uder
. Will
stay
cle
ar o
f 500
m
etre
s. K
now
s the
are
a.
246
--
20
250
2 25
0 1.
5 25
0 G
ener
al c
argo
-
--
Live
rpoo
l Bay
36
0 4.
5 0.
2 4
Rad
ar c
onta
ct w
as lo
st a
t 6 m
iles.
Prin
ted
and
publ
ishe
d by
the
Hea
lth a
nd S
afet
y E
xecu
tive
C1.
25
02/0
3

ISBN 0-7176-2679-2
RR 053
780717626793£30.00 9

Ship
/pla
tform
collisio
n in
cident d
ata
base
(2001)
HS
E B
OO
KS