research triangle institute consequences of whistleblowing...
TRANSCRIPT
RESEARCH TRIANGLE INSTITUTE
Consequences of Whistleblowing for the Whistleblowerin Misconduct in Science Cases
Final Report
Submitted to:
Lawrence Rhoades, Ph.D., Director
Division of Policy and Education
Office of Research Integrity
Rockwall II Building, Suite 700
5515 Security Lane
Rockville, MD 20852
Prepared by
Research Triangle Institute
Contract No. 282-92-0045
Delivery Order No. 3
Deliverable No. 8
October 30, 1995
1615 M St NW • Suite 740 • Research Triangle Institute, Washington, DC 20036-3209 USA
Consequences of Whistleblowing for the Whistleblower
in Misconduct in Science Cases
Final Report
Submitted to:
Lawrence Rhoades, Ph.D., Director
Division of Policy and Education
Office of Research Integrity
Rockwall II Building, Suite 700
5515 Security Lane
Rockville, MD 20852
Prepared by
Research Triangle Institute
James S. Lubalin, Ph.D.
Mary-Anne E. Ardini
Jennifer L. Matheson
Contract No. 282-92-0045
Delivery Order No. 3
Deliverable No. 8
October 30, 1995
TABLE OF CONTENTS
1. Background and Purpose of the Project . . . . . . . . . . . . . . . . . . . . . . . . . . . . . . . . . . . . . . . . . . . . 1
a. Empirical Evidence . . . . . . . . . . . . . . . . . . . . . . . . . . . . . . . . . . . . . . . . . . . . . . . . . . . . . . . . . 1
b. Legislative and Regulatory Background . . . . . . . . . . . . . . . . . . . . . . . . . . . . . . . . . . . . . . . . . 3
c. Purpose of This Study . . . . . . . . . . . . . . . . . . . . . . . . . . . . . . . . . . . . . . . . . . . . . . . . . . . . . . . 4
2. Study Methods . . . . . . . . . . . . . . . . . . . . . . . . . . . . . . . . . . . . . . . . . . . . . . . . . . . . . . . . . . . . . . . 6
a. Instrument Contents . . . . . . . . . . . . . . . . . . . . . . . . . . . . . . . . . . . . . . . . . . . . . . . . . . . . . . . . 6
b. Data Collection . . . . . . . . . . . . . . . . . . . . . . . . . . . . . . . . . . . . . . . . . . . . . . . . . . . . . . . . . . . . 6
c. Analyses . . . . . . . . . . . . . . . . . . . . . . . . . . . . . . . . . . . . . . . . . . . . . . . . . . . . . . . . . . . . . . . . . 9
3. Analysis of Survey Response Rates . . . . . . . . . . . . . . . . . . . . . . . . . . . . . . . . . . . . . . . . . . . . . . 11
a. Overall Response Rates . . . . . . . . . . . . . . . . . . . . . . . . . . . . . . . . . . . . . . . . . . . . . . . . . . . . . 11
b. Response Rates of Different Types of Whistleblowing Cases . . . . . . . . . . . . . . . . . . . . . . . . 13
c. Who Are the Whistleblowers Included in This Survey . . . . . . . . . . . . . . . . . . . . . . . . . . . . . . 14
4. Findings: Consequences of Whistleblowing for the Whistleblower . . . . . . . . . . . . . . . . . . . . . . . 18
a. Specific Consequences of Blowing the Whistle . . . . . . . . . . . . . . . . . . . . . . . . . . . . . . . . . . . 18
b. Consequences Experienced by Different Complainants . . . . . . . . . . . . . . . . . . . . . . . . . . . . . 29
c. Consequences Experienced in Different Situations . . . . . . . . . . . . . . . . . . . . . . . . . . . . . . . . . 33
d. Overall Impact of Whistleblowing on the Whistleblower . . . . . . . . . . . . . . . . . . . . . . . . . . . . 39
5. Conclusions and Recommendations . . . . . . . . . . . . . . . . . . . . . . . . . . . . . . . . . . . . . . . . . . . . . . 55
Bibliography
Appendix A Survey Instrument and Recruitment Letters
Appendix B Script for Telephone Reminder Calls
LIST OF TABLES
Table 1 Comparison of Whistleblowers Who Completed Surveys With InitialWhistleblowing Cases . . . . . . . . . . . . . . . . . . . . . . . . . . . . . . . . . . . . . . . . . . . . . . . . . . . 12
Table 2 Self Reported Characteristics of Whistleblowers Completing Surveys . . . . . . . . . . . . . . . 16
Table 3 Number and Percent of Whistleblowers Reporting Different Numbers ofNegative Actions . . . . . . . . . . . . . . . . . . . . . . . . . . . . . . . . . . . . . . . . . . . . . . . . . . . . . . 19
Table 4 Number and Percent of Whistleblowers Reporting Specific Negative Actions . . . . . . . . . 20
Table 5 Number and Percent of Whistleblowers Reporting Specific Negative ActionsDuring And/Or After Investigation of the Allegation . . . . . . . . . . . . . . . . . . . . . . . . . . . . 23
Table 6 Number and Percent of Whistleblowers Reporting Specific PersonsResponsible for Any Negative Actions . . . . . . . . . . . . . . . . . . . . . . . . . . . . . . . . . . . . . . 25
Table 7 Number and Percent of Whistleblowers Reporting Different PersonsResponsible by Negative Action Category . . . . . . . . . . . . . . . . . . . . . . . . . . . . . . . . . . . 26
Table 8 Number and Percent of Whistleblowers Reporting Different PersonsResponsible by When Negative Actions Occurred . . . . . . . . . . . . . . . . . . . . . . . . . . . . . . 28
Table 9 Number and Percent of Whistleblowers Who Reported Experiencing AnyNegative Actions by Whistleblower Characteristics . . . . . . . . . . . . . . . . . . . . . . . . . . . . . 30
Table 10 Number and Percent of Whistleblowers Who Reported Experiencing AnyNegative Actions by Case Characteristics . . . . . . . . . . . . . . . . . . . . . . . . . . . . . . . . . . . . 34
Table 11 Whistleblowers' Assessments of Overall Effect of Whistleblowing on Career byWhether Negative Actions Were Experienced . . . . . . . . . . . . . . . . . . . . . . . . . . . . . . . . 40
Table 12 Whistleblowers' Assessments of Impact of Whistleblowing on Career . . . . . . . . . . . . . . . 42
Table 13 Whistleblowers' Assessments of Impact of Whistleblowing on Career byWhether Negative Actions Were Experienced . . . . . . . . . . . . . . . . . . . . . . . . . . . . . . . . . 43
Table 14 Whistleblowers' Assessments of Impact of Whistleblowing on Participationin Professional Activities . . . . . . . . . . . . . . . . . . . . . . . . . . . . . . . . . . . . . . . . . . . . . . . . . 45
Table 15 Whistleblowers' Summary Assessments of Impact of Whistleblowing on ProfessionalActivities by Whether Negative Actions Were Experienced . . . . . . . . . . . . . . . . . . . . . . . 46
LIST OF TABLES (Cont'd)
Table 16 Whistleblowers' Assessments of Impact of Whistleblowing on Personal Life . . . . . . . . . . 48
Table 17 Whistleblowers' Assessments of Impact of Whistleblowing on Personal Life byWhether Negative Actions Were Experienced . . . . . . . . . . . . . . . . . . . . . . . . . . . . . . . . . 49
Table 18 Number and Percent of Whistleblowers Currently Employed by Whether Negative Actions Were Experienced . . . . . . . . . . . . . . . . . . . . . . . . . . . . . . . . . 51
Table 19 Whistleblowers' Perceptions of Stigma Attached to Whistleblowing byWhether Negative Actions Were Experienced . . . . . . . . . . . . . . . . . . . . . . . . . . . . . . . . . 52
Table 20 Whistleblowers' Willingness to Blow the Whistle Again byWhether Negative Actions Were Experienced . . . . . . . . . . . . . . . . . . . . . . . . . . . . . . . . . 54
1
1. Background and Purpose of the Project
Uncovering misconduct in science, like misconduct in other areas of industry and governmentactivities, often depends on the willingness of those aware of or suspecting misconduct to report it. Uncovering such misconduct is generally recognized to be of significant value to society and to the integrityof scientific research. However, the willingness of individuals to allege misconduct is likely to depend onhow the system deals with and protects them when they come forth with their allegations. Potentialwhistleblowers must consider whether the allegation will be taken seriously and the report treatedconfidentially and whether reporting will provoke retaliation not only from those accused but also from thelarger academic and scientific community.
a. Empirical Evidence
There is some empirical evidence, as well as a substantial number of anecdotal reports, to suggestthat students and faculty engaged in scientific research are, or feel they are, vulnerable to retaliation if theyreport misconduct on the part of their students, peers, or teachers. For example, a recent paper inAmerican Scientist (Swazey, Anderson, and Louis, 1993), reported a survey dealing, in part, with this topic. The survey was conducted by mail with 2000 doctoral candidates and 2000 of their faculty across 99graduate departments in four disciplines -- chemistry, civil engineering, microbiology, and sociology. Thesurvey asked both students and faculty: "Could you report cases of suspected misconduct (a) by a facultymember [or] (b) by a graduate student in your department without expecting retaliation?" The resultssuggest that substantial numbers of both students and faculty share the perception that they would probablyor definitely risk retaliation from a whistleblowing incident, although students were more likely (53 percent)than faculty (26 percent) to feel vulnerable to retaliation. The authors also report that faculty reportedfeeling safer in reporting a graduate student than in reporting another faculty member, with 60 percentfeeling safe in reporting a student but only 35 percent feeling safe in reporting a colleague. Other findingsincluded greater perceived vulnerability of junior than senior faculty and of those who reported observing acase of misconduct than of those who had not.
This study also asked interviewees about their exposure to misconduct in science and other types ofmisconduct. The most noteworthy finding is that six to nine percent of both students and faculty reportdirect knowledge of plagiarism or falsification by faculty. Since the number of allegations of misconduct ismuch smaller than this, these data suggest that substantial numbers of instances of misconduct gounreported -- as would be expected given the level of concerns about retaliation voiced by those surveyed.
This study dealt with self-reports and beliefs of a cross section of students and faculty in the selecteddepartments. While it reported on their observations of misconduct and their beliefs about potentialretaliation if they were to blow the whistle, it did not provide empirical information on the extent to whichactual whistleblowers experience retaliation.
Another study published in the same year (U.S. Merit Systems Protection Board, 1993), althoughfocused on a much broader range of misconduct by government employees than just scientific misconduct,went well beyond perceptions of the propensity to report and feelings of vulnerability. It collectedinformation from over 13,000 government employees to examine the extent of exposure to misconduct, theextent to which those exposed reported the misconduct, the reasons why some did not report, and whathappened to those who did. Key findings from this study included the following:
2
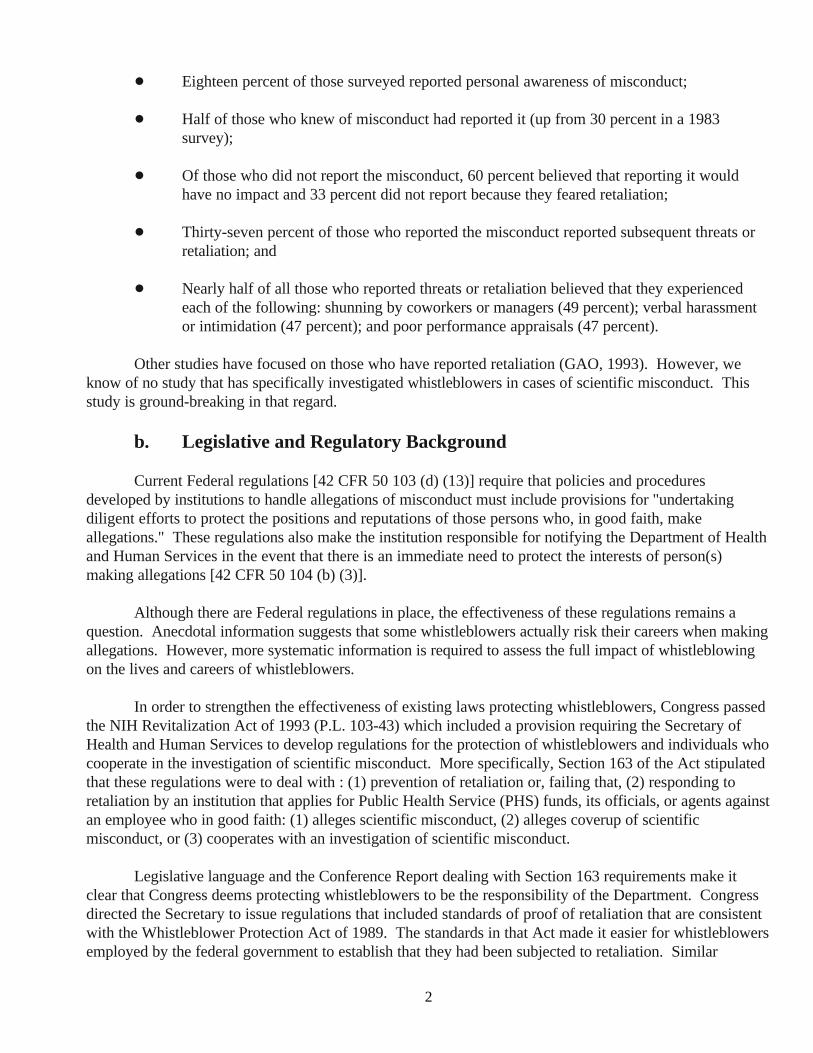
! Eighteen percent of those surveyed reported personal awareness of misconduct;
! Half of those who knew of misconduct had reported it (up from 30 percent in a 1983survey);
! Of those who did not report the misconduct, 60 percent believed that reporting it wouldhave no impact and 33 percent did not report because they feared retaliation;
! Thirty-seven percent of those who reported the misconduct reported subsequent threats orretaliation; and
! Nearly half of all those who reported threats or retaliation believed that they experiencedeach of the following: shunning by coworkers or managers (49 percent); verbal harassmentor intimidation (47 percent); and poor performance appraisals (47 percent).
Other studies have focused on those who have reported retaliation (GAO, 1993). However, weknow of no study that has specifically investigated whistleblowers in cases of scientific misconduct. Thisstudy is ground-breaking in that regard.
b. Legislative and Regulatory Background
Current Federal regulations [42 CFR 50 103 (d) (13)] require that policies and proceduresdeveloped by institutions to handle allegations of misconduct must include provisions for "undertakingdiligent efforts to protect the positions and reputations of those persons who, in good faith, makeallegations." These regulations also make the institution responsible for notifying the Department of Healthand Human Services in the event that there is an immediate need to protect the interests of person(s)making allegations [42 CFR 50 104 (b) (3)].
Although there are Federal regulations in place, the effectiveness of these regulations remains aquestion. Anecdotal information suggests that some whistleblowers actually risk their careers when makingallegations. However, more systematic information is required to assess the full impact of whistleblowingon the lives and careers of whistleblowers.
In order to strengthen the effectiveness of existing laws protecting whistleblowers, Congress passedthe NIH Revitalization Act of 1993 (P.L. 103-43) which included a provision requiring the Secretary ofHealth and Human Services to develop regulations for the protection of whistleblowers and individuals whocooperate in the investigation of scientific misconduct. More specifically, Section 163 of the Act stipulatedthat these regulations were to deal with : (1) prevention of retaliation or, failing that, (2) responding toretaliation by an institution that applies for Public Health Service (PHS) funds, its officials, or agents againstan employee who in good faith: (1) alleges scientific misconduct, (2) alleges coverup of scientificmisconduct, or (3) cooperates with an investigation of scientific misconduct.
Legislative language and the Conference Report dealing with Section 163 requirements make itclear that Congress deems protecting whistleblowers to be the responsibility of the Department. Congressdirected the Secretary to issue regulations that included standards of proof of retaliation that are consistentwith the Whistleblower Protection Act of 1989. The standards in that Act made it easier for whistleblowersemployed by the federal government to establish that they had been subjected to retaliation. Similar
ORI Newsletter, Vol. 3, No. 2, pp. 1-2, March 19951
3
regulations, Congress presumed, can offer better protection to those involved in PHS scientific misconductcases outside government employment.
The NIH Revitalization Act of 1993 also created a Commission on Research Integrity which wasestablished in March, 1994 to make recommendations to the Secretary and Congress on how the PHSshould deal with research misconduct in federally-funded research. In an interim report released in January1995, the Commission identified three problem areas on which their recommendations aimed at ensuring theresponsible conduct of research will focus: (1) the definition of research misconduct, (2) the lack ofinstitutional standards for good research practices, and (3) retaliation against whistleblowers. 1
Congressional hearings and the mandate for additional regulation and protection for whistleblowerspresume that earlier regulations were not sufficient to protect whistleblowers. As the evidence reviewedabove and anecdotal information suggest, there may be cases in which whistleblowers have been retaliatedagainst under current regulations. The principal purpose of this study was to determine in a moresystematic way what types of actions were taken following allegations, what the direct outcomes of theseactions were, and what benefits were gained or what retaliation has been suffered by which whistleblowers,under various circumstances. This will in turn help ORI and the Commission meet their mandates tomonitor what happens to whistleblowers, to develop a system for on-going monitoring, and to continue toimprove regulations to target the types of abuses that have already occurred.
c. Purpose of This Study
As part of this overall comprehensive effort to examine research practices, The "Study of theConsequences of Whistleblowing for the Whistleblower in Misconduct in Science Cases" attempted tocontact and interview by mail those individuals listed in the Office of Research Integrity (ORI) files ashaving made allegations of scientific misconduct. Only individuals involved in closed cases were contactedfor the study. The study was intended to provide an empirical base for consideration of the consequencesexperienced by whistleblowers in varying positions within the scientific community and thus, act as a sourceto inform the efforts of both the Commission on Research Integrity and ORI staff.
The aim of the study was to collect data on what types of actions were experienced bywhistleblowers during and after their allegation, how these actions impacted their personal and professionallives, and to gather more detail about the circumstances of the allegation (i.e. the relationship to theaccused, the type of allegation, the outcome of the allegation and the amount of publicity which it received,etc.). In addition to reporting on the specific consequences and larger impacts of whistleblowing onwhistleblowers, we have also sought to understand the circumstances in which whistleblowers are more orless likely to suffer adverse consequences of their act. Such findings should prove helpful in identifyingcircumstances requiring particular vigilance on the part of ORI and institutions supported with PHS funds. Due to the small number of cases involved, the study must be considered primarily a descriptive workalthough it does, for the first time, produce some statistical data on the perceived consequences of allegingmisconduct in scientific research.
This report does not analyze those open-end items but is focused instead on quantitative analysis of fixed-response items.2
In this report, we use the terms complainant and whistleblower interchangeably. In every case we mean to denote a person who has made3
an allegation of scientific misconduct.
4
2. Study Methods
a. Instrument Contents
Prior to awarding a contract to the Research Triangle Institute (RTI) in August, 1993, ORI haddeveloped a draft instrument for a small pretest. RTI efforts concentrated primarily on making the existingsurvey easier for whistleblowers to complete on their own by formatting question and answer categories. We tried to make certain that wording of the questions was clear and the intent of each question wasunambiguous. The only substantial additions to the instrument content were a series of three open-endedquestions, appended to the fixed-response items included in the instrument, which allowed whistleblowersto give personal accounts of their experiences and advice to other potential whistleblowers. A copy of the2
full survey instrument plus letters used to obtain contact information and solicit participation appear inAppendix A.
b. Data Collection
Data collection was carried out in two phases. First, we used information from ORI's files to locateas many whistleblowers as possible and to obtain up-to-date mailing addresses. Second, we implementedthe Whistleblower Survey.
Database Preparation and Advance Mailing. The following pieces of information were availablefor each name in the closed case file delivered by ORI:
! the ORI case reference number consisting of the year the allegation was made known to ORIand a sequential number;
! the name of the institution where the alleged misconduct occurred;
! the name of the complainant (whistleblower) ;3
! the work address and telephone number (if available) of the complainant at the time thealleged misconduct was reported;
! the home address and telephone number (if available) of the complainant at the time thealleged misconduct was reported;
! whether the case involved an investigation or an inquiry (some cases had a delineation of"not" in this data field and were classified as "unknown, not pursued" as regards their levelof inquiry/investigation);
! whether the report was made to the institution or directly to ORI; and
5
! the outcome of the case.
We created a database from this information and used it as the foundation for a control system forthe initial address verification mailing and the full mail survey.
The advance contact effort consisted of three phases--two mailings and a followup telephone call--inan attempt to locate a valid address to send the questionnaire. Each successive phase occurred 4-6 weeksapart, in order to allow time for whistleblowers to respond.
We conducted telephone tracing on the cases which had not responded to our two mailings. If thewhistleblower was no longer at the location and/or telephone number listed, we made inquiries in anattempt to locate the individual. After exhausting all data available about the missing individual, weattempted to use data about other whistleblowers in the database in order to facilitate the search for theremaining unconfirmed addressees. In a few instances, this proved successful. Former colleagues were ableto direct us either to the whistleblower or to someone who might know the whistleblower's whereabouts. After several months of such tracing efforts, we were able to obtain current addresses for 104 of the 127(82 percent) of the original group.
Survey Administration. The survey administration component of the study began with mailout ofa survey packet which included a cover letter, questionnaire and pre-stamped return envelope to all personsin the data file for whom we were able to confirm an address. We sent out a total of 105 survey packages,including one to a person who notified us that he was a whistleblower whose case was closed who shouldhave been included in our study.
Using a database compiled from updated address information, we generated labels and sent surveypackets to the address preference indicated by the whistleblower during the address verification activities. A total of 38 packets were sent out to home addresses and 67 packets to work addresses in the first roundof mailing. The survey cover letter requested return of the completed questionnaire within two weeks ofreceipt. As expected, the address information collected in the initial phase facilitated delivery of the surveyquestionnaires. Only one packet of the initial 105 was returned due to invalid address. Further results ofthe mailout are discussed in section 3 when we review the response rates and representativeness of thecompleted surveys.
Four weeks after mailing the questionnaires, we made a reminder call to each individual who hadnot responded. We made calls to the telephone numbers for the addresses used in the mailing (i.e. if thepreferred address for mailing was the residence, followup was made to the whistleblower's home). Forwhistleblowers who preferred to be contacted at home, we left messages on answering machines explainingthe nature of the call. However, if after multiple attempts, we were unable to reach a whistleblower usingthe preferred location, we attempted to reach him/her at the alternate location if one was available. Throughthis initial round of reminder calls we determined:
! Whether the address was current for the whistleblower;
! Whether the survey arrived at the address; and
! Whether the whistleblower planned to return the survey.
6
Our reminder calls urged individuals to return the completed questionnaire. Using the script shownin Appendix B, the caller explained the nature of the survey and asked whether the questionnaire wasreceived. If it was not, we verified the address and name and sent a replacement immediately. If the surveywas received but completion was delayed, the caller urged the individual to return it as soon as possible. Many whistleblowers were inclined to complete and return the questionnaire once reminded of theimportance of the information they would provide.
Approximately five weeks after initial distribution, we sent a second survey packet to those fromwhom we had not received a completed questionnaire, with a slightly amended cover letter. The letterreferenced the previous mailing and urged the person to complete and return the enclosed formimmediately.
Two weeks after the second mailing, we began another series of telephone calls to those who hadnot responded. Many of those contacted said that they had already returned the completed survey. In allbut 1 case, the surveys arrived for those who reported them as having been returned.
Through the efforts described above, we received a response from 89 members of the studypopulation included in the survey mailout component, with completed interviews from 68 eligible finalizedcases. We describe the results of our recruitment effort in more detail in the next section. Specifically, wepresent the results of all these contacts and discuss the response rate and representativeness of the surveysreturned to us for analysis. Then we turn to a more substantive review of what the survey indicates aboutthe consequences of whistleblowing for the whistleblower.
c. Analyses
Before turning to the analyses of response rates and more substantive findings, several points aboutour survey design and analytic approach are worth noting. First, we selected the entire universe of cases inORI's file for study, we did not select a sample. Technically, this is a census and not a sample survey. Inaddition, in discussions with ORI, it has been clear that the closed cases in their files are not representativeof a larger set of cases. They simply represent the set of closed cases about which ORI is knowledgeable. Because we attempted to complete surveys with every person in the ORI file and because there is no basisfor extrapolating the results of this survey to some larger universe of cases, the typical statistical tests ofsignificance and estimates of standard errors of estimate that we normally apply to sample survey data areinappropriate in this study. Rather, we can simply take the data reported as descriptive information about aconveniently available set of whistleblowers. The differences that appear in the data are the real differencesthat exist in this population -- no significance tests are needed to assure that the differences were not due torandom error. Rather, only the practical question remains -- how big a difference should be consideredmeaningful? The answer to this is more political than scientific and is really the questions of how big adifference would make ORI, or the scientific community generally, want to change its policies andprocedures. In most cases, we have discussed differences only when they exceeded 10 percent and we havedrawn major conclusions only when the differences are substantially larger than this.
The analyses in this report represent a first cut through the data. They are descriptive and largelycross-tabulations of one variable or one set of variables with another. More complex multivariatetechniques could be used to define measures empirically or try to better understand possible causalconnections in the data. However, these techniques will be of limited use with this dataset due to therelatively small number of observations (N=68) in this dataset. In one sense, this study represents a large

7
case study of a set of whistleblowers. There is an extensive set of information about each whistleblower inthe study and we have explored some of the major relationships among these factors in this report. Whilewe cannot make strong inferences from the data in this report, they represent the best information availableto date on the consequences of whistleblowing for the whistleblower in cases of scientific misconduct. At aminimum, they provide the basis for formulating a set of hypotheses that others might explore in additionalstudies or in additional analyses of this dataset.
The numbers in the table, 105 and 128, respectively, each include one whistleblower who heard about the study, decided that he belonged4
in the study and to whom we sent a survey instrument (after conferring with ORI).
8
3. Analysis of Survey Response Rate
Before turning to the descriptive analyses that are the heart of this final report, it is important toanswer the following two questions:
! What was the response rate to the Whistleblower Survey?
! Do those who completed the survey appear to represent the full set of cases of interest toORI?
To address these two questions, we used a combination of information about cases derived from ORI's casefiles and the results of our survey mailings and other contacts.
a. Overall Response Rates
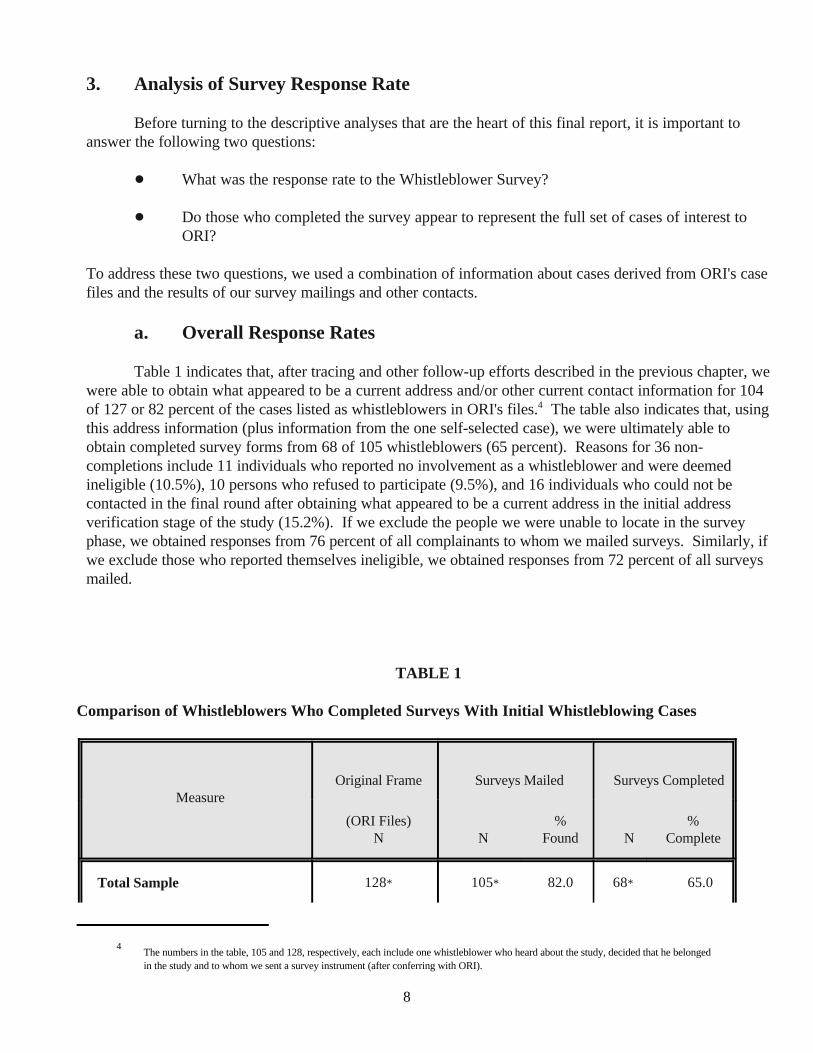
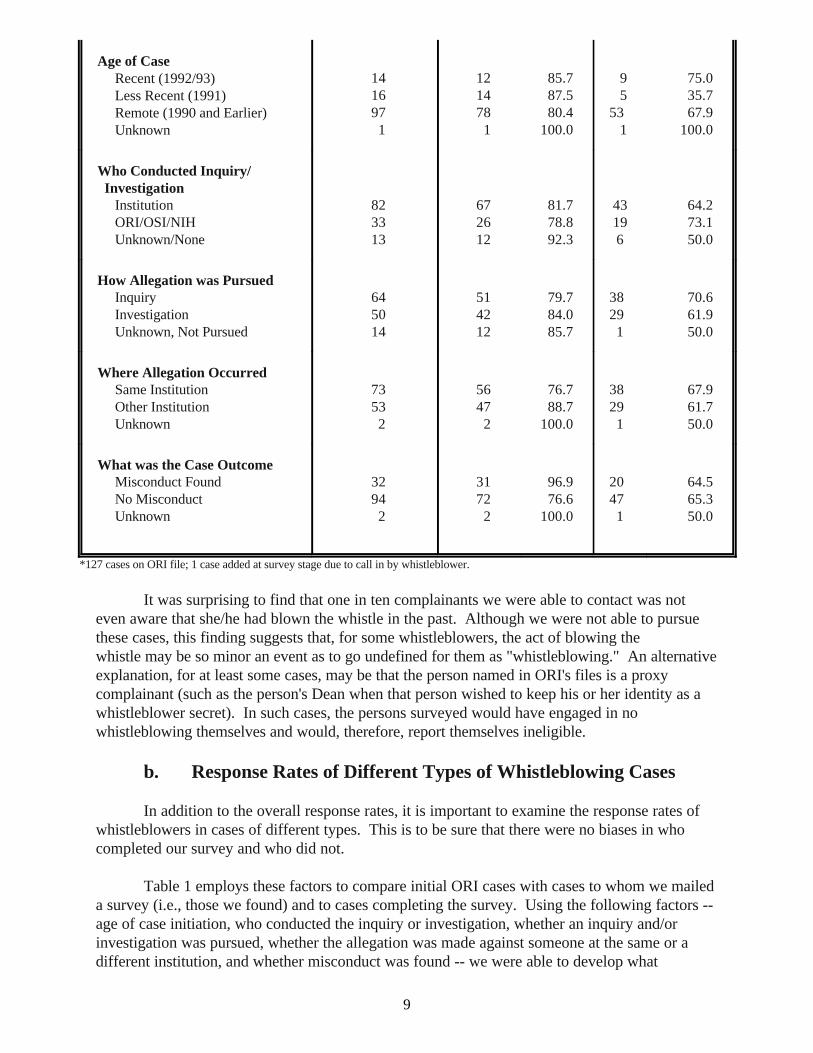
Table 1 indicates that, after tracing and other follow-up efforts described in the previous chapter, we were able to obtain what appeared to be a current address and/or other current contact information for 104of 127 or 82 percent of the cases listed as whistleblowers in ORI's files. The table also indicates that, using4
this address information (plus information from the one self-selected case), we were ultimately able toobtain completed survey forms from 68 of 105 whistleblowers (65 percent). Reasons for 36 non-completions include 11 individuals who reported no involvement as a whistleblower and were deemedineligible (10.5%), 10 persons who refused to participate (9.5%), and 16 individuals who could not becontacted in the final round after obtaining what appeared to be a current address in the initial addressverification stage of the study (15.2%). If we exclude the people we were unable to locate in the surveyphase, we obtained responses from 76 percent of all complainants to whom we mailed surveys. Similarly, ifwe exclude those who reported themselves ineligible, we obtained responses from 72 percent of all surveysmailed.
TABLE 1
Comparison of Whistleblowers Who Completed Surveys With Initial Whistleblowing Cases
MeasureOriginal Frame Surveys Mailed Surveys Completed
(ORI Files) % %N N Found N Complete
Total Sample 128* 105* 82.0 68* 65.0
9
Age of Case Recent (1992/93) Less Recent (1991) Remote (1990 and Earlier) Unknown
14 12 85.7 9 75.016 14 87.5 5 35.797 78 80.4 53 67.9 1 1 100.0 1 100.0
Who Conducted Inquiry/ Investigation Institution 82 67 81.7 43 64.2 ORI/OSI/NIH 33 26 78.8 19 73.1 Unknown/None 13 12 92.3 6 50.0
How Allegation was Pursued Inquiry 64 51 79.7 38 70.6 Investigation 50 42 84.0 29 61.9 Unknown, Not Pursued 14 12 85.7 1 50.0
Where Allegation Occurred Same Institution 73 56 76.7 38 67.9 Other Institution 53 47 88.7 29 61.7 Unknown 2 2 100.0 1 50.0
What was the Case Outcome Misconduct Found 32 31 96.9 20 64.5 No Misconduct 94 72 76.6 47 65.3 Unknown 2 2 100.0 1 50.0
*127 cases on ORI file; 1 case added at survey stage due to call in by whistleblower.
It was surprising to find that one in ten complainants we were able to contact was noteven aware that she/he had blown the whistle in the past. Although we were not able to pursuethese cases, this finding suggests that, for some whistleblowers, the act of blowing thewhistle may be so minor an event as to go undefined for them as "whistleblowing." An alternativeexplanation, for at least some cases, may be that the person named in ORI's files is a proxycomplainant (such as the person's Dean when that person wished to keep his or her identity as awhistleblower secret). In such cases, the persons surveyed would have engaged in nowhistleblowing themselves and would, therefore, report themselves ineligible.
b. Response Rates of Different Types of Whistleblowing Cases
In addition to the overall response rates, it is important to examine the response rates ofwhistleblowers in cases of different types. This is to be sure that there were no biases in whocompleted our survey and who did not.
Table 1 employs these factors to compare initial ORI cases with cases to whom we maileda survey (i.e., those we found) and to cases completing the survey. Using the following factors --age of case initiation, who conducted the inquiry or investigation, whether an inquiry and/orinvestigation was pursued, whether the allegation was made against someone at the same or adifferent institution, and whether misconduct was found -- we were able to develop what
10
appeared to be good contact information for at least three-fourths of all cases of every type. Although some of the differences are small, the middle columns indicate that it was relativelymore difficult to find complainants when: (1) no misconduct was found (we found 77 percent ofthese versus 97 percent of those for whom misconduct was found); (2) the complainant and theaccused were at the same institution (we found 77 percent as compared to 89 percent when theywere at different institutions); (3) the case was pursued by a federal source (we found 79 percentcompared to 82 percent of those whose cases were handled by their institution); or (4) the casereached only an inquiry stage (we found 80 percent compared to 84 percent for cases that reachedthe investigation stage). The easiest cases to find were those in which misconduct was found.
Ignoring the few cases in which the information was incomplete and coded "unknown"and the case which self-referred into the study, the percent of complainants who completedsurveys mailed to them varied from 62 to 75 percent with one exception. Only 36 percent ofcomplainants who initiated cases in 1991 completed the survey, a finding that does not fit withcompletion rates of 75 and 68 percent for more recent and more remote cases, respectively.
Although not shown in this table, the percent of completed surveys in each categoryappears to strongly resemble those in the initial set of cases. The only difference of note is thatwe were able to obtain completed surveys from a higher proportion of cases handled by ORI,OSI, and NIH than of cases dealt with at the institutional level because we apparently had bettercontact information for them than for other cases. All things considered, it appears reasonable toreport information from those who completed the survey to represent all ORI cases.
Before leaving ORI's data, it is important to note a few key features of the cases weselected to examine. First, most of the cases in our study, were initiated before 1990. Second,most of our cases (43 of 68 or 63 percent) were investigated by the institutions themselves andnot by ORI or its predecessors. Although there were more cases that involved only inquiries thancases that involved investigations, there were a substantial number of cases of both types in oursample. Surprisingly, both the ORI files and our sample include a significant number ofcomplainants who were from an institution other than the one where the accused was located atthe time of the allegation. Finally, and quite significantly, in roughly seven-in-ten cases there wasno finding of misconduct. Thus, a large proportion of the whistleblowers in our study madeallegations that were not substantiated by subsequent inquiries or investigations.
c. Who Are the Whistleblowers Included In This Survey?
In addition to knowing that a sufficient number of complainants who resemble those inORI's files completed the survey, our ability to interpret the data depends on our more detailedknowledge of who it is we actually surveyed. For this purpose, we turn to the information in thesurvey.
Given the lack of variation on some measures (e.g., holding a doctoral degree or being employed full time), we excluded such items as5
analytic factors in most later tables.
In the survey questionnaire, we asked whistleblowers to check all positions they held at the time of the whistleblowing incident. Someone6
could report being a department chair and a lab chief. To avoid double counting in this item, we recoded the set of responses in asequential fashion. A whistleblower who check senior administrator was coded as a senior administrator regardless of anything elsechecked. A whistleblower who checked department chair//head, was coded as such unless he or she had checked senior administrator --again regardless of anything else he or she might have checked. This same logic continued through the remainder of the subcategories.
11
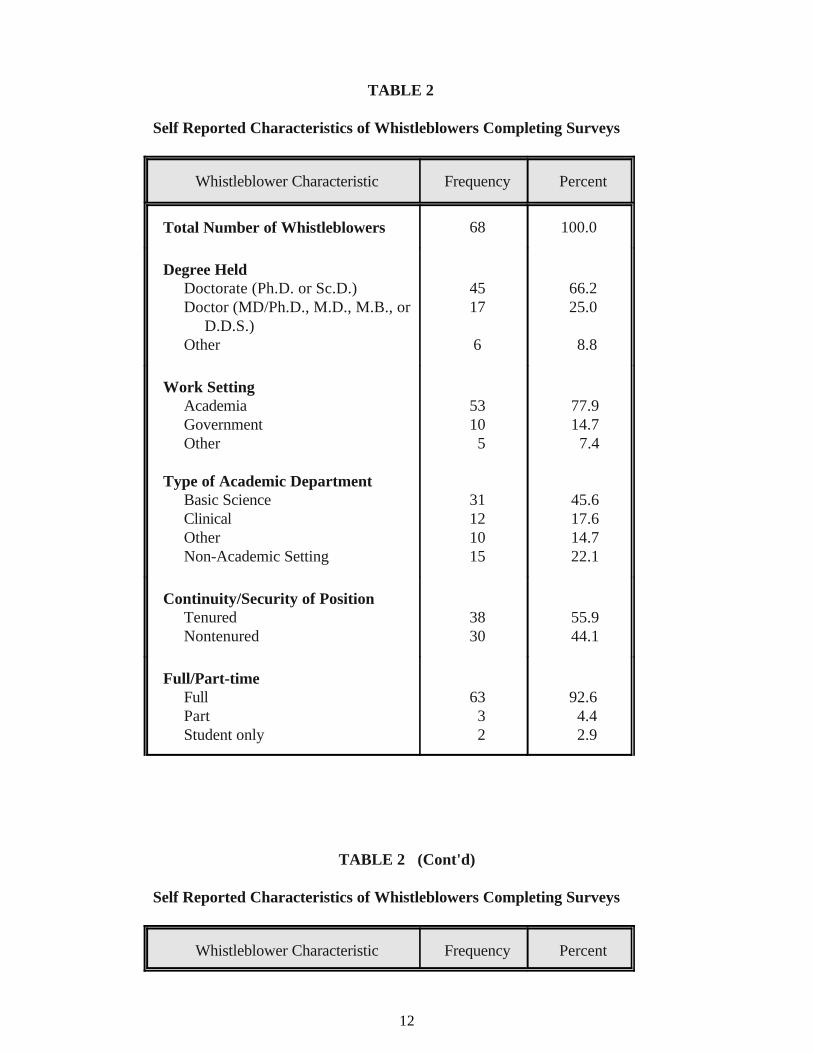
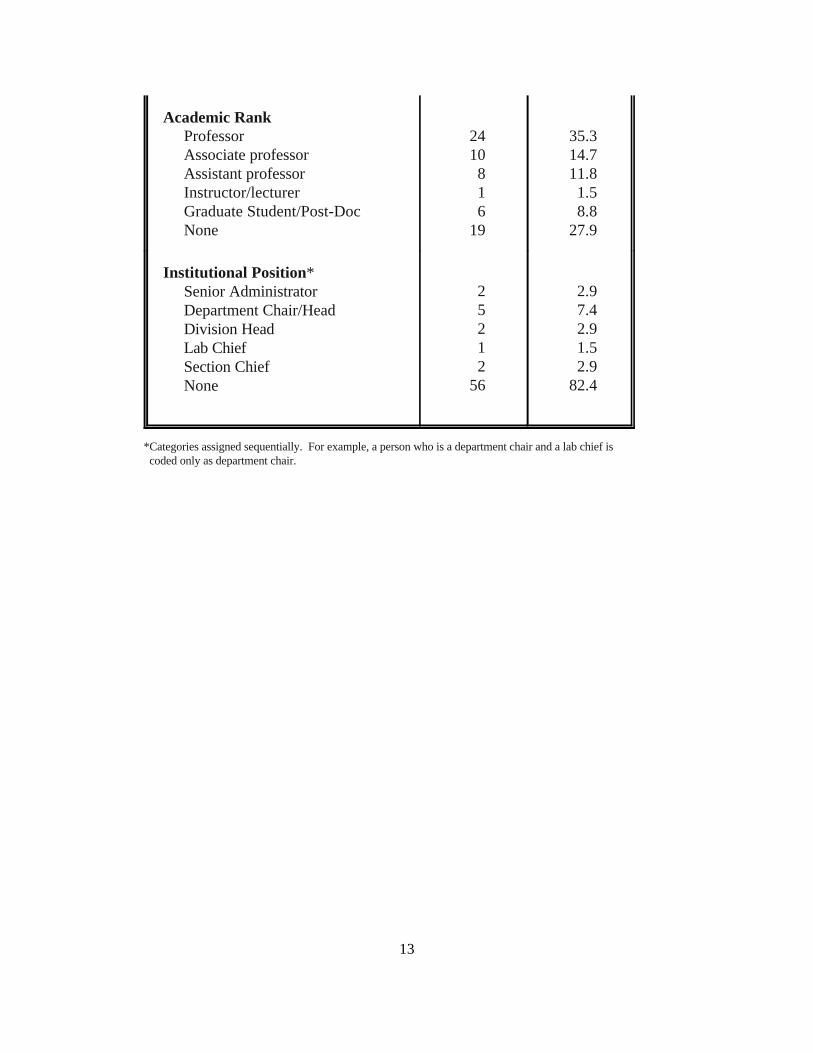
Table 2 is based on survey data and indicates that, at the time of the allegation, (1) the vastmajority (91%) of complainants held doctoral level degrees; (2) more than 3 in 4 (78%) worked5
in academic settings and that most of the others worked for the government (15%); (3) of the 53whistleblowers who worked in academic settings, 31, roughly 3 in 5, were in basic scienceprograms while the remainder were split between clinical and other programs; (4) about half ofthe complaints (56%) held tenured positionsand almost all (93%) worked full time; (5) just overone-third of complaints (35%) were full professors, 28 percent held other academic ranks, fewerthan one-in-ten (9%) were post-doctoral or graduate students, and the remainder (28%) held noacademic rank; and (6) relatively few complainants (just 18%) held an administrative ormanagement position.6
12
TABLE 2
Self Reported Characteristics of Whistleblowers Completing Surveys
Whistleblower Characteristic Frequency Percent
Total Number of Whistleblowers 68 100.0
Degree Held Doctorate (Ph.D. or Sc.D.) 45 66.2 Doctor (MD/Ph.D., M.D., M.B., or 17 25.0 D.D.S.) Other 6 8.8
Work Setting Academia 53 77.9 Government 10 14.7 Other 5 7.4
Type of Academic Department Basic Science 31 45.6 Clinical 12 17.6 Other 10 14.7 Non-Academic Setting 15 22.1
Continuity/Security of Position Tenured 38 55.9 Nontenured 30 44.1
Full/Part-time Full 63 92.6 Part 3 4.4 Student only 2 2.9
TABLE 2 (Cont'd)
Self Reported Characteristics of Whistleblowers Completing Surveys
Whistleblower Characteristic Frequency Percent
13
Academic Rank Professor 24 35.3 Associate professor 10 14.7 Assistant professor 8 11.8 Instructor/lecturer 1 1.5 Graduate Student/Post-Doc 6 8.8 None 19 27.9
Institutional Position* Senior Administrator Department Chair/Head Division Head Lab Chief Section Chief None
2 2.9 5 7.4 2 2.9 1 1.5 2 2.956 82.4
*Categories assigned sequentially. For example, a person who is a department chair and a lab chief is coded only as department chair.
We also asked a question about positive outcomes of whistleblowing, such as commendations or other forms of recognition. However, only7
one person checked any of the categories included in this list and four more reported single positive outcomes -- being thanked (2 people),not being terminated (1 person), and getting a new position ( 1 person). Consequently, we did not analyze this information further.
14
4. Findings: Consequences of Whistleblowing for the Whistleblower
The primary purpose of this study was to identify the consequences whistleblowersexperience as a result of blowing the whistle. An important secondary purpose was to see if andhow the particular characteristics of the whistleblowers, their allegations, the ways in which theirallegations were handled, or the outcomes of their allegations help explain the consequences theyexperienced and, as a result, serve as guides for the formulation of regulatory development.
a. Specific Consequences of Blowing the Whistle
We asked whistleblowers in our survey to tell us which, if any, of a list of negativeoutcomes they experienced either during the whistleblowing incident or afterward. The listincluded a total of 15 possible negative actions such as being fired, being denied a promotion,experiencing a loss of research support, or being pressured to drop the allegation.7
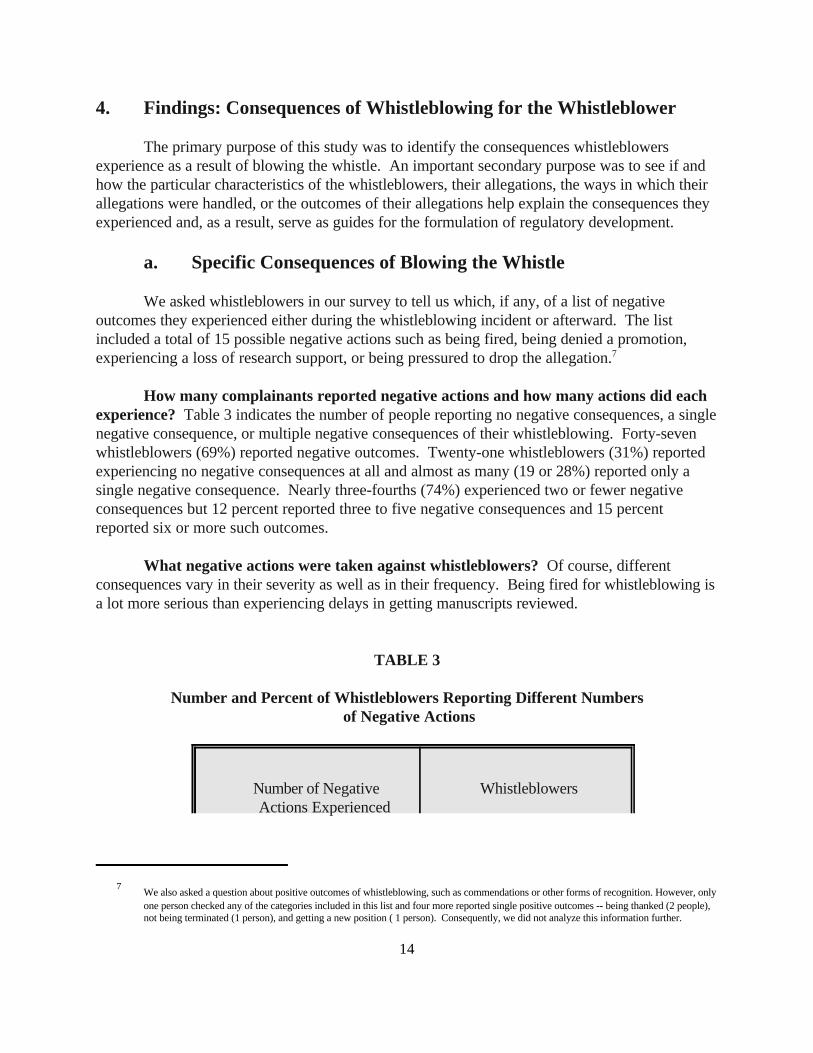
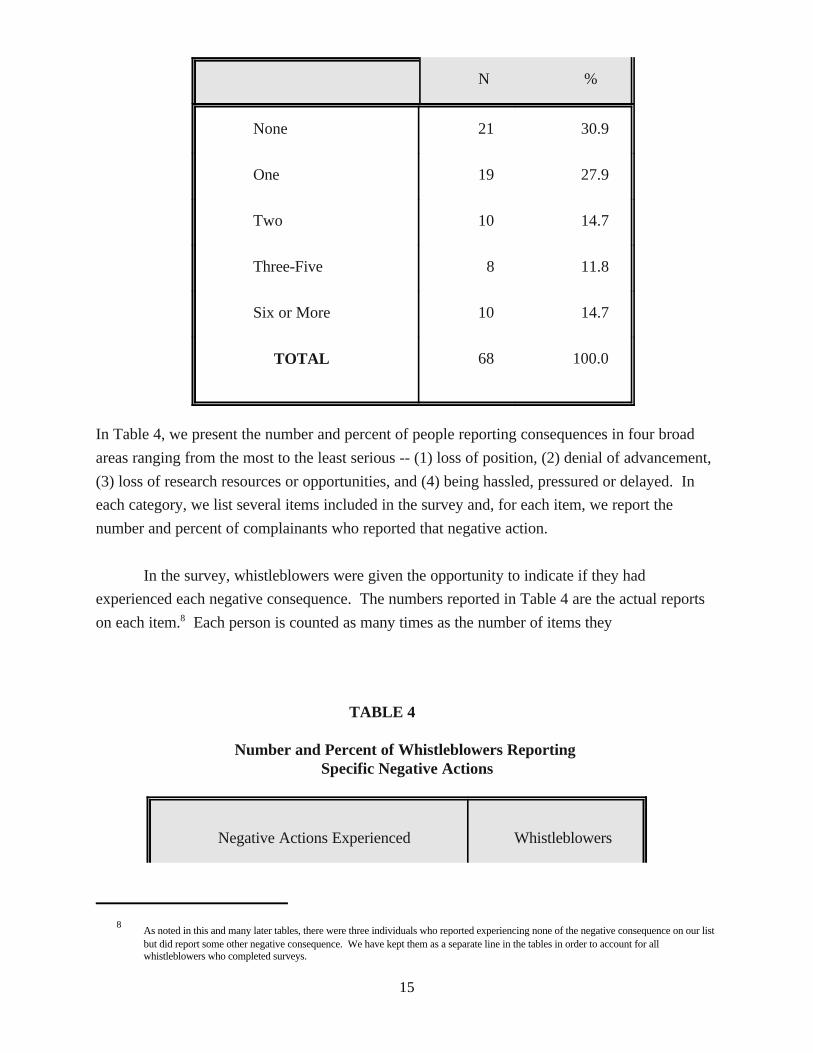
How many complainants reported negative actions and how many actions did eachexperience? Table 3 indicates the number of people reporting no negative consequences, a singlenegative consequence, or multiple negative consequences of their whistleblowing. Forty-sevenwhistleblowers (69%) reported negative outcomes. Twenty-one whistleblowers (31%) reportedexperiencing no negative consequences at all and almost as many (19 or 28%) reported only asingle negative consequence. Nearly three-fourths (74%) experienced two or fewer negativeconsequences but 12 percent reported three to five negative consequences and 15 percentreported six or more such outcomes.
What negative actions were taken against whistleblowers? Of course, differentconsequences vary in their severity as well as in their frequency. Being fired for whistleblowing isa lot more serious than experiencing delays in getting manuscripts reviewed.
TABLE 3
Number and Percent of Whistleblowers Reporting Different Numbers of Negative Actions
Number of Negative Whistleblowers Actions Experienced
As noted in this and many later tables, there were three individuals who reported experiencing none of the negative consequence on our list8
but did report some other negative consequence. We have kept them as a separate line in the tables in order to account for allwhistleblowers who completed surveys.
15
N %
None 21 30.9
One 19 27.9
Two 10 14.7
Three-Five 8 11.8
Six or More 10 14.7
TOTAL 68 100.0
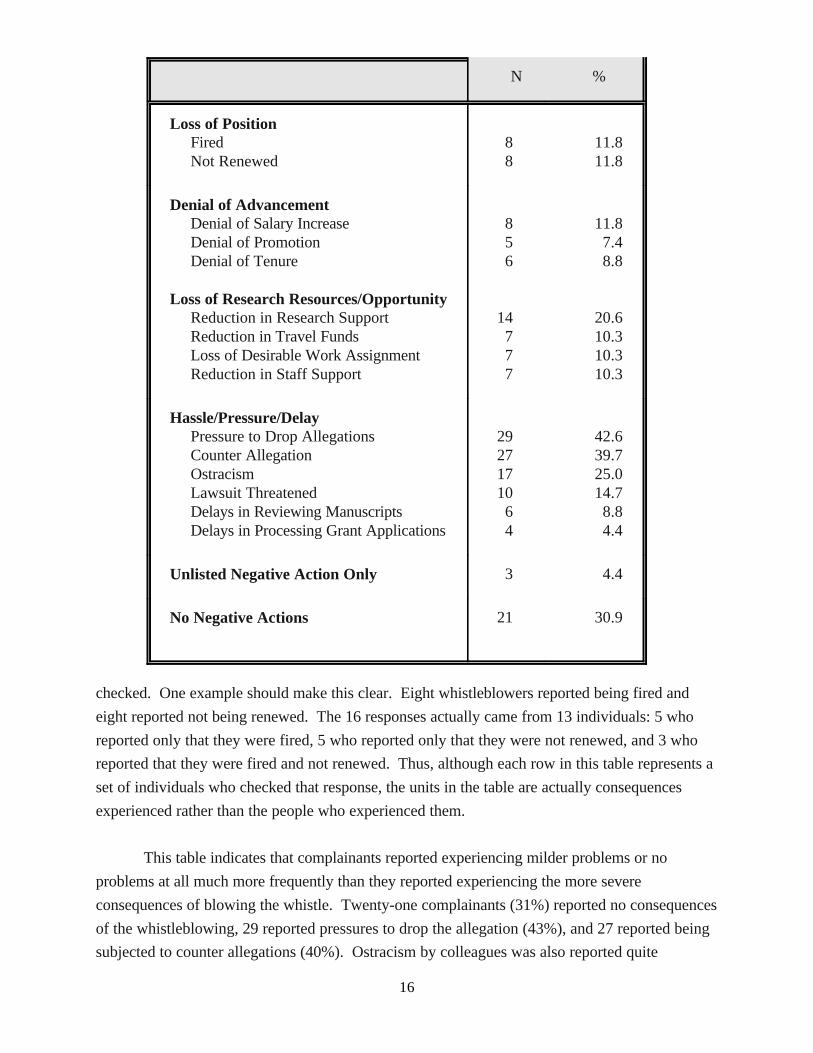
In Table 4, we present the number and percent of people reporting consequences in four broad
areas ranging from the most to the least serious -- (1) loss of position, (2) denial of advancement,
(3) loss of research resources or opportunities, and (4) being hassled, pressured or delayed. In
each category, we list several items included in the survey and, for each item, we report the
number and percent of complainants who reported that negative action.
In the survey, whistleblowers were given the opportunity to indicate if they had
experienced each negative consequence. The numbers reported in Table 4 are the actual reports
on each item. Each person is counted as many times as the number of items they 8
TABLE 4
Number and Percent of Whistleblowers Reporting Specific Negative Actions
Negative Actions Experienced Whistleblowers
16
N %
Loss of Position Fired 8 11.8 Not Renewed 8 11.8
Denial of Advancement Denial of Salary Increase 8 11.8 Denial of Promotion 5 7.4 Denial of Tenure 6 8.8
Loss of Research Resources/Opportunity Reduction in Research Support 14 20.6 Reduction in Travel Funds 7 10.3 Loss of Desirable Work Assignment 7 10.3 Reduction in Staff Support 7 10.3
Hassle/Pressure/Delay Pressure to Drop Allegations 29 42.6 Counter Allegation 27 39.7 Ostracism 17 25.0 Lawsuit Threatened 10 14.7 Delays in Reviewing Manuscripts 6 8.8 Delays in Processing Grant Applications 4 4.4
Unlisted Negative Action Only 3 4.4
No Negative Actions 21 30.9
checked. One example should make this clear. Eight whistleblowers reported being fired and
eight reported not being renewed. The 16 responses actually came from 13 individuals: 5 who
reported only that they were fired, 5 who reported only that they were not renewed, and 3 who
reported that they were fired and not renewed. Thus, although each row in this table represents a
set of individuals who checked that response, the units in the table are actually consequences
experienced rather than the people who experienced them.
This table indicates that complainants reported experiencing milder problems or no
problems at all much more frequently than they reported experiencing the more severe
consequences of blowing the whistle. Twenty-one complainants (31%) reported no consequences
of the whistleblowing, 29 reported pressures to drop the allegation (43%), and 27 reported being
subjected to counter allegations (40%). Ostracism by colleagues was also reported quite

In interpreting these findings, it is important to remember that people often report more than one negative outcome (see Table 3). For9
example, a total of 40 whistleblowers reported one or more negative actions listed under hassle, pressure or delay.
17
commonly, with 17 complainants (25%) reporting such treatment. It is important to remember9
(see Table 3) that people often report more than one negative outcome. A total of 40
whistleblowers reported one or more negative actions listed under hassle, pressure or delay.
Unfortunately, a small but significant proportion of complainants reported very serious
consequences of their whistleblowing. At least ten percent of complainants reported each of the
following: 8 whistleblowers (12%) reported being fired, not being renewed, and/or being denied
salary increases, 14 reported losing research support (21%), and 7 whistleblowers (10%) reported
losing staff support and/or receiving less desirable work assignments. Again, it is important to
keep in mind that these are often the same people. In fact, just 20 whistleblowers are responsible
for all 70 consequences reported under the top three headings in this table.
On the one hand, these findings refute the notion that every whistleblower suffers
substantial negative consequences. On the other, they confirm that whistleblowers frequently
face the prospect of significant hardship for their efforts. A substantial proportion suffer at least
some difficulties as a result of blowing the whistle and a sizeable group suffers devastating
consequences such as losing their jobs.
Just knowing the extent of the problem, while extremely important, is insufficient
information to help fashion more effective approaches for protecting whistleblowers. Instead, it is
valuable to examine other information in this survey to try to determine which whistleblowers are
hurt the most and in what circumstances. Such information will help ORI to tailor appropriate
regulations and enforcement procedures and to target them on situations most likely to result in
difficulties for complainants.
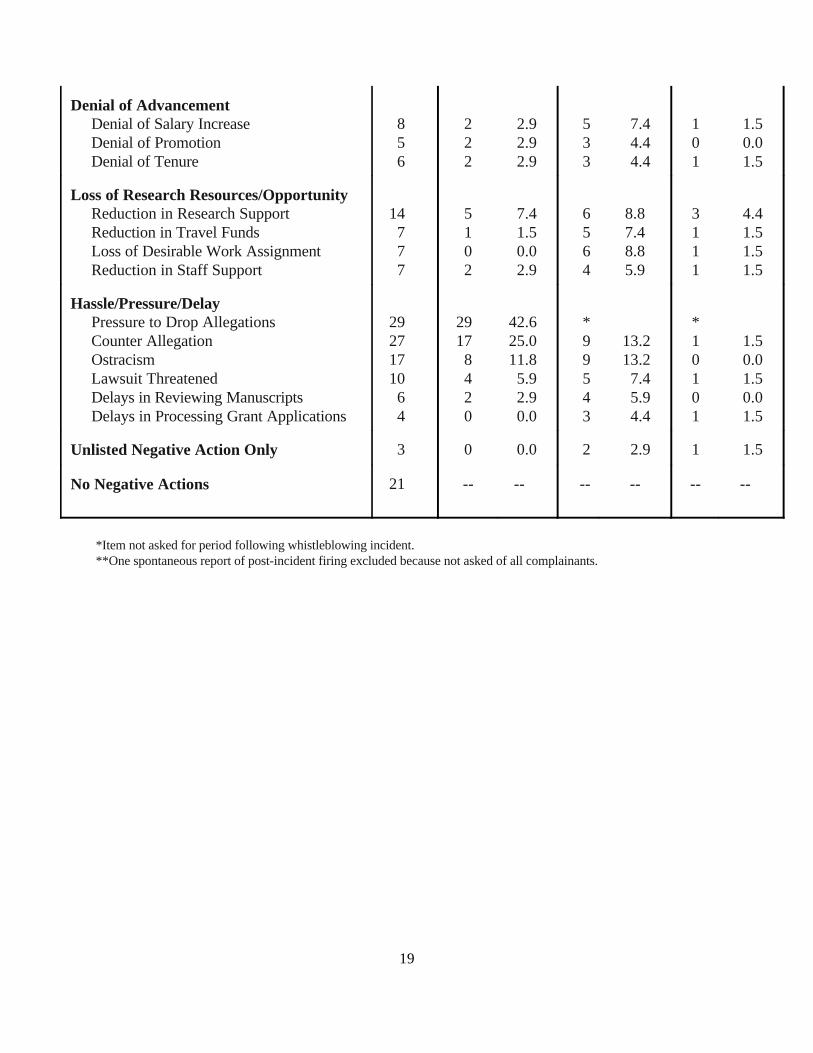
When did the negative actions occur? This part of the analysis examines the temporal
patterns associated with negative whistleblowing outcomes. Table 5 reports on the same specific
negative actions as appeared in the previous table. However, for each category, it distinguishes
when the negative actions occurred -- during the period in which the whistleblowing case was
open, after the case was closed, or during both periods. We asked three items only about the
active period of the case -- whether the complainant lost his/her job, did not get renewed, or was
subjected to pressures to drop the allegation(s). For this table, again, the numbers reported in
each row are the individuals who report each consequence during each time period. Since some

18
people report multiple consequences, they can be in more than one row. The temporal pattern
they report for a particular consequence may be different than what they report for a different
consequence. For example, a whistleblower could report being subjected to counter allegations
only during the active phase of the investigation but report a loss of research support only after
the event.
The table indicates first that when people are classified into the three time periods based
on all of their consequences taken together (top row), 19 (28% of all whistleblowers) reported
experiencing whatever negative consequences they experienced only during the event, 25 (37%)
reported experiencing them both during and after the event, and only 3 people (4%) reported
experiencing negative consequences exclusively after the active phase of the whistleblowing
incident. These figures document that 44 of 47 whistleblowers who experienced negative
outcomes (94%) as a consequence of whistleblowing experienced at least one such consequence
while the case was still active. Conversely, a whistleblower who experienced no negative
consequences while the case was active (i.e., 24 whistleblowers -- 3 after only and 21 no negative
consequences) had only a one-in-eight chance of being subjected to any negative consequence.
The data for the individual negative consequences tell the same story. In some cases (e.g.,
pressure to drop allegations and being subject to counter-allegations), the most common pattern is
for the events to occur exclusively while the case is pending. Seventeen whistleblowers reported
being subjected to counter allegations during but not after the
TABLE 5
Number and Percent of Whistleblowers Reporting Specific Negative Actions DuringAnd/Or After Investigation of the Allegation
Negative Actions Experienced Total
When Negative Action Occurred
Only During During & Only After Incident After Incident Incident
N % N % N %
Total with Negative Action Experienced
Loss of Position Fired 8 8 11.8 * * Not Renewed
47 19 27.9 25 36.8 3 4.4
8 8 11.8 * **
19
Denial of Advancement Denial of Salary Increase 8 2 2.9 5 7.4 1 1.5 Denial of Promotion 5 2 2.9 3 4.4 0 0.0 Denial of Tenure 6 2 2.9 3 4.4 1 1.5
Loss of Research Resources/Opportunity Reduction in Research Support 14 5 7.4 6 8.8 3 4.4 Reduction in Travel Funds 7 1 1.5 5 7.4 1 1.5 Loss of Desirable Work Assignment 7 0 0.0 6 8.8 1 1.5 Reduction in Staff Support 7 2 2.9 4 5.9 1 1.5
Hassle/Pressure/Delay Pressure to Drop Allegations 29 29 42.6 * * Counter Allegation 27 17 25.0 9 13.2 1 1.5 Ostracism 17 8 11.8 9 13.2 0 0.0 Lawsuit Threatened 10 4 5.9 5 7.4 1 1.5 Delays in Reviewing Manuscripts 6 2 2.9 4 5.9 0 0.0 Delays in Processing Grant Applications 4 0 0.0 3 4.4 1 1.5
Unlisted Negative Action Only 3 0 0.0 2 2.9 1 1.5
No Negative Actions 21 -- -- -- -- -- --
*Item not asked for period following whistleblowing incident.**One spontaneous report of post-incident firing excluded because not asked of all complainants.
20
incident, while only 9 reported being subjected to them during both periods. However, for the
other adverse outcomes, the most common pattern is one in which the difficulties begin during the
active phase and continue even after the investigation is over. This pattern is most
apparent for those who reported a reduction in travel funds (5 both versus 1 only during) and/or
loss of desirable work assignments (6 both versus not a single only during). In general the during
only pattern is most common for the least severe consequences, while the during and after pattern
is most common in more serious cases that require an administrative action -- such as denial of
advancement or loss of research resources.
In general, this pattern of results suggests that ORI regulations focus first and foremost on
limiting adverse actions while the case is still active. However, it also suggests the need for long-
term vigilance, even after cases have been fully adjudicated.
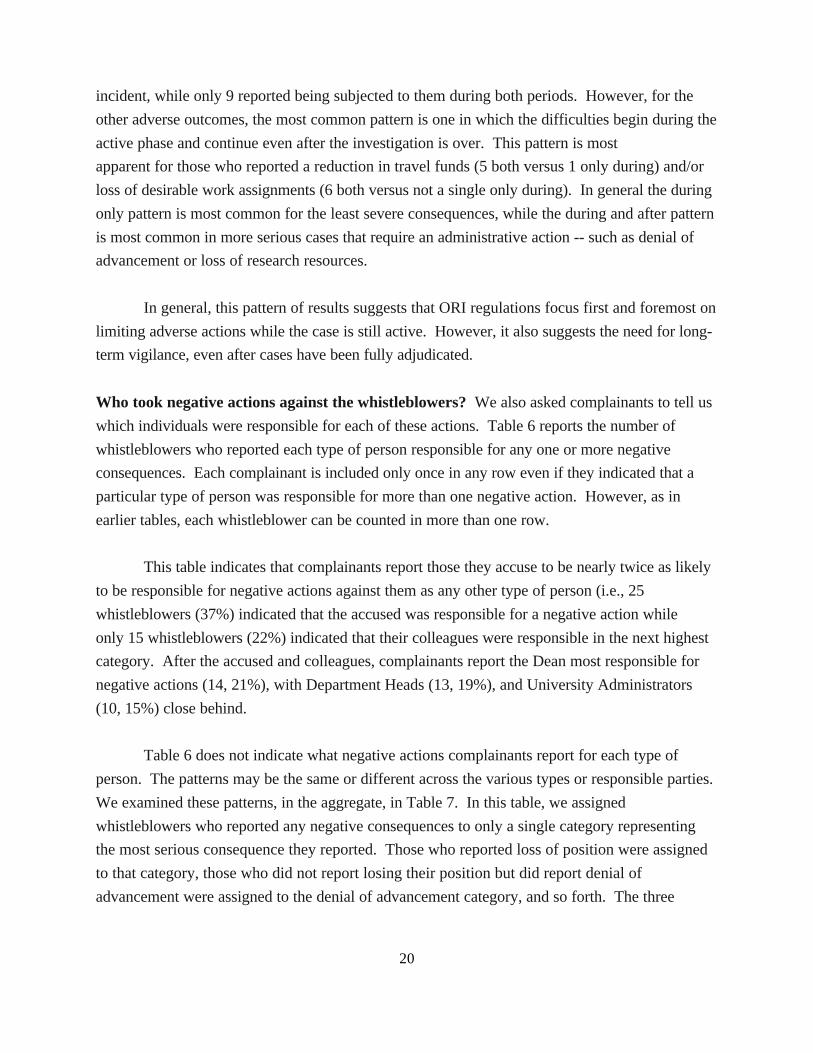
Who took negative actions against the whistleblowers? We also asked complainants to tell us
which individuals were responsible for each of these actions. Table 6 reports the number of
whistleblowers who reported each type of person responsible for any one or more negative
consequences. Each complainant is included only once in any row even if they indicated that a
particular type of person was responsible for more than one negative action. However, as in
earlier tables, each whistleblower can be counted in more than one row.
This table indicates that complainants report those they accuse to be nearly twice as likely
to be responsible for negative actions against them as any other type of person (i.e., 25
whistleblowers (37%) indicated that the accused was responsible for a negative action while
only 15 whistleblowers (22%) indicated that their colleagues were responsible in the next highest
category. After the accused and colleagues, complainants report the Dean most responsible for
negative actions (14, 21%), with Department Heads (13, 19%), and University Administrators
(10, 15%) close behind.
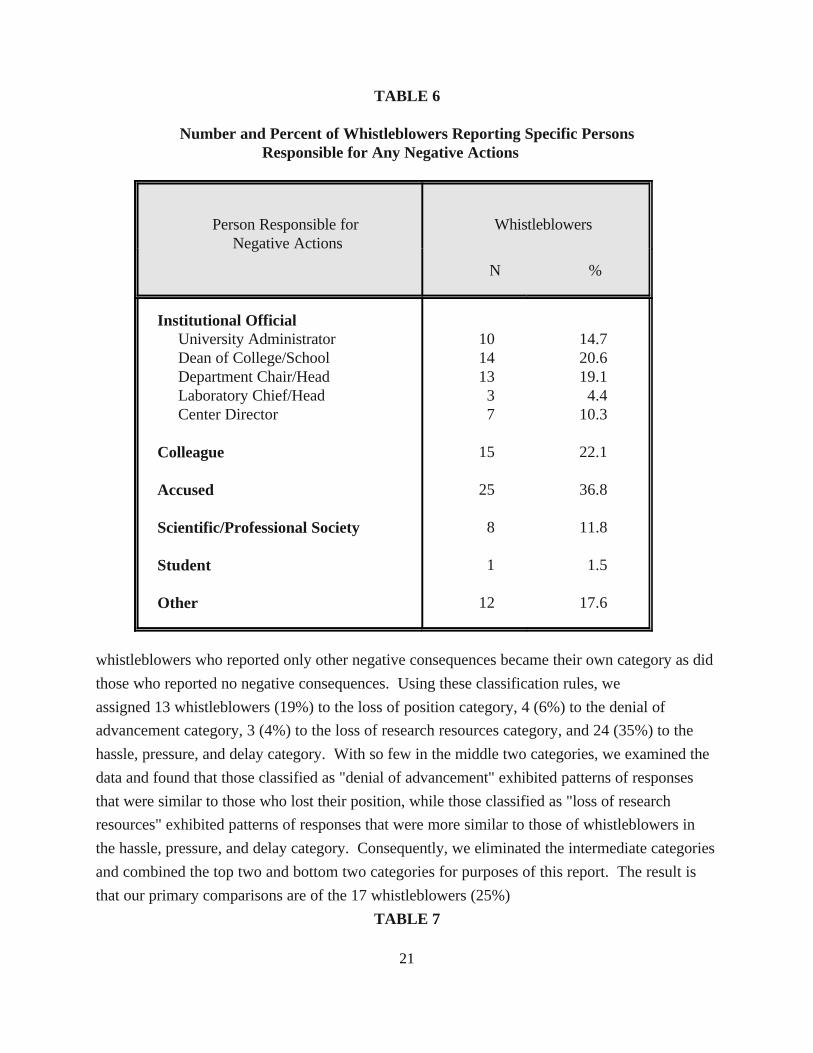
Table 6 does not indicate what negative actions complainants report for each type of
person. The patterns may be the same or different across the various types or responsible parties.
We examined these patterns, in the aggregate, in Table 7. In this table, we assigned
whistleblowers who reported any negative consequences to only a single category representing
the most serious consequence they reported. Those who reported loss of position were assigned
to that category, those who did not report losing their position but did report denial of
advancement were assigned to the denial of advancement category, and so forth. The three
21
TABLE 6
Number and Percent of Whistleblowers Reporting Specific Persons Responsible for Any Negative Actions
Person Responsible for Whistleblowers Negative Actions
N %
Institutional Official University Administrator 10 14.7 Dean of College/School 14 20.6 Department Chair/Head 13 19.1 Laboratory Chief/Head 3 4.4 Center Director 7 10.3
Colleague
Accused
Scientific/Professional Society
Student
Other
15 22.1
25 36.8
8 11.8
1 1.5
12 17.6
whistleblowers who reported only other negative consequences became their own category as did
those who reported no negative consequences. Using these classification rules, we
assigned 13 whistleblowers (19%) to the loss of position category, 4 (6%) to the denial of
advancement category, 3 (4%) to the loss of research resources category, and 24 (35%) to the
hassle, pressure, and delay category. With so few in the middle two categories, we examined the
data and found that those classified as "denial of advancement" exhibited patterns of responses
that were similar to those who lost their position, while those classified as "loss of research
resources" exhibited patterns of responses that were more similar to those of whistleblowers in
the hassle, pressure, and delay category. Consequently, we eliminated the intermediate categories
and combined the top two and bottom two categories for purposes of this report. The result is
that our primary comparisons are of the 17 whistleblowers (25%)
TABLE 7
22
Number and Percent of Whistleblowers Reporting Different Persons Responsible by Negative Action Category
Severity of Negative Actions Total %Experienced
Person Responsible
Accused Colleagues Official SocietyInstitutional Professional
N % N % N % N %
Serious Negative Consequences 17 25.0 4 23.5 3 17.6 15 88.2 1 5.9
Less Severe Negative 27 39.7 14 51.9 4 14.8 10 37.0 4 14.8Consequences
Unlisted Negative Action Only 3 4.4 0 0.0 0 0.0 2 66.7 0 0.0
No Negative Consequences 21 30.9
TOTAL 68 100.0
23
who reported serious, potentially career-altering, negative consequences such as loss of position
and/or denial of advancement and the 27 whistleblowers (40%) who reported less severe
consequences such as the loss of research resources and/or being hassled, pressured, or delayed.
Using this new classification, Table 7 makes clear that institutional officials, as a group,
are involved in almost all (88%) of the cases that experienced the most serious negative
outcomes, while only about a quarter of the accused (24%) and fewer colleagues (18%) and
professional societies (6%) are reported to be responsible for such outcomes. The pattern is very
different for the less serious outcomes. For these, whistleblowers most often reported that the
accused was responsible (52%), with institutional officials (37%) playing a significant role in these
outcomes as well. Colleagues (15%) and professional societies (15%) were deemed less likely to
have been responsible for even these minor negative outcomes. The most striking and clearcut
finding in this table is that severe negative consequences that require administrative actions for
implementation -- loss of position or denial of advancement -- were almost exclusively the result
of actions by institutional officials.
These data suggest that, to prevent the most serious consequences of whistleblowing, ORI
regulations and enforcement approaches will need to be targeted primarily at institutional officials.
Additional focus on the accused is likely to address the bulk of the remaining difficulties
experienced by whistleblowers.
Table 8 examines the temporal patterns for each category of person reported to be
responsible for any negative action. We have used the overall measure of when the action
occurred (i.e., all negative actions during, all negative actions after, some negative actions during
each period). When negative actions are confined to the active period of the investigation,
complainants ascribe blame for their negative outcomes most often to the accused (74%), less but
nearly equally often to colleagues and institutional officials (47% and 53%, respectively), and least
often (16%) to professional societies. When the consequences occur both during and after the
incident, whistleblowers most often attribute responsibility for their bad outcomes to institutional
officials (68%), then to the accused (40%), next to colleagues (24%), and least often to
professional societies (16%). The accused and, to a lesser extent, colleagues appear to intervene
negatively during the initial whistleblowing incident but their level of involvement appears to fall
off after that (perhaps because in most cases the
TABLE 8

242424
Number and Percent of Whistleblowers Reporting Different Persons Responsible by When Negative Actions Occurred
When Negative Actions Occurred Total
Person Responsible
Accused Colleagues Official SocietyInstitutional Professional
N % N % N % N %
Only During Incident 19 14 73.7 9 47.4 10 52.6 3 15.8
During and After Incident 25 10 40.0 6 24.0 17 68.0 4 16.0
Only After Incident 3 1 33.3 0 0.0 2 66.7 1 33.3
25
accused is not found to have engaged in misconduct). Institutional officials, on the other hand,
appear to stay involved for the long-run (presumably to protect the interests of their institution
against further allegations). Like the previous table, this one suggests that ORI focus attention on
the period of active case consideration and include both the institutional officials and the accused
as major targets of its regulatory, monitoring, and enforcement efforts.
b. Consequences Experienced by Different Complainants
In the previous section, we described the negative outcomes whistleblowers experienced
and looked for some structural characteristics of these outcomes that might be useful in helping to
target the application of federal and institutional resources. In this section, we look at what
happened to whistleblowers of different types to determine if there are some people who can blow
the whistle with relative impunity while others find themselves particularly vulnerable to
retaliation when they blow the whistle. Again, this may help focus resources where they can do
the most good in protecting vulnerable whistleblowers.
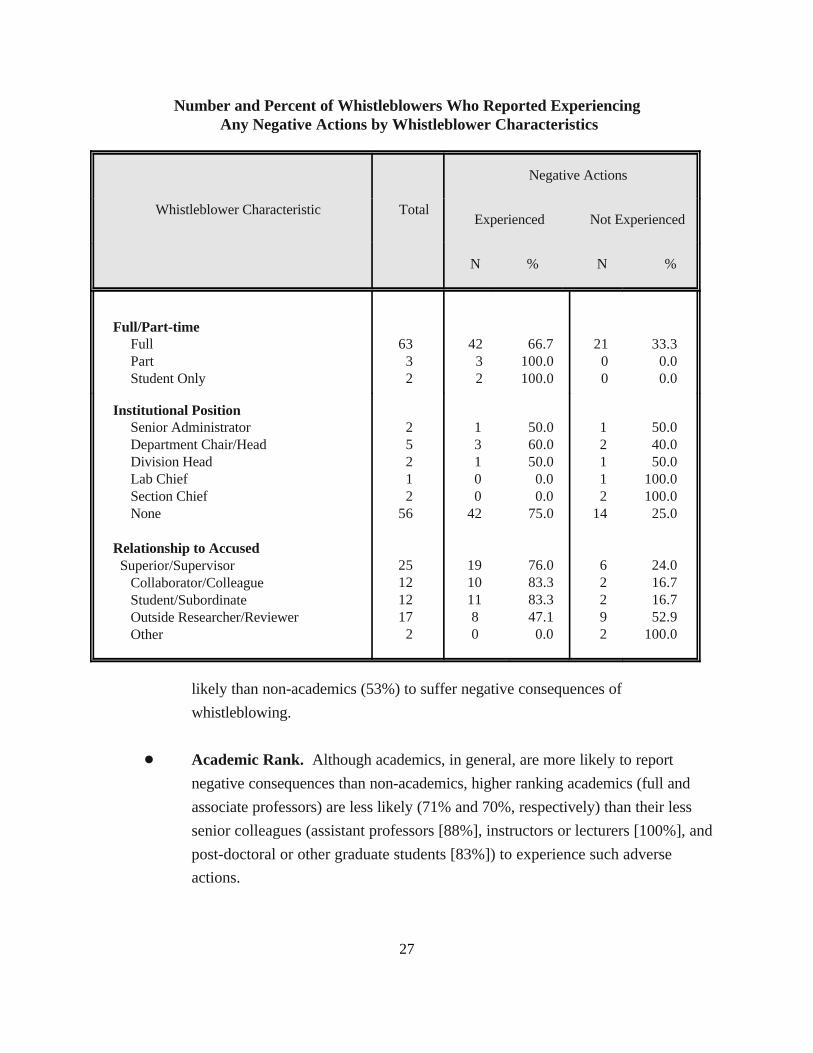
How do complainants differ in the consequences they experience? Table 9 examines
the relationship between the personal characteristics of complainants and whether or not they
experienced negative consequences as a result of blowing the whistle. We looked at a number of
complainant characteristics, including:
! Degree Held. In general, those with research-oriented doctorates only (PhD or
ScD) were the most likely (73%) to experience negative consequences of
whistleblowing and those with clinically-oriented degrees (MD, MD/PhD, MB, or
DDS) were the least likely (59%) to experience negative consequences of
whistleblowing.
! Work Setting. Academics were more likely (74%) than those in government
(50%) or other settings (60%) to suffer negative consequences of whistleblowing.
! Type of Academic Department. Among academics, those in basic science
departments were particularly likely (84%) to report negative consequences when
blowing the whistle. Those in clinical departments (50%) were no more
TABLE 9

26
Number and Percent of Whistleblowers Who Reported Experiencing Any Negative Actions by Whistleblower Characteristics
Negative Actions
Whistleblower Characteristic Total Experienced Not Experienced
N % N %
Total Number of Complainants
Degree Held Doctorate (Ph.D., D.Sc.) 45 33 73.3 12 26.7 Doctor (MD/Ph.D, M.D., M.B., or 17 10 58.8 7 41.2 D.D.S.) Other 6 4 66.7 2 33.3
68 47 69.1 21 30.9
Work Setting Academia 53 39 73.6 14 26.4 Government 10 5 50.0 5 50.0 Other 5 3 60.0 2 40.0
Type of Academic Department Basic Science 31 26 83.9 5 16.1 Clinical 12 6 50.0 6 50.0 Other 10 7 70.0 3 30.0 Non-Academic Setting 15 8 53.3 7 46.7
Academic Rank Professor 24 17 70.8 7 29.2 Associate Professor 10 7 70.0 3 30.0 Assistant Professor 8 7 87.5 1 12.5 Instructor/Lecturer 1 1 100.0 0 0.0 Graduate Student/Post-Doc 6 5 83.3 1 16.7 No Academic Rank 19 10 52.6 9 47.4
Continuity/Security of Position Tenured 38 27 71.0 11 29.0 Nontenured 30 20 66.7 10 33.3
Source of Funds University Funds Only 17 13 76.5 4 23.5 University/Extramural Funds 26 17 65.4 9 34.6 Extramural Funds Only 11 9 81.8 2 18.2 Unpaid/Don't Know/Inapplicable 14 8 57.1 6 2.9
TABLE 9 (Cont'd)
27
Number and Percent of Whistleblowers Who Reported Experiencing Any Negative Actions by Whistleblower Characteristics
Negative Actions
Whistleblower Characteristic TotalExperienced Not Experienced
N % N %
Full/Part-time Full 63 42 66.7 21 33.3 Part 3 3 100.0 0 0.0 Student Only 2 2 100.0 0 0.0
Institutional Position Senior Administrator 2 1 50.0 1 50.0 Department Chair/Head 5 3 60.0 2 40.0 Division Head 2 1 50.0 1 50.0 Lab Chief 1 0 0.0 1 100.0 Section Chief 2 0 0.0 2 100.0 None 56 42 75.0 14 25.0
Relationship to Accused Superior/Supervisor Collaborator/Colleague Student/Subordinate Outside Researcher/Reviewer Other
25 19 76.0 6 24.012 10 83.3 2 16.712 11 83.3 2 16.717 8 47.1 9 52.9
2 0 0.0 2 100.0
likely than non-academics (53%) to suffer negative consequences of
whistleblowing.
! Academic Rank. Although academics, in general, are more likely to report
negative consequences than non-academics, higher ranking academics (full and
associate professors) are less likely (71% and 70%, respectively) than their less
senior colleagues (assistant professors [88%], instructors or lecturers [100%], and
post-doctoral or other graduate students [83%]) to experience such adverse
actions.
Whistleblowers in our survey could indicate more than one relationship to the accused (e.g., both supervisor and collaborator). However,10
we used the data to create unique categories for each individual. Those who were supervisors/superiors we categorized as such regardlessof other relationships they might hold with the accused. The remaining categories were assigned in descending order.
28
! Tenure. There was little difference overall between those with (71%) and without
(67%) tenure in reported experience of negative consequences. If anything, the
results suggest that those with tenure suffer adverse consequences slightly more
often than their untenured colleagues. This may be because the latter category
includes both lower level academics (who we already saw are more subject to
adverse consequences) and non-academics (who we already saw were less subject
to negative actions).
! Source of Funding. Those whose salary is supported exclusively by extramural
funds (82%) are the most vulnerable to experiencing negative outcomes. Those
whose salaries are exclusively supported by university funds (77%) also report
more frequent experience of negative consequences than those who have mixed
funding (65%) or are unfunded (57%).
! Work Status. Since nearly all complainants were employed full time (93%) at the
time of their allegations, it is difficult to make much of the findings on this topic.
However, every one of the five whistleblowers who worked part-time or were
students at the time of the allegations reported experiencing negative outcomes.
! Institutional Position. Fewer than one-in-five complainants (18%) held a
position of institutional authority at the time of the allegation. The number in any
particular position is so small that the differences are uninterpretable. However,
combining the top 5 categories suggests that holding any institutional position of
authority appears to confer some protection against the negative consequences of
blowing the whistle -- 58% of institutional officials but only 25% of other
complainants reported experiencing no negative consequences of blowing the
whistle.
! Relationship to the Accused. There is relatively little difference in the10
proportion of complainants who report adverse consequences of whistleblowing
between those who were superiors/supervisors of the accused (76%) those who
were colleagues/collaborators of the accused (83%), and those who were
29
subordinates/students of the accused (83%). However, those who are located at
another institution, outside researchers and reviewers, experience negative
consequences in a much smaller proportion of the cases in which they allege
misconduct (47%).
c. Consequences Experienced in Different Situations
In the above analyses, we have shown that what happened to a whistleblower appears to
have something to do with who takes action against them, when they take that action, and what
sort of person the whistleblower is. Another set of factors likely to influence the outcome of
whistleblowing is the nature of the whistleblowing event itself and how the allegations were
handled.
How do the consequences experienced by whistleblowers vary with differences in the
whistleblowing situation? Table 10 examines the relationship between the characteristics of the
whistleblowing incidents experienced by complainants and whether or not they experienced
negative consequences as a result of blowing the whistle. We looked at a number of
characteristics of such incidents, including:
! Case Outcome. Complainants whose allegations were partially but not fully
confirmed were the most likely (79%) to experience negative consequences.
Those whose allegations were totally unsupported were next most likely (74%) to
report adverse consequences followed by those whose allegations were fully
supported (68%). Complainants least likely to be adversely affected were those
who were unaware of the outcome of their allegations (50%). It is also interesting
to note that the number of cases in which respondents report that all

30
TABLE 10
Number and Percent of Whistleblowers Who Reported Experiencing Any Negative Actions by Case Characteristics
Characteristics of the Incident Total Experienced Not Experienced
Negative Actions
N % N %
Total Number of Whistleblowers 68 47 69.1 21 30.9
Outcome of Case No Allegations Supported 23 17 73.9 6 26.1 Some Allegations Supported 14 11 78.6 3 21.4 All Allegations Supported 19 13 68.4 6 31.6 Don't Know 12 6 50.0 6 50.0
Type of Misconduct Alleged Fabrication Falsification Plagiarism More Than One
20 16 80.0 4 20.016 10 62.5 6 37.538 17 71.0 11 29.016 12 75.0 4 25.0
Case Publicity Publicized 15 13 86.7 2 13.3 Not Publicized/No Answer 48 32 66.7 16 33.3 Don't Know 5 2 40.0 3 60.0
To Whom Allegation Made Dean of College/School/University 24 22 91.7 2 8.3 Department Head/Chair 27 25 92.6 2 7.4 Institutional Misconduct Official 17 16 94.1 1 5.9 Laboratory Chief/Director 9 5 55.6 4 44.4 Principal Investigator 6 4 66.7 2 33.3 ORI/OSI 31 24 77.4 7 22.6 Funding Agency 14 12 85.7 2 14.3 Executive Director of Review Group 14 8 57.1 6 42.9 Journal Editor 8 6 75.0 2 25.0
31
TABLE 10 (Cont'd)
Number and Percent of Whistleblowers Who Reported ExperiencingAny Negative Actions by Case Characteristics
Negative Actions
Characteristics of the Incident Total Experienced Not Experienced
N % N %
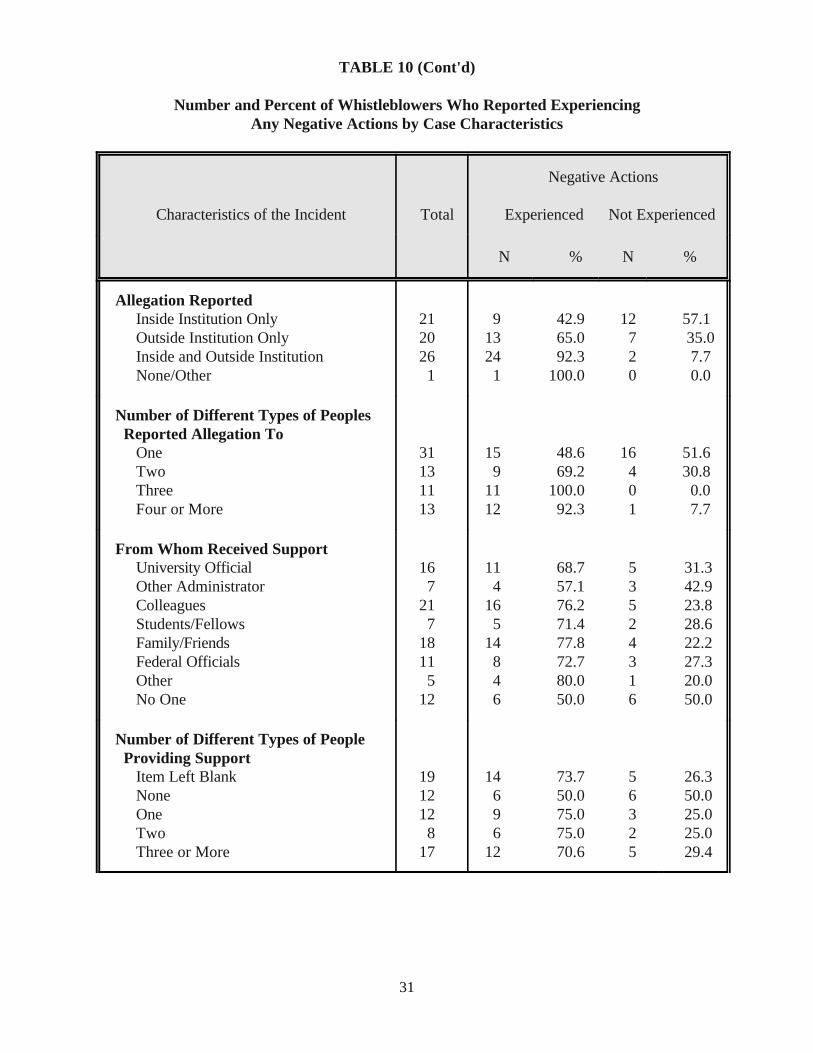
Allegation Reported Inside Institution Only 21 9 42.9 12 57.1 Outside Institution Only 20 13 65.0 7 35.0 Inside and Outside Institution 26 24 92.3 2 7.7 None/Other 1 1 100.0 0 0.0
Number of Different Types of Peoples Reported Allegation To One 31 15 48.6 16 51.6 Two 13 9 69.2 4 30.8 Three 11 11 100.0 0 0.0 Four or More 13 12 92.3 1 7.7
From Whom Received Support University Official 16 11 68.7 5 31.3 Other Administrator 7 4 57.1 3 42.9 Colleagues 21 16 76.2 5 23.8 Students/Fellows 7 5 71.4 2 28.6 Family/Friends 18 14 77.8 4 22.2 Federal Officials 11 8 72.7 3 27.3 Other 5 4 80.0 1 20.0 No One 12 6 50.0 6 50.0
Number of Different Types of People Providing Support Item Left Blank 19 14 73.7 5 26.3 None 12 6 50.0 6 50.0 One 12 9 75.0 3 25.0 Two 8 6 75.0 2 25.0 Three or More 17 12 70.6 5 29.4

Whistleblowers can and often do make more than one allegation. While the numbers in each row represent unique individuals, the11
numbers in different rows are not independent. The final category, multiple allegations, is one attempt to capture this overlaps.
32
TABLE 10 (Cont'd)
Number and Percent of Whistleblowers Who Reported ExperiencingAny Negative Actions by Case Characteristics
Negative Actions
Characteristics of the Incident Total Experienced Not Experienced
N % N %
Response to Allegation Inquiry Only 36 26 72.2 10 27.8 Inquiry and Investigation 8 5 62.5 3 37.5 Investigation Only 6 6 100.0 0 0.0 None/Other/Don't Know 18 10 55.6 8 44.4
allegations were supported (19) is almost identical to the reported number of cases
of misconduct in ORI's files (20). An additional 14 complainants reported that
some allegations were supported, but since they may have made allegations other
than research misconduct, it is unclear what this discrepancy means.
! Type of Misconduct Alleged. Alleging fabrication is more likely (80%) to11
result in negative consequences than alleging plagiarism (71%), which, in turn, is
more likely to result in negative outcomes than alleging falsification (63%).
Alleging more than one type of misconduct results in negative consequences
almost as often (75%) as alleging fabrication.
! Case Publicity. Complainants in cases that receive publicity are more likely
(87%) than their colleagues whose cases were not publicized (67%) to report
negative consequences of blowing the whistle. Fortunately, fewer than one-fourth
of cases (22%) were reported to have been publicized. Again, not knowing
Whistleblowers can and often do make allegations to more than one type of individual. While the numbers in each row represent unique12
individuals, the numbers in different rows are not independent.
33
whether or not the case was publicized was associated with lower risk of adverse
outcomes (40%).
! To Whom Allegation Was Made. Consistent with the previous results on12
persons responsible for negative actions, those who reported their allegations to
university officials -- deans (92%), department heads (93%), or even institutional
misconduct officials (94%) -- were the most likely to experience adverse
consequences. Reporting allegations to a funding agency (86%), ORI/OSI (77%),
or a journal editor (75%) also resulted in above average levels of negative
consequences. Interestingly, those who reported their suspicions to a laboratory
director were least likely (56%) to suffer negative outcomes.
! Internal vs. External Reporting. We recoded the information from this same
question to separate those who reported to someone within their institution from
those who reported to someone outside their institution. Some people reported to
both and one reported only to a person whose location could not be determined
from the response. Those who reported the allegation outside the institution,
tended to experience negative actions more often (65%) than those who reported
the allegation only within the institution (45%). Those who reported it both
outside and within are particularly vulnerable to adverse consequences (92%).
! Number of People to Whom Allegation Was Reported. Looking at these same
data yet another way, we determined the number of different types of people to
whom an allegation was made. The more different types of people complainants
report their allegations to, the higher their chance of suffering adverse
consequences. Thirty-one whistleblowers (46%) reported their allegations to only
a single type of person and almost half of such whistleblowers reported having
experienced a negative consequence. Nine of 13 complainants who reported to
two types of people (69%) indicated that they had experienced negative
consequences. All 11 of those who made allegations to three types of people and
12 of 13 who reported their allegation to four or more types of people (92%)
reported an adverse outcome of their whistleblowing.
34
! From Whom Received Support/Encouragement. Interestingly, when
complainants receive support and encouragement from university officials or other
administrative officials, they experience fewer negative consequences less often
(69% for university officials and 57% for other administrators) than when they
receive support elsewhere (i.e., 71% for students/fellows, 73% for federal officials,
76% for colleagues, 78% for family/friends, and 80% for other). To some extent,
this is the flip side of the coin from earlier results and suggests that a key factor in
the outcomes whistleblowers experience is whether they receive support or
opposition from those with authority in their institution. Those who report that
they received no support or encouragement also reported lowest frequency of
negative consequences (50%).
! Number of People Providing Support/Encouragement. Thirty-seven
whistleblowers (54%) reported receiving support from at least one person.
Twelve whistleblowers (18%) reported receiving support from no one, and an
additional 19 whistleblowers (28%) left this item blank, suggesting that the overall
proportion of whistleblowers who received no support of encouragement is likely
substantially larger than 18%. The number of different types of people who
provide support to whistleblowers seems to make very little difference in the
consequences whistleblowers experience -- except, as before, people who
explicitly reported having received no support from anyone experienced fewer
adverse actions (50% versus 71-75% for all other categories).
! How Far Case Pursued. The six whistleblowers (9%) who reported that their
allegations were considered only at an investigation without an initial inquiry were
most likely to experience negative consequences (100%). Those whose allegations
were considered only at an inquiry (36 whistleblowers [53%]) also reported higher
than average levels of negative consequences of blowing the whistle (72%). Those
whose allegations were heard in both forums (8 whistleblowers [12%]) reported
fewer negative consequences still (63%) and those who reported some other way
in which their allegations were handled (10 whistleblowers [15%]) also reported
the fewest negative consequences (56%). The overall figures on self-reports of the
response to the allegation can be compared to the initial information in ORI's file.
The number reporting "inquiry only" in Table 10 (36) is quite consistent with the
ORI figure for "inquiry" in Table 1 (38). However, the sum of those reporting an
Possibilities suggested by ORI are: (1) that whistleblowers may not be clear on this distinction or (2) that ORI sometimes classifies an13
institutional inquiry as an investigation if the inquiry appears to be sufficiently thorough to meet ORI's definition of an investigation.
The survey question we asked gave whistleblowers the opportunity to respond to this items by choosing one of eight items very, somewhat,14
or slightly positive, very, somewhat, or slightly negative, no effect, and uncertain. For several reasons (small sample size, previousresearch with similar scales, fact that other career, professional activities, and person life scales have fewer points), we collapsed categoriesfor reporting into positive (very and somewhat positive), negative (very and somewhat negative), and neutral (no effect, uncertain, slightlypositive or negative).
35
investigation with or without an inquiry in Table 10 (14) is only about half the
number of investigations noted in ORI files (29). This finding is difficult to
explain.13
d. Overall Impact of Whistleblowing on the Whistleblower
In addition to asking whistleblowers about the specific negative consequences they
experienced as a result of whistleblowing, we also asked them to rate the impact of their
whistleblowing on their career overall (item 31) and on specific aspects of their careers (item 28),
professional activities (item 30), and personal lives (item 29). The analyses in this section look
first at their overall ratings, then at the individual dimensions that whistleblowers rated, and finally
at the relationship between the specific consequences whistleblowers experienced and summary
ratings of the impact of their whistleblowing in these three domains -- career, professional
activities, and personal life.
What was the overall impact of whistleblowing on claimants' careers? The survey
included an item (item 31) which asked complainants to rate the overall effect of whistleblowing
on their careers. Table 11 provides an overview of this information for all whistleblowers in our
survey, for those who experienced or did not experience a negative action, and among the former,
those who experienced severe versus less severe negative consequences:14
TABLE 11 Whistleblowers' Assessments of Overall Effect of Whistleblowing on Career by Whether Negative Actions Were Experienced
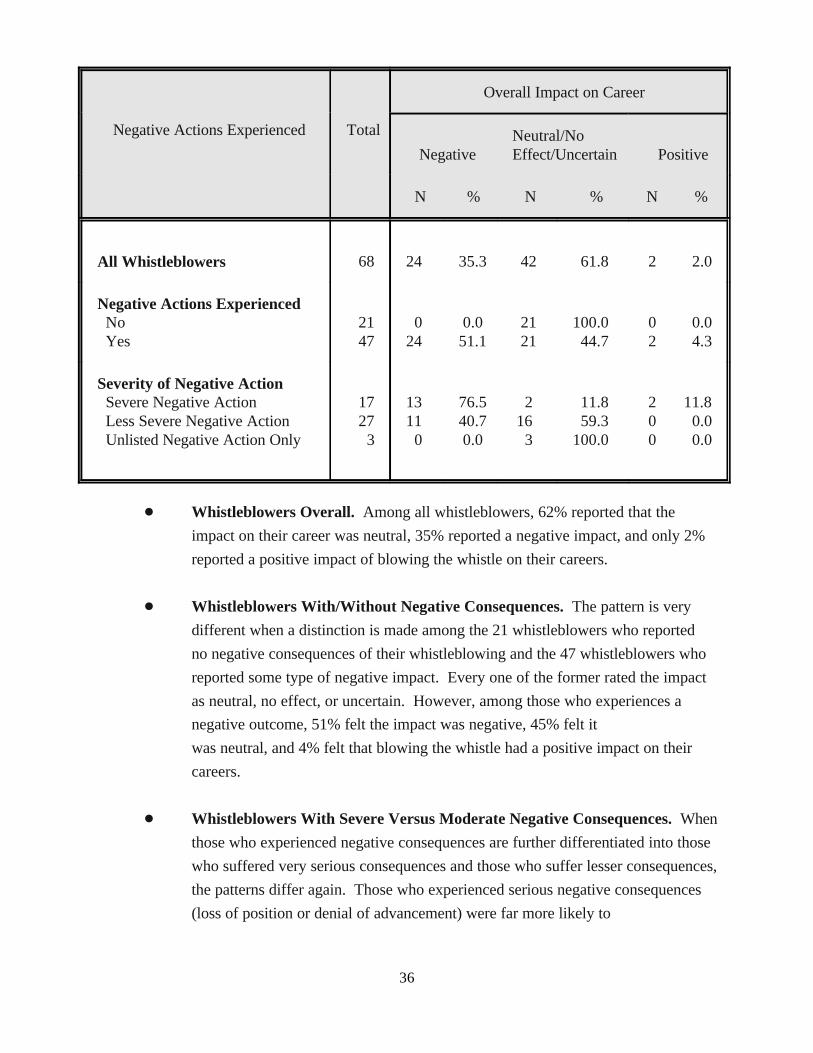
36
Negative Actions Experienced Total
Overall Impact on Career
Negative Effect/Uncertain PositiveNeutral/No
N % N % N %
All Whistleblowers 68 24 35.3 42 61.8 2 2.0
Negative Actions Experienced No 21 0 0.0 21 100.0 0 0.0 Yes 47 24 51.1 21 44.7 2 4.3
Severity of Negative Action Severe Negative Action 17 13 76.5 2 11.8 2 11.8 Less Severe Negative Action 27 11 40.7 16 59.3 0 0.0 Unlisted Negative Action Only 3 0 0.0 3 100.0 0 0.0
! Whistleblowers Overall. Among all whistleblowers, 62% reported that the
impact on their career was neutral, 35% reported a negative impact, and only 2%
reported a positive impact of blowing the whistle on their careers.
! Whistleblowers With/Without Negative Consequences. The pattern is very
different when a distinction is made among the 21 whistleblowers who reported
no negative consequences of their whistleblowing and the 47 whistleblowers who
reported some type of negative impact. Every one of the former rated the impact
as neutral, no effect, or uncertain. However, among those who experiences a
negative outcome, 51% felt the impact was negative, 45% felt it
was neutral, and 4% felt that blowing the whistle had a positive impact on their
careers.
! Whistleblowers With Severe Versus Moderate Negative Consequences. When
those who experienced negative consequences are further differentiated into those
who suffered very serious consequences and those who suffer lesser consequences,
the patterns differ again. Those who experienced serious negative consequences
(loss of position or denial of advancement) were far more likely to
37
rate the overall impact on their career as negative (77%) than to rate it as neutral
(12%) or positive (12%). Whereas, those who reported experiencing the less
serious adverse outcomes (loss of research resources or hassles, pressures, or
delays), were more likely to rate their experience as neutral (59%) than negative
(41%), with none of these whistleblowers rating their experience as positive.
What impact did blowing the whistle have on various aspects of complainants'
careers? Table 12 presents information on complainants' self-assessments of the impact of
whistleblowing on various aspects of their careers. The overall pattern reflected in this table is
that, on every dimension, the most selected option is the no effect/uncertain choice. The
proportion choosing this neutral option varied from 53% for the impact on the whistleblowers'
reputations, to 84% for its impact on their consulting activities. Most of those who did not
choose the middle option rated the impact on these career-oriented dimensions as negative. The
proportion giving negative ratings ranged from highs for reputation (32%), promotions, field of
research, and income (31% each), job mobility, and collaborations (30% each), to lows for
consulting (16%), tenure (17%), and networking (24%). With the exception of two dimensions,
no more than one whistleblower indicated that their whistleblowing had a positive impact on any
career dimension. The exceptions were that 6% felt that the incident had a positive impact on
their field of research and 15% felt it enhanced their reputation. In sum, relatively few people
who blew the whistle reported any impact on each of the dimensions we looked at. However,
when they did report an impact, it was almost invariably negative. The only slight exception to
this pattern is for "reputation," which exhibits the most polarization of complainant judgement.
However, more than twice as many people reported their reputations hurt as reported them
helped by their involvement in the whistleblowing incident.
TABLE 12
Whistleblowers' Assessments of Impact of Whistleblowing onCareer
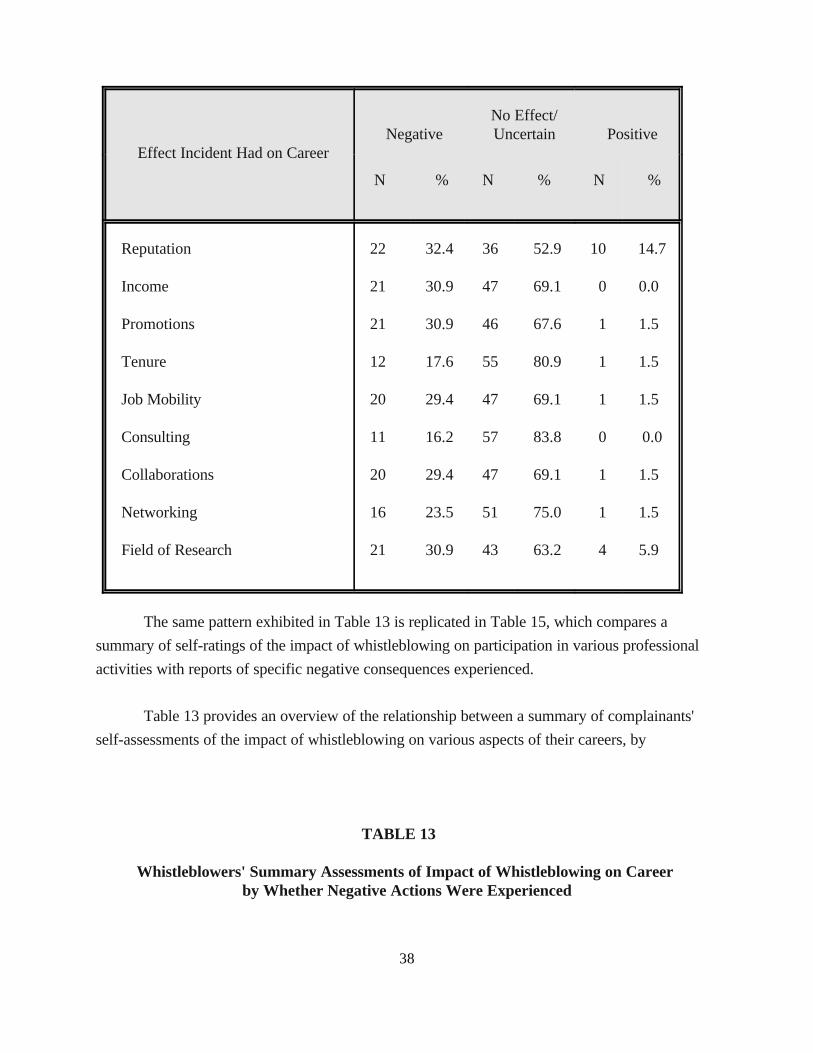
38
Effect Incident Had on CareerNegative Uncertain Positive
No Effect/
N % N % N %
Reputation 22 32.4 36 52.9 10 14.7
Income 21 30.9 47 69.1 0 0.0
Promotions 21 30.9 46 67.6 1 1.5
Tenure 12 17.6 55 80.9 1 1.5
Job Mobility 20 29.4 47 69.1 1 1.5
Consulting 11 16.2 57 83.8 0 0.0
Collaborations 20 29.4 47 69.1 1 1.5
Networking 16 23.5 51 75.0 1 1.5
Field of Research 21 30.9 43 63.2 4 5.9
The same pattern exhibited in Table 13 is replicated in Table 15, which compares a
summary of self-ratings of the impact of whistleblowing on participation in various professional
activities with reports of specific negative consequences experienced.
Table 13 provides an overview of the relationship between a summary of complainants'
self-assessments of the impact of whistleblowing on various aspects of their careers, by
TABLE 13
Whistleblowers' Summary Assessments of Impact of Whistleblowing on Career by Whether Negative Actions Were Experienced
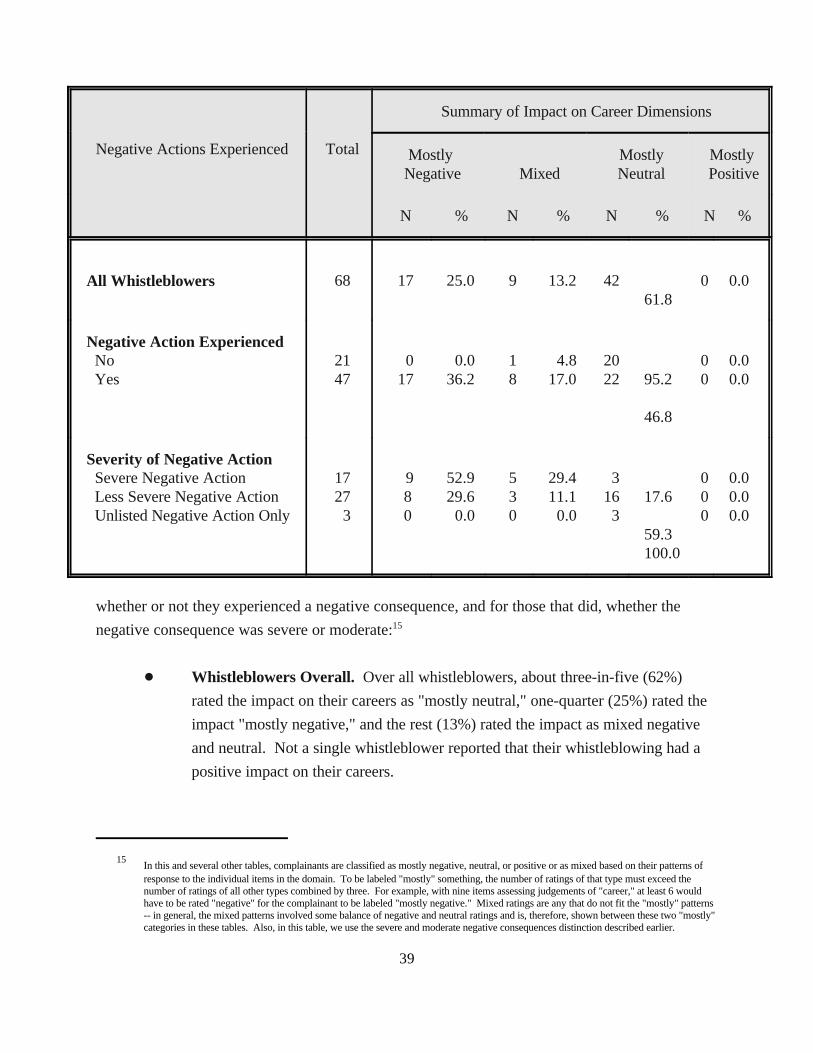
In this and several other tables, complainants are classified as mostly negative, neutral, or positive or as mixed based on their patterns of15
response to the individual items in the domain. To be labeled "mostly" something, the number of ratings of that type must exceed thenumber of ratings of all other types combined by three. For example, with nine items assessing judgements of "career," at least 6 wouldhave to be rated "negative" for the complainant to be labeled "mostly negative." Mixed ratings are any that do not fit the "mostly" patterns-- in general, the mixed patterns involved some balance of negative and neutral ratings and is, therefore, shown between these two "mostly"categories in these tables. Also, in this table, we use the severe and moderate negative consequences distinction described earlier.
39
Negative Actions Experienced Total
Summary of Impact on Career Dimensions
Mostly Mostly Mostly Negative Mixed Neutral Positive
N % N % N % N %
All Whistleblowers 68 17 25.0 9 13.2 42 0 0.061.8
Negative Action Experienced No 21 0 0.0 1 4.8 20 0 0.0 Yes 47 17 36.2 8 17.0 22 95.2 0 0.0
46.8
Severity of Negative Action Severe Negative Action 17 9 52.9 5 29.4 3 0 0.0 Less Severe Negative Action 27 8 29.6 3 11.1 16 17.6 0 0.0 Unlisted Negative Action Only 3 0 0.0 0 0.0 3 0 0.0 59.3
100.0
whether or not they experienced a negative consequence, and for those that did, whether the
negative consequence was severe or moderate:15
! Whistleblowers Overall. Over all whistleblowers, about three-in-five (62%)
rated the impact on their careers as "mostly neutral," one-quarter (25%) rated the
impact "mostly negative," and the rest (13%) rated the impact as mixed negative
and neutral. Not a single whistleblower reported that their whistleblowing had a
positive impact on their careers.
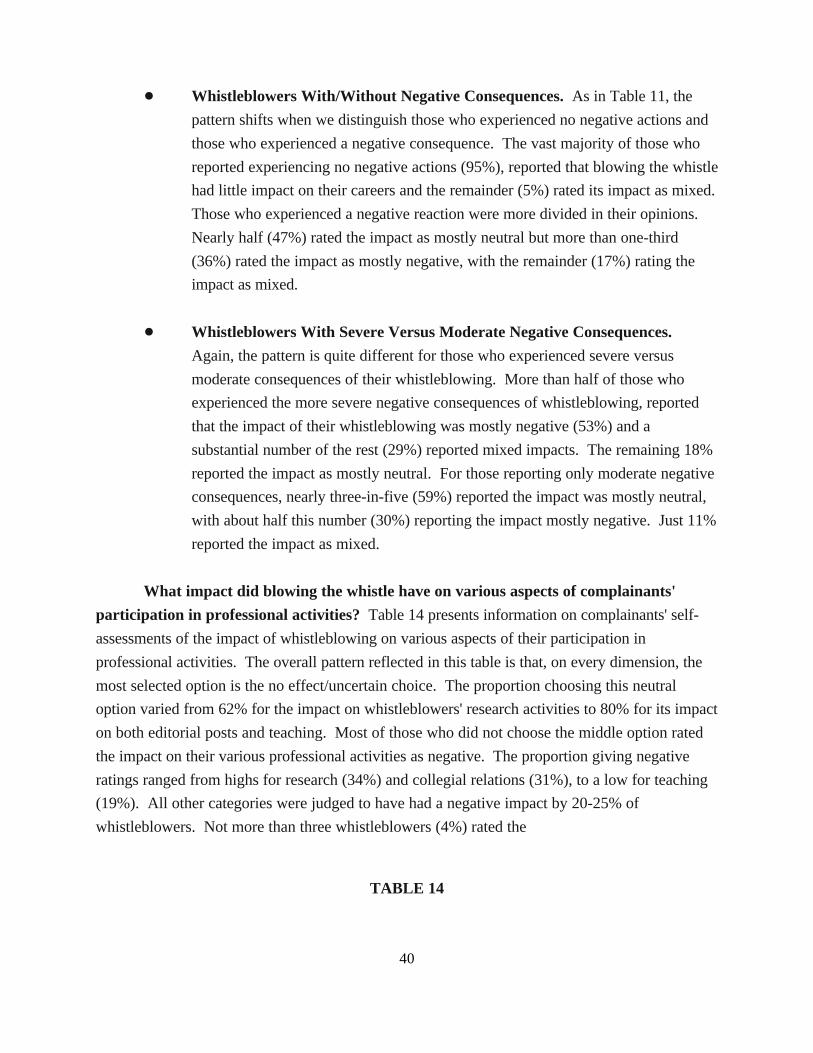
40
! Whistleblowers With/Without Negative Consequences. As in Table 11, the
pattern shifts when we distinguish those who experienced no negative actions and
those who experienced a negative consequence. The vast majority of those who
reported experiencing no negative actions (95%), reported that blowing the whistle
had little impact on their careers and the remainder (5%) rated its impact as mixed.
Those who experienced a negative reaction were more divided in their opinions.
Nearly half (47%) rated the impact as mostly neutral but more than one-third
(36%) rated the impact as mostly negative, with the remainder (17%) rating the
impact as mixed.
! Whistleblowers With Severe Versus Moderate Negative Consequences.
Again, the pattern is quite different for those who experienced severe versus
moderate consequences of their whistleblowing. More than half of those who
experienced the more severe negative consequences of whistleblowing, reported
that the impact of their whistleblowing was mostly negative (53%) and a
substantial number of the rest (29%) reported mixed impacts. The remaining 18%
reported the impact as mostly neutral. For those reporting only moderate negative
consequences, nearly three-in-five (59%) reported the impact was mostly neutral,
with about half this number (30%) reporting the impact mostly negative. Just 11%
reported the impact as mixed.
What impact did blowing the whistle have on various aspects of complainants'
participation in professional activities? Table 14 presents information on complainants' self-
assessments of the impact of whistleblowing on various aspects of their participation in
professional activities. The overall pattern reflected in this table is that, on every dimension, the
most selected option is the no effect/uncertain choice. The proportion choosing this neutral
option varied from 62% for the impact on whistleblowers' research activities to 80% for its impact
on both editorial posts and teaching. Most of those who did not choose the middle option rated
the impact on their various professional activities as negative. The proportion giving negative
ratings ranged from highs for research (34%) and collegial relations (31%), to a low for teaching
(19%). All other categories were judged to have had a negative impact by 20-25% of
whistleblowers. Not more than three whistleblowers (4%) rated the
TABLE 14
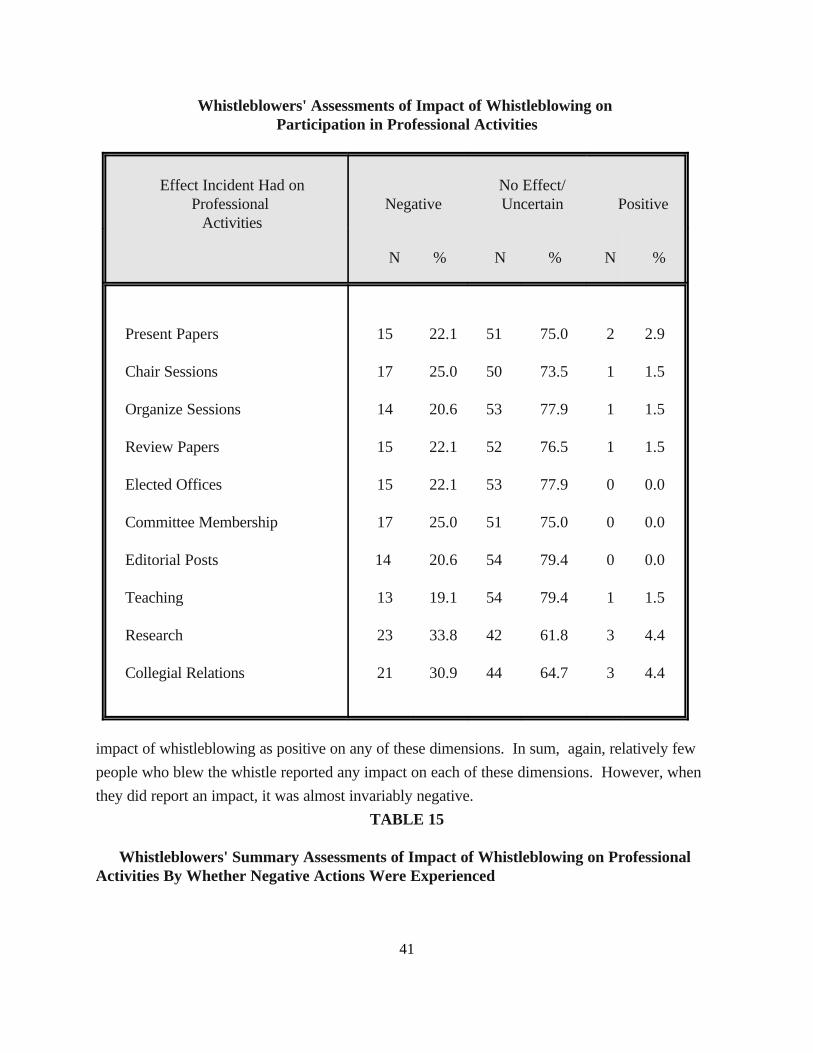
41
Whistleblowers' Assessments of Impact of Whistleblowing on Participation in Professional Activities
Effect Incident Had on No Effect/Professional Negative Uncertain Positive
Activities
N % N % N %
Present Papers 15 22.1 51 75.0 2 2.9
Chair Sessions 17 25.0 50 73.5 1 1.5
Organize Sessions 14 20.6 53 77.9 1 1.5
Review Papers 15 22.1 52 76.5 1 1.5
Elected Offices 15 22.1 53 77.9 0 0.0
Committee Membership 17 25.0 51 75.0 0 0.0
Editorial Posts 14 20.6 54 79.4 0 0.0
Teaching 13 19.1 54 79.4 1 1.5
Research 23 33.8 42 61.8 3 4.4
Collegial Relations 21 30.9 44 64.7 3 4.4
impact of whistleblowing as positive on any of these dimensions. In sum, again, relatively few
people who blew the whistle reported any impact on each of these dimensions. However, when
they did report an impact, it was almost invariably negative.
TABLE 15
Whistleblowers' Summary Assessments of Impact of Whistleblowing on Professional Activities By Whether Negative Actions Were Experienced
42
Negative Actions Experienced Total
Summary of Impact on Professional Activity Dimensions
Mostly Mostly Mostly Negative Mixed Neutral Positive
N % N % N % N %
All Complainants 68 19 27.9 5 7.4 44 64.7 0 0.0
Negative Actions Experienced No 21 0 0.0 0 0.0 21 100.0 0 0.0 Yes 47 19 40.4 5 10.6 23 0 0.0
48.9
Severity of Negative Action Severe Negative Action 17 10 58.8 2 11.8 5 29.4 0 0.0 Less Severe Negative Action 27 9 33.3 2 7.4 16 59.3 0 0.0 Unlisted Negative Action Only 3 0 0.0 1 33.3 2 66.7 0 0.0
The same pattern exhibited in Table 13 is replicated in Table 15, which compares a
summary of self-ratings of the impact of whistleblowing on participation in various professional
activities with reports of specific negative consequences experienced.
! Whistleblowers Overall. Among all whistleblowers, nearly two-thirds (65%)
rated the impact on their professional activities as "mostly neutral," just over one-
quarter (28%) rated the impact "mostly negative," and the rest (7%) rated the
impact as mixed negative and neutral. Not a single whistleblower reported that
their whistleblowing had a positive impact on their professional activities.
! Whistleblowers With/Without Negative Consequences. As in earlier tables, the
pattern shifts when we distinguish those who experienced no negative actions and
those who experienced a negative consequence. Every whistleblower who
reported experiencing no negative actions (100%), reported that blowing the
whistle had no impact on their professional activities. Those who experienced a
negative reaction were more divided in their opinions. Nearly half (49%) rated the
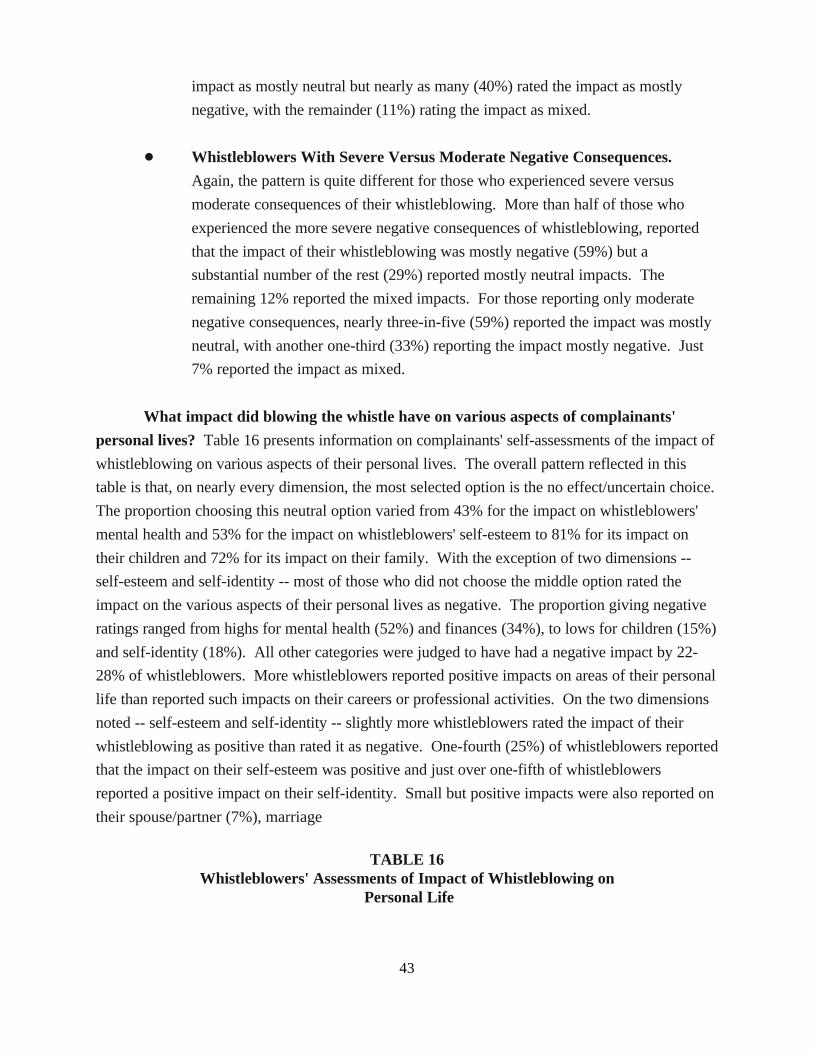
43
impact as mostly neutral but nearly as many (40%) rated the impact as mostly
negative, with the remainder (11%) rating the impact as mixed.
! Whistleblowers With Severe Versus Moderate Negative Consequences.
Again, the pattern is quite different for those who experienced severe versus
moderate consequences of their whistleblowing. More than half of those who
experienced the more severe negative consequences of whistleblowing, reported
that the impact of their whistleblowing was mostly negative (59%) but a
substantial number of the rest (29%) reported mostly neutral impacts. The
remaining 12% reported the mixed impacts. For those reporting only moderate
negative consequences, nearly three-in-five (59%) reported the impact was mostly
neutral, with another one-third (33%) reporting the impact mostly negative. Just
7% reported the impact as mixed.
What impact did blowing the whistle have on various aspects of complainants'
personal lives? Table 16 presents information on complainants' self-assessments of the impact of
whistleblowing on various aspects of their personal lives. The overall pattern reflected in this
table is that, on nearly every dimension, the most selected option is the no effect/uncertain choice.
The proportion choosing this neutral option varied from 43% for the impact on whistleblowers'
mental health and 53% for the impact on whistleblowers' self-esteem to 81% for its impact on
their children and 72% for its impact on their family. With the exception of two dimensions --
self-esteem and self-identity -- most of those who did not choose the middle option rated the
impact on the various aspects of their personal lives as negative. The proportion giving negative
ratings ranged from highs for mental health (52%) and finances (34%), to lows for children (15%)
and self-identity (18%). All other categories were judged to have had a negative impact by 22-
28% of whistleblowers. More whistleblowers reported positive impacts on areas of their personal
life than reported such impacts on their careers or professional activities. On the two dimensions
noted -- self-esteem and self-identity -- slightly more whistleblowers rated the impact of their
whistleblowing as positive than rated it as negative. One-fourth (25%) of whistleblowers reported
that the impact on their self-esteem was positive and just over one-fifth of whistleblowers
reported a positive impact on their self-identity. Small but positive impacts were also reported on
their spouse/partner (7%), marriage
TABLE 16Whistleblowers' Assessments of Impact of Whistleblowing on
Personal Life
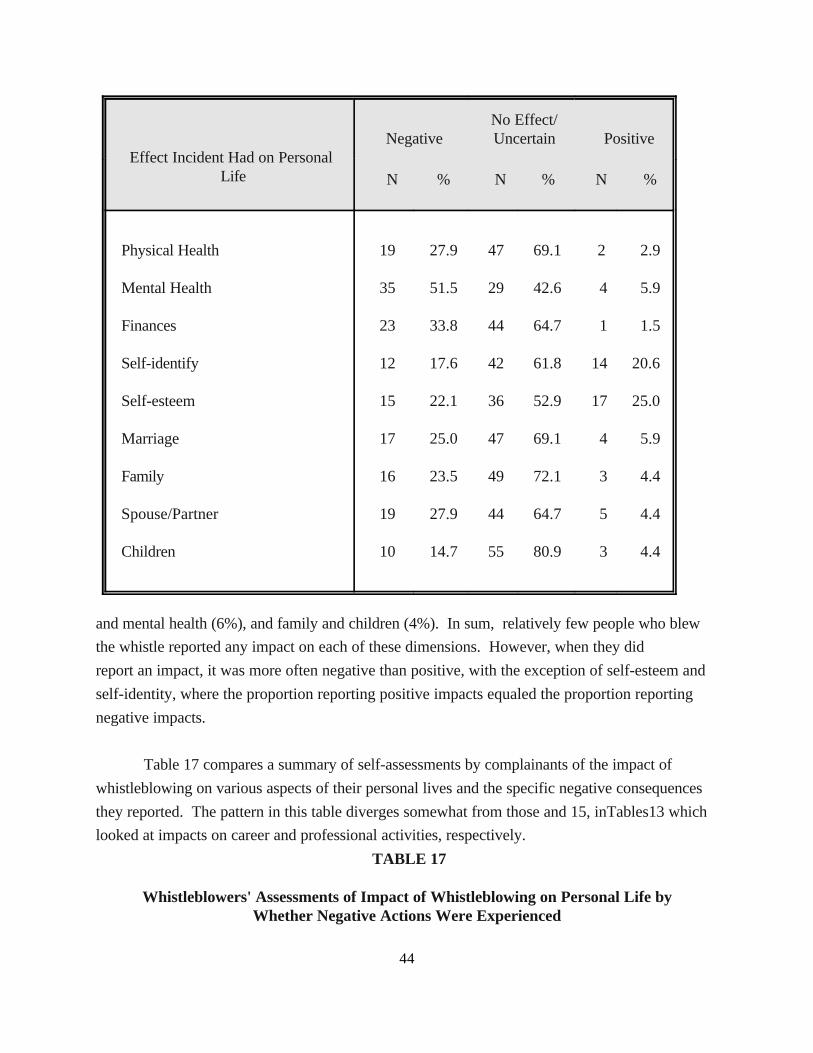
44
Effect Incident Had on Personal Life
Negative Uncertain PositiveNo Effect/
N % N % N %
Physical Health 19 27.9 47 69.1 2 2.9
Mental Health 35 51.5 29 42.6 4 5.9
Finances 23 33.8 44 64.7 1 1.5
Self-identify 12 17.6 42 61.8 14 20.6
Self-esteem 15 22.1 36 52.9 17 25.0
Marriage 17 25.0 47 69.1 4 5.9
Family 16 23.5 49 72.1 3 4.4
Spouse/Partner 19 27.9 44 64.7 5 4.4
Children 10 14.7 55 80.9 3 4.4
and mental health (6%), and family and children (4%). In sum, relatively few people who blew
the whistle reported any impact on each of these dimensions. However, when they did
report an impact, it was more often negative than positive, with the exception of self-esteem and
self-identity, where the proportion reporting positive impacts equaled the proportion reporting
negative impacts.
Table 17 compares a summary of self-assessments by complainants of the impact of
whistleblowing on various aspects of their personal lives and the specific negative consequences
they reported. The pattern in this table diverges somewhat from those and 15, inTables13 which
looked at impacts on career and professional activities, respectively.
TABLE 17
Whistleblowers' Assessments of Impact of Whistleblowing on Personal Life byWhether Negative Actions Were Experienced
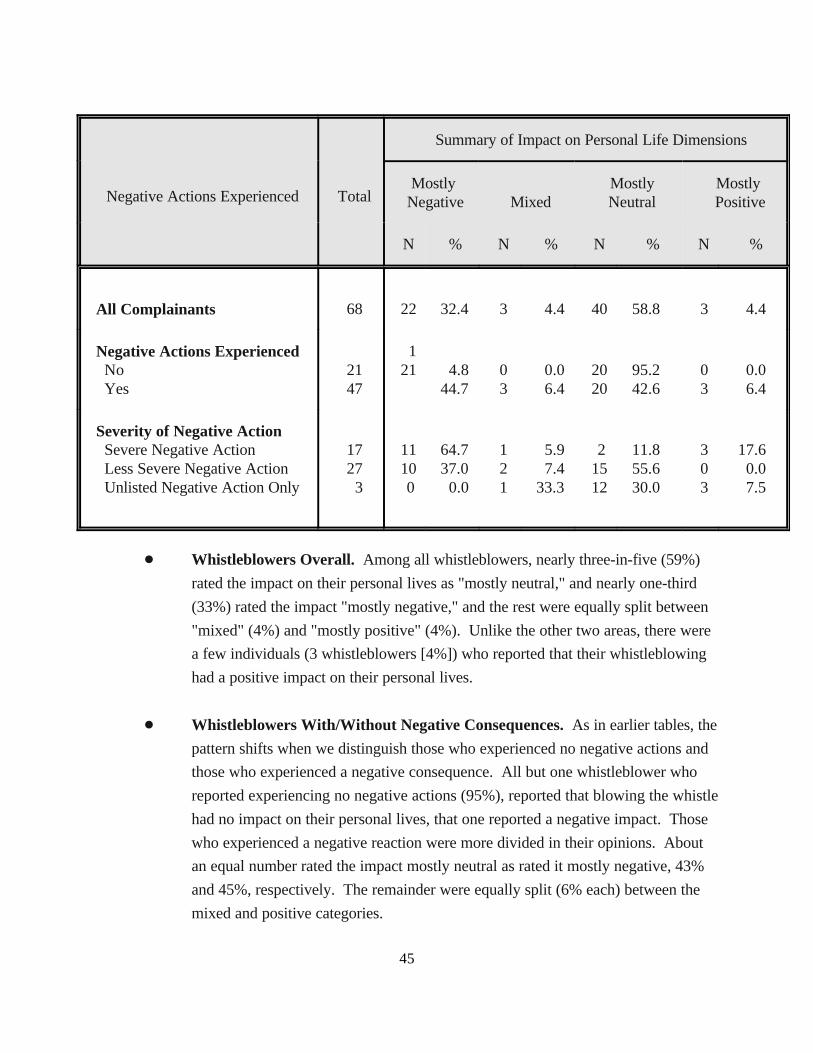
45
Negative Actions Experienced Total
Summary of Impact on Personal Life Dimensions
Mostly Mostly Mostly Negative Mixed Neutral Positive
N % N % N % N %
All Complainants 68 22 32.4 3 4.4 40 58.8 3 4.4
Negative Actions Experienced No 21 21 4.8 0 0.0 20 95.2 0 0.0 Yes 47 44.7 3 6.4 20 42.6 3 6.4
1
Severity of Negative Action Severe Negative Action 17 11 64.7 1 5.9 2 11.8 3 17.6 Less Severe Negative Action 27 10 37.0 2 7.4 15 55.6 0 0.0 Unlisted Negative Action Only 3 0 0.0 1 33.3 12 30.0 3 7.5
! Whistleblowers Overall. Among all whistleblowers, nearly three-in-five (59%)
rated the impact on their personal lives as "mostly neutral," and nearly one-third
(33%) rated the impact "mostly negative," and the rest were equally split between
"mixed" (4%) and "mostly positive" (4%). Unlike the other two areas, there were
a few individuals (3 whistleblowers [4%]) who reported that their whistleblowing
had a positive impact on their personal lives.
! Whistleblowers With/Without Negative Consequences. As in earlier tables, the
pattern shifts when we distinguish those who experienced no negative actions and
those who experienced a negative consequence. All but one whistleblower who
reported experiencing no negative actions (95%), reported that blowing the whistle
had no impact on their personal lives, that one reported a negative impact. Those
who experienced a negative reaction were more divided in their opinions. About
an equal number rated the impact mostly neutral as rated it mostly negative, 43%
and 45%, respectively. The remainder were equally split (6% each) between the
mixed and positive categories.
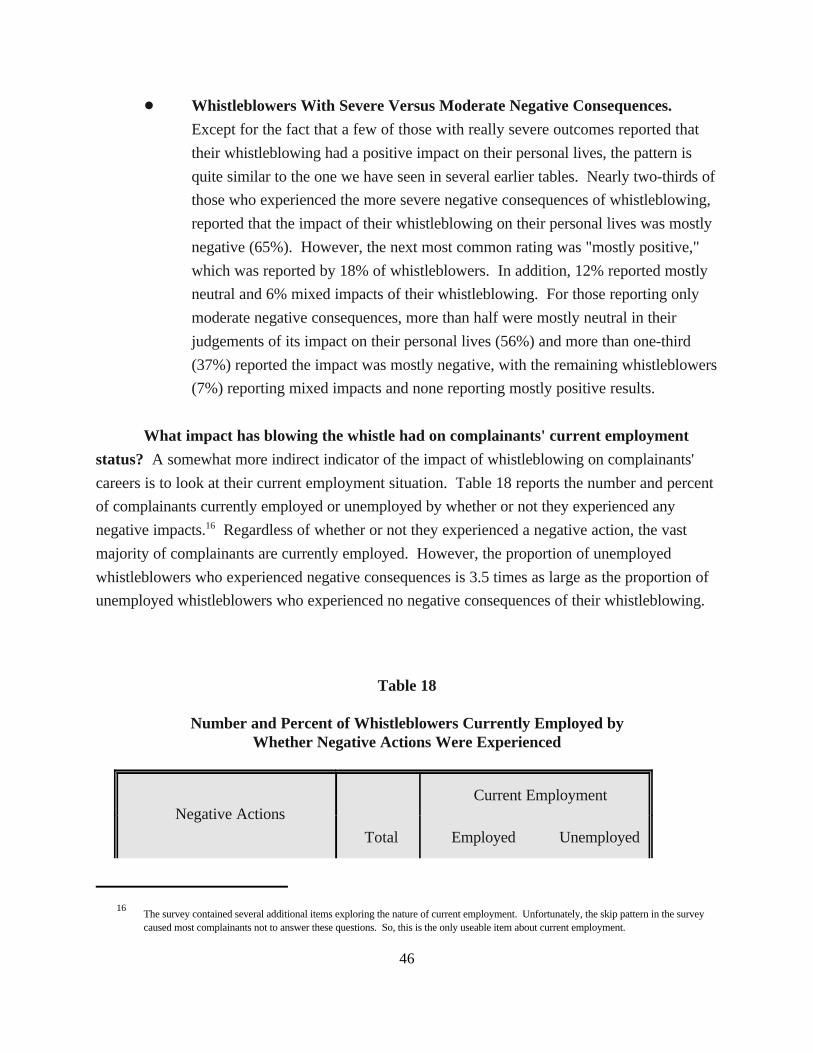
The survey contained several additional items exploring the nature of current employment. Unfortunately, the skip pattern in the survey16
caused most complainants not to answer these questions. So, this is the only useable item about current employment.
46
! Whistleblowers With Severe Versus Moderate Negative Consequences.
Except for the fact that a few of those with really severe outcomes reported that
their whistleblowing had a positive impact on their personal lives, the pattern is
quite similar to the one we have seen in several earlier tables. Nearly two-thirds of
those who experienced the more severe negative consequences of whistleblowing,
reported that the impact of their whistleblowing on their personal lives was mostly
negative (65%). However, the next most common rating was "mostly positive,"
which was reported by 18% of whistleblowers. In addition, 12% reported mostly
neutral and 6% mixed impacts of their whistleblowing. For those reporting only
moderate negative consequences, more than half were mostly neutral in their
judgements of its impact on their personal lives (56%) and more than one-third
(37%) reported the impact was mostly negative, with the remaining whistleblowers
(7%) reporting mixed impacts and none reporting mostly positive results.
What impact has blowing the whistle had on complainants' current employment
status? A somewhat more indirect indicator of the impact of whistleblowing on complainants'
careers is to look at their current employment situation. Table 18 reports the number and percent
of complainants currently employed or unemployed by whether or not they experienced any
negative impacts. Regardless of whether or not they experienced a negative action, the vast16
majority of complainants are currently employed. However, the proportion of unemployed
whistleblowers who experienced negative consequences is 3.5 times as large as the proportion of
unemployed whistleblowers who experienced no negative consequences of their whistleblowing.
Table 18
Number and Percent of Whistleblowers Currently Employed byWhether Negative Actions Were Experienced
Negative ActionsCurrent Employment
Total Employed Unemployed

47
N % N %
All Whistleblowers
Not Experienced 21 20 95.2 1 4.8
Experienced 47 39 83.0 8 17.0
68 59 86.8 9 13.2
Is there a stigma associated with whistleblowing? Table 19 reports on complainants'
beliefs about whether or not blowing the whistle stigmatizes the whistleblower.
! Whistleblowers Overall. Overall, nearly three-fourths of complainants believe
that it definitely (56%) or probably (19%) stigmatizes the whistleblower. Only
about one-sixth of complainants (18%) believe that it is not stigmatizing.
! Whistleblowers With/Without Negative Consequences. The pattern of beliefs
is distinctly different for those who experienced negative consequences and those
who did not. Among those who experienced no adverse outcomes, one-third
believe there is a stigma attached to whistleblowing (33%) and nearly one-fourth
(24%) think there probably is such a stigma, while 29% believe there is no stigma
attached to whistleblowing and a few (14%) are uncertain. For those who
experienced a negative action, two-thirds (66%) believe there is definitely a stigma
and an additional 17% believe there is probably a stigma associated with
TABLE 19 Whistleblowers' Perceptions of Stigma Attached to Whistleblowing by Whether Negative Actions Were Experienced
Negative Actions Total
Stigma Attached to Whistleblowing
No Probably Yes Uncertain
N % N % N % N %
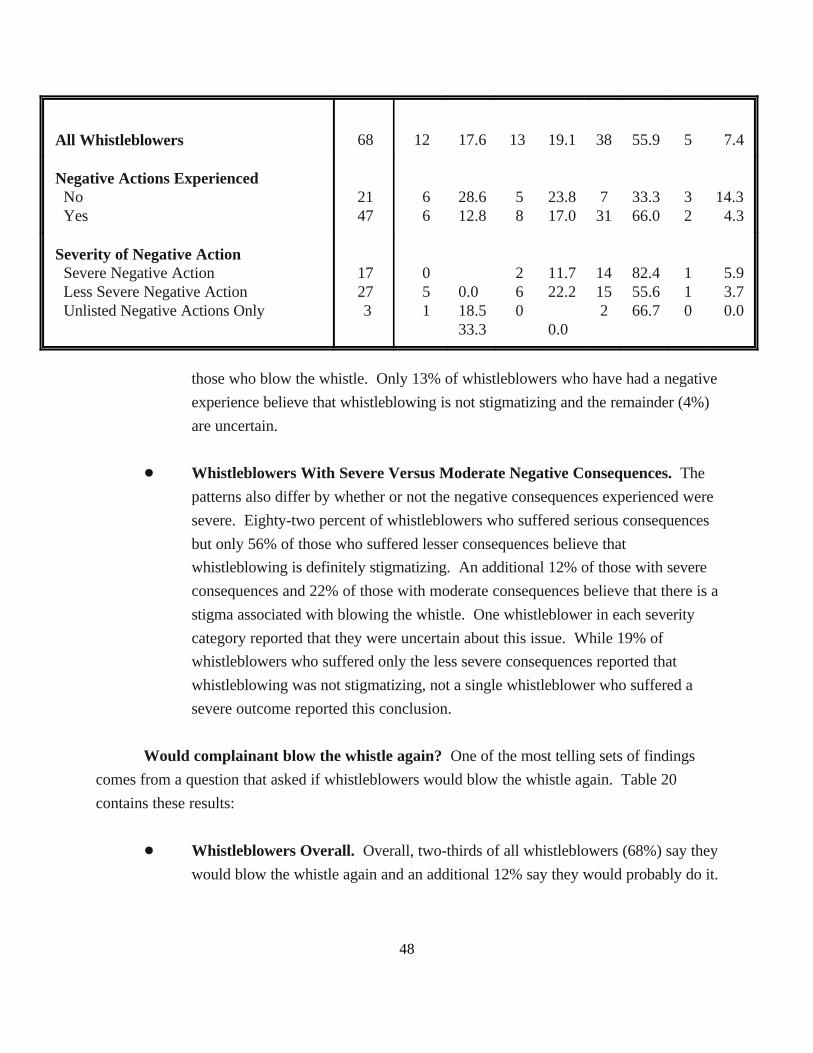
48
All Whistleblowers 68 12 17.6 13 19.1 38 55.9 5 7.4
Negative Actions Experienced No 21 6 28.6 5 23.8 7 33.3 3 14.3 Yes 47 6 12.8 8 17.0 31 66.0 2 4.3
Severity of Negative Action Severe Negative Action 17 0 2 11.7 14 82.4 1 5.9 Less Severe Negative Action 27 5 0.0 6 22.2 15 55.6 1 3.7 Unlisted Negative Actions Only 3 1 18.5 0 2 66.7 0 0.0
33.3 0.0
those who blow the whistle. Only 13% of whistleblowers who have had a negative
experience believe that whistleblowing is not stigmatizing and the remainder (4%)
are uncertain.
! Whistleblowers With Severe Versus Moderate Negative Consequences. The
patterns also differ by whether or not the negative consequences experienced were
severe. Eighty-two percent of whistleblowers who suffered serious consequences
but only 56% of those who suffered lesser consequences believe that
whistleblowing is definitely stigmatizing. An additional 12% of those with severe
consequences and 22% of those with moderate consequences believe that there is a
stigma associated with blowing the whistle. One whistleblower in each severity
category reported that they were uncertain about this issue. While 19% of
whistleblowers who suffered only the less severe consequences reported that
whistleblowing was not stigmatizing, not a single whistleblower who suffered a
severe outcome reported this conclusion.
Would complainant blow the whistle again? One of the most telling sets of findings
comes from a question that asked if whistleblowers would blow the whistle again. Table 20
contains these results:
! Whistleblowers Overall. Overall, two-thirds of all whistleblowers (68%) say they
would blow the whistle again and an additional 12% say they would probably do it.
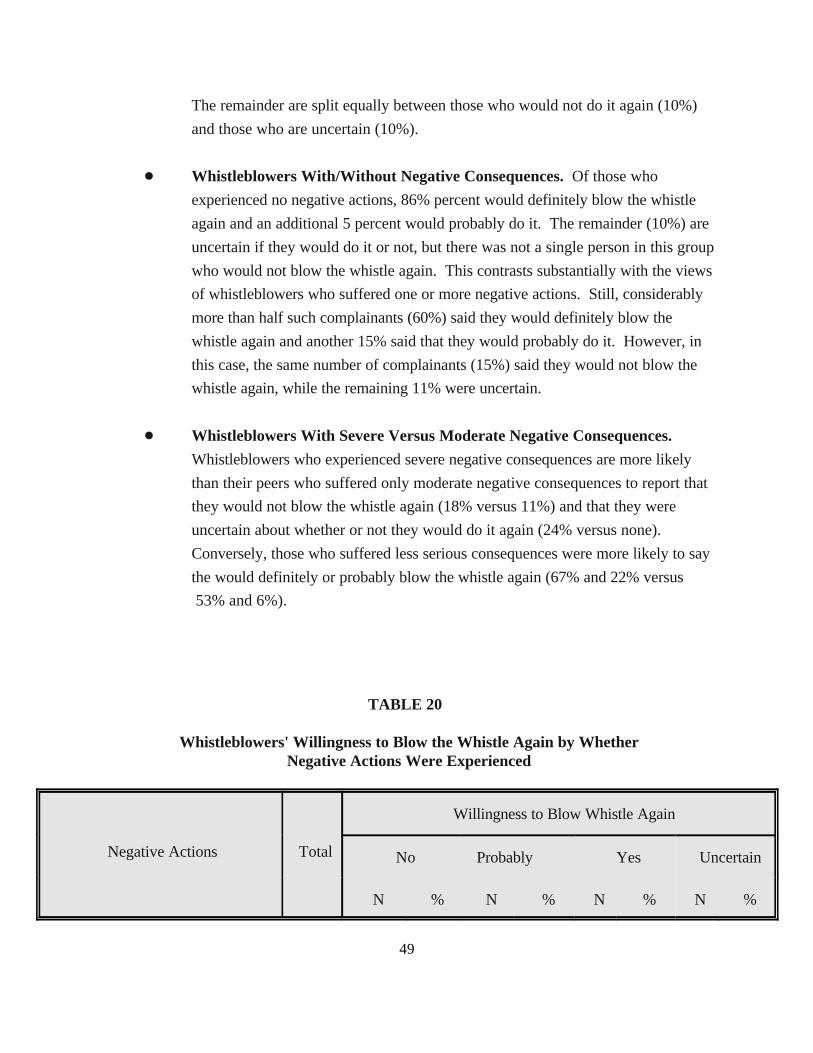
49
The remainder are split equally between those who would not do it again (10%)
and those who are uncertain (10%).
! Whistleblowers With/Without Negative Consequences. Of those who
experienced no negative actions, 86% percent would definitely blow the whistle
again and an additional 5 percent would probably do it. The remainder (10%) are
uncertain if they would do it or not, but there was not a single person in this group
who would not blow the whistle again. This contrasts substantially with the views
of whistleblowers who suffered one or more negative actions. Still, considerably
more than half such complainants (60%) said they would definitely blow the
whistle again and another 15% said that they would probably do it. However, in
this case, the same number of complainants (15%) said they would not blow the
whistle again, while the remaining 11% were uncertain.
! Whistleblowers With Severe Versus Moderate Negative Consequences.
Whistleblowers who experienced severe negative consequences are more likely
than their peers who suffered only moderate negative consequences to report that
they would not blow the whistle again (18% versus 11%) and that they were
uncertain about whether or not they would do it again (24% versus none).
Conversely, those who suffered less serious consequences were more likely to say
the would definitely or probably blow the whistle again (67% and 22% versus
53% and 6%).
TABLE 20
Whistleblowers' Willingness to Blow the Whistle Again by Whether Negative Actions Were Experienced
Negative Actions Total
Willingness to Blow Whistle Again
No Probably Yes Uncertain
N % N % N % N %
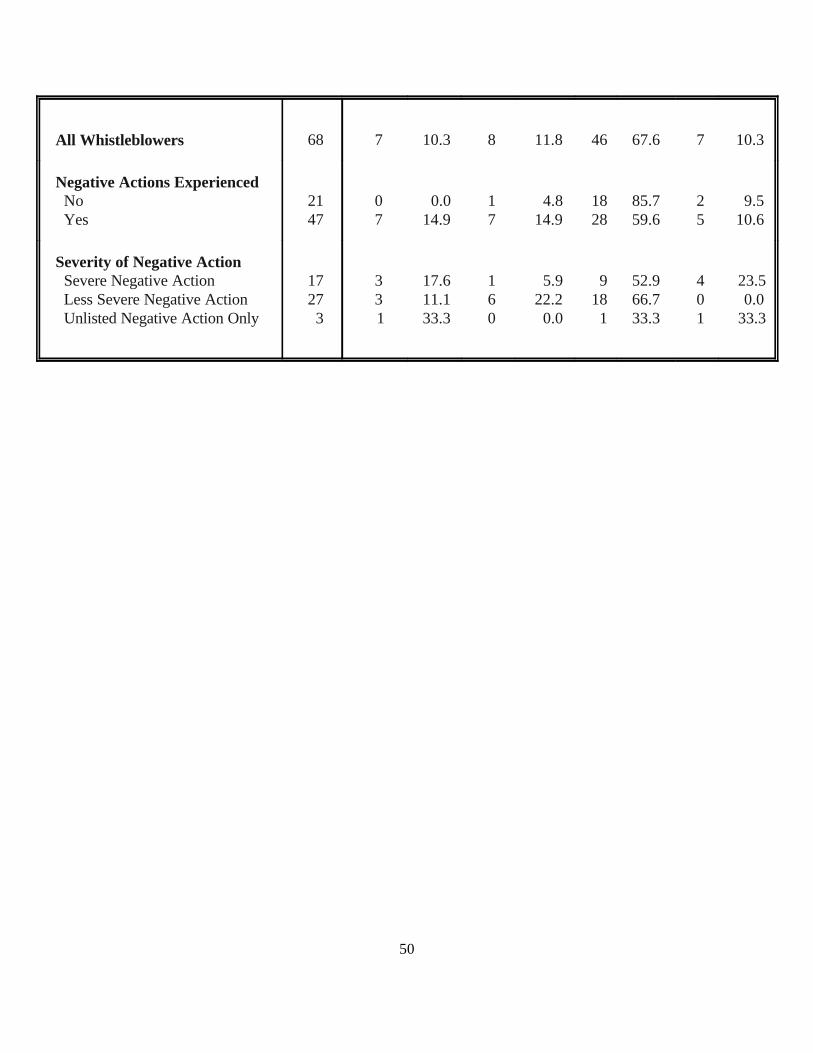
50
All Whistleblowers 68 7 10.3 8 11.8 46 67.6 7 10.3
Negative Actions Experienced No 21 0 0.0 1 4.8 18 85.7 2 9.5 Yes 47 7 14.9 7 14.9 28 59.6 5 10.6
Severity of Negative Action Severe Negative Action 17 3 17.6 1 5.9 9 52.9 4 23.5 Less Severe Negative Action 27 3 11.1 6 22.2 18 66.7 0 0.0 Unlisted Negative Action Only 3 1 33.3 0 0.0 1 33.3 1 33.3
51
5. Conclusions and Recommendations
The evidence presented in this report provides a clear picture of what the impacts of
whistleblowing have been on whistleblowers. The data also provide some insights into what types
of whistleblowers are more or less likely to suffer adverse results for their efforts and the
circumstances under which whistleblowers suffer or escape negative consequences. In this
section of the report, we synthesize our findings and draw a series of conclusions about the
impacts of whistleblowing on whistleblowers. Along the way, we offer some recommendations
for ORI and Commission consideration in ameliorating the problems experienced by many who
allege misconduct in science.
In all of this, it is important to keep in mind that the cases in our study, may represent only
the tip of the iceberg. They are cases that were reported and that came to the attention of ORI
(or its predecessor agencies). The data, therefore, provide no insights beyond these cases -- to
cases reported but never pursued or noted in an official record or to instances of misconduct that
were not reported (for fear of retaliation or for other reasons). Nevertheless, the patterns we
observed, since they represent the first effort to explore the experiences of those who report
misconduct in science cases, should prove very useful to ORI and the Commission as they
continue their efforts to encourage whistleblowing and protect whistleblowers in such cases.
Extent to which whistleblowing resulted in negative outcomes. Our first set of
conclusions concerns the extent to which complainants in closed cases experienced adverse
consequences of their whistleblowing. Among the most significant findings in this area are the
following:
! More than two-thirds of all whistleblowers reported experiencing at least one
negative outcome as a direct result of their whistleblowing. Conversely, nearly
one-third did not experience any adverse consequences of blowing the whistle.
! Whistleblowers most likely to have experienced an adverse outcome of their
whistleblowing included:
* lower ranking faculty and students/fellows in basic science departments;
52
* those who alleged misconduct by their colleagues.
! Whistleblowers least likely to have experienced an adverse outcome of their
whistleblowing included:
* academics in clinical departments;
* workers in non-academic settings (particularly government workers);
* those with senior administrative positions in their institutions;
* those who allege misconduct by individuals at a different institution.
! Blowing the whistle was most likely to have adverse outcomes in situations in
which:
* fabrication of data was alleged;
* the case received some publicity;
* the allegations were made to a senior administrative official or misconduct
official of the institution or to the funding agency;
* the allegations were made both within and outside the institution;
* the allegations were made to many different types of individuals;
* the allegations were subjected to an investigation without recourse to an
initial inquiry.
! Blowing the whistle was least likely to result in adverse outcomes in situations
in which:
* the allegations were made only within the institution;
* the allegations were made to only a single individual.
In general, these findings suggest that whistleblowers are most at risk of adverse
outcomes in high profile cases in the basic sciences, especially when those cases gain notoriety
outside the institution and the complainant is a lower ranking faculty member or student.
Institutional officials and funding agencies appear to put the interests of their organization above
those of the whistleblower. While this may well seem appropriate to such officials and agencies,
because more than 70 percent of cases result in no findings of misconduct (according to ORI
records), this pattern definitely suggests a failure in mechanisms to protect vulnerable

These findings are drawn from Table 4, in which the unit reported is the outcome, not the complainant.17
These findings are drawn from Table 7, in which the unit reported is the complainant.18
53
whistleblowers from retaliation. When whistleblowers turn to those closer at hand -- laboratory
chiefs or center directors -- and keep their allegations low key, they tend to fare better. Though
we did not examine it in this report, it would be interesting to know if the outcomes differ for
cases handled in these different ways.
Types of negative outcomes experienced. Not surprisingly, the most common negative
consequences of blowing the whistle are the least severe. When we consider each negative
consequence whistleblowers could report independently, allowing each whistleblower to indicate
as many consequences as they experienced, the most commonly experienced negative outcomes
of whistleblowing included the following:17
! Two-in-five complainants reported that they were pressured to drop their
allegations and almost the same number reported being subjected to counter
allegations;
! One-in-four complainants reported that they were ostracized by colleagues;
! One-in-five complainants reported reductions in their level of research support;
! One-in-seven complainants reported being threatened with or actually facing a
lawsuit; and
! Fewer than one-in-eight complainants reported each of the following more serious
negative outcomes -- being fired, not being renewed, being denied a salary
increase, losing travel funds, staff support, and desirable work assignments, being
denied promotion (9%), and being denied tenure.
While this pattern holds for each item taken individually, our analysis indicated that, when
complainants are classified according to the most serious of the consequences they suffered (and
counted only once):18

54
! Fully one-in-four reported experiencing at least one serious negative consequence
(including losing their position or otherwise being denied advancement), as a
result of their whistleblowing.
! An additional two-in-five reported experiencing a less serious type of negative
outcome (such as losing research support or opportunities or being hassled,
pressured, or delayed) as a result of their whistleblowing.
! Fewer than one-in-three complainants reported no negative consequences as a
result of whistleblowing.
Obviously, there is much room for improvement in protecting whistleblowers.
Fortunately, there are some hints in our data about how to focus regulatory, monitoring, and
enforcement efforts to improve this situation. For example, the evidence suggests that:
! The seeds of nearly every negative action taken against a whistleblower is sown
during the active phase of the investigation. Very few whistleblowers suffer
adverse consequences exclusively in the period after the case is closed.
! The most serious negative consequences -- loss of position, loss of research
resources or opportunity, and denial of advancement -- simply do not happen
without substantial involvement and direction by institutional officials.
! Lesser negative outcomes -- hassles, pressures, and delays -- also frequently come
from institutional officials but are equally as likely to come from the accused.
These findings suggest that for whistleblowers to suffer the most serious negative
outcomes, institutional officials must play a significant role in dealing with their cases. The
accused can also cause problems for whistleblowers but generally the consequences attributed to
the accused tend to be more widespread but less severe than those attributed to institutional
officials.
Complainants' assessments of their whistleblowing experience. Complainants' views
of the impact of their whistleblowing experiences on them were significantly affected by whether
55
or not they experienced any adverse outcomes and by what type of negative actions resulted from
their whistleblowing. For example:
! When whistleblowers did not experience a negative consequence as a result of
blowing the whistle, they almost invariably reported that their whistleblowing had
"no effects" at all on their careers, professional activities, or personal lives. Only a
third of them believed that whistleblowing was definitely stigmatizing and another
quarter thought it probably was. More than 90 percent said they would definitely
or probably blow the whistle again, with the rest undecided but with not a single
person saying they would not blow the whistle again.
! When whistleblowers experienced any negative consequence, this pattern
changed dramatically. A much smaller proportion (less than half) of these
whistleblowers reported that their whistleblowing had "no effects" on their careers,
professional activities, or personal lives, while a full third or more reported that
their whistleblowing had a negative impact on all these dimensions. Two-thirds of
these whistleblowers thought that blowing the whistle was definitely stigmatizing,
more than four-fifths thought it definitely or probably was. Surprisingly, three-
fourths of even these whistleblowers who suffered severe negative consequences
said they would definitely or probably blow the whistle again. However, nearly
one-in-six said they definitely would not. Not surprisingly, those who suffered the
most severe consequences were even more definitive in stating that they would not
blow the whistle again.
If the Public Health Service is to avoid these long-term negative impacts of
whistleblowing, it is clear that it must intervene to prevent the specific negative consequences
from occurring in the first place. The evidence from this study suggests that the place to focus
interventions is in basic science departments and to focus on the role of institutional and
departmental officials. It also suggests that potential whistleblowers be counseled regarding the
likely harm they will suffer if they make their case a cause celebre, taking their concerns outside
their institution or getting their case publicized by the media.
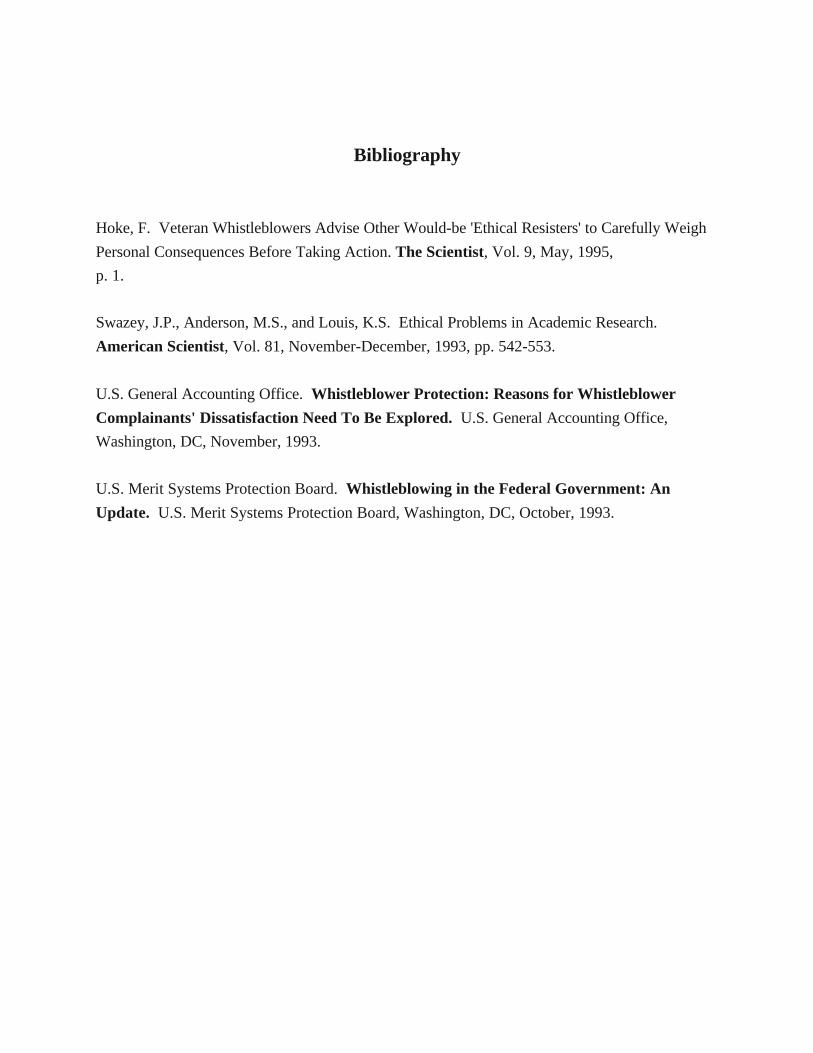
Bibliography
Hoke, F. Veteran Whistleblowers Advise Other Would-be 'Ethical Resisters' to Carefully Weigh
Personal Consequences Before Taking Action. The Scientist, Vol. 9, May, 1995,
p. 1.
Swazey, J.P., Anderson, M.S., and Louis, K.S. Ethical Problems in Academic Research.
American Scientist, Vol. 81, November-December, 1993, pp. 542-553.
U.S. General Accounting Office. Whistleblower Protection: Reasons for Whistleblower
Complainants' Dissatisfaction Need To Be Explored. U.S. General Accounting Office,
Washington, DC, November, 1993.
U.S. Merit Systems Protection Board. Whistleblowing in the Federal Government: An
Update. U.S. Merit Systems Protection Board, Washington, DC, October, 1993.
APPENDIX A
Survey Instrument and Recruitment Letters
Dear Participant:
The Office of Research Integrity (ORI) has contracted with Research Triangle Institute (RTI) to
conduct a survey to investigate the topic of misconduct in scientific research.
ORI, located in the Office of the Assistant Secretary for Health, is conducting the study because it
develops the policies and procedures by which the Public Health Service handles reports of
misconduct in science.
We are asking you to participate in this survey as a member of the scientific community who has some
familiarity with this issue. The survey will be mailed in the next few months. To insure that the
survey reaches you in a timely manner, we ask that you confirm or correct the address information
contained on the enclosed sheet and return the sheet in the prepaid envelope provided. If you
know you will be moving within the next few months but are uncertain of the location, please indicate
this on the form and return it anyway.
Please be assured that the questionnaire will not ask any specific identifying information. Your
participation will, of course, be voluntary. However, we sincerely hope you will participate in the
project because its success will require the input of individuals, such as yourself. If you have any
questions about the survey or any other aspect of this study, please feel free to call Mary-Anne Ardini
at Research Triangle Institute, 1615 M St. NW, Washington, D.C. 20036, 1-800-334-8571 extension
2055.
Thank you very much for your help and we look forward to receiving the completed address form
back from you.
Sincerely,
Lawrence J. Rhoades, Ph.D., Director Jim Lubalin, Ph.D., Project Director
Division of Policy and Education Research Triangle Institute
Office of Research Integrity
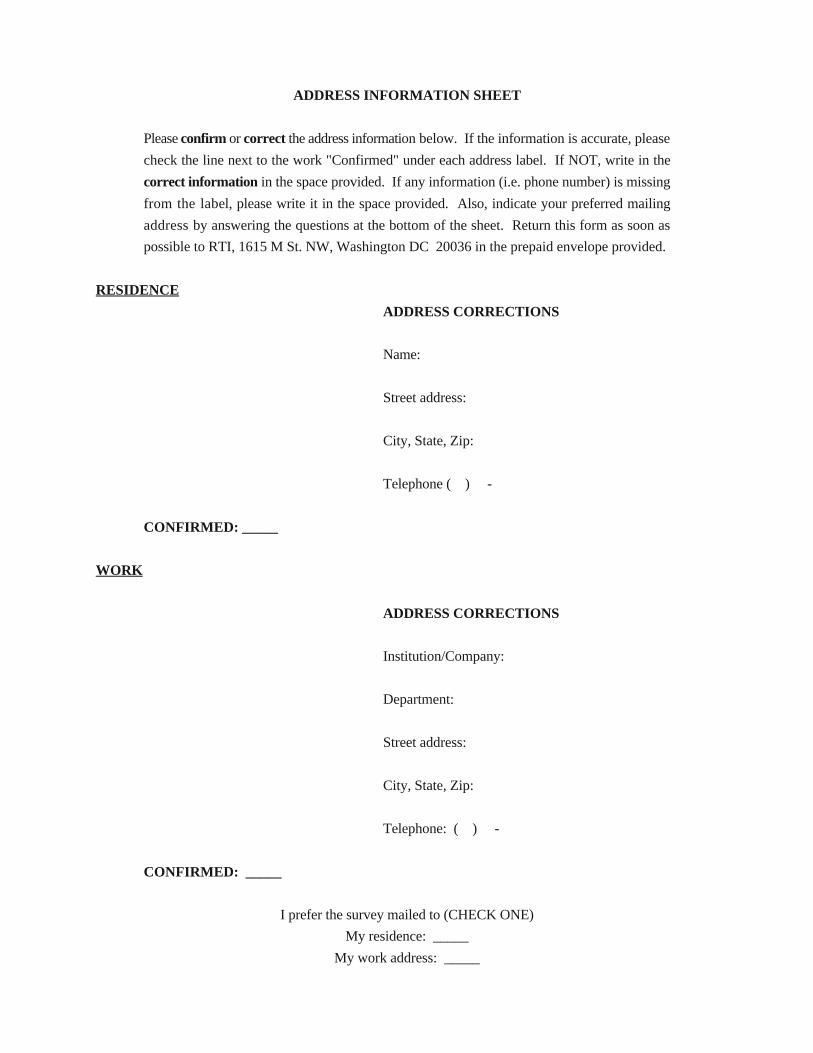
ADDRESS INFORMATION SHEET
Please confirm or correct the address information below. If the information is accurate, please
check the line next to the work "Confirmed" under each address label. If NOT, write in the
correct information in the space provided. If any information (i.e. phone number) is missing
from the label, please write it in the space provided. Also, indicate your preferred mailing
address by answering the questions at the bottom of the sheet. Return this form as soon as
possible to RTI, 1615 M St. NW, Washington DC 20036 in the prepaid envelope provided.
RESIDENCE
ADDRESS CORRECTIONS
Name:
Street address:
City, State, Zip:
Telephone ( ) -
CONFIRMED: _____
WORK
ADDRESS CORRECTIONS
Institution/Company:
Department:
Street address:
City, State, Zip:
Telephone: ( ) -
CONFIRMED: _____
I prefer the survey mailed to (CHECK ONE)
My residence: _____
My work address: _____
Public reporting burden for this collection of information is estimated to average 32 minutes. Send comments regarding this burden estimate or any other aspect ofthis collection of information, including suggestions for reducing this burden to: Reports Clearance Office, PHS; Attn:PRA; Room 721-B, Humphrey Bldg; 200Independence Ave. S.W. Washington D.C. 20201; and to Office of Management and Budget; Paperwork Reduction Project(0937-XXXX);Washington D.C.
OMB #: 0937-0202
Exp : 12/31/94
Dear Survey Participant:
The Office of Research Integrity (ORI) has contracted with Research Triangle Institute (RTI) to conduct a survey of individuals who have
reported misconduct in science. This survey which is being conducted under the authority of Section 493 of the Public Health Service Act
(42 U.S.C. 289b) will determine some things that have happened to them as a result of making such a report. The survey includes only
those individuals whose claims have come to the attention of ORI and whose cases are closed.
As you know, there is considerable speculation about the consequences of reporting misconduct. Unfortunately, the information available
is primarily anecdotal. With this survey, which will involve 75-100 individuals like you, we hope to compile qualitative and quantitative
data to form a clearer picture of the consequences of those who allege misconduct in science.
ORI, located in the Office of the Assistant Secretary for Health, is conducting the study because it develops the policies and procedures
by which the Public Health Service handles reports of misconduct in science. One policy area of major concern is the protection of
individuals who report misconduct.
Since ORI records on closed misconduct cases indicate that you reported misconduct in science, we are asking you to participate in the
survey. Please complete and return the attached questionnaire in the envelope provided. The questions will not ask any specific identifying
information. The information that is collected from this survey will be maintained as part of a system of records defined by the Privacy
Act (5 U.S.C. 552a). The system number and title is 09-25-0156, "Records of Participation in Programs and Respondents in Surveys Used
to Evaluate Programs of the Public Health Service, HHS/PHS/NIH." No individual will be identified in any report or publication resulting
from this survey. The questionnaire is numbered only to assist us in our follow-up efforts and will not be used to identify you with your
responses. The link between you and your responses will be destroyed after analysis is completed.
There is little or no risk or benefit associated with inclusion in this study and your participation is, of course, voluntary. We sincerely hope
you take part in this survey because this important issue needs input from those who have gone through the experience. If you have any
questions about the survey or any other aspect of the study, please feel free to call Mary-Anne Ardini at RTI, 1-800-334-8571 ext 2055.
If you have questions about your rights and protections as a survey participant, please call Barbara Moser at RTI, 1-800-334-8571 ext
6083.
Thank you very much for your help and we look forward to your partipation in this survey.
Sincerely,
Lawrence Rhoades, Ph.D. James S. Lubalin, Ph.D.
Director Project Director
Division of Policy and Education Research Triangle Institute
Office of Research Integrity
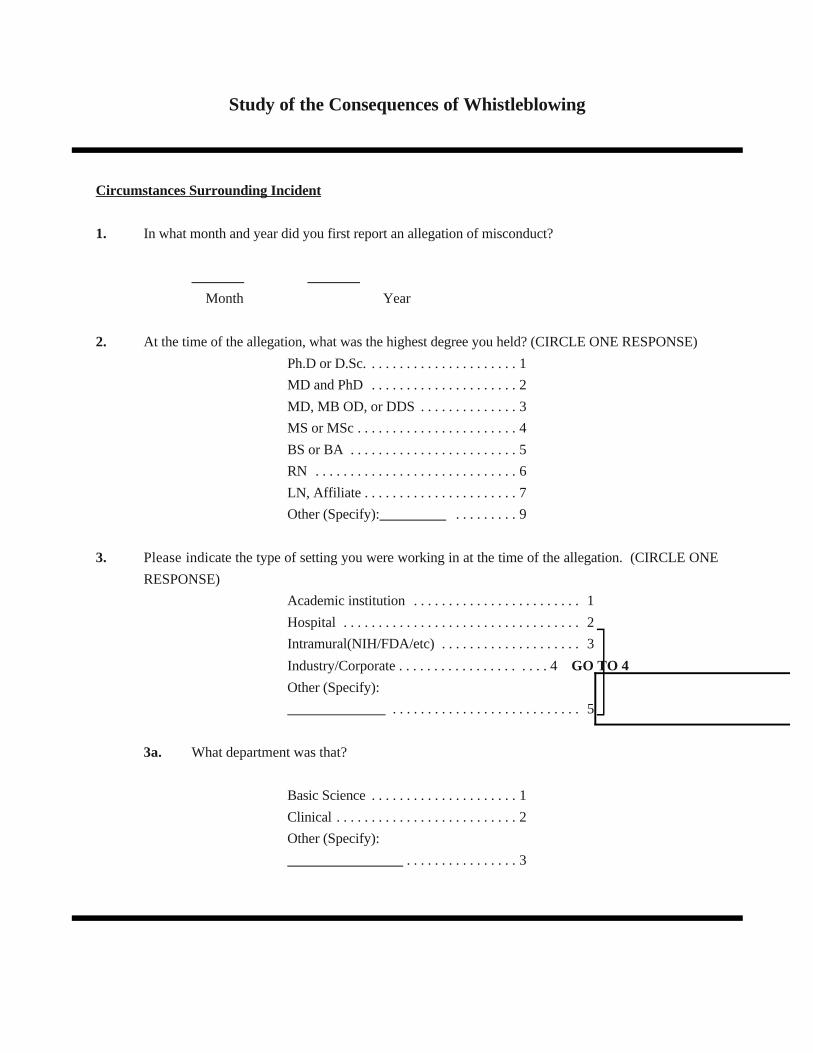
Study of the Consequences of Whistleblowing
Circumstances Surrounding Incident
1. In what month and year did you first report an allegation of misconduct?
Month Year
2. At the time of the allegation, what was the highest degree you held? (CIRCLE ONE RESPONSE)
Ph.D or D.Sc. . . . . . . . . . . . . . . . . . . . . . 1
MD and PhD . . . . . . . . . . . . . . . . . . . . . 2
MD, MB OD, or DDS . . . . . . . . . . . . . . 3
MS or MSc . . . . . . . . . . . . . . . . . . . . . . . 4
BS or BA . . . . . . . . . . . . . . . . . . . . . . . . 5
RN . . . . . . . . . . . . . . . . . . . . . . . . . . . . . 6
LN, Affiliate . . . . . . . . . . . . . . . . . . . . . . 7
Other (Specify): . . . . . . . . . 9
3. Please indicate the type of setting you were working in at the time of the allegation. (CIRCLE ONE
RESPONSE)
Academic institution . . . . . . . . . . . . . . . . . . . . . . . . 1
Hospital . . . . . . . . . . . . . . . . . . . . . . . . . . . . . . . . . . 2
Intramural(NIH/FDA/etc) . . . . . . . . . . . . . . . . . . . . 3
Industry/Corporate . . . . . . . . . . . . . . . . . . . . . 4 GO TO 4
Other (Specify):
. . . . . . . . . . . . . . . . . . . . . . . . . . . 5 �3a. What department was that?
Basic Science . . . . . . . . . . . . . . . . . . . . . 1
Clinical . . . . . . . . . . . . . . . . . . . . . . . . . . 2
Other (Specify):
. . . . . . . . . . . . . . . . 3
4. At the time of the allegation, what was the nature of the salary support for your position? (CIRCLE ONE
RESPONSE)
100% university funds. . . . . . . . . . . . 1 (GO TO 5)
Combination of university funding
and extramural funding . . . . . . . . . . . . . . . . . . 2
100% extramural funding . . . . . . . . . . . . . . . . 3
Unpaid position/student only . . . . . . . . . . . . . . 4
NOT APPLICABLE . . . . . . . . . . . . . . . 5 GO TO 5
DON'T KNOW . . . . . . . . . . . . . . . . . . . . . . . . 8 �4a. Indicate the source(s) of extramural funding. (CIRCLE ALL THAT APPLY)
State funding . . . . . . . . . . . . . . . . . . . . . 1
Research Grant/Contract . . . . . . . . . . . . 2
Program Project Grant . . . . . . . . . . . . . . 3
Industrial Grant/Contract . . . . . . . . . . . . 4
Fellowship/Traineeship . . . . . . . . . . . . . 5
Other (Specify) . . . . . . . . . . 6
DON'T KNOW . . . . . . . . . . . . . . . . . . . 8
5. What was your position at the institution at the time of the allegation? (CIRCLE ALL THAT APPLY)
Professor . . . . . . . . . . . . . . . . . . . . . . . 01
Associate Professor . . . . . . . . . . . . . . . 02
Assistant Professor . . . . . . . . . . . . . . . 03
Instructor/Lecturer . . . . . . . . . . . . . . . . 04
Senior Administrator . . . . . . . . . . . . . . 05
Dept. Chair/Head . . . . . . . . . . . . . . . . . 06
Division Head . . . . . . . . . . . . . . . . . . . 07
Laboratory Chief . . . . . . . . . . . . . . . . . 08
Section Chief . . . . . . . . . . . . . . . . . . . . 09
Senior Consultant . . . . . . . . . . . . . . . . 10
Resident/Intern . . . . . . . . . . . . . . . . . . . 11
Staff Scientist . . . . . . . . . . . . . . . . . . . . . . . . 12
Principal/Independent Investigator . . . . . . . 13
Postdoctoral Fellow . . . . . . . . . . . . . . . . . . . 14
Research Associate . . . . . . . . . . . . . . . . . . . 15
Nurse . . . . . . . . . . . . . . . . . . . . . . . . . . . . . . 16
Technician . . . . . . . . . . . . . . . . . . . . . . . . . . 17
Support/Secretarial Staff . . . . . . . . . . . . . . . 18
Medical Student . . . . . . . . . . . . . . . . . . . . . . 19
Graduate Student . . . . . . . . . . . . . . . . . . . . . 20
Undergraduate Student . . . . . . . . . . . . . . . . 21
Other (Specify) . . . . . . . . . . . . . 22
5a. Were you...(CIRCLE ONE RESPONSE)
tenured . . . . . . . . . . . . . . . . . . . . . . . . . . 1
tenure track . . . . . . . . . . . . . . . . . . . . . . 2
nontenure track . . . . . . . . . . . . . . . . . . . 3
visiting or adjunct . . . . . . . . . . . . . . . . . 4
NOT APPLICABLE . . . . . . . . . . . . . . . 5
6. Was your position full time, part time, a temporary position with a duration of less than one year or were
you a student only? (CIRCLE ONE RESPONSE)
Full time . . . . . . . . . . . . . . . . . . . . . . . . . 1
Part time . . . . . . . . . . . . . . . . . . . . . . . . . 2
Temporary . . . . . . . . . . . . . . . . . . . . . . . 3
Student only . . . . . . . . . . . . . . . . . . . . . . 4
7. At the time of the allegation, what was your relationship to the accused? (CIRCLE ALL THAT APPLY.
IF MORE THAN ONE ACCUSED, MARK THE APPROPRIATE COLUMN FOR EACH)
I was the: cused Accused Accused
Of Of Of
Person 1 Ac- Person 2 Person 3
Supervisor/superior . . . . . 01 01 01
Collaborator . . . . . . . . . . . 02 02 02
Reviewer . . . . . . . . . . . . . 03 03 03
Colleague in the same de-
partment . . . . . . . . . . . . . . 04 04 04
Colleague in a different
department . . . . . . . . . . . . 05 05 05
Scientist/clinician at differ-
ent institution . . . . . . . . . . 06 06 06
Post-doctoral fellow . . . . . 07 07 07
Graduate student . . . . . . . 08 08 08
Undergraduate student . . . 09 09 09
Subordinate . . . . . . . . . . . 10 10 10
Other (Specify):
. . . . . . . . . . 11 11 11
Whistleblowing Incident
8. What type(s) of misconduct was alleged? (CIRCLE ALL THAT APPLY. IF MORE THAN ONE
ACCUSED, MARK THE APPROPRIATE COLUMN FOR EACH)
Person 1 Person 2 Person 3
Accused of: Accused of: Accused of:
Fabrication of data . . . . . . . . . . . 01 01 01
Falsification of data . . . . . . . . . . 02 02 02
Plagiarism . . . . . . . . . . . . . . . . . 03 03 03
Other (Specify):
. . . . . . . . . . . . . 04 04 04
9. To whom did you report the allegation(s)? (CIRCLE ALL THAT APPLY)
Executive secretary of review group . . . . . . . . 01
Laboratory chief/director . . . . . . . . . . . . . . . . . 02
Department head/chair . . . . . . . . . . . . . . . . . . . 03
Dean of college/school/university . . . . . . . . . . 04
Journal editor . . . . . . . . . . . . . . . . . . . . . . . . . . 05
Principal investigator . . . . . . . . . . . . . . . . . . . . 06
Institutional Misconduct Official . . . . . . . . . . 07
ORI/OSI . . . . . . . . . . . . . . . . . . . . . . . . . . . . . . 08
Funding Agency . . . . . . . . . . . . . . . . . . . . . . . . 09
Other (Specify):
. . . . . . . . . . . . . . . . . . . . . . 10
DON'T KNOW . . . . . . . . . . . . . . . . . . . . . . . . 98
10. Where was the case publicized? (CIRCLE ALL THAT APPLY)
Scientific journals . . . . . . . . . . . . . . . . . . . . . . . 1
Newspapers . . . . . . . . . . . . . . . . . . . . . . . . . . . . 2
Magazines . . . . . . . . . . . . . . . . . . . . . . . . . . . . . 3
Campus newspaper . . . . . . . . . . . . . . . . . . . . . . 4
Television . . . . . . . . . . . . . . . . . . . . . . . . . . . . . . 5
Electronic Bulletin Board/E-mail . . . . . . . . . . . 6
Other (Specify):
. . . . . . . . . . . . . . . . . . . . . . 7
NONE . . . . . . . . . . . . . . . . . . . . . . . . . . . . . . . . 8
DON'T KNOW . . . . . . . . . . . . . . . . . . . . . . . . . 9
11. By whom was your identity as a whistleblower known? (CIRCLE ALL THAT APPLY)
Accused . . . . . . . . . . . . . . . . . . . . . . . . . . . . . . 01
Laboratory chief/director . . . . . . . . . . . . . . . . . 02
Department head/chair . . . . . . . . . . . . . . . . . . . 03
Dean of college/school/university . . . . . . . . . . 04
Investigation panel . . . . . . . . . . . . . . . . . . . . . . 05
Inquiry panel . . . . . . . . . . . . . . . . . . . . . . . . . . 06
Center head . . . . . . . . . . . . . . . . . . . . . . . . . . . 07
Colleagues . . . . . . . . . . . . . . . . . . . . . . . . . . . . 08
Other (Specify):
. . . . . . . . . . . . . . . . . . . . . . 09
DON'T KNOW . . . . . . . . . . . . . . . . . . . . . . . . 98
Responses to Allegation
12. What response did the allegation(s) produce? (CIRCLE ALL THAT APPLY)
A formal inquiry by the institution . . . . . . . . . . . . . . . . . 1
A formal investigation by the institution . . . . . . . . . . . . . 2
A formal inquiry by a Federal Agency . . . . . . . . . . . . . . 3
A formal investigation by a Federal Agency . . . . . . . . . . 4
Other (Specify):
. . . . . . . . . . . . . . . . . . . . . . . . . . 5
DON'T KNOW . . . . . . . . . . . . . . . . . . . . . . . . . . . . . . . . 8
13. Please indicate the final outcome of the allegations:
No allegations were supported . . . . . . . . . . . . . . . . . . . . . . 1 (GO TO 17)
Some allegations were supported . . . . . . . . . . . . . . . . . . . . . . . 2
All allegations were supported . . . . . . . . . . . . . . . . . . . . . . . . . 3
DON'T KNOW . . . . . . . . . . . . . . . . . . . . . . . . . . . . . . . . . . . . . 8
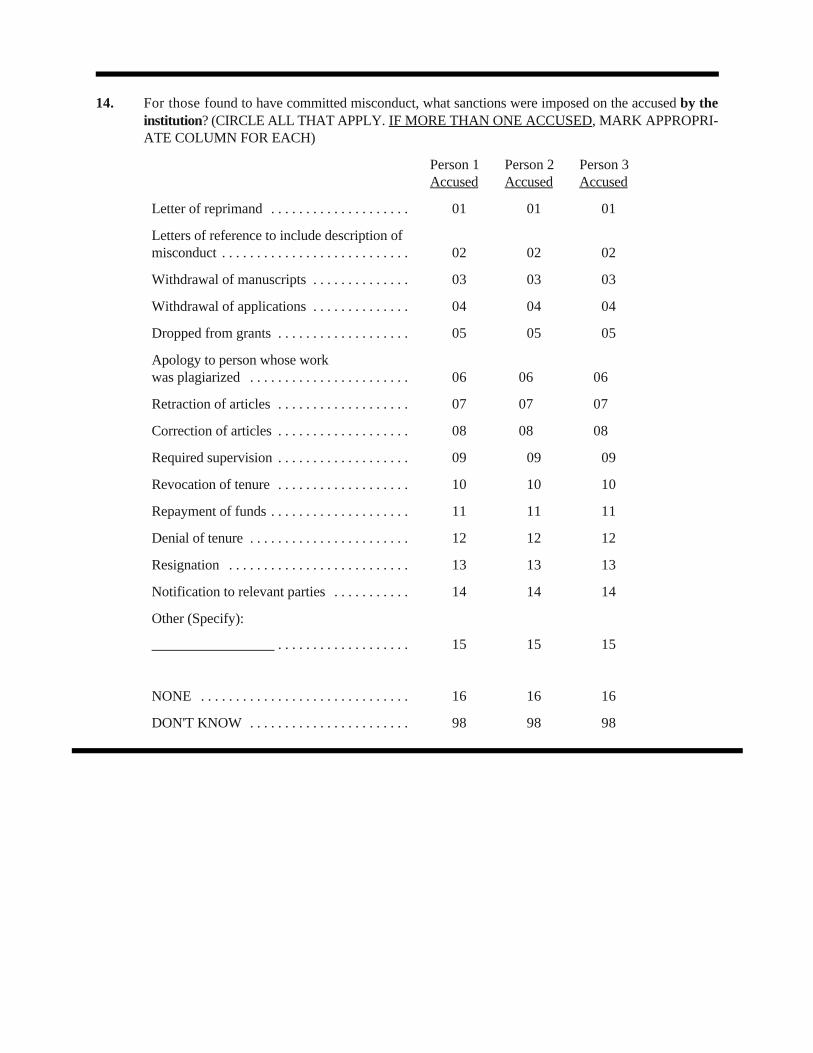
14. For those found to have committed misconduct, what sanctions were imposed on the accused by theinstitution? (CIRCLE ALL THAT APPLY. IF MORE THAN ONE ACCUSED, MARK APPROPRI-ATE COLUMN FOR EACH)
Person 1 Person 2 Person 3Accused Accused Accused
Letter of reprimand . . . . . . . . . . . . . . . . . . . . 01 01 01
Letters of reference to include description ofmisconduct . . . . . . . . . . . . . . . . . . . . . . . . . . . 02 02 02
Withdrawal of manuscripts . . . . . . . . . . . . . . 03 03 03
Withdrawal of applications . . . . . . . . . . . . . . 04 04 04
Dropped from grants . . . . . . . . . . . . . . . . . . . 05 05 05
Apology to person whose work was plagiarized . . . . . . . . . . . . . . . . . . . . . . . 06 06 06
Retraction of articles . . . . . . . . . . . . . . . . . . . 07 07 07
Correction of articles . . . . . . . . . . . . . . . . . . . 08 08 08
Required supervision . . . . . . . . . . . . . . . . . . . 09 09 09
Revocation of tenure . . . . . . . . . . . . . . . . . . . 10 10 10
Repayment of funds . . . . . . . . . . . . . . . . . . . . 11 11 11
Denial of tenure . . . . . . . . . . . . . . . . . . . . . . . 12 12 12
Resignation . . . . . . . . . . . . . . . . . . . . . . . . . . 13 13 13
Notification to relevant parties . . . . . . . . . . . 14 14 14
Other (Specify):
. . . . . . . . . . . . . . . . . . .
NONE . . . . . . . . . . . . . . . . . . . . . . . . . . . . . .
15 15 15
16 16 16
DON'T KNOW . . . . . . . . . . . . . . . . . . . . . . . 98 98 98

15. What sanctions were imposed on the accused by the Federal government? (CIRCLE ALL THATAPPLY. IF MORE THAN ONE ACCUSED, MARK APPROPRIATE COLUMN FOR EACH)
Person 1 Person 2 Person 3Accused Accused Accused
Letter of reprimand . . . . . . . . . . . . . . . . . . . . . . 01 01 01
Required institution to certify data in grant ap-plication . . . . . . . . . . . . . . . . . . . . . . . . . . . . . . 02 02 02
Required accused to certify appropriate attribution of sources in grant appli-cations . . . . . . . . . . . . . . . . . . . . . . . . . . . . . . . . 03 03 03
Required institution to establish supervisoryplan . . . . . . . . . . . . . . . . . . . . . . . . . . . . . . . . . . 04 04 04
Prohibited from serving on PHS advisory com-mittees . . . . . . . . . . . . . . . . . . . . . . . . . . . . . . . . 05 05 05
Informed advisory councils . . . . . . . . . . . . . . . . 06 06 06
Recovery of funds . . . . . . . . . . . . . . . . . . . . . . . 07 07 07
Termination of grant . . . . . . . . . . . . . . . . . . . . . 08 08 08
Debarred from receiving federal funds . . . . . . . 09 09 09
Other (Specify): . . . . . . . . . . . . . . . . . . . 10 10 10
NONE . . . . . . . . . . . . . . . . . . . . . . . . . . . . . . . . 11 11 11
DON'T KNOW . . . . . . . . . . . . . . . . . . . . . . . . . 98 98 98
16. During this time, who provided you support and encouragement with regard to the whistleblowingincident? (CIRCLE ALL THAT APPLY)
University administrators . . . . . . . . . . . . . . . . . . . . . . . 01Dean of college/school . . . . . . . . . . . . . . . . . . . . . . . . . . 02Department chair/head . . . . . . . . . . . . . . . . . . . . . . . . . . 03Laboratory chief/director . . . . . . . . . . . . . . . . . . . . . . . . 04Center director . . . . . . . . . . . . . . . . . . . . . . . . . . . . . . . . 05Colleagues . . . . . . . . . . . . . . . . . . . . . . . . . . . . . . . . . . . 06Postdoctoral fellows . . . . . . . . . . . . . . . . . . . . . . . . . . . . 07Graduate students . . . . . . . . . . . . . . . . . . . . . . . . . . . . . 08Spouse/partner/family/friends . . . . . . . . . . . . . . . . . . . . 09Federal Officials . . . . . . . . . . . . . . . . . . . . . . . . . . . . . . 10Other (Specify): . . . . . . . . . . . . . . . . . . . . . . . . . . . . . 11NO ONE PROVIDED SUPPORT . . . . . . . . . . . . . . . . 12
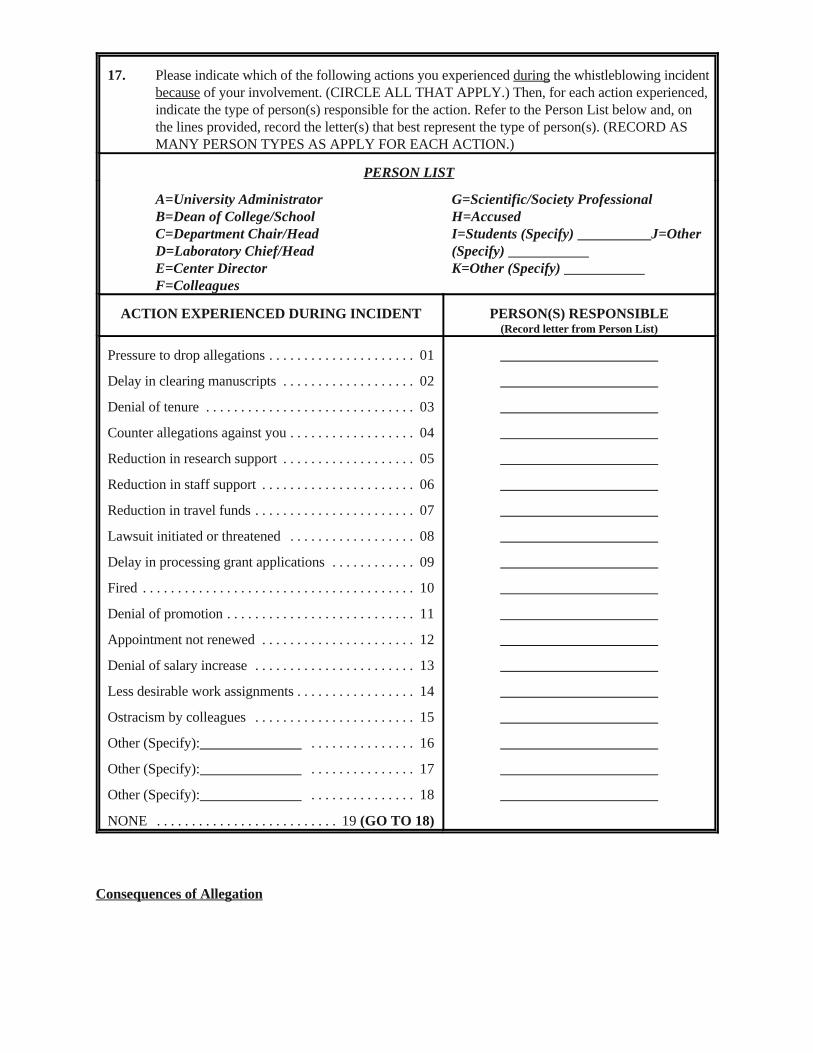
17. Please indicate which of the following actions you experienced during the whistleblowing incidentbecause of your involvement. (CIRCLE ALL THAT APPLY.) Then, for each action experienced,indicate the type of person(s) responsible for the action. Refer to the Person List below and, onthe lines provided, record the letter(s) that best represent the type of person(s). (RECORD ASMANY PERSON TYPES AS APPLY FOR EACH ACTION.)
PERSON LIST
A=University Administrator G=Scientific/Society ProfessionalB=Dean of College/School H=AccusedC=Department Chair/Head I=Students (Specify) J=OtherD=Laboratory Chief/Head (Specify) E=Center Director K=Other (Specify) F=Colleagues
ACTION EXPERIENCED DURING INCIDENT PERSON(S) RESPONSIBLE(Record letter from Person List)
Pressure to drop allegations . . . . . . . . . . . . . . . . . . . . . 01
Delay in clearing manuscripts . . . . . . . . . . . . . . . . . . . 02
Denial of tenure . . . . . . . . . . . . . . . . . . . . . . . . . . . . . . 03
Counter allegations against you . . . . . . . . . . . . . . . . . . 04
Reduction in research support . . . . . . . . . . . . . . . . . . . 05
Reduction in staff support . . . . . . . . . . . . . . . . . . . . . . 06
Reduction in travel funds . . . . . . . . . . . . . . . . . . . . . . . 07
Lawsuit initiated or threatened . . . . . . . . . . . . . . . . . . 08
Delay in processing grant applications . . . . . . . . . . . . 09
Fired . . . . . . . . . . . . . . . . . . . . . . . . . . . . . . . . . . . . . . . 10
Denial of promotion . . . . . . . . . . . . . . . . . . . . . . . . . . . 11
Appointment not renewed . . . . . . . . . . . . . . . . . . . . . . 12
Denial of salary increase . . . . . . . . . . . . . . . . . . . . . . . 13
Less desirable work assignments . . . . . . . . . . . . . . . . . 14
Ostracism by colleagues . . . . . . . . . . . . . . . . . . . . . . . 15
Other (Specify): . . . . . . . . . . . . . . . 16
Other (Specify): . . . . . . . . . . . . . . . 17
Other (Specify): . . . . . . . . . . . . . . . 18
NONE . . . . . . . . . . . . . . . . . . . . . . . . . . 19 (GO TO 18)
Consequences of Allegation
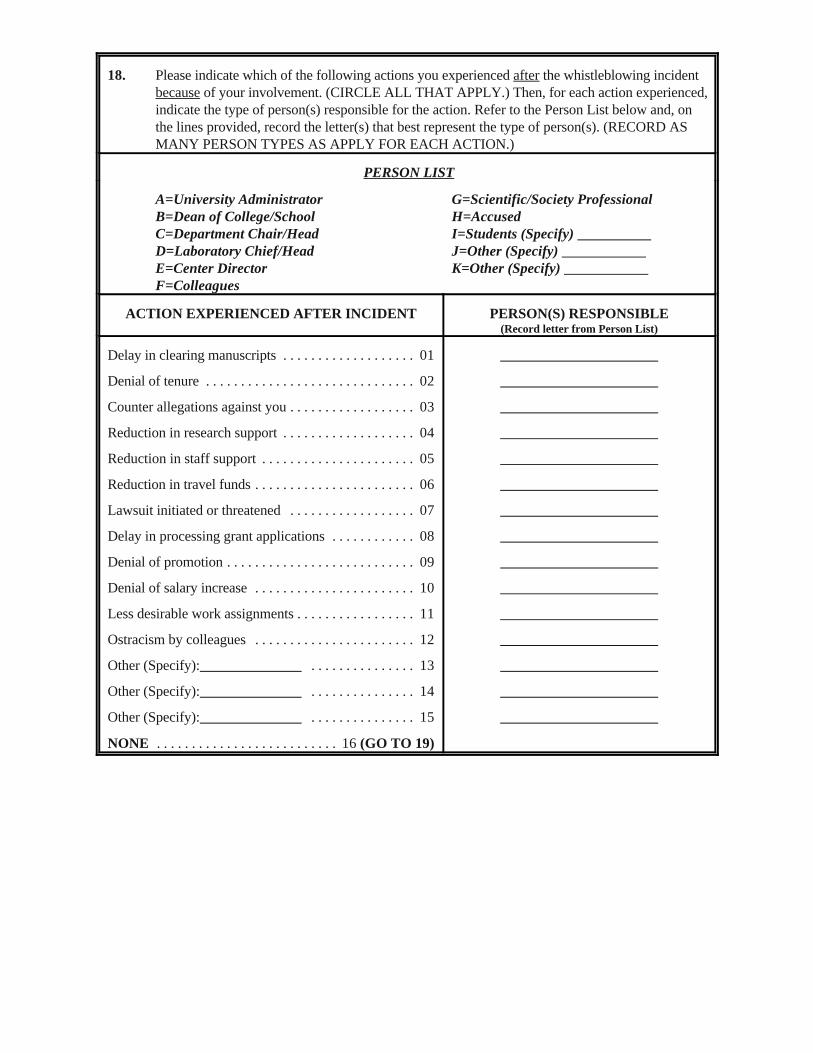
18. Please indicate which of the following actions you experienced after the whistleblowing incidentbecause of your involvement. (CIRCLE ALL THAT APPLY.) Then, for each action experienced,indicate the type of person(s) responsible for the action. Refer to the Person List below and, onthe lines provided, record the letter(s) that best represent the type of person(s). (RECORD ASMANY PERSON TYPES AS APPLY FOR EACH ACTION.)
PERSON LIST
A=University Administrator G=Scientific/Society ProfessionalB=Dean of College/School H=AccusedC=Department Chair/Head I=Students (Specify) D=Laboratory Chief/Head J=Other (Specify) E=Center Director K=Other (Specify) F=Colleagues
ACTION EXPERIENCED AFTER INCIDENT PERSON(S) RESPONSIBLE(Record letter from Person List)
Delay in clearing manuscripts . . . . . . . . . . . . . . . . . . . 01
Denial of tenure . . . . . . . . . . . . . . . . . . . . . . . . . . . . . . 02
Counter allegations against you . . . . . . . . . . . . . . . . . . 03
Reduction in research support . . . . . . . . . . . . . . . . . . . 04
Reduction in staff support . . . . . . . . . . . . . . . . . . . . . . 05
Reduction in travel funds . . . . . . . . . . . . . . . . . . . . . . . 06
Lawsuit initiated or threatened . . . . . . . . . . . . . . . . . . 07
Delay in processing grant applications . . . . . . . . . . . . 08
Denial of promotion . . . . . . . . . . . . . . . . . . . . . . . . . . . 09
Denial of salary increase . . . . . . . . . . . . . . . . . . . . . . . 10
Less desirable work assignments . . . . . . . . . . . . . . . . . 11
Ostracism by colleagues . . . . . . . . . . . . . . . . . . . . . . . 12
Other (Specify): . . . . . . . . . . . . . . . 13
Other (Specify): . . . . . . . . . . . . . . . 14
Other (Specify): . . . . . . . . . . . . . . . 15
NONE . . . . . . . . . . . . . . . . . . . . . . . . . . 16 (GO TO 19)
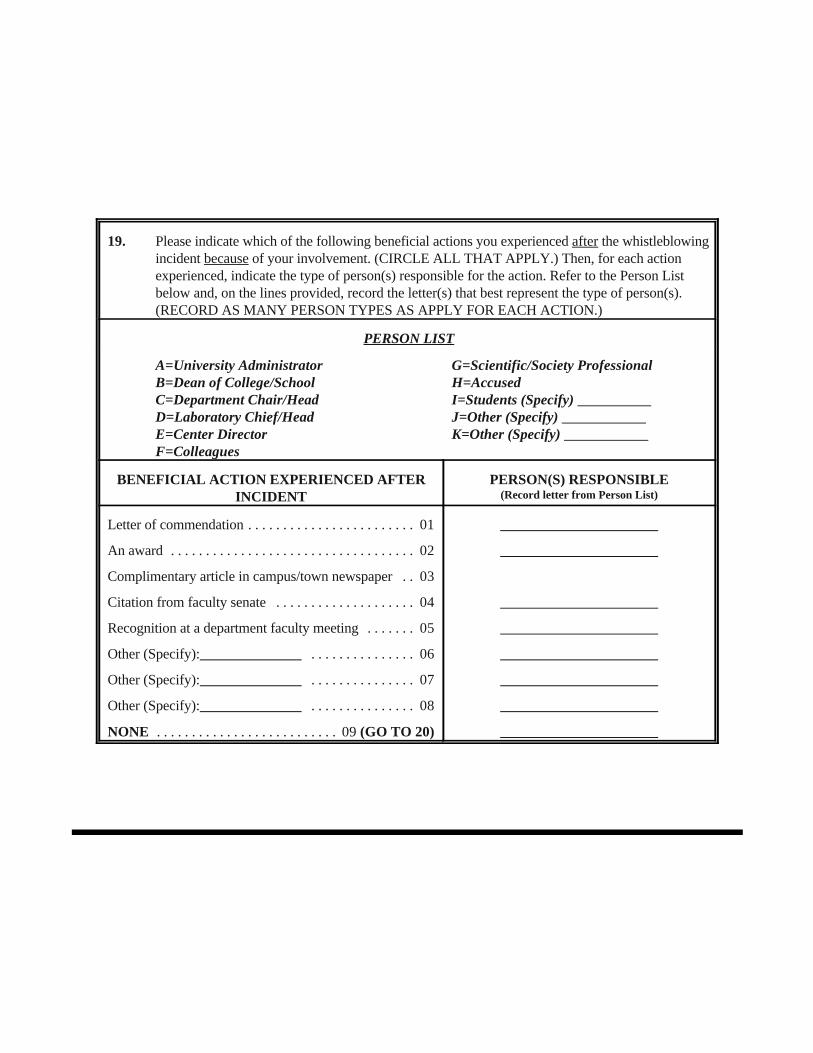
19. Please indicate which of the following beneficial actions you experienced after the whistleblowingincident because of your involvement. (CIRCLE ALL THAT APPLY.) Then, for each actionexperienced, indicate the type of person(s) responsible for the action. Refer to the Person Listbelow and, on the lines provided, record the letter(s) that best represent the type of person(s).(RECORD AS MANY PERSON TYPES AS APPLY FOR EACH ACTION.)
PERSON LIST
A=University Administrator G=Scientific/Society ProfessionalB=Dean of College/School H=AccusedC=Department Chair/Head I=Students (Specify) D=Laboratory Chief/Head J=Other (Specify) E=Center Director K=Other (Specify) F=Colleagues
BENEFICIAL ACTION EXPERIENCED AFTER PERSON(S) RESPONSIBLEINCIDENT (Record letter from Person List)
Letter of commendation . . . . . . . . . . . . . . . . . . . . . . . . 01
An award . . . . . . . . . . . . . . . . . . . . . . . . . . . . . . . . . . . 02
Complimentary article in campus/town newspaper . . 03
Citation from faculty senate . . . . . . . . . . . . . . . . . . . . 04
Recognition at a department faculty meeting . . . . . . . 05
Other (Specify): . . . . . . . . . . . . . . . 06
Other (Specify): . . . . . . . . . . . . . . . 07
Other (Specify): . . . . . . . . . . . . . . . 08
NONE . . . . . . . . . . . . . . . . . . . . . . . . . . 09 (GO TO 20)

20. How satisfied were you with the handling and outcome of the following? (IF NOT APPLICABLE,CIRCLE THE "6" CODE)
Very Somewhat fied or Somewhat VerySatisfied Satisfied Dissatisfied Dissatisfied Dissatisfied
InstitutionalInquiry . . . . . . . . . . 1
Investigation . . . . . . 1
Sanctions . . . . . . . . 1
FederalInquiry . . . . . . . . . . 1
Investigation . . . . . . 1
Sanctions . . . . . . . . 1
2 3 4 5
2 3 4 5
2 3 4 5
2 3 4 5
2 3 4 5
2 3 4 5
Neither Satis-NOT APPLICA-
BLE
6
6
6
6
6
6
21. Have you instituted a lawsuit?
Yes . . . . . . . . . . . . . . . . . . . . . . . 1No . . . . . . . . . . . . . . . . . . . . . . . . 2
22. Have you attempted to have the allegation(s) reinvestigated? (CIRCLE ALL THAT APPLY)
No . . . . . . . . . . . . . . . . . . . . . . . . . . . . . . . . . . . . . . . . . . . . . . . 1Yes, by the institution . . . . . . . . . . . . . . . . . . . . . . . . . . . . . . . . 2Yes, by a Federal agency . . . . . . . . . . . . . . . . . . . . . . . . . . . . . . 3Yes, by a Congressional committee . . . . . . . . . . . . . . . . . . . . . . 4Yes, by some other group (Specify): . . . . . . . . . . . . . . . . . . . . . . . . . . . . 5
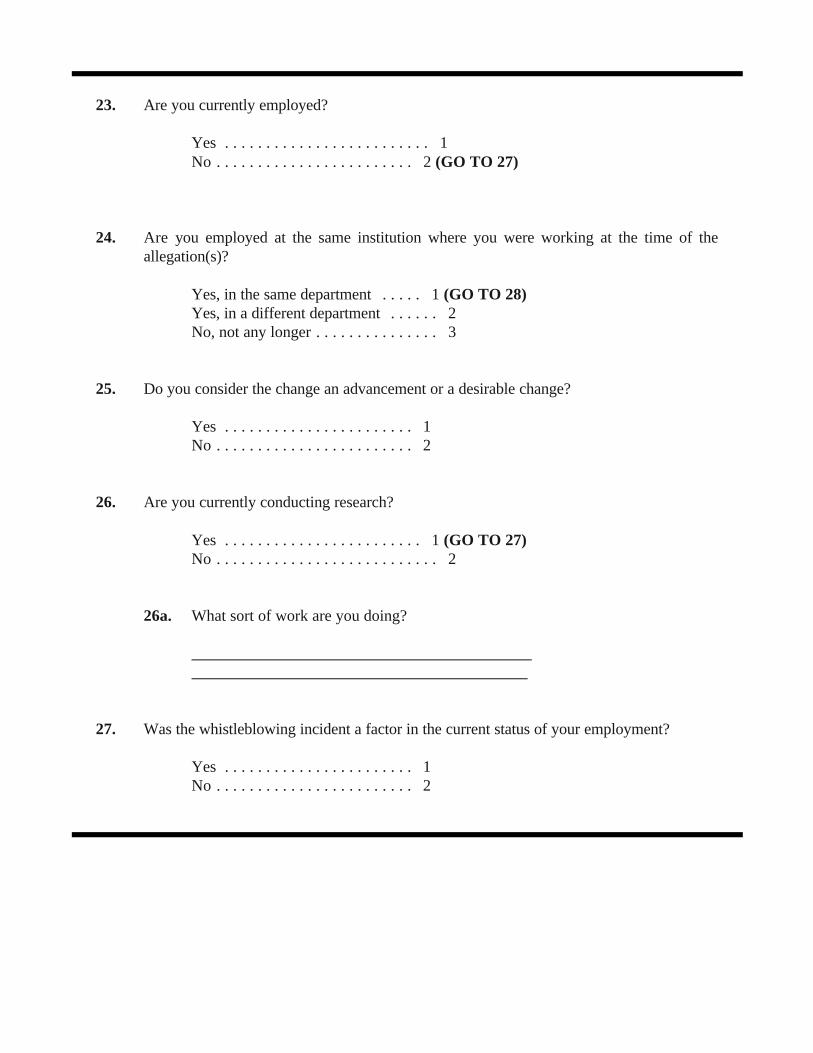
23. Are you currently employed?
Yes . . . . . . . . . . . . . . . . . . . . . . . . . 1 No . . . . . . . . . . . . . . . . . . . . . . . . 2 (GO TO 27)
24. Are you employed at the same institution where you were working at the time of theallegation(s)?
Yes, in the same department . . . . . 1 (GO TO 28)Yes, in a different department . . . . . . 2 No, not any longer . . . . . . . . . . . . . . . 3
25. Do you consider the change an advancement or a desirable change?
Yes . . . . . . . . . . . . . . . . . . . . . . . 1No . . . . . . . . . . . . . . . . . . . . . . . . 2
26. Are you currently conducting research?
Yes . . . . . . . . . . . . . . . . . . . . . . . . 1 (GO TO 27)No . . . . . . . . . . . . . . . . . . . . . . . . . . . 2
26a. What sort of work are you doing?
27. Was the whistleblowing incident a factor in the current status of your employment?
Yes . . . . . . . . . . . . . . . . . . . . . . . 1No . . . . . . . . . . . . . . . . . . . . . . . . 2
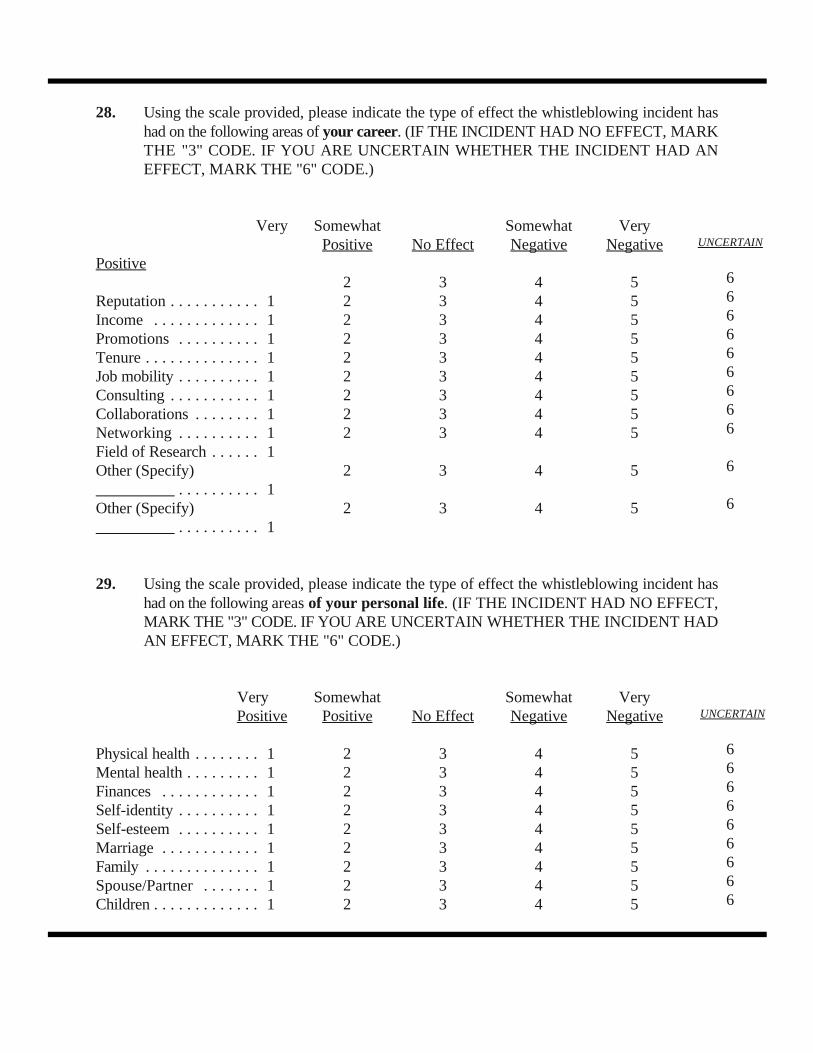
28. Using the scale provided, please indicate the type of effect the whistleblowing incident hashad on the following areas of your career. (IF THE INCIDENT HAD NO EFFECT, MARKTHE "3" CODE. IF YOU ARE UNCERTAIN WHETHER THE INCIDENT HAD ANEFFECT, MARK THE "6" CODE.)
Very Somewhat Somewhat Very Positive No Effect Negative Negative
Positive
Reputation . . . . . . . . . . . 1 Income . . . . . . . . . . . . . 1 Promotions . . . . . . . . . . 1 Tenure . . . . . . . . . . . . . . 1 Job mobility . . . . . . . . . . 1 Consulting . . . . . . . . . . . 1 Collaborations . . . . . . . . 1 Networking . . . . . . . . . . 1 Field of Research . . . . . . 1 Other (Specify) 2 3 4 5 . . . . . . . . . . 1 Other (Specify) 2 3 4 5 . . . . . . . . . . 1
2 3 4 52 3 4 52 3 4 52 3 4 52 3 4 52 3 4 52 3 4 52 3 4 52 3 4 5
UNCERTAIN
666666666
6
6
29. Using the scale provided, please indicate the type of effect the whistleblowing incident hashad on the following areas of your personal life. (IF THE INCIDENT HAD NO EFFECT,MARK THE "3" CODE. IF YOU ARE UNCERTAIN WHETHER THE INCIDENT HADAN EFFECT, MARK THE "6" CODE.)
Very Somewhat Somewhat Very Positive Positive No Effect Negative Negative
Physical health . . . . . . . . 1 Mental health . . . . . . . . . 1 Finances . . . . . . . . . . . . 1 Self-identity . . . . . . . . . . 1 Self-esteem . . . . . . . . . . 1 Marriage . . . . . . . . . . . . 1 Family . . . . . . . . . . . . . . 1 Spouse/Partner . . . . . . . 1 Children . . . . . . . . . . . . . 1
2 3 4 52 3 4 52 3 4 52 3 4 52 3 4 52 3 4 52 3 4 52 3 4 52 3 4 5
UNCERTAIN
666666666
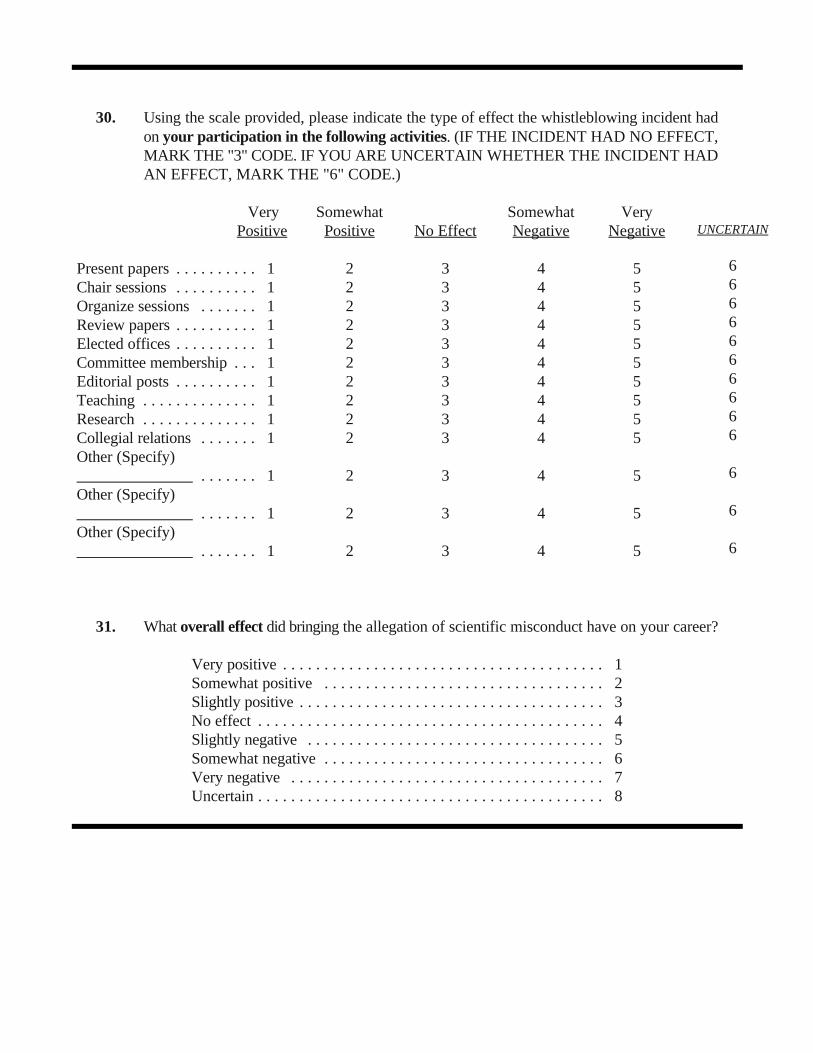
30. Using the scale provided, please indicate the type of effect the whistleblowing incident hadon your participation in the following activities. (IF THE INCIDENT HAD NO EFFECT,MARK THE "3" CODE. IF YOU ARE UNCERTAIN WHETHER THE INCIDENT HADAN EFFECT, MARK THE "6" CODE.)
Very Somewhat Somewhat Very Positive Positive No Effect Negative Negative
Present papers . . . . . . . . . . 1 Chair sessions . . . . . . . . . . 1 Organize sessions . . . . . . . 1 Review papers . . . . . . . . . . 1 Elected offices . . . . . . . . . . 1 Committee membership . . . 1 Editorial posts . . . . . . . . . . 1 Teaching . . . . . . . . . . . . . . 1 Research . . . . . . . . . . . . . . 1 Collegial relations . . . . . . . 1 Other (Specify) . . . . . . . 1 Other (Specify) . . . . . . . 1 Other (Specify) . . . . . . . 1
2 3 4 52 3 4 52 3 4 52 3 4 52 3 4 52 3 4 52 3 4 52 3 4 52 3 4 52 3 4 5
2 3 4 5
2 3 4 5
2 3 4 5
UNCERTAIN
6666666666
6
6
6
31. What overall effect did bringing the allegation of scientific misconduct have on your career?
Very positive . . . . . . . . . . . . . . . . . . . . . . . . . . . . . . . . . . . . . . . 1Somewhat positive . . . . . . . . . . . . . . . . . . . . . . . . . . . . . . . . . . 2Slightly positive . . . . . . . . . . . . . . . . . . . . . . . . . . . . . . . . . . . . . 3No effect . . . . . . . . . . . . . . . . . . . . . . . . . . . . . . . . . . . . . . . . . . 4Slightly negative . . . . . . . . . . . . . . . . . . . . . . . . . . . . . . . . . . . . 5Somewhat negative . . . . . . . . . . . . . . . . . . . . . . . . . . . . . . . . . . 6Very negative . . . . . . . . . . . . . . . . . . . . . . . . . . . . . . . . . . . . . . 7Uncertain . . . . . . . . . . . . . . . . . . . . . . . . . . . . . . . . . . . . . . . . . . 8
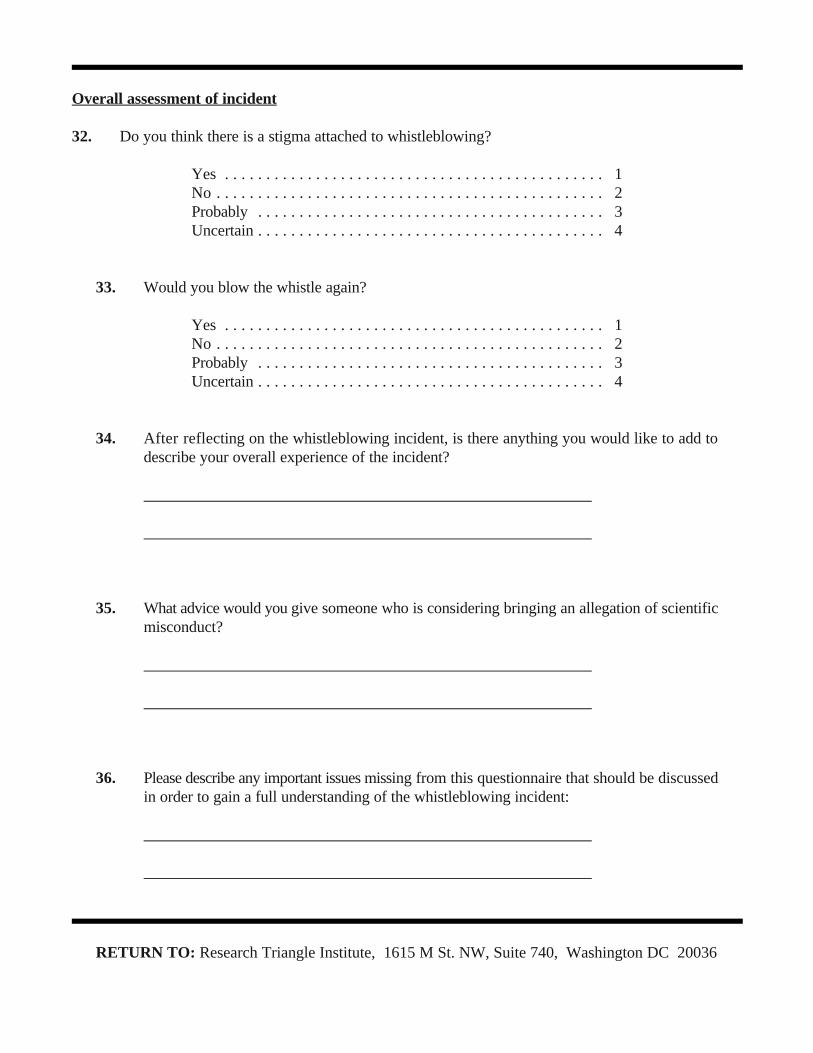
Overall assessment of incident
32. Do you think there is a stigma attached to whistleblowing?
Yes . . . . . . . . . . . . . . . . . . . . . . . . . . . . . . . . . . . . . . . . . . . . . . 1No . . . . . . . . . . . . . . . . . . . . . . . . . . . . . . . . . . . . . . . . . . . . . . . 2Probably . . . . . . . . . . . . . . . . . . . . . . . . . . . . . . . . . . . . . . . . . . 3Uncertain . . . . . . . . . . . . . . . . . . . . . . . . . . . . . . . . . . . . . . . . . . 4
33. Would you blow the whistle again?
Yes . . . . . . . . . . . . . . . . . . . . . . . . . . . . . . . . . . . . . . . . . . . . . . 1No . . . . . . . . . . . . . . . . . . . . . . . . . . . . . . . . . . . . . . . . . . . . . . . 2Probably . . . . . . . . . . . . . . . . . . . . . . . . . . . . . . . . . . . . . . . . . . 3Uncertain . . . . . . . . . . . . . . . . . . . . . . . . . . . . . . . . . . . . . . . . . . 4
34. After reflecting on the whistleblowing incident, is there anything you would like to add todescribe your overall experience of the incident?
35. What advice would you give someone who is considering bringing an allegation of scientificmisconduct?
36. Please describe any important issues missing from this questionnaire that should be discussedin order to gain a full understanding of the whistleblowing incident:
RETURN TO: Research Triangle Institute, 1615 M St. NW, Suite 740, Washington DC 20036
APPENDIX B
Script for Telephone Reminder Calls
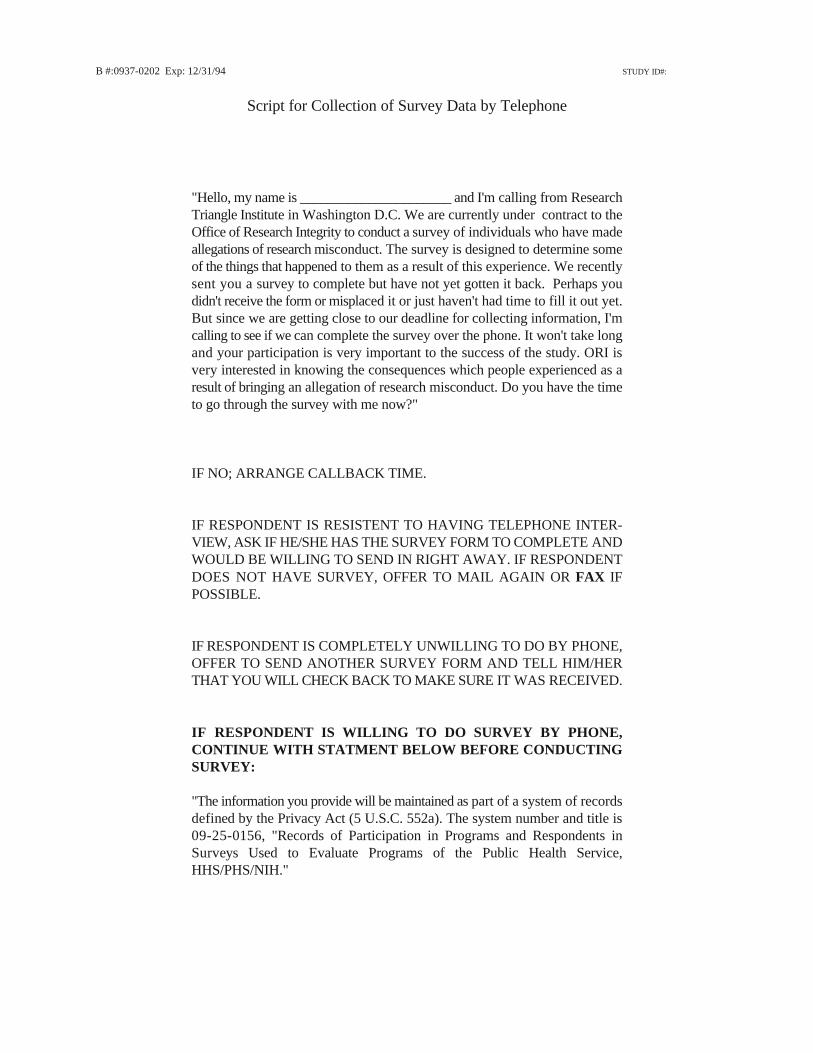
B #:0937-0202 Exp: 12/31/94 STUDY ID#:
Script for Collection of Survey Data by Telephone
"Hello, my name is ______________________ and I'm calling from ResearchTriangle Institute in Washington D.C. We are currently under contract to theOffice of Research Integrity to conduct a survey of individuals who have madeallegations of research misconduct. The survey is designed to determine someof the things that happened to them as a result of this experience. We recentlysent you a survey to complete but have not yet gotten it back. Perhaps youdidn't receive the form or misplaced it or just haven't had time to fill it out yet.But since we are getting close to our deadline for collecting information, I'mcalling to see if we can complete the survey over the phone. It won't take longand your participation is very important to the success of the study. ORI isvery interested in knowing the consequences which people experienced as aresult of bringing an allegation of research misconduct. Do you have the timeto go through the survey with me now?"
IF NO; ARRANGE CALLBACK TIME.
IF RESPONDENT IS RESISTENT TO HAVING TELEPHONE INTER-VIEW, ASK IF HE/SHE HAS THE SURVEY FORM TO COMPLETE ANDWOULD BE WILLING TO SEND IN RIGHT AWAY. IF RESPONDENTDOES NOT HAVE SURVEY, OFFER TO MAIL AGAIN OR FAX IFPOSSIBLE.
IF RESPONDENT IS COMPLETELY UNWILLING TO DO BY PHONE,OFFER TO SEND ANOTHER SURVEY FORM AND TELL HIM/HERTHAT YOU WILL CHECK BACK TO MAKE SURE IT WAS RECEIVED.
IF RESPONDENT IS WILLING TO DO SURVEY BY PHONE,CONTINUE WITH STATMENT BELOW BEFORE CONDUCTINGSURVEY:
"The information you provide will be maintained as part of a system of recordsdefined by the Privacy Act (5 U.S.C. 552a). The system number and title is09-25-0156, "Records of Participation in Programs and Respondents inSurveys Used to Evaluate Programs of the Public Health Service,HHS/PHS/NIH."