reservoir characterization of a authors permian deep … · we thank mr. thomas b. cowden, of the...
TRANSCRIPT
AUTHORS
Shirley P. Dutton � Bureau of EconomicGeology, John A. and Katherine G. JacksonSchool of Geosciences, University ofTexas at Austin, Austin, Texas, 78713;[email protected]
Shirley P. Dutton is a senior research scientist atthe Bureau of Economic Geology with researchinterests in sedimentology, reservoir character-ization, sedimentary petrology, and clastic dia-genesis. She received a B.A. degree from theUniversity of Rochester and an M.A. degree andPh.D. from the University of Texas at Austin, allin geology.
William A. Flanders � Transpetco Engi-neering, 110 N. Marienfeld Place, Suite 525,Midland, Texas, 79701; [email protected]
William A. (Bill) Flanders is an engineer withspecial expertise in reservoir engineering,enhanced oil recovery, and reservoir modeling.Flanders is president of Transpetco Engineer-ing of the Southwest, and formerly worked atExxon and at Murphy Oil. He earned his B.S.and M.S. degrees in mechanical engineeringfrom Kansas State University.
Mark D. Barton � Shell Exploration andProduction Inc., 3737 Bellaire Blvd., P.O. Box481, Houston, Texas 77001-0481;[email protected]
Mark D. Barton is a reservoir geologist withShell Exploration and Production. He formerlyworked at the Bureau of Economic Geology,where he conducted the research summarizedin this paper. His expertise is in clastic sedi-mentology and stratigraphy. He holds a Ph.D.in geology from the University of Texas atAustin.
Reservoir characterization of aPermian deep-water sandstone,East Ford field, Delawarebasin, TexasShirley P. Dutton, William A. Flanders, andMark D. Barton
ABSTRACT
Deep-water sandstones of the Delaware Mountain Group in west
Texas and southeast New Mexico contained an estimated 1.8 billion
bbl of original oil in place, but primary recovery from these fields is
commonly less than 20%. East Ford field in Reeves County, Texas,
which produces from the Ramsey sandstone in the upper Bell Can-
yon Formation, went directly from primary production to tertiary
recovery by CO2 flooding. Field production has increased from 30
to more than 185 BOPD. Oil recovery has been improved by the
CO2 flood, but not as much as expected. Geologic heterogeneities
such as interbedded siltstones are apparently influencing reservoir
displacement operations in the East Ford unit.
A depositional model of the East Ford unit was developed using
data from Bell Canyon outcrops and subsurface data. The Ramsey
sandstones were deposited by turbidity currents in a basin-floor set-
ting. The sandstones are interpreted as having been deposited in a
channel-levee system that terminated in broad lobes; overbank splays
filled topographically low interchannel areas. Injection wells located
in splay sandstones apparently have poor communication with wells
in channel sandstones, perhaps because communication is restricted
through levee and channel-margin deposits. The south part of the unit
is responding well to the flood because the injection and production
wells are in the same interconnected lobe depositional environment.
INTRODUCTION
Reservoirs in deep-water sandstones of the Delaware Mountain Group
in the Delaware basin (Figures 1, 2) contained more than 1.8 billion
bbl of original oil in place (Holtz, 1995). Recovery efficiencies of
these reservoirs have averaged less than 20% since production began
Copyright #2003. The American Association of Petroleum Geologists. All rights reserved.
Manuscript received February 19, 2002; provisional acceptance July 8, 2002; revised manuscriptreceived September 23, 2002; final acceptance October 10, 2002.
AAPG Bulletin, v. 87, no. 4 (April 2003), pp. 609–627 609
610 Reservoir Characterization of a Permian Deep-Water Sandstone
mostly in the 1950s and 1960s, and only 340 million bbl of oil had
been produced through 1998. Many of these mature fields are nearing
the end of primary or secondary production and are in danger of
abandonment unless effective, economic methods of enhanced oil re-
covery (EOR) can be implemented.
Because of their historically low recovery, reservoirs in the Bell
Canyon Formation of the Delaware Mountain Group were the tar-
get of a reservoir-characterization and demonstration project fund-
ed by the U.S. Department of Energy as part of the Class III (Slope
and Basin Clastic Reservoirs) Field Demonstration Program (Dutton
and Flanders, 2001a). Our study was focused on East Ford field in
Reeves County, Texas (Figures 1, 3), which produces from the
Ramsey sandstone, the youngest sandstone in the Bell Canyon For-
mation. Primary recovery efficiency at East Ford field was only 16%,
and enhanced oil recovery by CO2 flooding is now being conducted
in the East Ford unit in an effort to increase recovery.
A depositional model of Bell Canyon sandstones was developed
from well-exposed outcrops (Barton and Dutton, 1999; Dutton
et al., 1999b). The outcrop model was used to guide interpreta-
tion of the subsurface data and develop a geologic model of East
Ford field. The geologic model explains much of the production
response to the fluid-displacement operation and provides a frame-
work for modifying the flood to increase recovery.
More than 375 reservoirs have been discovered in the Delaware
basin submarine-fan sandstone play in west Texas and New Mexico
(Galloway et al., 1983; Dutton et al., 2000). Because the reservoirs
in this play have similar depositional, diagenetic, and production
histories, knowledge gained from study of the East Ford field can be
extrapolated to other fields in the play. Lessons learned from the
production history of this mature reservoir in west Texas may also
have application to development of newly discovered turbidite res-
ervoirs throughout the world.
Geologic Setting
Upper Permian (Guadalupian) Delaware Mountain Group strata
compose a 4500-ft-thick (1400-m) succession of slope and basin
deposits in the Delaware basin (Gardner, 1997b). The Delaware
Mountain Group is divided, from oldest to youngest, into the Brushy
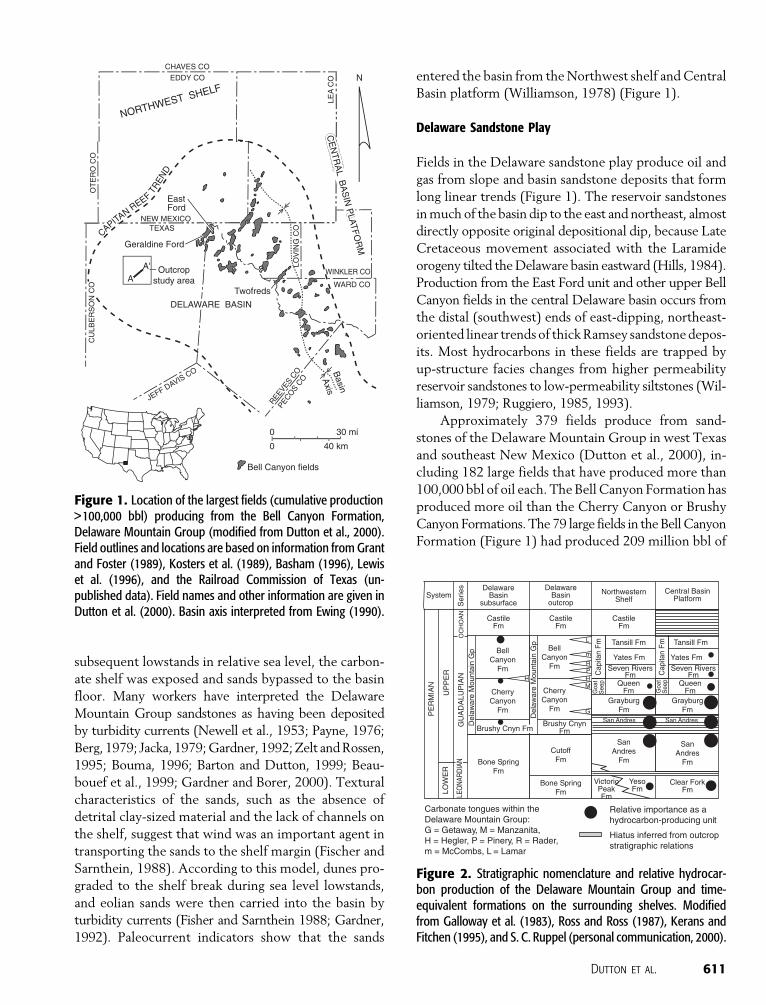
Canyon, Cherry Canyon, and Bell Canyon Formations (Figure 2).
Shelf-to-basin-floor correlations of time-equivalent strata indicate
water depths were between 1000 and 2000 ft (300 and 600 m)
during deposition of the Bell Canyon Formation (Kerans et al.,
1992). The cyclic interbedding of sandstones with organic-rich silt-
stones in the Delaware Mountain Group has been interpreted to
record frequent changes in relative sea level (Meissner, 1972; Fis-
cher and Sarnthein, 1988; Gardner, 1992, 1997a,b). During high-
stands in relative sea level, sands were trapped behind a broad,
flooded shelf and were prevented from entering the basin. Thin,
widespread, organic-rich siltstones accumulated on the basin floor
by the slow settling of marine algal material and airborne silt. During
ACKNOWLEDGEMENTS
This research was funded by the U.S. Depart-ment of Energy under contract no. DE-FC22-95BC14936 and by the state of Texas underState Match Pool Project 4201 and as part of theState of Texas Advanced Resource Recoveryproject. DOE project manager was Daniel J.Ferguson. The Bureau of Economic Geologyacknowledges support of this research byLandmark Graphics via the Landmark UniversityGrant Program. We thank Mr. Thomas B.Cowden, of the Cowden Ranch, for permissionto conduct fieldwork on the ranch. Researchwas assisted by Jose I. Guzman, Helena H.Zirczy, Luciano L. Correa, and Daniel L. Mendez.We gratefully acknowledge the efforts of DavidC. Jennette and Lesli J. Wood, who reviewed anearly version of this paper, and of peerreviewers Lee T. Billingsley and Fred F. Meissnerand Bulletin Editor John C. Lorenz. Theirconstructive comments improved this article.Illustrations were prepared by the Graphics staffof the Bureau of Economic Geology under thedirection of Joel L. Lardon, Graphics Manager.Susann Doenges edited the manuscript. Pub-lished by permission of the director, Bureau ofEconomic Geology, University of Texas atAustin.
subsequent lowstands in relative sea level, the carbon-
ate shelf was exposed and sands bypassed to the basin
floor. Many workers have interpreted the Delaware
Mountain Group sandstones as having been deposited
by turbidity currents (Newell et al., 1953; Payne, 1976;
Berg, 1979; Jacka, 1979; Gardner, 1992; Zelt and Rossen,
1995; Bouma, 1996; Barton and Dutton, 1999; Beau-
bouef et al., 1999; Gardner and Borer, 2000). Textural
characteristics of the sands, such as the absence of
detrital clay-sized material and the lack of channels on
the shelf, suggest that wind was an important agent in
transporting the sands to the shelf margin (Fischer and
Sarnthein, 1988). According to this model, dunes pro-
graded to the shelf break during sea level lowstands,
and eolian sands were then carried into the basin by
turbidity currents (Fisher and Sarnthein 1988; Gardner,
1992). Paleocurrent indicators show that the sands
entered the basin from the Northwest shelf and Central
Basin platform (Williamson, 1978) (Figure 1).
Delaware Sandstone Play
Fields in the Delaware sandstone play produce oil and
gas from slope and basin sandstone deposits that form
long linear trends (Figure 1). The reservoir sandstones
in much of the basin dip to the east and northeast, almost
directly opposite original depositional dip, because Late
Cretaceous movement associated with the Laramide
orogeny tilted the Delaware basin eastward (Hills, 1984).
Production from the East Ford unit and other upper Bell
Canyon fields in the central Delaware basin occurs from
the distal (southwest) ends of east-dipping, northeast-
oriented linear trends of thick Ramsey sandstone depos-
its. Most hydrocarbons in these fields are trapped by
up-structure facies changes from higher permeability
reservoir sandstones to low-permeability siltstones (Wil-
liamson, 1979; Ruggiero, 1985, 1993).
Approximately 379 fields produce from sand-
stones of the Delaware Mountain Group in west Texas
and southeast New Mexico (Dutton et al., 2000), in-
cluding 182 large fields that have produced more than
100,000 bbl of oil each. The Bell Canyon Formation has
produced more oil than the Cherry Canyon or Brushy
Canyon Formations. The 79 large fields in the Bell Canyon
Formation (Figure 1) had produced 209 million bbl of
Dutton et al. 611
Figure 1. Location of the largest fields (cumulative production>100,000 bbl) producing from the Bell Canyon Formation,Delaware Mountain Group (modified from Dutton et al., 2000).Field outlines and locations are based on information from Grantand Foster (1989), Kosters et al. (1989), Basham (1996), Lewiset al. (1996), and the Railroad Commission of Texas (un-published data). Field names and other information are given inDutton et al. (2000). Basin axis interpreted from Ewing (1990).
Figure 2. Stratigraphic nomenclature and relative hydrocar-bon production of the Delaware Mountain Group and time-equivalent formations on the surrounding shelves. Modifiedfrom Galloway et al. (1983), Ross and Ross (1987), Kerans andFitchen (1995), and S. C. Ruppel (personal communication, 2000).
oil through 1998 (Dutton et al., 2000). Through 1998,
62 large fields in the Cherry Canyon Formation had
produced 75 million bbl of oil, and 41 large Brushy
Canyon fields had produced 45 million bbl of oil (Dut-
ton et al., 2000). Previous papers have summarized
information about Brushy Canyon and Cherry Canyon
reservoirs in the Delaware sandstone play (Montgomery
et al., 1999, 2000). This paper focuses on the youngest
and most productive interval in the Delaware Moun-
tain Group, the Bell Canyon Formation.
Outcrop Characterization of Bell Canyon Sandstone
Interpretation of the Ramsey sandstone reservoir at the
East Ford unit was based largely on the depositional
model developed by investigation of Bell Canyon sand-
stones exposed in outcrop 25 mi (40 km) to the west
(Barton and Dutton, 1999; Dutton et al., 1999b) (Fig-
ure 1). The outcrop work focused on the first sandstone
below the McCombs limestone (Figure 2), a sandstone
that is environmentally analogous to, but older than,
the Ramsey sandstone. The older sandstone was inves-
tigated because it is interpreted to be a better analog to
the reservoirs at East Ford field, being from a similar
position in the facies tract. The Ramsey sandstone ex-
posed in outcrop represents a more distal depositional
environment than the Ramsey sandstone deposited at
East Ford field. The results of the outcrop study are
summarized below; more detailed descriptions of the
lithofacies, sandstone thickness and geometry, and in-
terpreted depositional processes are published in Bar-
ton and Dutton (1999) and Dutton et al. (1999b).
Six lithofacies were identified in outcrop: litho-
facies 1 is a massive, organic-rich siltstone; lithofacies
2 is an organic-rich, laminated siltstone; lithofacies 3 is a
laminated siltstone; lithofacies 4 is composed of thin-
bedded sandstones and siltstones that are graded or
display partial Bouma sequences (Bouma, 1962); litho-
facies 5 is a massive sandstone having water escape
and load structures; lithofacies 6 is a large-scale, cross-
laminated sandstone (Barton and Dutton, 1999). The
sandstones and massive siltstones are interpreted as
having been deposited by sandy high- and low-density
turbidity currents that carried a narrow range of sedi-
ment size, mostly very fine sand to coarse silt. Lami-
nated siltstones are interpreted to have been deposited
by fine material settling out of suspension.
Depositional elements recognized in the Bell Can-
yon deposits exposed in outcrop include (1) channels,
(2) levees, (3) lobes, (4) overbank splays, and (5) sheets
of laminated siltstones (Barton and Dutton, 1999; Dut-
ton et al., 1999b). Stratigraphic relationships of the dep-
ositional elements indicate that the sandstones were
deposited on the floor of the Delaware basin by a sys-
tem of leveed channels having attached lobes and over-
bank splays (Barton and Dutton, 1999; Dutton et al.,
1999b) (Figure 4). Individual channel-levee and lobe
complexes stack in a compensatory fashion and are
separated by laterally continuous, laminated siltstones.
Paleocurrent measurements indicate that the sandstone
bodies in the outcrop area trend north-south, which is
nearly perpendicular to the shelf margin on the north-
west side of the basin.
Lobe deposits are broadly lenticular sandstone
bodies that generally lack an erosive base (Figure 4c).
They are as much as 25 ft (8 m) thick and 2 mi (3.2 km)
612 Reservoir Characterization of a Permian Deep-Water Sandstone
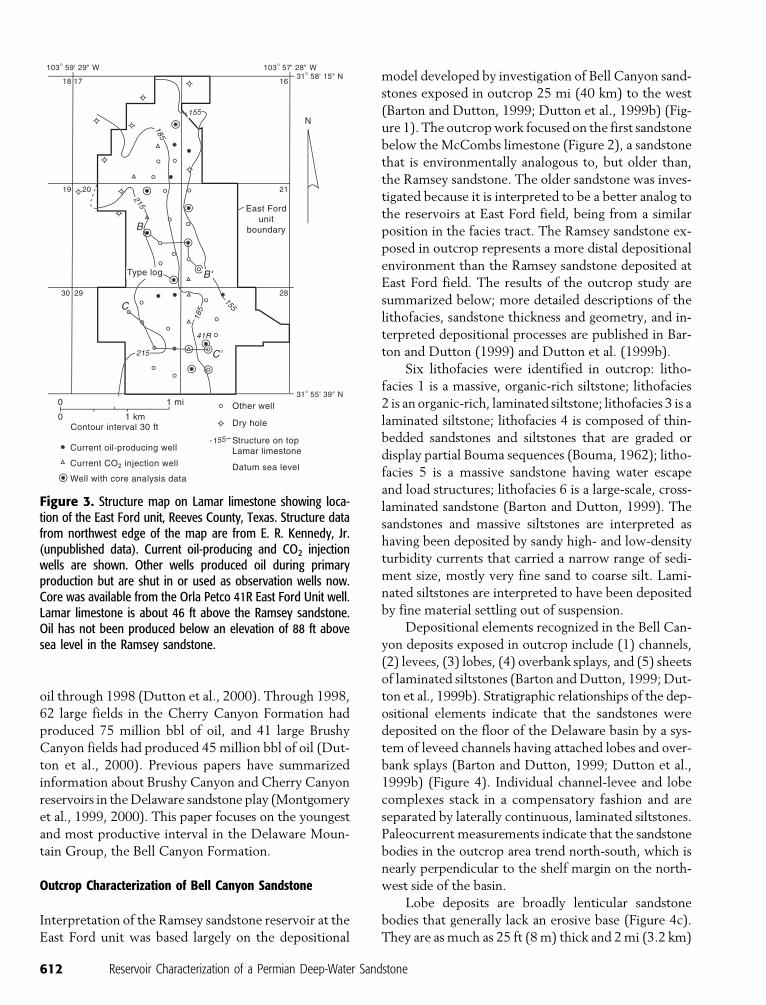
Figure 3. Structure map on Lamar limestone showing loca-tion of the East Ford unit, Reeves County, Texas. Structure datafrom northwest edge of the map are from E. R. Kennedy, Jr.(unpublished data). Current oil-producing and CO2 injectionwells are shown. Other wells produced oil during primaryproduction but are shut in or used as observation wells now.Core was available from the Orla Petco 41R East Ford Unit well.Lamar limestone is about 46 ft above the Ramsey sandstone.Oil has not been produced below an elevation of 88 ft abovesea level in the Ramsey sandstone.
Dutton et al. 613
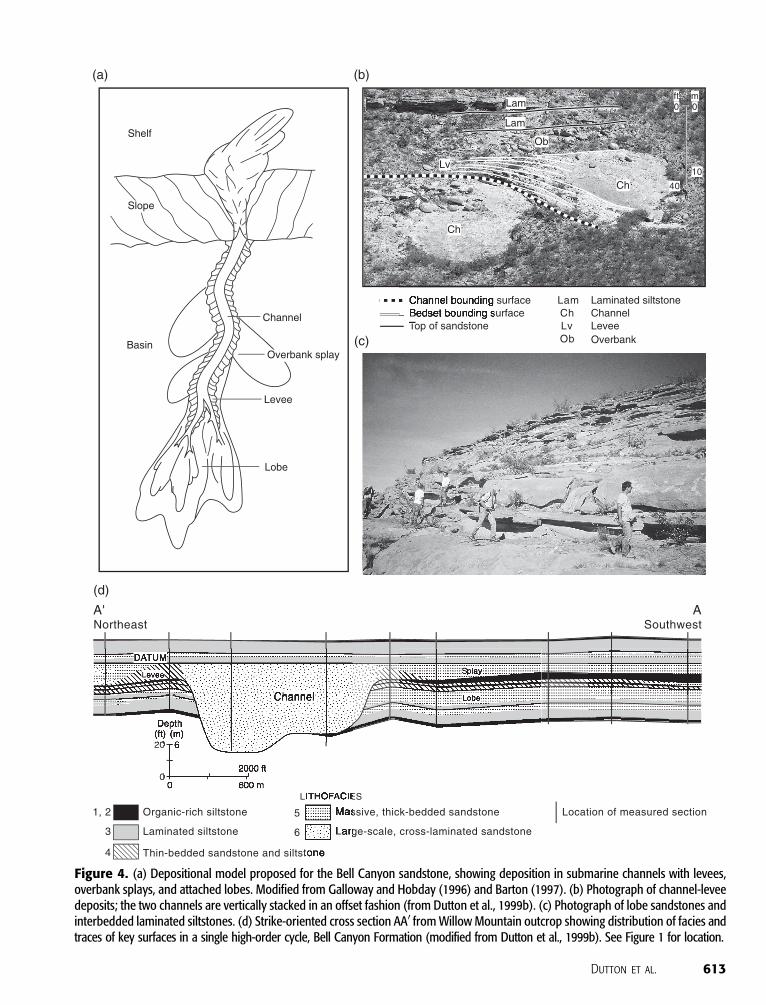
Figure 4. (a) Depositional model proposed for the Bell Canyon sandstone, showing deposition in submarine channels with levees,overbank splays, and attached lobes. Modified from Galloway and Hobday (1996) and Barton (1997). (b) Photograph of channel-leveedeposits; the two channels are vertically stacked in an offset fashion (from Dutton et al., 1999b). (c) Photograph of lobe sandstones andinterbedded laminated siltstones. (d) Strike-oriented cross section AA0 from Willow Mountain outcrop showing distribution of facies andtraces of key surfaces in a single high-order cycle, Bell Canyon Formation (modified from Dutton et al., 1999b). See Figure 1 for location.
wide (Barton and Dutton, 1999; Dutton et al., 1999b).
Lobes are composed mostly of medium- to thick-bedded
massive sandstones having dewatering features such as
dish and flame structures and are commonly interbedded
with sheets of laminated siltstone. Lobe sandstones are
interpreted as having been deposited at the mouths of
channels by unconfined, highly decelerating sediment-
gravity flows. In a prograding system, lobe facies would
have been deposited first and then overlain and partly
eroded by the channel-levee-overbank system (Figure 4d).
Channels are bound at the base by an erosion surface
and are largely filled with massive and cross-stratified
sandstones (BartonandDutton,1999;Duttonet al., 1999b).
Channels mapped in outcrop range from 10 to 60 ft
(3 to 18 m) in thickness; most are 20–40 ft (6–12 m)
thick. Channel widths are 300–3000 ft (90–900 m).
Aspect ratios (width/thickness) range from 15 to 40.
The channels bifurcate and widen downdip.
Flanking the channels on both sides are wedge-
shaped ‘‘wings’’ composed of thinly bedded sandstone
and siltstone (Figure 4b, d) and interpreted to be levee
deposits (Barton and Dutton, 1999; Dutton et al.,
1999b). In some cases, sandstone beds in the levees can
be traced into the adjacent channel (Figure 4b), and the
bedding relationships indicate that the margins of the
channels were maintained by elevated levee deposits.
In other cases, the levee and channel deposits display
a disconformable contact. Paleocurrents in the levee
deposits deviate by about 15–45j away from the axis
of the channel. Levees are interpreted as having been
deposited by unconfined turbidity currents that spilled
over the margin of the channel. The width of levee
deposits mapped in outcrop ranges from about 500 to
3000 ft (150 m to 1 km) wide. The levees thin abruptly
away from the channel, decreasing in thickness from 20
to 1 ft (6 to 0.3 m).
Overbank splays are composed of massive sand-
stones and display a broad, tabular to irregular geome-
try. They onlap the levee deposits (Barton and Dutton,
1999; Dutton et al., 1999b) (Figure 4d). Convoluted
bedding and dewatering structures such as dish and
pillar structures are common in these beds. The splay
sandstones are 3–25 ft (1–8 m) thick. Splays on the
flanks of the channel system were at least 3000 ft (900
m) wide and possibly much greater, as they extended
beyond the limits of the mappable outcrop. Overbank
splays increase in thickness away from the channel
margins in a compensatory fashion with the levees, in-
dicating that the splays filled topographically low in-
terchannel areas. The locally irregular geometry of the
splay deposits is related to the underlying topography.
Stratigraphic relationships suggest that the splays form-
ed during the final stages of channel filling (Barton and
Dutton, 1999). Volumetrically, they contain much of
the sandstone in the system (Figure 4d). It is not pos-
sible to distinguish overbank-splay deposits from lobe
deposits by lithofacies alone. The location, shape, and
stratigraphic position of the massive sandstones are
needed to distinguish these two depositional elements.
This depositional model is similar in many respects
to the ‘‘build, cut, fill, and spill model’’ proposed for
the older Brushy Canyon Formation by Gardner and
Borer (2000). The lobe deposits, which represent the
‘‘build’’ stage, are cut and overlain by the channel-levee
deposits that represent the ‘‘cut and fill’’ stage. Splay
sandstones represent the ‘‘spill’’ phase of overbank dep-
osition. A difference between our Bell Canyon model
and the Brushy Canyon models of Beaubouef et al.
(1999) and Gardner and Borer (2000) is our interpre-
tation that levees maintained the Bell Canyon channel
margins.
The depositional model developed from study of
well-exposed outcrops in the Bell Canyon Formation
guided our interpretation of the reservoirs at East Ford
field. This depositional model should be widely ap-
plicable to other Bell Canyon reservoirs. The results of
the outcrop study can thus be transferred by operators
to Bell Canyon fields throughout the play and used to
guide reservoir characterization.
RESERVOIR CHARACTERIZATION OF EASTFORD FIELD
The Ramsey sandstone, the main reservoir in East Ford
field, is the youngest sandstone in the Bell Canyon
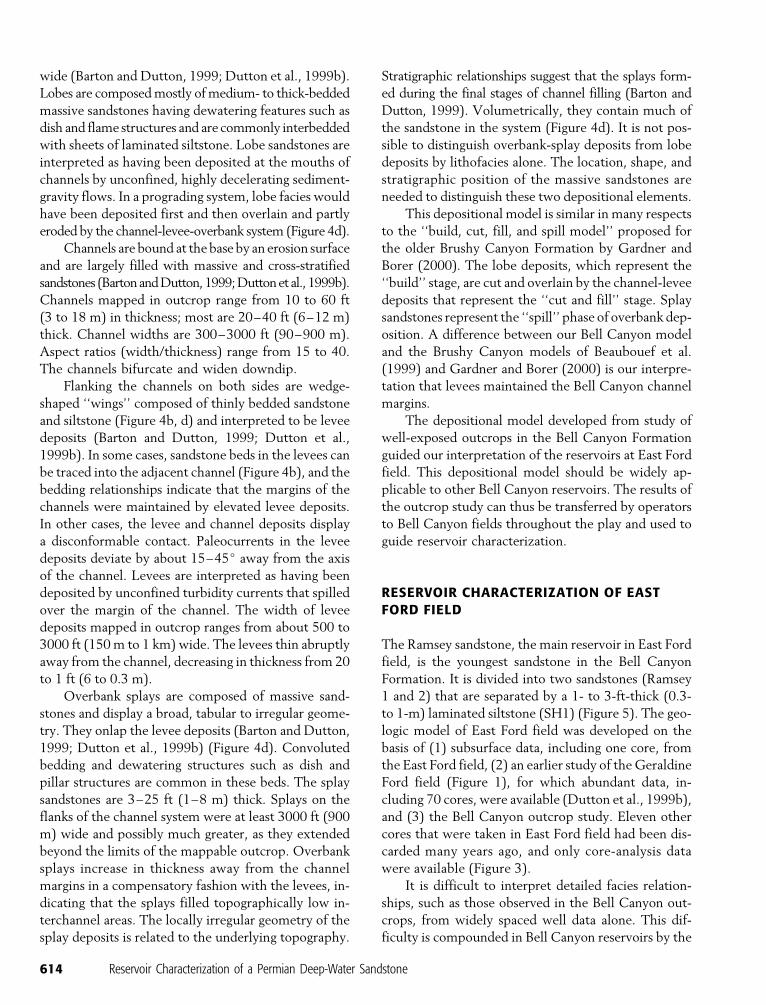
Formation. It is divided into two sandstones (Ramsey
1 and 2) that are separated by a 1- to 3-ft-thick (0.3-
to 1-m) laminated siltstone (SH1) (Figure 5). The geo-
logic model of East Ford field was developed on the
basis of (1) subsurface data, including one core, from
the East Ford field, (2) an earlier study of the Geraldine
Ford field (Figure 1), for which abundant data, in-
cluding 70 cores, were available (Dutton et al., 1999b),
and (3) the Bell Canyon outcrop study. Eleven other
cores that were taken in East Ford field had been dis-
carded many years ago, and only core-analysis data
were available (Figure 3).
It is difficult to interpret detailed facies relation-
ships, such as those observed in the Bell Canyon out-
crops, from widely spaced well data alone. This dif-
ficulty is compounded in Bell Canyon reservoirs by the
614 Reservoir Characterization of a Permian Deep-Water Sandstone
absence of detrital clay in the sandstones; as a result, log
responses are muted, and log patterns are not always
reliable for facies identification. Interpretation of the
sandstone-thickness and log-facies data in the East Ford
field was strongly influenced by the depositional model
developed from the outcrop study.
Sandstone Distribution and Facies
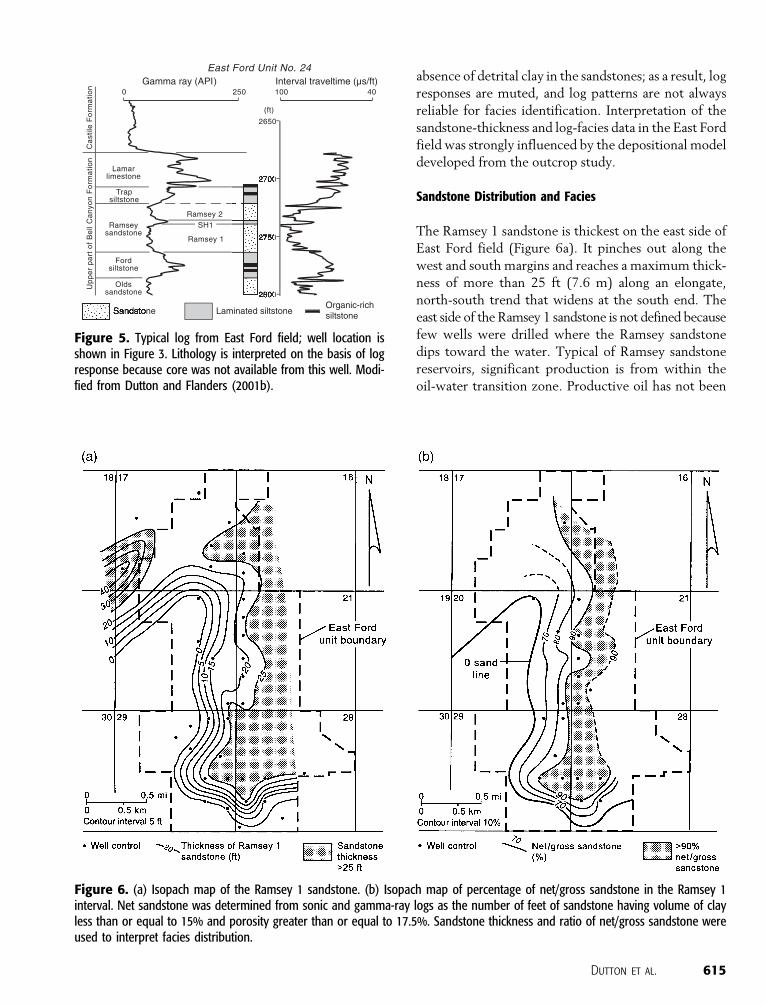
The Ramsey 1 sandstone is thickest on the east side of
East Ford field (Figure 6a). It pinches out along the
west and south margins and reaches a maximum thick-
ness of more than 25 ft (7.6 m) along an elongate,
north-south trend that widens at the south end. The
east side of the Ramsey 1 sandstone is not defined because
few wells were drilled where the Ramsey sandstone
dips toward the water. Typical of Ramsey sandstone
reservoirs, significant production is from within the
oil-water transition zone. Productive oil has not been
Dutton et al. 615
Figure 5. Typical log from East Ford field; well location isshown in Figure 3. Lithology is interpreted on the basis of logresponse because core was not available from this well. Modi-fied from Dutton and Flanders (2001b).
Figure 6. (a) Isopach map of the Ramsey 1 sandstone. (b) Isopach map of percentage of net/gross sandstone in the Ramsey 1interval. Net sandstone was determined from sonic and gamma-ray logs as the number of feet of sandstone having volume of clayless than or equal to 15% and porosity greater than or equal to 17.5%. Sandstone thickness and ratio of net/gross sandstone wereused to interpret facies distribution.
defined below 88 ft (27 m) above sea level. Because log
control to the east is poor, the orientation of the Ramsey
1 sandstone is uncertain, and it may be oriented more
northeast-southwest than is shown in Figure 6a.
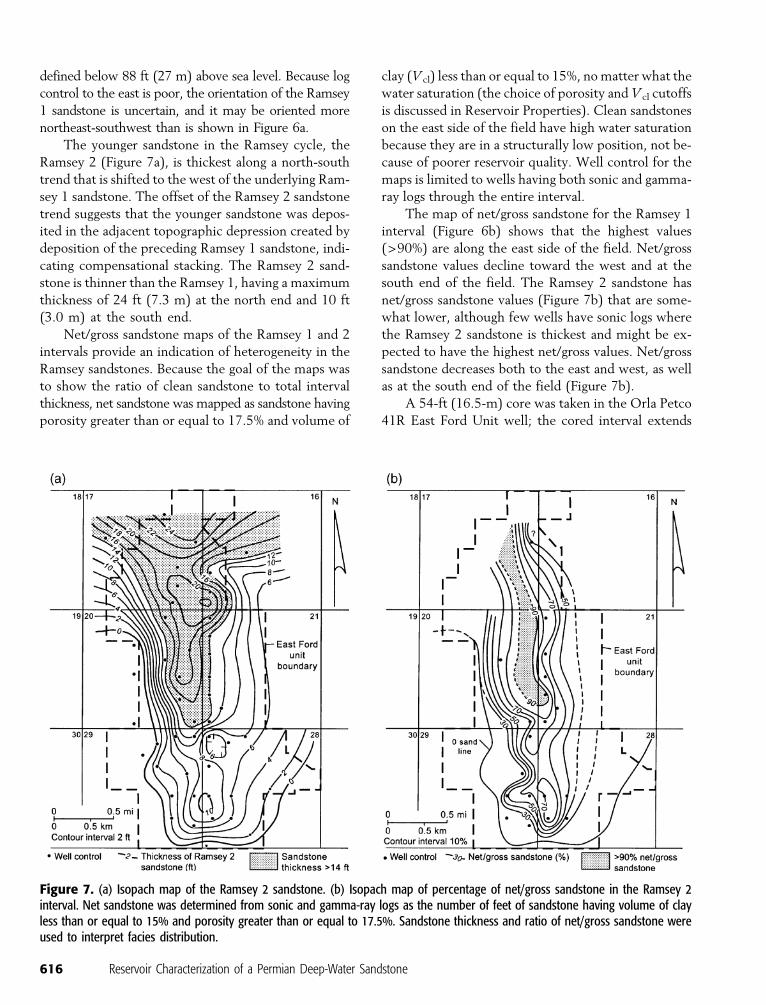
The younger sandstone in the Ramsey cycle, the
Ramsey 2 (Figure 7a), is thickest along a north-south
trend that is shifted to the west of the underlying Ram-
sey 1 sandstone. The offset of the Ramsey 2 sandstone
trend suggests that the younger sandstone was depos-
ited in the adjacent topographic depression created by
deposition of the preceding Ramsey 1 sandstone, indi-
cating compensational stacking. The Ramsey 2 sand-
stone is thinner than the Ramsey 1, having a maximum
thickness of 24 ft (7.3 m) at the north end and 10 ft
(3.0 m) at the south end.
Net/gross sandstone maps of the Ramsey 1 and 2
intervals provide an indication of heterogeneity in the
Ramsey sandstones. Because the goal of the maps was
to show the ratio of clean sandstone to total interval
thickness, net sandstone was mapped as sandstone having
porosity greater than or equal to 17.5% and volume of
clay (Vcl) less than or equal to 15%, no matter what the
water saturation (the choice of porosity and Vcl cutoffs
is discussed in Reservoir Properties). Clean sandstones
on the east side of the field have high water saturation
because they are in a structurally low position, not be-
cause of poorer reservoir quality. Well control for the
maps is limited to wells having both sonic and gamma-
ray logs through the entire interval.
The map of net/gross sandstone for the Ramsey 1
interval (Figure 6b) shows that the highest values
(>90%) are along the east side of the field. Net/gross
sandstone values decline toward the west and at the
south end of the field. The Ramsey 2 sandstone has
net/gross sandstone values (Figure 7b) that are some-
what lower, although few wells have sonic logs where
the Ramsey 2 sandstone is thickest and might be ex-
pected to have the highest net/gross values. Net/gross
sandstone decreases both to the east and west, as well
as at the south end of the field (Figure 7b).
A 54-ft (16.5-m) core was taken in the Orla Petco
41R East Ford Unit well; the cored interval extends
616 Reservoir Characterization of a Permian Deep-Water Sandstone
Figure 7. (a) Isopach map of the Ramsey 2 sandstone. (b) Isopach map of percentage of net/gross sandstone in the Ramsey 2interval. Net sandstone was determined from sonic and gamma-ray logs as the number of feet of sandstone having volume of clayless than or equal to 15% and porosity greater than or equal to 17.5%. Sandstone thickness and ratio of net/gross sandstone wereused to interpret facies distribution.
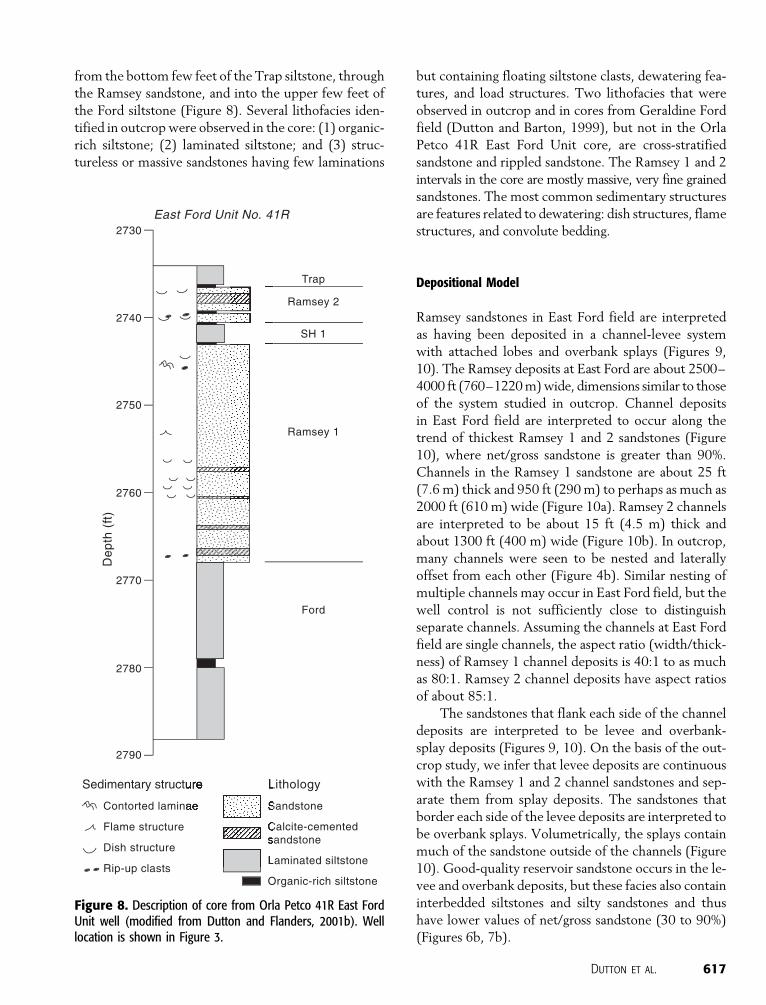
from the bottom few feet of the Trap siltstone, through
the Ramsey sandstone, and into the upper few feet of
the Ford siltstone (Figure 8). Several lithofacies iden-
tified in outcrop were observed in the core: (1) organic-
rich siltstone; (2) laminated siltstone; and (3) struc-
tureless or massive sandstones having few laminations
but containing floating siltstone clasts, dewatering fea-
tures, and load structures. Two lithofacies that were
observed in outcrop and in cores from Geraldine Ford
field (Dutton and Barton, 1999), but not in the Orla
Petco 41R East Ford Unit core, are cross-stratified
sandstone and rippled sandstone. The Ramsey 1 and 2
intervals in the core are mostly massive, very fine grained
sandstones. The most common sedimentary structures
are features related to dewatering: dish structures, flame
structures, and convolute bedding.
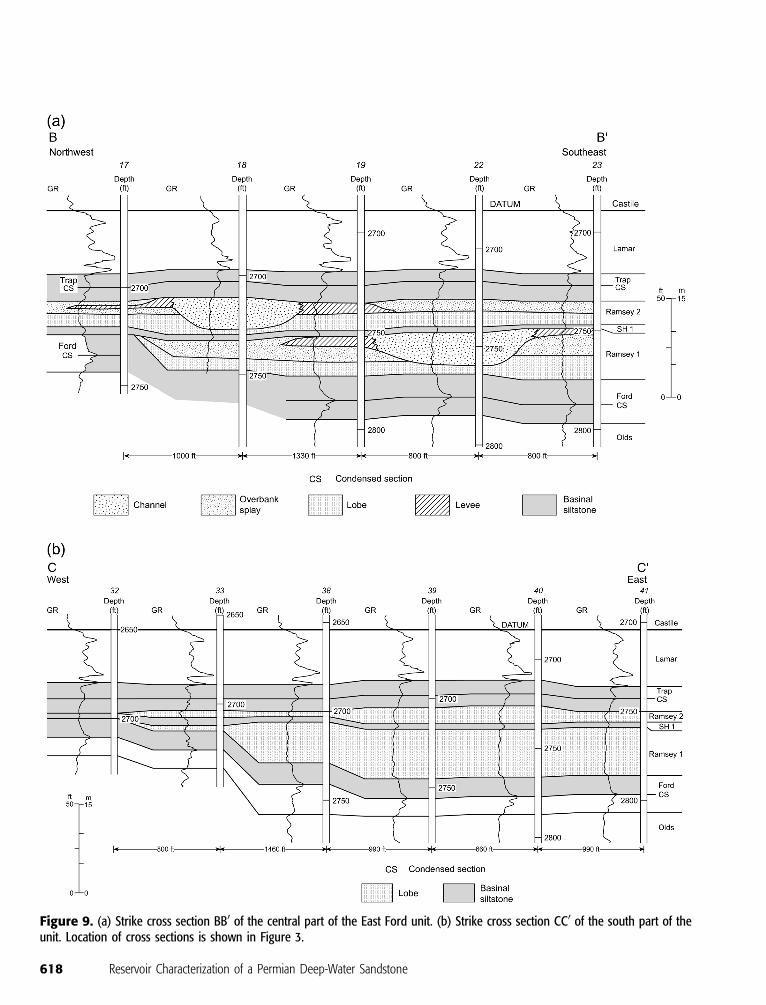
Depositional Model
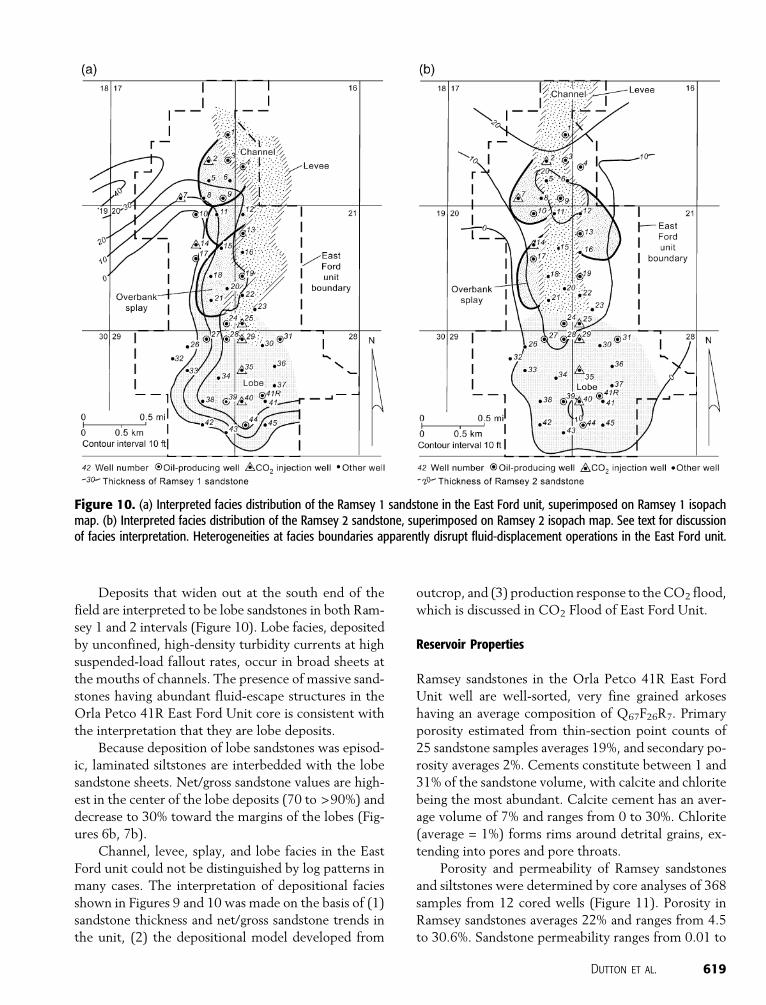
Ramsey sandstones in East Ford field are interpreted
as having been deposited in a channel-levee system
with attached lobes and overbank splays (Figures 9,
10). The Ramsey deposits at East Ford are about 2500–
4000 ft (760–1220 m) wide, dimensions similar to those
of the system studied in outcrop. Channel deposits
in East Ford field are interpreted to occur along the
trend of thickest Ramsey 1 and 2 sandstones (Figure
10), where net/gross sandstone is greater than 90%.
Channels in the Ramsey 1 sandstone are about 25 ft
(7.6 m) thick and 950 ft (290 m) to perhaps as much as
2000 ft (610 m) wide (Figure 10a). Ramsey 2 channels
are interpreted to be about 15 ft (4.5 m) thick and
about 1300 ft (400 m) wide (Figure 10b). In outcrop,
many channels were seen to be nested and laterally
offset from each other (Figure 4b). Similar nesting of
multiple channels may occur in East Ford field, but the
well control is not sufficiently close to distinguish
separate channels. Assuming the channels at East Ford
field are single channels, the aspect ratio (width/thick-
ness) of Ramsey 1 channel deposits is 40:1 to as much
as 80:1. Ramsey 2 channel deposits have aspect ratios
of about 85:1.
The sandstones that flank each side of the channel
deposits are interpreted to be levee and overbank-
splay deposits (Figures 9, 10). On the basis of the out-
crop study, we infer that levee deposits are continuous
with the Ramsey 1 and 2 channel sandstones and sep-
arate them from splay deposits. The sandstones that
border each side of the levee deposits are interpreted to
be overbank splays. Volumetrically, the splays contain
much of the sandstone outside of the channels (Figure
10). Good-quality reservoir sandstone occurs in the le-
vee and overbank deposits, but these facies also contain
interbedded siltstones and silty sandstones and thus
have lower values of net/gross sandstone (30 to 90%)
(Figures 6b, 7b).
Dutton et al. 617
Figure 8. Description of core from Orla Petco 41R East FordUnit well (modified from Dutton and Flanders, 2001b). Welllocation is shown in Figure 3.
618 Reservoir Characterization of a Permian Deep-Water Sandstone
Figure 9. (a) Strike cross section BB0 of the central part of the East Ford unit. (b) Strike cross section CC0 of the south part of theunit. Location of cross sections is shown in Figure 3.
Deposits that widen out at the south end of the
field are interpreted to be lobe sandstones in both Ram-
sey 1 and 2 intervals (Figure 10). Lobe facies, deposited
by unconfined, high-density turbidity currents at high
suspended-load fallout rates, occur in broad sheets at
the mouths of channels. The presence of massive sand-
stones having abundant fluid-escape structures in the
Orla Petco 41R East Ford Unit core is consistent with
the interpretation that they are lobe deposits.
Because deposition of lobe sandstones was episod-
ic, laminated siltstones are interbedded with the lobe
sandstone sheets. Net/gross sandstone values are high-
est in the center of the lobe deposits (70 to >90%) and
decrease to 30% toward the margins of the lobes (Fig-
ures 6b, 7b).
Channel, levee, splay, and lobe facies in the East
Ford unit could not be distinguished by log patterns in
many cases. The interpretation of depositional facies
shown in Figures 9 and 10 was made on the basis of (1)
sandstone thickness and net/gross sandstone trends in
the unit, (2) the depositional model developed from
outcrop, and (3) production response to the CO2 flood,
which is discussed in CO2 Flood of East Ford Unit.
Reservoir Properties
Ramsey sandstones in the Orla Petco 41R East Ford
Unit well are well-sorted, very fine grained arkoses
having an average composition of Q67F26R7. Primary
porosity estimated from thin-section point counts of
25 sandstone samples averages 19%, and secondary po-
rosity averages 2%. Cements constitute between 1 and
31% of the sandstone volume, with calcite and chlorite
being the most abundant. Calcite cement has an aver-
age volume of 7% and ranges from 0 to 30%. Chlorite
(average = 1%) forms rims around detrital grains, ex-
tending into pores and pore throats.
Porosity and permeability of Ramsey sandstones
and siltstones were determined by core analyses of 368
samples from 12 cored wells (Figure 11). Porosity in
Ramsey sandstones averages 22% and ranges from 4.5
to 30.6%. Sandstone permeability ranges from 0.01 to
Dutton et al. 619
Figure 10. (a) Interpreted facies distribution of the Ramsey 1 sandstone in the East Ford unit, superimposed on Ramsey 1 isopachmap. (b) Interpreted facies distribution of the Ramsey 2 sandstone, superimposed on Ramsey 2 isopach map. See text for discussionof facies interpretation. Heterogeneities at facies boundaries apparently disrupt fluid-displacement operations in the East Ford unit.
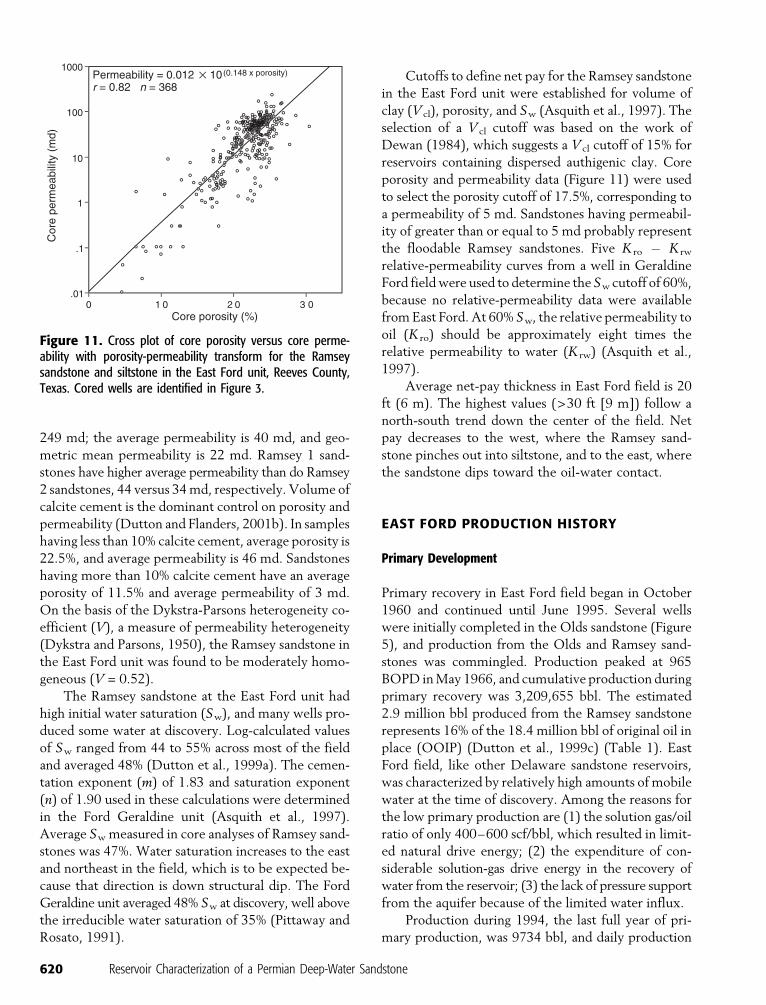
249 md; the average permeability is 40 md, and geo-
metric mean permeability is 22 md. Ramsey 1 sand-
stones have higher average permeability than do Ramsey
2 sandstones, 44 versus 34 md, respectively. Volume of
calcite cement is the dominant control on porosity and
permeability (Dutton and Flanders, 2001b). In samples
having less than 10% calcite cement, average porosity is
22.5%, and average permeability is 46 md. Sandstones
having more than 10% calcite cement have an average
porosity of 11.5% and average permeability of 3 md.
On the basis of the Dykstra-Parsons heterogeneity co-
efficient (V), a measure of permeability heterogeneity
(Dykstra and Parsons, 1950), the Ramsey sandstone in
the East Ford unit was found to be moderately homo-
geneous (V = 0.52).
The Ramsey sandstone at the East Ford unit had
high initial water saturation (Sw), and many wells pro-
duced some water at discovery. Log-calculated values
of Sw ranged from 44 to 55% across most of the field
and averaged 48% (Dutton et al., 1999a). The cemen-
tation exponent (m) of 1.83 and saturation exponent
(n) of 1.90 used in these calculations were determined
in the Ford Geraldine unit (Asquith et al., 1997).
Average Sw measured in core analyses of Ramsey sand-
stones was 47%. Water saturation increases to the east
and northeast in the field, which is to be expected be-
cause that direction is down structural dip. The Ford
Geraldine unit averaged 48% Sw at discovery, well above
the irreducible water saturation of 35% (Pittaway and
Rosato, 1991).
Cutoffs to define net pay for the Ramsey sandstone
in the East Ford unit were established for volume of
clay (Vcl), porosity, and Sw (Asquith et al., 1997). The
selection of a Vcl cutoff was based on the work of
Dewan (1984), which suggests a Vcl cutoff of 15% for
reservoirs containing dispersed authigenic clay. Core
porosity and permeability data (Figure 11) were used
to select the porosity cutoff of 17.5%, corresponding to
a permeability of 5 md. Sandstones having permeabil-
ity of greater than or equal to 5 md probably represent
the floodable Ramsey sandstones. Five K ro � K rw
relative-permeability curves from a well in Geraldine
Ford field were used to determine the Sw cutoff of 60%,
because no relative-permeability data were available
from East Ford. At 60% Sw, the relative permeability to
oil (K ro) should be approximately eight times the
relative permeability to water (K rw) (Asquith et al.,
1997).
Average net-pay thickness in East Ford field is 20
ft (6 m). The highest values (>30 ft [9 m]) follow a
north-south trend down the center of the field. Net
pay decreases to the west, where the Ramsey sand-
stone pinches out into siltstone, and to the east, where
the sandstone dips toward the oil-water contact.
EAST FORD PRODUCTION HISTORY
Primary Development
Primary recovery in East Ford field began in October
1960 and continued until June 1995. Several wells
were initially completed in the Olds sandstone (Figure
5), and production from the Olds and Ramsey sand-
stones was commingled. Production peaked at 965
BOPD in May 1966, and cumulative production during
primary recovery was 3,209,655 bbl. The estimated
2.9 million bbl produced from the Ramsey sandstone
represents 16% of the 18.4 million bbl of original oil in
place (OOIP) (Dutton et al., 1999c) (Table 1). East
Ford field, like other Delaware sandstone reservoirs,
was characterized by relatively high amounts of mobile
water at the time of discovery. Among the reasons for
the low primary production are (1) the solution gas/oil
ratio of only 400–600 scf/bbl, which resulted in limit-
ed natural drive energy; (2) the expenditure of con-
siderable solution-gas drive energy in the recovery of
water from the reservoir; (3) the lack of pressure support
from the aquifer because of the limited water influx.
Production during 1994, the last full year of pri-
mary production, was 9734 bbl, and daily production
620 Reservoir Characterization of a Permian Deep-Water Sandstone
Figure 11. Cross plot of core porosity versus core perme-ability with porosity-permeability transform for the Ramseysandstone and siltstone in the East Ford unit, Reeves County,Texas. Cored wells are identified in Figure 3.
had declined to 30 bbl. The decline rate, calculated using
an exponential least-squares fit of the production data
from April 1991 through September 1994, was 10.1%.
At that rate of decline, the economic limit of the field
would have been reached soon if the CO2 flood had
not started.
The East Ford unit did not undergo secondary
recovery by water flooding, because water flooding has
not been very successful in other Ramsey sandstone
reservoirs. Water flooding added about 4% of the OOIP
to the total recovery from the Ford Geraldine unit
(Pittaway and Rosato, 1991) and from Twofreds (West
Side) field in Loving County, Texas (Kirkpatrick et al.,
1985; Flanders and DePauw, 1993). Waterflood re-
coveries in Ramsey sandstones have been low because
of poor sweep efficiency caused by (1) abundant mobile
water present when the waterflood was started, (2)
water injection above the formation parting pressure,
(3) lack of proper water filtration, and (4) patterns not
arranged to exploit depositional characteristics.
CO2 Flood of East Ford Unit
Two Bell Canyon reservoirs have already undergone
CO2 floods, Twofreds Delaware unit and Ford Geral-
dine unit (Figure 1). Tertiary recovery began in 1974 in
the Twofreds unit (Kirkpatrick et al., 1985; Flanders
and DePauw, 1993) and in 1981 in the Ford Geraldine
unit (Pittaway and Rosato, 1991). In the Twofreds
unit, 12% of OOIP was recovered by the CO2 flood
(Table 1) (Dutton and Flanders, 2001a). Approxi-
mately 7% of OOIP in the flooded area of the Ford
Geraldine unit was recovered by the CO2 flood (Table
1). Tertiary recovery from the Ford Geraldine unit may
be lower because a higher percentage of OOIP (23%)
was recovered during primary and secondary production
than in the Twofreds unit (16%) (Table 1) because of a
stronger solution-gas drive at Ford Geraldine.
East Ford field was unitized, and CO2 injection in
the East Ford unit began in July 1995 with 8 injectors
and 11 producers; the unit currently has 7 injectors and
15 producers (Figure 3). The number of active wells in
the unit was kept low to reduce costs. In the north part
of the unit, the injectors are positioned on the west side,
but to the south, the injectors are located centrally
(Figure 3).
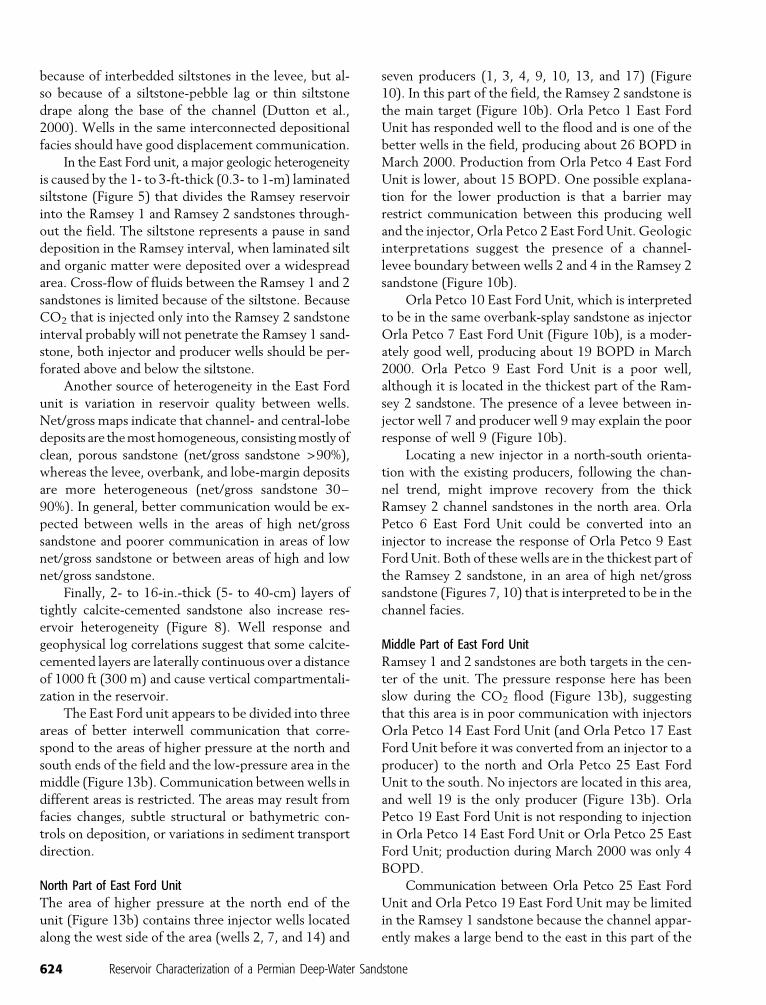
The first response to the flood was observed in
April 1996, and major production response in the unit
began in December 1997 (Figure 12). Average bottom-
hole pressure in the unit at the start of the project was
723 psi (4.98�106 Pa), whereas minimum miscibility
pressure is 900 psi (6.21�106 Pa). Somewhat higher
pressure occurred around wells 7, 12, 36, and 37 (Fig-
ure 13a), where produced water was reinjected into
the formation. The low pressure in the East Ford unit
at the start of the CO2 flood, combined with the low
reservoir temperature of 83jF (23jC), meant that CO2
would exist as both vapor and liquid phases under these
Dutton et al. 621
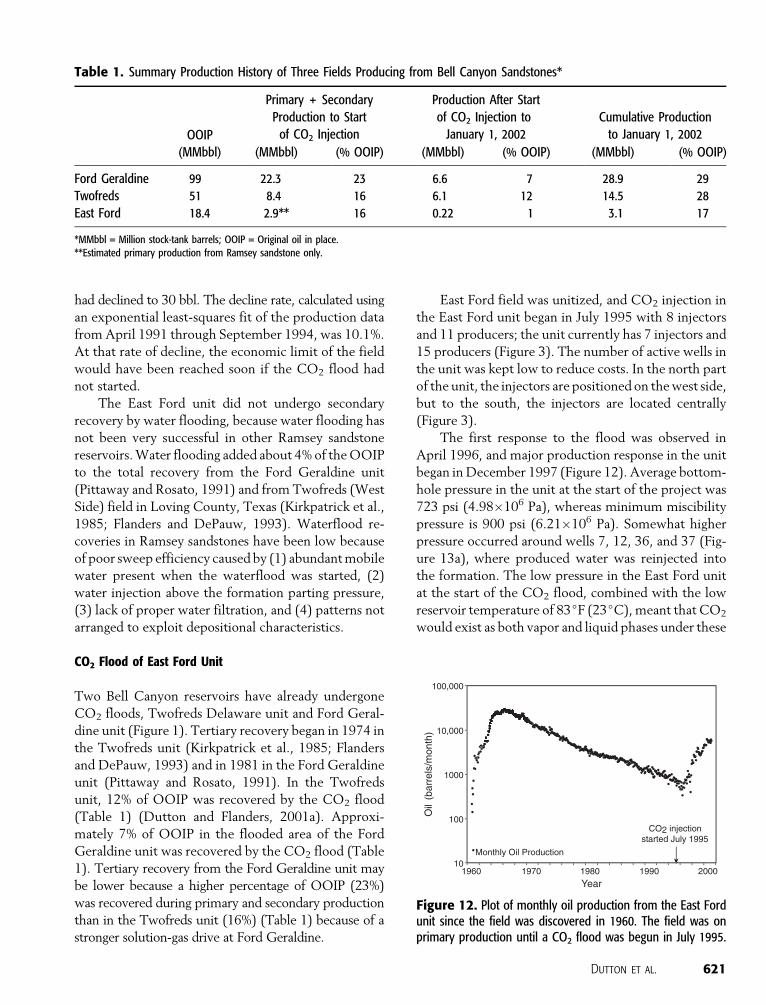
Table 1. Summary Production History of Three Fields Producing from Bell Canyon Sandstones*
OOIP
Primary + Secondary
Production to Start
of CO2 Injection
Production After Start
of CO2 Injection to
January 1, 2002
Cumulative Production
to January 1, 2002
(MMbbl) (MMbbl) (% OOIP) (MMbbl) (% OOIP) (MMbbl) (% OOIP)
Ford Geraldine 99 22.3 23 6.6 7 28.9 29
Twofreds 51 8.4 16 6.1 12 14.5 28
East Ford 18.4 2.9** 16 0.22 1 3.1 17
*MMbbl = Million stock-tank barrels; OOIP = Original oil in place.**Estimated primary production from Ramsey sandstone only.
Figure 12. Plot of monthly oil production from the East Fordunit since the field was discovered in 1960. The field was onprimary production until a CO2 flood was begun in July 1995.
conditions. Response to CO2 injection in the field may
have been delayed as a result. At these low tempera-
tures and pressures, liquid CO2 can occur on both the
injection side and the production side.
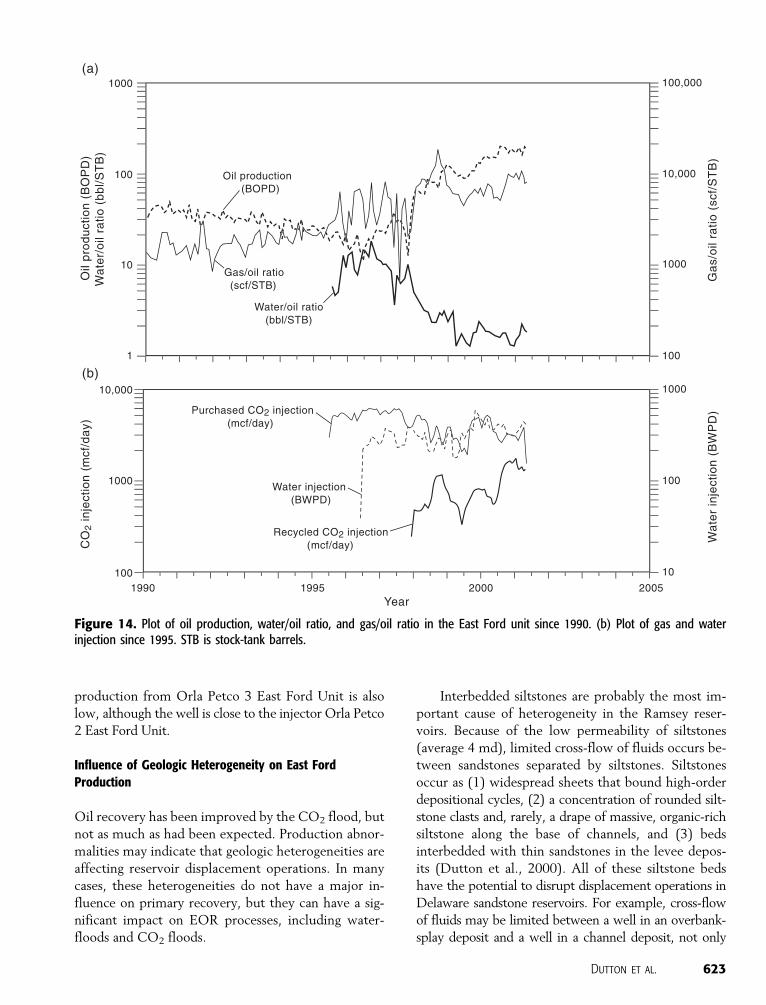
By May 2001, the production rate had increased to
185 BOPD, along with 345 BWPD and 1.7 mmcf/day
(hydrocarbon gases and CO2) (Figure 14a). Most of the
produced gas and water are reinjected, and to repres-
sure the reservoir, additional water for injection is being
taken from a nearby operator. Cumulative production
through May 2001 was 180,097 stock-tank bbl of oil,
518,000 bbl of water, and 1344 mmcf of gas. Essentially
all the oil production since the start of the CO2 flood
can be attributed to the EOR project. Injection rates in
May 2001 were 3100 mcf/day of purchased CO2, 1425
mcf of recycled CO2, and 375 BWPD (Figure 14b).
Cumulative injection through May 2001 was 9057
mmcf of purchased CO2, 1075 mmcf of recycled CO2,
and 670,000 bbl of water.
The CO2 flood has increased production from the
East Ford unit substantially (Figure 14), but several
production abnormalities have been observed: (1) low
pressure in the center of the field, (2) low production
rates, (3) severe reduction in transmissibility indicated
by a bottom-hole pressure-buildup test, and (4) low
gas production rates in key wells. Some of these abnor-
malities may be caused by mechanical problems, but
others may result from the effect of geologic hetero-
geneity in the field.
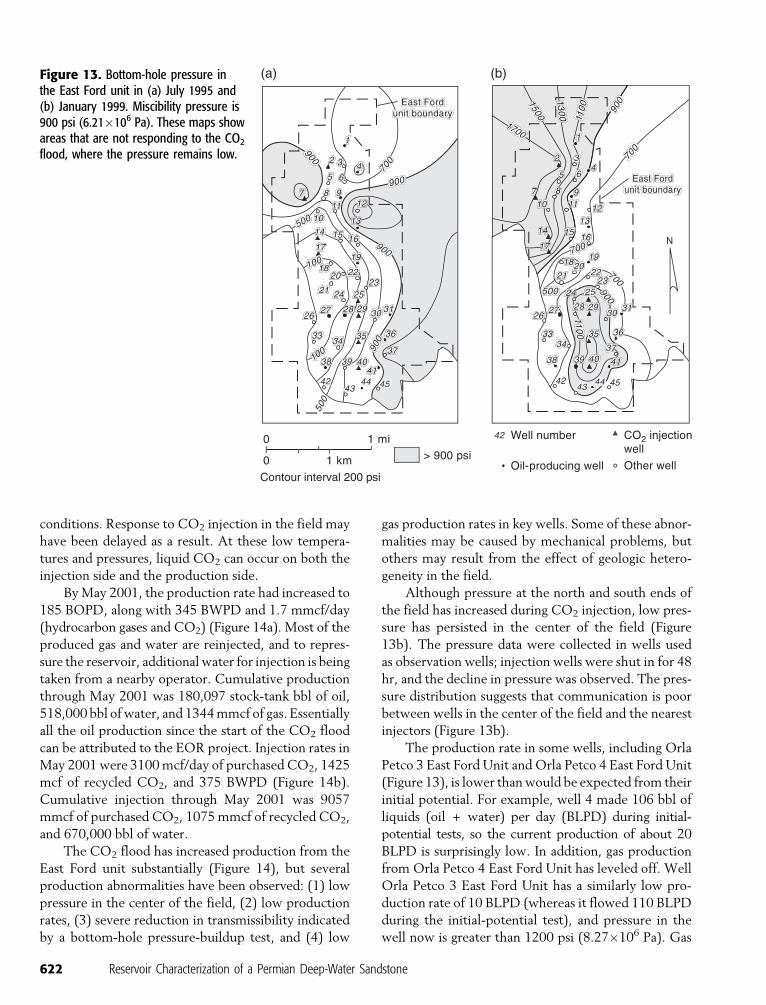
Although pressure at the north and south ends of
the field has increased during CO2 injection, low pres-
sure has persisted in the center of the field (Figure
13b). The pressure data were collected in wells used
as observation wells; injection wells were shut in for 48
hr, and the decline in pressure was observed. The pres-
sure distribution suggests that communication is poor
between wells in the center of the field and the nearest
injectors (Figure 13b).
The production rate in some wells, including Orla
Petco 3 East Ford Unit and Orla Petco 4 East Ford Unit
(Figure 13), is lower than would be expected from their
initial potential. For example, well 4 made 106 bbl of
liquids (oil + water) per day (BLPD) during initial-
potential tests, so the current production of about 20
BLPD is surprisingly low. In addition, gas production
from Orla Petco 4 East Ford Unit has leveled off. Well
Orla Petco 3 East Ford Unit has a similarly low pro-
duction rate of 10 BLPD (whereas it flowed 110 BLPD
during the initial-potential test), and pressure in the
well now is greater than 1200 psi (8.27�106 Pa). Gas
622 Reservoir Characterization of a Permian Deep-Water Sandstone
Figure 13. Bottom-hole pressure inthe East Ford unit in (a) July 1995 and(b) January 1999. Miscibility pressure is900 psi (6.21�106 Pa). These maps showareas that are not responding to the CO2
flood, where the pressure remains low.
production from Orla Petco 3 East Ford Unit is also
low, although the well is close to the injector Orla Petco
2 East Ford Unit.
Influence of Geologic Heterogeneity on East FordProduction
Oil recovery has been improved by the CO2 flood, but
not as much as had been expected. Production abnor-
malities may indicate that geologic heterogeneities are
affecting reservoir displacement operations. In many
cases, these heterogeneities do not have a major in-
fluence on primary recovery, but they can have a sig-
nificant impact on EOR processes, including water-
floods and CO2 floods.
Interbedded siltstones are probably the most im-
portant cause of heterogeneity in the Ramsey reser-
voirs. Because of the low permeability of siltstones
(average 4 md), limited cross-flow of fluids occurs be-
tween sandstones separated by siltstones. Siltstones
occur as (1) widespread sheets that bound high-order
depositional cycles, (2) a concentration of rounded silt-
stone clasts and, rarely, a drape of massive, organic-rich
siltstone along the base of channels, and (3) beds
interbedded with thin sandstones in the levee depos-
its (Dutton et al., 2000). All of these siltstone beds
have the potential to disrupt displacement operations in
Delaware sandstone reservoirs. For example, cross-flow
of fluids may be limited between a well in an overbank-
splay deposit and a well in a channel deposit, not only
Dutton et al. 623
Figure 14. Plot of oil production, water/oil ratio, and gas/oil ratio in the East Ford unit since 1990. (b) Plot of gas and waterinjection since 1995. STB is stock-tank barrels.
because of interbedded siltstones in the levee, but al-
so because of a siltstone-pebble lag or thin siltstone
drape along the base of the channel (Dutton et al.,
2000). Wells in the same interconnected depositional
facies should have good displacement communication.
In the East Ford unit, a major geologic heterogeneity
is caused by the 1- to 3-ft-thick (0.3- to 1-m) laminated
siltstone (Figure 5) that divides the Ramsey reservoir
into the Ramsey 1 and Ramsey 2 sandstones through-
out the field. The siltstone represents a pause in sand
deposition in the Ramsey interval, when laminated silt
and organic matter were deposited over a widespread
area. Cross-flow of fluids between the Ramsey 1 and 2
sandstones is limited because of the siltstone. Because
CO2 that is injected only into the Ramsey 2 sandstone
interval probably will not penetrate the Ramsey 1 sand-
stone, both injector and producer wells should be per-
forated above and below the siltstone.
Another source of heterogeneity in the East Ford
unit is variation in reservoir quality between wells.
Net/gross maps indicate that channel- and central-lobe
deposits are the most homogeneous, consisting mostly of
clean, porous sandstone (net/gross sandstone >90%),
whereas the levee, overbank, and lobe-margin deposits
are more heterogeneous (net/gross sandstone 30–
90%). In general, better communication would be ex-
pected between wells in the areas of high net/gross
sandstone and poorer communication in areas of low
net/gross sandstone or between areas of high and low
net/gross sandstone.
Finally, 2- to 16-in.-thick (5- to 40-cm) layers of
tightly calcite-cemented sandstone also increase res-
ervoir heterogeneity (Figure 8). Well response and
geophysical log correlations suggest that some calcite-
cemented layers are laterally continuous over a distance
of 1000 ft (300 m) and cause vertical compartmentali-
zation in the reservoir.
The East Ford unit appears to be divided into three
areas of better interwell communication that corre-
spond to the areas of higher pressure at the north and
south ends of the field and the low-pressure area in the
middle (Figure 13b). Communication between wells in
different areas is restricted. The areas may result from
facies changes, subtle structural or bathymetric con-
trols on deposition, or variations in sediment transport
direction.
North Part of East Ford Unit
The area of higher pressure at the north end of the
unit (Figure 13b) contains three injector wells located
along the west side of the area (wells 2, 7, and 14) and
seven producers (1, 3, 4, 9, 10, 13, and 17) (Figure
10). In this part of the field, the Ramsey 2 sandstone is
the main target (Figure 10b). Orla Petco 1 East Ford
Unit has responded well to the flood and is one of the
better wells in the field, producing about 26 BOPD in
March 2000. Production from Orla Petco 4 East Ford
Unit is lower, about 15 BOPD. One possible explana-
tion for the lower production is that a barrier may
restrict communication between this producing well
and the injector, Orla Petco 2 East Ford Unit. Geologic
interpretations suggest the presence of a channel-
levee boundary between wells 2 and 4 in the Ramsey 2
sandstone (Figure 10b).
Orla Petco 10 East Ford Unit, which is interpreted
to be in the same overbank-splay sandstone as injector
Orla Petco 7 East Ford Unit (Figure 10b), is a moder-
ately good well, producing about 19 BOPD in March
2000. Orla Petco 9 East Ford Unit is a poor well,
although it is located in the thickest part of the Ram-
sey 2 sandstone. The presence of a levee between in-
jector well 7 and producer well 9 may explain the poor
response of well 9 (Figure 10b).
Locating a new injector in a north-south orienta-
tion with the existing producers, following the chan-
nel trend, might improve recovery from the thick
Ramsey 2 channel sandstones in the north area. Orla
Petco 6 East Ford Unit could be converted into an
injector to increase the response of Orla Petco 9 East
Ford Unit. Both of these wells are in the thickest part of
the Ramsey 2 sandstone, in an area of high net/gross
sandstone (Figures 7, 10) that is interpreted to be in the
channel facies.
Middle Part of East Ford Unit
Ramsey 1 and 2 sandstones are both targets in the cen-
ter of the unit. The pressure response here has been
slow during the CO2 flood (Figure 13b), suggesting
that this area is in poor communication with injectors
Orla Petco 14 East Ford Unit (and Orla Petco 17 East
Ford Unit before it was converted from an injector to a
producer) to the north and Orla Petco 25 East Ford
Unit to the south. No injectors are located in this area,
and well 19 is the only producer (Figure 13b). Orla
Petco 19 East Ford Unit is not responding to injection
in Orla Petco 14 East Ford Unit or Orla Petco 25 East
Ford Unit; production during March 2000 was only 4
BOPD.
Communication between Orla Petco 25 East Ford
Unit and Orla Petco 19 East Ford Unit may be limited
in the Ramsey 1 sandstone because the channel appar-
ently makes a large bend to the east in this part of the
624 Reservoir Characterization of a Permian Deep-Water Sandstone
field (Figure 10a). The Ramsey 1 sandstone is thinner
in Orla Petco 19 East Ford Unit (Figure 6a), net/gross
sandstone is lower than in the wells to the north and
south (Figure 6b), and the percentage of calcite-cemented
sandstone is higher. All these factors may restrict com-
munication between Orla Petco 19 East Ford Unit and
Orla Petco 25 East Ford Unit. By adding an injector
well to this area, such as Orla Petco 20 East Ford Unit
and making Orla Petco 18 East Ford Unit, Orla Petco
21 East Ford Unit, and Orla Petco 22 East Ford Unit
producers may improve production from this appar-
ently isolated area.
South Part of East Ford Unit
The south area of the unit is mostly in the lobe facies of
the Ramsey 1 sandstone (Figure 10a), but lobe deposits
of the Ramsey 2 sandstone (Figure 10b) probably also
contribute to production. This area is responding well
to the existing north-south line of injectors. Wells Orla
Petco 27 East Ford Unit, Orla Petco 28 East Ford
Unit, and Orla Petco 31 East Ford Unit are among the
best wells in the field. Recovery in this area is interpret-
ed to be good because the injection and production
wells are all in a laterally continuous lobe sandstone.
Recovery might be improved by bringing on addition-
al producers.
CONCLUSIONS
The Ramsey sandstone interval of the Bell Canyon
Formation in East Ford field was characterized using
subsurface log and core data, but the interpretation
was guided by the depositional model developed from
study of well-exposed outcrop analogs in the Bell Can-
yon Formation. The Ramsey sandstones are interpreted
as having been deposited in a basin-floor setting by a
system of leveed channels having attached lobes and
overbank splays. Individual channel-levee and lobe com-
plexes stack in a compensatory fashion and are separated
by laterally continuous, laminated siltstones. Reservoir
sandstones consist of (1) broadly lenticular lobe de-
posits, (2) elongate channel deposits, and (3) irregular
splay deposits. The depositional model developed from
outcrop can be widely applied by operators to other
reservoirs that produce from Bell Canyon sandstones.
Enhanced oil recovery by CO2 flood has increased
production from these deep-water sandstone reser-
voirs. As a result of the CO2 flood, production from
the East Ford unit increased from 30 bbl/day at the
end of primary production to more than 185 bbl/day
in 2001. The unit produced 216,6297 bbl of oil from
the start of tertiary recovery through December 2001,
and essentially all this production can be attributed
to the EOR project.
Geologic heterogeneities appear to influence re-
sponse to the CO2 flood in the East Ford unit. The most
important causes of heterogeneity in the Ramsey sand-
stone reservoirs are the presence of siltstone beds, var-
iations in net/gross sandstone, and calcite-cemented
sandstone layers. All these heterogeneities have the
potential to disrupt displacement operations in Dela-
ware sandstone reservoirs by limiting cross-flow of fluids
between injector and producer wells. Locating an ade-
quate number of injectors and producers in the same
depositional facies, whether channels, splays, or lobes,
will maximize the reservoir volume contacted and the
production rate and minimize the displacement across
restrictive depositional barriers and the time to produce
the reservoir. EOR projects undertaken without inte-
grated geologic and engineering reservoir characteriza-
tion will not realize maximum potential production.
REFERENCES CITED
Asquith, G. B., S. P. Dutton, A. G. Cole, M. Razi, and J. I. Guzman,1997, Petrophysics of the Ramsey sandstone, Ford Geraldineunit, Reeves and Culberson counties, Texas: West TexasGeological Society Publication no. 97-102, p. 61–69.
Barton, M. D., 1997, Facies architecture of submarine channel-leveeand lobe sandstones: Permian Bell Canyon Formation, DelawareMountains, west Texas: University of Texas at Austin, Bureau ofEconomic Geology Field Trip Guidebook, 40 p.
Barton, M. D., and S. P. Dutton, 1999, Outcrop analysis of a sand-rich, basin-floor turbidite system, Permian Bell Canyon Forma-tion, west Texas, in T. F. Hentz, ed., Transactions: Gulf CoastSection SEPM 19th Annual Bob F. Perkins Research Con-ference, December 5–8, Houston, p. 53–64.
Basham, W. L., 1996, Delaware Mountain Group sandstone channelorientations: implications for sediment source and deposition,in W. D. DeMis and A. G. Cole, eds., The Brushy Canyon playin outcrop and subsurface: concepts and examples: SEPM(Permian Basin Section) Publication 96-38, p. 91–102.
Beaubouef, R. T., C. Rossen, F. B. Zelt, M. D. Sullivan, D. C. Mohrig,and D. C. Jennette, 1999, Deep-water sandstones, BrushyCanyon Formation, west Texas: AAPG Continuing EducationCourse Notes Series 40, 48 p.
Berg, R. R., 1979, Reservoir sandstones of the Delaware MountainGroup, southeast New Mexico, in N. M. Sullivan, ed., Guada-lupian Delaware Mountain Group of west Texas and southeastNew Mexico, Symposium and Field Trip Conference Guide-book: SEPM (Permian Basin Section) Publication 79-18,p. 75–95.
Bouma, A. H., 1962, Sedimentology of some flysch deposits: Agraphic approach to facies interpretation: Amsterdam, Else-vier, 168 p.
Bouma, A. H., 1996, Initial comparison between fine- and coarse-grained submarine fans and the Brushy Canyon Formation
Dutton et al. 625
sandstones, in W. D. DeMis and A. G. Cole, eds., The BrushyCanyon play in outcrop and subsurface: concepts andexamples: Guidebook, SEPM (Permian Basin Section) Publica-tion 96-38, p. 41–50.
Dewan, J. T., 1984, Essentials of modern open-hole log interpreta-tion: Tulsa, PennWell Publishing, 345 p.
Dutton, S. P., and M. D. Barton, 1999, Application of outcropanalogs to reservoir characterization of Permian deep-watersandstones, Bell Canyon Formation, Ford Geraldine Unit, westTexas (Delaware basin), in T. F. Hentz, ed., Transactions: GulfCoast Section SEPM 19th Annual Bob F. Perkins ResearchConference, December 5–8, Houston, p. 65–76.
Dutton, S. P., and W. A. Flanders, 2001a, Application of advancedreservoir characterization, simulation, and production optimi-zation strategies to maximize recovery in slope and basin clasticreservoirs, west Texas (Delaware basin): University of Texas atAustin, Bureau of Economic Geology, final report prepared forU.S. Department of Energy, DOE/BC/14936-18, 170 p.
Dutton, S. P., and W. A. Flanders, 2001b, Deposition and diagenesisof turbidite sandstones in East Ford Field, Bell CanyonFormation, Delaware basin, Texas: AAPG Southwest Section,2001 Annual Meeting Papers and Abstracts, Dallas, Texas,March 10–13, 12 p.
Dutton, S. P., G. B. Asquith, W. A., Flanders, J. I. Guzman, andH. H. Zirczy, 1999a, New techniques for using old geophysicallogs in reservoir characterization: examples from Bell Canyonsandstones, Ford Geraldine and East Ford units, Delawarebasin, Texas: Proceedings of the 1999 Oil & Gas ConferenceTechnology Options for Producer Survival, Conference spon-sored by the U.S. Department of Energy, Dallas, PublicationDOE/FETC-99/1103, 25 p.
Dutton, S. P., M. D. Barton, G. B. Asquith, M. A. Malik, A. G.Cole, J. Gogas, J. I. Guzman, and S. J. Clift, 1999b, Geologicand engineering characterization of turbidite reservoirs, FordGeraldine unit, Bell Canyon Formation, west Texas: Universityof Texas at Austin, Bureau of Economic Geology Report ofInvestigations no. 255, 88 p.
Dutton, S. P., W. A. Flanders, H. H. Zirczy, and J. I. Guzman, 1999c,Geologic and engineering characterization of East Ford field,Reeves County, Texas: University of Texas at Austin, Bureau ofEconomic Geology, topical report prepared for the U.S.Department of Energy, DOE/BC/14936-11, 113 p.
Dutton, S. P., M. D. Barton, H. H. Zirczy, and W. A. Flanders, 2000,Characterization of reservoir heterogeneity in slope and basinclastic reservoirs, Bell Canyon Formation, Delaware basin,Texas: Transactions, Southwest Section AAPG, publicationno. 2000-107, p. 116–129.
Dykstra, H., and R. L. Parsons, 1950, The prediction of oil recoveryby water flooding, in Secondary recovery of oil in the UnitedStates, 2d ed.: New York, American Petroleum Institute,p. 160–174.
Ewing, T. E., 1990, Tectonic map of Texas: University of Texas atAustin, Bureau of Economic Geology, scale 1:750,000, 4 sheets.
Fischer, A. G., and M. Sarnthein, 1988, Airborne silts and dune-derived sands in the Permian of the Delaware basin: Journal ofSedimentary Petrology, v. 58, p. 637–643.
Flanders, W. A., and R. M. DePauw, 1993, Update case history:Performance of the Twofreds Tertiary CO2 project: Society ofPetroleum Engineers Annual Technical Conference andExhibition, SPE Paper 26614, 10 p.
Galloway, W. E., and D. K. Hobday, 1996, Terrigenous clasticdepositional systems: applications to fossil fuel and ground-water resources, 2d ed.: New York, Springer-Verlag, 489 p.
Galloway, W. E., T. E. Ewing, C. M. Garrett Jr., N. Tyler, and D. G.Bebout, 1983, Atlas of major Texas oil reservoirs: University ofTexas at Austin, Bureau of Economic Geology, 139 p.
Gardner, M. H., 1992, Sequence stratigraphy of eolian-derivedturbidites: patterns of deep-water sedimentation along an aridcarbonate platform, Permian (Guadalupian) Delaware Moun-tain Group, west Texas, in D. H. Mruk and B. C. Curran, eds.,Permian Basin exploration and production strategies: applica-tions of sequence stratigraphic and reservoir characterizationconcepts: West Texas Geological Society Publication 92-91,p. 7–12.
Gardner, M. H., 1997a, Characterization of deep-water siliciclasticreservoirs in the upper Bell Canyon and Cherry Canyon for-mations of the northern Delaware basin, Culberson and ReevesCounties, Texas, in R. P. Major, ed., Oil and gas on Texas statelands: an assessment of the resource and characterization of typereservoirs: University of Texas, Bureau of Economic GeologyReport of Investigations no. 241, p. 137–146.
Gardner, M. H., 1997b, Sequence stratigraphy and hydrocarbonhabitat of the Permian (Guadalupian) Delaware MountainGroup, Delaware basin, west Texas, in R. P. Major, ed., Oil and gason Texas state lands: an assessment of the resource and charac-terization of type reservoirs: University of Texas, Bureau ofEconomic Geology Report of Investigations no. 241, p. 147–157.
Gardner, M. H., and J. M. Borer, 2000, Submarine channel archi-tecture along a slope to basin profile, Brushy Canyon Formation,west Texas, in A. H. Bouma and C. G. Stone, eds., Fine-grainedturbidite systems: AAPG Memoir 72/SEPM Special Publica-tion 68, p. 195–214.
Grant Jr., P. R., and R. W. Foster, 1989, Future petroleum provincesin New Mexico— discovering new reserves: New Mexico Bu-reau of Mines and Mineral Resources, 94 p.
Hills, J. M., 1984, Sedimentation, tectonism, and hydrocarbongeneration in Delaware basin, west Texas and southeasternNew Mexico: AAPG Bulletin, v. 68, p. 250–267.
Holtz, M. H., 1995, Characteristics of the Delaware submarine fansandstone play, southwestern U.S.A.: University of Texas atAustin, Bureau of Economic Geology, Internal Report, 8 p.
Jacka, A. D., 1979, Deposition and entrapment of hydrocarbons inBell Canyon and Cherry Canyon deep-sea fans of the Delawarebasin, in N. M. Sullivan, ed., Guadalupian Delaware MountainGroup of west Texas and southeast New Mexico: SEPM(Permian Basin Section) Publication 79-18, p. 104–120.
Kerans, C., and W. M. Fitchen, 1995, Sequence hierarchy and faciesarchitecture of a carbonate-ramp system: San Andres Forma-tion of Algerita Escarpment and western Guadalupe Moun-tains, west Texas and New Mexico: University of Texas atAustin, Bureau of Economic Geology Report of Investigationsno. 235, 86 p.
Kerans, C., W. M. Fitchen, M. H. Gardner, M. D. Sonnenfeld, S. W.Tinker, and B. R. Wardlaw, 1992, Styles of sequence devel-opment within uppermost Leonardian through Guadalupianstrata of the Guadalupe Mountains, Texas and New Mexico,in D. H. Mruk and B. C. Curran, eds., Permian basin explorationand production strategies: applications of sequence strati-graphic and reservoir characterization concepts: West TexasGeological Society Publication 92-91, p. 1–6.
Kirkpatrick, R. K., W. A. Flanders, and R. M. DePauw, 1985,Performance of the Twofreds CO2 injection project: Society ofPetroleum Engineers Annual Technical Conference andExhibition, SPE Paper 14439, 12 p.
Kosters, E. C., D. G. Bebout, S. J. Seni, C. M. Garrett Jr., L. F.Brown Jr., H. S. Hamlin, S. P. Dutton, S. C. Ruppel, R. J. Finley,and N. Tyler, 1989, Atlas of major Texas gas reservoirs:University of Texas at Austin, Bureau of Economic GeologySpecial Publication, 161 p.
Lewis, P., S. Cross, and G. Hoose, 1996, Delaware MountainGroup production map, in W. D. DeMis and A. G. Cole, eds.,The Brushy Canyon play in outcrop and subsurface: Concepts
626 Reservoir Characterization of a Permian Deep-Water Sandstone
and examples: SEPM (Permian Basin Section) Publication96-38, separate map in back pocket.
Meissner, F. F., 1972, Cyclic sedimentation in Middle Permian strataof the Permian basin, west Texas and New Mexico, in J. G. Elamand S. Chuber, eds., Cyclic sedimentation in the Permian Basin,2d ed.: West Texas Geological Society, p. 203–232.
Montgomery, S. L., J. Worrall, and D. Hamilton, 1999, DelawareMountain Group, west Texas and southeastern New Mexico, acase of refound opportunity: Part 1— Brushy Canyon: AAPGBulletin, v. 83, p. 1901–1926.
Montgomery, S. L., D. Hamilton, T. Hunt, and J. Worrall, 2000,Delaware Mountain Group, west Texas and southeastern NewMexico, a case of refound opportunity: Part 2— CherryCanyon: AAPG Bulletin, v. 84, p. 1–11.
Newell, N. D., J. K. Rigby, A. G. Fischer, A. J. Whiteman, J. E.Hickox, and J. S. Bradley, 1953, The Permian reef complex ofthe Guadalupe Mountains region, Texas and New Mexico: SanFrancisco, Freeman and Co., 236 p.
Payne, M. W., 1976, Basinal sandstone facies, Delaware basin, westTexas and southeast New Mexico: AAPG Bulletin, v. 60,p. 517–527.
Pittaway, K. R., and R. J. Rosato, 1991, The Ford Geraldine unitCO2 flood— update 1990: Society of Petroleum EngineersReservoir Engineering, v. 6, no. 4, p. 410–414.
Ross, C. A., and J. R. P. Ross, 1987, Late Paleozoic sea levels anddepositional sequences, in C. A. Ross and D. Haman, eds.,Timing and depositional history of eustatic sequences:
constraints on seismic stratigraphy: Washington, D.C., Cush-man Foundation for Foraminiferal Research, Special Publica-tion 24, p. 137–149.
Ruggiero, R. W., 1985, Depositional history and performance of aBell Canyon sandstone reservoir, Ford-Geraldine field, westTexas: Master’s thesis, University of Texas at Austin, Austin,Texas, 242 p.
Ruggiero, R. W., 1993, Depositional history and performance of aPermian Bell Canyon sandstone reservoir, Ford-Geraldine field,west Texas, in E. G. Rhodes and T. F. Moslow, eds., Marineclastic reservoirs: New York, Springer-Verlag, p. 201–229.
Williamson, C. R., 1978, Depositional processes, diagenesis andreservoir properties of Permian deep-sea sandstones, BellCanyon Formation, Texas— New Mexico: Ph.D. dissertation,University of Texas at Austin, Austin, Texas, 262 p.
Williamson, C. R., 1979, Deep-sea sedimentation and stratigraphictraps, Bell Canyon Formation (Permian), Delaware basin, inN. M. Sullivan, ed., Guadalupian Delaware Mountain Groupof west Texas and southeast New Mexico, Symposium andField Trip Conference Guidebook: SEPM (Permian BasinSection) Publication 79-18, p. 39–74.
Zelt, F. B., and C. Rossen, 1995, Geometry and continuity of deep-water sandstones and siltstones, Brushy Canyon Formation(Permian) Delaware Mountains, Texas, in K. T. Pickering,R. N. Hiscott, N. H. Kenyon, F. R. Lucchi, and R. D. A. Smith,eds., Atlas of deep water environments, architectural style inturbidite systems: London, Chapman and Hall, p. 167–183.
Dutton et al. 627