residential location choices and household activity engagement 1/14/2013 roger chen, steven gehrke,...
TRANSCRIPT

1
Residential Location Choices and Household Activity Engagement
1/14/2013
Roger Chen, Steven Gehrke, Yunemi Jiang, Jenny Liu and Kelly Clifton
Oregon Modeling Collaborative

Introduction
A relationship exists between where we live and what we do
Different Location type choices Lead to different activity engagement
What is the relationship between where we live and how households spend their time?

3
Overview of Study
• This study is concerned with loocation at ther elatopnsiip beween where wee vive and how we spend out time
• Data on Activity engagement is nucours; as a the alocation of time is distilled
• Estimate models of choice to look at connection

4
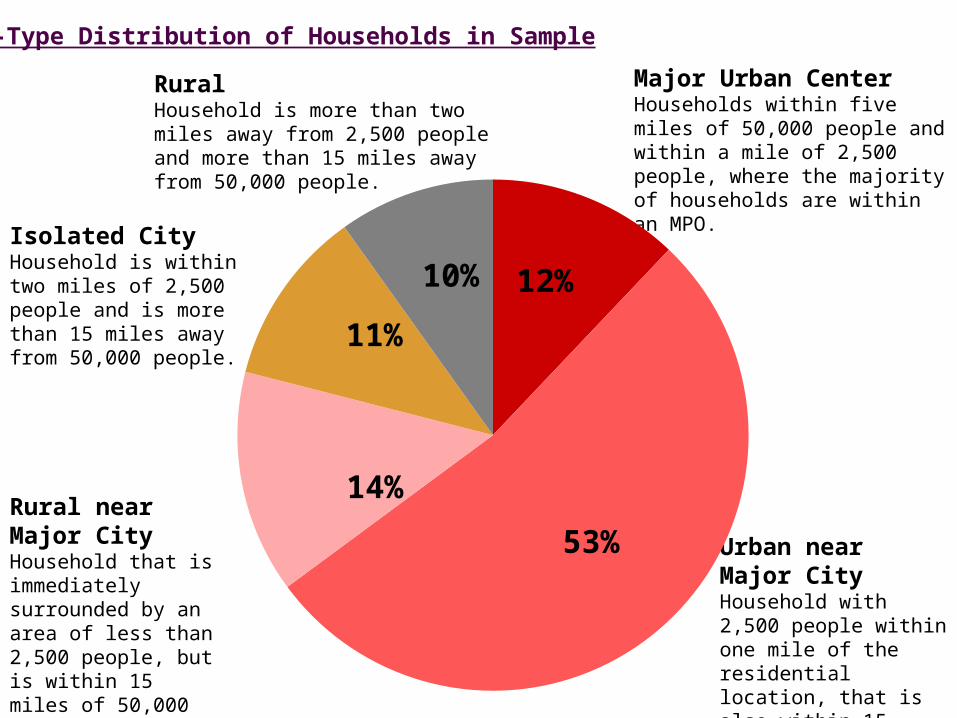
Study Area and Distribution of Residential Area-Types
5
Major Urban CenterHouseholds within five miles of 50,000 people and within a mile of 2,500 people, where the majority of households are within an MPO.
Urban near Major City Household with 2,500 people within one mile of the residential location, that is also within 15 miles of 50,000 people.
Rural near Major CityHousehold that is immediately surrounded by an area of less than 2,500 people, but is within 15 miles of 50,000 people.
Isolated CityHousehold is within two miles of 2,500 people and is more than 15 miles away from 50,000 people.
RuralHousehold is more than two miles away from 2,500 people and more than 15 miles away from 50,000 people.
Area-Type Distribution of Households in Sample
12%
53%
14%
11%
10%

6
Tenure-Housing Type Distribution of Sample
Housing Tenure
Rent Own
83.64%16.36%
Single-FamilyUnit
DuplexUnit
Multi-FamilyUnit
Single-FamilyUnit
DuplexUnit
Multi-FamilyUnit
96.7% 1.09% 2.21% 36.65 13.17% 50.18%
Rent
Own
MFSF
DPLX
SF
MFDPLX

7
Why we segment into lifestyle classes
• Control for heterogeneity• Based on classifications found in the literature
8
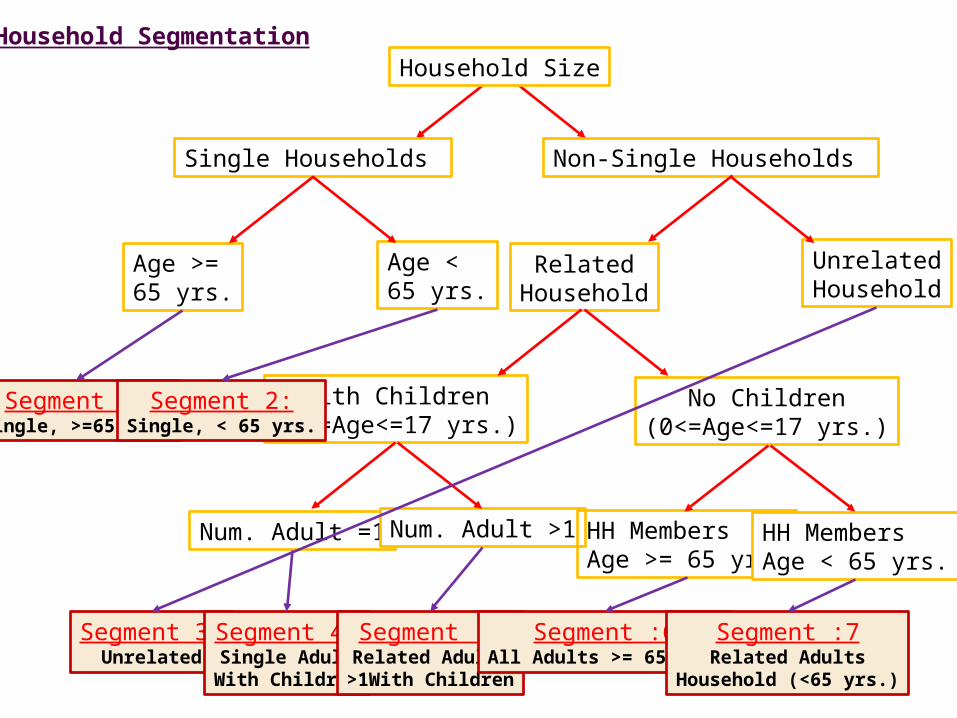
Household Segmentation
Single Households
Household Size
Non-Single Households
Age >= 65 yrs.
Age < 65 yrs.
with Children(0<=Age<=17 yrs.)
No Children(0<=Age<=17 yrs.)
RelatedHousehold
UnrelatedHousehold
Num. Adult =1 Num. Adult >1 HH MembersAge >= 65 yrs.
HH MembersAge < 65 yrs.
Segment 1:Single, >=65 yrs.
Segment 2:Single, < 65 yrs.
Segment 3:Unrelated
Segment 4:Single Adult
With Children
Segment :5Related Adults
>1With Children
Segment :6All Adults >= 65 yrs.
Segment :7Related Adults
Household (<65 yrs.)
10
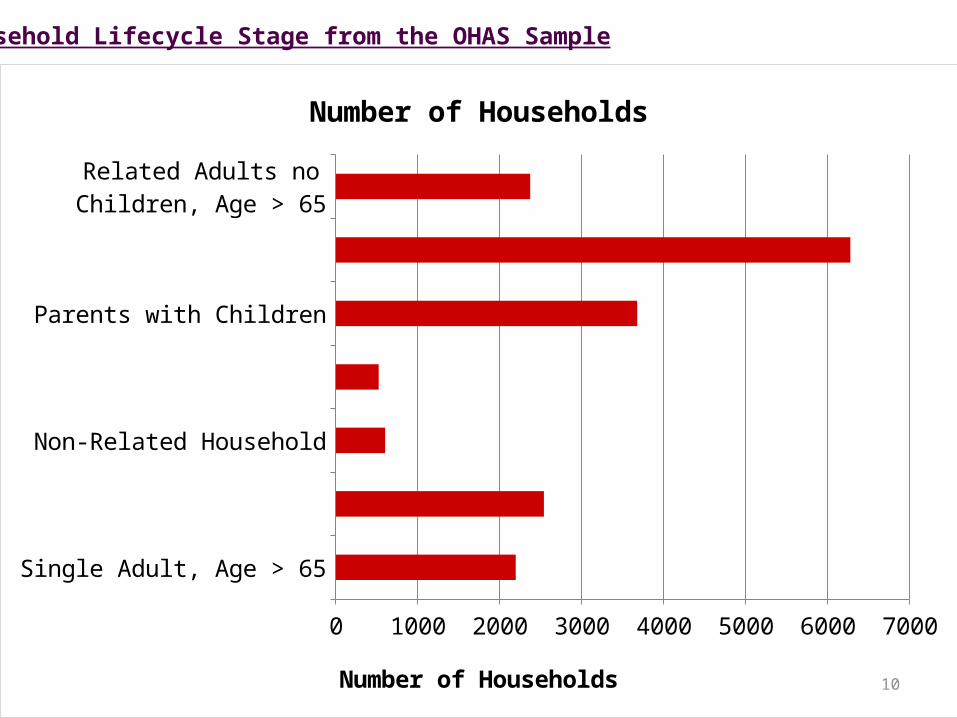
Household Lifecycle Stage from the OHAS Sample
Single Adult, Age > 65
Single Adult, Age 18-65
Non-Related Household
Single Parents with Children
Parents with Children
Related Adults no Children, Age < 65
Related Adults no Children, Age > 65
0 1000 2000 3000 4000 5000 6000 7000
Number of Households
Number of Households
11
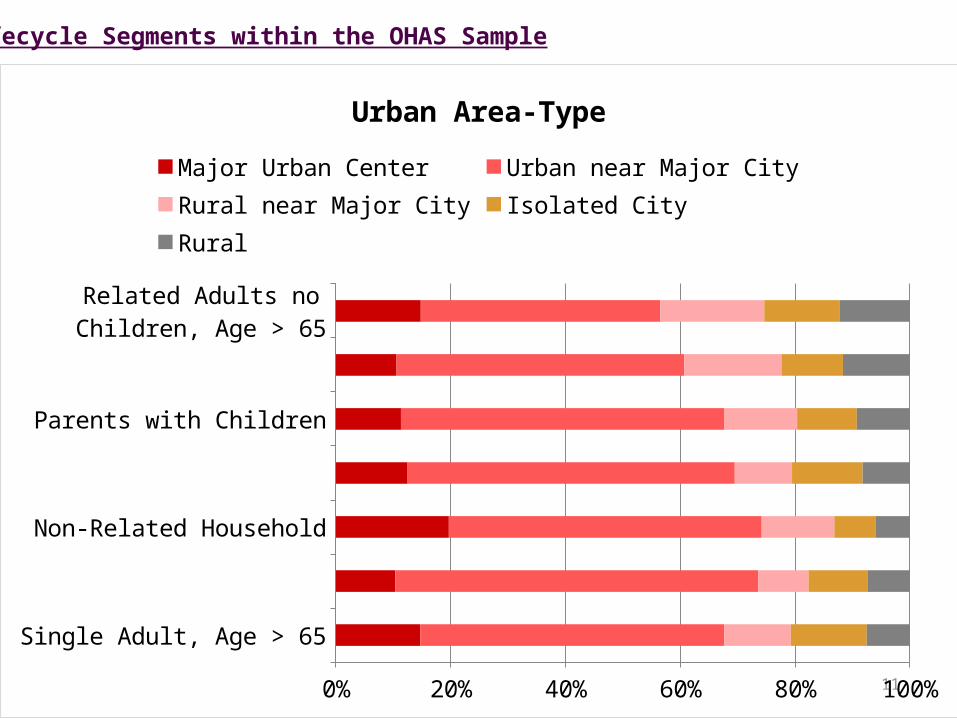
Lifecycle Segments within the OHAS Sample
Single Adult, Age > 65
Single Adult, Age 18-65
Non-Related Household
Single Parents with Children
Parents with Children
Related Adults no Children, Age < 65
Related Adults no Children, Age > 65
0% 20% 40% 60% 80% 100%
Urban Area-Type
Major Urban Center Urban near Major City Rural near Major CityIsolated City Rural

12
Lifecycle Segments within the OHAS Sample
Single Adult, Age > 65
Single Adult, Age 18-65
Non-Related Household
Single Parents with Children
Parents with Children
Related Adults no Children, Age < 65
Related Adults no Children, Age > 65
0% 20% 40% 60% 80% 100%
Household Structure Type
Single-Family Duplex/TownhomeBuilding with 3+ Apartments Mobile Home

14
Lifecycle Segments within the OHAS Sample
Single Adult, Age > 65
Single Adult, Age 18-65
Non-Related Household
Single Parents with Children
Parents with Children
Related Adults no Children, Age < 65
Related Adults no Children, Age > 65
0 0.5 1 1.5 2 2.5 3 3.5 4 4.5
Average Household Residents by Work-Status
Workers Students Retired Homemakers
Average per Household

15
Lifecycle Segments within the OHAS Sample
Single Adult, Age > 65
Single Adult, Age 18-65
Non-Related Household
Single Parents with Children
Parents with Children
Related Adults no Children, Age < 65
Related Adults no Children, Age > 65
0 0.5 1 1.5 2 2.5 3
Average Household Vehicle/Bike Availability
Vehicles Vehicles per License Holder Bikes
Average per Household

16
Lifecycle Segments within the OHAS Sample
Single Adult, Age > 65
Single Adult, Age 18-65
Non-Related Household
Single Parents with Children
Parents with Children
Related Adults no Children, Age < 65
Related Adults no Children, Age > 65
$- $20,000 $40,000 $60,000 $80,000 $100,000
Average Household Income

17
Slide about Factor Analysis

18
Cut-off at λ < 1.0
Principal Component Extraction• 7 Factors• 59.3% Variance Explained

20
Factor LabelPercent Variance
ExplainedInfluencing Activities
(Time Allocated per Household – BOLD: Factors > 0.6)
Work (out-of-home) 12.6%(-) Home(+) Working from Home(+) Work/Work-related
Routine Out-of-Home Activities 9.3%
(-) Work/Work-related (+) Routine Shopping, HH Errands(+) Personal Business(+) Eating (Out-of-Home)(+) Visit
School and School-Related Travel 7.9%(-) Work/Work-Related(+) Transfer/Drop-off/Pick-up (Travel)(+) Class/Class-Related (School)
Eating and Recreation 7.6%
(+) Recreation/Entertainment(+) Eating (Out-of-Home)(-) Healthcare(-) Visit
Work at Home with Errands 7.4%
(-) Working at Home(+) Work/Work-related(+) Transfer/Drop-off/Pick-up (Travel)(+) Eating (Out-of-Home)
Specialty Shopping and Civic/Religious 7.3%
(+) Civic/Religious(+) Transfer/Drop-off/Pick-up (Travel)(+) Special Shopping
Personal Activities and Civic/Religious 7.2%
(+) Personal Business(-) Working at Home(+) Civic/Religious
21
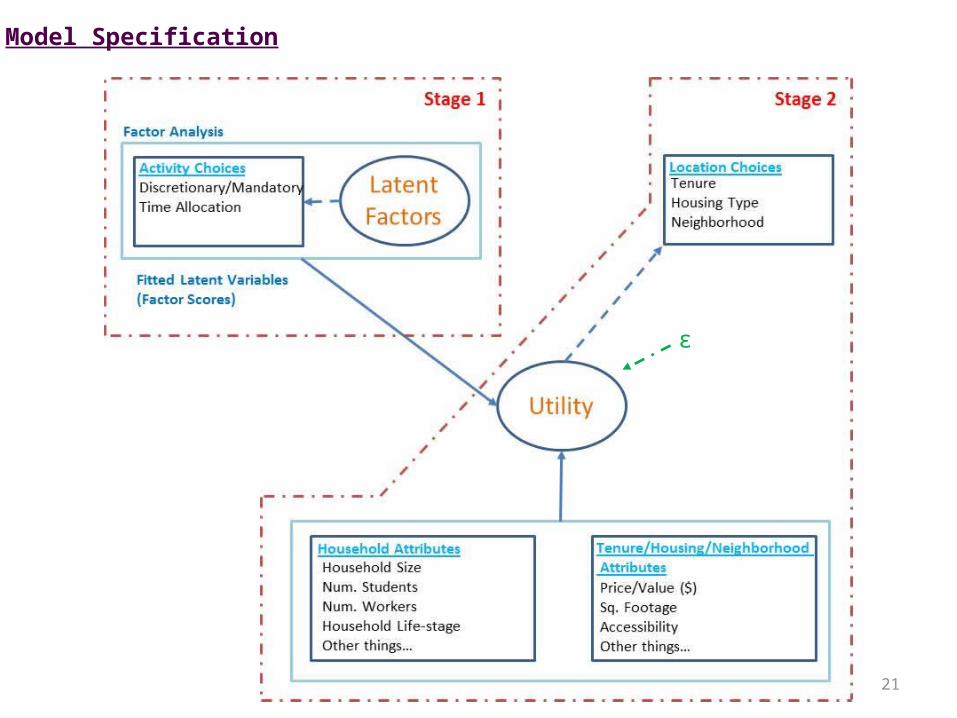
Model Specification
ɛ

25
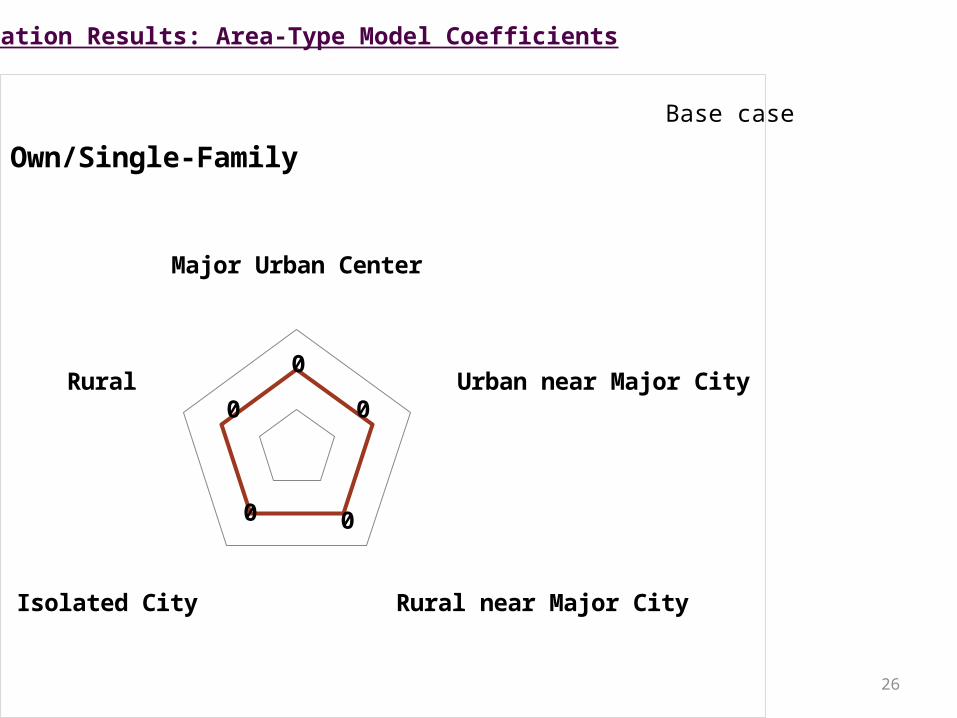
Estimation Results: Area-Type Model Coefficients
26
Estimation Results: Area-Type Model Coefficients
Major Urban Center
Urban near Major City
Rural near Major CityIsolated City
Rural
0
0
00
0
Own/Single-FamilyBase case

27
Estimation Results: Area-Type Model Coefficients
Major Urban Center
Urban near Major City
Rural near Major CityIsolated City
Rural
0
0.088
-0.1980.275
0.385
Rent/Single-Family
HH are more likely to rent single-family homes in rural, isolated and cities near MPOs
relative to households in MPOs.

28
Estimation Results: Area-Type Model Coefficients
Major Urban Center
Urban near Major City
Rural near Major CityIsolated City
Rural
0
-0.787
0.959-1.049
-2.274
Own/Multi-Family or Attached Single-Family
HH are less likely to own multi-family and attached
single-family in areas outsideof MPOs; this is least likely in rural
areas

29
Estimation Results: Area-Type Model Coefficients
Major Urban Center
Urban near Major City
Rural near Major CityIsolated City
Rural
0
-0.392
-1.74
-0.378
-2.401
Rent/Multi-Family or Attached Single-Family
HH are less likely to rent multi-family and attached
single-family in areas outside of MPOs.
In general in rural areas, HHs are more likely to own
a single family unit.

31
Lifecycle Segments within the OHAS Sample
Single Adult, Age > 65
Single Adult, Age 18-65
Non-Related Household
Single Parents with Children
Parents with Children
Related Adults no Children, Age < 65
Related Adults no Children, Age > 65
0% 20% 40% 60% 80% 100%
Household Structure Type
Single-Family Duplex/TownhomeBuilding with 3+ Apartments Mobile Home

Estimation Results: Lifecycle Model Coefficients
Single Adult, Age > 65
Single Adult, Age 18-65
Non-Related Household
Single Parents with ChildrenParents with Children
Related Adults no Children, Age < 65
Related Adults no Children, Age > 650
0
0
00
0
0
Own/Single-FamilyBase case

Estimation Results: Lifecycle Model Coefficients
Single Adult, Age > 65
Single Adult, Age 18-65
Non-Related Household
Single Parents with ChildrenParents with Children
Related Adults no Children, Age < 65
Related Adults no Children, Age > 650.276
1.478
1.8692.0551.834
1.085
0
Rent/Single-Family Relative to retired couples, all segments are more likely to
rent a SF home.

Estimation Results: Lifecycle Model Coefficients
Single Adult, Age > 65
Single Adult, Age 18-65
Non-Related Household
Single Parents with ChildrenParents with Children
Related Adults no Children, Age < 65
Related Adults no Children, Age > 650.381
0.374
0
0-0.859
-0.306
0
Own/Multi-Family orAttached Single-Family Single adults are the most likely
segment to own a Multi-Family/Attached Single-
Family home. The least likely are parents with children.

Estimation Results: Lifecycle Model Coefficients
Single Adult, Age > 65
Single Adult, Age 18-65
Non-Related Household
Single Parents with ChildrenParents with Children
Related Adults no Children, Age < 65
Related Adults no Children, Age > 65
1.1251.766
1.8161.939
1.2931.226
0
Rent/Multi-Family orAttached Single-Family
Single parents with Children are the most likely segment to rent a
Multi-Family/Attached Single-Family home. The least likely are
older adults (with or without kids).

37
Factor LabelPercent Variance
ExplainedInfluencing Activities
(Time Allocated per Household – BOLD: Factors > 0.6)
Work (out-of-home) 12.6%(-) Home(+) Working from Home(+) Work/Work-related
Routine Out-of-Home Activities 9.3%
(-) Work/Work-related (+) Routine Shopping, HH Errands(+) Personal Business(+) Eating (Out-of-Home)(+) Visit
School and School-Related Travel 7.9%(-) Work/Work-Related(+) Transfer/Drop-off/Pick-up (Travel)(+) Class/Class-Related (School)
Eating and Recreation 7.6%
(+) Recreation/Entertainment(+) Eating (Out-of-Home)(-) Healthcare(-) Visit
Work at Home with Errands 7.4%
(-) Working at Home(+) Work/Work-related(+) Transfer/Drop-off/Pick-up (Travel)(+) Eating (Out-of-Home)
Specialty Shopping and Civic/Religious 7.3%
(+) Civic/Religious(+) Transfer/Drop-off/Pick-up (Travel)(+) Special Shopping
Personal Activities and Civic/Religious 7.2%
(+) Personal Business(-) Working at Home(+) Civic/Religious

38
Estimation Results: Time-Allocation Factors
• Household variation in the Time-Allocation Factor Scores “Work” or “Personal Activity with Civic Responsibilities” activities was not a significant variable in explaining differences in either tenure or housing structure choice.
• When comparing variation across any Time-Allocation Factor Scores, there was also no significant difference between propensities to own a single-family or multi-family/attached single-family homes.

39
Estimation Results: Time-Allocation Factors
Own/Single-Family (base)
Own/Multi-Family or Attached Single-Family
Rent/Single-Family
Rent/Multi-Family or Attached Single-Family
0
0
-0.038
0
Routine Out-of-Home Activities Households with larger time-allocation scores for routine out-of-home
activities, then to be slightly less likely to rent a single-family home, then to own
their own home or rent a multi-family/attached single-family
home.

40
Estimation Results: Time-Allocation Factors
Own/Single-Family (base)
Own/Multi-Family or Attached Single-Family
Rent/Single-Family
Rent/Multi-Family or Attached Single-Family
0
0
0
0.109
School TravelHouseholds with larger scores related to
school activity time, also tend to be more likely to rent multi-family or
attached single-family housing types.

41
Estimation Results: Time-Allocation Factors
Own/Single-Family (base)
Own/Multi-Family or Attached Single-Family
Rent/Single-Family
Rent/Multi-Family or Attached Single-Family
0
0-0.145
-0.065
Eating and Recreation Households with larger eating out- and recreation-type activity scores, also tend
to be much less likely to rent.
They tend to be even more likely to rent single-family housing types.

42
Estimation Results: Time-Allocation Factors
Own/Single-Family (base)
Own/Multi-Family or Attached Single-Family
Rent/Single-Family
Rent/Multi-Family or Attached Single-Family
0
0
0
0.119
Work with ErrandsHouseholds with a greater
amount of work-related activity, tend to rent multi-family or attached single-
family housing types more.

43
Estimation Results: Time-Allocation Factors
Own/Single-Family (base)
Own/Multi-Family or Attached Single-Family
Rent/Single-Family
Rent/Multi-Family or Attached Single-Family
0
0
-0.174
0
0
0
0.214
0
0
0.224
0
Specialty Shopping and Civic/Religious
All Lifecycle Types
Single Adults, Age 18-65
Related Adults, No Children, Age < 65
In general, households who spend larger amounts of their time doing specialty
shopping or participating in civic/religious activities, tend to be less likely to rent a
single-family home.
Single adults (age: 18-65) or related adults without children (age: < 65) who spend
greater amounts of time doing these things, have a greater likelihood of renting a single-
family home.
44
Estimation Results: Time-Allocation Factors
• Thoughts about results for Time-allocation factors?
45
Conclusions
• In rural areas, you are less likely to see rentals and old people. In fact, in general retired.
• Retired households are less likely to rent, but more likely to located in urban areas.
• Households with children are less likely to rent MF or ASF homes.

46
Extensions for Future Work
1. Incorporate Stated-Preference (SP) responses2. Do away with the two-stage approach3. Integrate price index model4. Improve process capturing household time
allocation