resilient washington state final... · resilient washington state a framework for minimizing loss...
TRANSCRIPT

Resilient Washington State A Framework for Minimizing Loss and Improving Statewide Recovery
after an Earthquake November 2012
Also published as Information Circular 114 by the Division of Geology and Earth Resources, Washington State Department of Natural Resources

Front cover photos: U.S. Route 12 through Aberdeen (photo by Kéryn); Tacoma Narrows Bridge (photo by Kevin Madden); MV Puyallup ferry in Puget Sound (photo by Joe Mabel); Cadillac Hotel building in Seattle’s Pioneer Square—restored after the Nisqually earthquake in 2001 (photo by Joe Mabel); Port of Tacoma and Mount Rainier (photo: public domain); truck carrying grain along the Columbia River (photo courtesy of Washington State University); River Front Park in Spokane (photo by Mark Wagner); Grand Coulee Dam (Farwestern photo by Gregg M. Erickson); Seattle at dusk (photo by Cacophony)
Back cover photos: Damage caused by the Nisqually earthquake in 2001: Highway 101 (photo courtesy of the University of Washington, Nisqually Earthquake Information Clearinghouse); broken pathway at Capitol Lake in Olympia (Photo by Karl Wegmann, Washington State Department of Natural Resources); the remains of the parapet from the Washington Federal building in downtown Olympia (Photo courtesy of the University of Washington, Nisqually Earthquake Clearinghouse)

RESILIENT WASHINGTON STATE A Framework for Minimizing Loss and Improving
Statewide Recovery after an Earthquake
FINAL REPORT AND RECOMMENDATIONS NOVEMBER 2012
Washington State Emergency Management Council:
Seismic Safety Committee
WASHINGTON STATE SEISMIC SAFETY COMMITTEE 1111 Washington Street SE
P.O. Box 47007 Olympia, WA 98504-7007
Also published as Information Circular 114 by the Division of Geology and Earth Resources, Washington State Department of Natural Resources

Acknowledgments This report was prepared by the Resilient Washington State (RWS) Subcommittee of the Washington State Emergency Management Council’s Seismic Safety Committee.
SEISMIC SAFETY COMMITTEE MEMBERS (* DENOTES RWS SUBCOMMITTEE MEMBER) James M. Mullen, Washington State Emergency Management Division, Committee Co-Chair Dave Norman,* Washington State Department of Natural Resources, Committee Co-Chair Stacy Bartoletti,* Structural Engineers Association of Washington/Degenkolb Engineers, RWS Chair Tamra Biasco,* Federal Emergency Management Agency Steve Boyer, Hill and Knowlton, Private Industry Representative Tom Hill, Washington Association of Building Officials Sheryl Jardine, Washington State Emergency Management Scott Miles,* Huxley College, Western Washington University Pat Morin, Washington State Department of Transportation Bill Perkins, American Society of Civil Engineers John Schelling,* Washington State Emergency Management Division Barbara Thurman, Office of the Superintendant of Public Instruction John Vidale, State Seismologist, University of Washington Tim Walsh,* Washington State Department of Natural Resources Craig Weaver, United States Geological Survey
Writing and editing support was provided by Kyra L. Nourse.
Support for this publication was provided by FEMA, Department of Homeland Security, under the National Earthquake Hazard Reduction Program (NEHRP) State Cooperative Agreements. Points of view or opinions expressed in this document are those of the authors and do not necessarily represent the official position or policies of FEMA or the U.S. Department of Homeland Security.
Additional funding for the Resilient Washington State Initiative was provided by National Science Foundation grant #0927356, “Repeat Disaster Impacts to Infrastructure Networks and Their Effects on Economic Agent Recovery,” for which the principal investigator was Scott Miles, Associate Professor and Director of the Resilience Institute at Western Washington University.
The Resilient Washington State Subcommittee would like to thank all those who dedicated time, expertise, and resources to this project. In particular, we would like to acknowledge the contributions of the Cascadia Region Earthquake Workgroup (CREW), Degenkolb Engineers, FEMA, the Washington Emergency Management Division, the Washington State Department of Natural Resources, Western Washington University’s Resilience Institute, and Western Washington University’s Disaster Risk Reduction students. We would also like to thank and acknowledge the San Francisco Planning and Urban Research Association (SPUR) for their initial work, which laid the foundation for this effort.

Contents i
Contents
Contents ................................................................................................................................................. i
Tables & Figures ............................................................................................................................... ii
Supplemental Materials .................................................................................................................... ii
Executive Summary .............................................................................................................................. 1
Identifying Washington’s Vulnerabilities ..................................................................................... 2
Preparing a Plan of Action ............................................................................................................ 2
Introduction ........................................................................................................................................... 7
The Resilient Washington State Initiative ........................................................................................ 7
Process and Methodology ................................................................................................................. 7
What is a Resilient State? ............................................................................................................. 8
Assessing Washington’s Resilience .............................................................................................. 8
Developing Statewide Recommendations from the Results ....................................................... 10
Defining the Earthquake Hazard ......................................................................................................... 11
Overview of Earthquake Scenarios ................................................................................................. 13
Cascadia Subduction Zone Scenario ........................................................................................... 14
Anticipating the Effects of an Earthquake ...................................................................................... 14
Evaluating Washington’s Infrastructure ............................................................................................. 17
Critical Services Sector ................................................................................................................... 17
Utilities Sector ................................................................................................................................ 18
Transportation Sector ...................................................................................................................... 21
Housing and Economic Development Sector ................................................................................. 24
Appendices .......................................................................................................................................... 27
Glossary .......................................................................................................................................... 27
List of Participants .......................................................................................................................... 29
Additional Resources ...................................................................................................................... 32

ii Resilient Washington State
TABLES & FIGURES Figure 1: The Four Sector Groups and Their Components: 9 Figure 2: PGA (peak ground acceleration) Map of Washington and Oregon: 12 Target States of Recovery Tables Critical Services Sector: 17 Utilities Sector: 19 Transportation Sector: 21 Housing & Economic Development Sector: 24
SUPPLEMENTAL MATERIALS The following materials can be accessed at the Washington Military Department Emergency Management Division website: http://www.emd.wa.gov/about/SeismicSafetyCommittee.shtml Resilient Washington State: Workshop Report I
Resilient Washington State: Workshop Report II
Earthquake scenario fact sheets for the seven fault zones featured in this report (Seattle, southern Whidbey Island, Tacoma, Saddle Mountain, Cle Elum, Walla Walla/Hite, and Cascadia subduction zone)
Grouping and Ranking of RWS Recommendations Using Collaborative Scenario Planning, a report by the Disaster Risk Reduction students at Western Washington University

Executive Summary 1
A resilient state is one that maintains services and livelihoods after an earthquake. In the event that services and livelihoods are disrupted, recovery occurs rapidly, with minimal social disruption, and results in a new and better condition.
Executive Summary The state of Washington is a region of beautiful landscapes and bountiful natural resources, but the geologic forces that shaped many of these features also give the state one of the highest earthquake hazards in the nation. The potential impacts of this hazard were demonstrated in 2001 by the Nisqually earthquake, which caused hundreds of injuries and inflicted damage serious enough to prompt federal disaster declarations in 24 counties, including six in eastern Washington—but this was not the most damaging earthquake we can expect.
While we cannot prevent earthquakes or know precisely when the next one will strike, we can do a great deal to make sure our communities—including the services and infrastructure on which they depend—are prepared to withstand and recover quickly from their damaging effects. It was with this goal in mind that the Washington State Emergency Management Council’s Seismic Safety Committee began the Resilient Washington State Initiative.
The initiative lays the groundwork for improving our state’s resilience:
This objective—further refined by consideration of values such as life safety and human health, property protection, economic security, environmental quality, and community continuity—guided the development of the initiative’s three main products:
A general assessment of the current recovery capacity of the state’s major systems and infrastructure, including estimates of the time it is likely to take for each component to recover following a serious earthquake.
A target timeframe for each component—that is, the timeframe within which a given component ought to recover to ensure that the state is resilient.
The top 10 recommendations for improving statewide resilience.
This comprehensive assessment revealed many of our state’s critical vulnerabilities and suggested where our efforts should be focused and sustained over the long term to provide the greatest improvement in life safety and post-earthquake recovery. Implementation of the recommendations will encourage the pre-earthquake planning, mitigation, and enhanced seismic performance of future construction that Washington’s citizens, businesses, and communities need to lower their seismic risk and reduce the time it takes to recover from a significant earthquake. With these investments, we will buy down tomorrow’s recovery time and enhance public safety for generations to come.
The Resilient Washington State Initiative provides a framework for long-term
implementation of seismic risk reduction policies and
activities across the state with the goal of making the
state resilient within a 50-year timeframe.

2 Resilient Washington State
Identifying Washington’s Vulnerabilities To determine the current level of Washington’s resilience and identify recovery targets, the sub-committee that headed the initiative solicited participation and gathered input from a wide range of subject-matter experts and stakeholders representing local, state, and federal agencies, university departments, and private businesses. The contributors were organized into four main sector groups: CRITICAL SERVICES UTILITIES
TRANSPORTATION HOUSING AND ECONOMIC DEVELOPMENT
Through 24 months of collaborative meetings, two all-day workshops, and consensus discussions, each group formulated a table that provides a snapshot of how resilient the sector is today, where its chief vulnerabilities lie, and what factors must be addressed to ensure that when a destructive earth-quake occurs, the state’s recovery is robust and timely. These tables appear on pages 17–24 of this report; details of the assessment and sector-specific recommendations appear in Workshop Report II.
Preparing a Plan of Action The work of the sector groups led to the following recommendations. Priority actions support each recommendation by identifying the steps to be taken in the short, mid-, and long term to improve Washington’s resilience over the next 50 years and ensure that communities and businesses are able to respond effectively to a major earthquake, recover quickly, and adapt successfully to the “new normal” that inevitably follows. The list of recommended organizations to lead and participate in each action is not intended to be all inclusive; the private sector must also be actively engaged. Note: All recommendations are valued equally: the order in which they are listed does not reflect relative importance.
RECOMMENDATION 1. Make schools resilient: structurally, socially, and educationally. PRIORITY ACTIONS: RECOMMENDED
ORGANIZATIONS:
OSPI (lead); DNR
1a. As part of a single statewide project, perform consistent, cost-effective, comprehensive assessments of school buildings to prioritize the seismic risk of the state’s schools. Apply the new SSC-developed assessment process, which addresses seismic hazard, liquefaction, and structural and non-structural deficiencies.
Short term: Complete assessments by year 8. Based on the priorities revealed, devise a plan to repair or replace school buildings, beginning with those with the highest level of risk.
Mid- to long term: Repair or replace schools as outlined in the plan.
1b. Enact legislation that requires school districts to conduct at least one earthquake safety drill per school year. Schools in mapped tsunami hazard zones should conduct a pedestrian evacuation drill annually. Such a law should explicitly require drop, cover, and hold as the state’s approved earthquake safety technique.
Short term: Draft and enact legislation. Long term: Use the existing Great Washington ShakeOut Earthquake Drill registration to track metrics related
to progress and participation.
State Legislature (lead); OSPI; EMD
1c. Enact legislation that requires all school districts to develop mitigation plans, whether on their own or by participating in a city or county mitigation planning process.
Short term: Districts develop hazard mitigation plans to make them eligible for federal funding (when available) through the Hazard Mitigation Grant Program (HMGP).
Long term: Districts maintain hazard mitigation plans by regularly revising and updating them.
State Legislature (lead): School Districts; Cities; Counties; EMD
1d. Enact legislation that requires all school districts to develop and maintain comprehensive continuity of operations plans, including provisions for mutual aid (e.g. facility-sharing) between districts.
Short term: School districts develop continuity of operations plans. Long term: Schools and districts maintain plans through regular training, updates, and exercises.
OSPI (lead); State Legislature; School Districts

Executive Summary 3
RECOMMENDATION 2. Require that utility providers (domestic water supply, wastewater, electricity, natural gas, petroleum, and information and communication technology) identify the vulnerabilities in their systems and mitigate the deficiencies. PRIORITY ACTIONS: RECOMMENDED
ORGANIZATIONS: EMD 2a. Maintain a state lifelines working group under the Washington State Emergency Management Council to
facilitate improved coordination, planning, and response among public and private sector lifeline operators. 2b. Develop and adopt model statewide codes for design performance standards for each utility type. Examine incentives for replacement programs that eliminate non-ductile (rigid) pipelines and replace them with ductile (flexible) alternatives that are less susceptible to breakage in seismic events.
UTC with ASCE (lead); State Building Codes Council
2c. Request that the Northwest Power and Conservation Council examine the feasibility of establishing an interoperable power network (including interoperable parts) within Washington and throughout the Pacific Northwest and/or western United States.
Office of the Governor, State Legislature, NWPC
2d. Codify a framework for identifying and communicating which essential facilities will have priority for restoration of utility service following an earthquake. Such a framework will provide greater certainty during the response and recovery phases for critical facilities, etc.
Proposed life-lines working group (lead); State Legislature
2e. Expand existing requirements regarding facilities that must have backup generators to include any facility that is critical to response and recovery operations. Connection to two different electrical substations alone should not satisfy these new requirements.
State Legislature
2f. Conduct an analysis of the potential economic losses associated with power outages that may result from a variety of earthquake scenarios. (This is to help implement Recommendations 2d and 2e.)
Dept. of Commerce
RECOMMENDATION 3. Improve the resilience of buildings in areas of high seismic hazard to improve life safety and increase the number of people who will be able to shelter in place. PRIORITY ACTIONS: RECOMMENDED
ORGANIZATIONS: Dept. of Commerce
3a. Compile a detailed inventory of the actual building stock (types of buildings and structural systems, dates of construction, and seismic retrofits) in all jurisdictions across the state. 3b. Mandate that seismic evaluations be completed as part of real estate transactions in order to ensure full disclosure of a property’s condition between buyers and sellers.
Short term: Establish a working group with key stakeholders, including real estate, insurance, and financial professionals, to examine potential funding mechanisms and define an approach and requirements. Initiate a demonstration project within a county or region.
Long term: Evaluate the efficacy of the demonstration project and, if such an approach is determined to be feasible, expand on a statewide basis.
Office of the Governor, State Legislature
3c. Provide model code language for adoption by local jurisdictions in order to ensure that unsafe buildings do not kill or injure occupants. This should include mandatory parapet retrofit (or removal); examining the City of Seattle’s Unreinforced Masonry (URM) building retrofit ordinance; and working with stakeholders to identify federal, state, and local incentives to promote adoption and action (e.g. retrofitting).
Dept. of Commerce–GMS; State Building Codes Council
3d. Institute a rapid, consistent, and comprehensive fast-tagging building assessment program that may be used in all local jurisdictions.
Short term: Form a task group to further define the concept of “shelter in place” (i.e., allowing residents to stay in their own homes while they are being repaired) after a major earthquake and determine how best to facilitate implementation at a community level. The task group should also: Adopt a program similar to San Francisco’s Building Occupancy Resumption Program (BORP). Recommend adjustments to the permitting process to make it possible for people to stay in their homes
with access to temporary sewage and water services.
DSHS; DES; EMD; SEAW; WABO
3f. Create a task force to identify possible strategies for development of a state-managed earthquake insurance program similar to the California Earthquake Authority or more effectively promote privately-offered earthquake insurance to increase coverage throughout the state and reduce direct losses to individuals and families.
Office of the Insurance Commissioner

4 Resilient Washington State
RECOMMENDATION 4. Assess the permitting requirements that relate to environmental protection and mitigation to determine how best to make environmental planning mesh with seismic mitigation and recovery planning. PRIORITY ACTIONS: RECOMMENDED
ORGANIZATIONS: Ecology; EMD (EMC); Governor’s Office of Regulatory Assistance; DNR; WDFW
4a. Complete a comprehensive review of the state’s permitting rules and regulations and create an inventory of those that may pose challenges during the recovery phase. Create a process for developing potential alternative solutions that would better fit a recovery situation, making sure that the need to expedite permits is balanced with the need to ensure the quality and safety of repairs and the protection of the environment. Communicate the results (the status of rules and regulations after an earthquake) to local jurisdictions and relevant industries. 4b. Require communities planning under the Washington State Growth Management Act to consider the “post-earthquake disaster landscape” as part of the comprehensive planning process. Amending the Growth Management Act to include this concept would provide communities with an opportunity to more closely dovetail hazard mitigation planning and land use planning with the aim of reducing risk and promoting a rapid recovery.
RECOMMENDATION 5. Strengthen business continuity planning efforts. PRIORITY ACTIONS: RECOMMENDED
ORGANIZATIONS: EMD; Dept. of Commerce
5a. Provide education, tools, and training to help businesses develop continuity plans or analyze existing plans, giving particular consideration to their supply chains and issues related to just-in-time inventories.
RECOMMENDATION 6. Strengthen regional transportation networks. PRIORITY ACTIONS: RECOMMENDED
ORGANIZATIONS: WSDOT 6a. Further define critical state routes into and out of ports, airports, and other key areas (e.g. the Kent/Duwamish
Valley) and identify priority routes for retrofitting/hardening as a systematic approach that includes 6b. Decisions about these routes should be made in consultation with all necessary administrative levels/jurisdictions. 6b. Facilitate collaboration between state and local jurisdictions to identify regional lifeline routes and prioritize retrofitting of city and county roads and bridges. Incorporate this into the Transportation Improvement Program.
WSDOT; Regional & Metropolitan Transportation Planning Organizations
6c. Develop interagency agreements between WSDOT and local jurisdictions to facilitate the rerouting of traffic following an earthquake. 6d. Require that transit agencies (both large and small) develop robust continuity of operations plans. State Legislature
RECOMMENDATION 7. Make hospitals resilient—structurally and functionally. PRIORITY ACTIONS: RECOMMENDED
ORGANIZATIONS: Dept. of Health; State Legislature
7a. Retrofit hospitals and assess and address the vulnerabilities of their supply chains to ensure that they are able not only to withstand the expected earthquake, but to remain operational afterwards.
Short term: Establish a task force to review California’s Office of Statewide Heath Planning and Development requirements regarding mandatory retrofitting of existing hospital facilities. This task force should identify and adapt for use in Washington a set of regulations that define the necessary level of building performance for hospitals and require hospitals to retrofit within a specified timeframe in order to achieve that level of performance.
7b. Require that the non-structural elements of hospital buildings be addressed in design requirements: Further define this in the current building code; develop and implement a means of enforcement; and provide opportunities for training.
Building Codes Council
7c. Strengthen seismic requirements and oversight for design and construction/upgrades of hospital facilities and regional medical centers that serve similar functions. 7d. Require analysis of supply chains of pharmaceuticals and other essential commodities to identify weak links in the health care system and enable health-care providers to develop viable alternatives.
Dept. of Health

Executive Summary 5
RECOMMENDATION 8. Identify and map in greater detail sources of seismicity and geologically hazardous areas and develop plans for mitigation of identified hazards. PRIORITY ACTIONS: RECOMMENDED
ORGANIZATIONS:
DNR; PNSN 8a. Continue to enhance knowledge of seismic sources impacting the State of Washington through mapping, research, field investigation, and seismic monitoring.
8b. Prioritize areas for detailed liquefaction and other seismic hazard mapping and accelerate the mapping. Short term: Develop a more comprehensive and detailed statewide assessment of liquefaction-prone areas:
Prioritize areas where liquefaction is likely to have the highest impact; begin assessment around critical facilities; and do detailed studies of areas that are already of interest based on current mapping.
Mid-term: Reference the updated liquefaction hazard maps in building codes and establish a consistent means of communicating maps and related information to local jurisdictions for use as best-available-science under the Growth Management Act.
DNR
8c. Work with the planning and public works departments within local jurisdictions and tribes to develop a model ordinance of mitigation measures and an explanation of how it can be used.
DNR; Dept. of Commerce–GMS
RECOMMENDATION 9. Improve life safety in coastal communities at risk of local tsunamis. PRIORITY ACTIONS: RECOMMENDED
ORGANIZATIONS:
EMD 9a. Implement tsunami vertical evacuation plans developed by local and tribal jurisdictions through “Project Safe Haven” to minimize loss of life during local tsunamis.
Short term: Support one or more local jurisdiction demonstration projects in order to determine the most cost-effective approach and identify funding options that may be instituted on a regional or local basis.
RECOMMENDATION 10. Implement resilience principles through formalized accountability. PRIORITY ACTIONS: RECOMMENDED
ORGANIZATIONS:
Office of the Governor, State Legislature, Commissioner of Public Lands, Superintendent of Public Instruction, OFM
10a. Adopt the recommendations of the Resilient Washington State Initiative into Washington State Priorities of Government (POG) and the Governor’s Management and Accountability Program (GMAP)
10b. Identify annualized cost of implementation and continually examine opportunities for funding mechanisms related to the Resilient Washington State Initiative.
ABBREVIATIONS ASCE: American Society of Civil Engineers OFM: Office of Financial Management DES: Washington State Department of Enterprise Services OSPI: Office of Superintendent of Public Instruction DNR: Washington State Department of Natural Resources PNSN: Pacific Northwest Seismic Network DSHS: Washington State Department of Social and Health Services SEAW: Structural Engineers Association of Washington Ecology: Washington State Department of Ecology SSC: Washington State Seismic Safety Committee EMC: Emergency Management Council UTC: Washington Utilities and Transportation Commission EMD: Washington Military Department, Emergency Management Division WABO: Washington Association of Building Officials GMS: Growth Management Services WDFW: Washington Department of Fish and Wildlife NWPC: Northwest Power and Conservation Council WSDOT: Washington State Department of Transportation

6 Resilient Washington State
Because past earthquakes offer clues to the earthquakes we can expect in the future, geologists are using a wide range of tools, from LiDAR surveys to trenching (right), to trace the state’s earthquake history even further back. In addition to discovering previously unrecognized faults throughout the state, they have uncovered evidence of major earthquakes, including a massive earthquake in 1700 along the Cascadia subduction zone. This earthquake triggered a tsunami large enough to cross the Pacific and be recorded in Japan. The 1700 quake also caused the land to subside along much of the Washington coast. Encroaching seawater subsequently killed the trees near the mouth of the Copalis River, creating the “ghost forest” shown in the photo above.
Phot
o: U
SGS,
Bria
n At
wat
er
Photo: DNR, Josh Logan
Earthquakes in Washington’s Past Tell Us What to Expect in the Future
Washington has experienced about 20 destructive earthquakes over the last 125 years, including the Nisqually earthquake in 2001. The majority occurred on the west side of the state, but the east side is not immune. In fact, the largest earthquake in historic times struck east of the Cascade crest in 1872.

Introduction 7
Introduction News coverage of recent devastating earthquakes in New Zealand and Japan has captured public attention worldwide and ensured that we are all aware of the destruction and loss of life that earth-quakes and tsunamis can cause. For the people of Washington, such events also serve as reminders of the dangers lurking beneath our own feet. Research over the past few decades has shown that our state’s earthquake hazard is greater than previously suspected. While this is especially true of the western half of the state, many areas east of the Cascade Mountains are also at risk. In a recent study of annualized earthquake losses, FEMA ranked the state of Washington second only to California for highest earthquake risk (FEMA 366/April 2008).
Moreover, because all regions of Washington are inter-connected—economically, socially, and even physically through shared systems and resources—a destructive earthquake in one part of the state can have serious and long-lasting consequences for the others.
Washington’s earthquake hazard is defined by the region’s geology. We can seek to understand it better, but we cannot alter it. Fortunately, it is possible to reduce the risk that earthquakes pose to the people who live here. To do this, we must identify the vulnerabilities of our state’s systems and infrastructure and implement policies that ensure that we are as prepared and as resilient as possible.
THE RESILIENT WASHINGTON STATE INITIATIVE This report is the culmination of the Resilient Washington State Initiative, which was launched by the Washington State Seismic Safety Committee (SSC) in the spring of 2010. The initiative was spearheaded by the SSC’s Resilient Washington State Subcommittee. Its purpose was to create a framework for improving Washington’s resilience when earthquakes occur by proactively reducing critical vulnerabilities before the next damaging event. The framework includes recommendations for legislation and other measures that will encourage pre-earthquake planning, mitigation, and enhanced seismic performance of future construction to lower seismic risk and significantly reduce the amount of time it takes to recover from a moderate to large earthquake. The framework is intended to facilitate long-term implementation of seismic risk reduction policies and activities across the state with the goal of making the state resilient within a 50-year timeframe.
PROCESS AND METHODOLOGY For initial inspiration, the Resilient Washington State (RWS) Subcommittee looked to a similar effort undertaken for the City of San Francisco by the San Francisco Planning and Urban Research Association (SPUR). Unlike the SPUR project, which focused on a single city, the RWS effort addressed statewide impacts. It is the first initiative of its kind in the United States.
The state of Washington is ranked second in the
nation for highest earthquake risk; our
state’s annualized loss from earthquakes is estimated to be more
than $366 million. –FEMA 366/
April 2008

8 Resilient Washington State
A resilient state is one that maintains services and livelihoods after an earthquake. In the event that services and livelihoods are disrupted, recovery occurs rapidly, with minimal social disruption, and results in a new and better condition.
What is a Resilient State? The Resilient Washington State Subcommittee began by surveying the existing literature to find a definition of resilience that could be used to give direction to the project. Because none of the existing definitions seemed to suit the initiative’s scope, the subcommittee formulated a definition that can be applied to the state as a whole:
The subcommittee also articulated a set of equally weighted values to help guide the process of identifying the state’s recovery targets. These values (in no particular order) are:
Life Safety and Human Health: Residents of the state of Washington should not suffer life-threatening injuries from earthquake-induced damage or develop serious illness from lack of emergency medical care after an earthquake. This includes enforcing and updating building codes, eliminating non-structural hazards, and ensuring continuity of emergency health care.
Property Protection: Public and private property within the state of Washington should be built, retrofitted, or rebuilt to minimize earthquake-induced damage. This includes proper design and construction of both structural and non-structural elements.
Economic Security: Residents and businesses within the state of Washington should have access to income opportunities to meet basic needs before and soon after an earthquake. This includes sufficient employment opportunities, market access, distribution capacity, and supplier access.
Environmental Quality: The natural resources and ecosystems of Washington State should be managed in such a way as to minimize earthquake-induced damage. This includes the use of proper growth management, accident response capacity, and industrial safety measures.
Community Continuity: All communities within the state of Washington should have the capacity to maintain their social networks and livelihoods after an earthquake disaster. This includes prevention of social-network disruption, social discrimination, and community bias.
Assessing Washington’s Resilience For organizational purposes, the state’s systems and infrastructure were divided into four sectors: Critical Services, Transportation, Utilities, and Housing and Economic Development. These sectors were further subdivided into their primary components (see Figure 1). This organization provided the basic structure for all discussions about and assessments of Washington’s capacity to recover from an earthquake.

Introduction 9
To ensure a full and balanced evaluation of Washington’s infrastructure, the RWS Subcommittee solicited input from a wide range of experts and stakeholders from across the state and from all four sectors. The participants in this project included representatives from local, state, and federal agencies, university departments, and private industry (see the list of participants in the appendices). The subcommittee began gathering this input at a one-day Resilient Washington State Workshop on September 17, 2010 at the University of Washington. Invitations were sent to stakeholders and experts throughout the state. Forty-five people attended and participated in discussions that further refined the values and shaped the way the sectors and components were defined.
Following this workshop, groups of stakeholders and experts were asked to examine the capacity and resilience of the sectors in more detail. Four groups were formed, one for each of the sectors. These sector groups, which included many of the people who had attended the first workshop, met in the spring and summer of 2011 to review and assess the primary components of each sector. Each group was co-chaired by at least one member of the subcommittee and a volunteer from among the participants.
The members of the sector groups used their collective expertise to:
Evaluate the current condition of the state’s systems and infrastructure to predict how they will perform in an earthquake and how quickly they can be restored if disrupted or damaged.
Develop targets for the desired levels of performance.
Develop target timeframes for the restoration of services and functions following an earthquake.
Define the vulnerabilities and key interdependencies of each sector. (For example, when considered alone, water might be restored within a day, but its vulnerability is that it depends on electricity, which could take longer than a day.)
Prepare recommendations for statewide action to achieve desired targets.
Critical Services
• Law enforcement • Emergency response • Health & medical care • Education • Mass care • Social Services • Food network • Government administration
Utilities
• Domestic water supply • Wastewater systems • Flood control • Electricity • Natural Gas • Petroleum • Information & communication technology
Transportation
• Interstate 5 • Interstate 90 • Interstate 405 • Ferry operations • Floating bridges • Major & minor arterials • Airports • Ports & navigable waterways
• Rail • Mass transit
Housing & Economic Development
• Finance & banking • Commerce (commercial facilities)
• Real estate & construction
• Manufacturing (industrial facilities)
• Planning & community development
• Unreinforced masonry structures
• Housing
Figure 1. The four sector groups and their components. Each sector group was chaired by one member of the Resilient Washington State Subcommittee and one volunteer from within the sector.
For the state of Washington
alone, the total economic impact
from a magnitude 9.0 Cascadia
subduction zone earthquake is
estimated to be about $49 billion.
–FEMA, 2011

10 Resilient Washington State
At the concluding Resilient Washington State Workshop on December 2, 2011, the co-chairs of the sector groups presented the results of each groups’ efforts. The experts and stakeholders who participated in the final workshop then took part in breakout sessions. These sessions allowed them to review and in some cases revise the assessments, giving particular attention to the ways in which the interdependencies of the sectors and components might impact and alter the timeframes required for recovery.
The second workshop report contains each group’s estimated recovery timeframes and recommended targets, along with a summary of the variables that the groups considered most likely to affect the length of time it takes for each component to recover. The workshop report also provides sector-specific recommendations for shortening recovery timeframes and improving resilience.
Developing Statewide Recommendations from the Results The final step was to assemble the recommendations that the work groups had prepared for each sector and derive from them a set of recommendations that, if implemented, would lower risk, speed recovery, and have the greatest impact on the resilience of the state as a whole. To help with the initial evaluation, the RWS Subcommittee invited Disaster Risk Reduction students at Western Washington University to arrange and rank all of the recommendations submitted by the sector groups. To do this, the students applied a collaborative scenario planning process (for their report, see the Supplemental Materials list on page ii). Their grouping and ranking of the sector groups’ recommendations provided a useful framework for discussing and synthesizing the results of the initiative. From this, the RWS Subcommittee and Seismic Safety Committee articulated state-level recommendations and priority actions.
The results of the Resilient Washington State process are summarized in the tables, notes, and recommendations provided in this report and its appendices. They are intended to serve as tools for shaping the direction of earthquake planning, mitigation, and response, as well as the further development of policies that will improve statewide resilience.
The diagram at right illustrates the basic dynamics of the Cascadia subduction zone and the three main sources of earthquakes in the state of Washington. The dates and epicenters of four recent damaging earthquakes are also indicated.

Defining the Earthquake Hazard 11
Defining the Earthquake Hazard Before we can develop and implement policies that will improve Washington’s resilience, we must first define the hazard. In essence, this means we must characterize the earthquake that we expect and anticipate the results of the shaking.
In a state the size of Washington, no single earthquake scenario can be used to define the hazard and level of risk for every region and every community in the state. In order to define resilience at a statewide level and develop mitigation policies to achieve it, the Resilient Washington State (RWS) Subcommittee chose to adopt a two-pronged approach to the expected earthquake ground motions.
First, the subcommittee considered a number of scenario earthquakes that were developed in 2009 by the Washington State Emergency Management Division, Washington State Department of Natural Resources, United States Geological Survey, and Federal Emergency Management Agency, for use in this and other planning efforts. Those who contributed their expertise to the Resilient Washington State Initiative were asked to refer to seven of these scenarios. This was to help them comprehend the geographic area of impact of a single earthquake with regional or statewide consequences. Although each of these earthquake scenarios represents a single seismic event—and some events may occur more frequently than others—the scenarios are consistent with the National Seismic Hazard Maps created by the U.S. Geological Survey (USGS).
Second, participating experts and stakeholders were asked to consider the 2008 USGS Seismic Hazard Map of Washington (see Figure 2). This map illustrates the average level of shaking expected from all known sources of earthquakes affecting the region. The results are portrayed in probabilistic terms: The various colors indicate the level of shaking that seismologists anticipate (with 10 percent probability) will occur in that area within the next 50 years.
Collectively, the earthquake scenarios and the PGA hazard map illustrate the type and level of earthquake hazard for which the state must be prepared if it is to be resilient.
Washington’s Earthquakes by Type Deep earthquakes, such as the M6.8 Nisqually earthquake in 2001, occur along fractures in the Juan de Fuca plate where it has descended beneath the North American plate. The epicenters of such earthquakes are usually 30 to 50 miles underground and cause shaking across a large area. Deep earthquakes produce few or no aftershocks large enough to be felt. Shallow earthquakes occur in the crust of the North American plate where numerous faults have developed as a result of the collision between this plate and the Juan de Fuca plate. Built-up stress causes the faults to rupture, generating earthquakes. Because the epicenters are usually less than 20 miles below ground, the shaking is more intense and destructive than in a deep earthquake, but the area affected is less extensive. Shallow earthquakes are usually followed by aftershocks. Subduction zone earthquakes occur where the Juan de Fuca plate meets and is forced under the North American plate. Periodically, built-up pressure causes the plates to slip rapidly past each other, producing a mega thrust earthquake. The shaking from such an earthquake will be felt over the entire region and may go on for several minutes. The massive movement of the seafloor also pushes seawater along the zone upward, which creates a tsunami at the surface. Tsunami waves will begin to strike Washington’s coastline within 20–30 minutes. The initial earthquake will also be followed by numerous aftershocks.

12 Resilient Washington State
Shaking vs. Magnitude
News reports often describe earthquakes in terms of magnitude, a number that indicates the earthquake’s size (the amount of energy that was released when the fault ruptured).
To understand earthquake risk, the more important factor is the strength of the shaking we are likely to experience. This varies based on location and is usually expressed as a probability: Seismologists consider all of the potential sources of earthquakes in a given area and generate maps to show the levels of shaking that are likely to occur within a particular timeframe.
On the USGS Seismic Hazard Map of Washington, this is shown as peak ground accelerations (PGA) with a 10 percent probability of exceedance (10/50): in other words, the level of shaking (expressed as a percentage of acceleration of gravity, or % of g) that we can expect with 10% probability over the next 50 years. Ground motions between 9 and 18% of g can be expected to cause light damage, while damage from motions ranging from 34 to 65% of g is likely to be severe.
Figure 2. PGA (peak ground acceleration) map of Washington and Oregon showing the levels of shaking that seismologists expect (with 10% probability) within the next 50 years.

Defining the Earthquake Hazard 13
OVERVIEW OF EARTHQUAKE SCENARIOS The earthquakes described in the following scenarios are expected to have serious repercussions for the state as a whole, not just the areas physically damaged by the ground shaking. (Fact sheets for each scenario can be accessed at http://www.emd.wa.gov/about/SeismicSafetyCommittee.shtml.) The first six are shallow or “crustal” earthquakes; the seventh is an interplate earthquake on the Cascadia subduction zone.
LOCATION & MAGNITUDE OF SIX SHALLOW SCENARIO EARTHQUAKES:
SOME POTENTIAL EFFECTS:
Seattle fault zone Magnitude 7.2
Although western Washington would experience the greatest shaking intensities, eastern Washington and Alaska will be affected by the economic disruption that results from damage to port facilities in and around Seattle.
Southern Whidbey Island fault zone
Magnitude 7.4 Such an earthquake would not only affect northern Puget Sound, including the cities of Seattle, Everett, and Port Townsend, but also Vancouver Island, British Columbia.
Tacoma fault Magnitude 7.1 This earthquake would cause severe damage to the communities of southern Puget Sound. It might also create a tsunami in Puget Sound itself. Within about five minutes of the earthquake, this tsunami would cause flooding in the Puyallup River delta.
Saddle Mountain fault
Magnitude 7.4 This event would impact at least ten counties in Washington, with the most significant effects in Grant County, followed by Yakima, Kittitas, Benton, and Franklin. The U.S. Department of Energy’s Hanford Site is within the area likely to experience strong shaking.
Cle Elum fault Magnitude 6.8 Although the communities within Kittitas and Yakima counties would experience the strongest shaking and sustain the greatest damage, surrounding counties, such as King and Pierce, would also be affected.
Hite fault Magnitude 6.8 Like the earthquakes in the Saddle Mountain and Cle Elum scenarios, this earthquake could disrupt the transmission of electricity as well as traffic along the Columbia River.

14 Resilient Washington State
Cascadia Subduction Zone Scenario The Cascadia subduction zone off Washington’s coastline is 684 miles (1,100 kilometers) long, extending from Brooks Peninsula on Vancouver Island to Cape Mendocino in California. It is capable of producing earthquakes on the order of magnitude 9.0. Such an earthquake would be comparable to Japan’s great Tohoku earthquake and tsunami in March of 2011.
Because large segments of the fault may slip during a subduction zone earthquake, the shaking is expected to impact all of western Washington and cause the most widespread damage of any scenario. The entire subduction zone could rupture from end to end in a single event. Although the maximum intensity of ground shaking would be less than for a large shallow earthquake, a subduction zone earthquake would cause strong shaking over a much larger area—from northern California to northern Vancouver Island. The shaking is also expected to continue for 2–3 minutes, causing extensive liquefaction in river valleys and along waterfronts. Like the earthquake that struck off the coast of Japan, a Cascadia subduction zone earthquake would also trigger a tsunami, which will cause further devastation as it impacts the coastline and travels inland for several miles.
ANTICIPATING THE EFFECTS OF AN EARTHQUAKE The nature and degree of damage caused by an earthquake will depend on the earthquake scenario and local conditions. In general, we can expect damage and disruption as a result of:
Strong ground shaking: This may seriously damage buildings and their contents, bridges, roads, utilities, and other critical systems and facilities.
Liquefaction: This occurs when the shaking causes water-saturated loose soils (such as silt and sand) to behave like a liquid. Liquefaction tends to happen along natural waterways, such as rivers, and in areas where the ground consists of artificial fill. Port facilities and bridges may therefore be especially vulnerable, but commercial buildings located along rivers, inlets, and bays are also at risk. Buildings on such soils can sink and topple, and foundations may lose strength, resulting in severe damage or structural collapse. Pipes and tanks buried in liquefied soils will float upwards to the surface.
Landslides: Landslides, which may continue to occur for several days after the shaking stops, are especially likely if the earthquake happens during the wet season (winter and spring).
Tsunami: A subduction zone earthquake, such as the one described above in the Cascadia scenario, will generate a large tsunami. The waves will begin to flood the coast within 30 minutes of the earthquake, causing severe damage to ports, harbors, communities, transportation corridors, and utilities systems for several miles inland. A more localized tsunami in Puget Sound is also possible following a shallow earthquake, but this will depend on the fault’s location and other
After a M6.9 earth-quake and tsunami in
1995, the severely damaged Port of
Kobe in Japan fell from 6th to 39th place
in a global ranking of ports. Seventeen
years later, Kobe still hasn’t regained its
former status. –Fukushima, 1995; Pachakis
& Kiremidjiaan, 2004

Defining the Earthquake Hazard 15
details of the earthquake (see, for example, the Tacoma fault scenario). Localized tsunamis can also be triggered by earthquake-induced landslides.
Current efforts to address Washington’s tsunami risk are focused on preparedness to improve life safety within vulnerable areas. This includes the implementation of warning systems, identification and posting of evacuation routes, and training and education for local residents and businesses. Areas that do not have high ground above the projected zone of tsunami flooding will require vertical evacuation shelters—these make it possible for the population to reach man-made high ground in a short amount of time. Project Safe Haven (www.facebook.com/projectsafehaven) allows coastal communities to participate in the planning and design of the evacuation structures to ensure that they meet local needs.
Secondary hazards caused by the earthquake: The damage that results from an earthquake may create additional hazards, including fires and natural gas leaks, hazardous material spills, and downed or damaged electrical lines.
Our resilience depends on how well we anticipate and prepare for the effects of a major earthquake. Because Washington’s systems, infrastructure, and economy are interconnected, improving our resilience requires a coordinated effort among stakeholders from all sectors and locations, even those that may not experience direct physical damage during an earthquake. The first step, as the following section shows, is to identify our current level of resilience and pinpoint our most serious vulnerabilities.
View of Onagawa, Ishinomaki, after the M9.0 Tohoku earth-quake and tsunami struck Japan on March 11, 2011. This event caused more than 15,700 deaths and 5,000 injuries; over 4,600 people were reported missing. In addition to the terrible human toll, Japan suffered economic losses approaching $309 billion (U.S. Geological Survey).
Phot
o: N
OAA
/NG
DC, S
huni
cki K
oshi
mur
a

16 Resilient Washington State
The Danger to Washington’s Ports
Washington’s ports are crucial to the region’s economy: 8% of U.S. exports and 6% of imports pass through our seaports. Together, Seattle and Tacoma make up the third largest container port complex in the nation. In 2010, they had a combined total vessel trade of over $70.6 billion.
Seattle now ranks 7th of 50 among North American ports, while the Port of Everett boasts the largest marina on the West Coast. Three of the state’s 11 deep draft ports are located on the Columbia River, which serves as a transportation corridor for over 40 million tons of cargo each year.
Ports are especially vulnerable to earthquakes: Their waterfront facilities are typically built on fill or sediments that are prone to liquefaction. Ports on Washington’s Pacific coast and in Puget Sound are also exposed to the tsunami hazard.
The top photo shows damage from lateral spreading at the Port of Coronel in Chile after a magnitude 8.8 earthquake in February 2010. At least four large sink holes also developed at this port in the days following the earthquake. The bottom photo shows an example of the damage that resulted from ground failure all around Osaka Bay during the magnitude 6.9 earthquake that severely damaged the port facilities of Kobe, Japan, in January of 1995.
Photo: Geotechnical Extreme Events Reconnaissance (G
EER)
Phot
o: N
OAA
/NG
DC, D
r. Ro
ger H
utch
ison

Evaluating Washington’s Infrastructure 17
Evaluating Washington’s Infrastructure Four workgroups were assigned the task of assessing the key sectors of Washington’s infrastructure. They evaluated the components that make up each sector and considered how these components are likely to perform during and recover after an earthquake. From this evaluation, they developed a general sense of the state’s current capacity for recovery and identified the targets that we must meet if we are to achieve Washington’s resilience goals.
CRITICAL SERVICES SECTOR The following table summarizes the estimated timeframes for recovery of the components of Washington’s Critical Services sector. The Xs mark the group’s collective opinion, based on existing data and expert judgment, as to how long the response and recovery of each component is likely to take if a scenario earthquake happened today. The colored areas indicate the targets that are necessary to ensure that Washington is resilient. Gaps between the Xs and colored areas reveal the need for further evaluation, policies, and actions to improve the state’s resilience.
KEY TO THE TABLE TARGET TIMEFRAME FOR RECOVERY: Operational (time it ought to take to restore the component to 80–90% operational): TIME NEEDED FOR RECOVERY TO 80–90% OPERATIONAL GIVEN CURRENT CONDITIONS: For a number of components, the timeframes marked in the table reflect the estimated recovery period following a worst case scenario earthquake.
TARGET STATES OF RECOVERY: WASHINGTON’S CRITICAL SERVICES SECTOR
Event
occurs 0–24 hours 1–3 days 3–7 days 1 week–
1 month 1–3 months
3 months– 1 year 1–3 years 3 + years
Law enforcement
Emergency response
Health and medical care
Education
Mass care
Social services
Food network
Government administration
Workshop Report II contains detailed examples of the variables that are likely to affect the actual timeframe of each component’s response and recovery; it also contains sector-specific recommendations for improving resilience. (For a copy of Workshop Report II, see the Supplemental Materials listed on page ii above.)

18 Resilient Washington State
DESCRIPTIONS OF COMPONENTS OF THE CRITICAL SERVICES SECTOR
ESTIMATED TIMEFRAME FOR RESPONSE & RECOVERY
Law enforcement in this context refers to the emergency response and regular policing duties of local and state law enforcement agencies.
Target: 3–7 days Timeframe based on current capacity:
3–7 days Emergency response encompasses all first responders, including urban search-and-rescue teams, fire fighters, and emergency medical technicians (EMTs). It also includes emergency operations centers (EOCs) and critical response systems, non-profit aid organizations (such as the American Red Cross), emergency morgue facilities, and Hazmat crews.
Target: 1–3 days Timeframe based on current capacity:
3–7 days These estimates apply to a fully engaged response; many aspects of the response will be initiated within the first 24 hours.
Health and medical care refers to the normal services—including elective procedures—provided by Washington’s hospitals, medical clinics, and other health care facilities. (Emergency care right after an earthquake is part of the emergency response component.)
Target: 1 week–1month Timeframe based on current capacity:
3 months–1 year
Education refers to Washington’s public and private school systems (kindergarten through grade 12), including buildings, curricula, and social aspects.
Target: 1 week–1month Timeframe based on current capacity:
3 months–1 year (buildings in 1–3 years; curriculum in 3 months–1 year; social aspects in 1 month)
Mass care is part of the emergency response following a disaster and involves the distribution of emergency supplies and resources (clothing, shelter, food, and water) to those in need. Some providers of mass care also seek to reconnect people to whatever social services they used before the disaster. Providers may include both nonprofit organizations, such as the Red Cross, and governmental agencies.
Target: 3–7 days for a major Cascadia subduction zone event with widespread damage; 1–3 days for a more localized event
Timeframe based on current capacity: 1 week–1 month
Social services are overseen by the Department of Social and Health Services (DSHS) and include regular assistance with food, mental and physical health care, childcare, and treatment for addictions, as well as help for victims of abuse. The people of Washington must rely increasingly on non-profit aid organizations for delivery of social services.
Target: 1 week–1month Timeframe based on current capacity:
1–3 months A large-scale earthquake is likely to result in substantial temporary degradation of the level of service.
Food network refers to the normal system by which food is stored, distributed, and sold to consumers. The network is operated by the private sector and includes nationally, regionally, and locally owned grocery stores and warehouses.
Target: 1 week–1 month Timeframe based on current capacity:
1 week–1 month
Government administration includes elected officials and staff (local and state) and both emergency operations and regular administrative functions. The facets of this component include representation, finance, policy development, executive decision making, and services (such as issuing licenses and permits).
Target: 3–7 days Timeframe based on current capacity:
1 week–1 month
UTILITIES SECTOR The following table summarizes the estimated timeframes for recovery of the components of Washington’s Utilities sector. The letters (L, NL, and X) mark the group’s collective opinion, based on existing data and expert judgment, as to how long the response and recovery of each component is likely to take if a scenario earthquake happened today. The colored areas indicate the targets that are necessary to ensure that Washington is resilient. Gaps between the letters and the colored areas reveal the need for further evaluation, policies, and actions to improve the state’s resilience.

Evaluating Washington’s Infrastructure 19
This work group preferred to show how the variability of earthquake damage—especially damage associated with liquefaction—may affect the recovery potential of existing, permanent utilities systems. (By implementing temporary solutions, utilities providers may be able to restore services to many end users before the permanent systems are fully repaired.)
KEY TO THE TABLE TARGET TIMEFRAME FOR RECOVERY: Operational (time it ought to take to restore component to 80–90% operational): TIME NEEDED FOR RECOVERY TO 80–90% OPERATIONAL GIVEN CURRENT CONDITIONS: TIME NEEDED FOR RECOVERY TO 80–90% OPERATIONAL IN LIQUEFACTION ZONES GIVEN CURRENT CONDITIONS: L TIME NEEDED FOR RECOVERY TO 80–90% OPERATIONAL IN NON-LIQUEFACTION ZONES GIVEN CURRENT CONDITIONS: NL
TARGET STATES OF RECOVERY: WASHINGTON’S UTILITIES SECTOR
Event
occurs 0–24 hours 1–3 days 3–7 days 1 week–
1 month 1–3 months
3 months– 1 year
1–3 years
3+ years
Domestic water supply Supply & transmission pipes
NL L Distribution pipes
NL L Wastewater systems Treatment facilities
NL L Sewer pipes
NL L Flood control Dams Levees
Electricity Transmission
Distribution, 60% restored
Distribution, 70% restored
Distribution, >70% restored
Natural Gas Transmission
NL L Distribution, 40% restored
Distribution, 90% restored
Petroleum Refineries & transmission Distribution
Information and communication technology
Workshop Report II contains detailed examples of the variables that are likely to affect the actual timeframe of each component’s response and recovery; it also contains sector-specific recommendations for improving resilience. (For a copy of Workshop Report II, see the Supplemental Materials listed on page ii above.)

20 Resilient Washington State
DESCRIPTIONS OF COMPONENTS OF THE UTILITIES SECTOR
ESTIMATED TIMEFRAME FOR RESPONSE & RECOVERY
Domestic water supply consists of reservoirs, storage facilities, treatment facilities, pump stations, and transmission and distribution pipe-lines for household, business, and emergency services use. It does not include pipelines and hookups on customers’ private property: these must be repaired by the property owner.
Target: 1–3 days Timeframes based on current capacity: Supply & transmission pipes: 3–7 days in zones of
no liquefaction; 3 months–1 year in liquefaction zones
Distribution pipes: 1 week–1month in zones of no liquefaction; 3 months–1 year in liquefaction zones
Wastewater systems consist of sewer and stormwater systems, including wastewater pump stations, transmission and distribution pipelines, catch basins, and wastewater treatment facilities. This component does not include pipelines and hookups on customers’ private property: these must be repaired by the property owner.
Target: 1 week–1month Timeframes based on current capacity: Treatment facilities: 1–3 months in zones of no
liquefaction; 3 months–1 year in liquefaction zones Sewer pipes: 1–3 months in zones of no
liquefaction; 1–3 years in liquefaction zones
Flood control consists of the dams, levees (including both manmade and natural river banks), and other structures that reduce the likelihood of impacts from flooding.
Target: 1 week–1 month Timeframes based on current capacity: Dams: 1–3 months Levees: 1–3 years
Electricity consists of generation facilities, substations, transmission towers, transmission lines and equipment, distribution poles and equipment, and control centers. It does not include hookups on customers’ private property: these must be repaired by the property owner (private residences and facilities will likely require inspection before service can be restored).
Target: 1 week–1 month Timeframe based on current capacity: Transmission: 1–3 years Distribution: 60% restored in 1 week–1 month; 70%
restored in 1–3 months; greater than 70% restored in 3 months–1 year
Estimates reflect the time needed to restore the electrical grid/system. Damage to residences and industrial and commercial buildings must also be repaired and inspected before these structures can be reconnected to the grid. In some cases, this could take longer than six months.
Natural gas includes natural gas transmission pipelines and facilities as well as their owners and operators. It does not include pipelines and hookups on customers’ private property: these must be repaired by the property owner.
Targets: Transmission in 1–3 days; distribution in 1 week–1 month
Timeframe based on current capacity: Transmission: 1–3 days in zones of no liquefaction;
1 week–1 month in liquefaction zones Distribution: 40% restored in 1 week–1 month; 90%
restored in 1–3 months Petroleum includes transmission pipelines for petroleum (gasoline, diesel, jet fuel, crude oil), terminals and refineries, and their owners and operators. It does not include pipelines and hookups on customers’ private property: these must be repaired by the owners of the property.
Targets: Refineries & transmission in 1 week–1 month; distribution in 3–7 days
Timeframe based on current capacity: Refineries & transmission: 1–3 years Distribution: 1–3 months
Information & communication technology includes hard-wired telephone and cable TV systems, wireless cellular phone systems, and 800 MHZ public service radio systems. Most services are provided by privately owned companies. The 800 MHZ, used primarily by police, fire, and emergency medical response agencies, is publicly owned and controlled.
Target: 3–7 days Timeframe based on current capacity: 1–3 months

Evaluating Washington’s Infrastructure 21
TRANSPORTATION SECTOR The following table summarizes the estimated timeframes for recovery of the components of Washington’s Transportation sector. The Xs mark the group’s collective opinion, based on existing data and expert judgment, as to how long the response and recovery of each component is likely to take if a scenario earthquake happened today. The colored areas indicate the targets that are necessary to ensure that Washington is resilient. Gaps between the Xs and colored areas reveal the need for further evaluation, policies, and actions to improve the state’s resilience.
This work group preferred to show how the recovery of the state’s transportation system can be expected to occur in stages as the restoration work proceeds through a list of priorities and advances from temporary to more permanent repairs and solutions.
KEY TO THE TABLE TARGETS TO ACHIEVE DIFFERENT LEVELS OF RECOVERY:
Minimal (A minimum level of service is restored, primarily for the use of emergency responders, repair crews, and vehicles transporting food and other critical supplies.)
Functional (Service is not yet restored to full capacity, but is sufficient to get the economy moving again—e.g. some truck/freight traffic can be accommodated. There may be fewer lanes in use, some weight restrictions, and lower speed limits.)
Operational (Restoration is up to 80–90% of capacity: A full level of service has been restored and is sufficient to allow people to commute to school and to work.)
TIME NEEDED FOR RECOVERY TO 80–90% OPERATIONAL GIVEN CURRENT CONDITIONS: For a number of components, the timeframes marked in the table reflect the estimated recovery period following a worst case scenario earthquake. See the notes in Workshop Report II for details.
TARGET STATES OF RECOVERY: WASHINGTON’S TRANSPORTATION SECTOR
Event
occurs 0–24 hours 1–3 days 3–7 days 1 week–
1 month 1–3 months
3 months– 1 year 1–3 years 3+ years
Interstate 5 Puget Sound (center & north)
South end (Chehalis south)
Interstate 90 Puget Sound (Snoqualmie Pass west) Cascades to eastern WA (Snoqualmie to Idaho) Interstate 405 South end (Tukwila to I-90)
North end (I-90 to Lynnwood)
Ferry operations Floating Bridges SR 520
I-90
Hood Canal

22 Resilient Washington State
TARGET STATES OF RECOVERY: WASHINGTON’S TRANSPORTATION SECTOR (CONTINUED)
Event occurs
0–24 hours 1–3 days 3–7 days 1 week–
1 month 1– 3 months
3 months– 1 year 1– 3 years 3+ years
25% of major & minor arterials 50% of major & minor arterials 75% of major & minor arterials 90% of major & minor arterials Airports Airport for emergency traffic Ports and navigable waterways
Rail (freight & passenger)
Mass transit: estimates mirror those of major & minor arterials
Workshop Report II contains detailed examples of the variables that are likely to affect the actual timeframe of each component’s response and recovery; it also contains sector-specific recommendations for improving resilience. (For a copy of Workshop Report II, see the Supplemental Materials listed on page ii above.)
DESCRIPTIONS OF COMPONENTS OF THE TRANSPORTATION SECTOR
ESTIMATED TIMEFRAME FOR RESPONSE & RECOVERY
Interstates and floating bridges include Interstates 5, 90, and 405 and floating bridges SR 520, I-90, and Hood Canal.
Target: between 1–3 days and 1–3 months, depending on location
Timeframe based on current capacity: between 3 months–1 year and 1–3 years, depending on location
Ferry operations consist of the fleet of 22 ferries and 20 terminals that the Washington State Department of Transportation operates in Puget Sound for the use of commuters, tourists, and commercial vehicles.
Target: between 0–24 hours and 1week–1 month Timeframe based on current capacity: 3 months–1
year
Major and minor arterials encompass arterial roadways (including bridges, state highways, and many city and county roads) other than the inter–states.
Target: between 0–24 hours and 3 months–1 year, depending on location
Timeframe based on current capacity: between 1 week–1 month and 1–3 years, depending on location The percentage of roadways that are open for use will increase over this period.
Airports include international and regional airports, such as Seattle-Tacoma (Sea-Tac) International Airport, Boeing Field (King County International Airport), and Paine Field (Snohomish County Airport).
Target: between 0–24 hours and 1week–1 month Timeframe based on current capacity: 3 months–1
year
Ports and navigable waterways consist of Washington’ system of ports and shipping routes, including piers, wharves, seawalls, container storage yards, marinas, and other facilities and equipment on which the operations of the ports depend.
Target: between 3–7 days and 1–3 months Timeframe based on current capacity: 1–3 years

Evaluating Washington’s Infrastructure 23
Rail includes passenger rail services and the freight services provided by numerous privately owned railroad companies, along with the tracks, bridges, overpasses, signal systems, and other facilities and equipment on which they depend.
Target: between 3–7 days and 1–3 months Timeframe based on current capacity: 1–3 years
(While light rail is part of the Mass Transit system, for the purposes of this initiative, it is also addressed as part of the Rail component.)
Mass transit includes all public transportation systems other than the ferry system. Because these systems—and public buses in particular—depend on the functionality of roadways and bridges, the recovery of mass transit will depend predominately on the recovery of the network of major and minor arterials along which mass transit routes run.
Target: between 0–24 hours and 3 months–1 year, depending on location
Timeframe based on current capacity: between 1 week–1 month and 1–3 years, depending on location The percentage of roadways that are open for use will increase over this period.
Damaging Aftershocks
This view of a street in Christchurch, New Zealand, illustrates how liquefaction during an earthquake can damage infrastructure and make roads impassable. In this case, not only was the roadway damaged but the drains as well, so the street was prevented from draining and drying out.
The damage in this photo occurred during a magnitude 6.1 aftershock more than five months after the main magnitude 7.0 Darfield earthquake struck New Zealand on September 3, 2010. The aftershock was closer to the city of Christchurch than the main quake and did significantly more damage: An estimated 100,000 buildings were destroyed, and the city’s central business district had to be cordoned off while buildings were demolished and debris was cleared away. Even 16 months after the earthquake, parts of the district were still off limits.
Phot
o: N
OAA
/NG
DC, S
teve
Tay
lor (
Ray
Whi
te)

24 Resilient Washington State
HOUSING AND ECONOMIC DEVELOPMENT SECTOR The following table summarizes the estimated timeframes for recovery of the components of Washington’s Housing and Economic Development sector. The Xs mark the group’s collective opinion, based on existing data and expert judgment, as to how long the response and recovery of each component is likely to take if a scenario earthquake happened today. Colored areas indicate the targets that are necessary to ensure that Washington is resilient. Gaps between the Xs and colored areas reveal the need for further evaluation, policies, and actions to improve the state’s resilience.
This work group preferred to show how some components are likely to recover in stages. In the case of housing, the timing of the stages may be affected by the building code standards that were in place at the time of construction: because newer buildings are built to higher seismic standards, they can usually be expected to suffer less damage during an earthquake.
KEY TO THE TABLE TARGETS TO ACHIEVE DIFFERENT LEVELS OF RECOVERY: Minimal: Functional: Operational* (time it ought to take to restore component to 80–90% operational): TIME NEEDED FOR RECOVERY TO 80–90% OPERATIONAL GIVEN CURRENT CONDITIONS: For a number of components, the timeframes marked in the table reflect the estimated recovery period following a worst case scenario earthquake.
TARGET STATES OF RECOVERY: WASHINGTON’S HOUSING & ECONOMIC DEVELOPMENT SECTOR
Event
occurs 0–24 hours 1–3 days 3–7 days 1 week–
1 month 1–3 months
3 months– 1 year
1–3 years
3+ years
Finance and banking
Commerce (commercial facilities) Real estate and construction Manufacturing (industrial facilities) Planning and community development
Unreinforced masonry structures Housing Detached single-family residential (pre-1950) Detached single-family residential (post 1950) Mid- and high-rise structures (pre- 1977) Mid- and high-rise structures (post 1977)

Evaluating Washington’s Infrastructure 25
Workshop Report II contains detailed examples of the variables that are likely to affect the actual timeframe of each component’s response and recovery; it also contains sector-specific recommendations for improving resilience. (For a copy of Workshop Report II, see the Supplemental Materials listed on page ii above.)
Occupiable means that a housing unit is structurally sound, safe, and sanitary (sewer and water are available in the unit or nearby), and people can use it to shelter in place following the earthquake.
DESCRIPTIONS OF COMPONENTS OF THE HOUSING & ECONOMIC DEVELOPMENT SECTOR
ESTIMATED TIMEFRAME FOR RESPONSE & RECOVERY
Finance and banking includes local branches of banks, ATM machines, and insurance providers.
Target: Minimum: in 1–3 days, at least 50% of services are restored Functional: in 3–7 days, at least 75% of services are restored Operational: in 1 week–1 month, at least 90% of services are
restored Timeframe based on current capacity: 3–7 days
Commerce (commercial facilities) consists of retail businesses (local stores as well as regional and national chains).
Target: Minimum: in 1–3 days, retailers gain access to facilities and
focus on cleaning up and assessing inventory. Functional: in 3–7 days, utilities are restored, just-in-time
inventories begin to be restocked, and stores have some ability to provide merchandise to customers.
Operational: in 1 week–1 month, stores are able to restock and sell merchandise with few limitations.
Timeframe based on current capacity: 1–3 months Real estate and construction includes construction companies, contractors, and real estate agencies.
Target: Minimum: 1–3 days Functional: 3–7 days Operational: 1 week–1 month
Timeframe based on current capacity: 3–7 days Manufacturing (industrial facilities) includes manufacturers such as Boeing and the buildings and equipment on which they rely.
Target: Minimum: 3–7 days Functional: 1 week–1 month Operational: 1–3 months
Timeframe based on current capacity: 1 week–1 month Planning & community development includes building codes, permitting processes, and the capacity of local governments and state agencies to review plans and issue permits for demolition, repairs, and new construction.
Target: Minimum: 3–7 days Functional: 1 week–1 month Operational: 1–3 months
Timeframe based on current capacity: 1–3 months
Unreinforced Masonry Structures (URMs) refers to a common type of older construction that is especially vulnerable to earthquakes. Many historic buildings are URMs.
Target: in 3 months–1 year, 80% of URMs are occupiable) Timeframe based on current capacity: 3+ years

26 Resilient Washington State
Housing refers to all residential structures except URMs.
(The estimates for residential buildings differ according to type and date of construction.)
Detached Single-Family Residential (Pre-1950)
Target: Functional: 75% of homes occupiable in 1–3 days Operational: 90% occupiable in 3–7 days
Timeframe based on current capacity: 3 months–1 year Detached Single-Family Residential (Post 1950)
Target: Functional: 75% of homes occupiable in 0–24 hours Operational: 90 % occupiable in 1–3 days
Timeframe based on current capacity: 1 week–1 month Mid- and High-rise Structures (Pre-1977) mid-rise: 4–10 stories high-rise: more than 10 stories
Target: Functional: 50% of structures occupiable in 3–7 days Operational: 90% occupiable in 1–3 months
Timeframe based on current capacity: 1–3 years Mid- and High-rise Structures (Post 1977) mid-rise: 4–10 stories high-rise: more than 10 stories
Target: Functional: 75% of structures occupiable in 1–3 days Operational: 90% occupiable in 1 week–1month
Timeframe based on current capacity: 1–3 months
The magnitude 6.8 Nisqually earthquake in 2001 caused serious damage to many older buildings in Seattle’s historic Pioneer Square.
If people are not able to return to
their homes soon after the earth-
quake, many will simply relocate. This would deal
another blow to the economy and slow the recovery of the whole community.
–RWS Housing & Economic Development
Sector Group
Phot
o: U
SGS,
A. S
anli
and
M. C
eleb
i
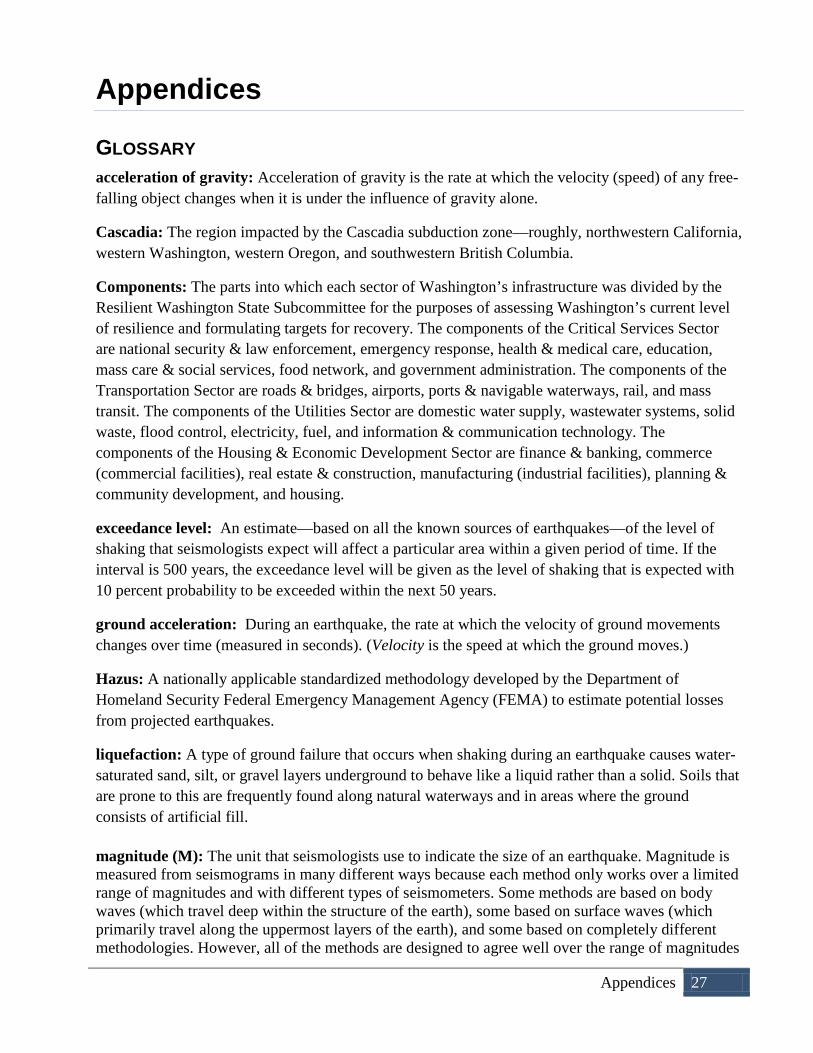
Appendices 27
Appendices
GLOSSARY acceleration of gravity: Acceleration of gravity is the rate at which the velocity (speed) of any free-falling object changes when it is under the influence of gravity alone.
Cascadia: The region impacted by the Cascadia subduction zone—roughly, northwestern California, western Washington, western Oregon, and southwestern British Columbia.
Components: The parts into which each sector of Washington’s infrastructure was divided by the Resilient Washington State Subcommittee for the purposes of assessing Washington’s current level of resilience and formulating targets for recovery. The components of the Critical Services Sector are national security & law enforcement, emergency response, health & medical care, education, mass care & social services, food network, and government administration. The components of the Transportation Sector are roads & bridges, airports, ports & navigable waterways, rail, and mass transit. The components of the Utilities Sector are domestic water supply, wastewater systems, solid waste, flood control, electricity, fuel, and information & communication technology. The components of the Housing & Economic Development Sector are finance & banking, commerce (commercial facilities), real estate & construction, manufacturing (industrial facilities), planning & community development, and housing.
exceedance level: An estimate—based on all the known sources of earthquakes—of the level of shaking that seismologists expect will affect a particular area within a given period of time. If the interval is 500 years, the exceedance level will be given as the level of shaking that is expected with 10 percent probability to be exceeded within the next 50 years.
ground acceleration: During an earthquake, the rate at which the velocity of ground movements changes over time (measured in seconds). (Velocity is the speed at which the ground moves.)
Hazus: A nationally applicable standardized methodology developed by the Department of Homeland Security Federal Emergency Management Agency (FEMA) to estimate potential losses from projected earthquakes.
liquefaction: A type of ground failure that occurs when shaking during an earthquake causes water-saturated sand, silt, or gravel layers underground to behave like a liquid rather than a solid. Soils that are prone to this are frequently found along natural waterways and in areas where the ground consists of artificial fill.
magnitude (M): The unit that seismologists use to indicate the size of an earthquake. Magnitude is measured from seismograms in many different ways because each method only works over a limited range of magnitudes and with different types of seismometers. Some methods are based on body waves (which travel deep within the structure of the earth), some based on surface waves (which primarily travel along the uppermost layers of the earth), and some based on completely different methodologies. However, all of the methods are designed to agree well over the range of magnitudes

28 Resilient Washington State
where they are reliable. Preliminary magnitudes based on incomplete data are sometimes estimated and reported. For example, the Tsunami Centers will calculate a preliminary magnitude and location for an event as soon as sufficient data is available to make an estimate. In this case, time is of the essence in order to broadcast a warning if tsunami waves are likely to be generated by the event. Such preliminary magnitudes, which may be off by one-half magnitude unit or more, are sufficient for the purpose at hand, and are superseded by more exact estimates of magnitude as more data become available. The scale used for measurements of magnitude is logarithmic. In simple terms, this means that at the same distance from the earthquake, the shaking will be 10 times as large during a magnitude 5 earthquake as during a M4 earthquake, while the shaking during a M6 earthquake will be 100 times greater than that of a M4 event. The total amount of energy released by the earthquake, however, goes up by a factor of 32.
peak ground acceleration (pga): A measure of the strength of the shaking during an earthquake. The back-and-forth movement of the ground during an earthquake is irregular; peak acceleration describes the maximum acceleration achieved as the seismic waves pass through the earth. (Acceleration is the rate at which the speed of the ground movement changes over time.)
rupture: The earth movement along a fault during an earthquake.
sector groups: Four groups of experts and stakeholders whose input was used to formulate the targets and recommendations contained within the Resilient Washington State report. Each sector group was assigned to one of the four sectors of Washington’s infrastructure: Critical Services, Transportation, Utilities, and Housing & Economic Development.
sectors: The four categories into which the Resilient Washington State Subcommittee divided the state’s infrastructure for the purposes of assessing Washington’s current level of resilience and formulating targets for recovery. The four sectors are Critical Services, Transportation, Utilities, and Housing & Economic Development.
subduction zone: The zone along which one tectonic plate meets and slides beneath another. In the Pacific Northwest, this is the 684-mile-long (1,100 kilometer) Cascadia subduction zone, a thrust fault along which the Juan de Fuca oceanic plate subducts beneath the North American plate. This zone extends from Brooks Peninsula on Vancouver Island to Cape Mendocino in California (where a second oceanic plate, called the Gorda plate, subducts beneath northern California). (See the illustration on page 10.)
tsunami: The wave or series of waves that are generated when an earthquake (or landslide) causes the sudden displacement of a body of water, such as when earth movements during a subduction zone event cause a portion of the seafloor to shift rapidly upward.
velocity: The speed at which the ground moves during an earthquake.

Appendices 29
LIST OF PARTICIPANTS Last Name First Name Organization/Affiliation
Anderson Mark Department of Commerce
Ash Cale Degenkolb Engineers
Atkins Tristan Washington State Dept. of Transportation, Aviation
Ballantyne Don Degenkolb Engineers
Bartoletti Stacy Degenkolb Engineers
Behee Roland Community Transit
Biasco Tamra FEMA RX
Bippert Bob Washington Department of General Administration
Bower Dick City of Gig Harbor
Carver Tom OSPI
Chin King GeoEngineers Inc.
Davis Charles Washington Federal
Decker Scott WA State Dept. of Health, Emergency Preparedness Unit
Dolan J. Daniel WSU, Dept. of Civil & Env. Engineering
Duffy Chuck WA State Fire Marshal
Dunn Carol City of Bellevue Office of Emergency Management
Edwards Shelby PEMCO
Eichhorn Lawrence Seattle Department of Transportation (EM)
Erickson John WA State Dept. of Health
Forschler Rick WA Association of Sewer and Water Districts
Freitag Bob University of Washington
Gonzalez David Degenkolb Engineers
Graff Barbara Seattle Office of Financial Management
Green Rebekah Western WA University, Resilience Institute,
Hails Charlene MRP Engineering
Hardin Kurt Washington State Emergency Management Division
Harmon Ron Port of Seattle
Hildreth Richard Mayor, City of Pacific

30 Resilient Washington State
Himmel John Washington State Department of Transportation
Holdeman Eric Port of Tacoma
Hutchinson Jim Washington State Emergency Management Division
Huxford CJ Western Washington University
Ivanov Barbara Washington State Department of Transportation
Jardine Sheryl Washington State Emergency Management Division
Jensen Grant Williams Pipeline Co.
Keenan Lyn GeoEngineers; American Planning Association
Labadie John Consultant, Emergency Management
LaVassar Jerald Department of Ecology, Dam Safety Office
Lokey Bill Witt Associates
Loveless Randy Reid Middleton
Lund Erika City of Seattle, Emergency Management
Lundeen Terry Coughlin Porter Lundeen
Lykken David Utilities & Transportation Commission, Pipeline Safety
Mansell Gary Boeing
Maykovich Vince FEMA Region X, Planning Section Chief
Mayer Steve Wells Fargo Corporate Properties Group
McBride Mat BECU
McDonald Cameron Western Washington University, DREP Program
Medina Alfredo Port of Seattle
Meyers Luke City of Bellevue Office of Emergency Management
Miles Scott Western Washington University, Resilience Institute
Mitra Anindita CREA Affiliates
Mociulski Michael Seattle Public Utilities
Mooney Jamie Washington State Emergency Management Division
Morin Pat Washington State Department of Transportation
Mueller Martin OSPI
Mullen Jim Washington State Emergency Management Division
Noahr Lorrell OSPI

Appendices 31
Nelson Dave Washington State Emergency Management Division
Norman Dave WA State Department of Natural Resources, Geology
Nourse Kyra Contractor, Writer & Editor
Ogi Irving Seattle City Light
Perez Tony City of Seattle, Department of Information Technology
Pierepiekarz Mark MRP Engineering
Ripley Sam City of Pacific, VISTA volunteer
Roberts Shawn Washington State Department of Health
Schelling John Washington State Emergency Management Division
Scofield Joan WA Office of Insurance Commission
Sinclair Helen Massey University, New Zealand
Siu John City of Seattle, DPD
Steele Bill Pacific Northwest Seismic Network
Subsits Joe WA Utilities & Transportation Commission
Swanson David Reid Middleton
Tabat Dale WSDOT
Thurman Barbara OSPI
Ufford John Washington State Emergency Management Division
Vidale John University of Washington, ESS Department
Wallace Chuck Grays Harbor Emergency Management
Walsh Tim WA State Department of Natural Resources, Geology
Wesolowski Mark Puget Sound Energy
West Don Golder Associates (for Williams Pipeline Co.)
Winecoff Steven Community Transit, Everett WA
Wood Nathan U.S. Geological Survey
Worcester Ned Seattle Public Utilities

32 Resilient Washington State
ADDITIONAL RESOURCES Alesch, D. J., Arendt, L. A., & Holly, J. N. (2009). Managing for Long-Term Community Recovery
in the Aftermath of Disaster. Fairfax, VA: Public Entity Risk Institute (PERI).
Alesch, D. J., Holly, J. N., Mittler, E., & Nagy, R. (2002). After the Disaster . . .What Should I Do Now? Information to Help Small Business Owners Make Post-Disaster Business Decisions. Fairfax, VA: PERI.
Cascadia Region Earthquake Workgroup. (2009). Cascadia Shallow Earthquakes. Seattle, WA: author.
Cascadia Region Earthquake Workgroup. (2009, revised). Cascadia Subduction Zone Earthquakes: A Magnitude 9.0 Earthquake Scenario. Seattle, WA: author.
Cascadia Region Earthquake Workgroup. (2008). Cascadia Deep Earthquakes. Seattle, WA: author.
Earthquake Engineering Research Institute & Washington Military Department Emergency Management Division. (2005). Scenario for a Magnitude 6.7 Earthquake on the Seattle Fault. Oakland, CA and Camp Murray, WA: author.
Federal Emergency Management Agency. (2008, April). HAZUS-MH Estimated Annualized Losses for the United States (FEMA 366/April 2008). Washington, D.C.: author.
Federal Emergency Management Agency & Washington Military Department, Emergency Management Division. (2001). Hazard Mitigation Survey Team Report for the Nisqually Earthquake, February 28, 2001 (DR-1361-WA). Camp Murray, WA: authors.
Ford, Peter. (2011, July 7). Japan’s tsunami recovery stalls. The Christian Science Monitor, http://www.csmonitor.com/World/Asia-Pacific/2011/0707/Japan-s-tsunami-recovery-stalls.
Fukushima, G. S. (1995). The Great Hanshin Earthquake. San Francisco: University of San Francisco Center for the Pacific Rim. http://www.jpri.org/publications/occasionalpapers/op2.html
Pachakis, D. S., & Kiremidjian, A. S. (2004). Estimation of downtime-related revenue losses in seaports following scenario earthquakes. Earthquake Spectra, 20(2), 427-449.
Pendall, R., Foster, K. A., & Cowell, M. (2007). Resilience and Regions: Building Understanding of the Metaphor, Working Paper 2007-12. Macarthur Foundation Research Network on Building Resilient Regions, Institute for Urban and Regional Development. University of California, Berkeley.
Puget Sound Transportation Recovery Annex: Catastrophic Disaster Coordination Plan. (2011), http://www.seattle.gov/emergency/library/TransportationRCPTApprovedFinal.pdf
Smith, G. (2011). Planning for Post-Disaster Recovery: A Review of the United States Disaster Assistance Framework. Fairfax, VA: PERI.

Appendices 33
San Francisco Planning and Urban Research Association (SPUR). (2008-2010). The Resilient City. http://www.spur.org/policy/the-resilient-city.
Vale, L. (2008). Resilience and Resistance: Rebuilding Cities after Disaster [PowerPoint Presentation]. Cambridge, MA: MIT Department of Urban Studies and Planning.
Washington State Emergency Management Council. (2009). Statewide Emergency Preparedness 2009 Annual Report to the Governor. Camp Murray, WA: Washington Military Department, Emergency Management Division.
Washington State Emergency Management Council Seismic Safety Subcommittee. (1998, June). Earthquake Safety in Washington State: A Progress Report on Activities for the Period 1992-1997. WA: author.
Washington State Department of Community Development Seismic Safety Advisory Committee. (1991). A Policy Plan for Improving Earthquake Safety in Washington: Fulfilling Our Responsibility. Olympia, WA: author.
Washington State Department of Community Development Seismic Safety Advisory Committee, Emergency Response Subcommittee. (1991). Final Report. Bellevue, WA: author.
Washington State Department of Community Development Seismic Safety Advisory Committee, Lifelines Subcommittee. (1991). Final Report. Bellevue, WA: author.
Washington State Department of Community Development Seismic Safety Advisory Committee, Structures Subcommittee. (1991). Final Report. Bellevue, WA: author.
Washington State Department of Transportation. (2011). Earthquake Peak Ground Motion Comparison, 500-Year Event vs. 1000-Year Event. Olympia, WA: author.
Western States Seismic Policy Council. ( 2001, Fall). WSSPC Policy Recommendations. Earthquake Quarterly, pp. 6–11.
More information about Washington’s tsunami hazard can be found at: www.emd.wa.gov/hazards/haz_tsunami.shtml www.dnr.wa.gov/ResearchScience/Topics/GeologicHazardsMapping/Pages/tsunamis.aspx www.dnr.wa.gov/ResearchScience/Topics/GeosciencesData/Pages/geology_portal.aspx

The goal is to make Washington Resilient
within 50 years.