resource adequacy and elcc primer (2format)
TRANSCRIPT

1
Resource Adequacy and ELCC Primer
Contents
1. Introduction and purpose
2. 2021 IRP Resource Adequacy analysis
Background
Resource Adequacy Modeling Approach
Peak Capacity Credit – Effective Load Carrying Capability (ELCC)
Loss of Load events and how that effects capacity credit
Storage Capacity Credit
o Why use expected unserved energy (EUE) for energy limited resources?
o Pumped Storage Hydro Analysis
3. Request for Proposal (RFP) modeling
4. Climate change analysis
5. Additional questions
6. Timeline for updates
1. Introduction and Purpose
During the development of PSE’s draft 2021 All-Source RFP, bidders and stakeholders raised many
questions about PSE’s resource adequacy modeling process and evaluation of resource effective load
carrying capability (ELCC) values. Questions ranged from general queries about resource adequacy
methodologies to specific inquiries about the ELCC values of battery energy storage, pumped
hydroelectric storage and hydroelectric resources. Another topic of interest for stakeholders was PSE’s
decision to reduce its market reliance from 1,500 MW to 500 MW and whether this action constrained the
ability of storage resources to be used to meet PSE’s identified capacity needs.
Given all the questions raised and the importance of ELCC in evaluating resources as part of the All-
Source RFP, particularly in Phase 2 of the evaluation process, PSE agreed as part of the Utilities and
Transportation Commission’s (Commission’s) review and approval process for its 2021 All-Source RFP to
provide an ELCC primer to stakeholders and host a workshop to further review and explain its ELCC
methodology, assumptions, and inputs and determine whether any updates or adjustments to PSE’s
ELCC methodology or inputs for the RFP may be appropriate. To support this in-depth review, PSE

2
worked through its independent evaluator to hire a third-party consultant, E3. E3 will be presenting at the
upcoming workshop on August 31, 2021, and their review will reflect on the reasonableness of PSE’s
ELCC methodology and inputs, with an eye towards addressing stakeholder questions and concerns that
were raised during development of the draft RFP.
This primer is intended to serve as a resource for stakeholders who may have varying degrees of
familiarity with PSE’s ELCC methodology, as explained in the 2021 RFP, and how it is applied in the RFP
process. Much of the information shared in this document can also be found in the materials supporting
the 2021 IRP, with some additional explanation or examples added throughout in an attempt to improve
clarity. The goal of this document is to help stakeholders better understand PSE’s approach to ELCC and
give stakeholders the tools to prepare for a robust discussion at the upcoming workshop.
2. 2021 IRP Resource Adequacy Analysis
Background
The energy supply industry is in a state of transition as major decarbonization policies are implemented in
many states. Significant amounts of coal-fired generation is being retired, and new intermittent, renewable
generation is being constructed. These changes will cause PSE and other utilities to significantly change
how they plan, especially with regard to resource adequacy. To maintain confidence in the wholesale
market and ensure that sufficient resources are installed and committed, the Northwest Power Pool is
designing and implementing a regional resource adequacy program. Documentation of the detailed
design of the resource adequacy program was published in July 2021 and participation in the non-binding
phase of the program is expected to commence in Q4 of 20211. As the detailed design documentation is
processed and the non-binding program is established, PSE will further develop the evaluation of various
resource adequacy elements in future IRP cycles to align with regional trends.
In addition to potential changes to the region brought about as a result of the Northwest Power Pool
Resource Adequacy Program, PSE has also be re-examining its reliance on wholesale market
purchases. In the past, relying on short-term wholesale energy markets has been a very cost-effective
strategy for customers. This strategy also avoided building significant amounts of new baseload natural
gas generation that might have created significant stranded cost concerns under the new policies. Recent
experience shows that while average wholesale electricity prices remain low, the Pacific Northwest
(PNW) region is starting to experience periods of high wholesale electricity prices and low short-term
market liquidity.
1 https://www.nwpp.org/private‐media/documents/2021‐08‐10_NWPP_RA_2B_Design_v4_final.pdf

3
PSE has a completed a market risk assessment which evaluates the availability of short-term market
purchases for peak capacity. The results of the market risk assessment suggest that PSE should reduce
its market reliance from 1500 MW to 500 MW by 2027. Additional details of the market risk assessment
may be found in Chapter 3 of the 2021 IRP2. PSE will continue to closely monitor the region’s projected
winter and summer season load/resource balance and any changes in the liquidity of the short-term
market, and to update its assessment of the reliability of wholesale market purchases as conditions
warrant in future IRP cycles. PSE will host a workshop on the market reliance assessment at the end of
September, 2021.
Resource adequacy planning is used to ensure that all of PSE customer’s load obligations are reliably
met by building sufficient generating capacity, or acquiring sufficient capacity through contracts, to be
able to meet customer demand with appropriate planning margins and operating reserves. The planning
margin and operating reserves refer to capacity above customer demand that ensure the system has
enough flexibility to handle balancing needs and unexpected events with minimal interruption of service.
Unexpected events can be variations in temperature, variations in hydro and wind generation, equipment
failure, transmission interruption, potential curtailment of wholesale power supplies, or any other sudden
departure from forecasts. Reliability requires that the full range of potential demand conditions are met
even if the potential of experiencing those conditions is relatively low.
The physical characteristics of the electric grid are very complex, so for planning purposes, PSE uses a 5
percent loss of load probability (LOLP) reliability metric to assess the physical resource adequacy risk.
This planning standard requires utilities to have sufficient peaking resources available to fully meet their
firm peak load and operating reserve obligations in 95 percent of simulations. In other words, the
likelihood of capacity being lower than load at any time in the year cannot exceed 5 percent. The 5
percent LOLP is consistent with the resource adequacy metric used by the Northwest Power and
Conservation Council (NPCC) and other utilities in the region, see Figure 1. LOLP is just one of several
resource adequacy metrics, below is a list of different metrics commonly used in resource adequacy
analysis:
1. Loss of Load Probability (LOLP) as a percent per year (%).
2. Loss of Load Hours (LOLH) in hours per year (hrs/yr). The LOLH is the total number of hours
in a year wherein load plus reserves exceeds generation. This helps to track the duration of
the loss of load event.
3. Loss of Load Expectation (LOLE) in days per year (days/yr). The LOLE is the total number of
days in a year where load plus reserves exceeds generations. This metric is used by CAISO
and other utilities. The industry standard target is 1-in-10 or 0.1 day/yr.
4. Expected Unserved Energy (EUE) in energy per year (MWh/year). The EUE is the amount of
energy lost during an event.
2 PSE 2021 Integrated Resource Plan, Chapter 3,
https://oohpseirp.blob.core.windows.net/media/Default/Reports/2021/Final/03.%20IRP21_Ch3_032921.pdf

4
The following table is a summary of the resource adequacy metrics used by utilities in the Pacific
Northwest for resource planning. PSE tracks all the metrics as part of the resource adequacy model for
comparison across different planning analyses.
Figure 1 – Utilities RA metric comparison
Reliability Criteria Capacity Contribution
Methodology Puget Sound Energy LOLP (5%/year) ELCC
EUE adjusted for energy limited
resources
Portland General Electric LOLE (0.1 days/year) Marginal ELCC
PacifiCorp LOLH (2.4 hours/year) LOLP based Capacity Factor
NorthWestern Energy LOLE (0.1 days/year) ELCC
Avista LOLP (5%/year) ELCC
Northwest Power and Conservation Council LOLP (5%/year) ASCC
Quantifying the peak capacity contribution of a renewable and energy limited resource (its effective load
carrying capacity or ELCC) is an important part of the analysis. The ELCC of a resource represents the
peak capacity credit assigned to that resource. It is calculated in the resource adequacy model since this
value is highly dependent on the load characteristics and the mix of portfolio resources. The ELCC of a
resource is therefore unique to each utility. Even neighboring utilities can have higher or lower ELCC
values, depending upon their needs, demand shapes and availability of supply-side resources.
Resource Adequacy Modeling Approach
PSE’s Resource Adequacy Model (RAM) is used to analyze load/resource conditions for PSE’s power
system. Since PSE relies on significant amounts of wholesale power purchases to meet peak need, the
analysis must include evaluation of potential curtailments to regional power supplies. To accomplish this,
the RAM integrates two other analyses into its results: 1) the classic GENESYS model3 developed by the
NPCC and BPA, which analyzes regional level load/resource conditions, and 2) the Wholesale Purchase
Curtailment Model (WPCM), developed by PSE, which analyzes the specific effects of regional
curtailments on PSE’s system. This allows us to evaluate PSE’s ability to make wholesale market
purchases to meet firm peak load and operating reserve obligations.
Figure 2 illustrates how the inputs and outputs of these models are linked. The outputs of the GENESYS
Model provide inputs for both the WPCM model and the RAM/LOLP model. The RAM/LOLP model and 3 The GENESYS model has recently be updated to the “Redeveloped GENESYS” model by the NPCC and BPA for the 2021
Power Plan. The draft power plan will be out September 2021, with the final power plan early 2022. Given that the redeveloped
GENEYS model is still under development and review and the results from the redeveloped GENESYS model are a departure
from the classic analysis, PSE is validating and verifying use of the redeveloped GENESYS for future IRP analysis.

5
WPCM models are used iteratively, with the final output of the RAM/LOLP model used in the next WPCM
modelling run.
Figure 2: Market Reliability Analysis Modeling Tools
PSE’s resource adequacy model follows a 4-step process to determine the peak capacity need:
1. The GENESYS model is run for regional load curtailments
2. The load curtailments are then run through the WPCM to determine PSE’s share of the
curtailment.
3. The available Mid-C market is then adjusted by the size of the curtailment in the WPCM by hour
4. The RAM is then run for every hour for loss of load events and to find the capacity needed to
achieve a 5% LOLP.
Resource Adequacy Model Inputs
The following key updates to the RAM inputs were made since the 2019 IRP Progress Report:
1. The load forecast was updated to reflect the 2021 IRP demand forecast assumptions.
2. The hourly draws of the existing PSE wind fleet and new wind resources were based on NREL
wind data set of 250 stochastic simulations.
3. The hourly draws of existing PSE solar resources and new solar resources were based on NREL
solar data set of 250 stochastic simulations.
4. Colstrip Units 3 & 4 and Centralia were removed.
5. New resources from the 2018 RFP were added.
6. The balancing reserve requirements were updated to include new results for study years 2025
and 2030.
7. The analysis year was adjusted from 2022 in the 2019 IRP progress report to 2027 and 2031 in
the 2021 IRP
YEARS MODELED. The 2021 IRP time horizon starts in 2022, so PSE modeled a 5-year and 10-year
resource adequacy assessment. The first assessment is the 5-year assessment for the period of October
GENESYS WPCM
RAM/LOLP
(PNW Curtailments) (PSE share of the PNW Curtailments limits Mid-C market availability)
(PSE)

6
2027 – September 2028. The second assessment is the 10-year assessment for the period of October
2031 – September 2032. The modeling timeframe follows the hydro year (October – September) and
allows the full winter and summer seasons to stay intact throughout the analysis. This is consistent with
the NPCC’s GENESYS model. If the calendar year was modeled instead, it would break up the winter
season (November – February).
PSE also updated the 2023 forecasts from the 2018 NPCC Resource Adequacy Assessment in the RAM
model. Since PSE is modeling the years 2027 and 2031, the GENESYS model was updated from the
year 2023 to match the years 2027 and 2031. This was done by updating the demand forecast using the
Council’s demand escalation, updating plant retirements such as Colstrip and Centralia, and including
new resources from PSE’s portfolio (e.g. Skookumchuck and Lund Hill). The detailed updates to the
GENESYS models are discussed in the 2021 IRP, Chapter 74.
RAM is an annual model. It is run for all hours of the year studied. All of the loss of load events are then
added up for the year and accounted for in the annual modeling process. The model is set up to track
annual events to a planning margin that is applied at the system peak. Monthly or seasonal RAM metrics
are not available for this IRP but are being considered for the next IRP.
UNCERTAINTY MODELED IN RAM. The following sources of uncertainty were incorporated into
PSE’s multi-scenario RAM.
1. FORCED OUTAGE RATE FOR THERMAL UNITS. Forced outage refers to a generator failure
event, including the time required to complete the repair. The “Frequency Duration” outage
method in AURORA5 is used to model unplanned outages (forced outage) for thermal plants. The
Frequency Duration outage method allows units to fail or return to service at any time-step within
the simulation, not just at the beginning of a month or a day. The method employs all or nothing
outages for most outages, but partial outages are permitted at the beginning or end of an outage
period. The logic considers each unit’s forced outage rate and mean repair time. When the unit
has a planned maintenance schedule, the model ignores those hours in the random outage
scheduling. In other words, the hours that planned maintenance occurs is not included in the
forced outage rate.
2. HOURLY SYSTEM LOADS. Hourly system loads are modeled as an econometric function of
hourly temperature for the month, using the hourly temperature data for each of the 88
temperature years (1929-2016). The 88 temperature years matches the inputs into the
GENESYS model for consistency between the two models. The demand draws are created with
4 PSE 2021 Integrated Resource Plan, Chapter 7,
https://oohpseirp.blob.core.windows.net/media/Default/Reports/2021/Final/07.IRP21_Ch7_032921.pdf 5 A full explanation of the AURORA model and how it’s used in the IRP is included in the 2021 IRP, Appendix G,
https://oohpseirp.blob.core.windows.net/media/Default/Reports/2021/Final/Appendix/18.%20IRP21_AppG_033021.pdf.

7
stochastic outputs from PSE’s economic and demographic model and two consecutive historic
weather years to predict future weather. Each historic weather year from 1929 to 2016 is
represented in the 88 demand draws. Since the resource adequacy model examines a hydro year
from October through September, drawing two consecutive years preserves the characteristics of
each historic heating season. Additionally, the model examines adequacy in each hour of a given
future year; therefore, the model inputs are scaled to hourly demand using the load forecasting
hourly demand model.
3. MID-COLUMBIA AND BAKER HYDROPOWER. PSE’s RAM uses the same 80 hydro years,
simulation for simulation, as the GENESYS model. PSE’s Mid-Columbia purchase contracts and
PSE’s Baker River plants are further adjusted so that: 1) they are shaped to PSE load, and 2)
they account for capacity contributions across several different sustained peaking periods (a 1-
hour peak up to a 12-hour sustained peak). The 80-year hydro is estimated generation based
on historical stream flow (1929 – 2008) with current operating conditions at each hydro facility.
The Northwest Power and Conservation Council uses the stream flow data provided by BPA
through their Regulation model which accounts for the current operating conditions of the
hydro facility to estimate generation levels for each historic stream flow year. The 7,040
combinations of hydro and temperature simulations are consistent with the GENESYS model
where the hydro and temperature years are not correlated together. Each hydro draw is
matched with each load draw: 80 hydro generation draws * 88 load draws = 7,040 simulations.
4. WIND AND SOLAR. PSE models 250 unique 8,760 hourly profiles, which exhibit the typical wind
or solar generation patterns. Since wind and solar are both intermittent resources, one of the
goals in developing the generation profile for each wind and solar project considered is to ensure
that this intermittency is preserved and reflected in the analysis. The other goals are to ensure
that correlations across wind farms and the seasonality of wind and solar generation are
reflected. PSE obtained wind speed data from the National Renewable Energy Laboratory’s
(NREL’s) Wind Tool Kit database.6 Data was collected from numerous sites within a prescribed
radius around a region of interest. The wind speed data was processed with a heuristic wind
production model to generate hundreds of possible generation profiles. The 250 profiles which
aligned most closely with the average seasonal production of a given site, as determined by the
average of the entire data set, were selected for use in the RAM. Those profiles were then
correlated by measurement year. Similarly, solar irradiance data for a given region was obtained
from the National Solar Radiation Database7 and processed with the NREL System Advisory
Model to generate production profiles. The 250 solar profiles which were most closely aligned
with the annual average production, as determined by the annual average of the entire data set,
were selected for use in the RAM. The solar profiles were correlated by measurement year.
6 https://www.nrel.gov/grid/wind-toolkit.html 7 https://nsrdb.nrel.gov/

8
5. WHOLESALE MARKET PURCHASES. These inputs to the RAM are determined in the
Wholesale Purchase Curtailment Model (WPCM) as explained above. Limitations on PSE
wholesale capacity purchases resulting from regional load curtailment events (as determined in
the WPCM) utilize the same GENESYS model simulations as PSE’s RAM. The initial set of hourly
wholesale market purchases that PSE imports into its system using its long-term Mid-C
transmission rights is computed as the difference between PSE’s maximum import rights less the
amount of transmission capacity required to import generation from PSE’s Wild Horse wind plant
and PSE’s contracted shares of the Mid-C hydro plants. To reflect regional deficit conditions, this
initial set of hourly wholesale market imports was reduced on the hours when a PNW load-
curtailment event is identified in the WCPM. The final set of hourly PSE wholesale imports from
the WPCM is then used as a data input into the RAM, and PSE’s loss of load probability,
expected unserved energy, and loss of load expectation are then determined. In this fashion, the
peak capacity need determined in the RAM incorporate PSE’s wholesale market reliance risk.
Allocation Methodology The WPCM then uses a multi-step approach to “allocate” the regional capacity deficiency among the
region’s individual utilities. These individual capacity shortages are reflected via a reduction in each
utility’s forecasted level of wholesale market purchases. In essence, on an hourly basis, the WPCM
portion of the resource adequacy analysis translates a regional load-curtailment event into a reduction in
PSE’s wholesale market purchases. In some cases, reductions in PSE’s initial desired volume of
wholesale market purchases could trigger a load-curtailment event in the LOLP portion of RAM.
It should be noted that in actual operations, no central coordinating entity in the PNW is charged with
allocating scarce supplies of energy and capacity to individual utilities during regional load-curtailment
events. This is for planning purposes only.
FORWARD MARKET ALLOCATIONS. The model assumes that each of the five large8 buyers purchase
a portion of their base capacity deficit in the forward wholesale markets. Under most scenarios, each
utility is able to purchase their target amount of capacity in these markets. This reduces the amount of
remaining capacity available for purchase in the spot markets. If the wholesale market does not have
enough capacity to satisfy all of the forward purchase targets, those purchases are reduced on a pro-rata
basis based upon each utility’s initial target purchase amount.
SPOT MARKET ALLOCATIONS. For spot market capacity allocation, each of the five large utility
purchasers is assumed to have equal access to the PNW wholesale spot markets, including available
imports from California. The spot market capacity allocation is not based on a straight pro-rata allocation,
because in actual operations the largest purchaser (which is usually PSE) would not be guaranteed
8 The utilities include PSE, Portland General Electric (PGE), PacifiCorp, Avista, and Idaho Power.

9
automatic access to a fixed percentage of its capacity need. Instead, all of the large purchasers would be
attempting to locate and purchase scarce capacity from the exact same sources. Under deficit conditions,
the largest of the purchasers would tend to experience the biggest MW shortfalls between what they need
to buy and what they can actually buy. This situation is particularly true for small to mid-sized regional
curtailments where the smaller purchasers may be able to fill 100 percent of their capacity needs but the
larger purchasers cannot.
Below is the calculation for the available Mid-C market:
Available Mid-C market = Available transmission – Wild Horse – (Mid-C hydro + spinning
reserves) – curtailment from WPCM
The available transmission is 2,031 MW and a full breakdown of the contracts is included in the 2021 IRP,
Appendix D9. Wild Horse, Mid-C hydro, reserves, and curtailment are all calculated on an hourly basis, so
this number is changing each hour.
Results of the Resource Adequacy Model
Figure 3 summarizes the resulting metrics when the LOLP meets the 5 percent standard. The Base
System represents the current PSE resource portfolio without any new resources. RAM determined that
907 MW of perfect capacity is needed in the year 2027 to meet the 5 percent LOLP and 1,361 MW in
2031.
Figure 3: Reliability Metrics at 5% LOLP for 2027
Metric Base System –
no added resources System at 5% LOLP –
add 907 MW
LOLP 68.84% 4.99%
EUE 5,059 MWh 430 MWh
LOLH 11.06 hours/year 0.83 hours/year
LOLE 12.58 days/year 0.12 days/year
LOLEV 2.49 events/year 0.14 events/year
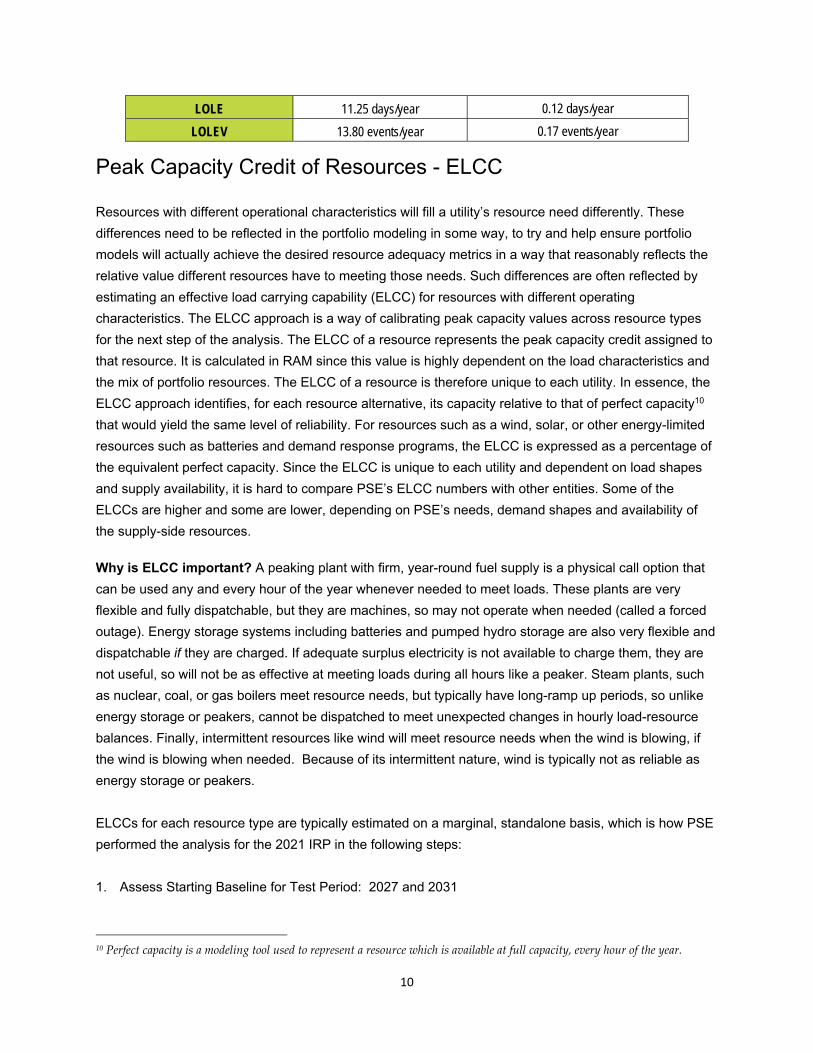
Reliability Metrics at 5% LOLP for 2031
Metric Base System –
no added resources System at 5% LOLP –
add 1361 MW
LOLP 98.45% 5.00%
EUE 19,243 MWh 419 MWh
LOLH 51.90 hours/year 0.86 hours/year
9 PSE 2021 Integrated Resource Plan, Appendix D,
https://oohpseirp.blob.core.windows.net/media/Default/Reports/2021/Final/Appendix/15.%20IRP21_AppD_031821B.pdf
10
LOLE 11.25 days/year 0.12 days/year
LOLEV 13.80 events/year 0.17 events/year
Peak Capacity Credit of Resources - ELCC
Resources with different operational characteristics will fill a utility’s resource need differently. These
differences need to be reflected in the portfolio modeling in some way, to try and help ensure portfolio
models will actually achieve the desired resource adequacy metrics in a way that reasonably reflects the
relative value different resources have to meeting those needs. Such differences are often reflected by
estimating an effective load carrying capability (ELCC) for resources with different operating
characteristics. The ELCC approach is a way of calibrating peak capacity values across resource types
for the next step of the analysis. The ELCC of a resource represents the peak capacity credit assigned to
that resource. It is calculated in RAM since this value is highly dependent on the load characteristics and
the mix of portfolio resources. The ELCC of a resource is therefore unique to each utility. In essence, the
ELCC approach identifies, for each resource alternative, its capacity relative to that of perfect capacity10
that would yield the same level of reliability. For resources such as a wind, solar, or other energy-limited
resources such as batteries and demand response programs, the ELCC is expressed as a percentage of
the equivalent perfect capacity. Since the ELCC is unique to each utility and dependent on load shapes
and supply availability, it is hard to compare PSE’s ELCC numbers with other entities. Some of the
ELCCs are higher and some are lower, depending on PSE’s needs, demand shapes and availability of
the supply-side resources.
Why is ELCC important? A peaking plant with firm, year-round fuel supply is a physical call option that
can be used any and every hour of the year whenever needed to meet loads. These plants are very
flexible and fully dispatchable, but they are machines, so may not operate when needed (called a forced
outage). Energy storage systems including batteries and pumped hydro storage are also very flexible and
dispatchable if they are charged. If adequate surplus electricity is not available to charge them, they are
not useful, so will not be as effective at meeting loads during all hours like a peaker. Steam plants, such
as nuclear, coal, or gas boilers meet resource needs, but typically have long-ramp up periods, so unlike
energy storage or peakers, cannot be dispatched to meet unexpected changes in hourly load-resource
balances. Finally, intermittent resources like wind will meet resource needs when the wind is blowing, if
the wind is blowing when needed. Because of its intermittent nature, wind is typically not as reliable as
energy storage or peakers.
ELCCs for each resource type are typically estimated on a marginal, standalone basis, which is how PSE
performed the analysis for the 2021 IRP in the following steps:
1. Assess Starting Baseline for Test Period: 2027 and 2031
10 Perfect capacity is a modeling tool used to represent a resource which is available at full capacity, every hour of the year.

11
2. Balance Portfolio to 5% LOLP with perfect capacity: 907 MW needed in 2027 and 1,361 MW in 2031
(results above).
3. Add a new resource to the resource adequacy model and then recalculate the need for perfect
capacity
4. Take the change in need from the baseline portfolio and the new portfolio with the resource added
and divide by the size of the new resource.
Example Calculation. ELCC = –(Need2 – Need1)/Change
1. Base case need = 500 MW 2. Add 100 MW nameplate renewable, New need = 475 MW
a. The perfect capacity is reduced to 475 to maintain the 5% LOLP 3. ELCC = –(475 MW – 500 MW)/100 MW = 25%
The full set of ELCC’s are represented in Figure 4. The ELCC of new generic resources were assessed
as an incremental add to the existing portfolio which includes Existing Wind (Hopkins Ridge, Wild Horse,
Lower Snake River 1, and Klondike III), Skookumchuck Wind, Lund Hill Solar, Golden Hills Wind, and
Clearwater Wind.
Figure 4: Effective Load Carrying Capability for model years 2027 and 2031
Capacity (MW) ELCC Year 2027
ELCC Year 2031
WIND AND SOLAR RESOURCES
Existing Wind 823 9.6% 11.2%
Skookumchuck Wind 131 29.9% 32.8%
Lund Hill Solar 150 8.3% 7.5%
Golden Hills Wind 200 60.5% 56.3%
Clearwater Wind (Generic MT East Wind1) 350 41.4% 45.8%
Generic MT East Wind2 200 21.8% 23.9%
Generic MT Central Wind 200 30.1% 31.3%
Generic WY East Wind 400 40.0% 41.1%
Generic WY West Wind 400 27.6% 29.4%
Generic ID Wind 400 24.2% 27.4%
Generic Offshore Wind 100 48.4% 46.6%
Generic WA East Wind 100 17.8% 15.4%
Generic WY East Solar 400 6.3% 5.4%
Generic WY West Solar 400 6.0% 5.8%
Generic ID Solar 400 3.4% 4.3%
Generic WA East Solar 100 4.0% 3.6%

12
Capacity (MW) ELCC Year
2027 ELCC Year
2031
WIND AND SOLAR RESOURCES
Generic WA West Solar – Utility-scale 100 1.2% 1.8%
Generic WA West Solar – DER Roof 100 1.6% 2.4%
Generic WA West Solar – DER Ground 100 1.2% 1.8%
BATTERY STORAGE
Lithium-ion, 2-hr, 82% RT efficiency 100 12.4% 15.8%
Lithium-ion, 4-hr, 87% RT efficiency 100 24.8% 29.8%
Flow, 4-hr, 73% RT efficiency 100 22.2% 27.4%
Flow, 6-hr, 73% RT efficiency 100 29.8% 35.6%
Pumped Storage, 8-hr, 80% RT efficiency 100 37.2% 43.8%
RENEWABLE + STORAGE HYDRID RESOURCE
Generic WA Solar, lithium-ion, 25MW/50MWh, 82% RT efficiency 100 14.4% 15.4%
Generic WA Wind, lithium-ion, 25MW/50MWh, 82% RT efficiency 100 23.6% 23.0%
Generic MT East Wind2, pumped storage, 8-hr, 80% RT efficiency
200 54.3% 57.7%
DEMAND RESPONSE
Demand Response, 3-hr duration, 6-hr delay, 10 calls per year
100 26.0% 31.6%
Demand Response, 4-hr duration, 6-hr delay, 10 calls per year
100 32.0% 37.4%
It is critical to recognize that marginal ELCCs are dependent on the loads and existing resources being
used in the analysis. As “marginal” ELCCs, PSE is calculating how much each resource type contributes
the very last bit of resource need. The larger, longer duration outages have all been covered by perfect
resources. That is, underlying all this analysis, we start with the assumption that 907 MW of perfect
capacity resources were actually in the portfolio that do not actually exist. As peakers are the closest
supply-side resource to perfect capacity, we are basically assuming if we had an additional 907 MW of
peakers available in all hours, how many battery resources would we need to fill that last 50 MW of need?
Of course, that implies PSE will have additional dispatchable resources that create surpluses in many
hours available to charge the batteries that we don’t really have. If we calculated the ELCC of batteries or
other resources to fill the entire 907 MW, the results would be vastly different.
This highlights an important limitation to using ELCCs of any kind: they are “state dependent”. For
example, PSE calculates saturation curves that show adding more and more wind in the same location
reduces the ELCC of the resource. The same condition holds for various combinations of resources.

13
Applying marginal11 ELCCs is good for small scale decisions, like the next plant. With large resource
gaps, though, if significant amounts of resources are added that do not mimic “perfect” resources, the
portfolio may fall short of the targeted 5% LOLP target.
If ELCCs are state dependent, why not just do all this analysis within the portfolio model? Resource
adequacy modeling is very complex as is portfolio modeling. At this time, it is not possible to combine
robust modeling of both aspects simultaneously, so the analyses must be done sequentially. It is
generally desirable to run a candidate resource portfolio through the RAM after applying the planning
reserve margin and marginal ELCCs in the portfolio modeling process, to make sure the portfolio is still
achieving the targeted LOLP. PSE has performed this iteration in prior IRPs and found resource plans
achieved the targeted 5% LOLP. In the 2021 IRP, PSE did not run all 42 portfolio sensitivities through the
RAM. The number of sensitivities performed in response to stakeholder requests made such an endeavor
infeasible. However, PSE does plan to model resources selected for Phase 2 of the 2021 All Source RFP
through the RAM model to measure their impact on portfolio resource adequacy.
The ELCC value of any resource, however, is also dependent on the reliability metric being used for
evaluating the peak contribution of that resource. This is a function of the characteristics of the resource
being evaluated, and more importantly, what each of the reliability metrics is counting. For example, a
variable energy resource such as wind or solar with unlimited energy may show different ELCC values
depending on which reliability metric is being used – LOLP or EUE. LOLP measures the likelihood of any
deficit event for all draws, but it ignores the number of times that the deficit events occur within each
draw, and it ignores the duration and magnitude of the deficit events. EUE sums up all deficit MW-hours
across events and draws inclusive of their duration and frequency, expressed as average over the
number of draws. In this study, we utilize LOLP as the reliability metric in estimating the ELCC of wind,
solar and market purchases. However, we use EUE to determine the ELCC of energy-limited resources
such as batteries and demand response, because LOLP is not able to distinguish the ELCC of batteries
and demand response programs with different durations and call frequencies.
LOSS OF LOAD EVENTS. A loss of load event can be caused by many factors, which may include
temperature, demand, hydro conditions, plant forced outages and variation in wind and solar generation.
All of the factors are modeled as stochastic inputs simulated for 7,040 iterations. Figure 5 is a 12x24 table
of the loss of load hours. The plot represents a relative heat map of the number of hours of lost load
summed by month and hour of day. The majority of the lost load hours occur in the winter months. From
this chart, we can see long durations, 24 hours or more, with a loss of load event.
11 “Marginal” typically means infinitesimally small changes.

14
Figure 5: Loss of Load Hours for 2027 and 2031
PSE’s winter peak has notably different characteristics than a summer peak in other parts of the Western
Interconnect. Summer peaking events occur in the late afternoon/evening when the day is the hottest and
only last a few hours in the evening. Energy storage is a good solution for summer peaking events. In
contrast, winter events can last several days at a time and temperatures can drop low during the night
and stay low throughout the day. Since energy storage is a short duration resource that has a low peak
capacity credit in PSE’s portfolio, it is not a good fit for winter peaks. With lower peak capacity credit,
more energy storage resources are needed to replace the new peaking capacity added in the portfolio.
STORAGE CAPACITY CREDIT. The estimated peak contribution of lithium-ion and flow batteries, as well
as pumped hydro storage were modelled in RAM. Both batteries modeled can be charged or discharged
at a maximum of 100 MW per hour up to two, four or six hours duration when the battery is fully charged.
For example, a four-hour duration, 100 MW battery can produce 400 MWh of energy continuously over
four hours. Thus, the battery is energy limited. The battery can be charged up to its maximum charge rate
per hour only when there are no system outages. The battery can be discharged up to its maximum
discharge rate or just the amount of system outage (adjusted for its round-trip [RT] efficiency rating) as
long as there is a system outage and the battery is not empty.
Why use EUE for energy limited resources? The LOLP is not able to distinguish the impacts of storage
resources on system outages since it counts only draws with any outage event but not the magnitude,
duration and frequency of events within each draw. This is important when determining the size of energy
storage needed to maintain reliability. Because of this, the ELCC of batteries is estimated using the
expected unserved energy (EUE) metric, in addition to LOLP. The analysis starts from a portfolio of
resources that achieves a 5 percent LOLP, then the EUE from that portfolio is calculated. Each of the
storage resources is then added to the portfolio, which leads to lower EUE. The amount of perfect
Hour Ending Jan Feb Mar Apr May Jun Jul Aug Sep Oct Nov Dec
1:00
2:00
3:00
4:00
5:00
6:00
7:00
8:00
9:00
10:00
11:00
12:00
13:00
14:00
15:00
16:00
17:00
18:00
19:00
20:00
21:00
22:00
23:00
24:00
2027 CaseHour Ending Jan Feb Mar Apr May Jun Jul Aug Sep Oct Nov Dec
1:00
2:00
3:00
4:00
5:00
6:00
7:00
8:00
9:00
10:00
11:00
12:00
13:00
14:00
15:00
16:00
17:00
18:00
19:00
20:00
21:00
22:00
23:00
24:00
2031 Case

15
capacity taken out of the portfolio to achieve an EUE at 5 percent LOLP, divided by the peak capacity of
the storage resource added, determines the ELCC, or peak capacity credit of the storage resource.
Example Calculation.
1. Start with the base case need
Base Need = 907 MW, LOLP = 4.99%, EUE = 429.93 MWh
2. Add new resource to model. For this example, we are using a 100 MW nameplate 6 hr flow
battery
3. Add perfect capacity to model until achieve equivalent EUE from Base Need.
New Need = 876.8 MW, LOLP = 3.97%, EUE = 429.6 MWh
4. Calculate ELCC by taking the new need minus the base need divided by the nameplate capacity.
ELCC = –(876.8 MW – 906.6 MW)/100 MW = 29.8%
From this example, in order to achieve the same EUE as the base model, the LOLP is lower than 5%.
The estimated peak contribution of storage resources in PSE’s RAM is shown in Figure 6.
Figure 6: Peak Capacity Credit for Battery Storage Based on EUE at 5% LOLP
BATTERY STORAGE Capacity (MW)
Peak Capacity Credit
Year 2027
Peak Capacity Credit
Year 2031
Lithium-ion, 2-hr, 82% RT efficiency 100 12.4% 15.8%
Lithium-ion, 4-hr, 87% RT efficiency 100 24.8% 29.8%
Flow, 4-hr, 73% RT efficiency 100 22.2% 27.4%
Flow, 6-hr, 73% RT efficiency 100 29.8% 35.6%
Pumped Storage, 8-hr, 80% RT efficiency
100 37.2% 43.8%
As mentioned above, ELCCs are unique to each utility and dependent on load shapes and supply
availability. PSE’s winter peak makes its situation different than other parts of the western interconnect
that have a summer peak. Summer peaking events are focused in the late afternoon/evening when the
day is the hottest and only last a few hours in the evening, which makes energy storage an ideal solution.

16
However, a winter event can last several days at a time and temperatures can drop low during the night
and stay low throughout the day. As shown in Figures 5 above, loss of load events can have extended
durations of 24 hours or more. Since energy storage resources generally have a short discharge period
(from 2 to at most 8 hours), they have little to contribute during extended events.
Pumped Storage Hydro Analysis. PSE tested several operational parameters for the pumped storage
hydro resource. The assumption for the generic pumped storage hydro in the 2021 IRP was for a
minimum operating range of 11.5% of nameplate capacity. Given the newer technology, the pumped
storage hydro can operate at full 100% range (i.e. 0% minimum), so PSE tested the increased operating
range to see if that would change the ELCC. Figure 7 below shows the ELCC for each scenario which
shows a slight increase in the ELCC of pumped storage hydro with a 100% range of operation.
Figure 7: Pumped Storage Hydro ELCC comparison
BATTERY STORAGE Capacity (MW)
Peak Capacity Credit
Year 2027
Peak Capacity Credit
Year 2031
Pumped Storage Hydro, 11.5% minimum 100 37.2% 43.8%
Pumped Storage Hydro, 0% minimum 100 39.0% 45.8%
3. RFP Modeling In the 2021 All Source RFP, PSE will use the ELCC values consistent with the 2021 IRP methodology for
the quantitative evaluation in the Phase 1 and Phase 2 of the RFP evaluation.
Phase 1 Quantitative Analysis. The Phase 1 quantitative analysis will approximate the ELCC value of
each proposed RFP resource using the ELCC value of a comparable generic resource from PSE’s 2021
IRP analysis. Based on their technology and location, resources in the RFP will be classified into
subgroups that align with the 2021 IRP generic resource categories listed in Figure 5 and Figure 6. For
example, Washington wind will be classified in a WA Wind subgroup with the WA wind generic ELCC,
and another wind resource located in eastern Montana would be classified in a separate eastern MT
Wind subgroup. Other RFP resource-specific characteristics, such as point of delivery, firmness of
delivery, seasonality and generation profile, will be checked for comparability within the subgroups.
Variable energy resources (“VERs”) such as wind and solar delivered to the Mid-C transmission that PSE
is making available for the RFP will not receive a capacity credit. This is because PSE’s market reliance
17
need is specifically tied to reliability concerns with the firmness of supply at the Mid-C market hub. And
since standalone VERs are non-firm resources that cannot guarantee firm supply during peaking events,
no capacity credit will be given to those resources. However, VERs with an ability to shape supply will
receive a capacity credit.
A few examples may help illustrate why unshaped VERs delivering to Mid-C will not receive a capacity
credit. In 2019, February 5th to 7th, an unexpected cold weather event occurred in the region. During this
event wind generation over those three days averaged just 5 MW from PSE’s approximately 800 MW of
wind capacity. Another example of wind generation failing to deliver reliably was during a hot weather
event that occurred August 15th to 17th in 2020. In this instance, out of PSE’s entire wind portfolio, only an
average of 61 MW could be delivered over those three days.
Pairing non-firm VER resources with firm transmission to address market reliance is inconsistent with the
objective to reduce uncertainty of energy delivered on Mid-C BPA transmission during peaking events.
Resources delivered to COB/Malin or COB/John Day in winter months for use of the California Oregon
Interchange (COI) transmission will also not receive a capacity credit. This is because PSE is in a
seasonal exchange with PG&E. The exchange volumes will utilize the COI transmission during winter
months for up to 300 MW for a total of 413,000 MWh, and PSE will not guarantee acceptance of delivery
during those months. PSE may have availability, however, on the COI during winter months on a day-
ahead basis.
The generation profiles of resources (8760 schedule) will be graphed, analyzed and compared to verify
general consistency with the associated generic resource assumption. If PSE identifies a proposal that
significantly differs from the associated generic assumption, and the bidder provides independently
verified third‐party support for their generation output profile, PSE would take that into consideration in
its analysis. If a bidder cannot provide this support, the generic ELCC assumption will be used. The All‐
Source RFP requires a minimum of one year of wind resource or solar irradiance data.
Adjustment will be also made for firmness of delivery or seasonality of offer. For example, if a resource
can only secure partial or seasonal firm transmission of the full offered nameplate, the ELCC will be
adjusted proportionally.
At the end of Phase 1, PSE intends to select a candidate pool of resources for portfolio optimization
analysis that represent the best‐performing proposals from different resource types and technologies to
test the performance of combinations of resources toward achieving a lowest reasonable cost portfolio.
This means that the ELCC values of one resource type compared to another is less important in Phase 1

18
because PSE will select a representative sampling of resources for further consideration, subject to
meeting the minimum criteria defined in the All‐Source RFP.
Phase 2 Quantitative Analysis. The Phase 2 quantitative analysis will be based on resource‐specific
ELCC values calculated for each Phase 2 resource. An individual project’s ELCC will vary based on
further due diligence and analysis of a variety of factors, including:
Exact location of the resource,
Verified generation shape (8760),
Ability to dispatch,
Duration of output,
Availability of firm delivery to PSE’s load center,
Demonstrated firm fuel supply for biomass,
Demonstrated ability to charge during a loss of load event for storage,
Other resource-specific operational characteristics
At the end of Phase 2, PSE will also run a portfolio ELCC for the shortlisted resources to assess the
correlations of the resource mix and whether the shortlisted resources sufficiently meet the capacity need.
4. Climate Change Analysis In the 2021 IRP, PSE evaluated temperature variations that increased the summer loss of load events.
This temperature sensitivity is one model of possible weather changes and provides a preliminary view of
a possible impact of warming temperatures as a result of climate change. The lessons learned from this
sensitivity are useful as PSE plans for future resource adequacy analyses, but limited conclusions can be
made from it to inform the preferred portfolio. Since this was a preliminary view, information was missing
in this analysis, including impacts to the conservation potential assessment, hydro stream flow data, and
extreme weather conditions. In addition, the resource adequacy model is set up to take 88 load draws,
but the climate change data that PSE used from the Northwest Power and Conservation Council for this
temperature sensitivity only contained 10 years of forward looking data. The 10 years of weather from the
three models was repeated almost three times and coupled with 88 economic and demographic draws to
create 88 future hourly loads for the RA model. This mirrors the methodology used in the NPCC resource
adequacy analysis. The forward looking 10 years are a forecast of weather trends, but repeats weather
patterns. This coupled with repeating years for the load draws results in a very limited view of possible
extreme weather conditions. The purpose of the resource adequacy model is to look at possible “what if”
scenarios - and that includes extreme weather events. By having a data set with a limited view and

19
repeating patterns, we are unsure if the results of the resource adequacy model are reasonable. Details
of the analysis are provided in the 2021 IRP, Chapter 6 for the load forecast, Chapter 7 for the resource
adequacy analysis, and portfolio results are presented in Chapter 8.
PSE will continue to model weather trends under different scenarios to better understand how summer
extreme events can affect resource adequacy, but also to ensure that PSE continues to plan for winter
extreme events. While average temperatures may be increasing over time due to climate change,
extreme events (both hot and cold) may still occur. Further climate change modeling is needed beyond
what was conducted in the temperature sensitivity to drive future resource planning changes.
PSE is committed to continuing this work for the 2023 IRP Progress Report. The current schedule
anticipates an updated load forecast and resource adequacy analysis that will be finished in mid-2022 to
inform Phase 2 of the RFP process. The resulting CPA and portfolio analysis will be included in the 2023
IRP Progress Report. Future changes to the resource adequacy analysis will include both winter and
summer resource adequacy analyses, and PSE will also work to develop a winter and summer peak
capacity credit to understand how different resources can contribute to both needs.
5. Additional Questions Stand-alone Storage
1. Are PSE’s Resource Adequacy modeling assumptions and resulting Effective Load Carrying
Contribution (ELCC) Values for Stand-Alone Energy Storage reasonable?
2. Are PSE’s constraints on the charging and discharging limitations of a stand-alone energy
storage resource reasonable?
3. Do PSE’s assumptions unreasonably limit the capability of stand-alone energy storage to charge,
limiting their ability to provide capacity in high loss-of-load winter periods?
Pumped Storage Hydro
1. It is unreasonable for PSE to limit pumped storage resources’ operating range (or “state of
charge”) to 70% of the resource’s storage capacity
2. Does this deflate PSH ELCC values?
Hybrid Resources
1. Does PSE unreasonably limit hybrid resources by only allowing them to charge from renewables
over the entire lifecycle of the resource, undervaluing these resources’ capacity and ancillary
services contributions?

20
Market Limitation
1. Does the reduction in availability of market purchases in PSE’s IRP artificially constrain the ability
of storage resources (including battery and pumped hydro storage) to meet PSE’s capacity
needs?
2. Does the IRP impose a 1000 MW market import limitation across the full 24-hour window on all
days in January and February instead of only during “super-peak” and “heavy-load” hours?
3. Do PSE’s modeling assumptions fail to reflect expected system conditions and create artificial
conditions where storage resources do not have enough energy to charge during off-peak hours,
thereby reducing their capacity contribution and availability to dispatch when PSE’s needs are the
highest?
4. How does PSE’s analysis reflect transmission constraints? Does PSE’s analytical process
unreasonably constrain regional transmission import limits?
5. Does PSE make the following inaccurate assumptions?
a. Loss of load events are consistently 24-hours in key winter months by 2027
b. There is 1,000 MW (or less) of Mid-C capacity (wholesale purchases) assumed to be
available in key winter months by 2027, thereby making less energy available for
charging storage resources
c. Only existing supply and any available Mid-C import capacity will be available for the
energy storage to charge from, thereby excluding the possibility of storage charging from
another market such as the California Independent System Operator (“CAISO”).
Two-hour vs four-hour Battery
1. Are the ELCCs assigned for “Li-ion – 2-hour” (12.4% ELCC) and “Li-ion – 4-hour” (24.8% ELCC)
overly conservative, considering that the resources are “stand-alone” and charging and
discharging schedules will not be constrained by a co-located renewable generation resource?
2. Should such constraints be considered purely from a system perspective – not on limitations of
charging and discharging to meet minimum ITC / PTC thresholds – and not result in a generic de-
rate of ELCC across the board?
3. Does PSE’s IRP portfolio modeling preference for two-hour batter storage conflict with the
industry-standard four-hour battery?
Depth of Discharge
1. Is the Company’s limitation on these storage resources’ depth of discharge (DoD) overly
conservative? Is a DoD value of up to 90% of the discharge capacity in ELCC modeling for the
winter peak months more reasonable, in order to allow for maximum discharge during the super-
peak hours?

21
2. In comparison to the 2020 assumptions utilized by PSE, these values are lower by 6.6% and
13.2%, respectively. What changed between the cases utilized in 2020 and amended in 2021 that
resulted in this decrease in the assessed ELCC of energy storage?
Other
1. Are PSE’s ELCC estimates inclusive of the possibility of forced outages during a peak event? If
forced outages were included, then the ELCC valuations for thermal resources could not be the
100 percent valuations shown on Figure 4 [of the 2021 All Source RFP document].
2. How did the temperature sensitivity scenario in the 2021 IRP impact PSE’s resource plan?
6. Timeline for updates The Resource Adequacy workshop (also called the “ELCC workshop”) will be held on August 31, 2021.
PSE has arranged for an independent consulting firm to review its RA modeling framework. The
consultant will share its observations and recommendations with PSE and stakeholders at the ELCC
workshop. PSE will review the consultant’s feedback and determine what updates, if any, should be made
to its RA analysis. PSE will also accept written comments from stakeholders in September 2021 following
the ELCC workshop, and intends to respond to stakeholder comments prior to incorporating any potential
updates into the ELCC values that will be used in Phase 2 of the All-Source RFP. Depending on the
recommendations and the feedback received, the process is expected to take several months. PSE
would use any updates it incorporates into its ELCCs in its Phase 2 analysis of the All-Source RFP bids.
More information about the comment and response process and schedule will be provided at the ELCC
workshop and on the All-Source RFP web site (www.pse.com/rfp) after the event.12
12 For updates associated with the ELCC workshop, refer to the “2021 RFP Bidders’ Conference and Stakeholder Workshops”
section of the RFP web site (www.pse.com/rfp). The site is updated on an ongoing basis as more information becomes available.