resource evaluation report mnp petroleum corporation...
TRANSCRIPT
Resource Evaluation Report MNP Petroleum Corporation Concessions
In Tajikistan
Effective Date: January 10, 2014
Prepared According To National Instrument 51-101
Prepared on Behalf of: MNP Petroleum Corporation and DWM Petroleum AG
Submitted By:
Independent Qualified Reserves Evaluators
Resource Evaluation Report MNP Petroleum Corporation Concessions
In Tajikistan
Effective Date: January 10, 2014
Prepared According To National Instrument 51-101
Prepared on Behalf of: MNP Petroleum Corporation and DWM Petroleum AG
Letha C. Lencioni Registered Petroleum Engineer
State of Colorado #29506
Independent Qualified Reserves Evaluators
1/10/2014 1 Gustavson Associates
1. EXECUTIVE SUMMARY
Gustavson Associates LLC (the Consultant) has been retained by MNP Petroleum Corporation
(the Client) to prepare a Probabilistic Resource Analysis Report that complies with Canada’s
National Instrument 51-101, Standards for Disclosure of Oil and Gas Activities (NI 51-101)
regarding an exploratory oil and gas project located in the southwestern part of Asia in the
country of Tajikistan. This Report is limited to a report on the potential undiscovered
Prospective and Contingent oil resources underlying the license areas and includes an economic
analysis of hypothetical exploration and development of each of the 11 identified prospects and
leads. This report is an update of the NI 51-101 report with an effective date of May 10, 2011
prepared on behalf of Santos Limited, Santos International Ventures Pty Ltd, Santos
International Pty Ltd, MNP Petroleum Corporation and DWM Petroleum AG. The Santos
interest has been reverted to DWM and the interests in the Kyrgyzstan licenses have been
dropped.
The subject oil and gas project is owned by Closed Joint Stock Company (CJSC) Somon Oil
Company (Somon Oil). Ninety percent (90%) of Somon Oil is owned by DWM Petroleum AG
(“DWM”), a Swiss company wholly-owned by the Client, a United States company, founded in
2004. Through its subsidiaries and partnerships, MNP has active projects in Tajikistan, and
Mongolia and in Albania it has equity interest in the listed company Petromanas Energy Inc. In
this report, unless otherwise specified, the term "MNP" means MNP Petroleum Corporation and
DWM Petroleum AG.
Tajikistan is located in Central Asia bounded by Kyrgyzstan to the north and China to the east,
Pakistan and Afghanistan to the south and Uzbekistan to the west. The subject area for this report
includes approximately 3,719 square kilometers (918,985 acres) located on the edges of the
Fergana Basin a recognized oil and gas producing area in southwestern Asia. The exploration
permit areas include the Western or NOK Permit containing 1,227 square kilometers (303,198
acres) and the North-West Permit that contains 2,492 square kilometers (615,787 acres) that are
subject to a Production Sharing Contract (PSC) with the Tajikistan government.
1/10/2014 2 Gustavson Associates
The plays described in this report include potential conventional exploration targets involving
fault and structurally trapped reservoirs that may contain both oil and gas hydrocarbon
accumulations.
The primary exploration targets are anticipated to be stacked sandstone and carbonate reservoirs.
Current and past production in these prospective reservoirs has been established in multiple
analogous fields including Niyazbek – North Karachikum, North Soh, Mingbulak, Mahram and
Tergachi.
Currently, the available data includes 1,376 line kilometers (855 line miles) of existing 2D
seismic coverage over the permit blocks and an extensive database containing 550 wells that
have been drilled in the area. The seismic data interpretation indicates that there are numerous
potential structures, which would be favorable for the accumulation of oil and gas. The
methodology used by Danubian Energy Consulting on behalf of MNP is the application of
industry standard techniques used for exploration based on the available interpreted seismic data
and the use of analogous past and currently producing fields in the area. This work was audited
by Gustavson Associates and found to be reasonable with a few minor adjustments. The resource
estimates are based on Gustavson’s estimates of the potential reservoir areas.
The hydrocarbon type that would most likely occur in these reservoirs is oil with some
associated gas. It is expected that the oil will be sweet and have an API gravity in the range of 30
to 42 degrees.
The Permits are currently under an Exploration License with a Production Sharing Agreement
that would govern the Permit areas in the event of a discovery and production.
The play concepts include acreage that would be considered exploratory and carry with them the
associated risks of success. A probabilistic resource estimate has been prepared for 11 prospects
and leads identified by MNP within the Permit areas.
The resources in this report are categorized as Contingent and Prospective resources. The North
Mahram prospect is considered to be a Contingent Resource because the area is interpreted to be
1/10/2014 3 Gustavson Associates
on the same structure as Mahram Field and the 10 other prospects are considered to be
Prospective Resources.
Contingent Resources are defined as follows1:
“Contingent resources are defined as those quantities of petroleum estimated as
of a given date to be potentially recoverable from known accumulations using
established technology or technology under development, but are not currently
considered to be commercially recoverable due to one or more contingencies.
Contingencies may include factors such as economic, legal, environmental,
political, and regulatory matters or a lack of markets. It is also appropriate to
classify as contingent resources the estimated discovered recoverable quantities
associated with a project in the early evaluation stage.”
The North Mahram prospect is located on the same structure but fault separated from the
Mahram Field which has produced approximately 800 MBO (Thousands of Barrels of Oil). The
contingencies associated with the North Mahram resource estimates are that large expenditures
associated with the drilling and completion of wells are required to establish with confidence the
commerciality of future development, develop the resources and get the oil to market.
Prospective Resources are defined as follows2:
“Prospective Resources are those quantities of petroleum estimated, as of a
given date, to be potentially recoverable from undiscovered accumulations by
application of future development projects. Prospective resources have both an
associated chance of discovery and a chance of development.”
1 Canadian Oil and Gas Evaluation Handbook, Volume 1, Section 5 Society of Petroleum Evaluation Engineers (Calgary Chapter) and Canadian Institute of Mining, Metallurgy & Petroleum (Petroleum Society), September 1, 2007, 5-6. 2 Canadian Oil and Gas Evaluation Handbook, Volume 1, Section 5, Society of Petroleum Evaluation Engineers (Calgary Chapter) and Canadian Institute of Mining, Metallurgy & Petroleum (Petroleum Society), September 1, 2007, 5-7.
1/10/2014 4 Gustavson Associates
The Low Estimate column represents the P90 values from the probabilistic analysis (in
other words, the value is greater than or equal to the P90 value 90% of the time), while the Best
Estimate represents the P50 and the High Estimate represents the P103.
Based on the analog fields, it has been assumed that the prospects, if discovered, will contain
multiple, stacked oil with associated gas reservoirs.
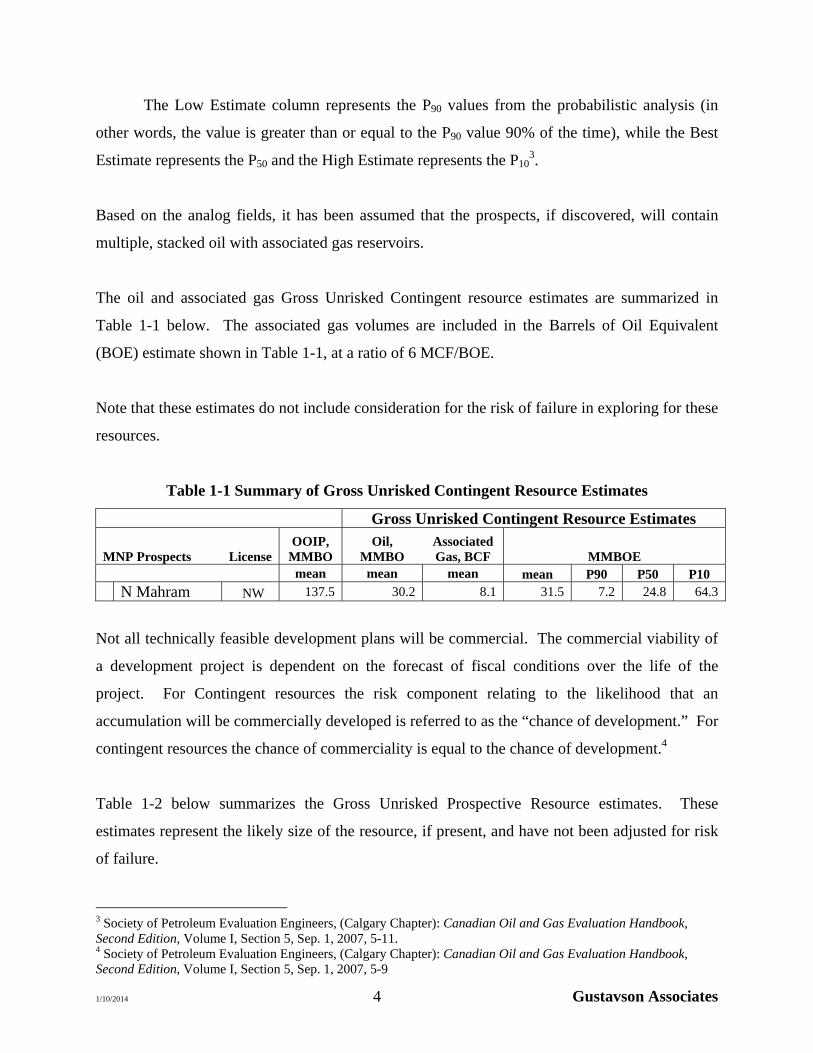
The oil and associated gas Gross Unrisked Contingent resource estimates are summarized in
Table 1-1 below. The associated gas volumes are included in the Barrels of Oil Equivalent
(BOE) estimate shown in Table 1-1, at a ratio of 6 MCF/BOE.
Note that these estimates do not include consideration for the risk of failure in exploring for these
resources.
Table 1-1 Summary of Gross Unrisked Contingent Resource Estimates
Gross Unrisked Contingent Resource Estimates
MNP Prospects License OOIP,
MMBO Oil,
MMBO Associated Gas, BCF MMBOE
mean mean mean mean P90 P50 P10 N Mahram NW 137.5 30.2 8.1 31.5 7.2 24.8 64.3
Not all technically feasible development plans will be commercial. The commercial viability of
a development project is dependent on the forecast of fiscal conditions over the life of the
project. For Contingent resources the risk component relating to the likelihood that an
accumulation will be commercially developed is referred to as the “chance of development.” For
contingent resources the chance of commerciality is equal to the chance of development.4
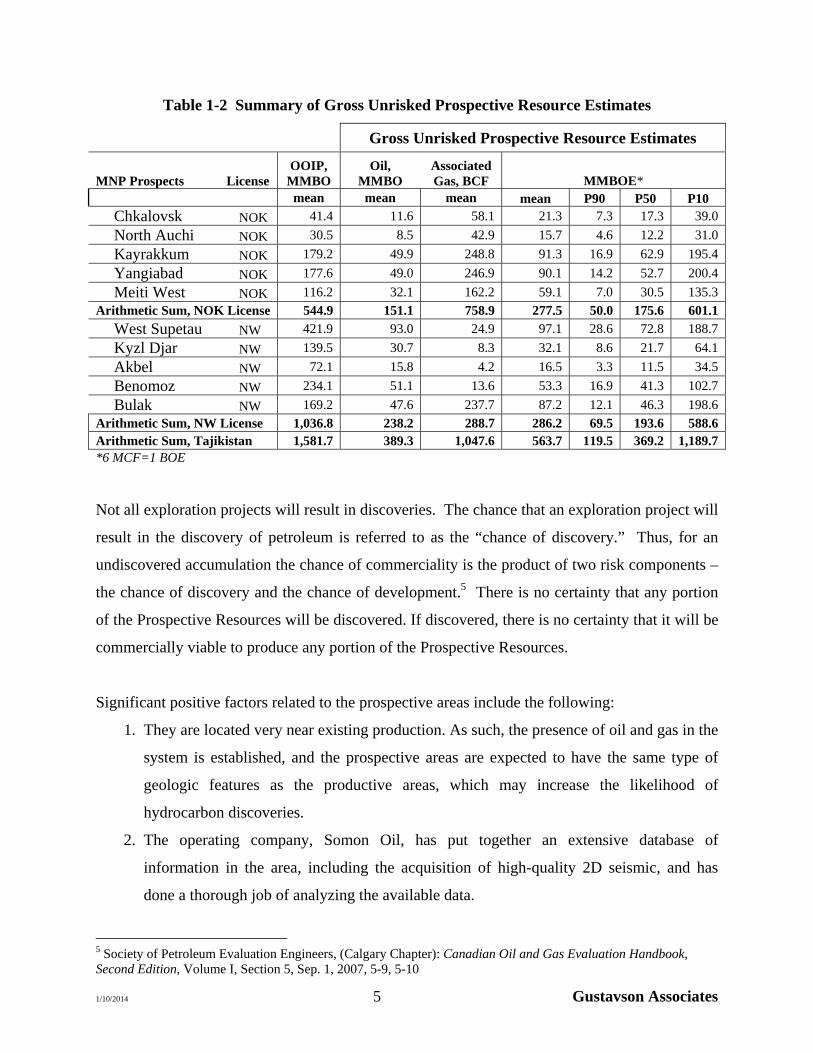
Table 1-2 below summarizes the Gross Unrisked Prospective Resource estimates. These
estimates represent the likely size of the resource, if present, and have not been adjusted for risk
of failure.
3 Society of Petroleum Evaluation Engineers, (Calgary Chapter): Canadian Oil and Gas Evaluation Handbook, Second Edition, Volume I, Section 5, Sep. 1, 2007, 5-11. 4 Society of Petroleum Evaluation Engineers, (Calgary Chapter): Canadian Oil and Gas Evaluation Handbook, Second Edition, Volume I, Section 5, Sep. 1, 2007, 5-9
1/10/2014 5 Gustavson Associates
Table 1-2 Summary of Gross Unrisked Prospective Resource Estimates
Gross Unrisked Prospective Resource Estimates
MNP Prospects License OOIP,
MMBO Oil,
MMBO Associated Gas, BCF MMBOE*
mean mean mean mean P90 P50 P10 Chkalovsk NOK 41.4 11.6 58.1 21.3 7.3 17.3 39.0
North Auchi NOK 30.5 8.5 42.9 15.7 4.6 12.2 31.0
Kayrakkum NOK 179.2 49.9 248.8 91.3 16.9 62.9 195.4
Yangiabad NOK 177.6 49.0 246.9 90.1 14.2 52.7 200.4
Meiti West NOK 116.2 32.1 162.2 59.1 7.0 30.5 135.3 Arithmetic Sum, NOK License 544.9 151.1 758.9 277.5 50.0 175.6 601.1 West Supetau NW 421.9 93.0 24.9 97.1 28.6 72.8 188.7
Kyzl Djar NW 139.5 30.7 8.3 32.1 8.6 21.7 64.1
Akbel NW 72.1 15.8 4.2 16.5 3.3 11.5 34.5
Benomoz NW 234.1 51.1 13.6 53.3 16.9 41.3 102.7
Bulak NW 169.2 47.6 237.7 87.2 12.1 46.3 198.6
Arithmetic Sum, NW License 1,036.8 238.2 288.7 286.2 69.5 193.6 588.6 Arithmetic Sum, Tajikistan 1,581.7 389.3 1,047.6 563.7 119.5 369.2 1,189.7 *6 MCF=1 BOE
Not all exploration projects will result in discoveries. The chance that an exploration project will
result in the discovery of petroleum is referred to as the “chance of discovery.” Thus, for an
undiscovered accumulation the chance of commerciality is the product of two risk components –
the chance of discovery and the chance of development.5 There is no certainty that any portion
of the Prospective Resources will be discovered. If discovered, there is no certainty that it will be
commercially viable to produce any portion of the Prospective Resources.
Significant positive factors related to the prospective areas include the following:
1. They are located very near existing production. As such, the presence of oil and gas in the
system is established, and the prospective areas are expected to have the same type of
geologic features as the productive areas, which may increase the likelihood of
hydrocarbon discoveries.
2. The operating company, Somon Oil, has put together an extensive database of
information in the area, including the acquisition of high-quality 2D seismic, and has
done a thorough job of analyzing the available data.
5 Society of Petroleum Evaluation Engineers, (Calgary Chapter): Canadian Oil and Gas Evaluation Handbook, Second Edition, Volume I, Section 5, Sep. 1, 2007, 5-9, 5-10
1/10/2014 6 Gustavson Associates
3. A methodology for transportation and sales of oil and gas from the area is established, via
an existing road system, pipeline system and other existing infrastructure.
This report includes an economic analysis of hypothetical exploration and development of each
of the 11 identified prospects and leads. The analysis includes the chance of geologic failure and
success. The chance of geologic success with economic failure was evaluated, and found to be
so low as to be negligible. This report does not include an estimate of market value of the
subject areas. There are numerous possible outcomes that may occur as a result of the
exploration program on the subject blocks. The estimate of the EMV for the total of these blocks
does not consider all of the possible combinations of successes and failures.
The order, in which the prospects are drilled, in this model, is based on input from MNP and may
not portray the actual course of events as the prospects are drilled. Many variables affect this
economic scenario, such as drilling and operating costs, the number of rigs used, flow rates,
pipeline diameters, pricing, etc. which could have a material impact on the potential value of this
project. Gustavson used the best current estimates available as well as input from MNP for this
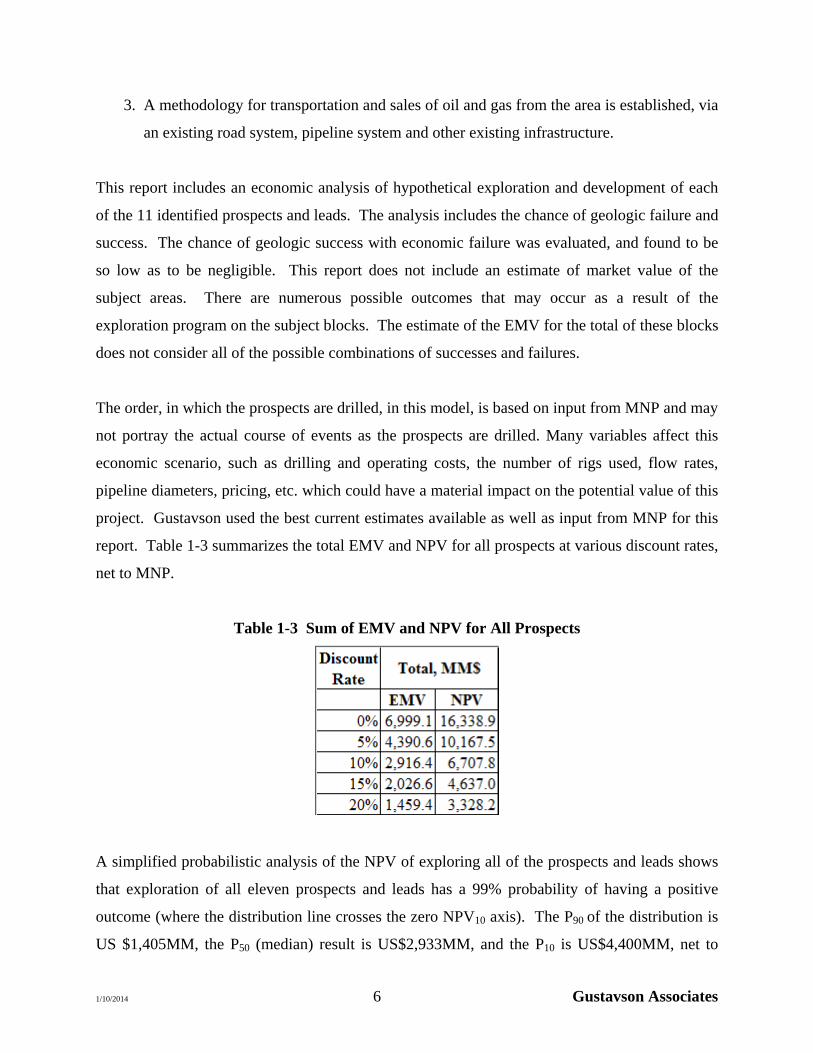
report. Table 1-3 summarizes the total EMV and NPV for all prospects at various discount rates,
net to MNP.
Table 1-3 Sum of EMV and NPV for All Prospects
A simplified probabilistic analysis of the NPV of exploring all of the prospects and leads shows
that exploration of all eleven prospects and leads has a 99% probability of having a positive
outcome (where the distribution line crosses the zero NPV10 axis). The P90 of the distribution is
US $1,405MM, the P50 (median) result is US$2,933MM, and the P10 is US$4,400MM, net to

1/10/2014 7 Gustavson Associates
MNP. This analysis does not include consideration of dependencies among prospects, which is
not expected to have a significant impact in this case due to the large magnitude of the values of
the success cases as compared to the cost of the failure cases.
1/10/2014 8 Gustavson Associates
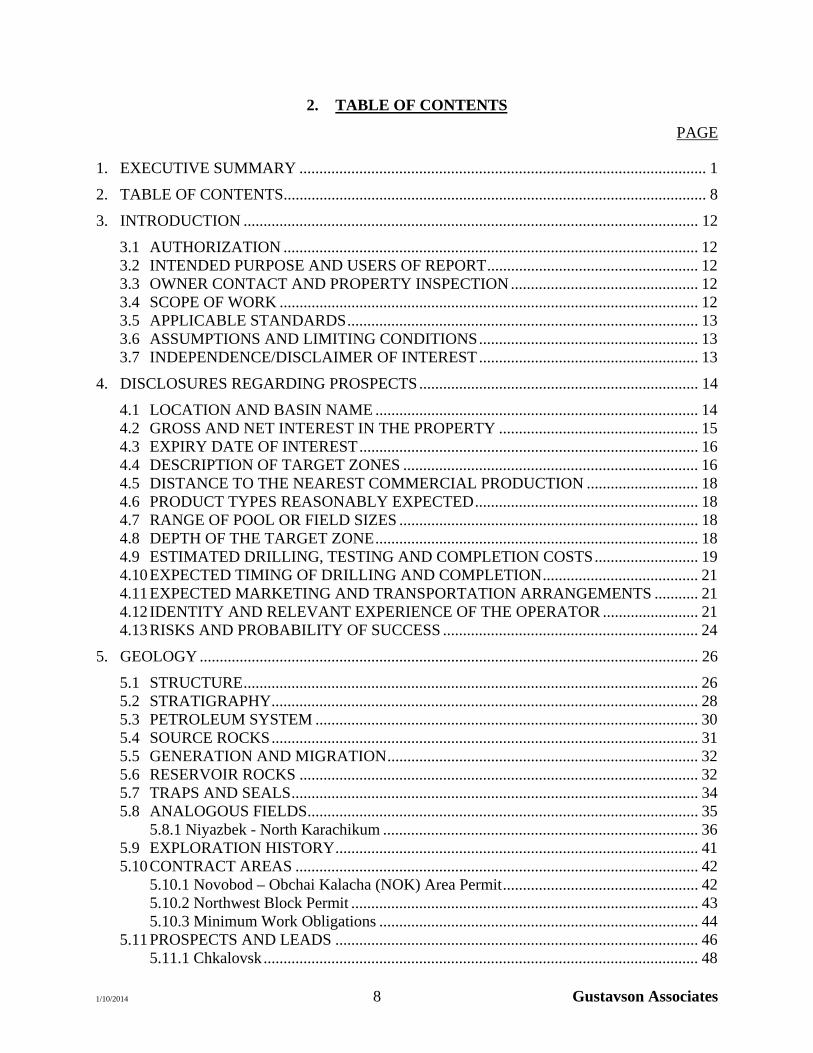
2. TABLE OF CONTENTS
PAGE
1. EXECUTIVE SUMMARY ...................................................................................................... 1
2. TABLE OF CONTENTS .......................................................................................................... 8
3. INTRODUCTION .................................................................................................................. 12
3.1 AUTHORIZATION ........................................................................................................ 12 3.2 INTENDED PURPOSE AND USERS OF REPORT ..................................................... 12 3.3 OWNER CONTACT AND PROPERTY INSPECTION ............................................... 12 3.4 SCOPE OF WORK ......................................................................................................... 12 3.5 APPLICABLE STANDARDS ........................................................................................ 13 3.6 ASSUMPTIONS AND LIMITING CONDITIONS ....................................................... 13 3.7 INDEPENDENCE/DISCLAIMER OF INTEREST ....................................................... 13
4. DISCLOSURES REGARDING PROSPECTS ...................................................................... 14
4.1 LOCATION AND BASIN NAME ................................................................................. 14 4.2 GROSS AND NET INTEREST IN THE PROPERTY .................................................. 15 4.3 EXPIRY DATE OF INTEREST ..................................................................................... 16 4.4 DESCRIPTION OF TARGET ZONES .......................................................................... 16 4.5 DISTANCE TO THE NEAREST COMMERCIAL PRODUCTION ............................ 18 4.6 PRODUCT TYPES REASONABLY EXPECTED ........................................................ 18 4.7 RANGE OF POOL OR FIELD SIZES ........................................................................... 18 4.8 DEPTH OF THE TARGET ZONE ................................................................................. 18 4.9 ESTIMATED DRILLING, TESTING AND COMPLETION COSTS .......................... 19 4.10 EXPECTED TIMING OF DRILLING AND COMPLETION ....................................... 21 4.11 EXPECTED MARKETING AND TRANSPORTATION ARRANGEMENTS ........... 21 4.12 IDENTITY AND RELEVANT EXPERIENCE OF THE OPERATOR ........................ 21 4.13 RISKS AND PROBABILITY OF SUCCESS ................................................................ 24
5. GEOLOGY ............................................................................................................................. 26
5.1 STRUCTURE .................................................................................................................. 26 5.2 STRATIGRAPHY ........................................................................................................... 28 5.3 PETROLEUM SYSTEM ................................................................................................ 30 5.4 SOURCE ROCKS ........................................................................................................... 31 5.5 GENERATION AND MIGRATION .............................................................................. 32 5.6 RESERVOIR ROCKS .................................................................................................... 32 5.7 TRAPS AND SEALS ...................................................................................................... 34 5.8 ANALOGOUS FIELDS .................................................................................................. 35
5.8.1 Niyazbek - North Karachikum ............................................................................... 36 5.9 EXPLORATION HISTORY ........................................................................................... 41 5.10 CONTRACT AREAS ..................................................................................................... 42
5.10.1 Novobod – Obchai Kalacha (NOK) Area Permit ................................................. 42 5.10.2 Northwest Block Permit ....................................................................................... 43 5.10.3 Minimum Work Obligations ................................................................................ 44
5.11 PROSPECTS AND LEADS ........................................................................................... 46 5.11.1 Chkalovsk ............................................................................................................. 48
1/10/2014 9 Gustavson Associates
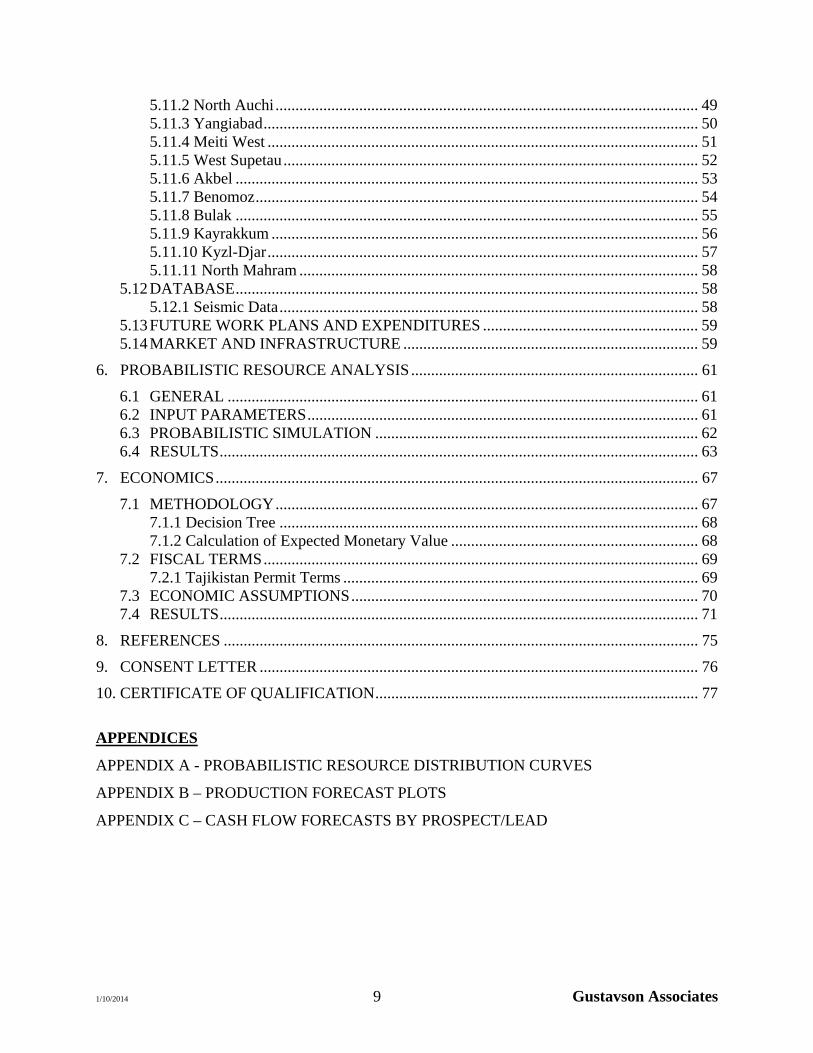
5.11.2 North Auchi .......................................................................................................... 49 5.11.3 Yangiabad ............................................................................................................. 50 5.11.4 Meiti West ............................................................................................................ 51 5.11.5 West Supetau ........................................................................................................ 52 5.11.6 Akbel .................................................................................................................... 53 5.11.7 Benomoz ............................................................................................................... 54 5.11.8 Bulak .................................................................................................................... 55 5.11.9 Kayrakkum ........................................................................................................... 56 5.11.10 Kyzl-Djar ............................................................................................................ 57 5.11.11 North Mahram .................................................................................................... 58
5.12 DATABASE .................................................................................................................... 58 5.12.1 Seismic Data ......................................................................................................... 58
5.13 FUTURE WORK PLANS AND EXPENDITURES ...................................................... 59 5.14 MARKET AND INFRASTRUCTURE .......................................................................... 59
6. PROBABILISTIC RESOURCE ANALYSIS ........................................................................ 61
6.1 GENERAL ...................................................................................................................... 61 6.2 INPUT PARAMETERS .................................................................................................. 61 6.3 PROBABILISTIC SIMULATION ................................................................................. 62 6.4 RESULTS ........................................................................................................................ 63
7. ECONOMICS ......................................................................................................................... 67
7.1 METHODOLOGY .......................................................................................................... 67 7.1.1 Decision Tree ......................................................................................................... 68 7.1.2 Calculation of Expected Monetary Value .............................................................. 68
7.2 FISCAL TERMS ............................................................................................................. 69 7.2.1 Tajikistan Permit Terms ......................................................................................... 69
7.3 ECONOMIC ASSUMPTIONS ....................................................................................... 70 7.4 RESULTS ........................................................................................................................ 71
8. REFERENCES ....................................................................................................................... 75
9. CONSENT LETTER .............................................................................................................. 76
10. CERTIFICATE OF QUALIFICATION ................................................................................. 77
APPENDICES
APPENDIX A - PROBABILISTIC RESOURCE DISTRIBUTION CURVES
APPENDIX B – PRODUCTION FORECAST PLOTS
APPENDIX C – CASH FLOW FORECASTS BY PROSPECT/LEAD
1/10/2014 10 Gustavson Associates
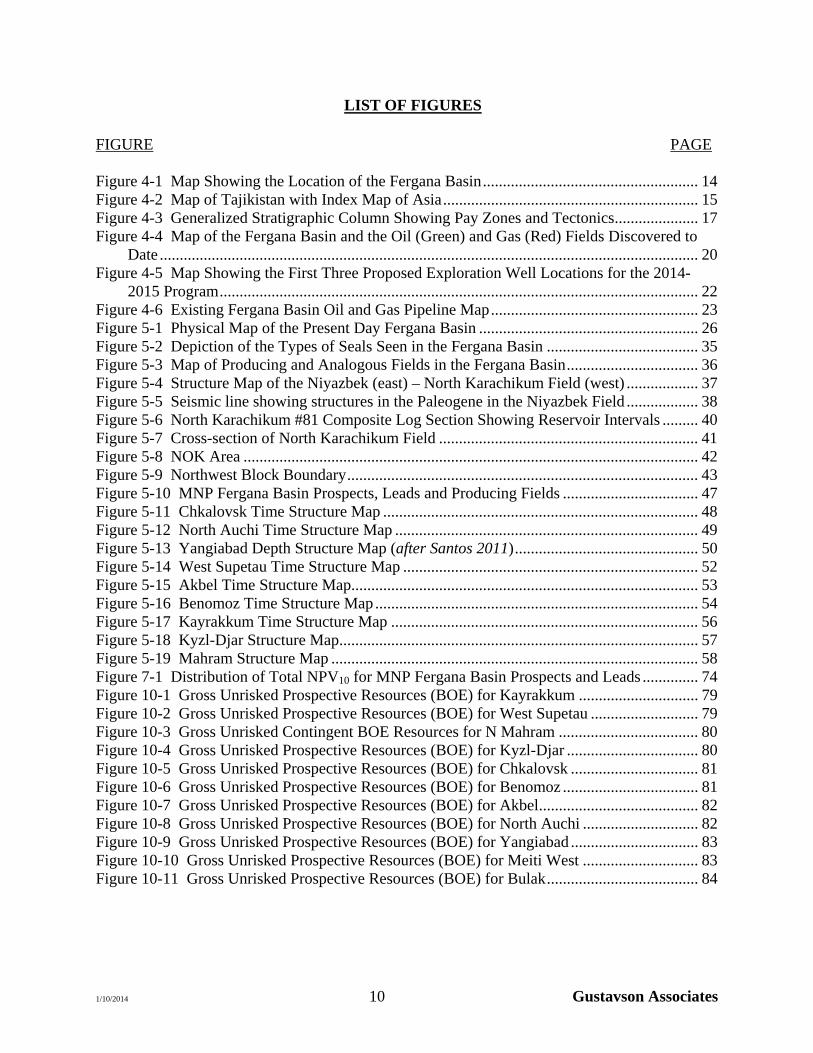
LIST OF FIGURES
FIGURE PAGE Figure 4-1 Map Showing the Location of the Fergana Basin ...................................................... 14 Figure 4-2 Map of Tajikistan with Index Map of Asia ................................................................ 15 Figure 4-3 Generalized Stratigraphic Column Showing Pay Zones and Tectonics ..................... 17 Figure 4-4 Map of the Fergana Basin and the Oil (Green) and Gas (Red) Fields Discovered to
Date ....................................................................................................................................... 20 Figure 4-5 Map Showing the First Three Proposed Exploration Well Locations for the 2014-
2015 Program ........................................................................................................................ 22 Figure 4-6 Existing Fergana Basin Oil and Gas Pipeline Map .................................................... 23 Figure 5-1 Physical Map of the Present Day Fergana Basin ....................................................... 26 Figure 5-2 Depiction of the Types of Seals Seen in the Fergana Basin ...................................... 35 Figure 5-3 Map of Producing and Analogous Fields in the Fergana Basin ................................. 36 Figure 5-4 Structure Map of the Niyazbek (east) – North Karachikum Field (west) .................. 37 Figure 5-5 Seismic line showing structures in the Paleogene in the Niyazbek Field .................. 38 Figure 5-6 North Karachikum #81 Composite Log Section Showing Reservoir Intervals ......... 40 Figure 5-7 Cross-section of North Karachikum Field ................................................................. 41 Figure 5-8 NOK Area .................................................................................................................. 42 Figure 5-9 Northwest Block Boundary ........................................................................................ 43 Figure 5-10 MNP Fergana Basin Prospects, Leads and Producing Fields .................................. 47 Figure 5-11 Chkalovsk Time Structure Map ............................................................................... 48 Figure 5-12 North Auchi Time Structure Map ............................................................................ 49 Figure 5-13 Yangiabad Depth Structure Map (after Santos 2011) .............................................. 50 Figure 5-14 West Supetau Time Structure Map .......................................................................... 52 Figure 5-15 Akbel Time Structure Map....................................................................................... 53 Figure 5-16 Benomoz Time Structure Map ................................................................................. 54 Figure 5-17 Kayrakkum Time Structure Map ............................................................................. 56 Figure 5-18 Kyzl-Djar Structure Map .......................................................................................... 57 Figure 5-19 Mahram Structure Map ............................................................................................ 58 Figure 7-1 Distribution of Total NPV10 for MNP Fergana Basin Prospects and Leads .............. 74 Figure 10-1 Gross Unrisked Prospective Resources (BOE) for Kayrakkum .............................. 79 Figure 10-2 Gross Unrisked Prospective Resources (BOE) for West Supetau ........................... 79 Figure 10-3 Gross Unrisked Contingent BOE Resources for N Mahram ................................... 80 Figure 10-4 Gross Unrisked Prospective Resources (BOE) for Kyzl-Djar ................................. 80 Figure 10-5 Gross Unrisked Prospective Resources (BOE) for Chkalovsk ................................ 81 Figure 10-6 Gross Unrisked Prospective Resources (BOE) for Benomoz .................................. 81 Figure 10-7 Gross Unrisked Prospective Resources (BOE) for Akbel ........................................ 82 Figure 10-8 Gross Unrisked Prospective Resources (BOE) for North Auchi ............................. 82 Figure 10-9 Gross Unrisked Prospective Resources (BOE) for Yangiabad ................................ 83 Figure 10-10 Gross Unrisked Prospective Resources (BOE) for Meiti West ............................. 83 Figure 10-11 Gross Unrisked Prospective Resources (BOE) for Bulak ...................................... 84
1/10/2014 11 Gustavson Associates
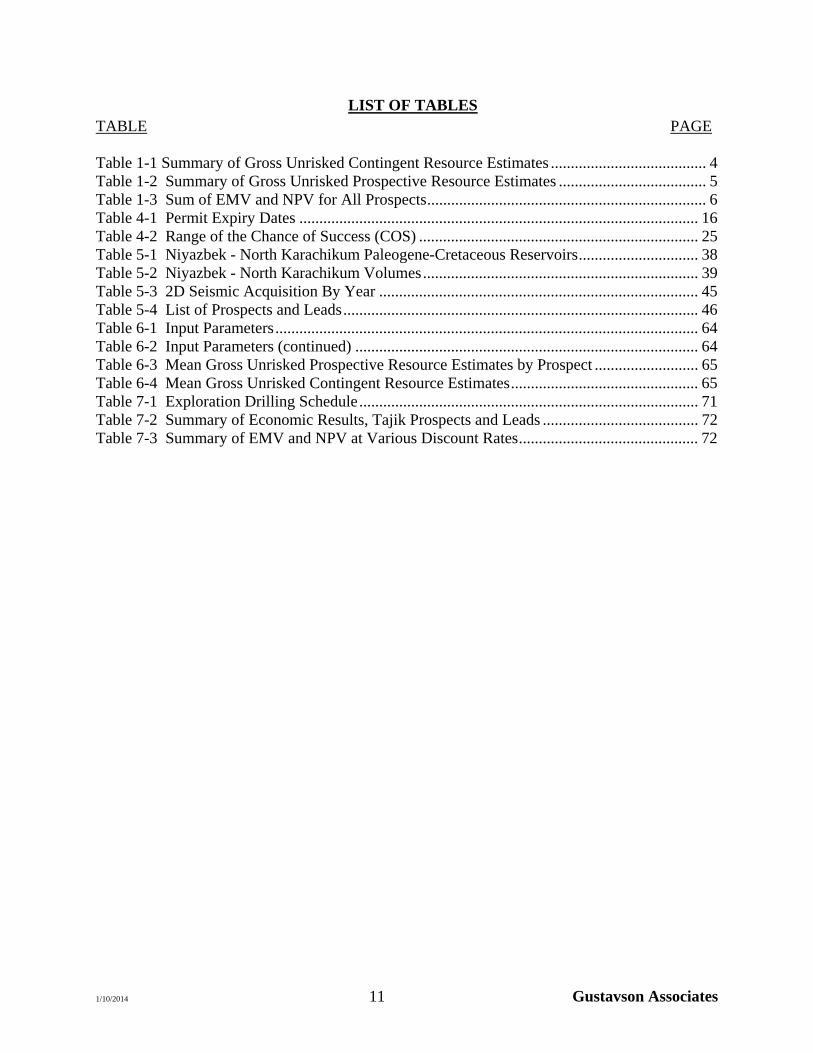
LIST OF TABLES TABLE PAGE Table 1-1 Summary of Gross Unrisked Contingent Resource Estimates ....................................... 4 Table 1-2 Summary of Gross Unrisked Prospective Resource Estimates ..................................... 5 Table 1-3 Sum of EMV and NPV for All Prospects ...................................................................... 6 Table 4-1 Permit Expiry Dates .................................................................................................... 16 Table 4-2 Range of the Chance of Success (COS) ...................................................................... 25 Table 5-1 Niyazbek - North Karachikum Paleogene-Cretaceous Reservoirs .............................. 38 Table 5-2 Niyazbek - North Karachikum Volumes ..................................................................... 39 Table 5-3 2D Seismic Acquisition By Year ................................................................................ 45 Table 5-4 List of Prospects and Leads ......................................................................................... 46 Table 6-1 Input Parameters .......................................................................................................... 64 Table 6-2 Input Parameters (continued) ...................................................................................... 64 Table 6-3 Mean Gross Unrisked Prospective Resource Estimates by Prospect .......................... 65 Table 6-4 Mean Gross Unrisked Contingent Resource Estimates ............................................... 65 Table 7-1 Exploration Drilling Schedule ..................................................................................... 71 Table 7-2 Summary of Economic Results, Tajik Prospects and Leads ....................................... 72 Table 7-3 Summary of EMV and NPV at Various Discount Rates ............................................. 72
1/10/2014 12 Gustavson Associates
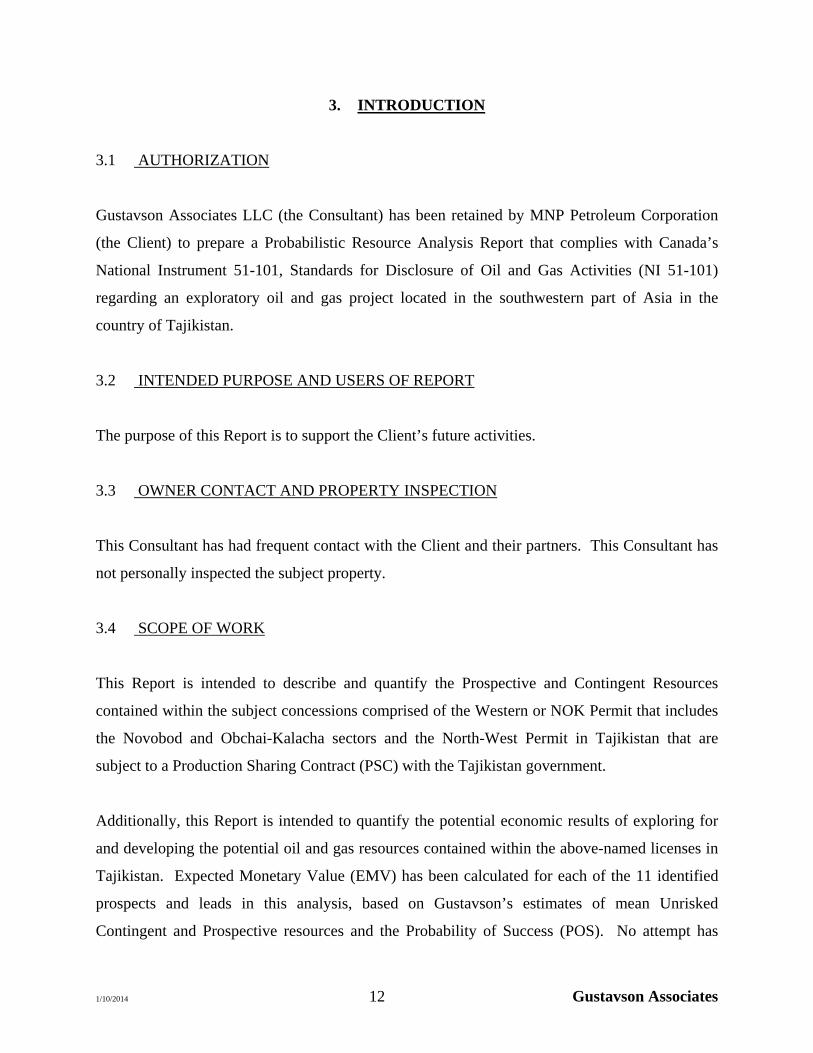
3. INTRODUCTION
3.1 AUTHORIZATION
Gustavson Associates LLC (the Consultant) has been retained by MNP Petroleum Corporation
(the Client) to prepare a Probabilistic Resource Analysis Report that complies with Canada’s
National Instrument 51-101, Standards for Disclosure of Oil and Gas Activities (NI 51-101)
regarding an exploratory oil and gas project located in the southwestern part of Asia in the
country of Tajikistan.
3.2 INTENDED PURPOSE AND USERS OF REPORT
The purpose of this Report is to support the Client’s future activities.
3.3 OWNER CONTACT AND PROPERTY INSPECTION
This Consultant has had frequent contact with the Client and their partners. This Consultant has
not personally inspected the subject property.
3.4 SCOPE OF WORK
This Report is intended to describe and quantify the Prospective and Contingent Resources
contained within the subject concessions comprised of the Western or NOK Permit that includes
the Novobod and Obchai-Kalacha sectors and the North-West Permit in Tajikistan that are
subject to a Production Sharing Contract (PSC) with the Tajikistan government.
Additionally, this Report is intended to quantify the potential economic results of exploring for
and developing the potential oil and gas resources contained within the above-named licenses in
Tajikistan. Expected Monetary Value (EMV) has been calculated for each of the 11 identified
prospects and leads in this analysis, based on Gustavson’s estimates of mean Unrisked
Contingent and Prospective resources and the Probability of Success (POS). No attempt has
1/10/2014 13 Gustavson Associates
been made to analyze all of the potential combinations of successes and failures of the 11
prospects. This Report does not attempt to place a Market Value thereon.
3.5 APPLICABLE STANDARDS
This Report has been prepared in accordance with Canadian National Instrument 51-101. The NI
51-101 requires that disclosure of oil and gas information, such as is provided in this Report,
comply with NI 51-101.
3.6 ASSUMPTIONS AND LIMITING CONDITIONS
The accuracy of any estimate is a function of available time, data and of geological, engineering,
and commercial interpretation and judgment. While the resource estimates presented herein are
believed to be reasonable, they should be viewed with the understanding that additional analysis
or new data may justify their revision. Gustavson Associates reserves the right to revise its
opinions of reserves and resources, if new information is deemed sufficiently credible to do so.
3.7 INDEPENDENCE/DISCLAIMER OF INTEREST
Gustavson Associates LLC has acted independently in the preparation of this Report. The
company and its employees have no direct or indirect ownership in the property evaluated or the
area of study described. Ms. Letha Lencioni is signing off on this Report, which has been
prepared by her as a Qualified Reserves Evaluator, with the assistance of others on Gustavson’s
staff.
Our fee for this Report and the other services that may be provided is not dependent on the
amount of resources estimated.
1/10/2014 14 Gustavson Associates
4. DISCLOSURES REGARDING PROSPECTS
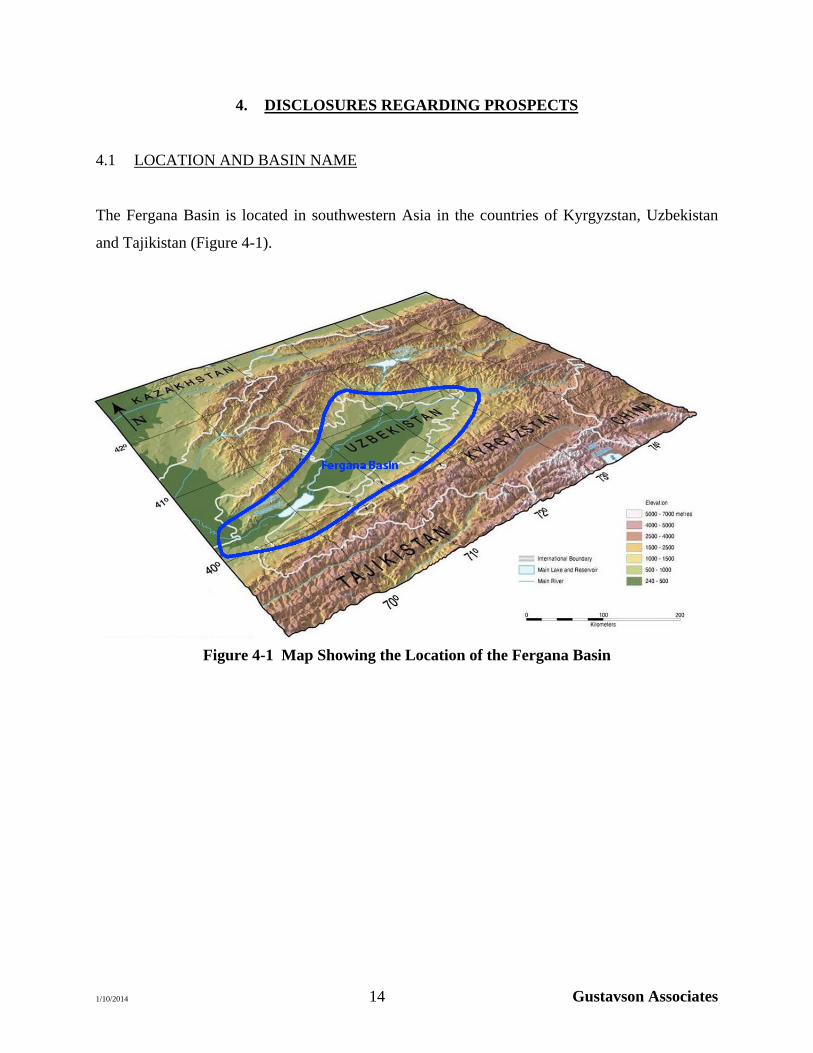
4.1 LOCATION AND BASIN NAME
The Fergana Basin is located in southwestern Asia in the countries of Kyrgyzstan, Uzbekistan
and Tajikistan (Figure 4-1).
Figure 4-1 Map Showing the Location of the Fergana Basin
1/10/2014 15 Gustavson Associates
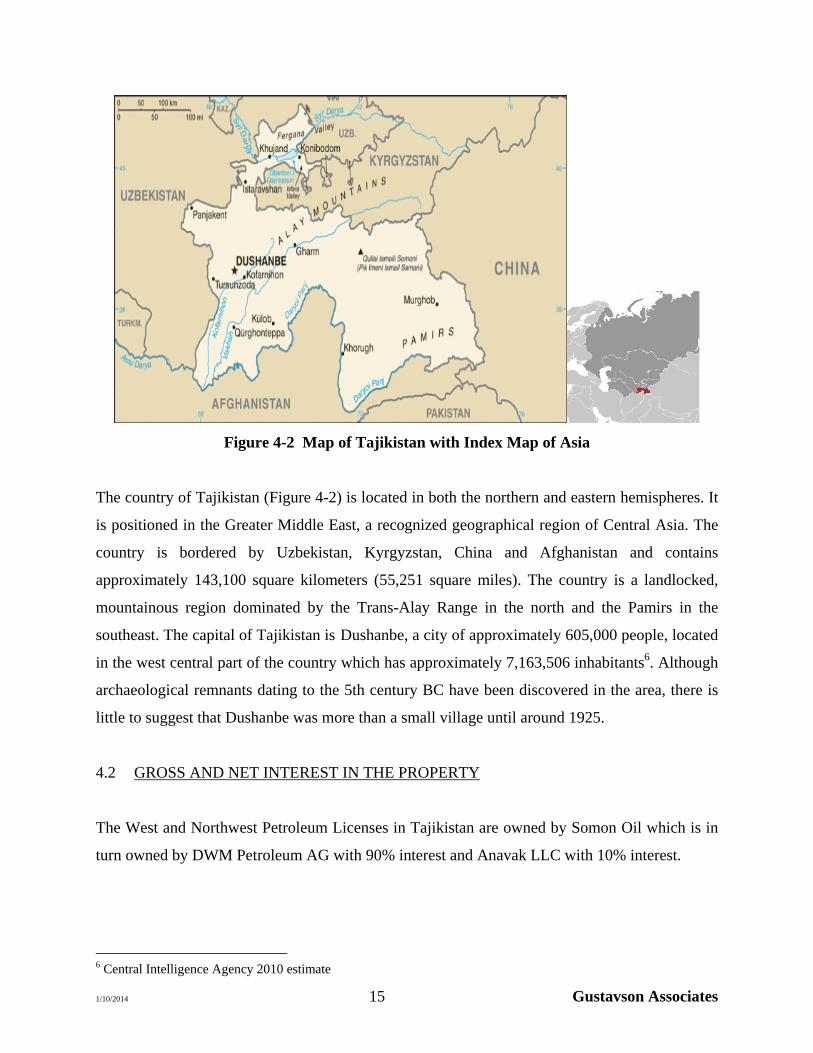
Figure 4-2 Map of Tajikistan with Index Map of Asia
The country of Tajikistan (Figure 4-2) is located in both the northern and eastern hemispheres. It
is positioned in the Greater Middle East, a recognized geographical region of Central Asia. The
country is bordered by Uzbekistan, Kyrgyzstan, China and Afghanistan and contains
approximately 143,100 square kilometers (55,251 square miles). The country is a landlocked,
mountainous region dominated by the Trans-Alay Range in the north and the Pamirs in the
southeast. The capital of Tajikistan is Dushanbe, a city of approximately 605,000 people, located
in the west central part of the country which has approximately 7,163,506 inhabitants6. Although
archaeological remnants dating to the 5th century BC have been discovered in the area, there is
little to suggest that Dushanbe was more than a small village until around 1925.
4.2 GROSS AND NET INTEREST IN THE PROPERTY
The West and Northwest Petroleum Licenses in Tajikistan are owned by Somon Oil which is in
turn owned by DWM Petroleum AG with 90% interest and Anavak LLC with 10% interest.
6 Central Intelligence Agency 2010 estimate
1/10/2014 16 Gustavson Associates
4.3 EXPIRY DATE OF INTEREST
The following Table 4-1 describes the expiration dates for the Exploration license areas in
Tajikistan. Somon has the ability to extend these dates of expiration if desired through a permit
renewal prior to the dates specified in the table.
Table 4-1 Permit Expiry Dates
Tajikistan Permits
Western (Novobod and Obchai - Kalacha sectors) 25 July 2014
Northwest 28 July 2016
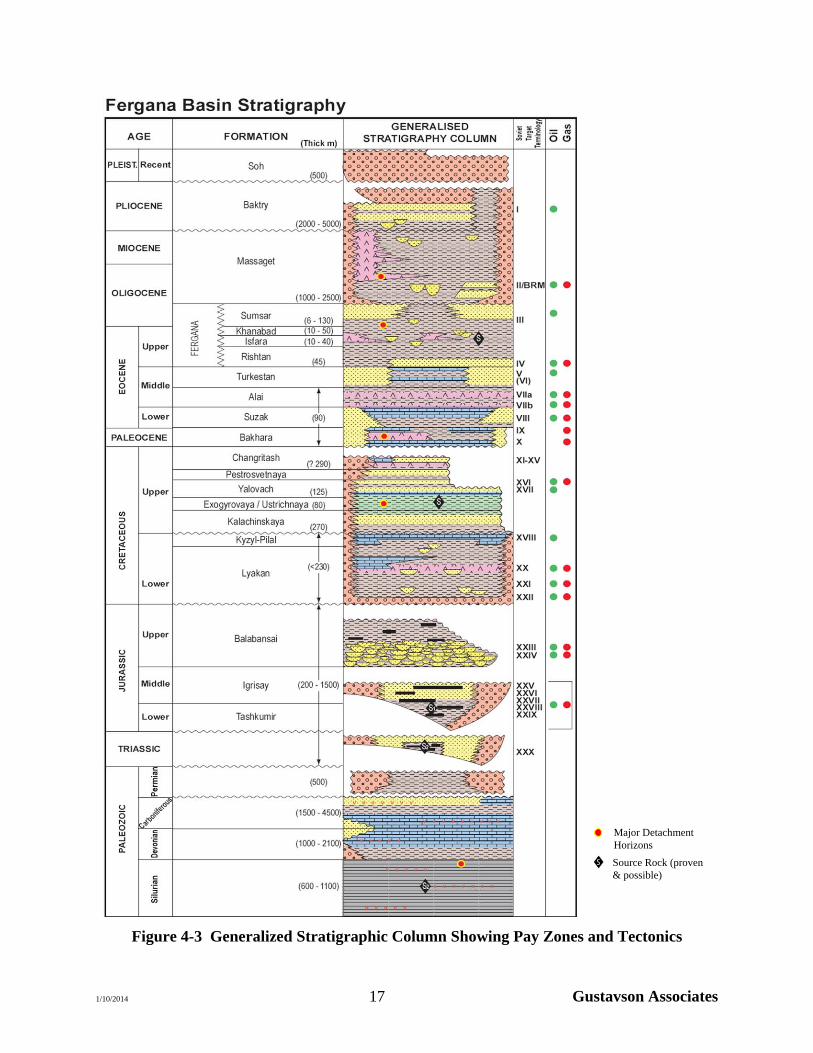
4.4 DESCRIPTION OF TARGET ZONES
The primary prospective section is in Paleogene age strata that produce in the basin. These
stacked reservoirs include the oil prone Oligocene age Sumsar (II) zone and the Eocene age
Isfara, Rishtan (IV), Turkestan (V), and Suzak (VIII) formations (Figure 4-3). The thickness of
producing zones from these formations ranges from 2 to 16 meters (6 to 52 feet) and reservoir
porosity ranges from 6 to 24 percent. Reservoir facies range from fractured, shallow marine low
energy chalky limestones through estuarine channel sandstones and massive shoreface
sandstones. Thick, widespread regional marine shale seals (often with an evaporitic association)
occur in the basin. Multiple interbedded seals act as effective, competent local seals as proven
by numerous stacked pays that are producing in many fields in the basin. The rift inversion,
thrust faulting, and folding that rejuvenated the extensive pre-existing structural fabrics during
the Tertiary to Recent Alpine orogenic phase of structuring formed multiple traps, which are the
primary structures explored to date, and continue to be the primary traps being targeted in the
basin.
The prospects and leads are conventional traps including hanging-wall closures and foot-wall
revers and thrust fault traps. MNP anticipates that multiple zones will contain hydrocarbons that
will most likely be undersaturated oil. Existing fields in the area are also three-way hanging-wall
closure and four-way closure traps.
1/10/2014 17 Gustavson Associates
Figure 4-3 Generalized Stratigraphic Column Showing Pay Zones and Tectonics
S
Major Detachment Horizons
Source Rock (proven & possible)
1/10/2014 18 Gustavson Associates
4.5 DISTANCE TO THE NEAREST COMMERCIAL PRODUCTION
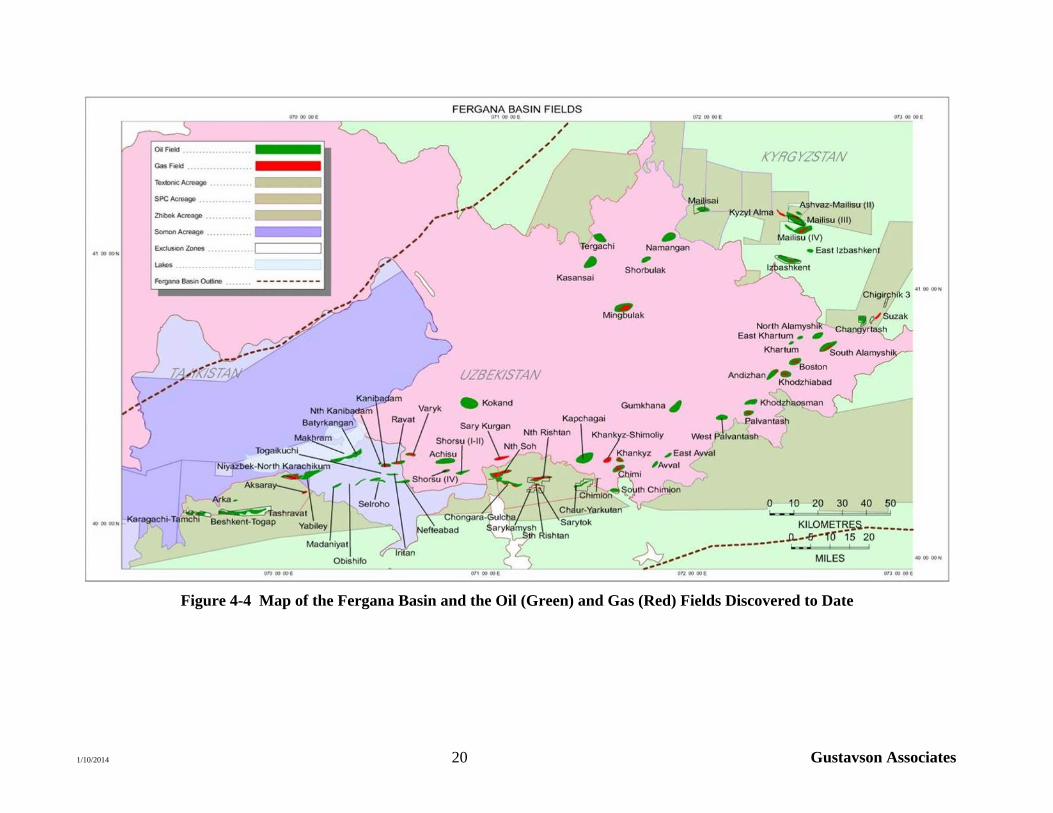
Commercial production in the Fergana Basin began in 1901 and continues today. Over 90 fields
have been discovered in the basin (Figure 4-4) including Niyazbek - North Karachikum Field
which has produced a total of 12 MMBO and 156 BCF through 1987. The Niyazbek Field has
had an average of 60% oil and 40% gas reservoirs. The other producing fields have mostly oil
reservoirs.
4.6 PRODUCT TYPES REASONABLY EXPECTED
Oil is the predominant product that would be expected in the area based on the analogous
production with gas being less likely. Sixty percent of the reservoirs discovered to date are oil
and forty percent are gas. The occurrence of oil or gas is not constrained by stratigraphy such
that oil reservoirs have occurred above gas reservoirs in the discovered fields. Associated gas
may occur with the oil reservoirs and condensate may occur within the gas reservoirs.
4.7 RANGE OF POOL OR FIELD SIZES
Based on the Danubian seismically mapped prospects and leads, the pool sizes ranges from 0.50
hectares to 75.00 square kilometers (124 to 18,533 acres). This compares to the pool size range
from analogous fields, which is 0.40 to 32.40 square kilometers (955 to 8,006 acres)7. The
analysis performed for this report indicates a likely range of individual field sizes, in terms of
Gross Unrisked Contingent and Prospective Resources, of 3.3 to 200.4 million barrels of oil
equivalent (MMBOE8) (see Section 6).
4.8 DEPTH OF THE TARGET ZONE
The main pay section in the Tajikistan prospects and leads would be located between 3,827
meters (12,556 feet) and 6,370 meters (20,900 feet) below the surface which ranges from 350
meters (1,148 feet) to 920 meters (3,018 feet) above sea level. 7 Oil and Gas Resources of the Fergana Basin (Uzbekistan, Tadzhikistan, and Kyrgyzstan), 1994, DOE/EIA-0575(94) 8 6 MCF=1 BOE
1/10/2014 19 Gustavson Associates
4.9 ESTIMATED DRILLING, TESTING AND COMPLETION COSTS
An estimate for drilling and testing costs had been provided by MNP. The estimated 2014 costs
for a 4,500 meter to 5,200 meter (14,763 feet to 17,060 feet) well are US$16 MM to US$19 MM
plus contingency to drill. Testing costs are estimated at US$1.3MM. Completion costs are
estimated to be US$2.0 MM. Total drill, complete and testing costs for the first exploration
wells is estimated to be US$22.0 MM with costs reduced to US$16MM for development wells.
MNP plans to utilize directional drilling and drill multiple wells from single locations to
minimize surface impact.
1/10/2014 20 Gustavson Associates
Figure 4-4 Map of the Fergana Basin and the Oil (Green) and Gas (Red) Fields Discovered to Date
1/10/2014 21 Gustavson Associates
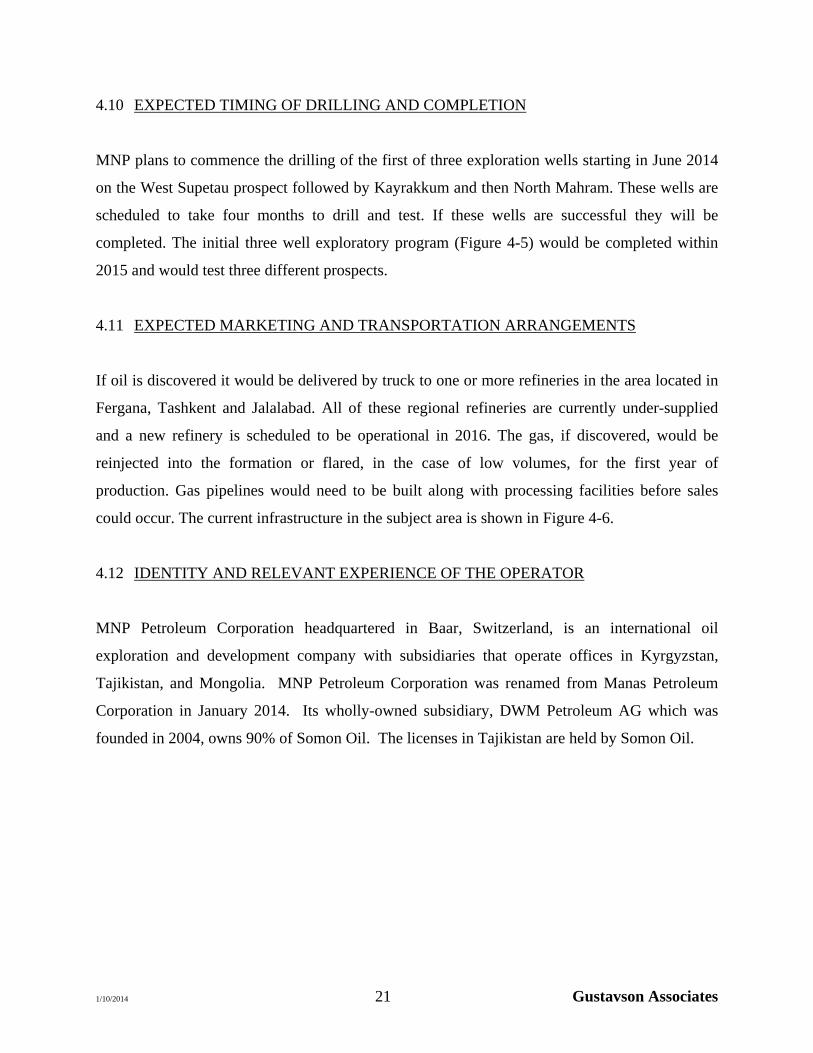
4.10 EXPECTED TIMING OF DRILLING AND COMPLETION
MNP plans to commence the drilling of the first of three exploration wells starting in June 2014
on the West Supetau prospect followed by Kayrakkum and then North Mahram. These wells are
scheduled to take four months to drill and test. If these wells are successful they will be
completed. The initial three well exploratory program (Figure 4-5) would be completed within
2015 and would test three different prospects.
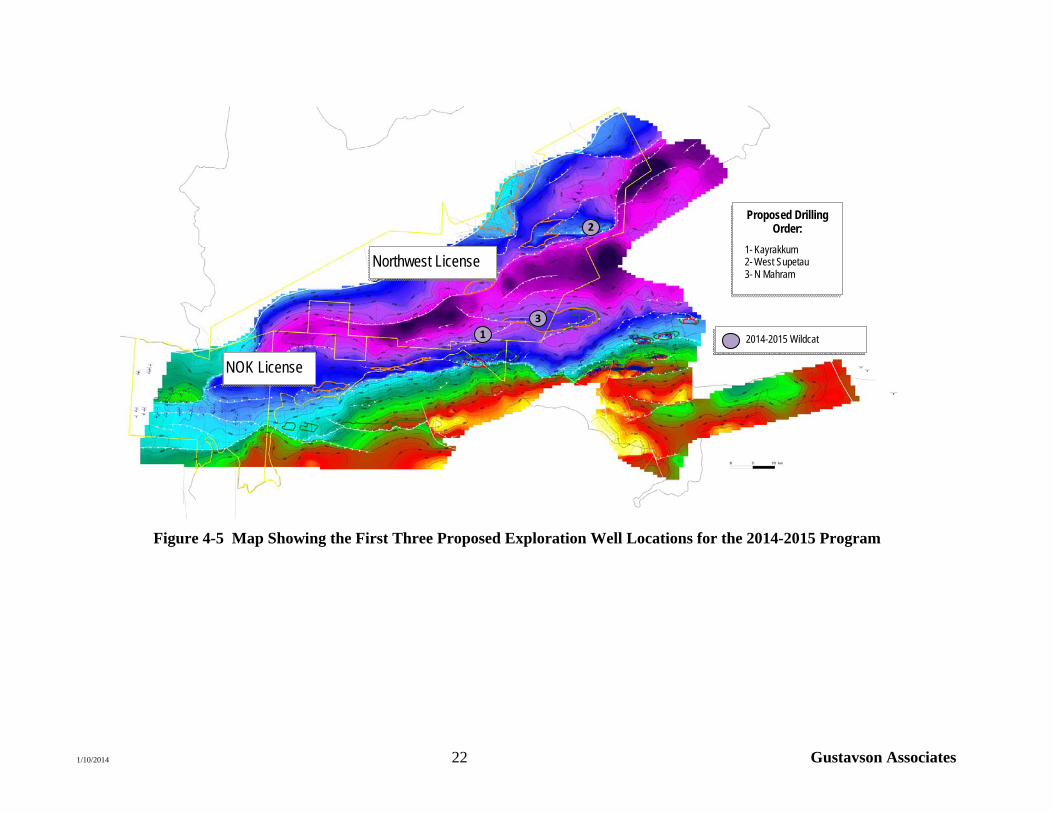
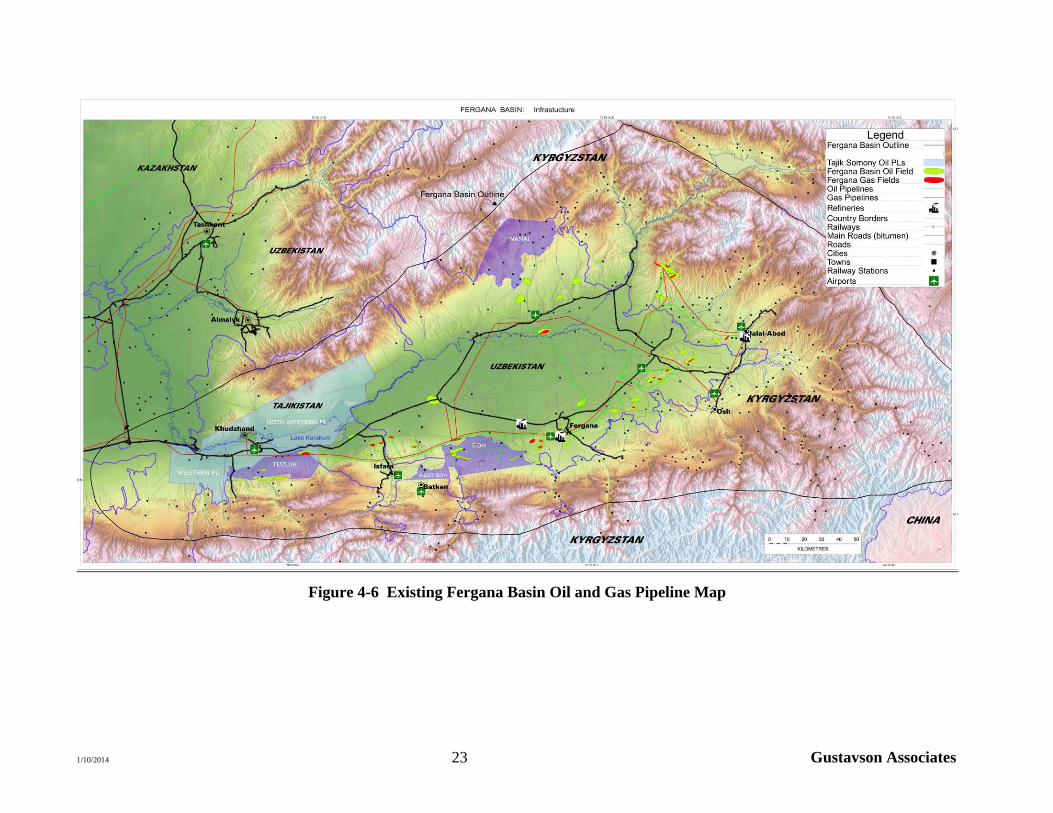
4.11 EXPECTED MARKETING AND TRANSPORTATION ARRANGEMENTS
If oil is discovered it would be delivered by truck to one or more refineries in the area located in
Fergana, Tashkent and Jalalabad. All of these regional refineries are currently under-supplied
and a new refinery is scheduled to be operational in 2016. The gas, if discovered, would be
reinjected into the formation or flared, in the case of low volumes, for the first year of
production. Gas pipelines would need to be built along with processing facilities before sales
could occur. The current infrastructure in the subject area is shown in Figure 4-6.
4.12 IDENTITY AND RELEVANT EXPERIENCE OF THE OPERATOR
MNP Petroleum Corporation headquartered in Baar, Switzerland, is an international oil
exploration and development company with subsidiaries that operate offices in Kyrgyzstan,
Tajikistan, and Mongolia. MNP Petroleum Corporation was renamed from Manas Petroleum
Corporation in January 2014. Its wholly-owned subsidiary, DWM Petroleum AG which was
founded in 2004, owns 90% of Somon Oil. The licenses in Tajikistan are held by Somon Oil.
1/10/2014 22 Gustavson Associates
Figure 4-5 Map Showing the First Three Proposed Exploration Well Locations for the 2014-2015 Program
1
2
3
Proposed Drilling Order:
1- Kayrakkum 2- West Supetau 3- N Mahram
2014-2015 Wildcat
Northwest License
NOK License
1/10/2014 23 Gustavson Associates
Figure 4-6 Existing Fergana Basin Oil and Gas Pipeline Map
1/10/2014 24 Gustavson Associates
4.13 RISKS AND PROBABILITY OF SUCCESS
The subject prospects and leads have a wide range of risk due to the amount and type of
available data that would help to mitigate the risk. The ‘drill-ready’ prospect Chkalovsk is
reasonably well documented with seismic data and very close to analogous production whereas a
lead such as Bulak needs further delineation with future seismic acquisition. The quantification
of the range of risk or the chance of finding commercial quantities of hydrocarbons in any single
prospect or lead for this play can be characterized with the following variables:
Structure: defined as the presence of a structure or stratigraphic feature that could act as a trap
for hydrocarbons;
Seal: defined as an impermeable barrier that would prevent hydrocarbons from leaking out of the
structure;
Reservoir: defined as the rock that is in a structurally favorable position having sufficient void
space present whether it be matrix porosity or fracture porosity to accumulate hydrocarbons in
sufficient quantities to be commercial; and
Presence of Hydrocarbons: defined as the occurrence of hydrocarbon source rocks that could
have generated hydrocarbons during a time that was favorable for accumulation in the structure.
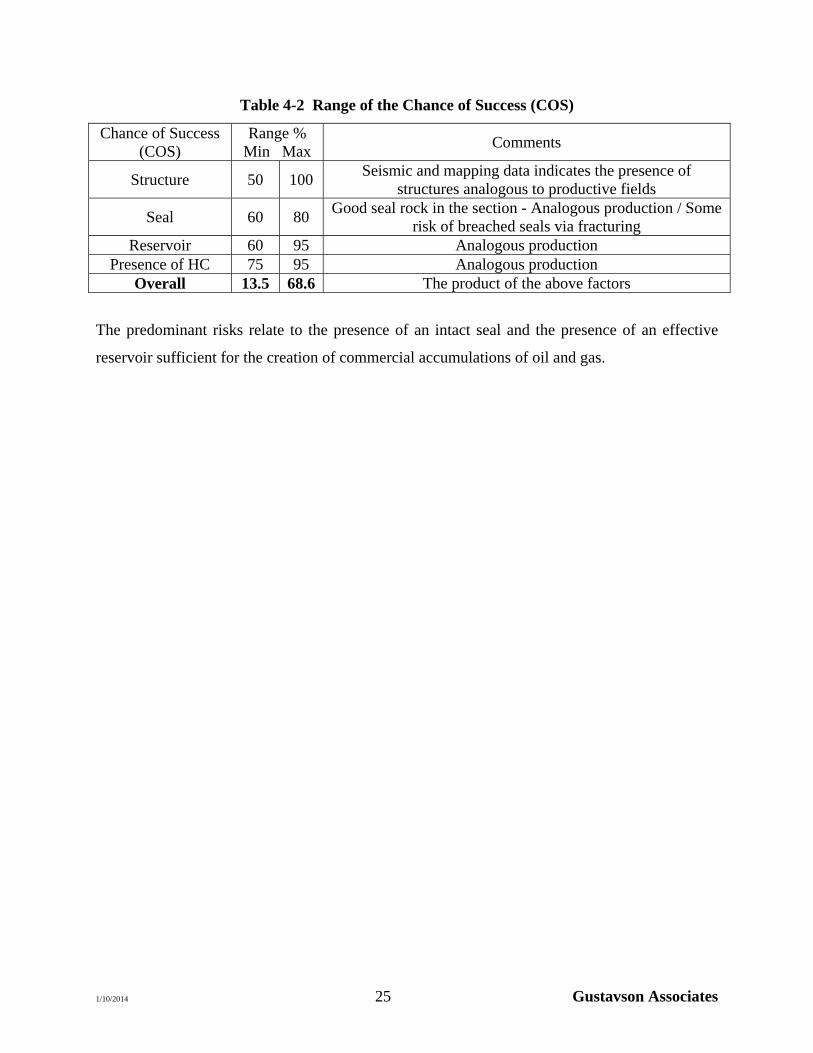
Table 4-2 shows the range of the Chance of Success (COS) or favorability that the above defined
variables would occur. The Overall COS is the product of all four variables.
1/10/2014 25 Gustavson Associates
Table 4-2 Range of the Chance of Success (COS)
Chance of Success (COS)
Range % Min Max
Comments
Structure 50 100 Seismic and mapping data indicates the presence of
structures analogous to productive fields
Seal 60 80 Good seal rock in the section - Analogous production / Some
risk of breached seals via fracturing Reservoir 60 95 Analogous production
Presence of HC 75 95 Analogous production Overall 13.5 68.6 The product of the above factors
The predominant risks relate to the presence of an intact seal and the presence of an effective
reservoir sufficient for the creation of commercial accumulations of oil and gas.
1/10/2014 26 Gustavson Associates
5. GEOLOGY
5.1 STRUCTURE
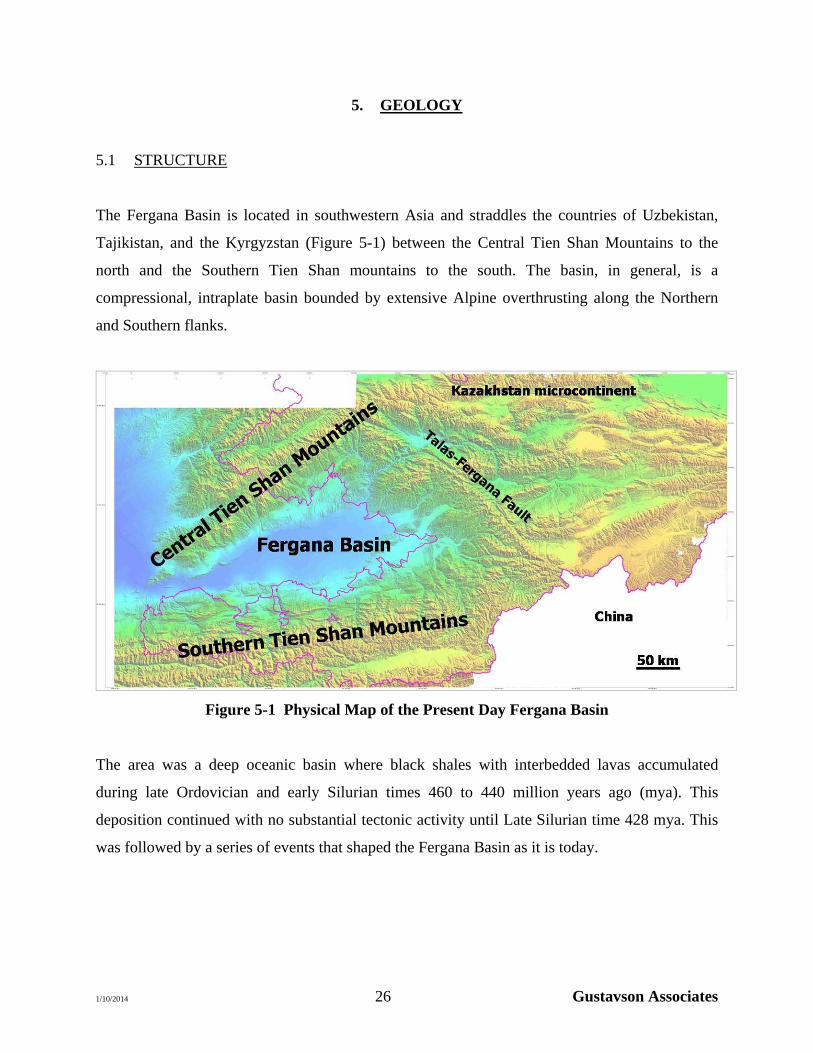
The Fergana Basin is located in southwestern Asia and straddles the countries of Uzbekistan,
Tajikistan, and the Kyrgyzstan (Figure 5-1) between the Central Tien Shan Mountains to the
north and the Southern Tien Shan mountains to the south. The basin, in general, is a
compressional, intraplate basin bounded by extensive Alpine overthrusting along the Northern
and Southern flanks.
Figure 5-1 Physical Map of the Present Day Fergana Basin
The area was a deep oceanic basin where black shales with interbedded lavas accumulated
during late Ordovician and early Silurian times 460 to 440 million years ago (mya). This
deposition continued with no substantial tectonic activity until Late Silurian time 428 mya. This
was followed by a series of events that shaped the Fergana Basin as it is today.
1/10/2014 27 Gustavson Associates
There have been four primary stages of tectonic activity: 1. Paleozoic passive margin stage, 2.
Hercynian Orogenic stage, 3. Platformal stage, and 4. Alpine Orogenic stage9.
During the Paleozoic stage from late Silurian to Late Carboniferous time the proto-Fergana basin
area was a passive margin occupied by a shallow marine carbonate platform and marginal marine
basins next to the South Tien Shan Volcanic Arc, marginal subduction of the southern Turkestan
oceanic plate. Devonian volcanism at this time was associated with back-arc rifting. Intrusive
terranes within the greater Tien Shan are dated to Carboniferous time, Permo-Triassic time,
Permian time and Ordovician time and include the North Fergana micro-continent (western
Central Tien Shan), and the southern margin of the Kazakh micro-continent (Northern Tien
Shan). The Tien Shan also incorporates the intervening suture zones.
The Hercynian orogeny stage resulted in closure of the Turkestan Ocean as the land mass of the
Alay-Tarim microcontinent collided with the South Tien Shan arc. This collision during the Late
Carboniferous through Permian (Pennsylvanian) time of several terranes in the region including
the Tarim - Alay, the Turkestan, and the Kazakhstania, microcontinents resulted in the
development of an extensive fold and thrust belt on the southern margin of the Kazakh
continental block.
The platform stage began in the Late Permian and continued through the Jurassic, with rifting
and the formation of pull-apart basins, rejuvenating the structural fabric inherited from Paleozoic
structures in the area that would become the Fergana Basin. These rift basins were filled with
thick, fluvio-lacustrine and alluvial sequences. Local marine transgression occurred in the Late
Cretaceous with a restricted shallow marine basin that extended from a marine carbonate
platform in the west to alluvial floodplain in the east.
Tertiary (Alpine) compression rejuvenated the Paleozoic fold belt fabrics, formed the Alay
Mountains to the south and enclosed the basin on three sides. Ultimately, this compression was
due to the collision of the Indian Plate with the Eurasian Plate starting 30 mya during late
9 Oil and Gas Resources of the Fergana Basin (Uzbekistan, Tadzhikistan, and Kyrgyzstan), 1994, DOE/EIA-0575(94).
1/10/2014 28 Gustavson Associates
Paleogene time and continuing through present time. Pre-existing Permo-Mesozoic rift basins
were locally inverted. High mountain growth exceeded 4 kilometers on the basin margins. This
resulted in the E-W, NE-SW oriented structures, broad folds, and steep reverse faults seen today.
The debris from erosion during Neogene time resulted in a thick clastic molasse with interbedded
evaporites of up to 7 kilometers thick accumulating in the basin center in less than 20 Million
years, providing both the structural traps and the maturation of source rocks that has resulted in
hydrocarbon accumulations in the basin.
With the current understanding of the structural history of the basin and the improved imaging
provided by recent seismic, this has resulted in multiple additional and deeper potential drilling
targets in the basin. Locally, compression and extensive lateral transport along evaporite-related
detachment surfaces has resulted in over-thrusts, from the north and south, of Paleozoic folded
basement rocks that overlie all but Quaternary deposits.
5.2 STRATIGRAPHY
Paleozoic age rocks crop out in the mountains around the edges of the Fergana Basin and consist
of limestone, shale, phyllite, sandstone, and volcanic rocks from the passive margin stage.
Permian age granitic intrusions mark the end of the second tectonic regime, the Hercynian
orogeny. Paleozoic age rocks are considered to be basement in this area. Sedimentary rocks as
old as Permo-Triassic and ranging to as young as Recent are present in the Fergana Basin (Figure
4-3). These rocks represent deposition during Triassic to Jurassic rifting, and later marine
platform tectonic settings followed by continental deposition during the latest orogeny.
The Jurassic strata consist of continental deposits of conglomerates, red-beds, sandstones,
siltstones, clay and coal as seen from outcrops located at the margins of the basin. Total
thickness of Jurassic age strata is approximately 1,500 meters (4,921 feet). Hydrocarbons
(predominantly gas and condensate) are produced from Jurassic age reservoirs.
Continental deposition continued into Cretaceous time with the presence of conglomerates,
sandstones, and clays. The Cretaceous is characterized by limestone, sandstone, and marl
1/10/2014 29 Gustavson Associates
deposited in settings distal to source terrains that alternate with conglomerate and sandstone
deposited in settings proximal to the source terrains. Gypsum and other minerals indicate
deposition in an arid climate with alternating continental and high-salinity shallow water
settings. Many of the formations of Cretaceous age are hydrocarbon producing reservoirs in the
basin. These rocks also crop out at the margins of the basin and are encountered at more than
6,000 meters (19,685 feet) depth in the deep portions of the basin. In total, the Cretaceous strata
are approximately 1,670 meters (5,479 feet) thick in the basin and thinner near the margins.
The Paleogene strata of the Fergana Basin represent shallow water and shelf marine carbonates
and clastics deposited as the area became part of the Tethys Sea. By the end of the Paleogene, or
early Oligocene time the Tethys Sea was closed and marine conditions were no longer present in
the area that would become the Fergana Basin.
The Paleogene strata can be subdivided into:
1.) Paleocene rocks that consist of the Goznau gypsum that is up to 100 meters (328 feet)
thick in the eastern part of the basin and clastic rocks and limestone elsewhere.
2.) Rocks of Eocene age comprised of clay, sandstone, siltstone, and carbonate. Maximum
total thickness is approximately 370 meters (1,214 feet). Hydrocarbons are produced
from several reservoirs in Eocene strata.
3.) Lower and middle Oligocene strata consisting of marine clays and marl with sandstone
deposited in the late stages as marine conditions changed to continental settings. The
youngest marine deposits are middle Oligocene in age. Oligocene strata thickness is up
to approximately 230 meters (755 feet). Sandstones at the top of the Oligocene are
important hydrocarbon reservoirs in the basin.
All three of these units host hydrocarbon accumulations.
Miocene and Pliocene strata consist of terrigenous sandstone, siltstone, and conglomerate, and
locally thick sequences of lacustrine evaporitic beds/sabkha deposits of a combined thickness of
approximately 8,000 meters (26,246 feet) in the basin center and thinning to the margins.
1/10/2014 30 Gustavson Associates
Deposition during this time was similar to the setting today with debris shed from the
surrounding mountains.
Quaternary sediments are present to a thickness of approximately 500 meters (2,640 feet) thick.
Locally, Miocene, Pliocene and Quaternary fluvial-alluvial reservoirs host producible
hydrocarbons.
5.3 PETROLEUM SYSTEM
In an underexplored area such as the subject licenses, any information on the petroleum system is
applied or modeled to the extent possible. However, there is usually very limited data of this sort
in sparsely explored areas and consequently, petroleum companies primarily target anticlines for
exploratory drilling.
Petroleum systems are based on the factors affecting hydrocarbon accumulations including:
1. trap (a structure or limit to the quality of the reservoir rock that is capable of holding
hydrocarbons)
2. reservoir rock (one or more rock layers that has sufficient porosity and permeability to
store hydrocarbons)
3. mature source rock (a rock layer in the region that has sufficient organic content and is
mature enough to generate and expel hydrocarbons)
4. maturation (the burial of the source rock sufficient to generate hydrocarbons from the
organic material within the source rock)
5. migration (the path of movement of the generated hydrocarbons from the source rock to a
trap), seal (a layer that is impermeable to hydrocarbon and prevents the hydrocarbon from
escaping the trap)
6. timing (the events must occur in the correct order to create and preserve a hydrocarbon
accumulation).
1/10/2014 31 Gustavson Associates
Evaluation of this group of factors is termed “basin analysis” and these factors have been more
formally organized, since the 1980s, into an analysis approach termed “petroleum systems”
(Magoon, 1988).
The presence of oil seeps at the surface indicates the presence of an active petroleum system that
indicates a mature source rock.
Oil seeps from strata in the Fergana Basin have been observed and utilized for centuries.
Reported seeps and minor production from Permian rocks suggest unexplored hydrocarbon
potential in the Paleozoic section. Modern drilling with production from the basin began in 1880.
At least one active, regionally extensive petroleum system occurs in the basin and perhaps
additional petroleum systems based on the occurrence of other source rocks. Oil, natural gas,
and condensate are produced in the basin from stacked reservoirs. Production in the central
portion of the basin is from reservoirs deeper than 5,900 meters (19,350 feet) deep, on the flanks
from 4,500 meters (14,764 Feet), and on the margins, up to surface, with exhumed anticlines
producing oil down flank of active surface seeps. To date, over 53 fields have been discovered in
the basin, and the USGS estimates total discovered reserves at 1.1 BBO and 1.3 TCF gas.
5.4 SOURCE ROCKS
Paleogene shallow marine shales are considered the dominant oil and gas source rocks in the
Fergana Basin. Jurassic and Upper-Mid Cretaceous shales are also believed to represent
important secondary source rocks and Paleozoic black shales of Ordovician through Permian age
have speculative oil and gas source potential.
Potential source rocks of Late Cretaceous and Paleogene age are marine shales that are buried to
more than 6,000 meters (19,685 feet) in the center of the basin. There appears to be a similarity
among the produced oils from the Paleogene and Neogene-aged reservoirs in fields across the
basin. These oils have been tied to oil prone marginal marine rocks of Paleogene Paleocene-
Eocene age that have sourced Paleogene age reservoirs, in addition to older reservoirs.
1/10/2014 32 Gustavson Associates
Oil and gas prone fluvio-lacustrine strata that are early to middle Jurassic in age are sub-
regionally developed and locally these show high organic content. These are likely to be the
source rocks for oil and gas accumulations in Jurassic and Cretaceous age reservoirs.
Source rock intervals of Cretaceous age have potentially supplied hydrocarbons for oil
accumulations in Cretaceous reservoirs and have a strong terrestrial signature. Gas produced
from these reservoirs and Jurassic reservoirs appears to be similar.
5.5 GENERATION AND MIGRATION
Modeling indicates that the current location of the base of the oil window encompasses most of
the Fergana Basin. Areas of higher heat flow on the northern margin of the basin have primary
Paleogene source horizons in the primary gas-generating window. Hydrocarbons have been
generating and have been migrating from mature, basin-central Jurassic and Paleogene-aged
source rocks since Late Oligocene time. In the Fergana Basin hydrocarbon migration is sub-
regional, with effective migration occurring to the marginal structural traps in the basin from
down-dip, basin-central oil and gas generation kitchen areas. This is testimony to the regional
extent of the key aquifers, in particular the stacked Paleogene carbonate and clastic reservoir
systems. Typically, traps developed within or juxtaposed to the generative kitchen areas are
characterized by multiple stacked hydrocarbon pays beneath the regional seal.
5.6 RESERVOIR ROCKS
The majority of the proved oil reservoirs found to date in the neighboring fields are in carbonate
and clastic rocks of Paleogene age. Productive horizons are usually stacked with several
reservoirs encountered in a well or in a field throughout the Paleogene section. The reservoirs
can be independent accumulations of hydrocarbons, for example, oil reservoirs can be found
over gas reservoirs in a field.
Reservoir rocks are, however, found in strata of all ages that are present in the Fergana Basin.
The convention from the Soviet system for identifying the reservoirs consists of identification by
1/10/2014 33 Gustavson Associates
roman numerals10 (Figure 4-3). The oldest reservoirs of Permian and Triassic age are designated
as XXX, XXXI, and XXXII. Jurassic pays are designated as XXIX, XX and further identified
from shallow to deep beginning with XXIII. Cretaceous age pay zones are designated as XI
through XVIII and further divided by small letters. Paleogene age pay zones are designated as II
to X with increasing age and Roman numeral I refers to reservoirs of Neogene age.
Producing formations of Neogene age include the fluvial-alluvial facies of the Baktry and
Massaget Formations. The thickness of producing zones from these formations ranges from 16 to
38 meters (52 to 125 feet) and reservoir porosity ranges from 11 to 22 percent. Reservoirs range
from alluvial outwash fan, through braided channel and lacustrine delta facies.
Paleogene age strata that produce in the basin include the Oligocene age Sumsar (II), Khanabad
(III) zones and the Eocene age, Isfara ,Rishtan (IV), Turkestan (V), Alay (VII), Suzak (IX), and
Bukhara formations. Thickness of producing zones from these formations ranges from 2 to 16
meters (6 to 52 feet) and reservoir porosity ranges from 6 to 24 percent. Reservoir facies range
from fractured, shallow marine low energy chalky limestones through estuarine channel
sandstones and massive shoreface sandstones.
Cretaceous age strata that are productive in the basin include reservoirs in the Pestrotsvent (XII),
Yalovach (XVa), Ustricha (XVI, XVII), Kyzyl – Dylyal (XVII a, b, c), Lyakan (XVIII), and
Muyan formations. Thickness of producing zones from these formations range from 4 to 28
meters (13 to 92 feet) and reservoir porosity ranges from 10 to 27 percent. Reservoirs range from
braided fluvial channels through fractured micritic limestones.
Pay zones of Jurassic age include clastic reservoirs that range from 12 to 35 meters (39 to 115
feet) thick and reservoir porosities that range from 25 to 30 percent. Reservoirs are typically
fluvial channel through delta mouth bar facies.
10 Oil and Gas Resources of the Fergana Basin (Uzbekistan, Tadzhikistan, and Kyrgyzstan), 1994, DOE/EIA-0575(94).
1/10/2014 34 Gustavson Associates
Pay zones in the upper Permian and Triassic strata include sandstone and conglomerate
reservoirs in the Madygen Formation and the Kokiin Formation.
Heavily fractured thin bedded Carboniferous aged carbonates are observed in outcrop in
association with light oil seepages on the margin of the basin; however, the complex pre-
Mesozoic stratigraphy of the basin is poorly understood.
5.7 TRAPS AND SEALS
Numerous conventional traps have been drilled in the Fergana Basin. Trap types that have been
drilled include four-way-closures, faulted anticlines, combination fault and structural traps,
combination stratigraphic and structural traps, fault traps, and stratigraphic traps. Many of the
explored anticlines trend east to west.
Traps of Permian and Triassic age would have been formed early on; however these traps could
have been compromised by subsequent tectonics. Traps associated with Mesozoic (Tethyan)
rifting are also likely to have been compromised. The rift inversion, thrust faulting, and folding
that rejuvenated the extensive pre-existing structural fabrics during the Tertiary to Recent Alpine
orogenic phase of structuring formed multiple traps, which are the primary structures explored to
date, and continue to be the primary traps being targeted in the basin.
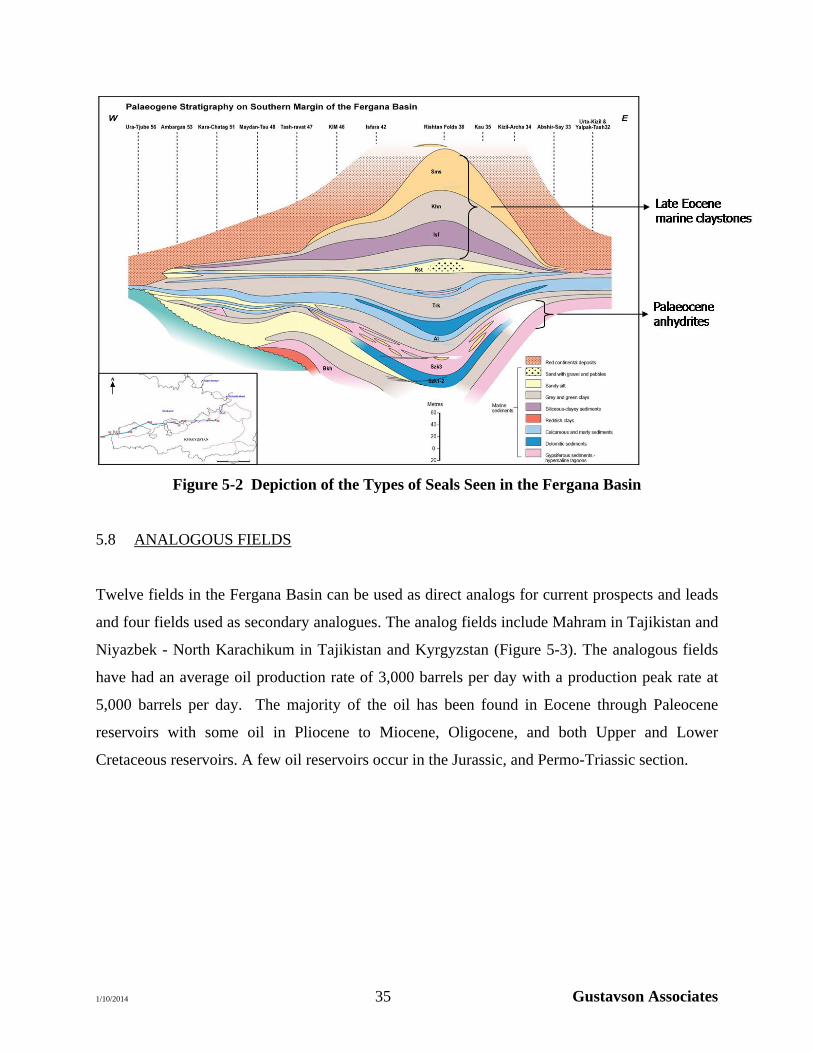
Thick, widespread regional marine shale seals, often with an evaporitic association, (Figure 5-2)
occur in the basin (Paleocene, Late Eocene). Multiple interbedded shales act as effective,
competent local seals as proven by numerous stacked pays that are producing in many field in
the basin. Thick intervals of thin-bedded Late Oligocene and Neogene evaporites and mudstone
seals are present in the north west of the basin (Tajikistan sector) above Neogene and Paleogene
primary reservoir horizons, and interbedded Paleogene source intervals. Although numerous
erosional unconformities occurred within the depositional history of the basin, the Paleogene
reservoirs are fairly uniform across the basin. The deposition of subsequent shaley overburden
provides effective regional and local seals.
1/10/2014 35 Gustavson Associates
Figure 5-2 Depiction of the Types of Seals Seen in the Fergana Basin
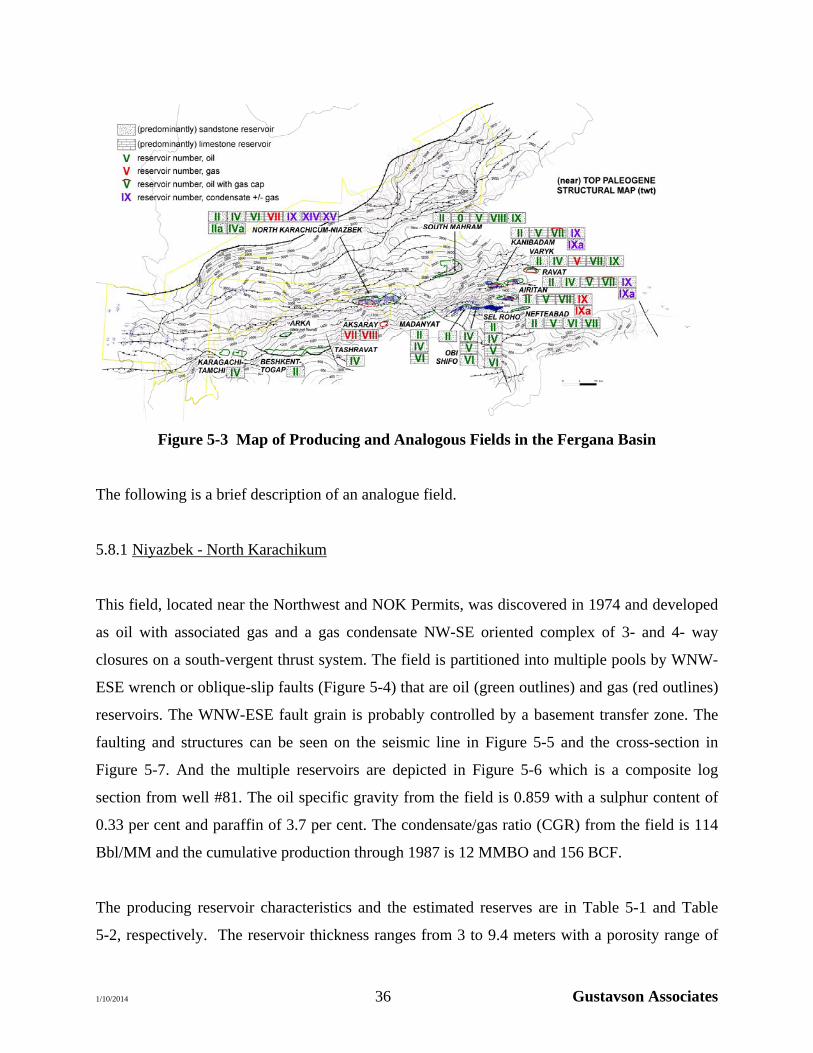
5.8 ANALOGOUS FIELDS
Twelve fields in the Fergana Basin can be used as direct analogs for current prospects and leads
and four fields used as secondary analogues. The analog fields include Mahram in Tajikistan and
Niyazbek - North Karachikum in Tajikistan and Kyrgyzstan (Figure 5-3). The analogous fields
have had an average oil production rate of 3,000 barrels per day with a production peak rate at
5,000 barrels per day. The majority of the oil has been found in Eocene through Paleocene
reservoirs with some oil in Pliocene to Miocene, Oligocene, and both Upper and Lower
Cretaceous reservoirs. A few oil reservoirs occur in the Jurassic, and Permo-Triassic section.
1/10/2014 36 Gustavson Associates
Figure 5-3 Map of Producing and Analogous Fields in the Fergana Basin
The following is a brief description of an analogue field.
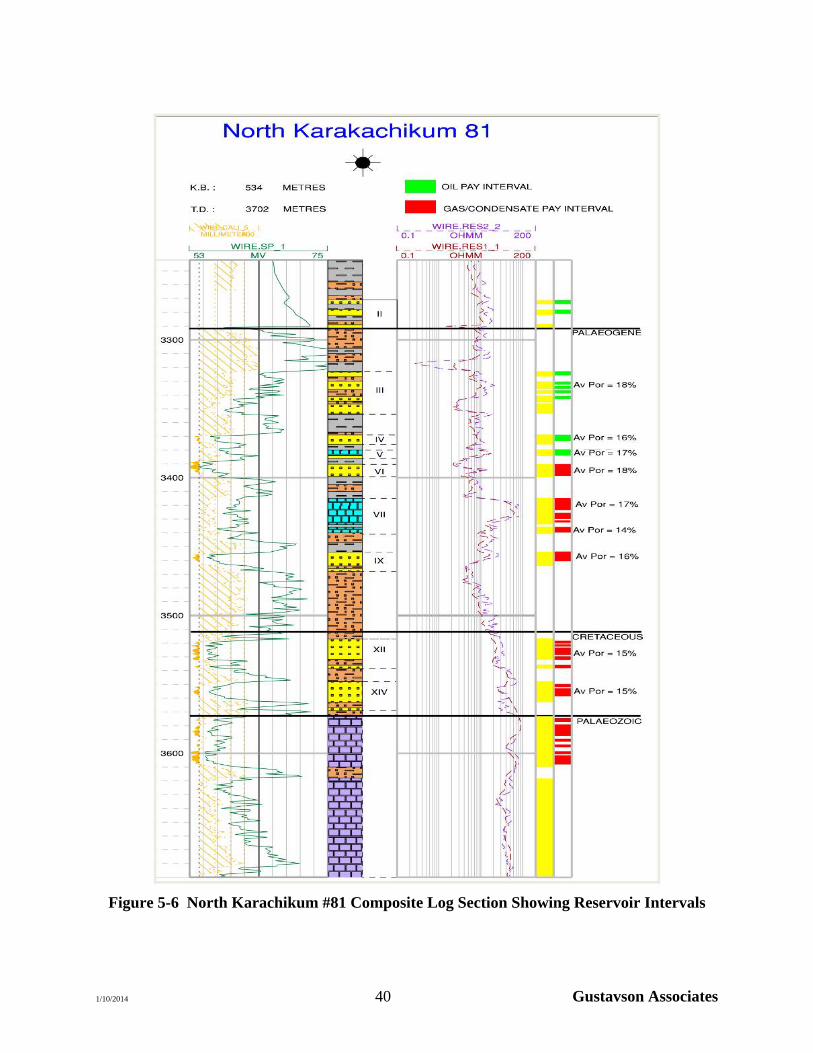
5.8.1 Niyazbek - North Karachikum
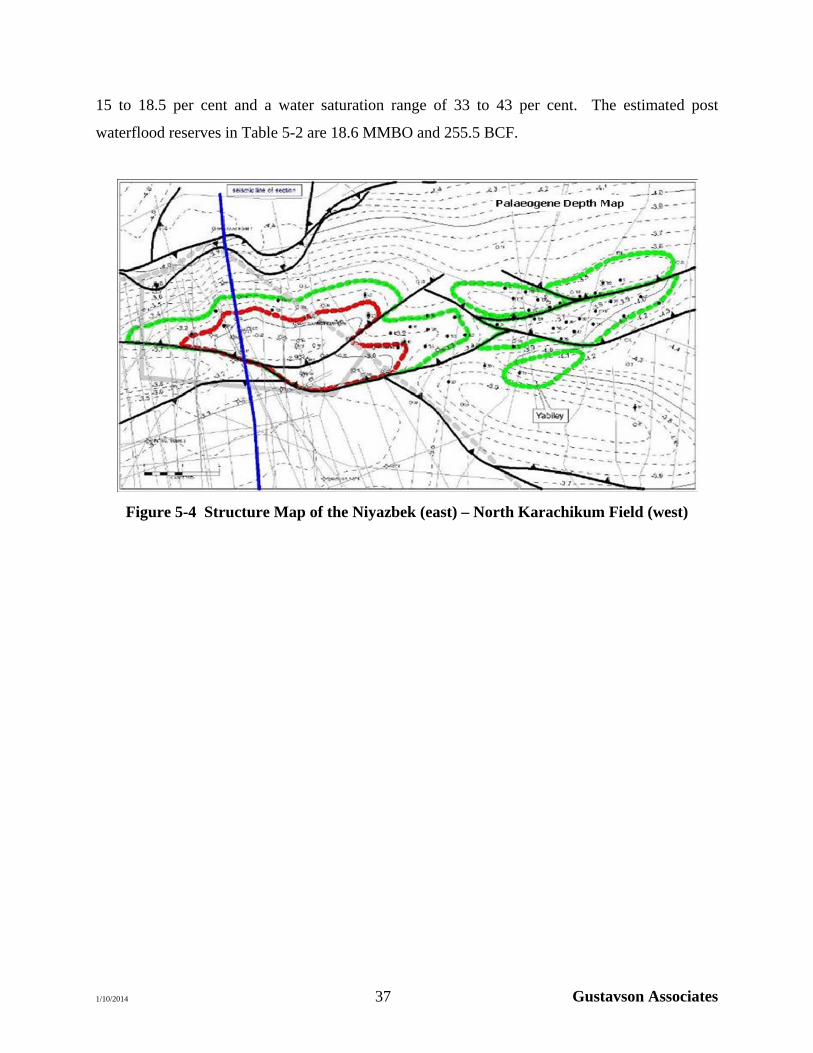
This field, located near the Northwest and NOK Permits, was discovered in 1974 and developed
as oil with associated gas and a gas condensate NW-SE oriented complex of 3- and 4- way
closures on a south-vergent thrust system. The field is partitioned into multiple pools by WNW-
ESE wrench or oblique-slip faults (Figure 5-4) that are oil (green outlines) and gas (red outlines)
reservoirs. The WNW-ESE fault grain is probably controlled by a basement transfer zone. The
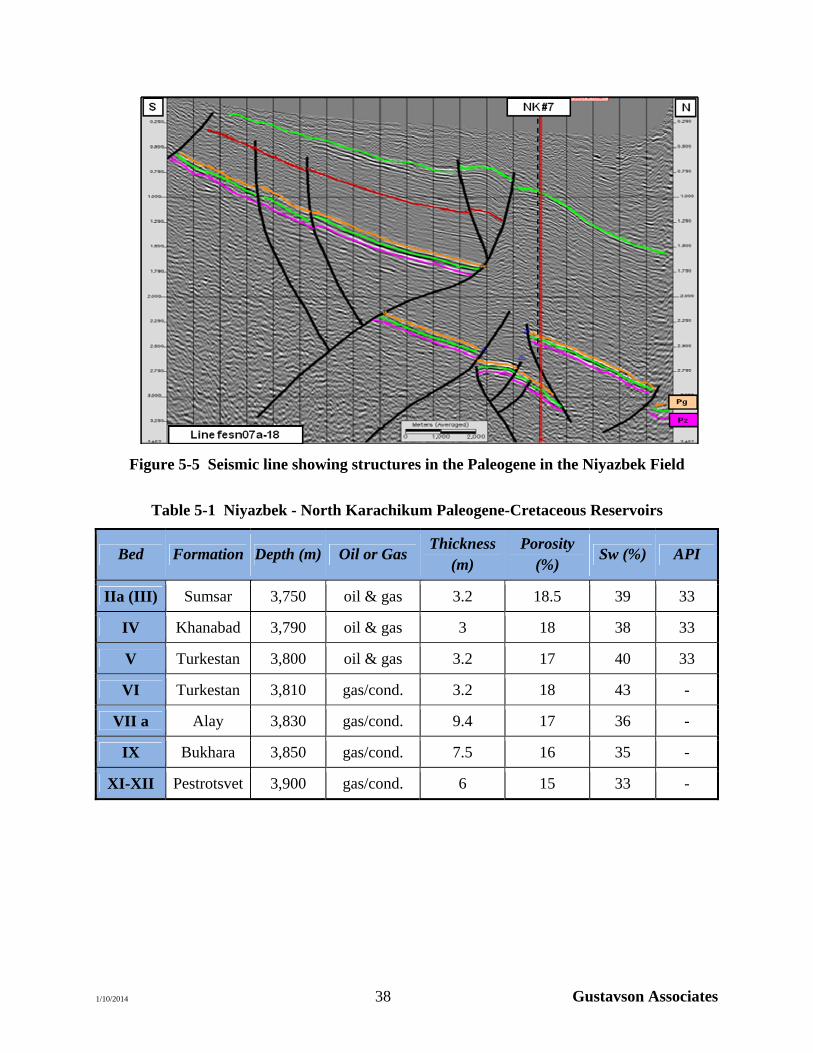
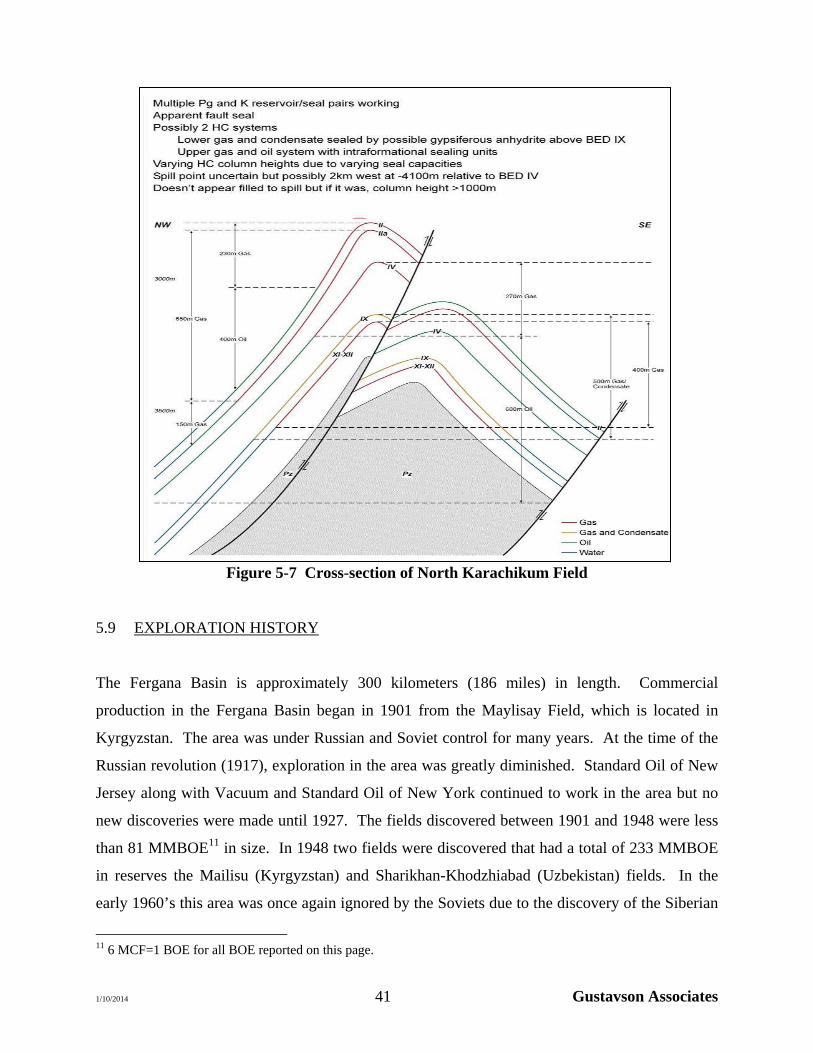
faulting and structures can be seen on the seismic line in Figure 5-5 and the cross-section in
Figure 5-7. And the multiple reservoirs are depicted in Figure 5-6 which is a composite log
section from well #81. The oil specific gravity from the field is 0.859 with a sulphur content of
0.33 per cent and paraffin of 3.7 per cent. The condensate/gas ratio (CGR) from the field is 114
Bbl/MM and the cumulative production through 1987 is 12 MMBO and 156 BCF.
The producing reservoir characteristics and the estimated reserves are in Table 5-1 and Table
5-2, respectively. The reservoir thickness ranges from 3 to 9.4 meters with a porosity range of
1/10/2014 37 Gustavson Associates
15 to 18.5 per cent and a water saturation range of 33 to 43 per cent. The estimated post
waterflood reserves in Table 5-2 are 18.6 MMBO and 255.5 BCF.
Figure 5-4 Structure Map of the Niyazbek (east) – North Karachikum Field (west)
1/10/2014 38 Gustavson Associates
Figure 5-5 Seismic line showing structures in the Paleogene in the Niyazbek Field
Table 5-1 Niyazbek - North Karachikum Paleogene-Cretaceous Reservoirs
Bed Formation Depth (m) Oil or Gas Thickness
(m) Porosity
(%) Sw (%) API
IIa (III) Sumsar 3,750 oil & gas 3.2 18.5 39 33
IV Khanabad 3,790 oil & gas 3 18 38 33
V Turkestan 3,800 oil & gas 3.2 17 40 33
VI Turkestan 3,810 gas/cond. 3.2 18 43 -
VII a Alay 3,830 gas/cond. 9.4 17 36 -
IX Bukhara 3,850 gas/cond. 7.5 16 35 -
XI-XII Pestrotsvet 3,900 gas/cond. 6 15 33 -
1/10/2014 39 Gustavson Associates
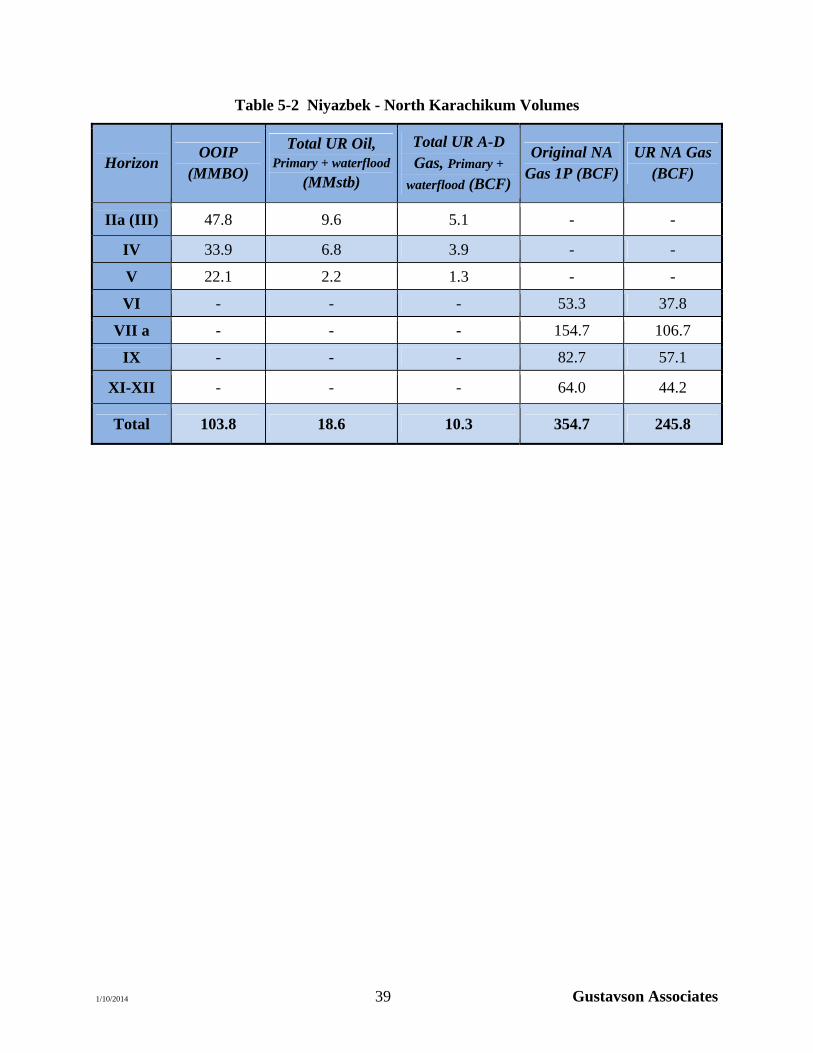
Table 5-2 Niyazbek - North Karachikum Volumes
Horizon OOIP
(MMBO)
Total UR Oil, Primary + waterflood
(MMstb)
Total UR A-D Gas, Primary +
waterflood (BCF)
Original NA Gas 1P (BCF)
UR NA Gas (BCF)
IIa (III) 47.8 9.6 5.1 - -
IV 33.9 6.8 3.9 - -
V 22.1 2.2 1.3 - -
VI - - - 53.3 37.8
VII a - - - 154.7 106.7
IX - - - 82.7 57.1
XI-XII - - - 64.0 44.2
Total 103.8 18.6 10.3 354.7 245.8
1/10/2014 40 Gustavson Associates
Figure 5-6 North Karachikum #81 Composite Log Section Showing Reservoir Intervals
1/10/2014 41 Gustavson Associates
Figure 5-7 Cross-section of North Karachikum Field
5.9 EXPLORATION HISTORY
The Fergana Basin is approximately 300 kilometers (186 miles) in length. Commercial
production in the Fergana Basin began in 1901 from the Maylisay Field, which is located in
Kyrgyzstan. The area was under Russian and Soviet control for many years. At the time of the
Russian revolution (1917), exploration in the area was greatly diminished. Standard Oil of New
Jersey along with Vacuum and Standard Oil of New York continued to work in the area but no
new discoveries were made until 1927. The fields discovered between 1901 and 1948 were less
than 81 MMBOE11 in size. In 1948 two fields were discovered that had a total of 233 MMBOE
in reserves the Mailisu (Kyrgyzstan) and Sharikhan-Khodzhiabad (Uzbekistan) fields. In the
early 1960’s this area was once again ignored by the Soviets due to the discovery of the Siberian
11 6 MCF=1 BOE for all BOE reported on this page.
1/10/2014 42 Gustavson Associates
oil fields. The Mingbulak discovery was drilled in 1992 just as the Soviet Union was collapsing.
It was the first deep structure that was tested in the basin. Over 90 fields have been discovered in
the basin to date ranging from 260 MMBOE to less than 1 MMBOE. The discovered fields have
had an average of 60 per cent oil and 40 per cent gas reservoirs. The average length and width of
a reservoir in the basin is 6.24 by 1.68 kilometers (3.88 by 1.04 miles). Most of the discovered
oil fields in the basin are in Uzbekistan. In August 1993 Uzbekistan offered blocks for
competitive bids across the valley area of the basin followed by Kyrgyzstan in 2004 and
Tajikistan in 2007.
5.10 CONTRACT AREAS
The total contract or permit areas in Tajikistan are 3,719 square kilometers (918,985 acres)
(Figure 5-8, Figure 5-9). Permit terms are described in Section 7.2 of this Report.
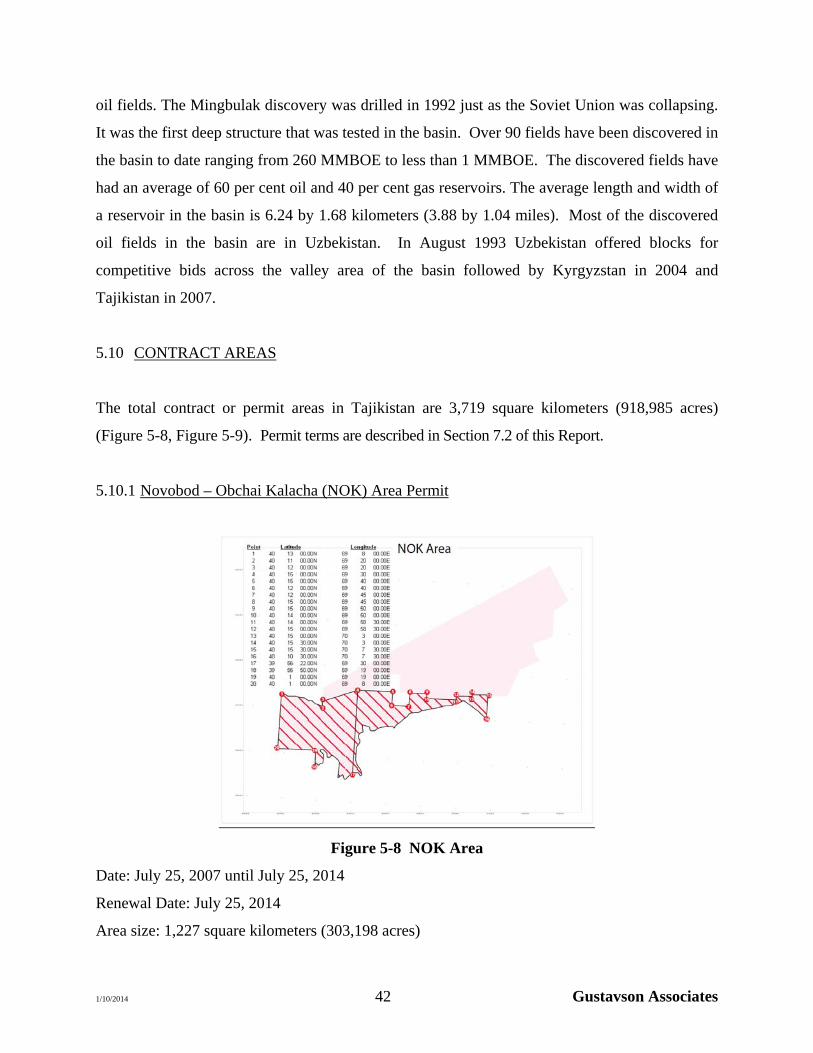
5.10.1 Novobod – Obchai Kalacha (NOK) Area Permit
Figure 5-8 NOK Area
Date: July 25, 2007 until July 25, 2014
Renewal Date: July 25, 2014
Area size: 1,227 square kilometers (303,198 acres)
1/10/2014 43 Gustavson Associates
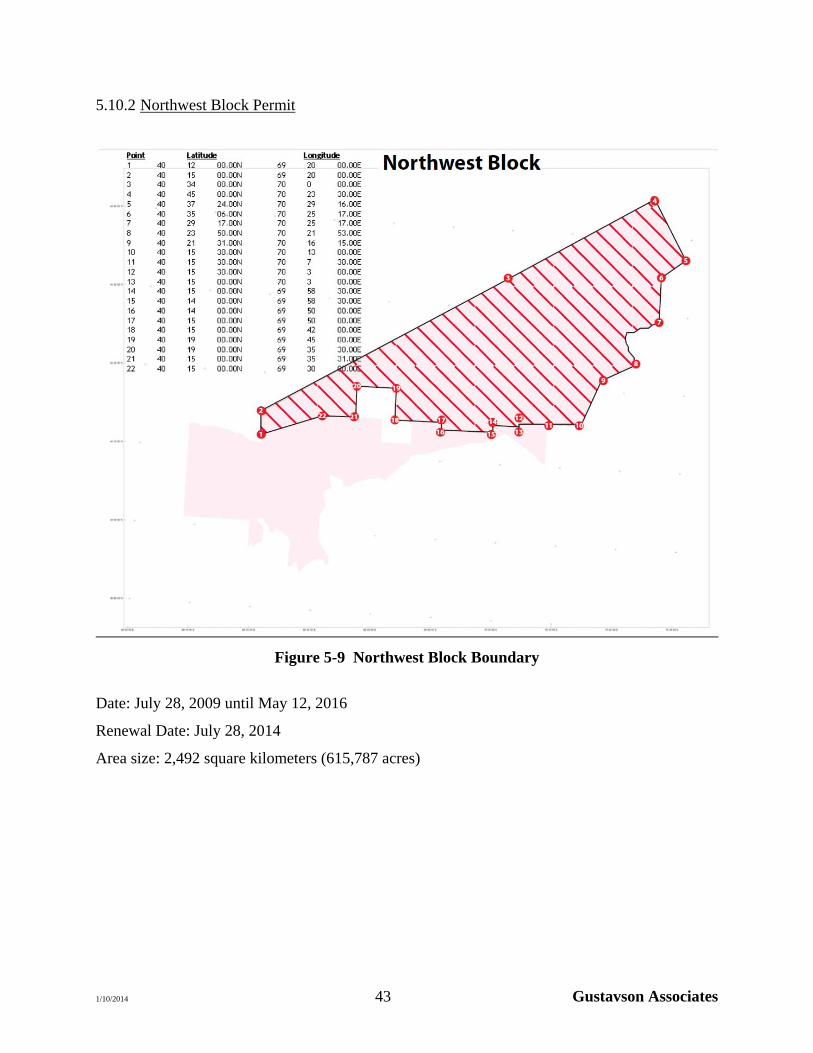
5.10.2 Northwest Block Permit
Figure 5-9 Northwest Block Boundary
Date: July 28, 2009 until May 12, 2016
Renewal Date: July 28, 2014
Area size: 2,492 square kilometers (615,787 acres)
1/10/2014 44 Gustavson Associates
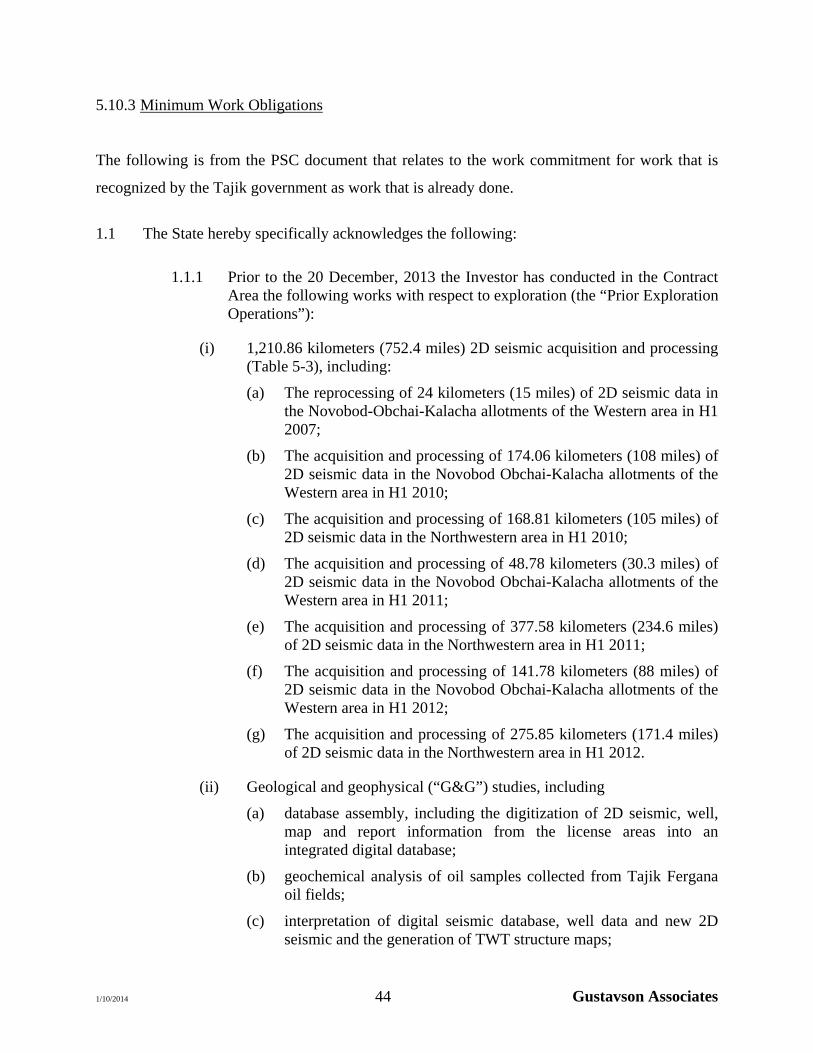
5.10.3 Minimum Work Obligations
The following is from the PSC document that relates to the work commitment for work that is
recognized by the Tajik government as work that is already done.
1.1 The State hereby specifically acknowledges the following:
1.1.1 Prior to the 20 December, 2013 the Investor has conducted in the Contract Area the following works with respect to exploration (the “Prior Exploration Operations”):
(i) 1,210.86 kilometers (752.4 miles) 2D seismic acquisition and processing (Table 5-3), including:
(a) The reprocessing of 24 kilometers (15 miles) of 2D seismic data in the Novobod-Obchai-Kalacha allotments of the Western area in H1 2007;
(b) The acquisition and processing of 174.06 kilometers (108 miles) of 2D seismic data in the Novobod Obchai-Kalacha allotments of the Western area in H1 2010;
(c) The acquisition and processing of 168.81 kilometers (105 miles) of 2D seismic data in the Northwestern area in H1 2010;
(d) The acquisition and processing of 48.78 kilometers (30.3 miles) of 2D seismic data in the Novobod Obchai-Kalacha allotments of the Western area in H1 2011;
(e) The acquisition and processing of 377.58 kilometers (234.6 miles) of 2D seismic data in the Northwestern area in H1 2011;
(f) The acquisition and processing of 141.78 kilometers (88 miles) of 2D seismic data in the Novobod Obchai-Kalacha allotments of the Western area in H1 2012;
(g) The acquisition and processing of 275.85 kilometers (171.4 miles) of 2D seismic data in the Northwestern area in H1 2012.
(ii) Geological and geophysical (“G&G”) studies, including
(a) database assembly, including the digitization of 2D seismic, well, map and report information from the license areas into an integrated digital database;
(b) geochemical analysis of oil samples collected from Tajik Fergana oil fields;
(c) interpretation of digital seismic database, well data and new 2D seismic and the generation of TWT structure maps;
1/10/2014 45 Gustavson Associates
(d) hydrocarbon generation and migration modelling;
(e) prospect generation and assessment, including surface and surface engineering and economic modelling;
(f) geologic prognosis and drill well planning;
(g) 2011 2D seismic acquisition program;
(iii) Administration, Management and Support
(a) maintain Dushanbe and Khujand field offices, staff salaries;
(b) technical and management time-writing costs associated with shareholder staff and contractors that are directly involved in the implementation of the present Agreement;
(c) contracting support;
(iv) statutory reporting.
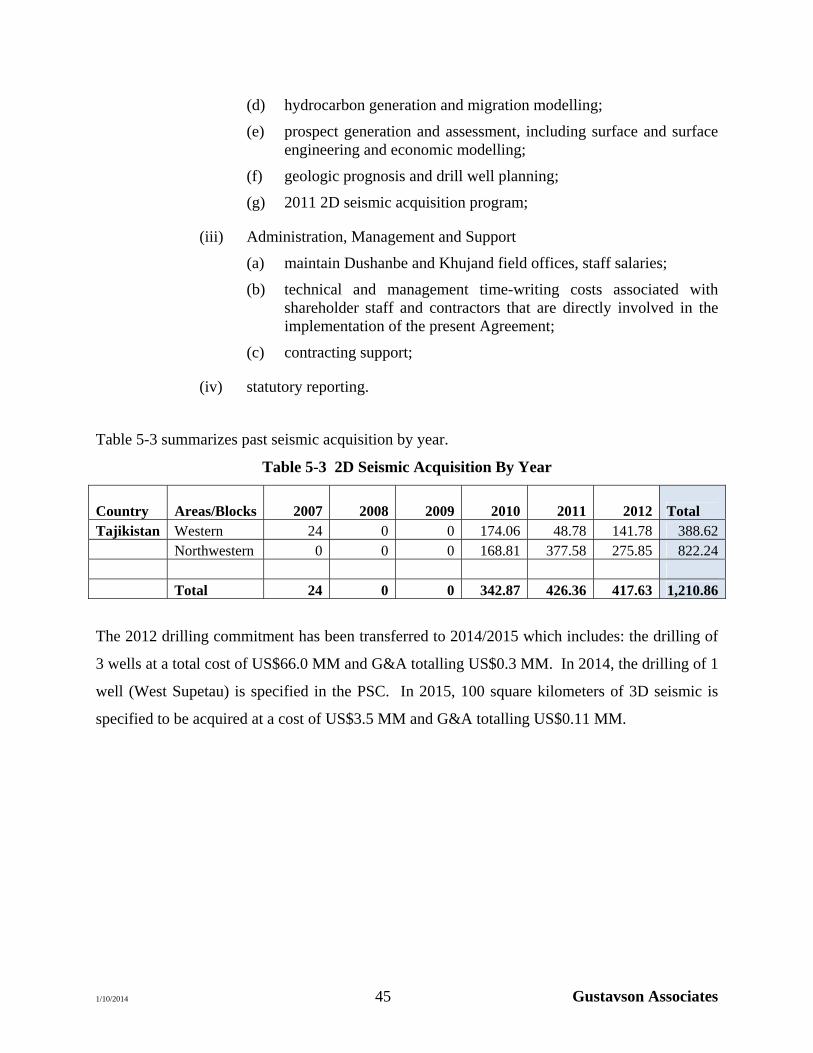
Table 5-3 summarizes past seismic acquisition by year.
Table 5-3 2D Seismic Acquisition By Year
Country Areas/Blocks 2007 2008 2009 2010 2011 2012 Total Tajikistan Western 24 0 0 174.06 48.78 141.78 388.62 Northwestern 0 0 0 168.81 377.58 275.85 822.24 Total 24 0 0 342.87 426.36 417.63 1,210.86
The 2012 drilling commitment has been transferred to 2014/2015 which includes: the drilling of
3 wells at a total cost of US$66.0 MM and G&A totalling US$0.3 MM. In 2014, the drilling of 1
well (West Supetau) is specified in the PSC. In 2015, 100 square kilometers of 3D seismic is
specified to be acquired at a cost of US$3.5 MM and G&A totalling US$0.11 MM.
1/10/2014 46 Gustavson Associates
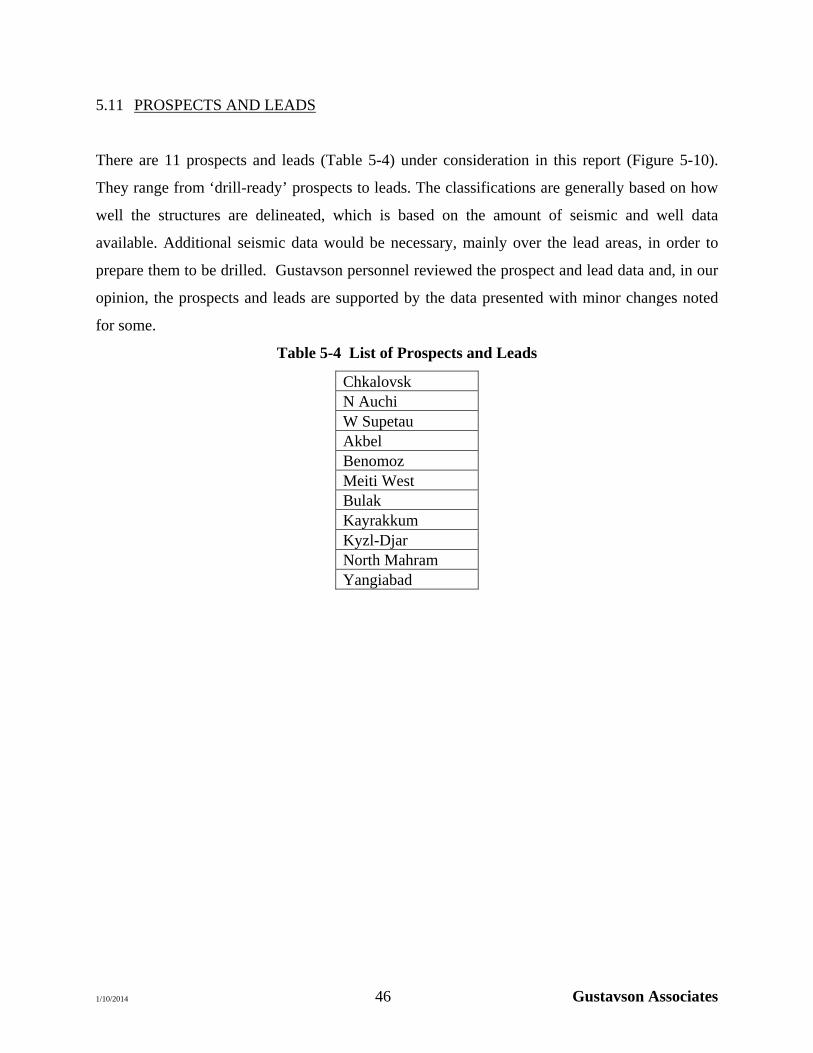
5.11 PROSPECTS AND LEADS
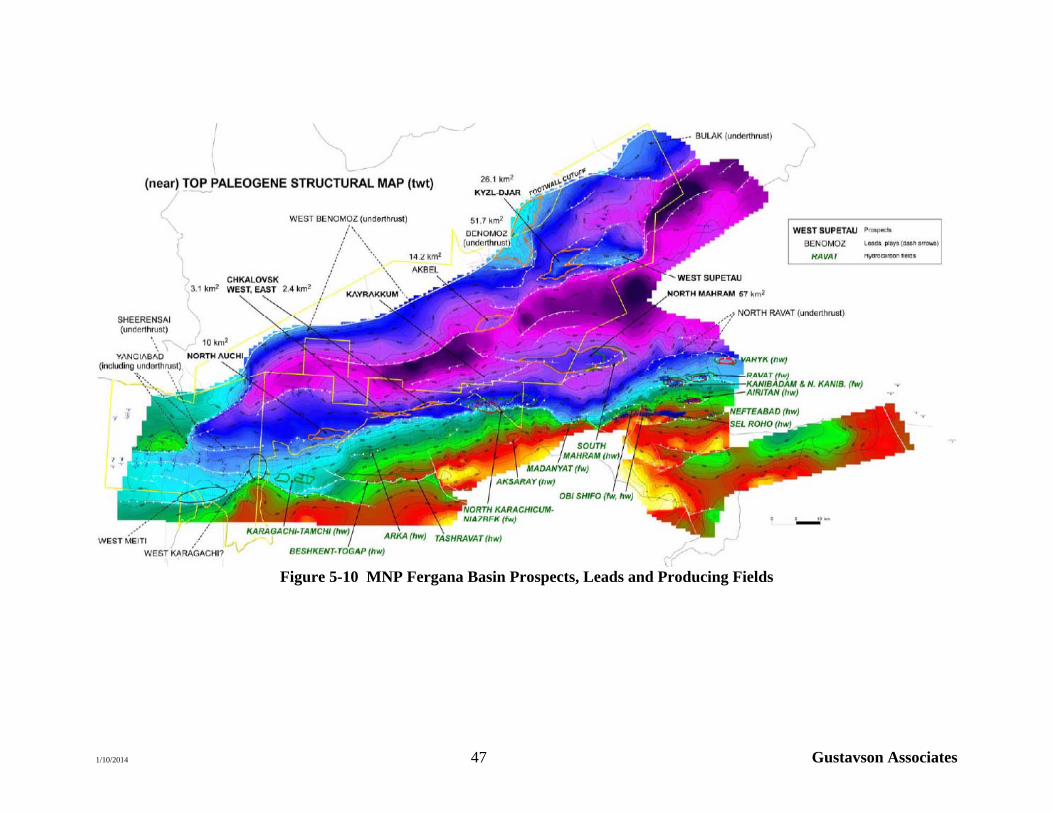
There are 11 prospects and leads (Table 5-4) under consideration in this report (Figure 5-10).
They range from ‘drill-ready’ prospects to leads. The classifications are generally based on how
well the structures are delineated, which is based on the amount of seismic and well data
available. Additional seismic data would be necessary, mainly over the lead areas, in order to
prepare them to be drilled. Gustavson personnel reviewed the prospect and lead data and, in our
opinion, the prospects and leads are supported by the data presented with minor changes noted
for some.
Table 5-4 List of Prospects and Leads
Chkalovsk N Auchi W Supetau Akbel Benomoz Meiti West Bulak Kayrakkum Kyzl-Djar North Mahram Yangiabad
1/10/2014 47 Gustavson Associates
Figure 5-10 MNP Fergana Basin Prospects, Leads and Producing Fields
1/10/2014 48 Gustavson Associates
The Danubian Energy Consulting maps of these prospects and leads have been reviewed with the
exception of Yangiabad, Meiti West, and Bulak. The descriptions and parameters from the prior
report have been used here for these three leads.
Minor changes were noted in the fault mapping of two of the Danubian leads. These are detailed
on the figures for the prospect or lead.
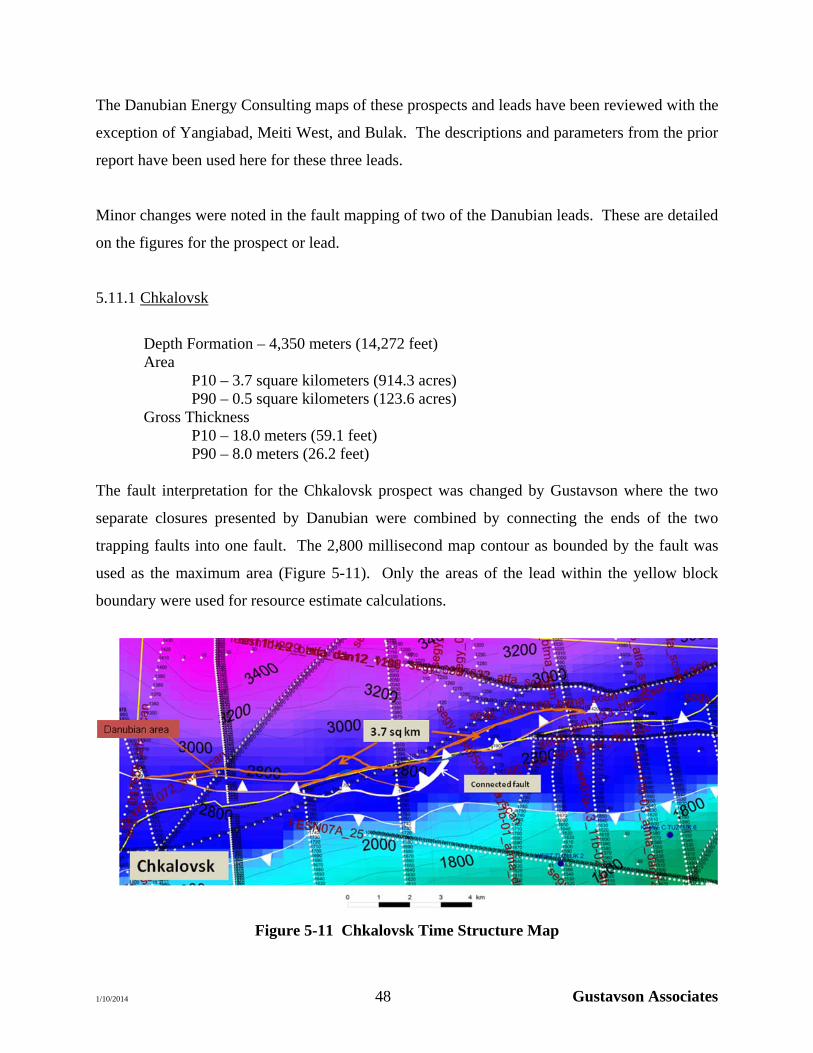
5.11.1 Chkalovsk
Depth Formation – 4,350 meters (14,272 feet) Area P10 – 3.7 square kilometers (914.3 acres) P90 – 0.5 square kilometers (123.6 acres) Gross Thickness P10 – 18.0 meters (59.1 feet) P90 – 8.0 meters (26.2 feet) The fault interpretation for the Chkalovsk prospect was changed by Gustavson where the two
separate closures presented by Danubian were combined by connecting the ends of the two
trapping faults into one fault. The 2,800 millisecond map contour as bounded by the fault was
used as the maximum area (Figure 5-11). Only the areas of the lead within the yellow block
boundary were used for resource estimate calculations.
Figure 5-11 Chkalovsk Time Structure Map
1/10/2014 49 Gustavson Associates
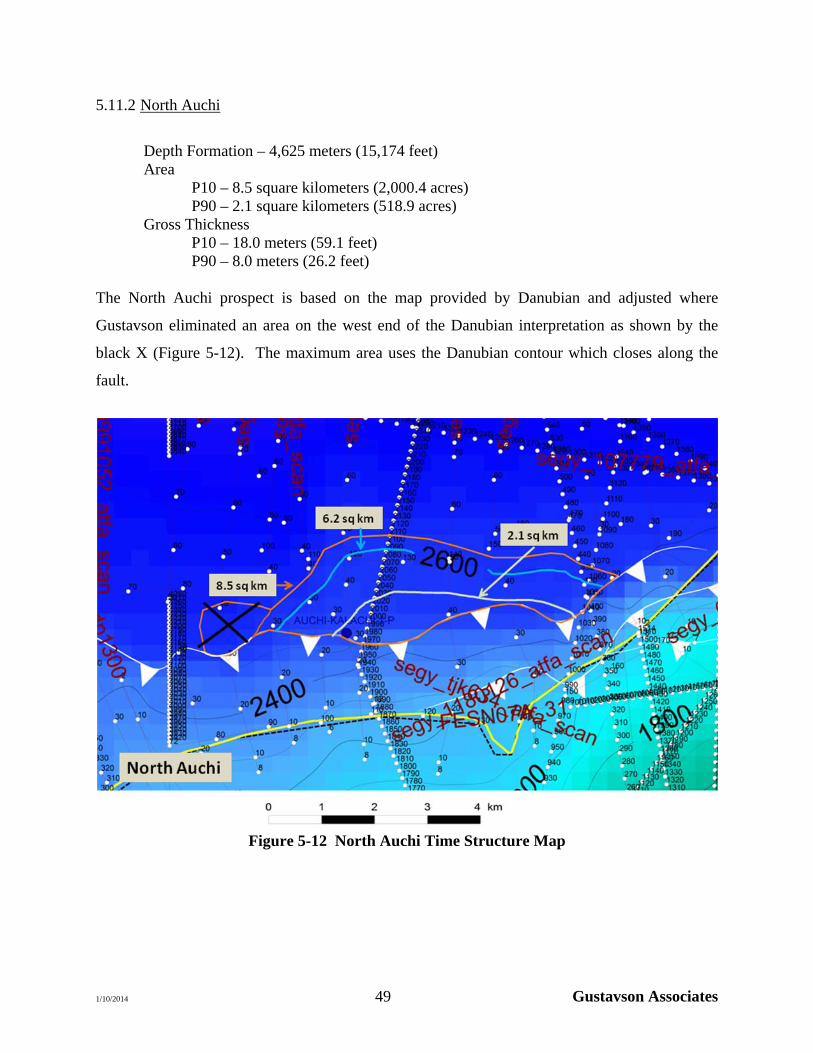
5.11.2 North Auchi
Depth Formation – 4,625 meters (15,174 feet) Area P10 – 8.5 square kilometers (2,000.4 acres) P90 – 2.1 square kilometers (518.9 acres) Gross Thickness P10 – 18.0 meters (59.1 feet) P90 – 8.0 meters (26.2 feet) The North Auchi prospect is based on the map provided by Danubian and adjusted where
Gustavson eliminated an area on the west end of the Danubian interpretation as shown by the
black X (Figure 5-12). The maximum area uses the Danubian contour which closes along the
fault.
Figure 5-12 North Auchi Time Structure Map
1/10/2014 50 Gustavson Associates
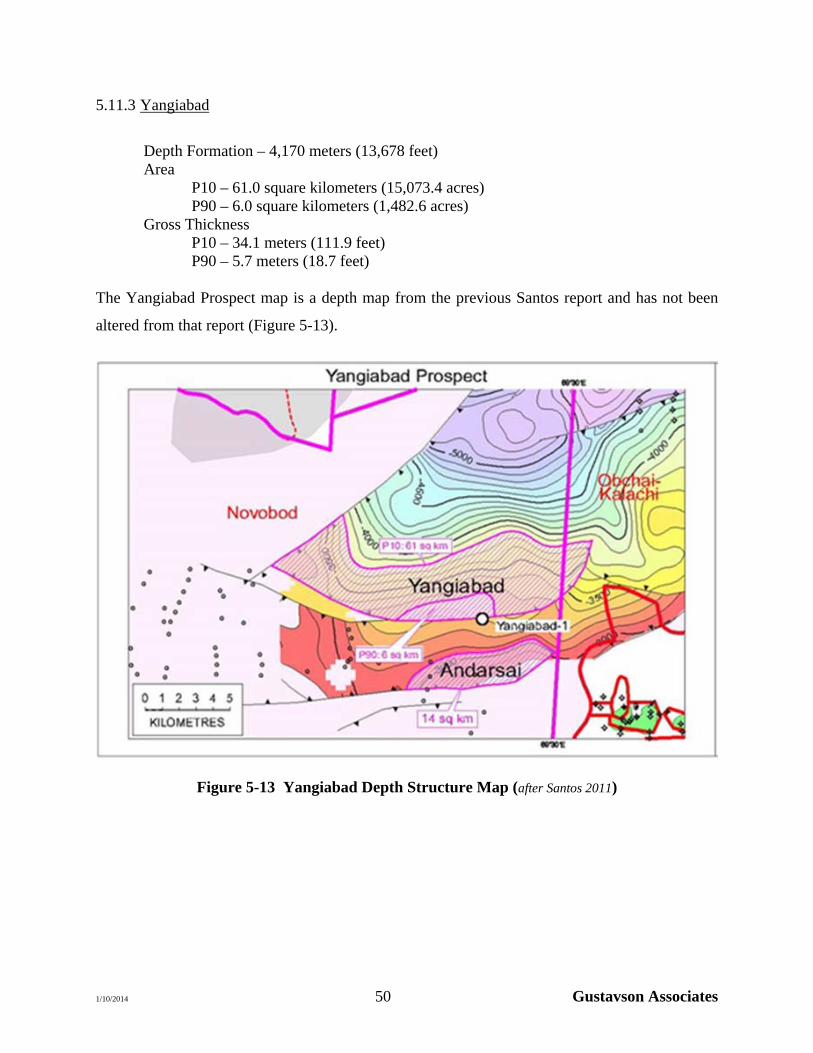
5.11.3 Yangiabad
Depth Formation – 4,170 meters (13,678 feet) Area P10 – 61.0 square kilometers (15,073.4 acres) P90 – 6.0 square kilometers (1,482.6 acres) Gross Thickness P10 – 34.1 meters (111.9 feet) P90 – 5.7 meters (18.7 feet) The Yangiabad Prospect map is a depth map from the previous Santos report and has not been
altered from that report (Figure 5-13).
Figure 5-13 Yangiabad Depth Structure Map (after Santos 2011)
1/10/2014 51 Gustavson Associates
5.11.4 Meiti West
Depth Formation – 4,000 meters (13,123 feet) Area P10 – 41.5 square kilometers (10,254.9 acres) P90 – 3.0 square kilometers (741.3 acres) Gross Thickness P10 – 42.0 meters (137.8 feet) P90 – 7.0 meters (23.0 feet)
(Map Not Available)
1/10/2014 52 Gustavson Associates
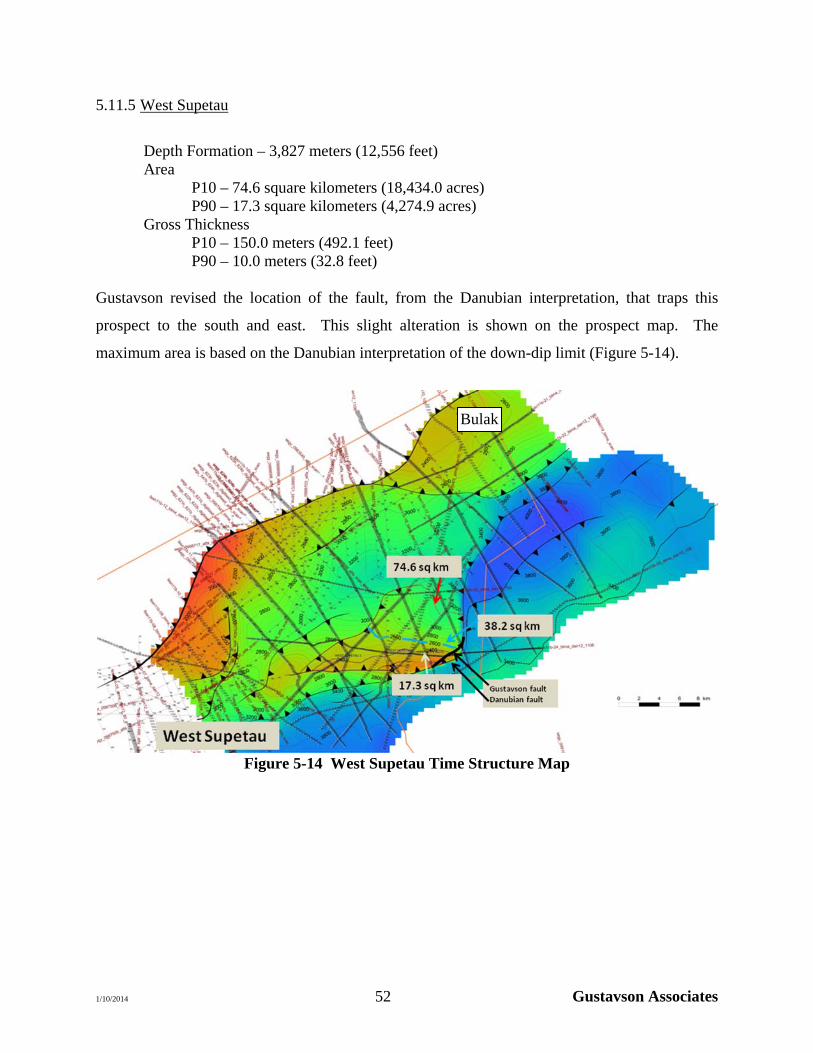
5.11.5 West Supetau
Depth Formation – 3,827 meters (12,556 feet) Area P10 – 74.6 square kilometers (18,434.0 acres) P90 – 17.3 square kilometers (4,274.9 acres) Gross Thickness P10 – 150.0 meters (492.1 feet) P90 – 10.0 meters (32.8 feet) Gustavson revised the location of the fault, from the Danubian interpretation, that traps this
prospect to the south and east. This slight alteration is shown on the prospect map. The
maximum area is based on the Danubian interpretation of the down-dip limit (Figure 5-14).
Figure 5-14 West Supetau Time Structure Map
Bulak
1/10/2014 53 Gustavson Associates
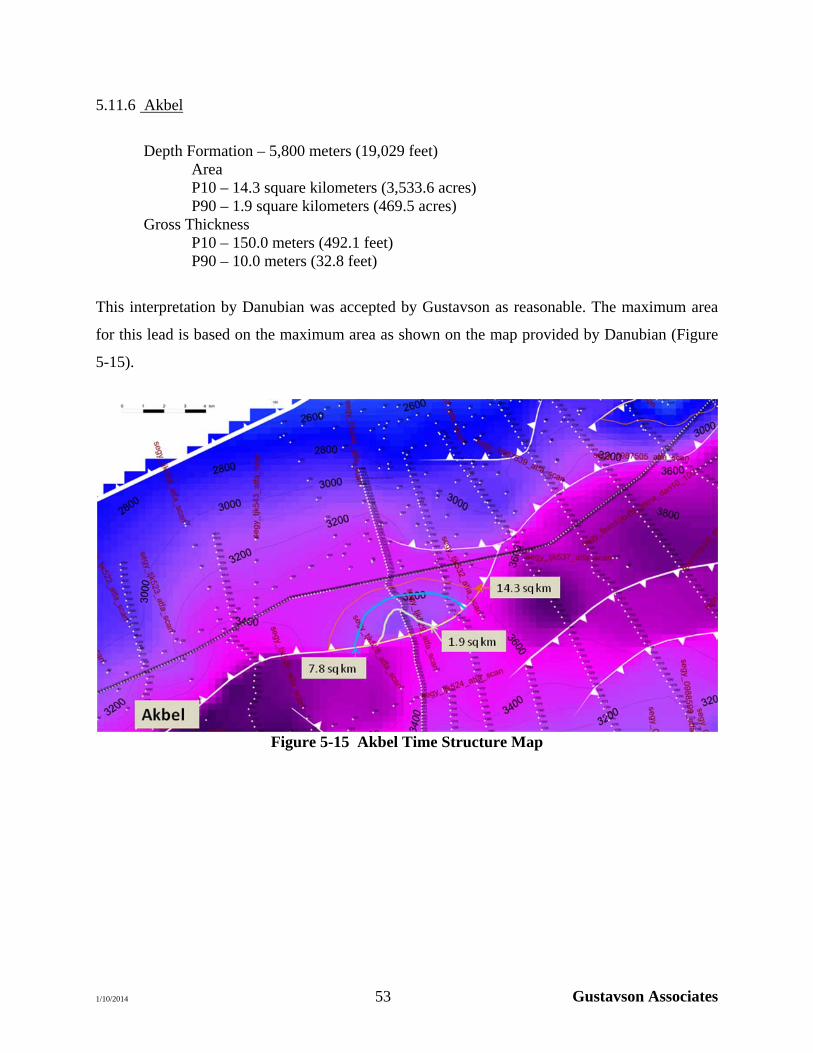
5.11.6 Akbel
Depth Formation – 5,800 meters (19,029 feet) Area P10 – 14.3 square kilometers (3,533.6 acres) P90 – 1.9 square kilometers (469.5 acres) Gross Thickness P10 – 150.0 meters (492.1 feet) P90 – 10.0 meters (32.8 feet)
This interpretation by Danubian was accepted by Gustavson as reasonable. The maximum area
for this lead is based on the maximum area as shown on the map provided by Danubian (Figure
5-15).
Figure 5-15 Akbel Time Structure Map
1/10/2014 54 Gustavson Associates
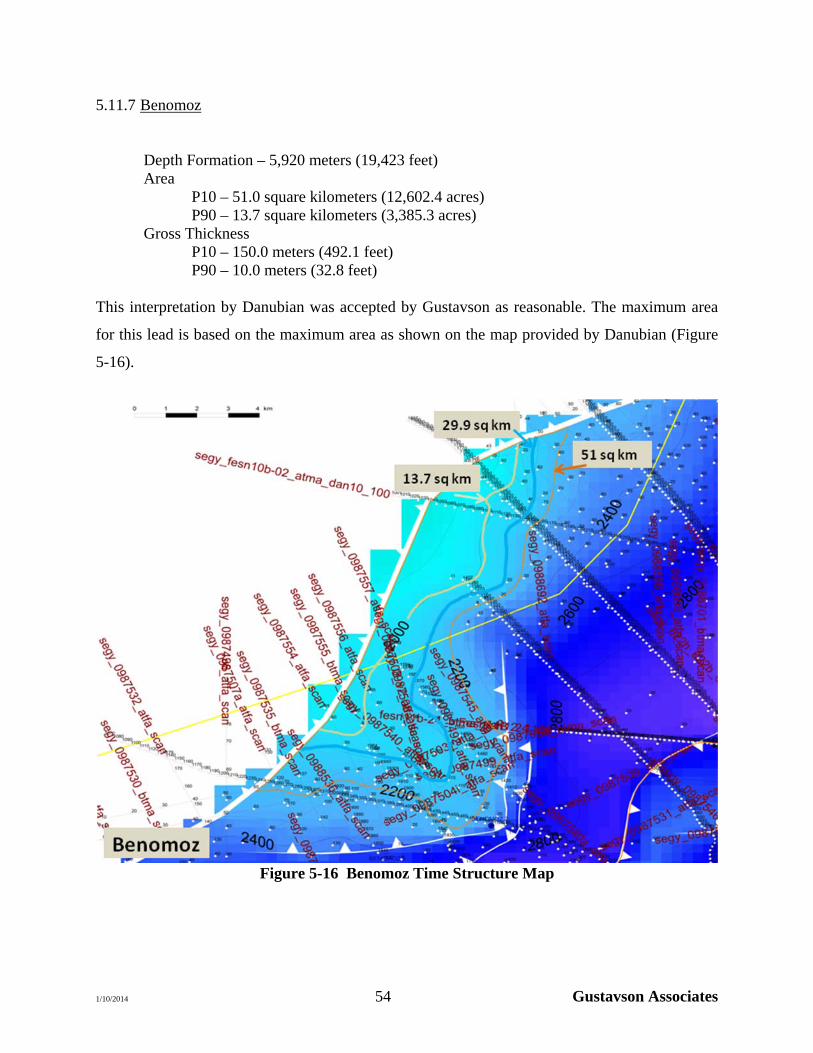
5.11.7 Benomoz
Depth Formation – 5,920 meters (19,423 feet) Area P10 – 51.0 square kilometers (12,602.4 acres) P90 – 13.7 square kilometers (3,385.3 acres) Gross Thickness P10 – 150.0 meters (492.1 feet) P90 – 10.0 meters (32.8 feet) This interpretation by Danubian was accepted by Gustavson as reasonable. The maximum area
for this lead is based on the maximum area as shown on the map provided by Danubian (Figure
5-16).
Figure 5-16 Benomoz Time Structure Map
1/10/2014 55 Gustavson Associates
5.11.8 Bulak
Depth Formation – 6,160 meters (20,210 feet) Area P10 – 60.0 square kilometers (14,826.3 acres) P90 – 5.0 square kilometers (1,235.5 acres) Gross Thickness P10 – 150.0 meters (492.1 feet) P90 – 10.0 meters (32.8 feet) (Figure 5-14 in the NE corner of the map)
1/10/2014 56 Gustavson Associates
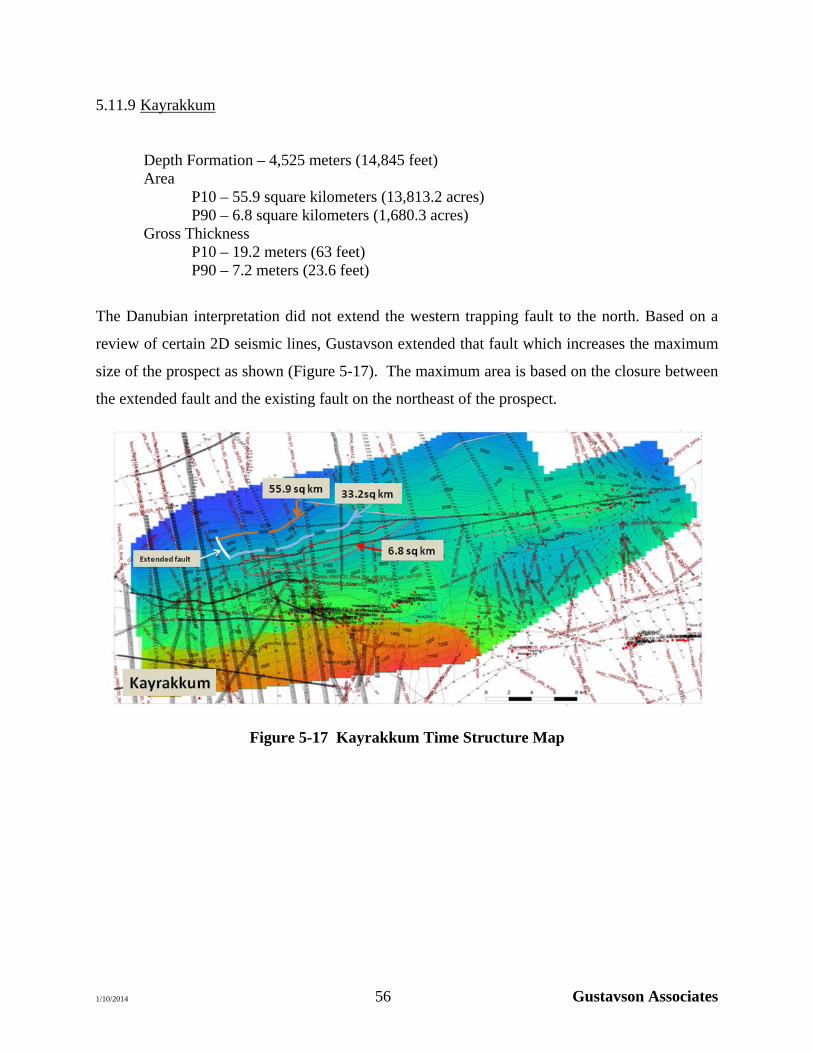
5.11.9 Kayrakkum
Depth Formation – 4,525 meters (14,845 feet) Area P10 – 55.9 square kilometers (13,813.2 acres) P90 – 6.8 square kilometers (1,680.3 acres) Gross Thickness P10 – 19.2 meters (63 feet) P90 – 7.2 meters (23.6 feet)
The Danubian interpretation did not extend the western trapping fault to the north. Based on a
review of certain 2D seismic lines, Gustavson extended that fault which increases the maximum
size of the prospect as shown (Figure 5-17). The maximum area is based on the closure between
the extended fault and the existing fault on the northeast of the prospect.
Figure 5-17 Kayrakkum Time Structure Map
1/10/2014 57 Gustavson Associates
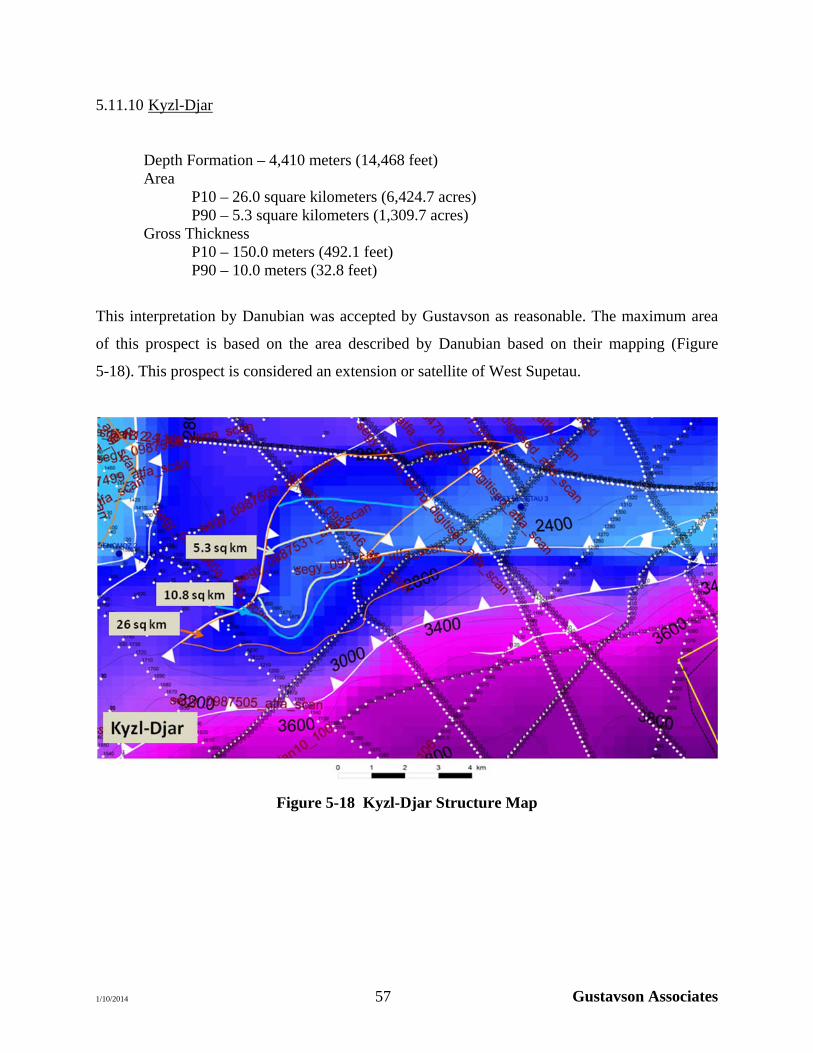
5.11.10 Kyzl-Djar
Depth Formation – 4,410 meters (14,468 feet) Area P10 – 26.0 square kilometers (6,424.7 acres) P90 – 5.3 square kilometers (1,309.7 acres) Gross Thickness P10 – 150.0 meters (492.1 feet) P90 – 10.0 meters (32.8 feet)
This interpretation by Danubian was accepted by Gustavson as reasonable. The maximum area
of this prospect is based on the area described by Danubian based on their mapping (Figure
5-18). This prospect is considered an extension or satellite of West Supetau.
Figure 5-18 Kyzl-Djar Structure Map
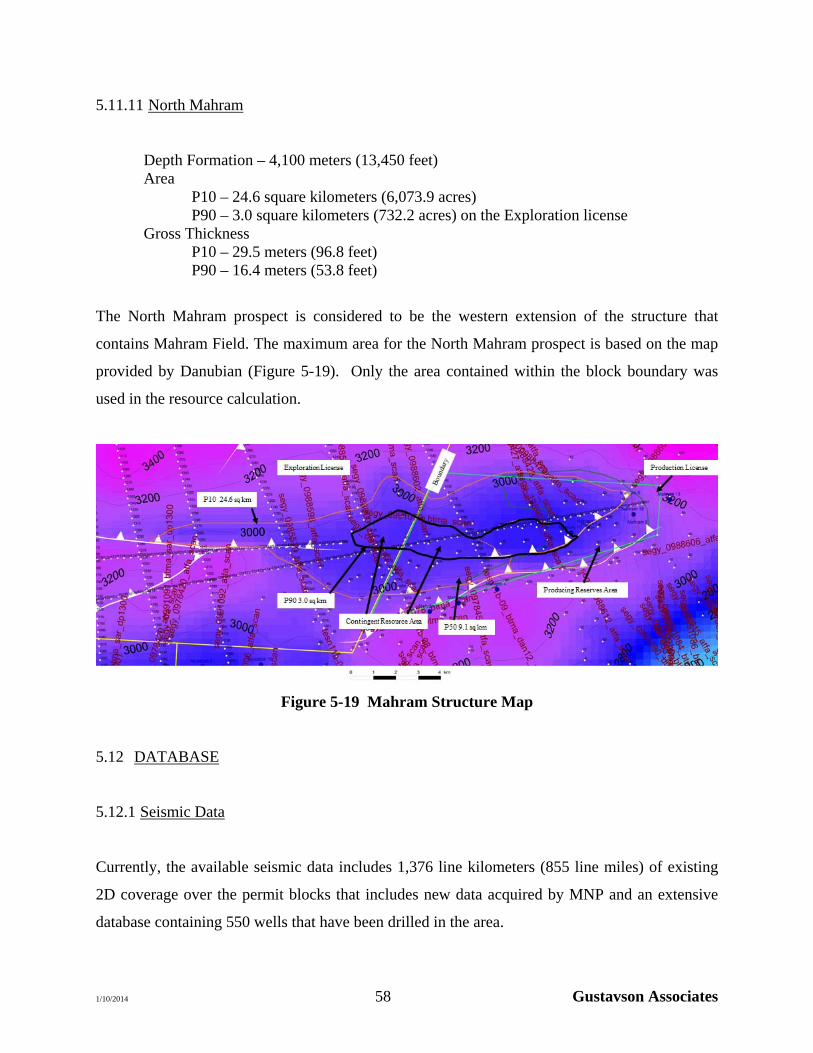
1/10/2014 58 Gustavson Associates
5.11.11 North Mahram
Depth Formation – 4,100 meters (13,450 feet) Area P10 – 24.6 square kilometers (6,073.9 acres) P90 – 3.0 square kilometers (732.2 acres) on the Exploration license Gross Thickness P10 – 29.5 meters (96.8 feet) P90 – 16.4 meters (53.8 feet)
The North Mahram prospect is considered to be the western extension of the structure that
contains Mahram Field. The maximum area for the North Mahram prospect is based on the map
provided by Danubian (Figure 5-19). Only the area contained within the block boundary was
used in the resource calculation.
Figure 5-19 Mahram Structure Map
5.12 DATABASE
5.12.1 Seismic Data
Currently, the available seismic data includes 1,376 line kilometers (855 line miles) of existing
2D coverage over the permit blocks that includes new data acquired by MNP and an extensive
database containing 550 wells that have been drilled in the area.
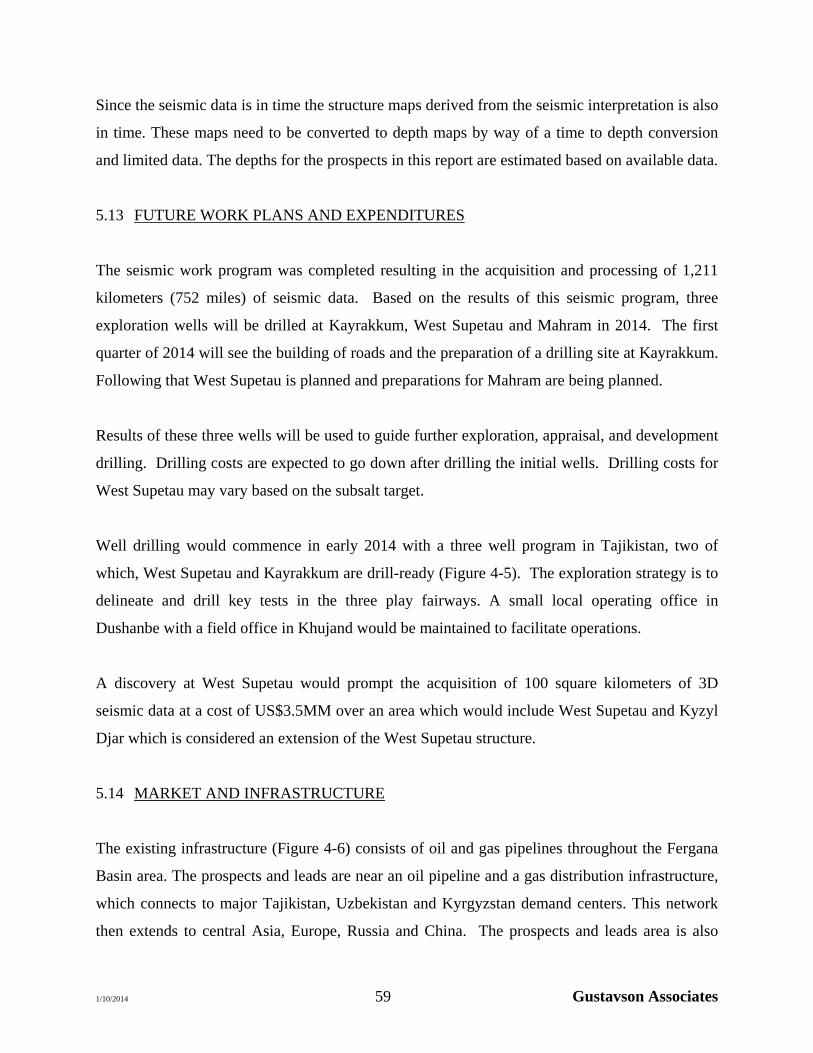
1/10/2014 59 Gustavson Associates
Since the seismic data is in time the structure maps derived from the seismic interpretation is also
in time. These maps need to be converted to depth maps by way of a time to depth conversion
and limited data. The depths for the prospects in this report are estimated based on available data.
5.13 FUTURE WORK PLANS AND EXPENDITURES
The seismic work program was completed resulting in the acquisition and processing of 1,211
kilometers (752 miles) of seismic data. Based on the results of this seismic program, three
exploration wells will be drilled at Kayrakkum, West Supetau and Mahram in 2014. The first
quarter of 2014 will see the building of roads and the preparation of a drilling site at Kayrakkum.
Following that West Supetau is planned and preparations for Mahram are being planned.
Results of these three wells will be used to guide further exploration, appraisal, and development
drilling. Drilling costs are expected to go down after drilling the initial wells. Drilling costs for
West Supetau may vary based on the subsalt target.
Well drilling would commence in early 2014 with a three well program in Tajikistan, two of
which, West Supetau and Kayrakkum are drill-ready (Figure 4-5). The exploration strategy is to
delineate and drill key tests in the three play fairways. A small local operating office in
Dushanbe with a field office in Khujand would be maintained to facilitate operations.
A discovery at West Supetau would prompt the acquisition of 100 square kilometers of 3D
seismic data at a cost of US$3.5MM over an area which would include West Supetau and Kyzyl
Djar which is considered an extension of the West Supetau structure.
5.14 MARKET AND INFRASTRUCTURE
The existing infrastructure (Figure 4-6) consists of oil and gas pipelines throughout the Fergana
Basin area. The prospects and leads are near an oil pipeline and a gas distribution infrastructure,
which connects to major Tajikistan, Uzbekistan and Kyrgyzstan demand centers. This network
then extends to central Asia, Europe, Russia and China. The prospects and leads area is also
1/10/2014 60 Gustavson Associates
favorably located to road and rail infrastructure which would facilitate the exportation of
produced oil, if desired. Local gas demand includes 250 million cubic feet per day (MMcf/d) in
Northern Tajik with regional Fergana area (Kyrgyzstan, Tajikistan, and Uzbekistan) demand of
approximately 550 MMcf/d. For the oil there are two local refineries: the Jalalabad (Kyrgyzstan)
Sweet Crude Refinery that was built in the 90’s with a total capacity of 9,500 Barrels of Oil per
day (BOPD), with the current load being 2,500 BOPD; and the Fergana (Uzbekistan) with a total
capacity of 66,000 BOPD of sour crude and is currently significantly under capacity. A new
refinery in Tajikistan is scheduled to be operational in 2016. Other options would be to export
the oil to neighboring countries.
The Tajikistan gas markets are reliant on imports from Uzbekistan which total approximately
350 BCF per year. There is a ready market for both oil and gas in the area.
The current plan is to truck the oil to the local refinery with the oil sold at the wellhead and the
gas would be transported by a new US$4MM pipeline and sold in the local market.
1/10/2014 61 Gustavson Associates
6. PROBABILISTIC RESOURCE ANALYSIS
6.1 GENERAL
A probabilistic resource analysis is most applicable for projects such as evaluating the potential
resources of an exploratory area like the permit areas, where a range of values exists in the
reservoir parameters. The range of the expected reservoir data is quantified by probability
distributions, and an iterative approach yields an expected probability distribution for potential
resources. This approach allows consideration of most likely resources for planning purposes,
while gaining an understanding of what volumes of resources may have higher certainty, and
what potential upside may exist for the project.
The analysis for this project was carried out considering the range of values for all parameters in
the volumetric resource equations.
6.2 INPUT PARAMETERS
This method involves estimating probability distributions for the range of reservoir parameters
and performing a statistical risk analysis involving multiple iterations of resource calculations
generated by random numbers and the specified distributions of reservoir parameters. To do this,
each parameter incorporated in our resource calculation was evaluated for its expected
probability distribution.
A triangular distribution with specification of P90, most likely or mode, and P10 values was used
for a variable representing the fraction of the prospect located within the current license area.
For the majority of the parameters in this analysis, lognormal probability distributions were used,
with input of mean, P90, and P10 values. Some parameters were modeled with uniform
distributions, with input of P90 and P10 values and equal probability of incurring any value in the
distribution.
1/10/2014 62 Gustavson Associates
Gustavson was provided with input distributions by the Client, based on their detailed study of
available data for the basin as described previously in this Report. Gustavson audited all of these
parameters, based on comparison to the basin database contained in the EIA report (originally
compiled by the USGS), review of seismic data for key fields, and general experience with
similar fields, and made a few adjustments to hydrocarbon saturations and recovery factors. Note
that these parameters represent average parameters over the entire play. So, for example, the
porosity ranges do not represent the range of what porosity might be in a particular well or a
particular interval, but rather the reasonable range of the average porosity for the whole play.
Most of the prospects and leads in the MNP license areas are expected to contain multiple
reservoirs. Analogous producing fields in the basin contain between one and 14 separate
reservoirs, with an average of 3.3. Some of these reservoirs are expected to be oil-bearing, while
some are expected to be gas-bearing. MNP approximated this complex situation by setting up an
input distribution for net pay that incorporates a range accommodating a varying number of
reservoirs, and applying a fraction of gas contained in the reservoir bulk volume, such as would
occur in a single reservoir with an oil deposit and a gas cap. Gustavson is of the opinion that this
is a reasonable approximation, and has used the same methodology. A summary of input
parameters is shown in Table 6-1 and Table 6-2.
6.3 PROBABILISTIC SIMULATION
Probabilistic resource analysis was performed using the Monte Carlo simulation software called
“@ Risk”. This software allows for input of a variety of probability distributions for any
parameter. Then the program performs a large number of iterations, either a large number
specified by the user, or until a specified level of stability is achieved in the output. The results
include a probability distribution for the output, sampled probability for the inputs, and
sensitivity analysis showing which input parameters have the most effect on the uncertainty in
each output parameter.
After distributions and relationships between input parameters were defined, a series of
simulations were run wherein points from the distributions were randomly selected and used to
1/10/2014 63 Gustavson Associates
calculate a single iteration of estimated potential resources. The iterations were repeated until
stable statistics (mean and standard deviation) result from the resulting output distribution. This
occurred after 5,000 iterations.
6.4 RESULTS
The output distributions were then used to characterize the Prospective Resources. Graphs of
cumulative probability versus prospective resources were constructed. Results are summarized
in Table 6-3 and Table 6-4. Note that these estimates do not include consideration for the risk of
failure in exploring for these resources. The distribution graphs for the resource estimates can be
found in Appendix A.
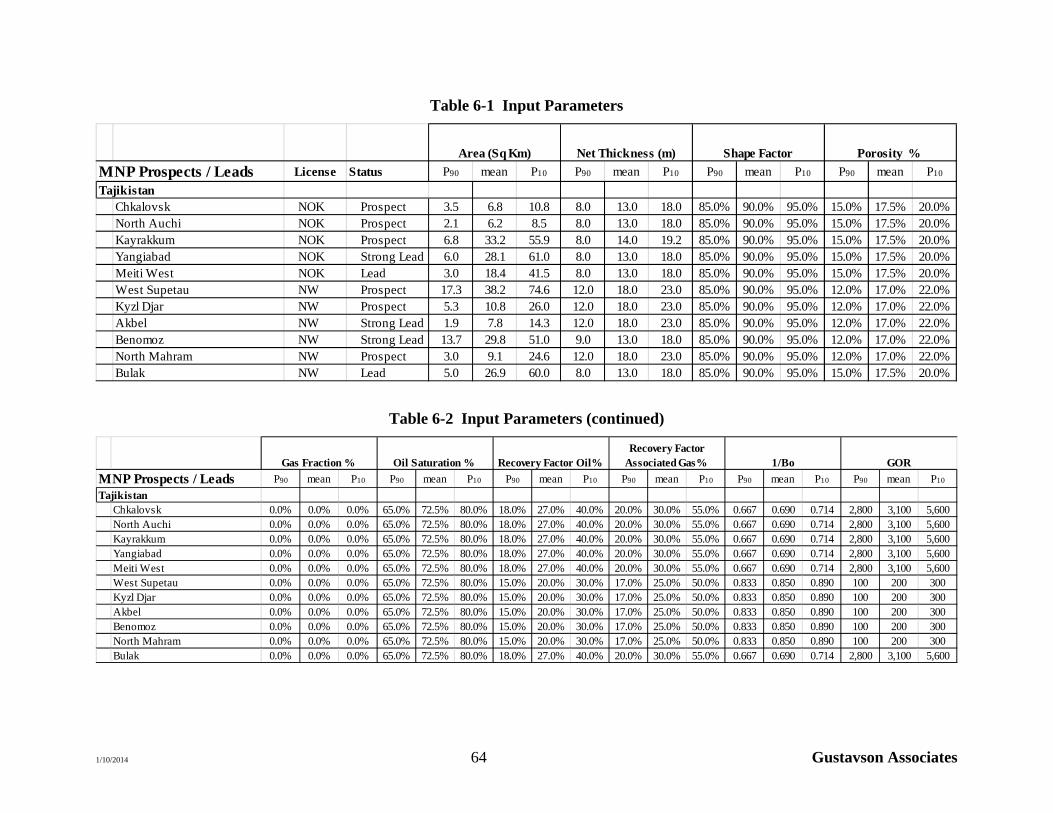
1/10/2014 64 Gustavson Associates
Table 6-1 Input Parameters
Area (Sq Km) Net Thickness (m) Shape Factor Porosity %
MNP Prospects / Leads License Status P90 mean P10 P90 mean P10 P90 mean P10 P90 mean P10
TajikistanChkalovsk NOK Prospect 3.5 6.8 10.8 8.0 13.0 18.0 85.0% 90.0% 95.0% 15.0% 17.5% 20.0%North Auchi NOK Prospect 2.1 6.2 8.5 8.0 13.0 18.0 85.0% 90.0% 95.0% 15.0% 17.5% 20.0%Kayrakkum NOK Prospect 6.8 33.2 55.9 8.0 14.0 19.2 85.0% 90.0% 95.0% 15.0% 17.5% 20.0%Yangiabad NOK Strong Lead 6.0 28.1 61.0 8.0 13.0 18.0 85.0% 90.0% 95.0% 15.0% 17.5% 20.0%Meiti West NOK Lead 3.0 18.4 41.5 8.0 13.0 18.0 85.0% 90.0% 95.0% 15.0% 17.5% 20.0%West Supetau NW Prospect 17.3 38.2 74.6 12.0 18.0 23.0 85.0% 90.0% 95.0% 12.0% 17.0% 22.0%Kyzl Djar NW Prospect 5.3 10.8 26.0 12.0 18.0 23.0 85.0% 90.0% 95.0% 12.0% 17.0% 22.0%Akbel NW Strong Lead 1.9 7.8 14.3 12.0 18.0 23.0 85.0% 90.0% 95.0% 12.0% 17.0% 22.0%Benomoz NW Strong Lead 13.7 29.8 51.0 9.0 13.0 18.0 85.0% 90.0% 95.0% 12.0% 17.0% 22.0%North Mahram NW Prospect 3.0 9.1 24.6 12.0 18.0 23.0 85.0% 90.0% 95.0% 12.0% 17.0% 22.0%Bulak NW Lead 5.0 26.9 60.0 8.0 13.0 18.0 85.0% 90.0% 95.0% 15.0% 17.5% 20.0%
Table 6-2 Input Parameters (continued)
Gas Fraction % Oil Saturation % Recovery Factor Oil%Recovery Factor
Associated Gas% 1/Bo GOR
MNP Prospects / Leads P90 mean P10 P90 mean P10 P90 mean P10 P90 mean P10 P90 mean P10 P90 mean P10
TajikistanChkalovsk 0.0% 0.0% 0.0% 65.0% 72.5% 80.0% 18.0% 27.0% 40.0% 20.0% 30.0% 55.0% 0.667 0.690 0.714 2,800 3,100 5,600North Auchi 0.0% 0.0% 0.0% 65.0% 72.5% 80.0% 18.0% 27.0% 40.0% 20.0% 30.0% 55.0% 0.667 0.690 0.714 2,800 3,100 5,600Kayrakkum 0.0% 0.0% 0.0% 65.0% 72.5% 80.0% 18.0% 27.0% 40.0% 20.0% 30.0% 55.0% 0.667 0.690 0.714 2,800 3,100 5,600Yangiabad 0.0% 0.0% 0.0% 65.0% 72.5% 80.0% 18.0% 27.0% 40.0% 20.0% 30.0% 55.0% 0.667 0.690 0.714 2,800 3,100 5,600Meiti West 0.0% 0.0% 0.0% 65.0% 72.5% 80.0% 18.0% 27.0% 40.0% 20.0% 30.0% 55.0% 0.667 0.690 0.714 2,800 3,100 5,600West Supetau 0.0% 0.0% 0.0% 65.0% 72.5% 80.0% 15.0% 20.0% 30.0% 17.0% 25.0% 50.0% 0.833 0.850 0.890 100 200 300Kyzl Djar 0.0% 0.0% 0.0% 65.0% 72.5% 80.0% 15.0% 20.0% 30.0% 17.0% 25.0% 50.0% 0.833 0.850 0.890 100 200 300Akbel 0.0% 0.0% 0.0% 65.0% 72.5% 80.0% 15.0% 20.0% 30.0% 17.0% 25.0% 50.0% 0.833 0.850 0.890 100 200 300Benomoz 0.0% 0.0% 0.0% 65.0% 72.5% 80.0% 15.0% 20.0% 30.0% 17.0% 25.0% 50.0% 0.833 0.850 0.890 100 200 300North Mahram 0.0% 0.0% 0.0% 65.0% 72.5% 80.0% 15.0% 20.0% 30.0% 17.0% 25.0% 50.0% 0.833 0.850 0.890 100 200 300Bulak 0.0% 0.0% 0.0% 65.0% 72.5% 80.0% 18.0% 27.0% 40.0% 20.0% 30.0% 55.0% 0.667 0.690 0.714 2,800 3,100 5,600
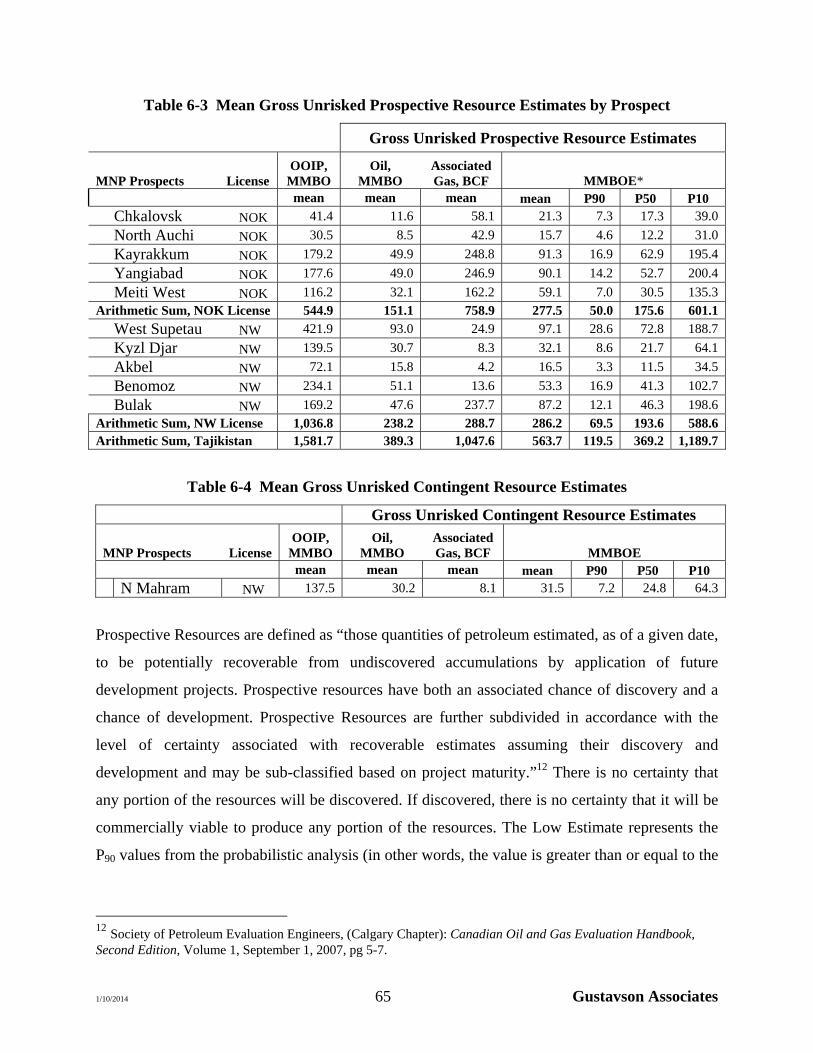
1/10/2014 65 Gustavson Associates
Table 6-3 Mean Gross Unrisked Prospective Resource Estimates by Prospect
Gross Unrisked Prospective Resource Estimates
MNP Prospects License OOIP,
MMBO Oil,
MMBO Associated Gas, BCF MMBOE*
mean mean mean mean P90 P50 P10 Chkalovsk NOK 41.4 11.6 58.1 21.3 7.3 17.3 39.0
North Auchi NOK 30.5 8.5 42.9 15.7 4.6 12.2 31.0
Kayrakkum NOK 179.2 49.9 248.8 91.3 16.9 62.9 195.4
Yangiabad NOK 177.6 49.0 246.9 90.1 14.2 52.7 200.4
Meiti West NOK 116.2 32.1 162.2 59.1 7.0 30.5 135.3 Arithmetic Sum, NOK License 544.9 151.1 758.9 277.5 50.0 175.6 601.1 West Supetau NW 421.9 93.0 24.9 97.1 28.6 72.8 188.7
Kyzl Djar NW 139.5 30.7 8.3 32.1 8.6 21.7 64.1
Akbel NW 72.1 15.8 4.2 16.5 3.3 11.5 34.5
Benomoz NW 234.1 51.1 13.6 53.3 16.9 41.3 102.7
Bulak NW 169.2 47.6 237.7 87.2 12.1 46.3 198.6
Arithmetic Sum, NW License 1,036.8 238.2 288.7 286.2 69.5 193.6 588.6 Arithmetic Sum, Tajikistan 1,581.7 389.3 1,047.6 563.7 119.5 369.2 1,189.7
Table 6-4 Mean Gross Unrisked Contingent Resource Estimates
Gross Unrisked Contingent Resource Estimates
MNP Prospects License OOIP,
MMBO Oil,
MMBO Associated Gas, BCF MMBOE
mean mean mean mean P90 P50 P10 N Mahram NW 137.5 30.2 8.1 31.5 7.2 24.8 64.3
Prospective Resources are defined as “those quantities of petroleum estimated, as of a given date,
to be potentially recoverable from undiscovered accumulations by application of future
development projects. Prospective resources have both an associated chance of discovery and a
chance of development. Prospective Resources are further subdivided in accordance with the
level of certainty associated with recoverable estimates assuming their discovery and
development and may be sub-classified based on project maturity.”12 There is no certainty that
any portion of the resources will be discovered. If discovered, there is no certainty that it will be
commercially viable to produce any portion of the resources. The Low Estimate represents the
P90 values from the probabilistic analysis (in other words, the value is greater than or equal to the
12 Society of Petroleum Evaluation Engineers, (Calgary Chapter): Canadian Oil and Gas Evaluation Handbook, Second Edition, Volume 1, September 1, 2007, pg 5-7.
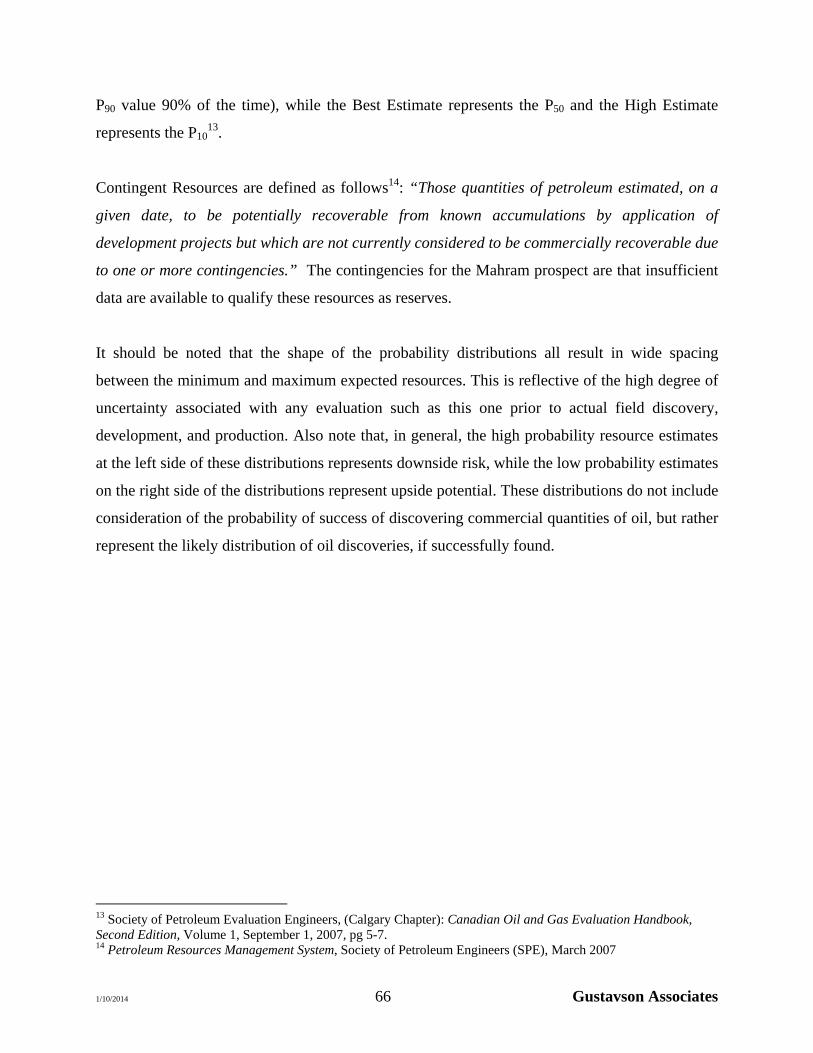
1/10/2014 66 Gustavson Associates
P90 value 90% of the time), while the Best Estimate represents the P50 and the High Estimate
represents the P1013.
Contingent Resources are defined as follows14: “Those quantities of petroleum estimated, on a
given date, to be potentially recoverable from known accumulations by application of
development projects but which are not currently considered to be commercially recoverable due
to one or more contingencies.” The contingencies for the Mahram prospect are that insufficient
data are available to qualify these resources as reserves.
It should be noted that the shape of the probability distributions all result in wide spacing
between the minimum and maximum expected resources. This is reflective of the high degree of
uncertainty associated with any evaluation such as this one prior to actual field discovery,
development, and production. Also note that, in general, the high probability resource estimates
at the left side of these distributions represents downside risk, while the low probability estimates
on the right side of the distributions represent upside potential. These distributions do not include
consideration of the probability of success of discovering commercial quantities of oil, but rather
represent the likely distribution of oil discoveries, if successfully found.
13 Society of Petroleum Evaluation Engineers, (Calgary Chapter): Canadian Oil and Gas Evaluation Handbook, Second Edition, Volume 1, September 1, 2007, pg 5-7. 14 Petroleum Resources Management System, Society of Petroleum Engineers (SPE), March 2007
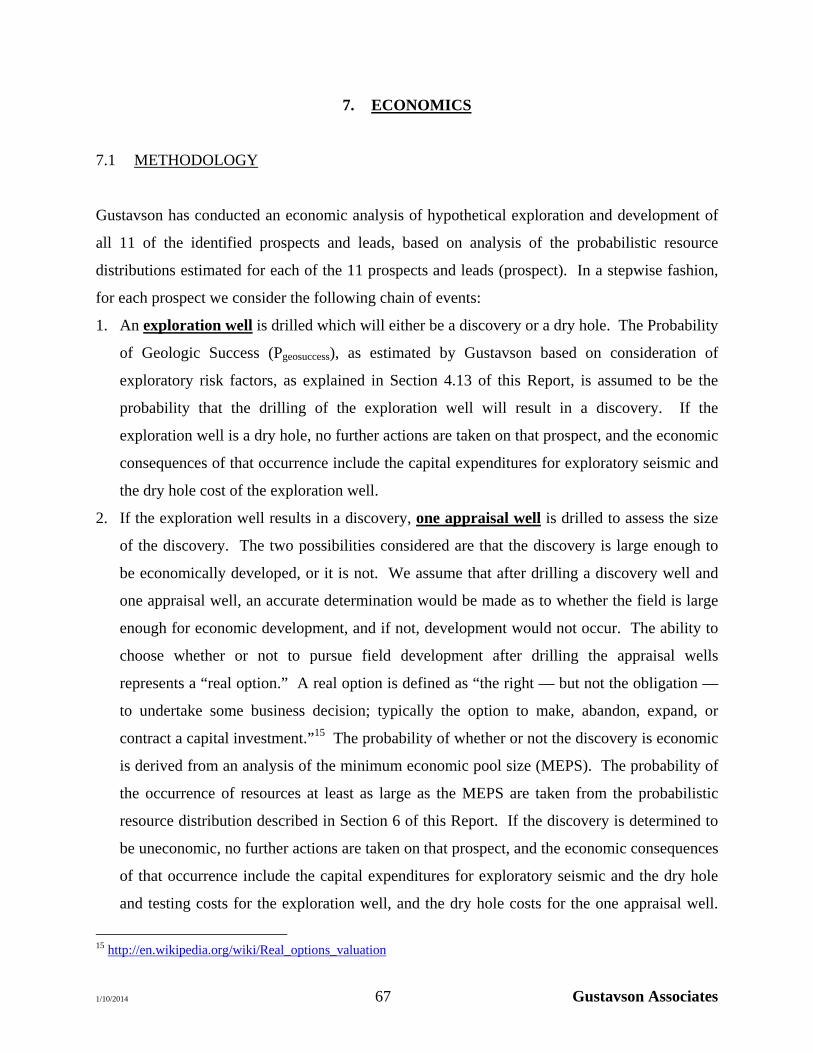
1/10/2014 67 Gustavson Associates
7. ECONOMICS
7.1 METHODOLOGY
Gustavson has conducted an economic analysis of hypothetical exploration and development of
all 11 of the identified prospects and leads, based on analysis of the probabilistic resource
distributions estimated for each of the 11 prospects and leads (prospect). In a stepwise fashion,
for each prospect we consider the following chain of events:
1. An exploration well is drilled which will either be a discovery or a dry hole. The Probability
of Geologic Success (Pgeosuccess), as estimated by Gustavson based on consideration of
exploratory risk factors, as explained in Section 4.13 of this Report, is assumed to be the
probability that the drilling of the exploration well will result in a discovery. If the
exploration well is a dry hole, no further actions are taken on that prospect, and the economic
consequences of that occurrence include the capital expenditures for exploratory seismic and
the dry hole cost of the exploration well.
2. If the exploration well results in a discovery, one appraisal well is drilled to assess the size
of the discovery. The two possibilities considered are that the discovery is large enough to
be economically developed, or it is not. We assume that after drilling a discovery well and
one appraisal well, an accurate determination would be made as to whether the field is large
enough for economic development, and if not, development would not occur. The ability to
choose whether or not to pursue field development after drilling the appraisal wells
represents a “real option.” A real option is defined as “the right — but not the obligation —
to undertake some business decision; typically the option to make, abandon, expand, or
contract a capital investment.”15 The probability of whether or not the discovery is economic
is derived from an analysis of the minimum economic pool size (MEPS). The probability of
the occurrence of resources at least as large as the MEPS are taken from the probabilistic
resource distribution described in Section 6 of this Report. If the discovery is determined to
be uneconomic, no further actions are taken on that prospect, and the economic consequences
of that occurrence include the capital expenditures for exploratory seismic and the dry hole
and testing costs for the exploration well, and the dry hole costs for the one appraisal well.
15 http://en.wikipedia.org/wiki/Real_options_valuation
1/10/2014 68 Gustavson Associates
However, in this analysis, the chance of an uneconomic discovery was evaluated and found
to be negligible.
3. If the discovery is determined to be economic, development drilling and commercial
production occurs, assuming that the resources are the mean level of resources given
commercial success.
7.1.1 Decision Tree
The outcome of the exploration and development of any prospect or lead is uncertain. Our
methodology considered three possible types of outcome, as described above. However, the
chance of occurrence of the non-commercial discoveries in this analysis were so small as to be
inconsiderable. It is standard practice to summarize the range of outcomes in terms of “Expected
Value,” which is a probability weighted average of the possible outcomes.
It may not be economic to develop small fields for which minimum required investments could
not be recovered from revenues from small amounts of production. The minimum economic
pool size (MEPS) was estimated by calculating economics for a range of field sizes16, plotting
NPV10 for field development versus field size in millions of barrels of oil equivalent (MMBOE),
and noting where the best fit line crosses the axis indicating an NPV10 of zero. This estimate was
determined to be very close to zero for the assumptions used in this analysis.
7.1.2 Calculation of Expected Monetary Value
Expected Monetary Values (EMVs) were calculated based on the net present value (NPV) of
projected future cash flows for each considered outcome, multiplied by the corresponding
probability of occurrence, as shown in equation form:
16 The points on the chart are NPVs of development of mean resources given discovery for the subject prospects and leads; however, the point of this analysis is simply to look at the economics for a range of field sizes.
1/10/2014 69 Gustavson Associates
EMV = (NPV10 geoSuccess × PgeoSuccess) + (NPV10 dryhole × Pgeofail)
Where
EMV = Expected Monetary Value
NPV10 geoSuccess = Net Present Value discounted at 10% of the cash flow resulting from development and production of a successful discovery
PgeoSuccess = Probability of geologic success NPV10 dryhole = Net Present Value discounted at 10% of the cash flow resulting from
seismic costs and drilling a dry exploratory well Pgeofail = Probability of geologic failure, equal to one minus the probability of
geologic success
The probability that a discovered resource will be commercial was determined to be very high
based on the assumptions used herein.
7.2 FISCAL TERMS
7.2.1 Tajikistan Permit Terms
The West and Northwest Petroleum Licenses in Tajikistan are owned by Somon Oil which is in
turn owned by DWM Petroleum AG with 90% and Anavak LLC with 10%. The Production
Sharing Contract (PSC), which governs the exploration licenses in the event of a discovery, was
ratified in May 2012. The terms of this agreement are summarized below.
The Investor is exempt from the following:
1. royalties; 2. bonuses; 3. profit tax; 4. corporate income tax; 5. retail sales tax; 6. value added tax in respect of: (a) the goods imported to the customs territory of the
Republic of Tajikistan for the conduct of works under the Agreement, provided that such goods have been included in the approved Work Program and Budgets; (b) supply (including export) of the Petroleum; and (c) works and services rendered by foreign physical and legal persons in the territory of the Republic of Tajikistan underwritten contracts, provided that such works and services have been included in the approved Work Program and Budgets;
7. excise tax in respect of supply of Petroleum; 8. Customs duty.
1/10/2014 70 Gustavson Associates
Seventy per cent (70%) of all available petroleum sales can be used for cost recovery, in the
following order: first for Prior Exploration Costs; and then for Petroleum Operating Costs.
Excess recoverable costs are carried forward. No ‘ring-fencing’ of areas or blocks within the
Contract Area are provided for; therefore, recoverable costs incurred in one area or block within
the Contract Area regardless of the outcome shall be carried over to the next area or block.
Then, the Investor is entitled to 50% of the profit gas and 50% of the profit oil. In addition, there
exists a 12.0% Dividend Withholding Tax (profit tax on dividend for non-Tajik shareholders).
7.3 ECONOMIC ASSUMPTIONS
Many variables affect these economic scenarios, such as drilling and operating costs, the number
of rigs used, flow rates, pipeline diameters, pricing, etc., that could change, which would have a
material impact on the potential value of this project. Gustavson Associates used inputs from
MNP, which were judged to be reasonable, for this report.
Additional assumptions are itemized below:
1. Condensate will be commingled with crude oil and priced as such.
2. No oil is exported.
3. No gas is exported.
4. Profits will be repatriated, if available and not needed for further investment.
5. Oil price based on US$80 at the wellhead through 2015 and US$90 1/1/2016.
6. Gas price US$5.95 based on local pricing.
7. Oil will be trucked, there are no transportation costs.
8. Gas pipeline costs assumed to be at an average cost of US$4MM.
9. Drilling costs as estimated by MNP.
10. Facility costs based generally on an average of MNP estimates, scaled from prospect to
prospect based on the ratio of peak producing rates raised to the power of 0.6.
11. Capital and operating costs are escalated at 1.5% from 2014 to 2015 and at 2.25% per year
from 2015 forward.
12. Tajik excise taxes apply only to exported production.
1/10/2014 71 Gustavson Associates
13. Production forecasts and cash flow projections were generated assuming a reasonable
initial rate and exponential decline.
14. Exploratory drilling begins June 2014 with one rig, four months per well. A second rig is
added January 2015.
15. Exploratory drilling is as specified by MNP for first three wells (Figure 4-4). Other
prospects and leads ranked by risk-weighted mean resources in BOE (Table 7-1). This may
not portray the actual course of events as the prospects are drilled.
16. Operating costs: US$600 M per year per field fixed plus variable costs of US$4.09 per
barrel of oil and US$0.79 per barrel of water.
Table 7-1 Exploration Drilling Schedule
Prospect/Lead Pgeosuccess
Mean Total Resources17,
MMBOE
Expected Resources, MMBOEs
Exploratory Drill Order
Drill year
Kayrakkum 64.9% 91.3 49.4 1 2014 West Supetau 50.9% 97.1 59.3 2 2014 North Mahram 68.6% 31.5 21.6 3 2015 Kyzl Djar 50.9% 32.1 16.3 4 2015 Chkalovsk 60.8% 21.3 12.9 5 2015 Benomoz 35.7% 53.3 19.0 6 2015 Akbel 30.6% 16.5 4.0 7 2016 North Auchi 41.0% 15.7 6.4 8 2016 Yangiabad 45.5% 90.1 41.0 9 2016 Meiti West 21.4% 59.1 12.7 10 2016 Bulak 13.5% 87.2 11.8 11 2016
7.4 RESULTS
Detailed cash flow forecasts and Expected Monetary Value (EMV)@10.0% were generated for
each of the 11 prospects and leads based on the above assumptions. The EMV10 for all the
projects total US$2,916MM for Tajikistan. Summaries by prospect are provided in Table 7-2
below, with details in Appendix C. A summary of the EMV at various discount rates, net to
Manas, is shown in Table 7-3.
17 These resources represent the sum of oil and condensate resources, plus the sum of associated gas resources divided by six, shown in Table 6 5.
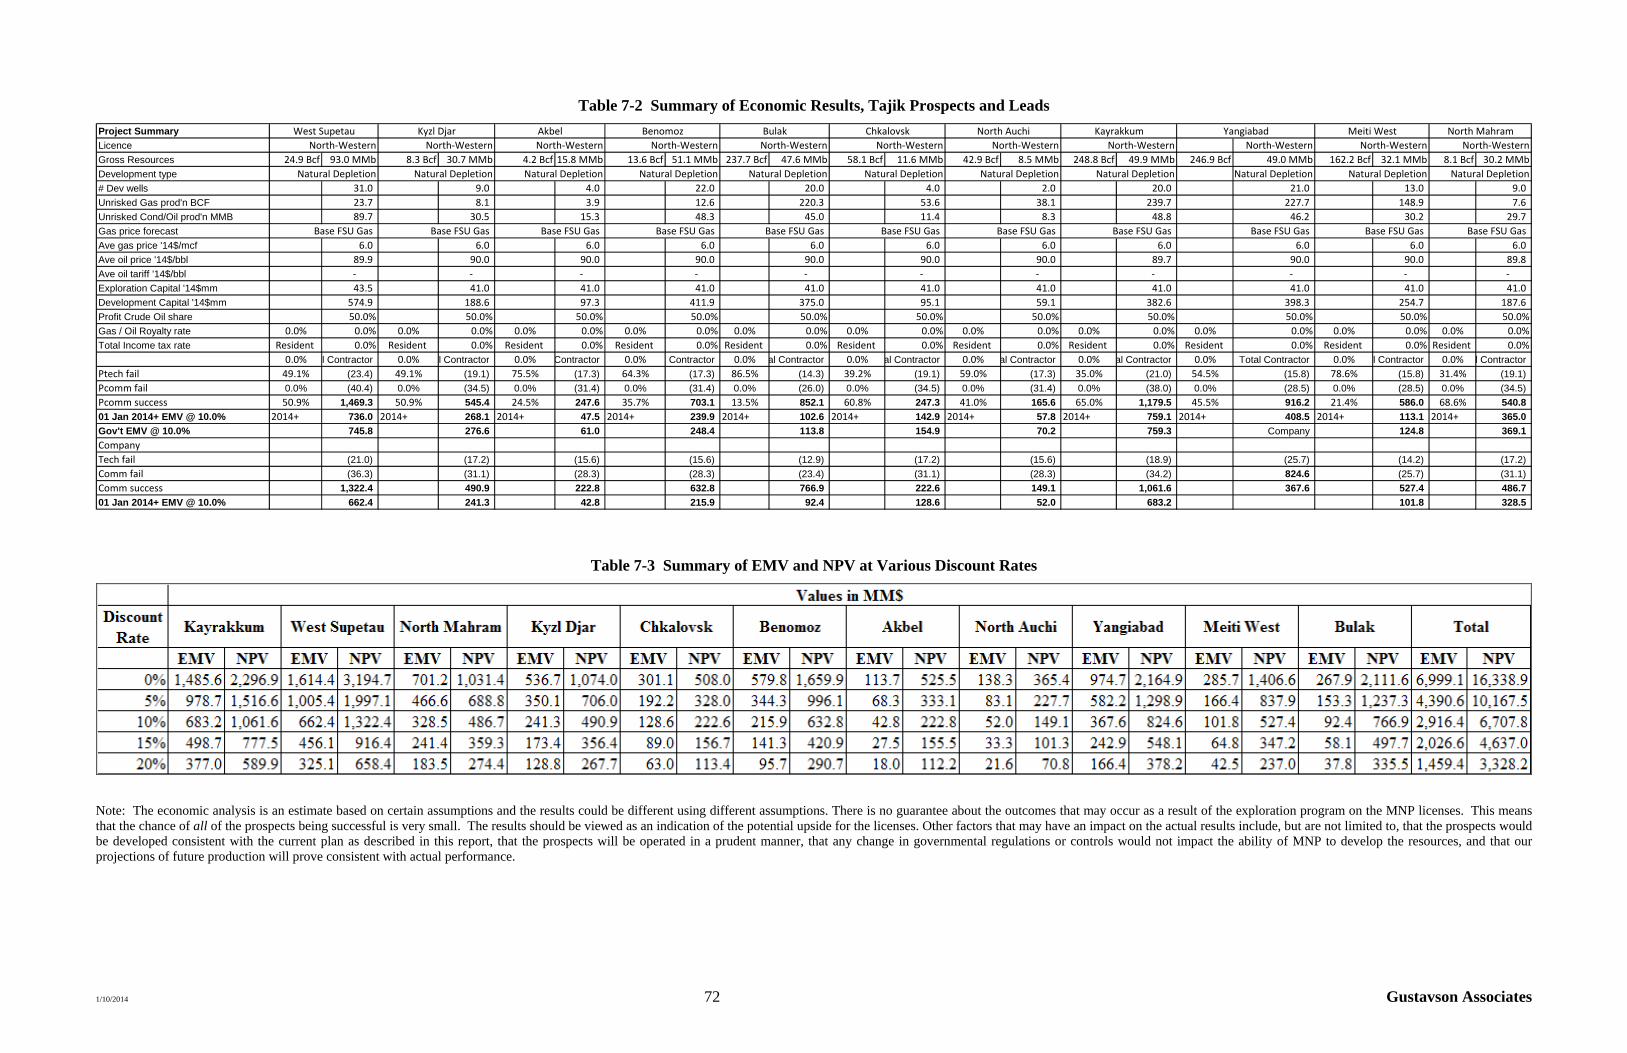
1/10/2014 72 Gustavson Associates
Table 7-2 Summary of Economic Results, Tajik Prospects and Leads
Project Summary West Supetau Kyzl Djar Akbel Benomoz Bulak Chkalovsk North Auchi Kayrakkum Yangiabad Meiti West North Mahram
Licence North‐Western North‐Western North‐Western North‐Western North‐Western North‐Western North‐Western North‐Western North‐Western North‐Western North‐Western
Gross Resources 24.9 Bcf 93.0 MMb 8.3 Bcf 30.7 MMb 4.2 Bcf 15.8 MMb 13.6 Bcf 51.1 MMb 237.7 Bcf 47.6 MMb 58.1 Bcf 11.6 MMb 42.9 Bcf 8.5 MMb 248.8 Bcf 49.9 MMb 246.9 Bcf 49.0 MMb 162.2 Bcf 32.1 MMb 8.1 Bcf 30.2 MMb
Development type Natural Depletion Natural Depletion Natural Depletion Natural Depletion Natural Depletion Natural Depletion Natural Depletion Natural Depletion Natural Depletion Natural Depletion Natural Depletion
# Dev wells 31.0 9.0 4.0 22.0 20.0 4.0 2.0 20.0 21.0 13.0 9.0
Unrisked Gas prod'n BCF 23.7 8.1 3.9 12.6 220.3 53.6 38.1 239.7 227.7 148.9 7.6
Unrisked Cond/Oil prod'n MMB 89.7 30.5 15.3 48.3 45.0 11.4 8.3 48.8 46.2 30.2 29.7
Gas price forecast Base FSU Gas Base FSU Gas Base FSU Gas Base FSU Gas Base FSU Gas Base FSU Gas Base FSU Gas Base FSU Gas Base FSU Gas Base FSU Gas Base FSU Gas
Ave gas price '14$/mcf 6.0 6.0 6.0 6.0 6.0 6.0 6.0 6.0 6.0 6.0 6.0
Ave oil price '14$/bbl 89.9 90.0 90.0 90.0 90.0 90.0 90.0 89.7 90.0 90.0 89.8
Ave oil tariff '14$/bbl ‐ ‐ ‐ ‐ ‐ ‐ ‐ ‐ ‐ ‐ ‐
Exploration Capital '14$mm 43.5 41.0 41.0 41.0 41.0 41.0 41.0 41.0 41.0 41.0 41.0
Development Capital '14$mm 574.9 188.6 97.3 411.9 375.0 95.1 59.1 382.6 398.3 254.7 187.6
Profit Crude Oil share 50.0% 50.0% 50.0% 50.0% 50.0% 50.0% 50.0% 50.0% 50.0% 50.0% 50.0%
Gas / Oil Royalty rate 0.0% 0.0% 0.0% 0.0% 0.0% 0.0% 0.0% 0.0% 0.0% 0.0% 0.0% 0.0% 0.0% 0.0% 0.0% 0.0% 0.0% 0.0% 0.0% 0.0% 0.0% 0.0%
Total Income tax rate Resident 0.0% Resident 0.0% Resident 0.0% Resident 0.0% Resident 0.0% Resident 0.0% Resident 0.0% Resident 0.0% Resident 0.0% Resident 0.0% Resident 0.0%
0.0% l Contractor 0.0% l Contractor 0.0% Contractor 0.0% Contractor 0.0% al Contractor 0.0% al Contractor 0.0% al Contractor 0.0% al Contractor 0.0% Total Contractor 0.0% l Contractor 0.0% l Contractor
Ptech fail 49.1% (23.4) 49.1% (19.1) 75.5% (17.3) 64.3% (17.3) 86.5% (14.3) 39.2% (19.1) 59.0% (17.3) 35.0% (21.0) 54.5% (15.8) 78.6% (15.8) 31.4% (19.1)
Pcomm fail 0.0% (40.4) 0.0% (34.5) 0.0% (31.4) 0.0% (31.4) 0.0% (26.0) 0.0% (34.5) 0.0% (31.4) 0.0% (38.0) 0.0% (28.5) 0.0% (28.5) 0.0% (34.5)
Pcomm success 50.9% 1,469.3 50.9% 545.4 24.5% 247.6 35.7% 703.1 13.5% 852.1 60.8% 247.3 41.0% 165.6 65.0% 1,179.5 45.5% 916.2 21.4% 586.0 68.6% 540.8
01 Jan 2014+ EMV @ 10.0% 2014+ 736.0 2014+ 268.1 2014+ 47.5 2014+ 239.9 2014+ 102.6 2014+ 142.9 2014+ 57.8 2014+ 759.1 2014+ 408.5 2014+ 113.1 2014+ 365.0
Gov't EMV @ 10.0% 745.8 276.6 61.0 248.4 113.8 154.9 70.2 759.3 Company 124.8 369.1
Company
Tech fail (21.0) (17.2) (15.6) (15.6) (12.9) (17.2) (15.6) (18.9) (25.7) (14.2) (17.2)
Comm fail (36.3) (31.1) (28.3) (28.3) (23.4) (31.1) (28.3) (34.2) 824.6 (25.7) (31.1)
Comm success 1,322.4 490.9 222.8 632.8 766.9 222.6 149.1 1,061.6 367.6 527.4 486.7
01 Jan 2014+ EMV @ 10.0% 662.4 241.3 42.8 215.9 92.4 128.6 52.0 683.2 101.8 328.5
Table 7-3 Summary of EMV and NPV at Various Discount Rates
Note: The economic analysis is an estimate based on certain assumptions and the results could be different using different assumptions. There is no guarantee about the outcomes that may occur as a result of the exploration program on the MNP licenses. This means that the chance of all of the prospects being successful is very small. The results should be viewed as an indication of the potential upside for the licenses. Other factors that may have an impact on the actual results include, but are not limited to, that the prospects would be developed consistent with the current plan as described in this report, that the prospects will be operated in a prudent manner, that any change in governmental regulations or controls would not impact the ability of MNP to develop the resources, and that our projections of future production will prove consistent with actual performance.
1/10/2014 73 Gustavson Associates
A simplified probabilistic analysis was performed on these results to attempt to capture a total
probability distribution for NPV of all the prospects, allowing the outcome of each to vary
among the two outcomes for each prospect according to a discrete distribution with the
probabilities of the outcomes. In other words, referring to Table 7-2, for West Supetau, there
was a 49.1% probability of an NPV of US$(23.4) MM, and a 50.9% probability of an NPV of
US$1,469 MM, continuing similarly for each prospect and adding the resulting values. The
analysis assumes no interdependence of probabilities among the prospects and leads, and ignores
the range of sizes of possible discoveries by assuming only commercial or non-commercial
discoveries at the mean sizes described above. The resulting distribution (Figure 7-1) shows that
exploration of all eleven prospects and leads has a 99% probability of having a positive outcome
(where the distribution line crosses the zero NPV10 axis). The P90 of the distribution is US
$1,405MM, the P50 (median) result is US$2,933MM, and the P10 is US$4,400MM, net to MNP.
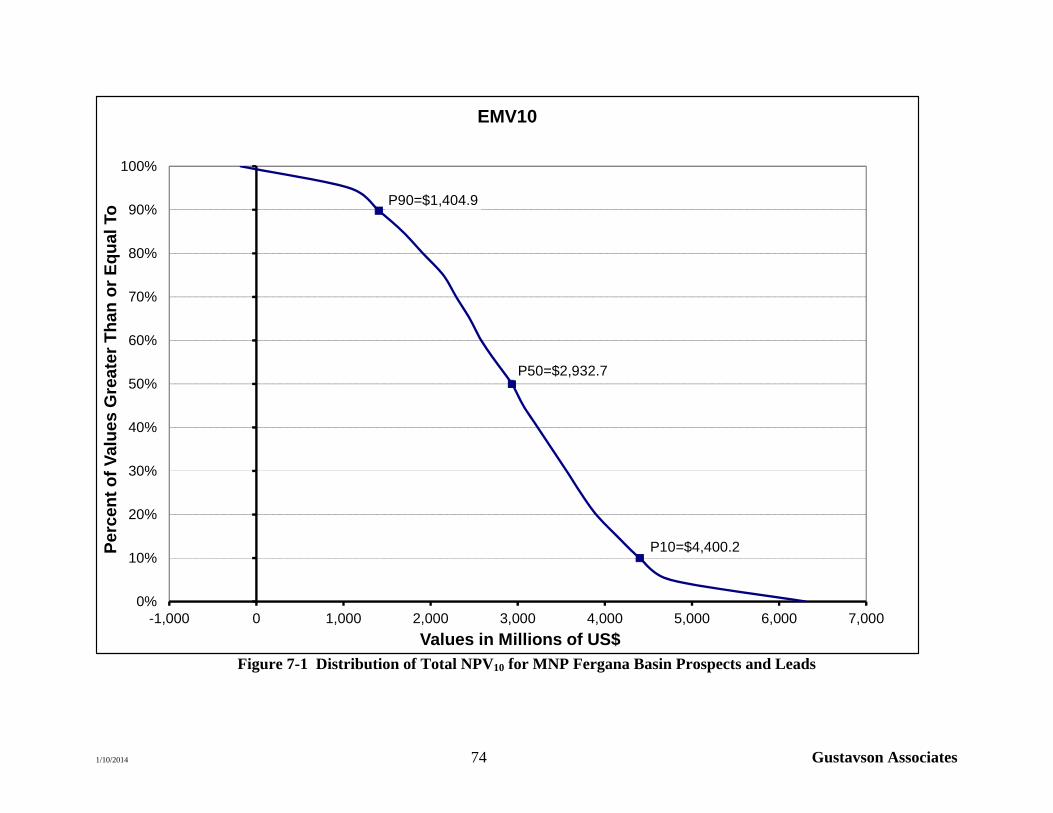
1/10/2014 74 Gustavson Associates
P90=$1,404.9
P50=$2,932.7
P10=$4,400.2
0%
10%
20%
30%
40%
50%
60%
70%
80%
90%
100%
-1,000 0 1,000 2,000 3,000 4,000 5,000 6,000 7,000
Per
cen
t o
f V
alu
es G
reat
er T
han
or
Eq
ual
To
Values in Millions of US$
EMV10
Figure 7-1 Distribution of Total NPV10 for MNP Fergana Basin Prospects and Leads
1/10/2014 75 Gustavson Associates
8. REFERENCES
Magoon, L.B., 1988, The Petroleum System: A Classification Scheme for Research 1
Exploration and Resource Assessment, in L. B. Magoon , ed., Petroleum Systems of the United States: U.S. Geological Survey Bulletin 1870, pages 2-15.
Johansen, Helge and Bonnell, Linda M., 1999, Preliminary Basin Modeling Results from the
Fergana Basin, Kyrgyzstan: Abstract, AAPG Otto, S. C., Iwaniw, E., Alexander, A. C., and Darlington, C., 1999, Post-Cimmerian (Jurassic)
Petroleum Systems of the Central Paratethys Region: Abstract, AAPG Oil and Gas Resources of the Fergana Basin (Uzbekistan, Tadzhikistan, and Kyrgyzstan), 1994,
DOE/EIA-0575(94), 147 p. Berner, Ulrich, Scheeder, Georg, Kus, Jolanta, Voigt, Sebastian, and Schneider, Jorg W., 2009,
Organic Geochemical and Petrographical Characterization of Continental Triassic Source Rocks, Madygen Basin, Southern Tien Shan, Kyrgyzstan: Search and discovery #40468, AAPG Abstract.
Ulmishek, G. and Harrison, W., 1983, Oil and Gas Developments in USSR in 1982: AAPG Bull
v. 67, no. 10, p. 1717-1722. Ulmishek, G. and Harrison, W., 1986, Oil and Gas Developments in USSR in 1983-1985: AAPG
Bull v. 70, no. 10, p. 1566-1577.
1/10/2014 76 Gustavson Associates
9. CONSENT LETTER
Gustavson Associates LLC hereby consents to the use of all or any part of this Resource
Evaluation Report for the Western (NOK) and North-West Permit, as of January 10, 2014, in any
document filed with any Securities Commission by MNP Corporation (a United States
corporation), and DWM Petroleum AG (a Switzerland corporation) which is a 100% subsidiary
of MNP.
Letha C. Lencioni Vice-President, Petroleum Engineering
Gustavson Associates LLC
1/10/2014 77 Gustavson Associates
10. CERTIFICATE OF QUALIFICATION
I, Letha Chapman Lencioni, Professional Engineer of 5757 Central Avenue, Suite D, Boulder,
Colorado, 80301, USA, hereby certify:
1. I am an employee of Gustavson Associates, which prepared a detailed analysis of the oil
and gas properties of MNP Petroleum Corporation. The effective date of this evaluation
is January 10, 2014
2. I do not have, nor do I expect to receive, any direct or indirect interest in the securities of
MNP or its affiliated companies, nor any interest in the subject property.
3. I attended the University of Tulsa and I graduated with a Bachelor of Science Degree in
Petroleum Engineering in 1980; I am a Registered Professional Engineer in the State of
Colorado, and I have in excess of 30 years’ experience in the conduct of evaluation and
engineering studies relating to oil and gas fields.
4. A personal field inspection of the properties was not made; however, such an inspection
was not considered necessary in view of information available from public information
and records, and the files of MNP
Letha Chapman Lencioni Chief Reservoir Engineer/
Vice-President, Petroleum Engineering Gustavson Associates, LLC
Colorado Registered Engineer #29506

APPENDIX A
PROBABILISTIC RESOURCE DISTRIBUTION CURVES
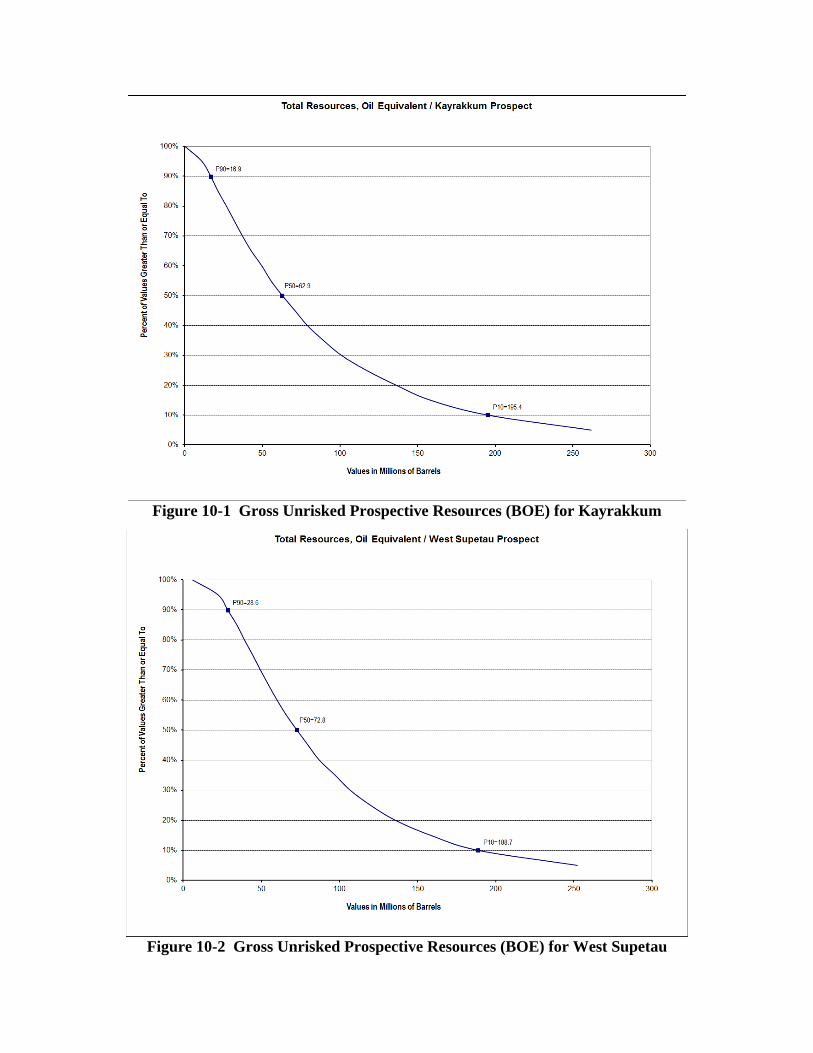
Figure 10-1 Gross Unrisked Prospective Resources (BOE) for Kayrakkum
Figure 10-2 Gross Unrisked Prospective Resources (BOE) for West Supetau
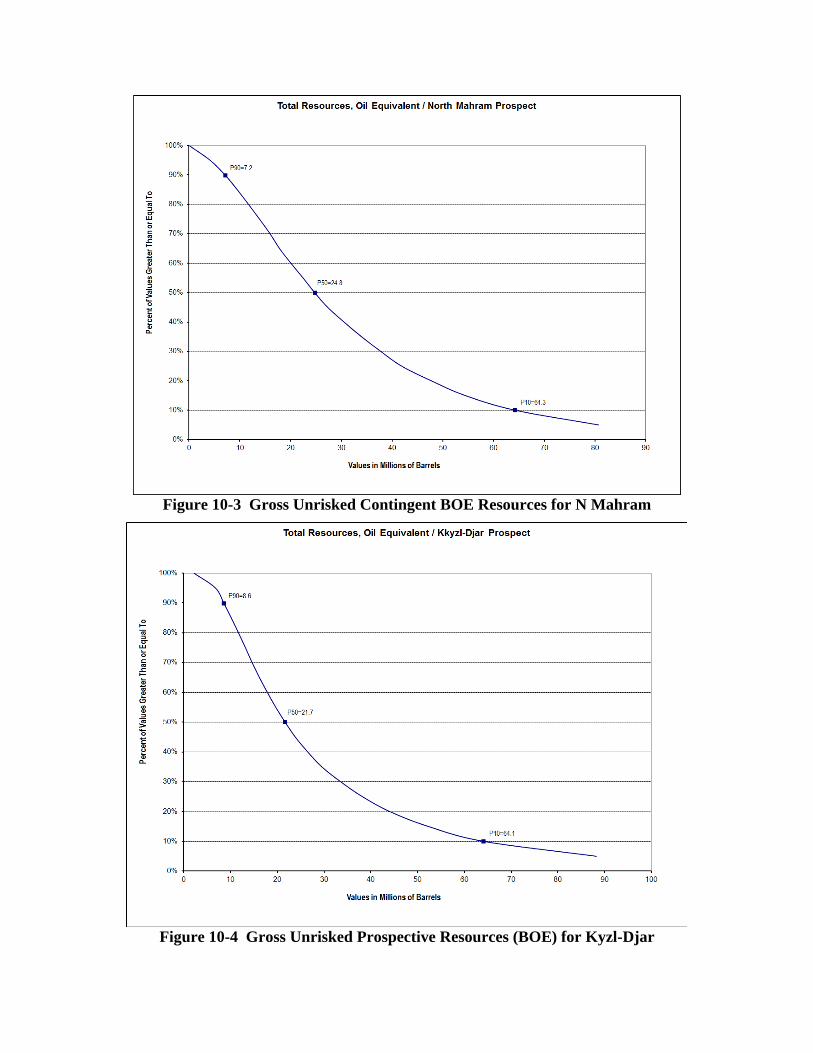
Figure 10-3 Gross Unrisked Contingent BOE Resources for N Mahram
Figure 10-4 Gross Unrisked Prospective Resources (BOE) for Kyzl-Djar
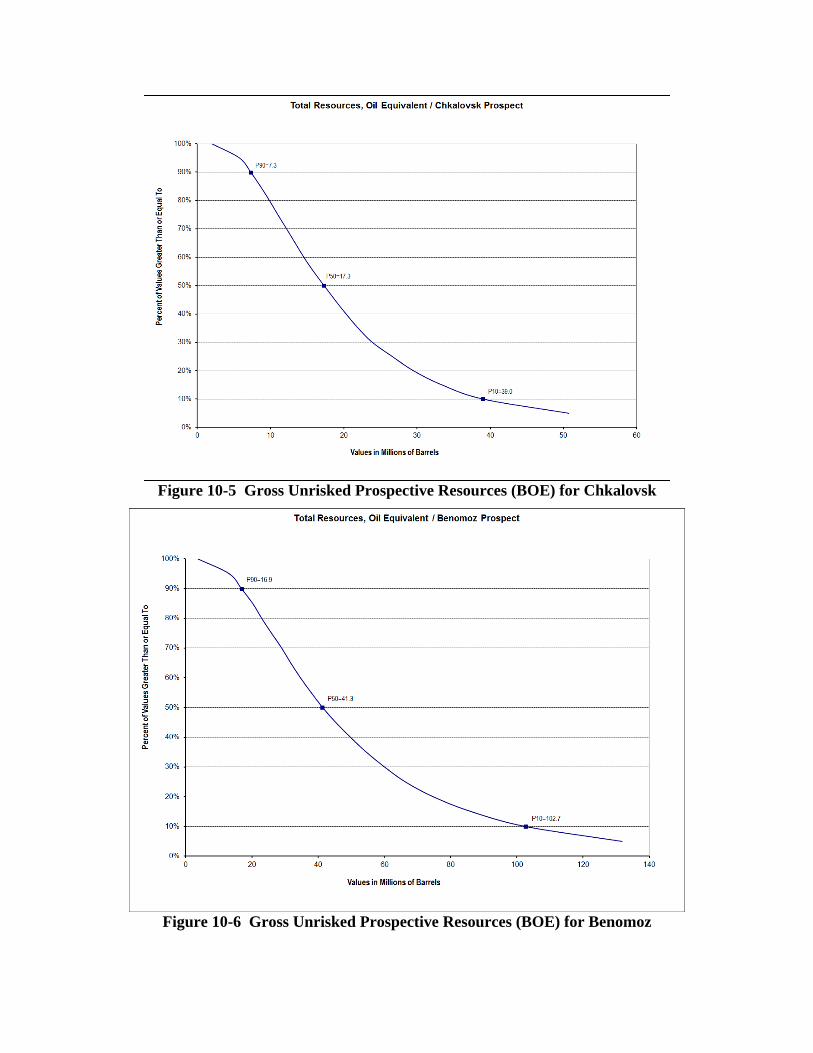
Figure 10-5 Gross Unrisked Prospective Resources (BOE) for Chkalovsk
Figure 10-6 Gross Unrisked Prospective Resources (BOE) for Benomoz
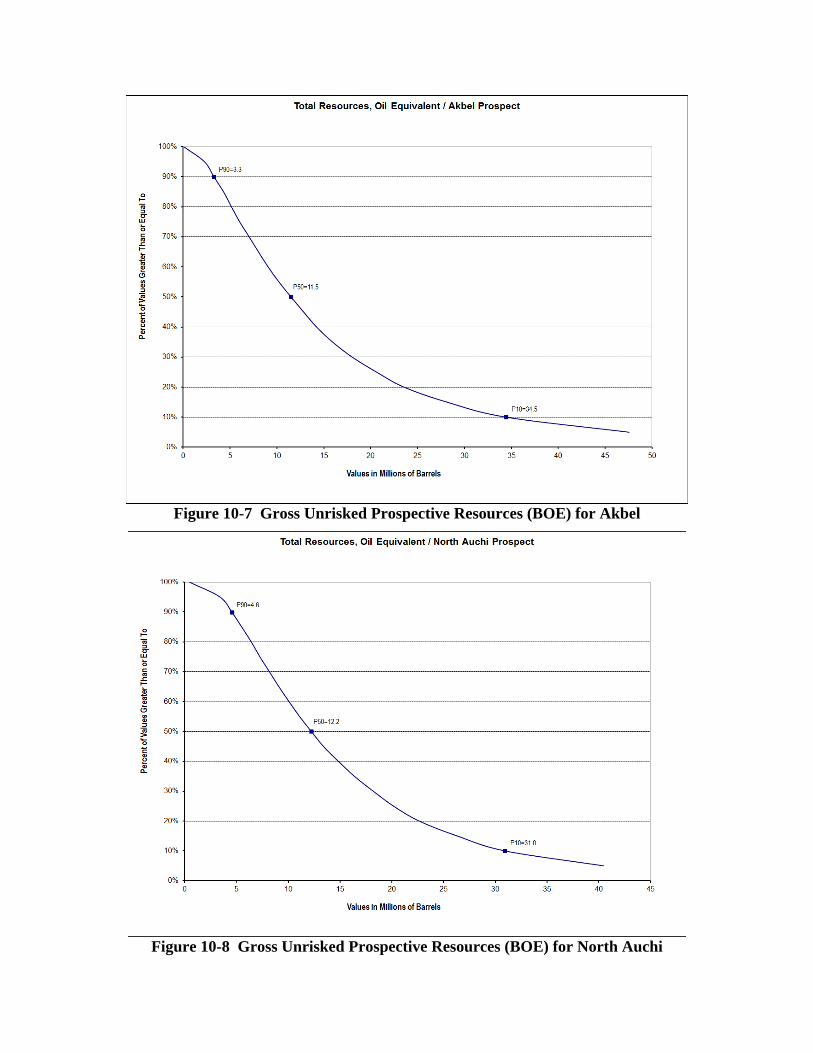
Figure 10-7 Gross Unrisked Prospective Resources (BOE) for Akbel
Figure 10-8 Gross Unrisked Prospective Resources (BOE) for North Auchi
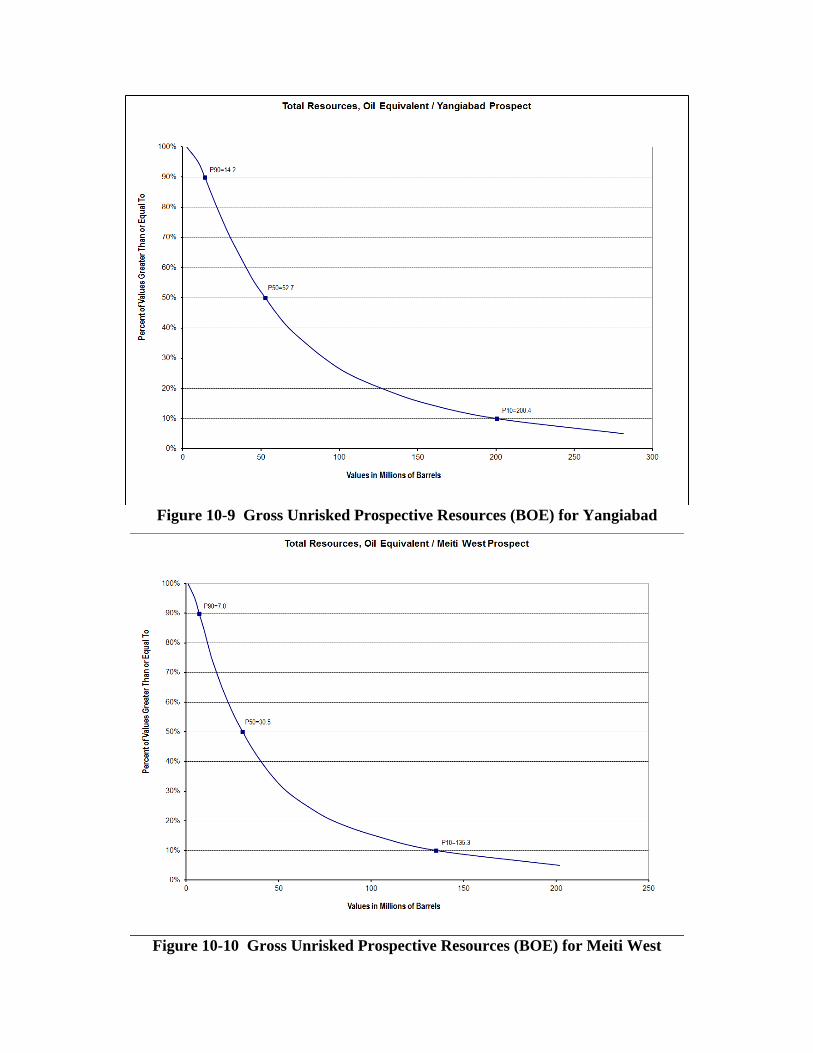
Figure 10-9 Gross Unrisked Prospective Resources (BOE) for Yangiabad
Figure 10-10 Gross Unrisked Prospective Resources (BOE) for Meiti West
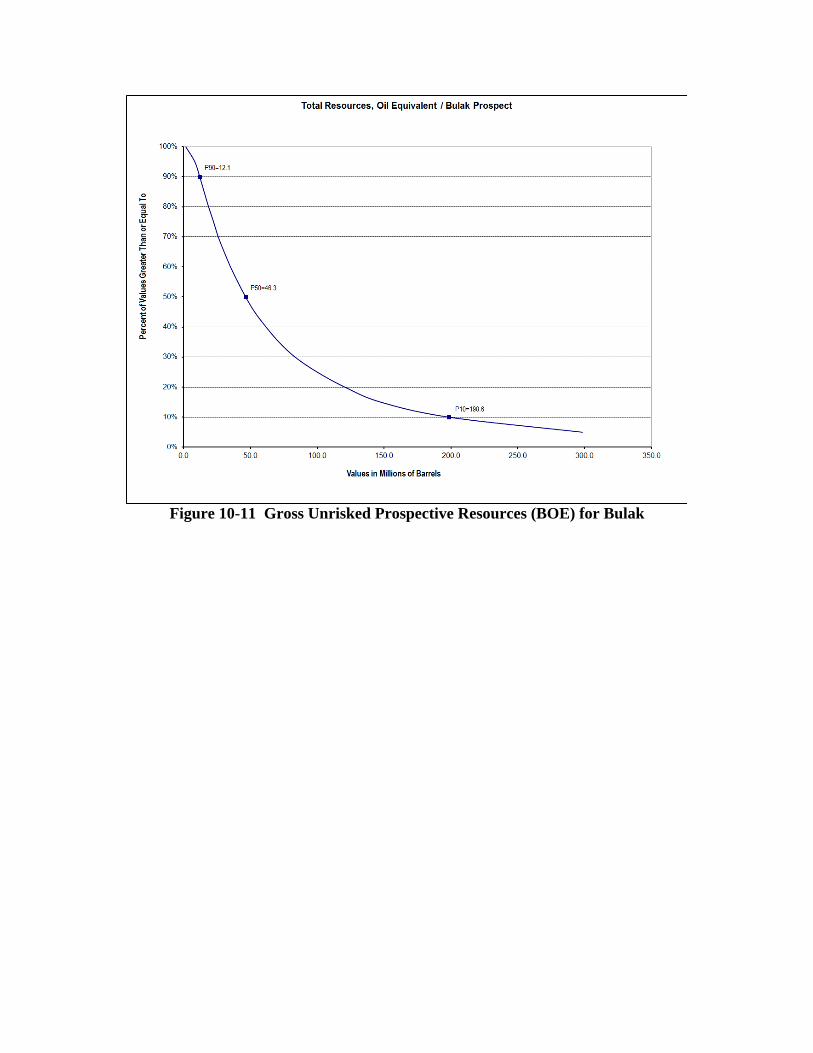
Figure 10-11 Gross Unrisked Prospective Resources (BOE) for Bulak
APPENDIX B
PRODUCTION FORECAST PLOTS
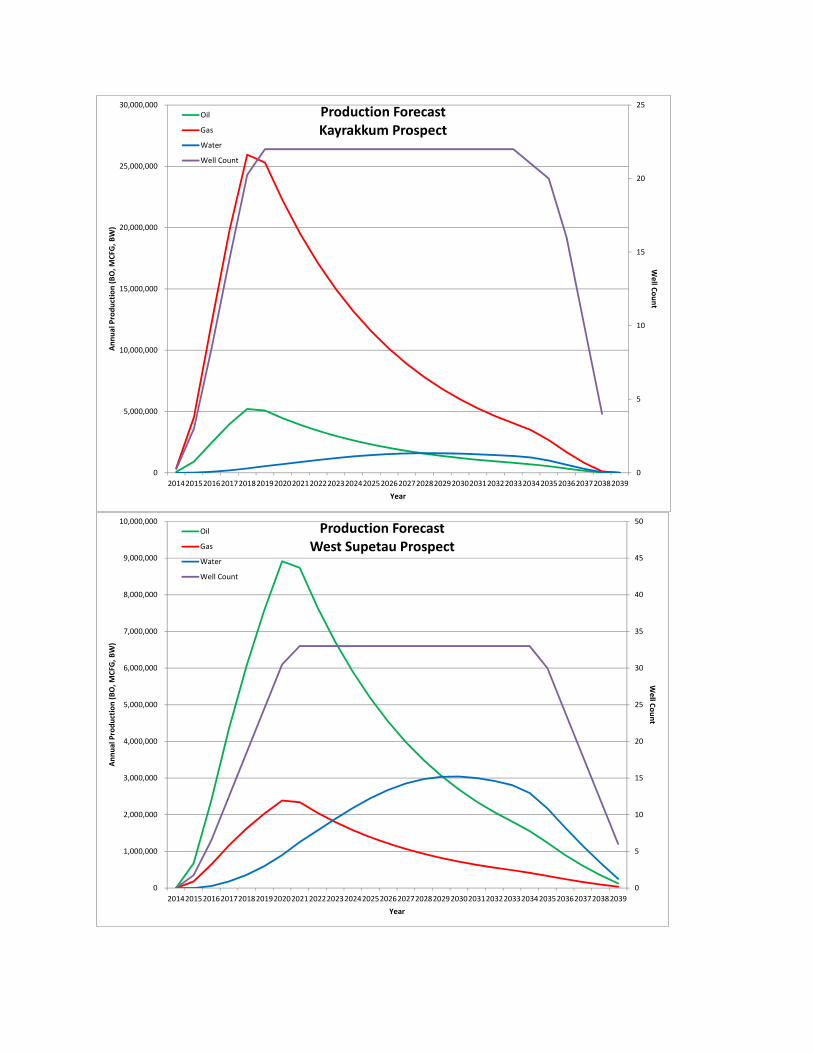
0
5
10
15
20
25
0
5,000,000
10,000,000
15,000,000
20,000,000
25,000,000
30,000,000
20142015201620172018201920202021202220232024202520262027202820292030203120322033203420352036203720382039
Well Count
Annu
al Produ
ction (BO, M
CFG, B
W)
Year
Production ForecastKayrakkum Prospect
Oil
Gas
Water
Well Count
0
5
10
15
20
25
30
35
40
45
50
0
1,000,000
2,000,000
3,000,000
4,000,000
5,000,000
6,000,000
7,000,000
8,000,000
9,000,000
10,000,000
20142015201620172018201920202021202220232024202520262027202820292030203120322033203420352036203720382039
Well Count
Annu
al Produ
ction (BO, M
CFG, B
W)
Year
Production ForecastWest Supetau Prospect
Oil
Gas
Water
Well Count
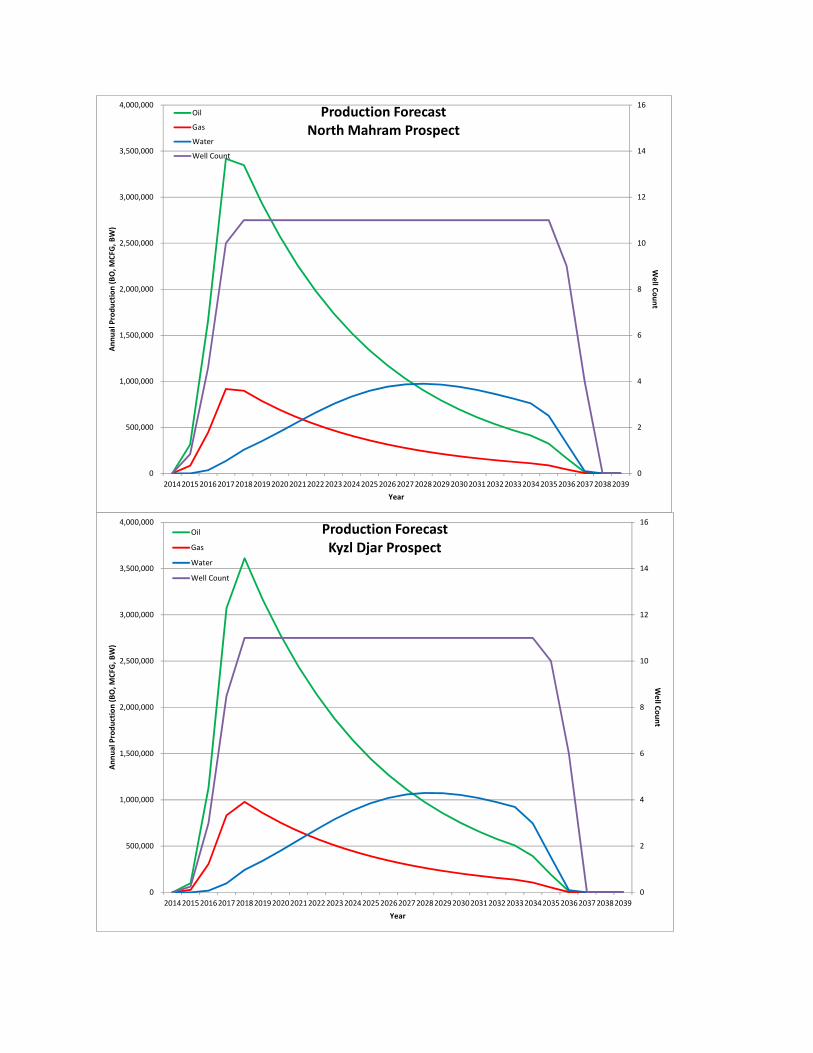
0
2
4
6
8
10
12
14
16
0
500,000
1,000,000
1,500,000
2,000,000
2,500,000
3,000,000
3,500,000
4,000,000
20142015201620172018201920202021202220232024202520262027202820292030203120322033203420352036203720382039
Well Count
Annu
al Produ
ction (BO, M
CFG, B
W)
Year
Production ForecastNorth Mahram Prospect
Oil
Gas
Water
Well Count
0
2
4
6
8
10
12
14
16
0
500,000
1,000,000
1,500,000
2,000,000
2,500,000
3,000,000
3,500,000
4,000,000
20142015201620172018201920202021202220232024202520262027202820292030203120322033203420352036203720382039
Well Count
Annu
al Produ
ction (BO, M
CFG, B
W)
Year
Production ForecastKyzl Djar Prospect
Oil
Gas
Water
Well Count
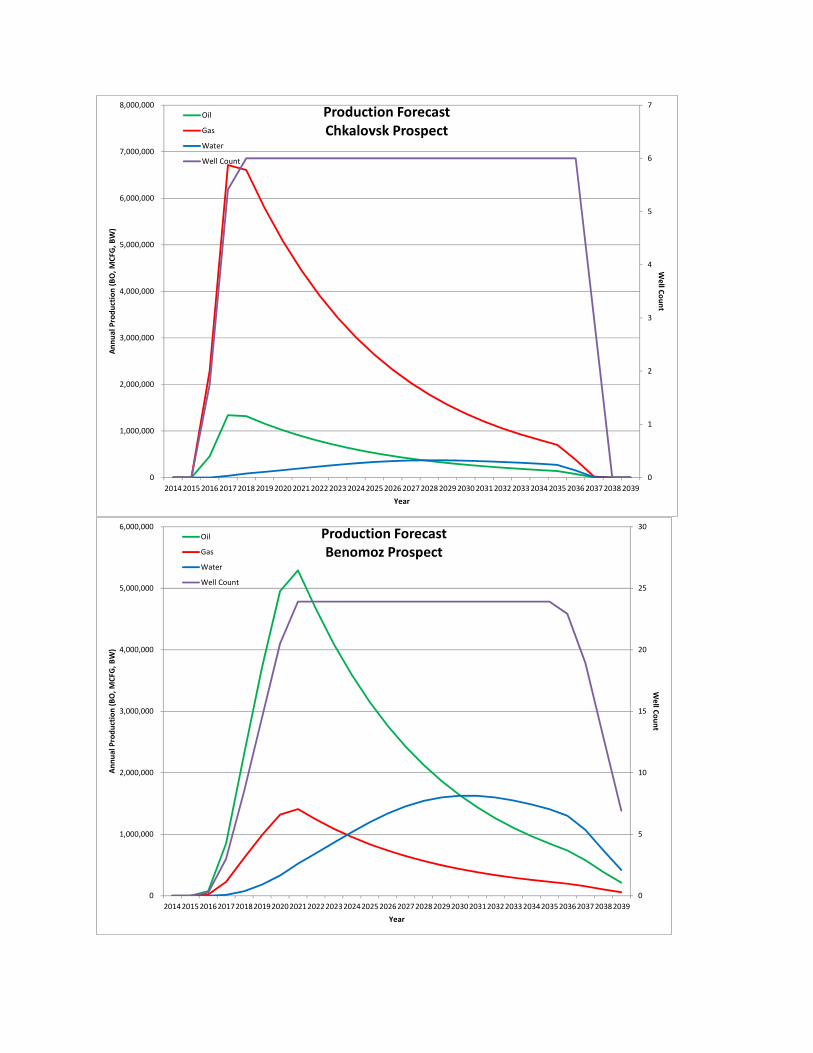
0
1
2
3
4
5
6
7
0
1,000,000
2,000,000
3,000,000
4,000,000
5,000,000
6,000,000
7,000,000
8,000,000
20142015201620172018201920202021202220232024202520262027202820292030203120322033203420352036203720382039
Well Count
Annu
al Produ
ction (BO, M
CFG, B
W)
Year
Production ForecastChkalovsk Prospect
Oil
Gas
Water
Well Count
0
5
10
15
20
25
30
0
1,000,000
2,000,000
3,000,000
4,000,000
5,000,000
6,000,000
20142015201620172018201920202021202220232024202520262027202820292030203120322033203420352036203720382039
Well Count
Annu
al Produ
ction (BO, M
CFG, B
W)
Year
Production ForecastBenomoz Prospect
Oil
Gas
Water
Well Count
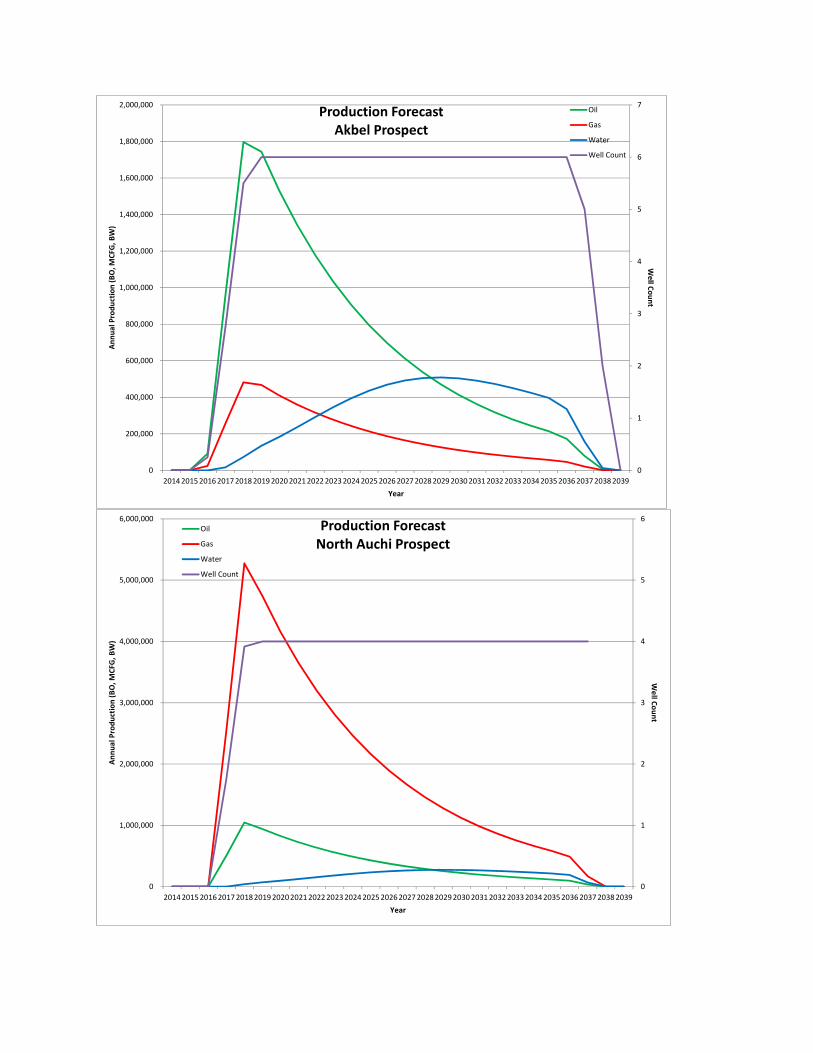
0
1
2
3
4
5
6
7
0
200,000
400,000
600,000
800,000
1,000,000
1,200,000
1,400,000
1,600,000
1,800,000
2,000,000
20142015201620172018201920202021202220232024202520262027202820292030203120322033203420352036203720382039
Well Count
Annu
al Produ
ction (BO, M
CFG, B
W)
Year
Production ForecastAkbel Prospect
Oil
Gas
Water
Well Count
0
1
2
3
4
5
6
0
1,000,000
2,000,000
3,000,000
4,000,000
5,000,000
6,000,000
20142015201620172018201920202021202220232024202520262027202820292030203120322033203420352036203720382039
Well Count
Annu
al Produ
ction (BO, M
CFG, B
W)
Year
Production ForecastNorth Auchi Prospect
Oil
Gas
Water
Well Count
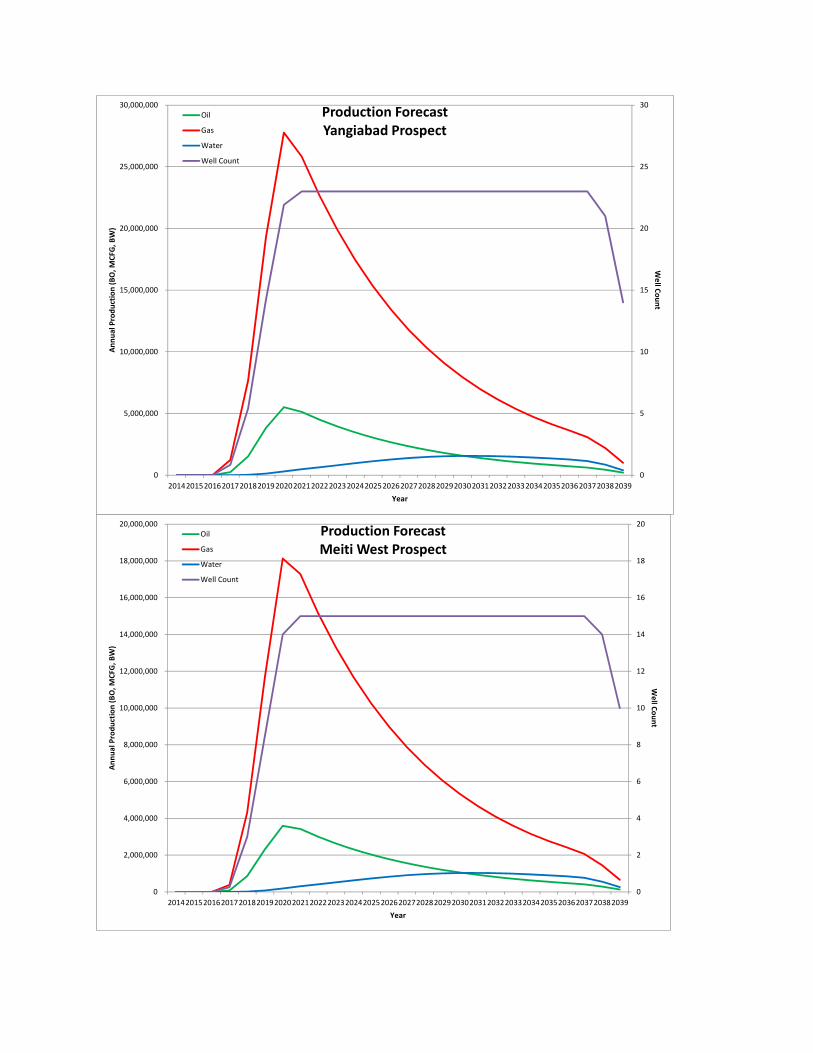
0
5
10
15
20
25
30
0
5,000,000
10,000,000
15,000,000
20,000,000
25,000,000
30,000,000
20142015201620172018201920202021202220232024202520262027202820292030203120322033203420352036203720382039
Well Count
Annu
al Produ
ction (BO, M
CFG, B
W)
Year
Production ForecastYangiabad Prospect
Oil
Gas
Water
Well Count
0
2
4
6
8
10
12
14
16
18
20
0
2,000,000
4,000,000
6,000,000
8,000,000
10,000,000
12,000,000
14,000,000
16,000,000
18,000,000
20,000,000
20142015201620172018201920202021202220232024202520262027202820292030203120322033203420352036203720382039
Well Count
Annu
al Produ
ction (BO, M
CFG, B
W)
Year
Production ForecastMeiti West Prospect
Oil
Gas
Water
Well Count
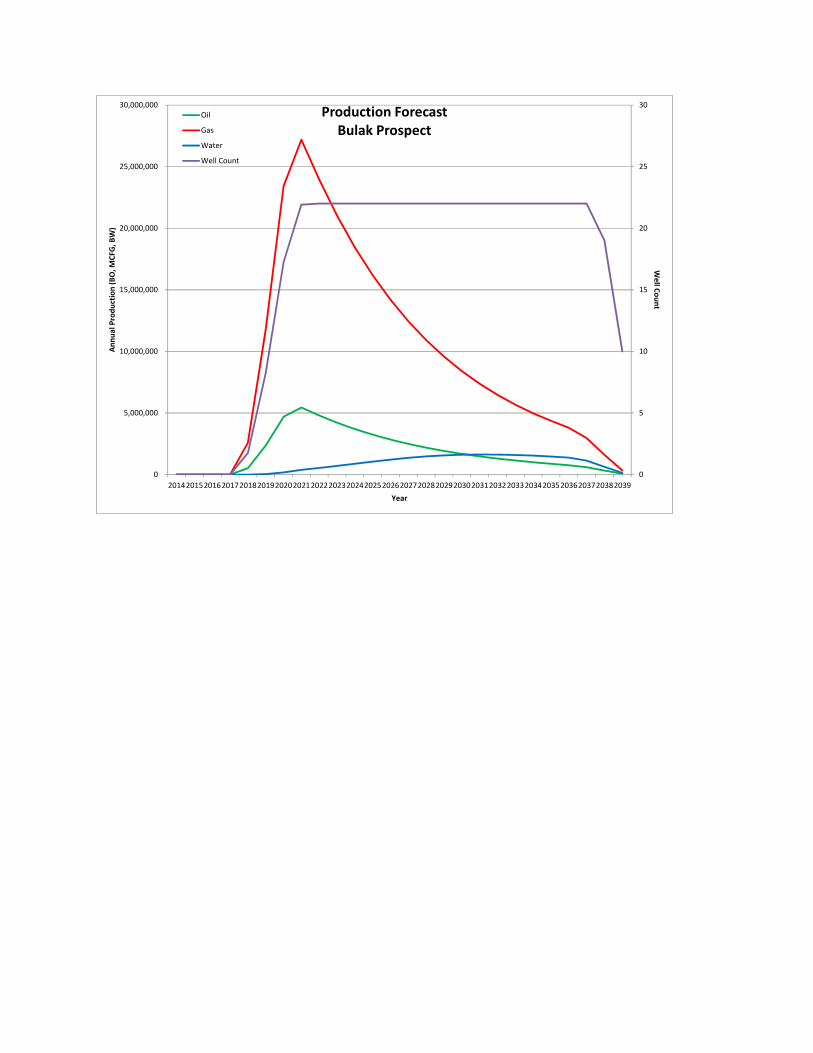
0
5
10
15
20
25
30
0
5,000,000
10,000,000
15,000,000
20,000,000
25,000,000
30,000,000
20142015201620172018201920202021202220232024202520262027202820292030203120322033203420352036203720382039
Well Count
Annu
al Produ
ction (BO, M
CFG, B
W)
Year
Production ForecastBulak Prospect
Oil
Gas
Water
Well Count
APPENDIX C
CASH FLOW FORECASTS BY PROSPECT
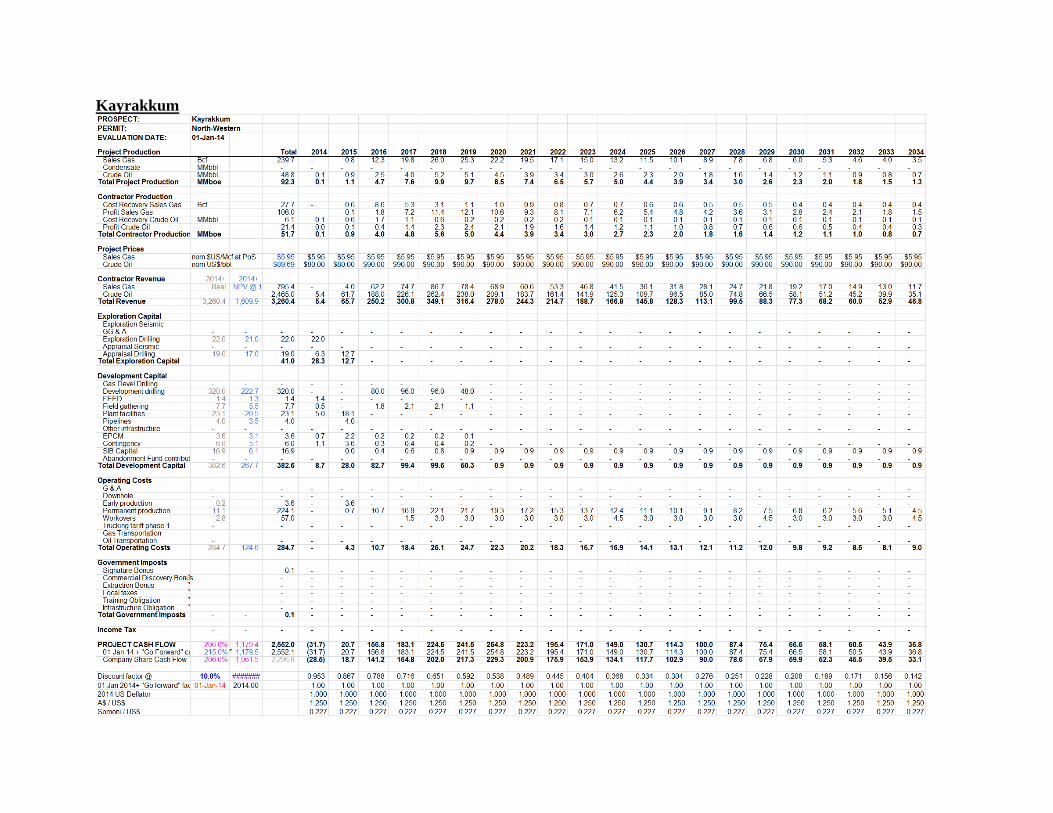
Kayrakkum
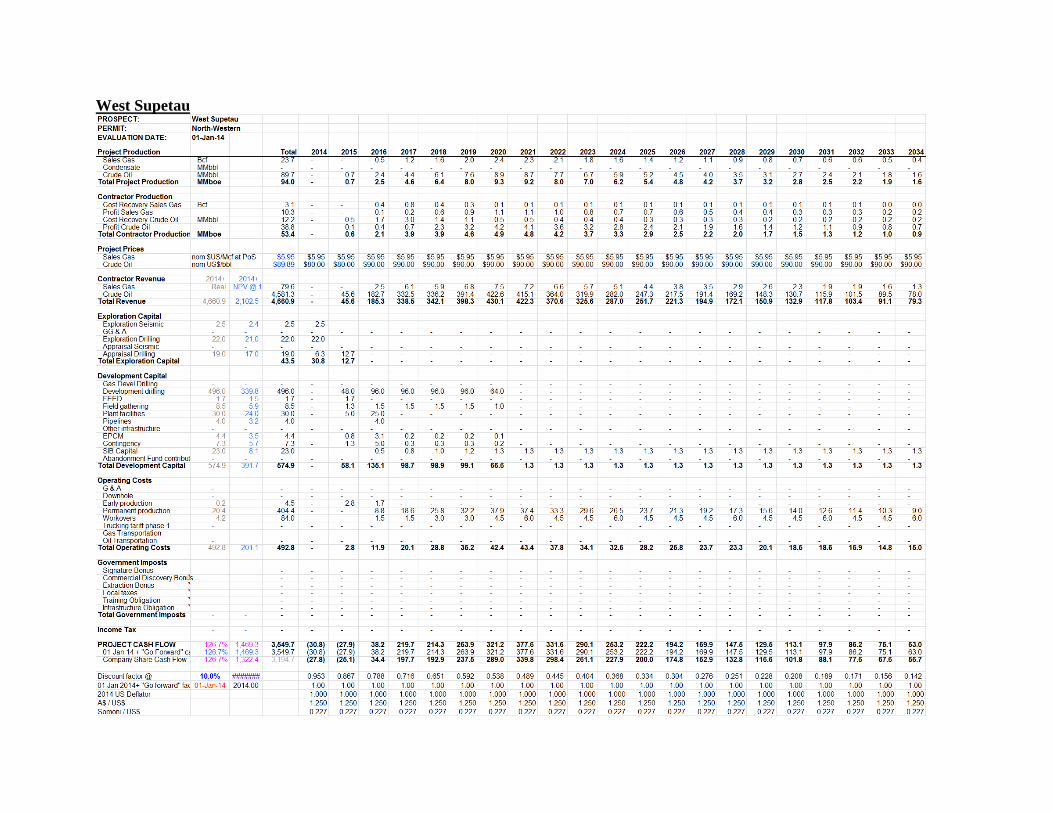
West Supetau
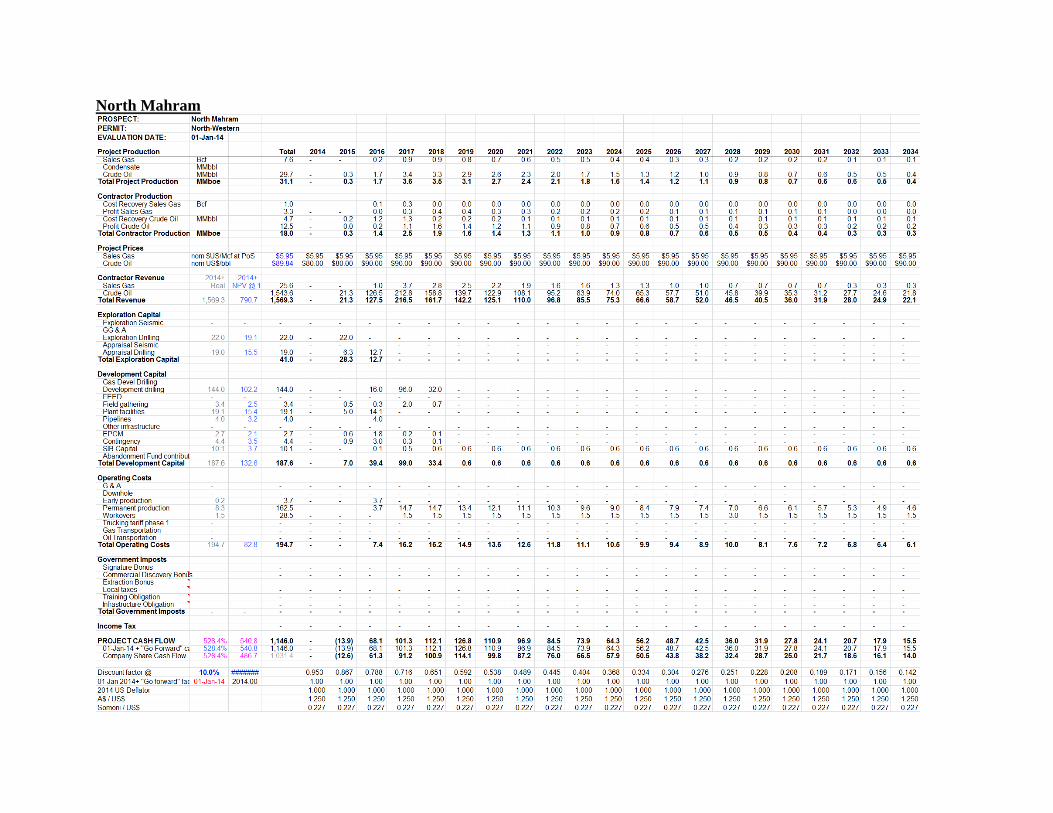
North Mahram
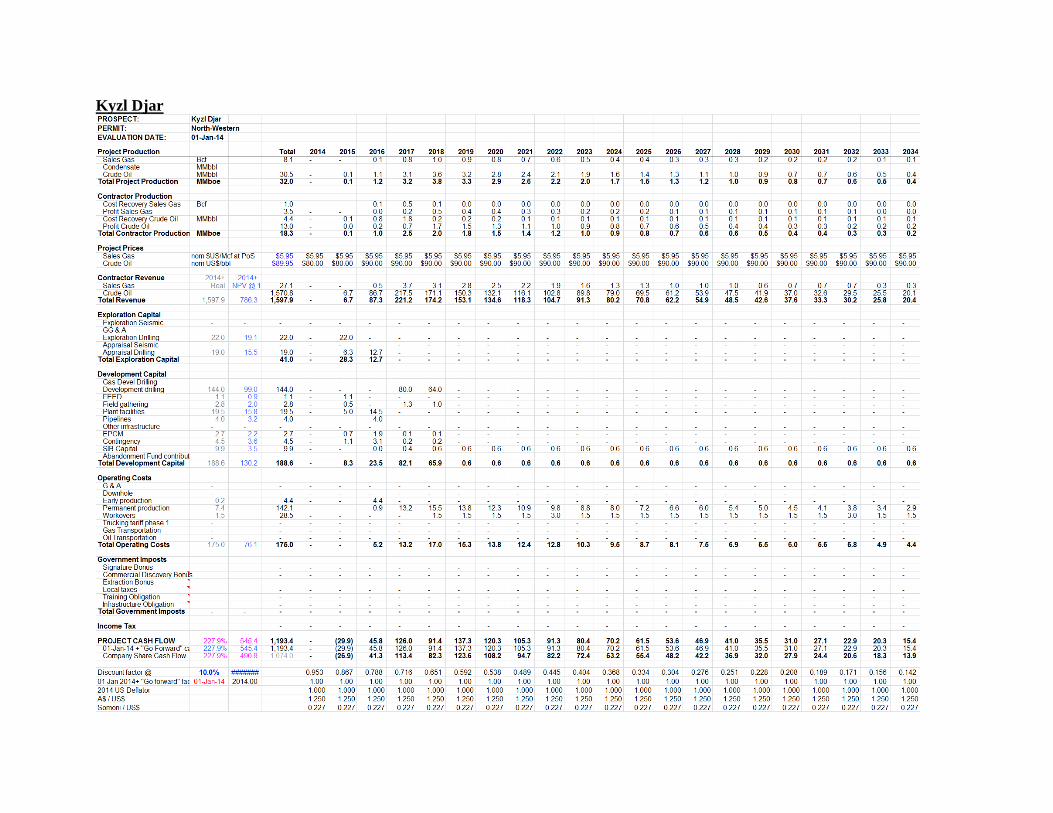
Kyzl Djar
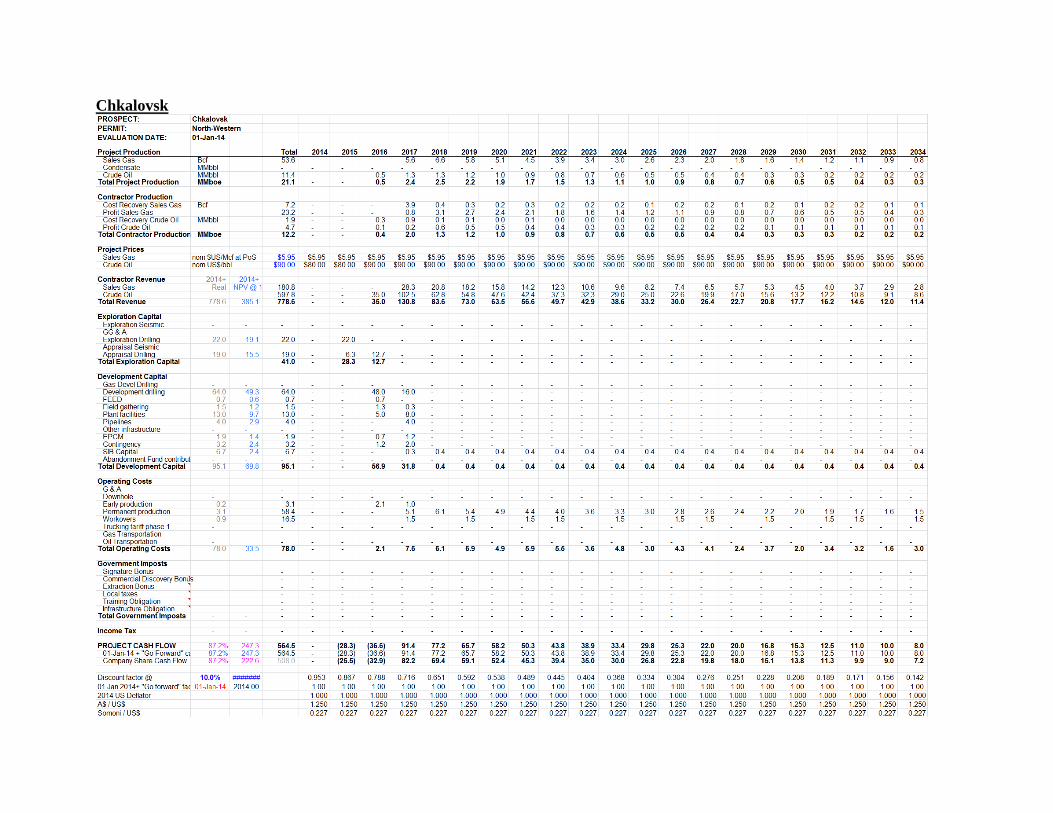
Chkalovsk
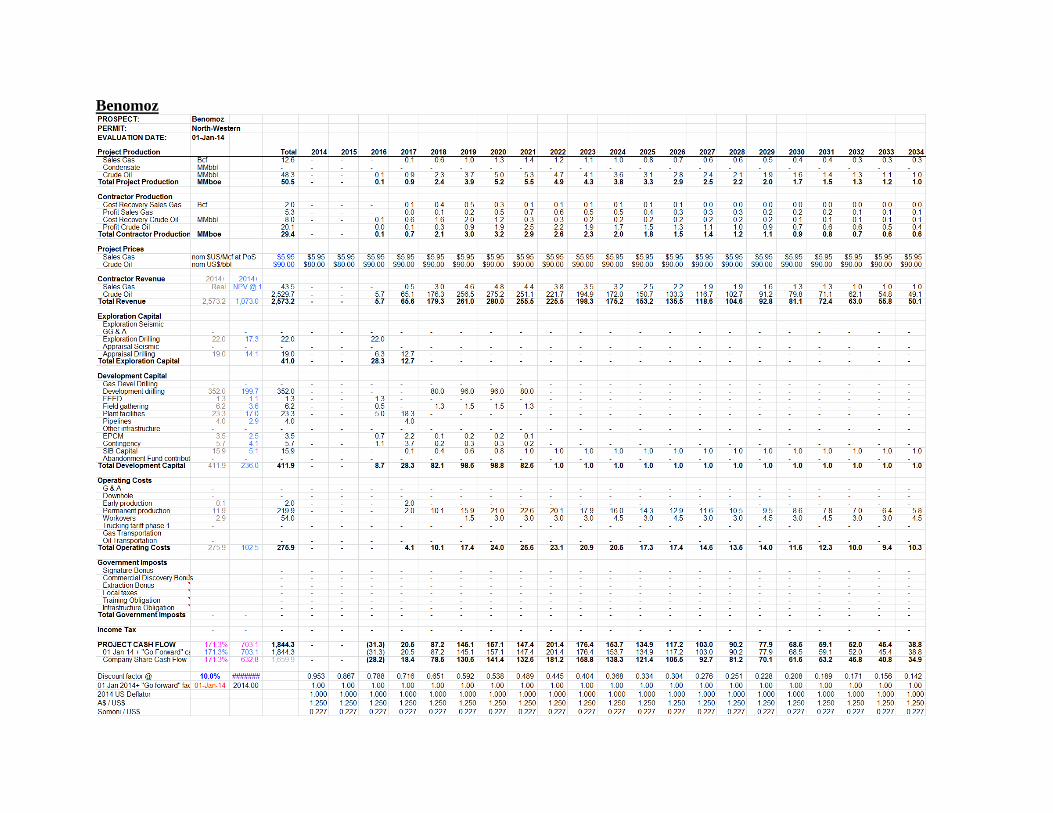
Benomoz
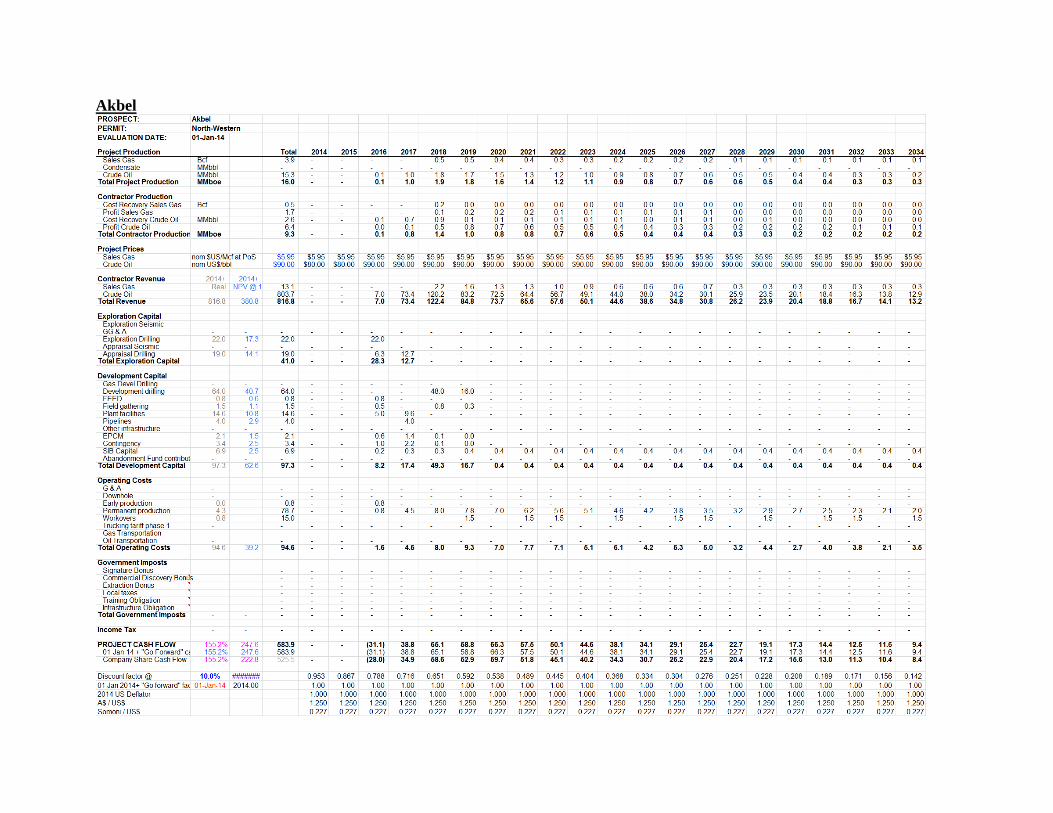
Akbel
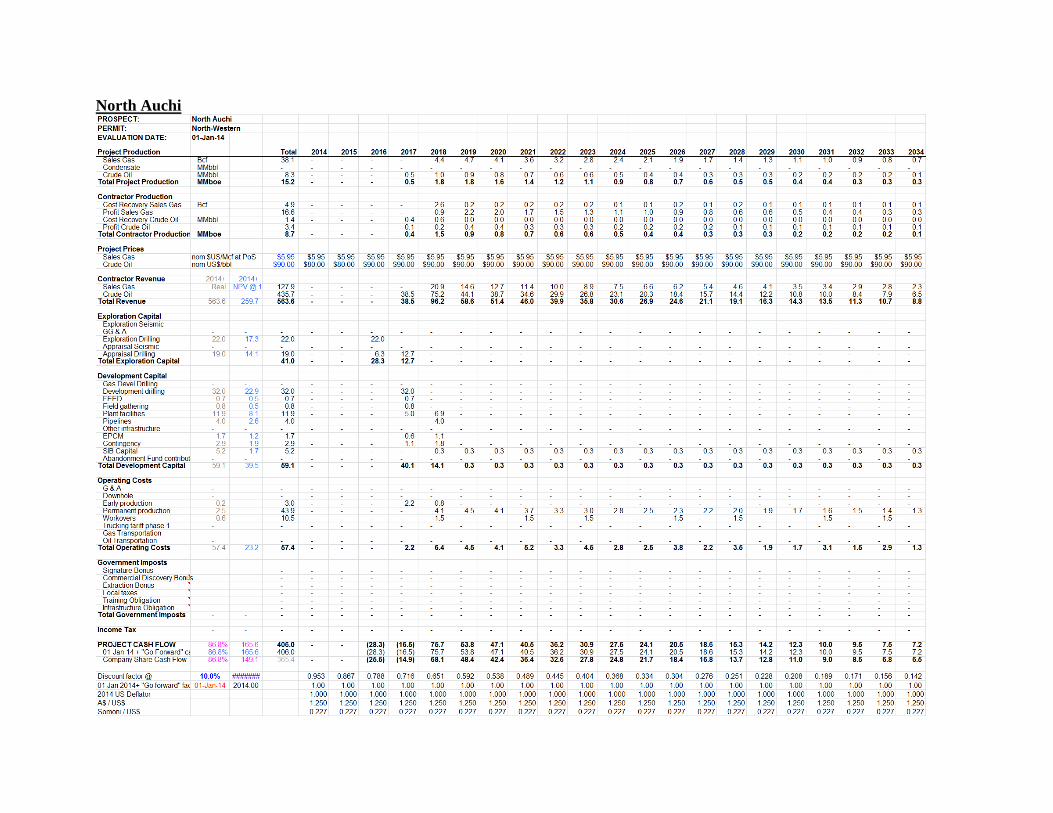
North Auchi
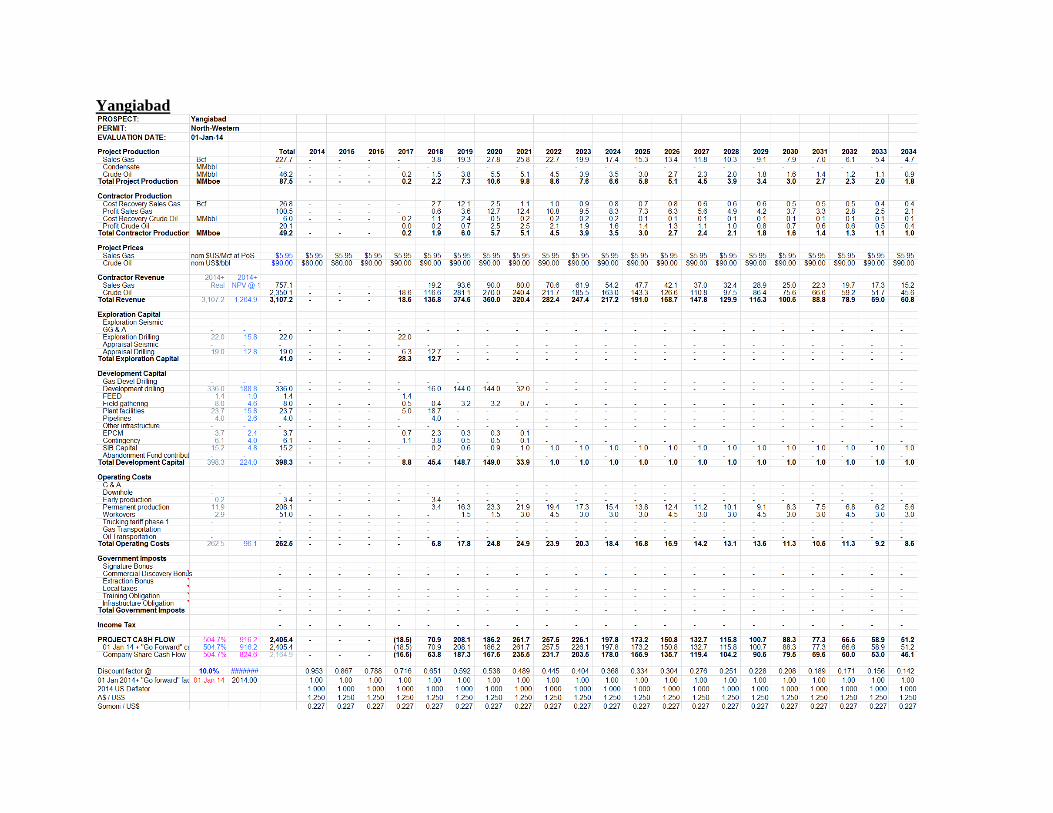
Yangiabad
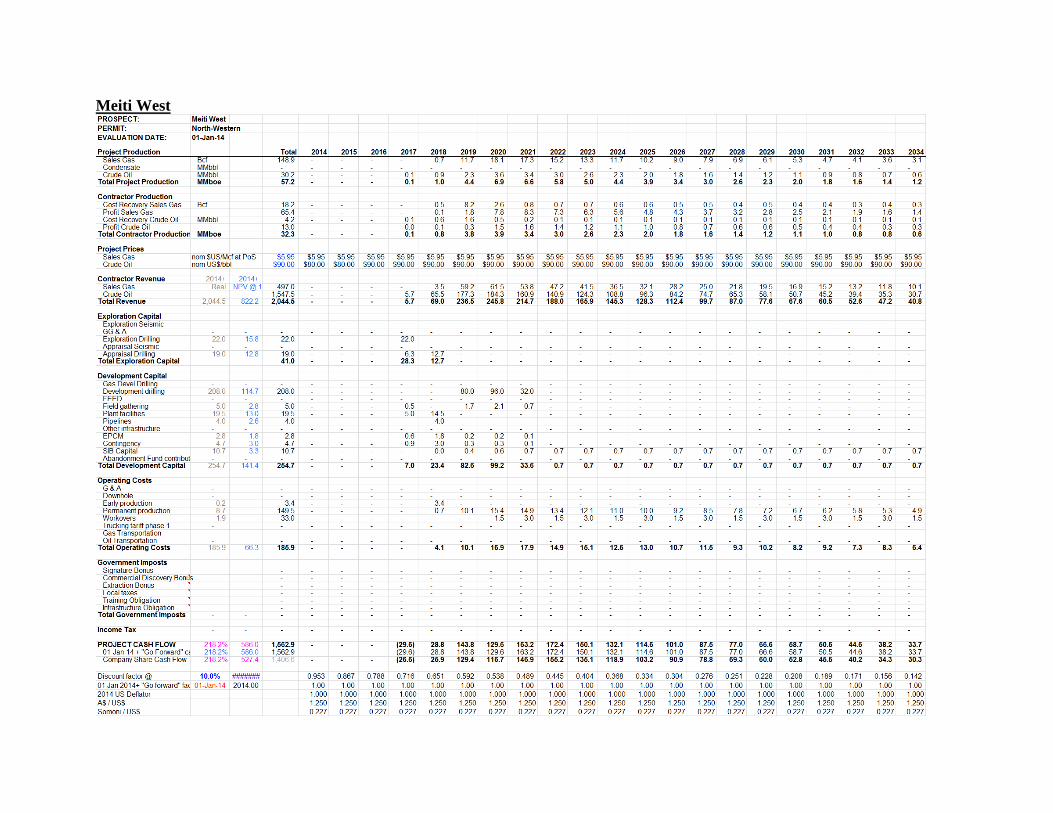
Meiti West
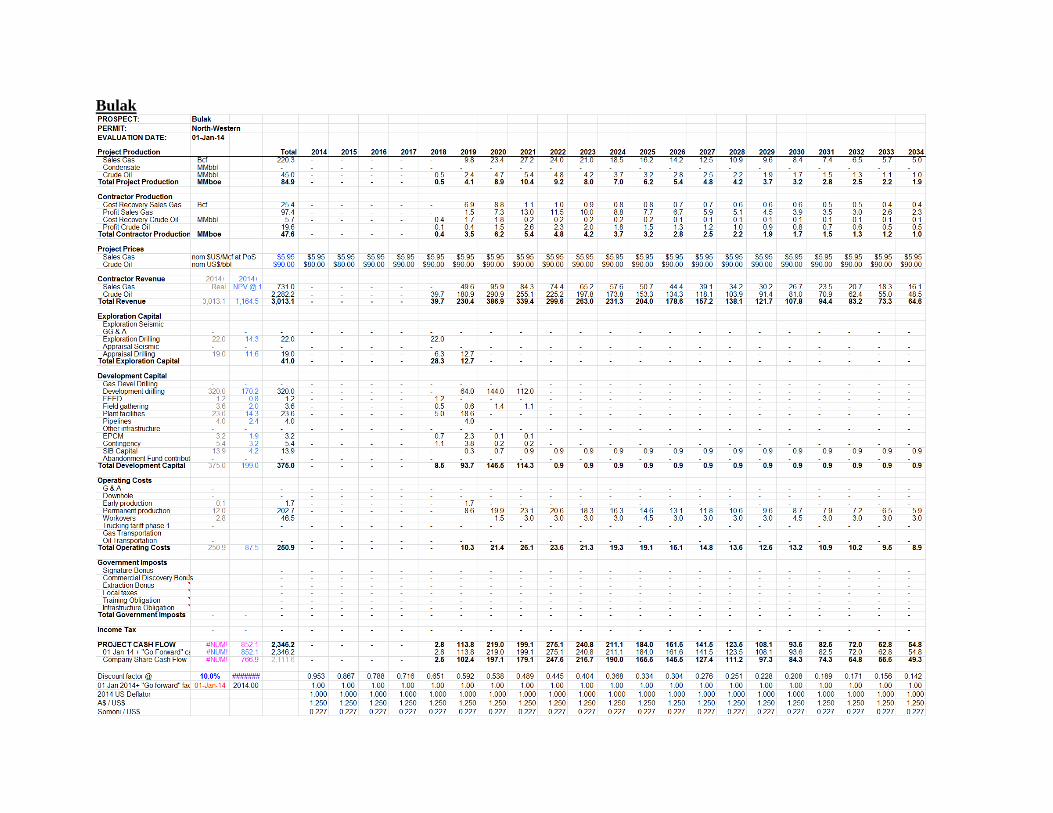
Bulak