responses to avian influenza and state of pandemic...
TRANSCRIPT

i
Responses to Avian Influenza and State of Pandemic Readiness
Fourth Global Progress Report
October 2008
UN System Influenza Coordinator & The World Bank

United Nations System Influenza Coordination 2 United Nations Plaza, DC2-2609, New York, NY 10017, USA Tel. +1 212 906 6183 / +1 917 332 7296 Fax. +1 212 906 6473 www.influenza.undg.org
World Bank 1818 H Street NW, Washington, DC 20433, USA Tel. +1 202 473 1000 Fax. +1 202 477 6391 www.worldbank.org/avianflu
Writing Team UNSIC Simon Cubley Ellen Funch Iain Bald Alexandra Conseil (LSHTM) Lauren Trakimas Michelle Barrett
World Bank Olga Jonas Pauline Zwaans Anju Sharma Elizabeth Marvin
Responsible Officer David Nabarro (UN System Influenza Coordinator)

Contents
Executive summary 8
1. Background and Introduction 9
2. International Financial and Technical Assistance 13
Pledges, Commitments & Disbursements 14
Analysis of International Systems for Support to Countries 21
3. Capacity to Reduce the Threats of Avian Influenza to Animals and Humans 26
Planning and Preparedness 26
Animal Health Services 28
Disease Surveillance, Identification and Response 28
Compensation Schemes & Assistance to those Economically Affected by HPAI 36
Poultry Vaccination 38
Biosecurity for Commercial & Household Poultry Production 39
Cross Border, Regional and International Collaboration on HPAI 41
Collaboration between Animal and Human Health Sectors 42
Communication to Prevent the Spread of HPAI & Reduce the Risk to Humans 43
IHR (2005) Implementation, Monitoring and their Relation to HPAI 47
Detection Capacity for H5N1 in Humans 49
4. Preparedness for Mitigating the Impacts of the Next Influenza Pandemic 52
Overall Planning 52
Making Planning Operational ‐ Including Simulations and Revision 53
Incorporation of Preparations & Response into National Disaster Management 55
Established and Validated Protocols for a Pharmaceutical Response 56
Public Health Interventions and Social Distancing in the Event of a Pandemic 57
Health System Capacity 61
Continuity of Essential Services Beyond Health During a Pandemic 61
Disadvantaged and Vulnerable Groups 64
Cross Border, Regional Planning & Inter‐Operability 65
5. Conclusions & Recommendations 67
Annex I Country Tables 73
Annex II Additional Charts of Data Collected from National Authorities 77
Annex III World Bank Operations under the Global Programme for Avian and Human Influenza 82
Annex IV Tables on Pledges Commitments and Disbursements 84

List of Illustrative Case Studies and Information Text Boxes Section 1: Background and Introduction 1.1 Latest Research on the Continued Threat of Influenza Pandemic and the
Transmissibility of H5N1 (Focus on 2008)
10
Section 2: International Financial and Technical Assistance 2.1 2.2
Update on UN‐World Bank Financial Collaboration Agreements Yemen Country Case Study
24 25
Section 3: Capacity to Reduce the Threats of Avian Influenza to Animals and Humans 3.1 ALive ‐ Integrated National Action Programme on Avian and Pandemic Influenza 27 3.2 Mongolia: Innovative Commitment by at An‐Risk Country 29 3.3 Lao People’s Democratic Republic: Frontline Early Detection of Infected Backyard
Poultry by Alert Locals 31
3.4 A Comprehensive Multisectoral Response to HPAI Outbreaks Enables Wider Benefits and Greater Preparedness
35
3.5 Participatory Disease Surveillance and Response in Indonesia: Strengthening Veterinary Services and Empowering Communities
36
3.6 Cross Border and Regional Cooperation on HPAI in Western Africa 42 3.7 Egypt: Community‐Based Education Campaigns – Empowerment through Education 46 3.8 An Example of Implementation Progress with the IHR (2005) in the Asia‐Pacific
Region 48
3.9 WHO Global Surveillance Capacity: Advancements and Virus Tracking 50 3.10 China Country Case Study 51 Section 4: Preparedness for Mitigating the Impacts of the Next Influenza Pandemic 4.1 Cambodia: An Example of Sub‐regional Pandemic Planning 53 4.2 Indonesia: One of the Largest Full‐Scale Pandemic Influenza Exercises – Planning
Process Deemed Just as Important as the Final Simulation 55
4.3 Options for the use of human H5N1 influenza vaccines and the WHO H5N1 vaccine stockpile
57
4.4 Examples of Recent Scientific Research and Policy Discussions on Social Distancing Measures
60
4.5 Financial Services Sector Leading the Way in Planning and Testing for a Pandemic 63 4.6 Country Focus: Multi‐Sector Pandemic Preparedness in Egypt 64 4.7 USAID and IFRC Humanitarian initiative to Prepare for a Pandemic Influenza
Emergency 65
4.8 Analysis of Pandemic Preparedness by Country Income Levels
66
Acronyms and Abbreviations AI Avian Influenza AHI Avian and Human Influenza AHIF Avian and Human Influenza Facility AHITF Avian and Human Influenza Task Force ALive Africa Partnership for Livestock
Development, Poverty Alleviation and Sustainable Growth
APEC Asia & Pacific Economic Cooperation ASEAN Association of Southeast Asian Nations AU African Union AU‐IBAR African Union – Inter‐African Bureau for
Animal Resources CAREC+ Central Asia Regional Economic Cooperation
(including Turkmenistan and the Russian Federation)
CFIA Central Fund for Influenza Action CIRAD Centre de coopération internationale en
recherche agronomique pour le développement
CMC‐AH Crisis Management Centre for Animal Health CONOPS Concept of Operations EAP East Asia and Pacific ECA Eastern Europe and Central Asia Region ECDC European Centre for Disease Prevention and
Control ECOWAS Economic Community of West African States ECTAD Emergency Centre for Transboundary
Animal Diseases EEA European Economic Area EIS Event Information Site EU European Union FAO Food and Agriculture Organisation of the
United Nations GAINS Global Avian Influenza Network for
Surveillance GISN Global Influenza Surveillance Network GLEWS Global Early Warning and Response System
for Major Animal Diseases, including Zoonoses
GPAI Global Program for Avian and Human Influenza Control and Preparedness
GOARN Global Outbreak Alert and Response Network
HPAI Highly Pathogenic Avian Influenza IASC Inter‐Agency Standing Committee ICS Incident Command System IFRC International Federation of the Red Cross
and Red Crescent Societies IHR International Health Regulations INGO International Non‐Governmental
Organisation IBRD International Bank for Reconstruction and
Development (World Bank) IDA International Development Association (of
the World Bank)
IMF International Monetary Fund INAP Integrated National Action Plan IPAPI International Partnership on Avian and
Pandemic Influenza LSHTM London School of Hygiene and Tropical
Medicine MBDS Mekong Basin Disease Surveillance MDBs Multilateral Development Banks MDTF Multidonor Trust Fund MNA Middle East and North Africa Region NFP National Focal Point NGO Non‐Governmental Organisation OCHA United Nations Office for the Coordination
of Humanitarian Affairs OFFLU OIE/FAO Network of Expertise on Avian
Influenza OIE World Organisation for Animal Health PAHO Pan American Health Organization PHRD Policy and Human Resources Development
(World Bank‐managed Japanese Trust Fund) PIC UNSIC Pandemic Influenza Contingency PoE Point of Entry PPE Personal Protective Equipment PVS Evaluation of Performances of Veterinary
Services (OIE‐PVS Tool; formerly Performance, Vision and Strategy)
RA Rapid Assessment RCP Regional Contact Point RFP Regional Focal Point SADC Southern African Development Community TAD Transboundary Animal Disease TAG Technical Advisory Group UNDG United Nations Development Group UNDP United Nations Development Programme UNEP United Nations Environment Programme UNHCR Office of the United Nations High
Commissioner for Refugees UNICEF United Nations Children’s Fund UNSIC United Nations System Influenza
Coordination USAID United States Agency for International
Development USCDC United States Centers for Disease Control
and Prevention WAEMU West African Economic and Monetary Union WAHID/S OIE World Animal Health Information
Database/ System WFP World Food Programme WHO World Health Organisation WHO WPRO WHO Western Pacific Regional Office

6

7
8
Executive summary It is now nearly five years since H5N1 highly pathogenic avian influenza (HPAI) spread across Southeast Asia and then to the rest of Asia, Europe and Africa. The rapid spread, significant socioeconomic losses, numerous human deaths, and the potential threat of a human pandemic influenza triggered concerted global action to control the disease and prepare for the next influenza pandemic. Since then around US$2.7 billion has been pledged and US$1.5 billion disbursed globally by the donor community to fight against HPAI and to aid pandemic preparedness. In addition, proportionately enormous funding and human resources have been expended by countries affected and at‐risk of HPAI and in preparing for a pandemic. The threat posed over the last 5 years has mobilized an unprecedented coming together of the animal health, human health, disaster preparedness and communication sectors to work in a cross discipline, cross sector and cross boundary way. At the last International Ministerial Conference on Avian and Pandemic Influenza held in New Delhi (4‐6 December 2007) it was acknowledged that significant progress made towards eliminating HPAI in many infected countries, but serious concerns remained. In response to requests from participants at the New Delhi Conference, the United Nations System Influenza Coordinator (UNSIC) and the World Bank have produced this Fourth Global Progress Report on Responses to Avian Influenza and Pandemic Readiness. The report i) describes international financial assistance provided to date; ii) assesses national capacities to respond to HPAI and prepared for the next influenza pandemic; iii) analyses implications of this progress for animal and human health and iv) recommends some key next steps. It focuses on progress with responses to avian influenza and with pandemic preparedness between June 2007 and June 2008, but also looks back over the last three years. Information was provided by national authorities from 148 countries that responded to an UNSIC survey questionnaire supplemented by with case studies, interviews and reports from UN system bodies and other partners. The information on donor pledges, commitments and disbursements has been collected by the World Bank via a donor polling exercise. A global analysis of the situation now in mid to late 2008 indicates fewer outbreaks in poultry, fewer newly infected countries, fewer human cases and fewer deaths compared to the same period in 2006 and 2007. Over 50 of the 61 countries that have experience an H5N1 outbreak, have successfully eliminated the disease. However, the virus remains entrenched in several countries and the threat of further outbreaks of HPAI in poultry (and sporadic cases in humans) persists. The threat of an influenza pandemic remains unchanged. While these findings suggest that HPAI strategies are successful when properly implemented, they also highlight that sustained vigilance and continued investment is needed in both surveillance and capacity to respond to HPAI. Significant progress has been made during the last year, and there is now near global awareness of the issue and the need to enable nations and communities to prevent, prepare and be able to respond to HPAI and pandemic influenza. Surveillance capacities have improved significantly over the past 3 years and there is now greater awareness and more incentives for reporting. Significant efforts are still needed in biosecurity and fundamental behavior change by poultry owners/ producers remains a long term objective. There is still the need for high political commitment to improve and invest in animal and public health systems. Many countries have made substantial progress for their national pandemic preparedness; in some regions sophisticated advancements continue to be made in deepening and developing preparations. However, many of the plans have not yet been fully endorsed or made operational – in particular at the local level and preparations in sectors beyond health need to be strengthened. Whilst the threat remains, it can be concluded that the world is significantly better prepared to respond to HPAI and to mitigate the impacts of the next influenza pandemic. Need remains for continued advocacy, support and monitoring of preparations to ensure the capacity to respond to the threat of HPAI (and in many cases other zoonosis) is strengthened and made sustainable. In addition, it is essential to review, adapt and update pandemic preparations which will not only be of benefit in the event of pandemic but for the general resilience of a country against other emergencies. With the threat of HPAI came an increased awareness of health threats at the animal‐human‐interface, and of the importance of a multi‐sectoral response. This better understanding needs to be sustained and advanced: During 2009, the world’s nations should agree on ways to better prevent, prepare and respond to the health, social, economic and political impacts of pandemics and emerging infectious diseases at the at the animal‐human‐ecosystem‐interface.
9
46
98115
88
3632
43
79
59
28
9
16
5561 61
0
10
20
30
40
50
60
0
20
40
60
80
100
120
2004 2005 2006 2007 2008Num
ber as rep
orted to OIE
Num
ber as rep
orted to W
HO
Human Cases, Deaths from H5N1 and Cumulative Number of Countries Affected
Human cases (per year, left axis)
Human deaths (per year, left axis)
Countries with H5N1 in animals (cumulative, right axis)
As of 10 Sept 2008
1. Background and Introduction
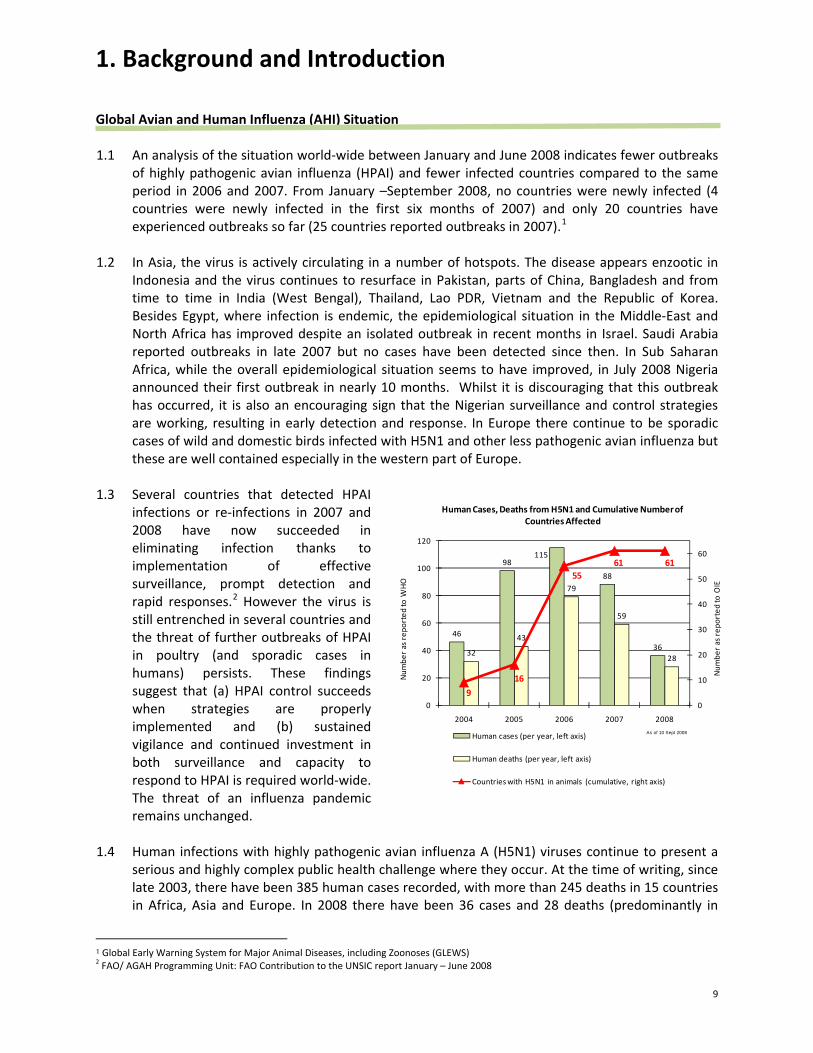
Global Avian and Human Influenza (AHI) Situation 1.1 An analysis of the situation world‐wide between January and June 2008 indicates fewer outbreaks
of highly pathogenic avian influenza (HPAI) and fewer infected countries compared to the same period in 2006 and 2007. From January –September 2008, no countries were newly infected (4 countries were newly infected in the first six months of 2007) and only 20 countries have experienced outbreaks so far (25 countries reported outbreaks in 2007).1
1.2 In Asia, the virus is actively circulating in a number of hotspots. The disease appears enzootic in Indonesia and the virus continues to resurface in Pakistan, parts of China, Bangladesh and from time to time in India (West Bengal), Thailand, Lao PDR, Vietnam and the Republic of Korea. Besides Egypt, where infection is endemic, the epidemiological situation in the Middle‐East and North Africa has improved despite an isolated outbreak in recent months in Israel. Saudi Arabia reported outbreaks in late 2007 but no cases have been detected since then. In Sub Saharan Africa, while the overall epidemiological situation seems to have improved, in July 2008 Nigeria announced their first outbreak in nearly 10 months. Whilst it is discouraging that this outbreak has occurred, it is also an encouraging sign that the Nigerian surveillance and control strategies are working, resulting in early detection and response. In Europe there continue to be sporadic cases of wild and domestic birds infected with H5N1 and other less pathogenic avian influenza but these are well contained especially in the western part of Europe.
1.3 Several countries that detected HPAI
infections or re‐infections in 2007 and 2008 have now succeeded in eliminating infection thanks to implementation of effective surveillance, prompt detection and rapid responses.2 However the virus is still entrenched in several countries and the threat of further outbreaks of HPAI in poultry (and sporadic cases in humans) persists. These findings suggest that (a) HPAI control succeeds when strategies are properly implemented and (b) sustained vigilance and continued investment in both surveillance and capacity to respond to HPAI is required world‐wide. The threat of an influenza pandemic remains unchanged.
1.4 Human infections with highly pathogenic avian influenza A (H5N1) viruses continue to present a serious and highly complex public health challenge where they occur. At the time of writing, since late 2003, there have been 385 human cases recorded, with more than 245 deaths in 15 countries in Africa, Asia and Europe. In 2008 there have been 36 cases and 28 deaths (predominantly in
1 Global Early Warning System for Major Animal Diseases, including Zoonoses (GLEWS) 2 FAO/ AGAH Programming Unit: FAO Contribution to the UNSIC report January – June 2008

10
Indonesia although Egypt, China and Vietnam continue to experience cases and deaths). Bangladesh is the only new country in 2008 to experience a human case.
1.5 Currently, H5N1 still causes infections relatively rarely in people, however when they occur, such
infections have been frequently fatal (the case fatality rate this year is 76% in total compared to 63% in total since late 2003).3 H5N1 viruses continue to evolve and could develop into a much greater public health threat resulting in the next influenza pandemic.
Purpose and Outline of Progress Report 1.6 This Fourth Progress Report on Avian Influenza and State of Pandemic Readiness has been jointly
produced by the United Nations System Influenza Coordinator (UNSIC) and the World Bank, with
3 As the majority of human cases occurred in Indonesia, which has always experienced a higher mortality rate than other countries, this number may not indicate a trend.
Box 1.1 Latest Research on the Continued Threat of Influenza Pandemic and the Transmissibility of H5N1 (Focus on 2008) Five years after the re‐emergence of H5N1, sporadic cases and small clusters of human infections with H5N1 avian influenza persist and the virus remains a substantial threat to global public health security. Other avian influenza A sub‐types (H7, H9) also present a potential danger but to date H5N1 viruses constitute the most imminent and important pandemic influenza threat. Thus far this year (between 1 January and 10 September 2008), 36 human cases of H5N1 have been confirmed in five countries1 of which, Bangladesh reported its first human case. When compared with the same period during the years 2005, 2006 and 2007, this year has witnessed the fewest number cases. 2 There has been little reported change in epidemiological features. As with previous years, the case fatality rate of the virus has been high; H5N1 human infections have, by a large majority, been sporadic and are believed to have been acquired through avian‐to‐human transmission, usually following human exposure to sick or dead poultry.1,6 There has been no report suggesting human‐to‐human transmission amongst the few cluster cases that emerged so far in 2008. Nevertheless, studies have suggested that, in the recent past, limited, non‐sustainable human‐to‐human transmission has probably occurred amongst clusters of epidemiologically linked cases in a small number of countries, including China, Indonesia and Pakistan. Since the re‐emergence of the threat in 2003, there has been no evidence of sustained human‐to‐human transmission of H5N1 and the WHO alert level has remained at Phase 3 (no or very limited human‐to‐human transmission).
However, despite the fact that there have been fewer cases in fewer countries thus far in 2008 when compared with the same periods in the past couple of years, it is important to underscore that the virus is now entrenched in parts of Asia and Africa and that the threat of an H5N1 pandemic influenza undoubtedly persists. 1 Bangladesh, China, Egypt, Indonesia and Vietnam 2 Year 2005: 69 cases (as of 16 September 2005); Year 2006: 97 cases (as of 08 September 2006); Year 2007: 64 cases (as of 31 August 2007) Sources : • Uyeki TM. Global epidemiology of human infections with highly pathogenic avian influenza (H5N1) viruses. Respirology 2008; 12: S2‐S9. • WHO (2008). Cumulative Number of Confirmed Human Cases of Avian Influenza A/(H5N1) Reported to WHO • Writing Committee of the Second World Health Organization Consulation on Clinical Aspects of Human Infection with Avian Influenza A (H5N1)
Virus (Abdel‐Ghafar AN, Chotpitayasunondh T, Gao Z et al). Update on Avian Influenza A (H5N1) Virus Infection in Humans. N Engl J Med 2008; 368 (3): 261‐273.
• Wang H, Feng, Z, Shu Y et al. Probable limited person‐to‐person transmission of highly pathogenic avian influenza (H5N1) virus in China. Lancet 2008; 371 (9622): 1427‐34.
• Yang, Y, Halloran ME, Sugimoto J, Longini IM. Detecting Human‐to‐Human transmission of Avian Influenza A (H5N1). Emerg Infect Dis 2007; 13(9):1348‐53.
• WHO (2008). Avian influenza – situation in Pakistan ‐ update 2 (03 April 2008). Available at: http://www.who.int/csr/don/2008_04_03/en/index.html .

11
valuable contributions from the Pandemic Influenza Contingency Team (PIC) based in the Office for the Coordination of Humanitarian Affairs (OCHA), the UN Food and Agricultural Organisation (FAO), the World Organisation for Animal Health (OIE), the World Health Organisation (WHO) and the UN Children’s Fund (UNICEF). The collaboration of 148 countries and territories that returned the UNSIC survey was the basis for much of the report content. It focuses on the progress in the response to avian influenza and pandemic preparedness between June 2007 and June 2008, but comparatively covers data from the past three years.
1.7 Previous UNSIC‐World Bank reports have covered the periods January to June 2007 produced in preparation for the New Delhi Intergovernmental Ministerial Conference on Avian and Pandemic Influenza (December 2007), July to December 2006 for the Bamako Conference (December 2006), and January to June 2006 for the Vienna meeting (June 2006). This report will be released ahead of time for the next intergovernmental ministerial conference, to be hosted in Sharm El Sheikh, Egypt, in October 2008.
1.8 The report includes presentation of data, analysis and comment in five main subject areas: (a)
global financial and technical assistance, (b) animal health, (c) human health, (d) pandemic preparedness and (e) communications. The purpose of this report is to provide an analysis of: i) International financial assistance provided to date; ii) National capacities to respond to HPAI and prepare for the next influenza pandemic; iii) Implications of this progress for animal and human health ;and iv) Some key next steps.
Study Methods: Design, Collection, Analysis and Limitations 1.9 Data and information for the current report was obtained from six principle sources:
• National authorities, surveyed by UNSIC: including responses from Ministries of Agriculture, Ministries of Health, National Disaster Committees and other responsible governmental agencies;
• Information collected from donor countries (by the World Bank) covering pledges, commitments, and disbursements in support of avian and human influenza control and pandemic preparedness;
• Case studies and illustrative examples of ongoing programs or projects; • A report prepared by FAO, which assesses the capacity to prevent, detect and respond to HPAI
in 54 countries where FAO is either implementing projects or there is a fluid epidemiological situation;
• Information from UN system and partner agencies; Reports from informants within the international community on coordination of external support and successes and challenges encountered during programme implementation; and
• Other published studies and assessments.
1.10 For the collection of UNSIC primary data, a survey of 46 questions was posed to 178 countries or territories (where the report refers to countries this also infers territories). The survey was made available in the six official UN languages. Overall, 148 responses to the survey were received, giving a response rate of over 83%. Of the 148, 127 were from the same countries as 2007 which provides an 86% global comparison. Questions were intended to be applicable to countries in a variety of situations. The full list of responding countries can be found in Annex I Table 1. The questionnaire contained a combination of questions, some repeated from previous years’ surveys to enable comparisons and new or adapted questions that were asked for the first time. The new or adapted questions are in response to changing circumstances: progress identified in previous

12
reports was recognized, and now new dimensions of countries’ capacities and preparedness need to be assessed.
1.11 In line with the December 2007 report, where possible responses to the data collection exercise were sought from contacts points within the national authorities. UN country level focal points were available to assist national authorities in this exercise; countries in which UN officials completed the questionnaire are specifically marked in Annex I Table 1. The draft report has also been circulated to those national authorizes who have taken part for their review.
1.12 As per previous reports, responses have been aggregated along World Bank Regional
classifications (Annex I Table 1). In addition this year’s analysis has also been conducted via new disaggregations: • To enable the identification of specific progress, same country responses to repeated
questions from previous years have been analyzed; • In an effort to distinguish the unique situation of countries with experience since 2003 of HPAI
infection and those without (infected – non‐infected), disaggregation occurs on this basis (as per reports to OIE of 25 July 2008); and
• To enable further distinction of where the challenges remain, disaggregation also occurs on a country income scale (as per World Bank classifications, Annex I Table 4).
1.13 The reader is asked to bear in mind that the data and interpretation of results based on the UNSIC
survey reflects the assessment by national officials and remains indicative. Whilst it has not proved possible for UNSIC and the World Bank to validate all those responses, it is hoped that by including inputs from the UN Technical Agencies and independent sources the report will provide a broader assessment. However, these results presented here remain indicative.
1.14 UNSIC and the World Bank are jointly responsible for the preparation, content and production of the report, and for any revisions that may be issued.

13
2. International Financial and Technical Assistance
Background
2.1 This section outlines the overall support provided by the international community through the multidonor flexible financing framework4 to assist individual countries, territories, and regional and international organisations to (a) respond to the threat posed by HPAI and (b) prepare for the next influenza pandemic..
2.2 The January 2006 “Avian and Human Influenza: Multidonor Financing Framework” and accompanying “Avian and Human Influenza: Financing Needs and Gaps”5 papers served as the basis for a coordinated global response by the international community. They outlined a flexible three‐year financing framework to channel donor funds for the immediate and short‐term needs of the response. The analysis recommended that the coordinated global response should be based on a common vision for addressing three areas of activity: (a) preventing the next human influenza pandemic by controlling the highly pathogenic H5N1 virus in fowl and improving surveillance; (b) containing a human influenza pandemic through rapid detection and care of human cases, and preventing human‐to‐human transmission of the pathogen; and (c) preparing to react effectively when an influenza pandemic is suspected to mitigate its potential social, economic, and health impacts. This global response would be guided by the leading technical agencies – FAO, OIE, and WHO, with support from the international donor community and international financial institutions. .
2.3 A number of principles were seen as critical to the response: (a) the use of a multisectoral
approach; (b) country commitment to integrated national avian and human influenza programs and coordinated donor support for such programs; (c) a balance between short‐ and long‐term actions; and (d) continuous evaluation of key interventions and actions as part of each program.6 These principles were embodied in programs prepared at the country level. The UN system’s agencies went on to develop a combined strategy in December 2005 and produced their consolidated action plan in June 2006, in support of the global response.
2.4 The “financing gap” for country, regional and global activities was initially estimated at around
$1.2 billion over three years.7 These estimates were subsequently revised upward because of the rapidly growing number of H5N1 infected and at‐risk countries during 2006 and 2007, and an increasingly pressing need to put in place adequate preparedness and response capacity, in particular in Africa. Despite strong donor support most recent estimates showed a remaining financing gap of $1.2 ‐ $1.5 billion for a 2‐3 year period, including both financing for country programs and a $325 million financing gap for international technical and other UN agencies.8
4 For further details see ‘Avian and Human Influenza: Multidonor Financing Framework’, World Bank, January 12, 2006, available at www.worldbank.org/avianflu
5 Avian and Human Influenza, Financing Needs and Gaps, The World Bank, January 12, 2006, available at www.worldbank.org/avianflu. 6 For further details please see “Avian and Human Influenza: Financing Needs and Gaps”, The World Bank, January 12, 2006. 7 For further details please see “Avian and Human Influenza: Financing Needs and Gaps”, The World Bank, January 12, 2006
8 For further details please see “Avian and Human Influenza: Update on Financing Needs and Framework”, The World Bank, November 2006 and section 2 of the Third Global Progress Report, available at www.worldbank.org/avianflu.

14
Figure 2.1. Pledges of Support Have Declined Relative to Gaps
17
9
35
0
200
400
600
800
1,000
1,200
1,400
1,600
1,800
2,000
Beijing (Jan '06) Bamako (Dec '06) Delhi (Dec '07)
$ m
illio
n
0
4
8
12
16
20
24
28
32
36
Num
ber o
f don
ors
pled
ging
Financing gap Pledges Number of donors pledging
Loans
GrantsGrantsGrants
Pledges, Commitments and Disbursements 2.5 At the international conferences on avian and pandemic influenza in Beijing (January 2006),
Bamako (December 2006), and New Delhi (December 2007) donors pledged a total of over $2.7 billion in financial support for the global fight against avian and human influenza and for pandemic preparedness. Figure 2.1 shows the evolution over time of pledges and donor engagement, as indicated by the number of donors pledging at each conference. As evident, total pledges have fallen increasingly short of rising needs as the number of contributing donors has declined over time from 35 at the Beijing conference, to 17 at the Bamako conference, and to 9 at the New Delhi conference. Sustained donor support is essential to ensuring that interventions in countries have a long term, sustainable impact.
2.6 All pledges were made in the context of the multidonor flexible financing framework designed to
focus on coordination of donor activities and contributions, whilst allowing flexibility for donors to provide support under various terms (grants, loans, credits), and to channel their funds in various ways as per their preferences. The framework was also set out to be flexible enough to address funding needs as they emerge, and to be adaptable and sustainable over the longer term to support countries in priority activities that will take more time to implement.
2.7 In July‐August 2008 the World Bank polled participating bilateral and multilateral donors on their progress on commitments and disbursements against their Beijing, Bamako and New Delhi pledges as part of the overall monitoring of key results and outcomes, and to assist in preparations for the Sharm el‐Sheikh International Ministerial Conference on Avian and Pandemic Influenza. The results of this polling exercise9 are reported in detail in the tables on the pledges, commitments, and disbursements in Annex IV. 10
2.8 Table 2.1 summarizes the Pledges, Commitments and Disbursements as of end‐April 2008.
Against pledges of $2.7 billion, donors reported commitments of $2.0 billion, of which $1.5 billion
9 Donor pledge, commitment and disbursement information is reflected as it was reported by individual donors to the World Bank. Minor discrepancies between the figures reported and amounts received by recipients may exist due to exchange rate differentials. The World Bank is not responsible for verifying that the funds reported by donors were indeed received by recipients. Where discrepancies exist between this report and the funds received by recipients, we would encourage countries and organizations to seek clarification from the relevant donor.
10 Financial data collected is only for those countries which made an official pledge to fighting AHI at the Beijing, Bamako or New Delhi
conferences. We recognize that there are many other donors who are making a valuable contribution to fighting AHI which is not reflected in this analysis. If desired, these countries or institutions can contact the World Bank to have their commitment and disbursement data recorded.

15
has been disbursed. Of this disbursement, 59 percent was in cash and 41 percent was in‐kind (for example personal protective equipment (PPE), reagents, and other supplies for emergency response capacity). Commitments amount to over 74 percent of the total pledged, while 72 percent of the committed amount has been disbursed. Such high commitment and disbursement rates within two and half years of the establishment of the financing framework clearly demonstrate the global commitment to the fight against avian and human influenzas, and, based on World Bank experience with response to disasters, are higher than the commitment and disbursement rates of responses to major rapid‐onset disasters.
2.9 Nearly all of the $1.7 billion of grant funding pledged by bilateral donors and the European
Commission has been committed, leaving only $112 million available for commitment. Many donors have already disbursed most of their commitments: donors reporting more than 75 percent of pledges to be both committed and disbursed include Belgium, Cyprus, Czech Republic, Estonia, Finland, Ireland, Japan, Korea (Republic of), Norway, Russia, Saudi Arabia, Singapore, Spain, Sweden, Switzerland, United Kingdom and the United States. A number of bilateral donors (Canada, Estonia, France, Germany, Ireland, Norway, Singapore, Sweden and the United States) have committed more than their cumulative pledges. The multilateral development banks (MDBs), which provide financing primarily in the form of loans, have made commitments of $400 million, which leaves $584 million of their pledges uncommitted. Disbursements from the multilateral development banks have reached 22 percent of commitments because they largely finance medium‐term programs to strengthen capacity, in addition to providing funding for countries’ emergency response, such as compensation funds, which do not disburse unless an emergency arises.
Table 2.1 AHI Pledges, Commitments and Disbursements as of April 30, 2008 Pledges Donor Beijing Bamako New Delhi Total Commit Disbursem % Disbur Uncommit
A. B. C. D.=A.+B.+C. E. F. F./E. Australia 56 55 111 100 67 67% 11Canada 87 87 91 40 44% ..France 31 10 7 48 50 34 69% ..Germany 29 8 4 41 41 30 73% ..Japan 155 67 69 291 297 297 100% ..Netherlands 14 7 21 17 6 32% 3Russia 24 8 32 32 29 92% ..United Kingdom 36 18 10 65 61 51 83% 3United States 334 100 195 629 629 629 100% ..Other EU countries 2. 31 11 42 53 48 90% 6Other countries 3. 33 4 4 41 33 31 94% 10Subtotal bilateral donors 741 376 290 1,408 1,406 1,262 90% 334
European Commission 124 83 111 319 241 140 58% 79Asian Dev’t Bank 468 468 83 13 16% 385African Dev’t Bank 15 15 7 4 63% 8World Bank 501 501 310 69 22% 191Subtotal MDBs 969 15 984 400 87 22% 584Grand Total 1,835 474 401 2,710 2,050 1,490 73% 692
Notes: 1. Donors’ reports of amounts committed and disbursed from calendar year 2005 and to April 30, 2008. Uncommitted amounts are net of commitments in excess of pledges. Commitment: The result of an agreement between the donor and recipient for designated purposes; a commitment is a firm decision that prevents the use of allocated amount for other purposes. Disbursement: Actual budget transfer or release of funds to the recipient for an intended purpose. 2. Austria, Belgium, Cyprus, Czech Republic, Estonia, Finland, Greece, Hungary (which has retracted its pledge due to lack of response from recipient country), Ireland, Italy, Luxembourg, Slovenia, Spain, and Sweden. 3. Iceland, Korea (Republic of), Norway, Saudi Arabia, Switzerland, Singapore, and Thailand. 4. This number represents the portion of total donor pledges that remain uncommitted. As some donors have committed more than their pledged amounts, this number does not correspond to the difference between the total of column D (1,408 ) minus the total of column E (1,406).
16
Figure 2.2. Commitments to Support Regional Organizations Increased Fastest During
Latest Reporting Period
735
118
301
510
386
629330
77
74
206
148
433
221
377
333
0
500
1,000
1,500
2,000
2,500
April '06 June '07 Apr '08
$ m
illion
, cum
ulat
ive
Countries AHI Facility
Regional Organizations International Organizations
Other
2.10 Among the highlights, the six largest donors (those pledging over $100 million) have reported significant progress:
• The United States has committed $629 million, all of which has been disbursed. The US has
been a very active donor by providing services and grants to over 80 countries, as well as to regional and international organizations.
• Japan has fully disbursed its commitments of $277 million. Its contributions cover a wide range of countries and organizations at the regional and global levels. Through the Policy and Human Resources Development (PHRD) trust fund, Japan is also providing cofinancing for World Bank‐financed operations under the Global Program for Avian Influenza.
• The European Commission disbursed $140 million out of its commitment of $241 million. The European Commission is the largest donor to the AHI Facility administered by the World Bank. The combined commitment figure for the EC and the European Union member states amounts to $464 million, of which $309 million ‐ 67 percent ‐ has been disbursed.11
• Australia committed $100 million, of which $67 million has been disbursed to recipient countries, regional, and international organizations.
• The Asian Development Bank has committed $83 million, which includes $24 million to WHO and FAO and the remaining amount to various national and regional projects in Asia.
• The World Bank has developed an extensive project portfolio under its Global Program for Avian Influenza (GPAI), and committed $307 million up to end‐April 2008 to support integrated country programs in 27 countries; in addition it has committed $76 million of AHI Facility resources for projects in 33 countries. (Annex III).
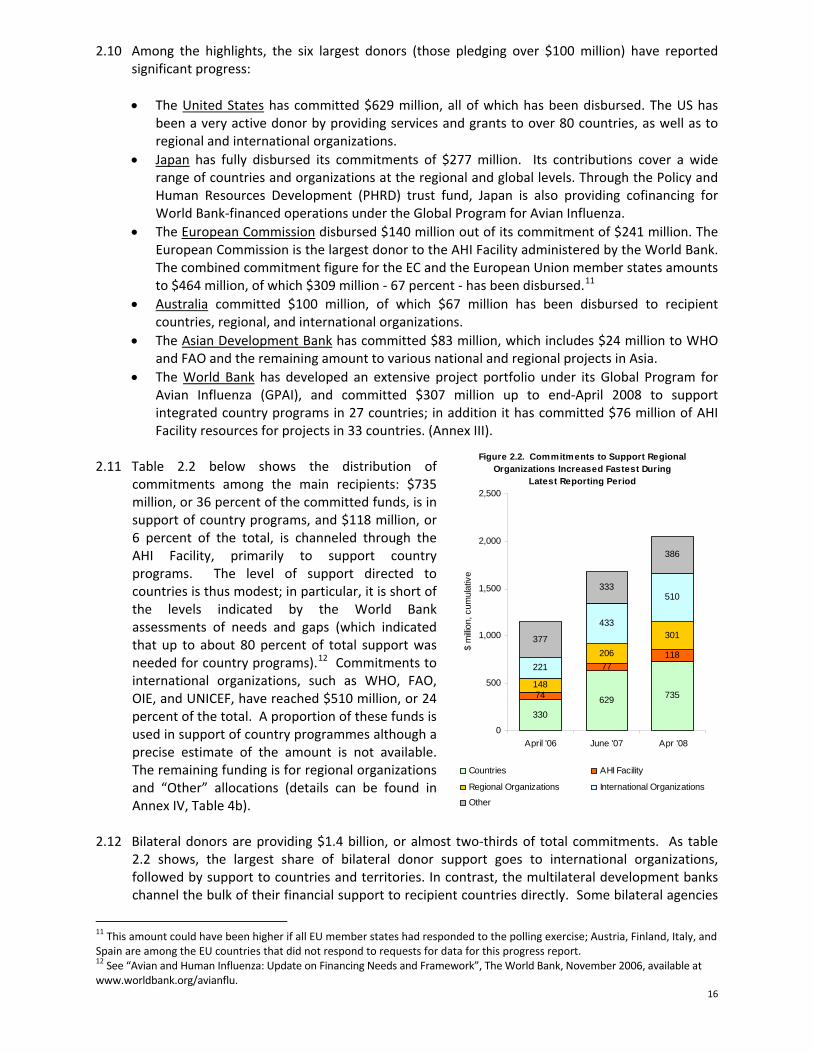
2.11 Table 2.2 below shows the distribution of
commitments among the main recipients: $735 million, or 36 percent of the committed funds, is in support of country programs, and $118 million, or 6 percent of the total, is channeled through the AHI Facility, primarily to support country programs. The level of support directed to countries is thus modest; in particular, it is short of the levels indicated by the World Bank assessments of needs and gaps (which indicated that up to about 80 percent of total support was needed for country programs).12 Commitments to international organizations, such as WHO, FAO, OIE, and UNICEF, have reached $510 million, or 24 percent of the total. A proportion of these funds is used in support of country programmes although a precise estimate of the amount is not available. The remaining funding is for regional organizations and “Other” allocations (details can be found in Annex IV, Table 4b).
2.12 Bilateral donors are providing $1.4 billion, or almost two‐thirds of total commitments. As table 2.2 shows, the largest share of bilateral donor support goes to international organizations, followed by support to countries and territories. In contrast, the multilateral development banks channel the bulk of their financial support to recipient countries directly. Some bilateral agencies
11 This amount could have been higher if all EU member states had responded to the polling exercise; Austria, Finland, Italy, and Spain are among the EU countries that did not respond to requests for data for this progress report. 12 See “Avian and Human Influenza: Update on Financing Needs and Framework”, The World Bank, November 2006, available at www.worldbank.org/avianflu.

17
use the multidonor Avian and Human Influenza Facility as a means to channel financing to countries. The European Commission provides important support to countries both directly and through its significant contribution to the AHI Facility. Figure 2.2 shows the evolution of commitments to the various types of recipients over time. Support to countries and to international organizations almost doubled between April 2006 and June 2007. Since then, the regional organizations and programmes have received the largest increase in commitments (See Annex IV, Table 4a for details). The relatively slow speed with which funds pledged by development banks have been committed and then disbursed is still a cause for concern given that this is an important route through which countries receive assistance. The reasons for this are further analyzed in this section.
2.13 Commitments to support country programs were $832 million (including $75.6 million from the
World Bank‐administered AHI Facility as well as a contribution from Japan’s PHRD Trust Fund). The main recipients were Indonesia ($128 million), Vietnam ($115 million), Nigeria ($58 million), Turkey ($46 million) and Romania ($41 million). Table 2.3 lists countries and territories that received more than $10 million in cumulative commitments.
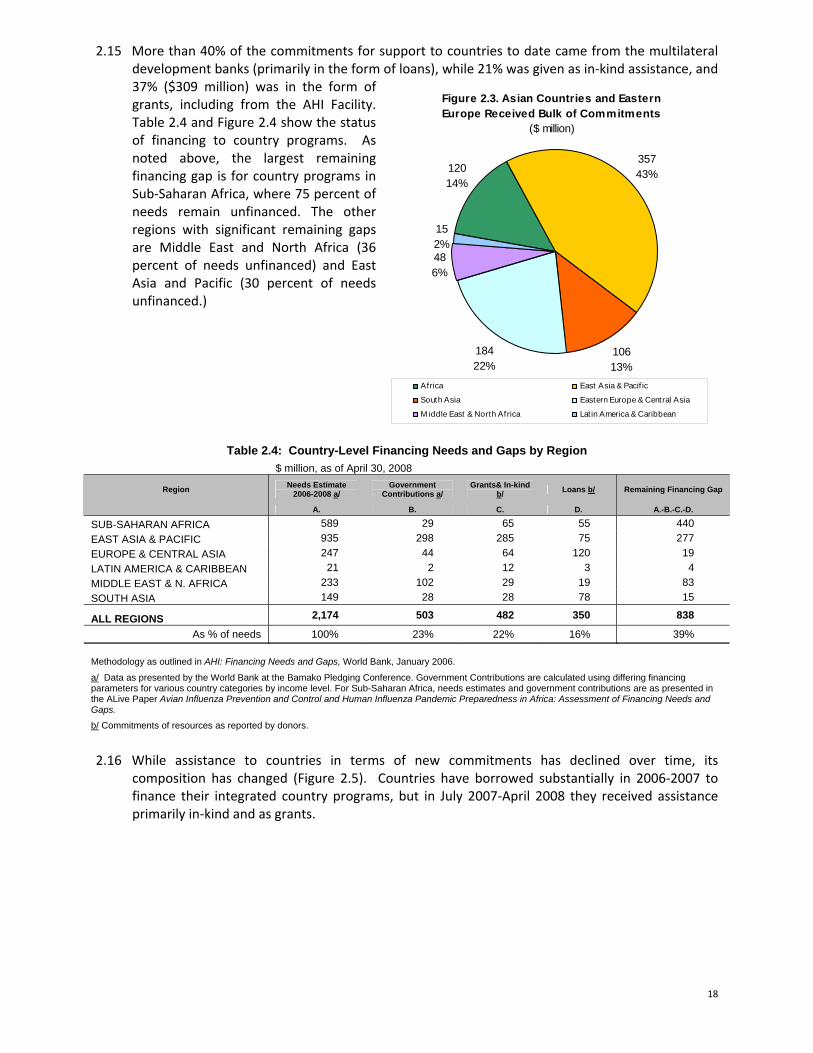
2.14 Figure 2.3 shows the regional distribution of support. Countries in East Asia and South Asia together received $466 million, or 56% of commitments to date; countries in Eastern Europe and Central Asia received $184 million, or 22 percent of total; and countries in Sub‐Saharan Africa and the Middle East and North Africa received $167 million, or 20% of total commitments. One way of assessing the flexibility of financial assistance to respond to emerging needs is by analyzing H5N1 outbreak data. This shows that the distribution of assistance among regions is not in line with needs as suggested by outbreak data. For example, 17 countries in Africa and the Middle East and North Africa have seen H5N1 outbreaks. In total they received only 20% of overall commitments, whereas the East Asia and Pacific region, with 13 outbreak countries, received 44% of total commitments. In addition, last year’s Global Progress Report showed that 58% of the financing gap for country programmes was due to needs in Africa, while 39% of the gap was for country programmes in Asia.
Table 2.2. Overview of AHI Commitments by Type of Recipient
Donors/Financiers Countries/ Territories
AHI Facility Regional
ProgrammesInternational Organizations
Other Total
Bilateral Donors 348 28 261 454 314 1,406European Commission 29 90 38 30 54 241Multilateral Develop. Banks 359 2 25 18 403Total 735 118 301 510 386 2,050 Share 36% 6% 15% 24% 19% 100%
Table 2.3: Countries and Territories Receiving $10 Million or More in Commitments ($ million)
Country/Territory Commitments DisbursementsIndonesia 128 90Vietnam 115 54Nigeria 58 38Turkey 46 18Romania 41 4India 37 5Cambodia 35 15Lao PDR 28 14Bangladesh 25 8Egypt 20 13Nepal 19 3Afghanistan 16 4West Bank & Gaza 13 4China 13 10Armenia 13 7Georgia 12 5Moldova 11 4 Thailand 11 11
18
Figure 2.3. Asian Countries and Eastern Europe Received Bulk of Commitments
($ million)
12014%
35743%
10613%
18422%
486%
152%
Africa East Asia & Pacif ic
South Asia Eastern Europe & Central Asia
M iddle East & North Africa Lat in America & Caribbean
2.15 More than 40% of the commitments for support to countries to date came from the multilateral development banks (primarily in the form of loans), while 21% was given as in‐kind assistance, and 37% ($309 million) was in the form of grants, including from the AHI Facility. Table 2.4 and Figure 2.4 show the status of financing to country programs. As noted above, the largest remaining financing gap is for country programs in Sub‐Saharan Africa, where 75 percent of needs remain unfinanced. The other regions with significant remaining gaps are Middle East and North Africa (36 percent of needs unfinanced) and East Asia and Pacific (30 percent of needs unfinanced.)
Table 2.4: Country-Level Financing Needs and Gaps by Region $ million, as of April 30, 2008
Region Needs Estimate 2006-2008 a/
Government Contributions a/
Grants& In-kind b/ Loans b/ Remaining Financing Gap
A. B. C. D. A.-B.-C.-D.
SUB-SAHARAN AFRICA 589 29 65 55 440 EAST ASIA & PACIFIC 935 298 285 75 277 EUROPE & CENTRAL ASIA 247 44 64 120 19 LATIN AMERICA & CARIBBEAN 21 2 12 3 -4 MIDDLE EAST & N. AFRICA 233 102 29 19 83 SOUTH ASIA 149 28 28 78 15
ALL REGIONS 2,174 503 482 350 838
As % of needs 100% 23% 22% 16% 39% Methodology as outlined in AHI: Financing Needs and Gaps, World Bank, January 2006.
a/ Data as presented by the World Bank at the Bamako Pledging Conference. Government Contributions are calculated using differing financing parameters for various country categories by income level. For Sub-Saharan Africa, needs estimates and government contributions are as presented in the ALive Paper Avian Influenza Prevention and Control and Human Influenza Pandemic Preparedness in Africa: Assessment of Financing Needs and Gaps.
b/ Commitments of resources as reported by donors.
2.16 While assistance to countries in terms of new commitments has declined over time, its
composition has changed (Figure 2.5). Countries have borrowed substantially in 2006‐2007 to finance their integrated country programs, but in July 2007‐April 2008 they received assistance primarily in‐kind and as grants.

19
Figure 2.5. Assistance to Countries Declines Despite Increase in In-Kind
Aid
0
50
100
150
200
250
300
350
Up to April'06
M ay-Oct. '06 Nov '06-June '07
Jul '07-Apr '08
R epo rt ing Period
$ m
illio
n, c
omm
itmen
ts
In Kind Grant Loans
Figure 2.4 Largest unfinanced gaps are for countries in Sub-Saharan Africa and East Asia and Pacific
0 100 200 300 400 500 600 700 800 900 1,000
SOUTH ASIA
M IDDLE EAST & N.AFRICA
LATIN AM ERICA &CARIBBEAN
EUROPE & CENTRALASIA
EAST ASIA & PACIFIC
SUB-SAHARAN AFRICA
US$ millions
Needs Available financing
2.17 Another financing source to support countries’
in implementing their Integrated National Action Plans is the Avian and Human Influenza (AHI) Facility, the multidonor financing facility conceived in January 2006 at the International Pledging Conference in Beijing. The AHI Facility was established five months later as a grant‐making mechanism administered by the World Bank and supported by trust funds to which nine donors presently contribute. Its specific goal is to help developing countries prepare and implement integrated country action plans that are designed to reduce the social and economic impact of avian influenza and minimize the possibility of an outbreak of a human influenza pandemic. Led by the European Commission, other donors include Australia, China, Estonia, Iceland, Korea, the Russian Federation, Slovenia, and the United Kingdom (see Table 2.5). As of end‐April 2008, the Facility has provided grants totaling $77 million to more than 40 countries (Annex III).
2.18 Beyond providing direct support to
countries, donors have also reported commitments of $475 million to support global, regional and country‐level actions through international agencies, of which $385 million has already been disbursed. As can be seen in Figure 2.2 above, there was a noticeable increase in the amount of funds received by international
agencies after the Bamako
Table 2.5. Confirmed Pledges to the AHI Facility
Donor Pledge Currency amount Approximate share
Australia A$ 10,500,000 7.89% China US$ 2,000,000 1.86% Estonia € 21,344 0.03% European Commission € 70,930,000 73.75% Iceland US$ 200,000 0.19% Korea US$ 1,000,000 0.93% Russian Federation US$ 3,000,000 2.79% Slovenia € 30,000 0.04% United Kingdom £ 7,000,000 12.54%

20
Figure 2.8. Disbursements by Sector (% of total disbursements reported)
24%
36%
14%
11%
15%
Animal Health, Biosecurity, Sustainable Livelihood
Human Health & Pandemic Preparedness
Information, Education & Communication
Support for Implementation Monitoring, Evaluation & Internal Coordination
Other
conference, but the recent growth in commitments has been significantly less. The amounts which donors report as giving to various international organizations are reported in Table 2.6.
2.19 In addition to reporting on financing for the beneficiary
countries and organizations, during this year’s polling exercise donors were also requested to indicate the specific sectors targeted for support. Figures 2.7 and 2.813 respectively provide an overview of the commitments and disbursements per sector. Of total sectoral commitments reported donor support for human health and pandemic preparedness (34%), and animal health activities (31%) were about equal; representing almost 2/3rd of total commitments. Information, education and communication activities, which represent a key element in the overall success of interventions in all sectors, represent only 12% of total commitments. Of total disbursements to each sector, disbursements were greatest for the human health and pandemic preparedness sectors.
Figure 2.7. Commitments by Sector (% of total commitments reported)
31%
12%
10%
13%
34%
Animal Health, Biosecurity, Sustainable Livelihood
Human Health & Pandemic Preparedness
Information, Education & Communication
Support for Implementation Monitoring, Evaluation & Internal Coordination
Other
13 The information reflected in these figures represents only a portion of total AHI sectoral spending, as not all donors reported this information.
Table 2.6. Commitments and Disbursements Received by International Organizations
($ million) Commitments Disbursements
WHO 183 148 FAO 123 105 OIE 36 30
UNICEF 70 68 Othera/ 98 70
Total 510 421 Souce: Donor reports to the World Bank polling exercise as of April 30, 2008 a/ See Annex V table 4a for details.

21
Analysis of International Systems for Support to Countries 2.20 This section of the report looks at the way international assistance has been provided to support
countries responding to avian and pandemic influenza. Due to the complex, global and urgent nature of the avian and pandemic influenza threats, special consideration was given to the institutional arrangements required for a coordinated, multi‐sectoral and integrated approach at the country, regional and global levels.
2.21 As indicated above, the unique nature of the pandemic avian influenza threat led the World Bank, the technical agencies (FAO, WHO, and OIE), and the UN System Influenza Coordinator to develop a flexible and responsive framework to channel financial and technical support at the country, regional and global levels. Therefore, in advance of the first Inter‐governmental Conference on Avian and Pandemic Influenza in Beijing in January 2006, two complementary papers were prepared. The AHI: Financing Needs and Gaps14 paper provided estimates of the possible costs of responding to avian and human influenza (AHI) at the country, regional and global levels over a three‐year period. The AHI: Multidonor Financing Framework15 outlined how these funds should be channeled.
2.22 At the New Delhi International Ministerial Conference, December 2007, it was proposed that a
new medium to long term strategy should be outlined and include potential implementation options. In anticipation of considering such a medium and long term approach (and almost three years after a framework was proposed at the Beijing Conference), it seemed timely to review the successes and challenges of the multidonor financing framework. Through numerous interviews, UNSIC staff collected and analyzed views of stakeholders involved in the response – national governments, international agencies, development banks, bilateral donors and NGOs – in five countries. The analysis below draws on the findings.
The Principles, Successes and Challenges of the Multi‐Donor Financing Framework
2.23 Three of the framework’s principles were used as a basis for examining the application of the framework. An analysis of challenges faced in adhering to these principles is presented below: .
Principle 1: The response should be adapted to each country based on country‐specific circumstances and be owned and led by a country’s national authorities.
2.24 It was envisaged that countries would develop integrated national action plans (INAP) for the
avian and pandemic influenza response. These would include “clear and common objectives across sectors, with associated results, outcomes and costs, to which all sectors can contribute.”16 A country’s INAP would serve as a basis for alignment and harmonization of activities carried out by various actors, against which commitments for support by the international community (or pooled funding mechanism such as the AHIF) could be made.
2.25 The analysis of challenges faced in applying this principle confirmed that:
14 World Bank: “Avian and Human Influenza: Financing Needs and Gaps.” (FNG) http://siteresources.worldbank.org/PROJECTS/Resources/40940‐1136754783560/AHIFinancingGAPSFINAL.pdf 15 World Bank: “Avian and Human Influenza: Multidonor Financing Framework.” (MDFF) http://siteresources.worldbank.org/PROJECTS/Resources/40940‐1136754783560/AHIFinancingFrameworkFINAL.pdf 16 FNG, p 3 “All countries, regardless of their level of risk, need to prepare integrated country plans for human and animal health as well as for other sectors engaged in the response for AHI. Country plans should identify clear and common objectives across sectors, with associated results, outcomes and costs, to which all sectors can contribute.”

22
• Political commitment of high‐level national authorities is crucial if the HPAI response is to be tailored to the reality of the country and nationally owned. This was particularly important with regard to multi‐sectoral planning and the coordinated engagement of external actors under national ownership.
• A well coordinated engagement by the international community and by national authorities is essential for efficient collaboration and repsonse. A successful country‐led response is powerfully influenced by synergized international efforts to support (and not supplant) both national coordination capacities and the management of implementation in the early stages. Country ownership is enhanced if funds are channeled directly to the country.
• International support should be well‐adapted to the national realities and presented in a way that is easy for the national authorities to absorb and utilize. Especially significant therein is the coordination among international agencies of messaging and technical advice to governments. If not adapted to the country context, implementation of activities using this support will be seriously delayed.
Principle 2: The response should be coordinated at all levels, both within sectors (such as animal health, human health, communications) and within institutions (the UN system, national authorities, amongst donors and amongst the wider international system).
2.26 Although the development of the INAP would be owned by the country, the international
community was expected to “provide critical advice and support”17 for assessments, preparation of the plan and appraisals of operations to assess their “financial, technical and economic soundness”18. Collective action was identified as a critical element of the response: “development finance partners must work together to meet the needs of these countries through integrated country programs…with strong inter‐ministerial cooperation and country‐led donor coordination.”19Country‐level coordination would involve national authorities, International technical agencies, multilateral development banks, bilateral donors and NGOs and ideally build upon existing coordination mechanisms.
2.27 The analysis confirmed that:
• Responses to avian influenza and effective pandemic preparedness have been most successful if there is an explicit multi‐sectoral response in‐country that engages the key national and international stakeholders from different organizational and technical backgrounds. The effort, from the start, to establish multi‐sectoral responses in‐country has sometimes taken several months but has turned out, in many countries, to be both innovative and creative, resulting in the formation of new concepts and networks that have influenced other cross‐sectoral action at country and regional levels. Multi‐sectoral interventions have improved coordination, both in terms of the range of stakeholders and quality of their interaction.
• The maintenance of joint working between established technical areas – in particular animal and human health sectors – requires continued efforts, and can be sustained through specific initiatives for joint training, joint surveillance and combined incident response.
• The quality of intersectoral coordination is best if the structures and systems for interaction between the key actors are established from the start, responsibilities are identified and (as
17 FNG: p 3 18 FNG, p 3 “Any AHI operation proposed must be subjected to a thorough and detailed appraisal process to assess its financial, technical and economic soundness before it is adopted.” 19 Multidonor Financing Framework p1: “Collective action is critical: Development finance partners must work together to meet the needs of these countries through integrated country programs that meet international standards and cover all necessary sectors and activities, with strong international cooperation and country‐led donor coordination.”

23
soon as possible) commitments are set out in an agreed action plan which includes both national authorities and international actors.
• In‐country working arrangements are frequently hampered by the practical problems caused by non‐alignment of procedures and financial regulations between UN system specialized agencies, funds and programmes.
2.28 The complementarity of the mandates of the UN and the World Bank enabled the organisations to cover different but related aspects of the response, which resulted in a good division of responsibilities and often synergetic collaboration (and as a consequence, this was given particular attention during the review).
2.29 Overall, the partnership of the UN and the World Bank in the area of AHI has been strong, and
their collaboration has been very productive. As UN system agencies, funds and programmes usually benefit from a significant in‐country presence, including relevant technical experts, it often has well established working relationships with the national authorities. In ideal cases, this enables the UN to have a sound knowledge of countries’ needs and capacities. Coupled with the World Bank’s expertise and institutional dimensions, the international community has made a positive substantial impact on the response.
2.30 However, the institutional mandate differences between the UN and the World Bank also lead to
challenges for the collaboration; analysis of the review concluded: • In some situations where recipient authorities decided to contract UN agencies to execute
activities funded from funds provided by the World Bank, differences in financial reporting, procurement regulations, and governance and anti‐corruption rules, as well as the recouperation of “overhead costs” by UN agencies were difficult to overcome and often lead to lengthy delays. These were exacerbated if, in the process, the World Bank reclassified the UN system body from being an implementing partner to an implementation contractor. Some of the most acute problems were temporarily solved through the granting of waivers by the World Bank to UN bodies. Significant efforts are underway to address these differences in financial, governance and anti‐corruption and procurement rules between the World Bank and UN agencies. Progress on this effort is noted in the following text box.
• The UN system serves as a technical advisor to, and an implementing partner of, many national governments. The World Bank often serves as their financing partner. These two entities are two key elements of the international system and yield the greatest benefits for national authorities when they work together, in synergy. When supporting national responses to the threats posed by avian and pandemic influenza the two parts of the system have generally worked very well together. However, as the country offices of both entities carry an ever increasing workload, the continued focus on avian influenza and joint meetings and planning may be hard to maintain. There is a vital need for continuing effort to ensure joint mechanisms for planning, implementation, monitoring and revision of country‐level activities.
24
Principle 3: Financial support should be flexible and expedient. 2.31 Flexible and responsive financing to cover shifting country, regional and global needs is a main
principle of the framework. The intention was to make best use of existing channels and allow donors the highest degree of flexibility, while enhancing the monitoring and coordination of the different existing funding flows. It was emphasized that the majority of the funds should go to country‐level activities, well‐balanced between short‐ and long‐term interventions. Monitoring and reporting was to be done by the World Bank through regular donor polling, tracking of commitments and expenditures of pledged amounts.
2.32 Analysis of the flexibility and expediency of financing revealed the following: • On the global scale, significant resources were mobilized, committed and disbursed for AHI
and Pandemic Preparedness activities, reflecting the commitment of the international system to respond to this threat. The International Ministerial Conferences proved to be an effective mechanism for bringing the issue of avian and pandemic influenza to the global attention, and to generate funding commitments.
• The limited availability of grant funding for countries – as opposed to loans and in‐kind assistance, or assistance channeled to regional or international organizations – has limited what can be achieved in‐country, as well as national ownership of activities. As of April 2008, nearly half the support received by countries was in the form of loans from multilateral development banks. More grant money is needed to meet the needs in particular of those countries with limited capacities and resources. In addition, unlike the flexible financing framework had set out, only 36% of total funds made available by the donor community was channeled directly to countries, most of this in the form of loans. Direct country support allows for greater country ownership of interventions.
• The flexibility of funds to respond to changing and newly emerging needs has been extremely limited. A significant proportion of funds has been earmarked for specific regions/countries or for the use of technical agencies. Additionally, a significant portion of the funds is short term
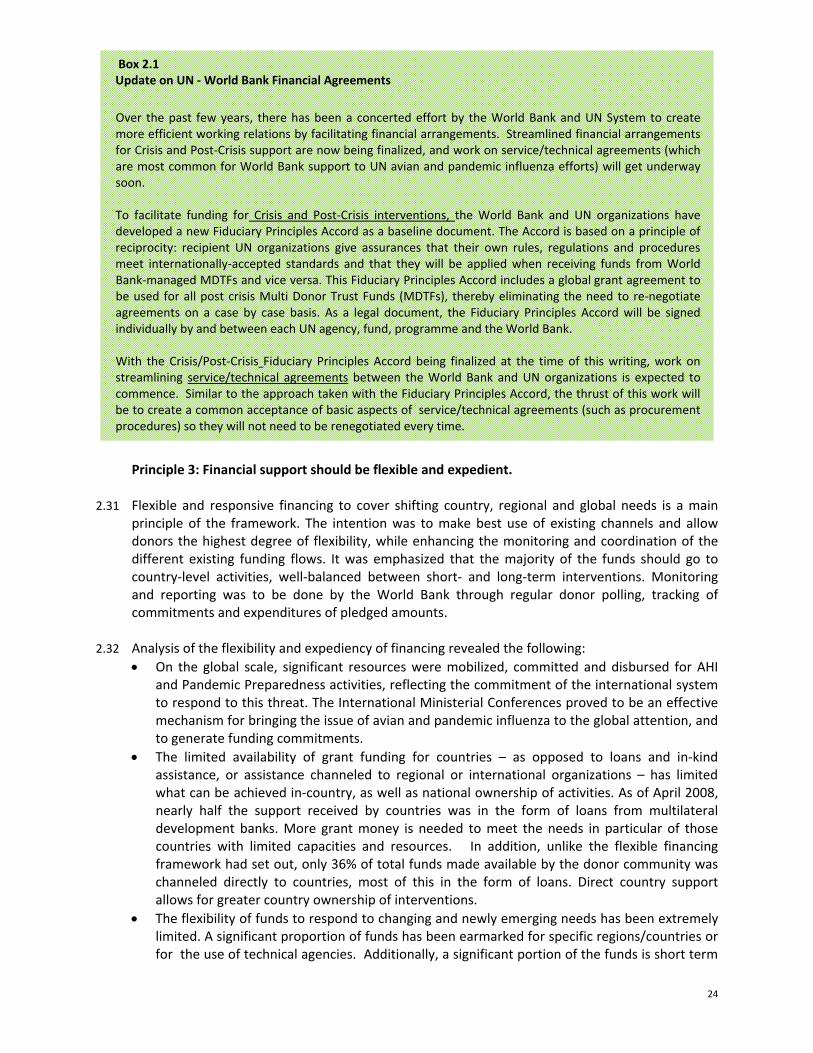
Box 2.1 Update on UN ‐ World Bank Financial Agreements Over the past few years, there has been a concerted effort by the World Bank and UN System to create more efficient working relations by facilitating financial arrangements. Streamlined financial arrangements for Crisis and Post‐Crisis support are now being finalized, and work on service/technical agreements (which are most common for World Bank support to UN avian and pandemic influenza efforts) will get underway soon. To facilitate funding for Crisis and Post‐Crisis interventions, the World Bank and UN organizations have developed a new Fiduciary Principles Accord as a baseline document. The Accord is based on a principle of reciprocity: recipient UN organizations give assurances that their own rules, regulations and procedures meet internationally‐accepted standards and that they will be applied when receiving funds from World Bank‐managed MDTFs and vice versa. This Fiduciary Principles Accord includes a global grant agreement to be used for all post crisis Multi Donor Trust Funds (MDTFs), thereby eliminating the need to re‐negotiate agreements on a case by case basis. As a legal document, the Fiduciary Principles Accord will be signed individually by and between each UN agency, fund, programme and the World Bank. With the Crisis/Post‐Crisis Fiduciary Principles Accord being finalized at the time of this writing, work on streamlining service/technical agreements between the World Bank and UN organizations is expected to commence. Similar to the approach taken with the Fiduciary Principles Accord, the thrust of this work will be to create a common acceptance of basic aspects of service/technical agreements (such as procurement procedures) so they will not need to be renegotiated every time.

25
in nature (due to conditions linked to emergency funding sources), even though many actions in the response require medium to longer term investments .
• Given the limited flexibility, national authorities have not always been able to direct funds to where most urgent needs have been identified. While the international partners agreed that national INAPs were the key platform to tackle avian flu and that significant resources should go to INAP‐related activites, only 40 percent of committed funds have been allocated in this way. Procedures and the requirements of different sources of funding should be designed to permit both expedient support for emergency operations and sustainable financing for the medium– to‐longer term.
Box 2.2: Yemen Country Case Study
Problem & Context. With 42% of the people living in poverty, Yemen is among the poorest countries in the world. Poultry meat currently represents 65% of total meat consumption, with 33% produced from backyard chickens. A disruption of the poultry industry may threaten the livelihood of hundreds of thousands of already impoverished livestock farmers in Yemen.
While there have not been any confirmed cases of HPAI in Yemen to date, the risk of H5N1 outbreaks remains high. There are major threats of infection from both legal and illegal overland entry, from the import of day‐old chicks, rearing of hobby birds, and generally weak poultry farm biosecurity. Such threats are all the more serious after Saudi Arabia and other countries in the region discovered HPAI outbreaks in their territory. In addition, Yemen is located directly under two migratory bird flyways.
Approach & Activities Undertaken. A national multi‐sectoral task force ‐ the National High Committee for Avian Influenza ‐ chaired by the Minister of Health was established in 2005, and preparedness planning addressing the most pressing needs was initiated. However, rapid avian influenza preparedness assessment for human and animal health, conducted with the assistance of the World Bank, the World Health Organization (WHO), the Food and Agriculture Organization (FAO) and the International Animal Health Organization (OIE), in collaboration with the Government of Yemen, indicated that the country's AI preparedness and response was being hampered by inadequate funding, and limited logistical and human resource capacities. The assessment recommended the formulation of a multi‐sectoral action plan with clear objectives, activities, outputs, costing, and deliverables to respond to potential avian influenza outbreaks.
Consequently, the AHI Facility awarded the Government of Yemen a Grant for US $57,260 to finance technical assistance. The aim was to ensure that a new Integrated National Action Plan for the Prevention and Control of Avian and Human Influenza under preparation will meet internationally accepted norms and capture the world‐wide experience with AI to date. The chief approach adopted for the Plan’s preparation was an emphasis on the multi‐sectoral nature of the issue, namely on the need for cooperation between the health, agricultural, education, finance, planning and law enforcement sectors, while also involving the private sector and underscoring the importance of communications and a public awareness campaign.
Results. The completion of the Integrated National Action Plan for the Prevention and Control of Avian and Human Influenza was followed by a dissemination workshop in March 2008, which was jointly organized by the Ministry of Health and Population and Ministry of Agriculture and Irrigation, and supported from the AHI Facility Grant. The purpose of the workshop was to facilitate a more active engagement of all relevant ministries, and secure a commitment to support and implement the Plan from responsible authorities. Additionally, the workshop aimed to identify key development partners and donors that could contribute – either financially or through technical assistance – to the implementation of the Plan.
Source: World Bank
26
35/36 27/28 23/24 39/4216/16
140/146
0%
20%
40%
60%
80%
100%
Africa Americas Asia Pacific ECA MENA Global
Existence of a National Action Plan Which Includes an Integrated Response to Avian and Human Influenza (Q5)
3. Capacity to Reduce the Threats of Avian Influenza to Animals and Humans 3.1 This section draws on data gathered from national authorities through the UNSIC global survey and on the
’Report Exercise on Highly Pathogenic Avian Influenza (HPAI)’, prepared by FAO as contribution to this Fourth Global Progress Report. Where this section refers to FAO’s assessment as opposed to the UNSIC global survey, it is the FAO report based exclusively on information and qualitative interpretation from FAO staff in national, regional and FAO headquarters offices focusing on 54 countries with FAO projects as opposed to views from national authorities provided in the UNSIC global survey. (Annex I for full list of the 54 countries).
Planning and Preparedness
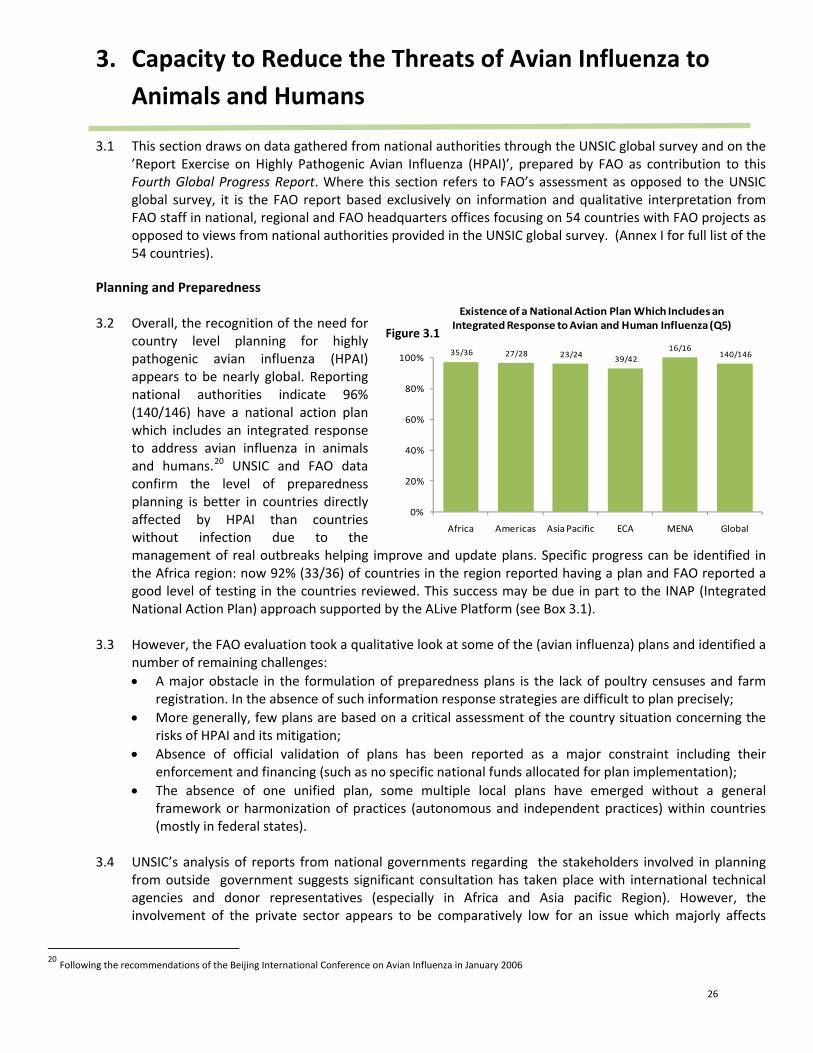
3.2 Overall, the recognition of the need for
country level planning for highly pathogenic avian influenza (HPAI) appears to be nearly global. Reporting national authorities indicate 96% (140/146) have a national action plan which includes an integrated response to address avian influenza in animals and humans.20 UNSIC and FAO data confirm the level of preparedness planning is better in countries directly affected by HPAI than countries without infection due to the management of real outbreaks helping improve and update plans. Specific progress can be identified in the Africa region: now 92% (33/36) of countries in the region reported having a plan and FAO reported a good level of testing in the countries reviewed. This success may be due in part to the INAP (Integrated National Action Plan) approach supported by the ALive Platform (see Box 3.1).
3.3 However, the FAO evaluation took a qualitative look at some of the (avian influenza) plans and identified a
number of remaining challenges: • A major obstacle in the formulation of preparedness plans is the lack of poultry censuses and farm
registration. In the absence of such information response strategies are difficult to plan precisely; • More generally, few plans are based on a critical assessment of the country situation concerning the
risks of HPAI and its mitigation; • Absence of official validation of plans has been reported as a major constraint including their
enforcement and financing (such as no specific national funds allocated for plan implementation); • The absence of one unified plan, some multiple local plans have emerged without a general
framework or harmonization of practices (autonomous and independent practices) within countries (mostly in federal states).
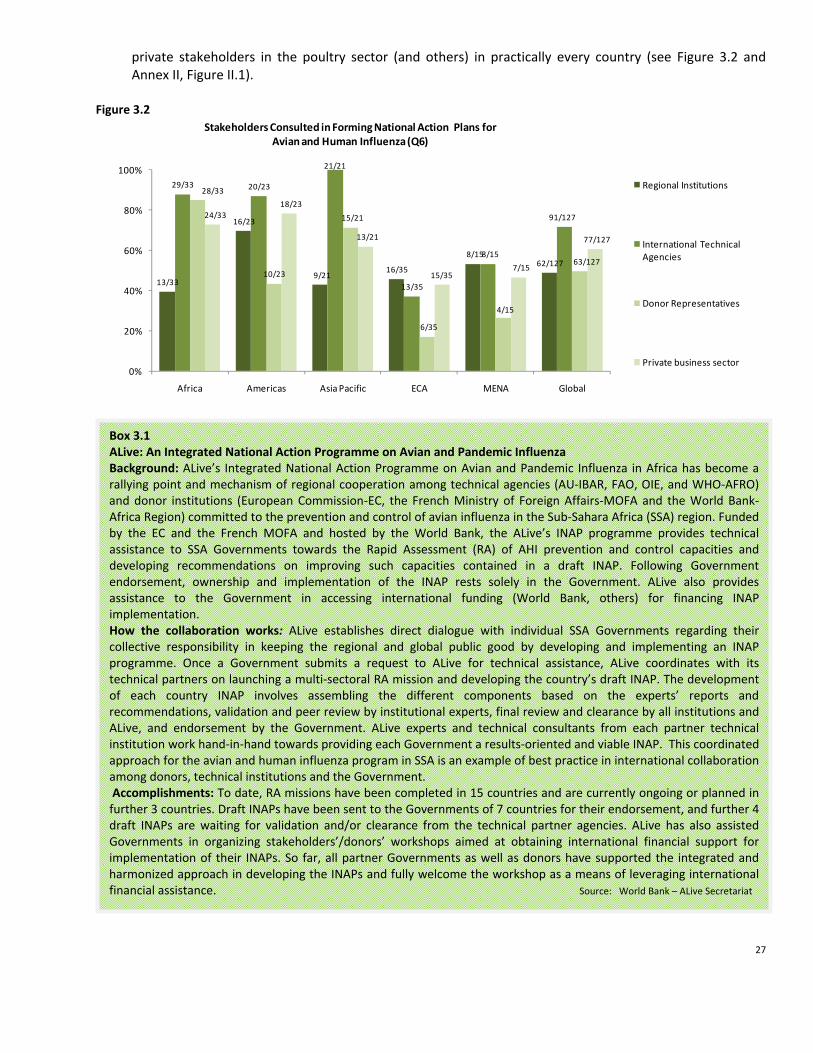
3.4 UNSIC’s analysis of reports from national governments regarding the stakeholders involved in planning
from outside government suggests significant consultation has taken place with international technical agencies and donor representatives (especially in Africa and Asia pacific Region). However, the involvement of the private sector appears to be comparatively low for an issue which majorly affects
20 Following the recommendations of the Beijing International Conference on Avian Influenza in January 2006
Figure 3.1
27
private stakeholders in the poultry sector (and others) in practically every country (see Figure 3.2 and Annex II, Figure II.1).
Figure 3.2
13/33
16/23
9/21 16/35
8/1562/127
29/33 20/23
21/21
13/35
8/15
91/127
28/33
10/23
15/21
6/35
4/15
63/127
24/3318/23
13/21
15/357/15
77/127
0%
20%
40%
60%
80%
100%
Africa Americas Asia Pacific ECA MENA Global
Stakeholders Consulted in Forming National Action Plans for Avian and Human Influenza (Q6)
Regional Institutions
International Technical Agencies
Donor Representatives
Private business sector
Box 3.1 ALive: An Integrated National Action Programme on Avian and Pandemic Influenza Background: ALive’s Integrated National Action Programme on Avian and Pandemic Influenza in Africa has become a rallying point and mechanism of regional cooperation among technical agencies (AU‐IBAR, FAO, OIE, and WHO‐AFRO) and donor institutions (European Commission‐EC, the French Ministry of Foreign Affairs‐MOFA and the World Bank‐Africa Region) committed to the prevention and control of avian influenza in the Sub‐Sahara Africa (SSA) region. Funded by the EC and the French MOFA and hosted by the World Bank, the ALive’s INAP programme provides technical assistance to SSA Governments towards the Rapid Assessment (RA) of AHI prevention and control capacities and developing recommendations on improving such capacities contained in a draft INAP. Following Government endorsement, ownership and implementation of the INAP rests solely in the Government. ALive also provides assistance to the Government in accessing international funding (World Bank, others) for financing INAP implementation. How the collaboration works: ALive establishes direct dialogue with individual SSA Governments regarding their collective responsibility in keeping the regional and global public good by developing and implementing an INAP programme. Once a Government submits a request to ALive for technical assistance, ALive coordinates with its technical partners on launching a multi‐sectoral RA mission and developing the country’s draft INAP. The development of each country INAP involves assembling the different components based on the experts’ reports and recommendations, validation and peer review by institutional experts, final review and clearance by all institutions and ALive, and endorsement by the Government. ALive experts and technical consultants from each partner technical institution work hand‐in‐hand towards providing each Government a results‐oriented and viable INAP. This coordinated approach for the avian and human influenza program in SSA is an example of best practice in international collaboration among donors, technical institutions and the Government. Accomplishments: To date, RA missions have been completed in 15 countries and are currently ongoing or planned in further 3 countries. Draft INAPs have been sent to the Governments of 7 countries for their endorsement, and further 4 draft INAPs are waiting for validation and/or clearance from the technical partner agencies. ALive has also assisted Governments in organizing stakeholders’/donors’ workshops aimed at obtaining international financial support for implementation of their INAPs. So far, all partner Governments as well as donors have supported the integrated and harmonized approach in developing the INAPs and fully welcome the workshop as a means of leveraging international financial assistance. Source: World Bank – ALive Secretariat

28
Animal Health Services 3.5 Since the last report, OIE has continued to develop and conduct assessments with the Evaluation of
Performances of Veterinary Services tool (OIE‐PVS). This tool enables a strategic approach for improving animal health services via identifying current levels of performance, agreeing a vision with the private sector, establishing priorities and planning strategically for their implementation. As of August 31 2008, 84 missions have been requested and 65 have been completed (for table of PVS missions’ status see Annex I table 3).21 OIE’s analysis of the PVS assessment’s findings reaffirm the main challenges for compliance with international standards that were highlighted in last year’s report, overall:
i) Legislation and regulations related to animal disease prevention and control are very often outdated,
incomplete, obsolete or even non‐existent in some cases. This undermines any programme directed towards early detection and rapid response mechanisms;
ii) Public‐Private partnerships are often still in their infancy, if not non‐existent. Complementarities and synergies between official veterinarians, private practitioners and farmers represent a field of improvement to improve implementation of early detection and rapid response;
iii) Sustainable operational public and private budgets for Veterinary Services are insufficient and very far below the pro rata contribution of animal farming activities to the national GDPs or inadequate when compared to the livestock population of the country;
iv) Staff resources and staff education and training (initial training as well as continuing education) are a source of concern in almost every country evaluated. In some countries the length of initial veterinary education is less than 2 years (world standards being more or less 6 years);
v) Laboratory capacity is also weak, both at national and at regional (sub‐continental) level (see section 3.11 for further information on laboratory capacity).
Disease Surveillance, Identification and Response
Surveillance
3.6 Surveillance has been crucial for early detection of disease in humans and animals. Controlling the pathogens at the animal source is the key issue in the fight against zoonotic diseases, therefore animal cases should trigger immediate investigation to limit the risk of animal‐to‐human transmission.
21 As the next step, the OIE is also working, in close cooperation with FAO, the World Bank, the European Commission, USDA and other Donors, on a tool "Gap Analysis of PVS Outcomes: Evaluation of Needs and Priorities" for the preparation of investment programmes in developing countries.

29
Box 3.2 Mongolia: Innovative Commitment by an At‐Risk Country
Problem & Context. Mongolia’s small poultry industry has not seen outbreaks of HPAI. A few confirmed outbreaks have occurred in wild birds (other wild bird infections may have occurred but not been detected due to limited surveillance). However, Mongolia lies within the three major flyways where infection from the AHI Asian epicenters of China, Indonesia and Vietnam intersect with those of Western Europe. It also has over 40 large lakes. Other species such as canids, pigs, camels and horses, which are susceptible to influenza viruses, all have access to waterways frequented by wild birds. This and other cross‐country issues in terms of preventing transmission, exchanging information and ensuring coordination make Mongolia an important center for monitoring AHI’s global spread and demonstrate the central importance of an integrated disease response.
Approach & Activities Undertaken. In response to the threat posed by AHI, the Government is implementing a three‐year, National Strategy and Action Plan for Avian and Human Pandemic Influenza. Complemented by sector strategies for animal and human health, the National Strategy focuses on: improving outbreak and disaster response at the national and aimag (provincial levels), wild bird surveillance, animal and human health early warning and response systems, bio‐security measures for poultry production facilities and health facilities, and capacity strengthening in hospitals to enable better management of human influenza patients.
While project activities are only just beginning to get underway, a unique and promising activity is the effort to build an Incidence Response Information System (IRIS). This GIS based system will entail risk mapping to facilitate improved human and animal health and emergency response capabilities. It will permit mapping of critical considerations—presence of veterinarians, number of households, livestock numbers, health facilities, etc., that will provide immediate information for prevention and control efforts‐‐defining catchments, settings the boundaries for response efforts, etc. This will allow the National Emergency Management Agency (NEMA) to work jointly with medical and veterinary personnel to respond to any poultry outbreaks of HPAI or human cases of H5N1. While initially intended for use in HPAI control, it offers potential in combating other diseases and thus could serve as a cross‐sectoral platform for work on diseases at the animal‐human interface.
Results. A notable feature of activities so far has been the close collaboration between the government, World Bank and UN technical agencies. This has been true from the project inception mission and continues to date as all agencies have worked hard to collectively define the challenges and articulate solutions. The Ministry of Health works with WHO and the Ministry of Agriculture with FAO on animal health concerns. NEMA undertakes overall coordination, particularly on monitoring and evaluation. These partnerships have helped overcome the usual sectoral boundaries and have led to an unusually high degree of collaboration across sectors and agencies in the formulation of a pandemic influenza preparedness and response plan.
Next Steps & Remaining Challenges. Mongolia’s sparse population comprising a herder culture and society sets it apart from most other countries in the SE Asia. The methodology being adopted by the project, however, has clear applications for other herder societies where animal human interaction is commonplace and where zoonotic diseases could have profound impacts on the lives and livelihoods and economy of the country. Thus, there are potential benefits from a more comprehensive, integrated animal and human health surveillance and disease response.
Source: World Bank

30
0 4/96
6/43
26/96
38/43
66/96
0%
20%
40%
60%
80%
100%
Infected Non‐Infected
Existence Of An Animal Disease Surveillance System Capable Of Detecting HPAI By Infected/ Non‐Infected Countries [Q9]
No System planned but not yet operational Yes
Figure 3.4
Figure 3.3
1/35 1/24 1/25 0
1/15 4/140
12/35
4/24 4/259/41
2/15
31/140
22/35
19/24 20/25 32/41 12/15
105/140
18/35
15/24
18/25
33/41 11/14
95/139
0%
20%
40%
60%
80%
100%
Africa Americas Asia Pacific ECA MENA Global
Existence of an Animal Disease Surveillance System Capable of Detecting HPAI and Risk Assessment (Q9 and Q 10)
No Surveillance System Exists to Detect HPAI
Surveillance System Planned but Not Yet Operational
Surveillance System Exists to Detect HPAI and Has Been Made Operational
Surveillance System Exists and Risk Assessment has Been Conducted to Identify Special Areas Needing Increased Surveillance
3.7 UNSIC data obtained from national authorities indicate 75% (105/140) of countries report having surveillance system which is operational and capable of detecting highly pathogenic avian influenza (see Figure 3.3). Analysis of countries by infected/ non‐infected status shows that all countries directly affected by HPAI infection (43 responding) report having a surveillance system, of which 6 are not yet operational. Non‐infected countries report a higher proportionate absence of an operational system (see Figure 3.4)
3.8 Reports from national authorities to UNSIC indicate that 68% (95/139) countries have also conducted a risk assessment (see Figure 3.3). However, FAO’s more detailed evaluation concluded that very few countries have a surveillance plan that is based on an ‘elaborated’ risk‐analysis. Therefore at‐risk species, production systems, areas or borders cannot be precisely prioritized. In addition, FAO’s detailed examination of national surveillance plans, based on an examination of 54 countries suggests that most countries do not have a well‐defined surveillance plan that combines passive and active surveillance (active surveillance is rarely implemented) and targets both domestic poultry and wild life populations.
3.9 During the last 6‐12 months examples of progress have been identified in strengthening these systems through training of personnel, availability of equipment and experience of dealing with previous outbreaks which has reinforced the need for capable systems to be put in place.
3.10 Despite the importance of targeted wildlife surveillance, relatively few countries are currently
implementing activities due to financial, technical, or human resource and expertise limitations. Wildlife surveillance is primarily carried out at the regional and global level by international organizations and

31
NGOs, guided by predictive species risk tools and spatially oriented to include the most important migratory flyway, breeding habitats, or stop‐over sites.22
Laboratory Capacity For The Detection Of HPAI In Animals 3.11 Reports from national authorities suggest that around 70% (102/144) of countries are reporting adequate
laboratory access in country for detecting HPAI in animals– although the quality and availability of this access has not been assessed (see Figure 3.5). Many countries within Africa and the Americas report remaining reliant on regional and international access. Globally, these figures show consistent levels to 2007 reports. Considering the availability of the resources at international level, a surprising number of respondees reported no access nationally or regionally. One reason for this may be due to shipping and handling issues (discussed below). National capacities seem more developed in countries with experience of H5N1 infection where significantly higher proportionate levels of access to laboratory capacity within the country are reported than from non‐infected countries (see Figure 3.6).
22 To date, no wildlife reservoir for HPAI H5N1 virus has been identified despite 72% of all countries reporting outbreaks (61 in total since 2003) confirming that wild birds have been involved. This demonstrates that wild bird species are being exposed to HPAI H5N1 virus either through contact with poultry, other wild birds, or environmental sources of virus, and after exposure, they are susceptible to this strain of virus.
Box 3.3 Lao PDR: Frontline Early Detection of Infected Backyard Poultry by Alert Locals The how an outbreak is detected is as important as the what. In Lao PDR in February 2008, an early detection of an outbreak in backyard poultry was notified by a village veterinary worker (VVW) who had been trained only 3 weeks prior by mechanisms provided by FAO, CARE and the National Animal Health Center. As the first case detected in backyard poultry as opposed to commercial farms in Lao PDR, the importance of community‐based initiatives were critical in the early detection and triggering of rapid control measures. Establishing an animal disease reporting network down to the village level was deemed critical in Lao PDR for early detection and notification of outbreaks. Training of VVW commenced in 2006 for livestock teams covering all provinces, and included basic avian influenza knowledge and teaching methods. The initiative continued to expand in 2007 (training 1,645 people) and 2008 (over 2,600 trained by June), and a national hotline was established. Empowered with training, knowledge and the skill to detect the signs and differential diagnosis of poultry diseases, VVWs have served as key persons to address the challenges at surveillance in backyard poultry systems.
Source: FAO/ UNICEF LAO PDR

32
1/45
15/98
40/45
61/98
4/45
22/98
0%
20%
40%
60%
80%
100%
Infected Non‐Infected
Access To Laboratory Facilities With HPAI Diagnostic Capacity By Infected/ Non‐Infected Countries [Q7]
Access is not adequate
Adequate access within the country
Adequate access at the regional or international levels only
Figure 3.6
Figure 3.5
3/36
7/25
4/26
2/42 0
16/144
10/36 7/25
3/26 5/421/15
26/144
23/36
11/25
19/26
35/42
14/15
102/144
0%
10%
20%
30%
40%
50%
60%
70%
80%
90%
100%
Africa Americas Asia Pacific ECA MENA Global
Access to Laboratory Facilities with HPAI Diagnostic Capacity for Animals (Q7)
Access not Adequate
Access Adequate at Regional or International Levels Only
Access Adequate Within Country
3.12 Specific progress has been identified in the widespread availability of access to laboratories at the country level and agreements in place with international laboratories (such as Padova in Italy, Weybridge ‐ England and Geelong ‐ Australia). In addition, further provision during the past 12 months of trained personnel, equipment and experience of dealing with previous outbreaks has been identified. Challenges with animal health laboratory capacity, both at national and at regional (sub‐continental) level, are not only due to a lack of adequate equipment; but also a management, personnel training and budgetary issue. The procurement of modern equipment, often not adapted to local conditions (such as no water or no electricity), is rarely enough. The condition of collection and shipment of biological samples to the laboratories is also a limiting factor. This works against early detection and confirmation of animal diseases with large inconsistencies in the technical aspects of shipping samples around the world. Countries experience financial and technical difficulties in being able to ship samples safely to reference laboratories. An effective mechanism for promptly shipping samples to international reference laboratories is essential for rapid diagnosis and continuous surveillance of circulating virus strains. The problem is how to build a true national veterinary scientific community for a long term approach. 23 24
23 ‘Ensuring efficient transport of Infectious Substances’ Meeting, Geneva ‐ December 2007 under the Auspices of WHO, with the support of OIE and FAO 24 The OIE is now engaged in a programme of OIE Certified Laboratory Twinning Projects with the financial support of several Donors. The concept of such twinnings aims at encouraging direct and flexible transfer of know‐how between OIE Reference laboratories and possible/potential new reference laboratories. FAO has created about 2 years ago an e‐mail account (empres‐shipping‐[email protected]) to which any request can be sent if any need for shipment. FAO organizes many training of national laboratory staff on international shipment as part of the global training provided for HPAI. It can be through regional workshops (for instance, for western and central Africa, 3 workshops ‐ 40 persons as a total ‐ have been carried over the period 2007‐2008 ;) and twinning programs at the FAO/OIE reference laboratory in Padova (IZSV).
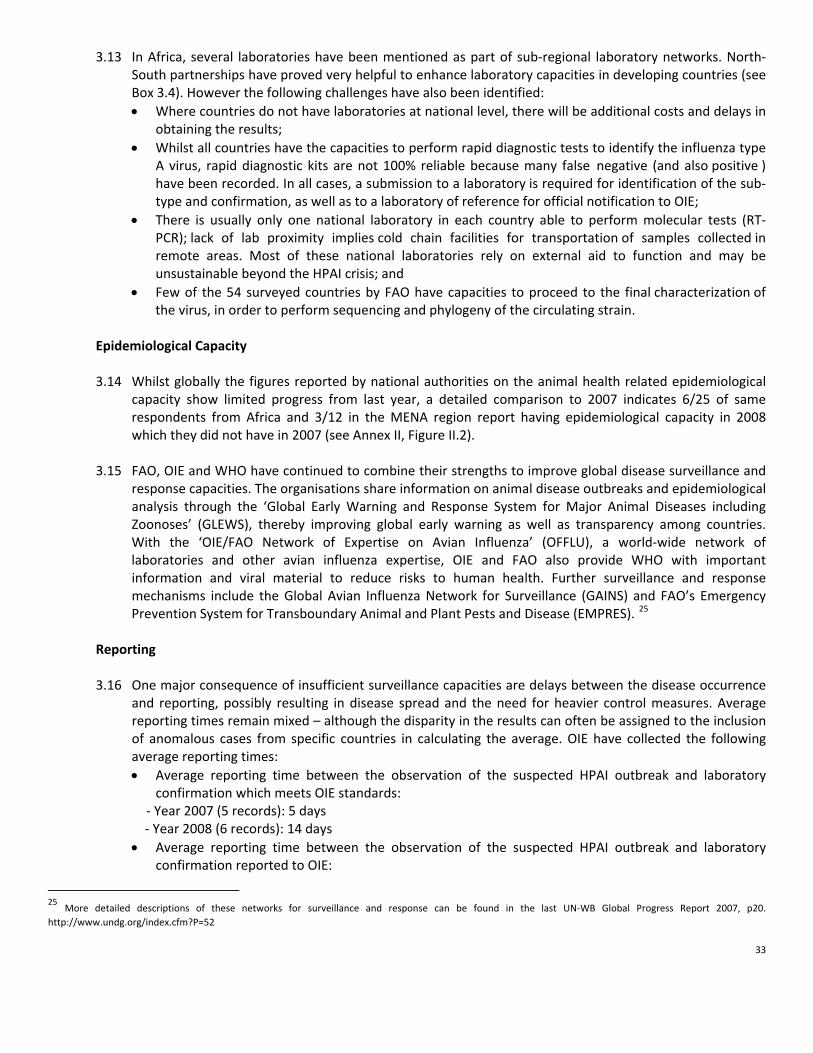
33
3.13 In Africa, several laboratories have been mentioned as part of sub‐regional laboratory networks. North‐South partnerships have proved very helpful to enhance laboratory capacities in developing countries (see Box 3.4). However the following challenges have also been identified: • Where countries do not have laboratories at national level, there will be additional costs and delays in
obtaining the results; • Whilst all countries have the capacities to perform rapid diagnostic tests to identify the influenza type
A virus, rapid diagnostic kits are not 100% reliable because many false negative (and also positive ) have been recorded. In all cases, a submission to a laboratory is required for identification of the sub‐type and confirmation, as well as to a laboratory of reference for official notification to OIE;
• There is usually only one national laboratory in each country able to perform molecular tests (RT‐PCR); lack of lab proximity implies cold chain facilities for transportation of samples collected in remote areas. Most of these national laboratories rely on external aid to function and may be unsustainable beyond the HPAI crisis; and
• Few of the 54 surveyed countries by FAO have capacities to proceed to the final characterization of the virus, in order to perform sequencing and phylogeny of the circulating strain.
Epidemiological Capacity
3.14 Whilst globally the figures reported by national authorities on the animal health related epidemiological
capacity show limited progress from last year, a detailed comparison to 2007 indicates 6/25 of same respondents from Africa and 3/12 in the MENA region report having epidemiological capacity in 2008 which they did not have in 2007 (see Annex II, Figure II.2).
3.15 FAO, OIE and WHO have continued to combine their strengths to improve global disease surveillance and response capacities. The organisations share information on animal disease outbreaks and epidemiological analysis through the ‘Global Early Warning and Response System for Major Animal Diseases including Zoonoses’ (GLEWS), thereby improving global early warning as well as transparency among countries. With the ‘OIE/FAO Network of Expertise on Avian Influenza’ (OFFLU), a world‐wide network of laboratories and other avian influenza expertise, OIE and FAO also provide WHO with important information and viral material to reduce risks to human health. Further surveillance and response mechanisms include the Global Avian Influenza Network for Surveillance (GAINS) and FAO’s Emergency Prevention System for Transboundary Animal and Plant Pests and Disease (EMPRES). 25
Reporting 3.16 One major consequence of insufficient surveillance capacities are delays between the disease occurrence
and reporting, possibly resulting in disease spread and the need for heavier control measures. Average reporting times remain mixed – although the disparity in the results can often be assigned to the inclusion of anomalous cases from specific countries in calculating the average. OIE have collected the following average reporting times: • Average reporting time between the observation of the suspected HPAI outbreak and laboratory
confirmation which meets OIE standards: ‐ Year 2007 (5 records): 5 days ‐ Year 2008 (6 records): 14 days • Average reporting time between the observation of the suspected HPAI outbreak and laboratory
confirmation reported to OIE:
25 More detailed descriptions of these networks for surveillance and response can be found in the last UN‐WB Global Progress Report 2007, p20. http://www.undg.org/index.cfm?P=52

34
‐ Year 2007 (33 records): 9 days – however, if one record of one country reporting a delay of 85 days is eliminated, the average is 6 days
‐ Year 2008 (35 records): 24 days – however, if four records of one country reporting delays of 91 to 125 days are eliminated, the average is 12 days 26
3.17 The recent implementation of the internet‐based computer system, named WAHIS, for member’s on‐line
notification has improved the timing of early warning information availability27.
26 "Reference Laboratories" for the World Animal Health Information System – WAHIS 27 The OIE’s World Animal Health Information Database (WAHID) Interface provides access to all data held within OIE's World Animal Health Information System (WAHIS). A comprehensive range of information is available at “http://www.oie.int/wahid‐prod/public.php?page=home”, from: (i) Immediate notifications and follow‐up reports submitted by Member Countries in response to exceptional disease events occurring in these countries as well as follow‐up reports about these events; (ii) Six‐monthly reports describing the OIE‐listed disease situations in each country, and (iii) Annual reports providing further background information on animal health, on laboratory and vaccine production facilities, etc. Available information may be explored (i) by country (or group of countries), (ii) by disease, (iii) focusing on control measures, or (iv) comparing the animal health situation between two countries.

35
Box 3.4: A Comprehensive Multisectoral Response to HPAI Outbreaks Enables Wider Benefits and Greater Preparedness
Problem & Context. Avian and Human Influenza (AHI) has provided an opportunity for Nigeria’s veterinarians and their medical counterparts to work together and address the prevention and control of emerging and re‐emerging zoonotic diseases. AHI has also led the political leadership at the different tiers of government to view prevention and control of AHI as an issue of good governance. It has furthermore provided the country with an opportunity to improve it’s ailing medical and veterinary infrastructures.
Since the first confirmed HPAI outbreak in February 2006 in Kaduna State, the disease has been confirmed in 25 states and the Federal Capital Territory, involving 97 local government areas. The disease has predominantly been experienced in medium and large scale commercial farms. Outbreaks in backyard farms involving free‐range poultry occurred in only 5 states of the Federation. The outbreaks have had severe consequences on the economy and on livelihoods of both small and large scale producers in the country and the entire West African Sub‐region.
Approach & Activities Undertaken. The government, in collaboration with development partners adopted a multi‐sectoral, multi‐disciplinary approach because of the complex and zoonotic nature of the disease. Activities carried out include:
i. Strengthening HPAI control and containment plans through effective depopulation and decontamination. ii. Strengthening disease surveillance and diagnostic capacity through strengthening Pan‐African Controls of
Epizootics (PACE), National Animal Disease Surveillance System (NADIS) epidemiosurveillance network and upgrading regional and central Labs to BSL2 and BSL3.
iii. Strengthening veterinary quarantine services through the rehabilitation of strategically located quarantine stations and training of quarantine personnel and provision of facilities.
iv. Improving biosecurity in poultry production and trade through intense biosecurity training for all categories of farmers and development of livebird markets.
v. Developing a compensation mechanism that involves stakeholder participation.
Results. As a result of the various response activities, the disease was properly controlled and contained. No outbreaks were recorded from October 2007 to July 2008. In July 2008, two confirmed cases in Kano and Katsina states were recorded and promptly contained. In addition, two positive cases were encountered during targeted livebird markets surveillance in Gombe and Kebbi States. Ongoing challenges to the AHI response include controlling the movement of poultry and poultry products across the nation, maintenance of biosecurity in farms and livebird markets, confusion among the general population regarding the difference between AI and Newcastle disease, and a lack of appreciable behavioral change. The response to the threat of AHI has taught that prevention and control of AHI is a complex multi‐sectoral and multidisciplinary endeavor. Improving the veterinary infrastructure, capacity building, and behavior change are essential ingredients in the fight against AHI.
Next Steps & Remaining Challenges. The next steps involve developing a roadmap for a sustainable control and final eradication of AHI and developing a regional strategy for disease surveillance and laboratory networking.
Source: World Bank

36
Compensation Schemes & Assistance to those Economically and Socially Affected by HPAI
3.18 Responses to the UNSIC data gathering exercise show that around 68% (95/140) of responding countries report a compensation scheme in place for poultry owners whose birds have been culled for the control of HPAI. The data indicates a similar level to 2007 data (see Figure II.3, Annex II). Africa and the Americas are
Box 3.5 Participatory Disease Surveillance and Response in Indonesia: Strengthening Veterinary Services and Empowering Communities Participatory Disease Surveillance and Response (PDSR) is a disease surveillance and response system that combines quantitative epidemiology with a qualitative approach known as Participatory Epidemiology (PE). Participatory epidemiology is the collection of epidemiologic information using participatory approaches, such as those that are commonly employed in Participatory Rural Appraisal (PRA). Participatory disease searching and disease reporting contribute to a surveillance system which is sensitive and timely. It can result in a more representative surveillance system when appropriately applied as part of an overall surveillance program. Participatory disease searching and disease reporting provide an effective and logistically feasible means of improving the timeliness of outbreak detection, reporting, and response, as well as broadening the scope of surveillance to include neglected or marginalized livestock populations, such as village poultry and small‐scale poultry producers. Participatory disease response uses participatory principles to support a community‐based response to control HPAI. It also catalyses participatory planning in order for communities to organize themselves and mobilize their own resources to prevent the occurrence of HPAI in their villages. The first phase of the PDSR project emphasized the detection and control of HPAI by PDS and PDR teams primarily in sector 4 poultry at the household level. Lessons learned during the first project included: • the importance of strengthening the knowledge base and capacity at community level in order to better
understand the origin, prevention and control of poultry diseases (especially HPAI); • taking a village‐level approach to work with all poultry farmers, traders and community leaders within the village
(including sector 3) to promote effective and efficient disease prevention and control; • facilitating links with and capacity building of the veterinary services through PDSR activities; and • actively involving local government and human health services in PDSR activities as well as the overall HPAI Control
Programme. PDSR assists the overall effort towards disease management and as such forms an integral part of the national HPAI control strategy. The second phase of the PDSR project has expanded participatory activities to enable all key stakeholders, from local communities to district, provincial and central governments, to have a voice in HPAI prevention and control. The ongoing evolution of the PDSR programme is expected to culminate in a community‐based animal disease prevention and control programme that becomes an integral part of provincial and district livestock services and which is adequately funded through government budgeting. By May 2008, 2,112 PDSR officers have been trained and are working in 331 districts across 27 of Indonesia’s 33 provinces. From January 2006 to April 2008, PDSR officers had made a total of 166,524 surveillance visits, conducted 65,309 outbreak responses, and worked with over one million community members. The effectiveness of the PDSR system was demonstrated recently during the outbreak of HPAI in a village in North Sumatra province. On 4 August, PDSR officers were called to the village by a sub‐district official. They diagnosed HPAI on the basis of clinical signs and positive rapid test. Poultry in the village were culled and decontamination conducted. The PDSR officers informed the local government including human and animal health authorities. Human health surveillance officers performed an investigation in the village on 5 August and by 6 August suspect H5N1 human cases had been admitted to hospital. On this occasion, all suspect human cases were negative for infection with H5N1.
Source: FAO

37
1/43
42/93
42/43
51/93
0%
20%
40%
60%
80%
100%
Infected Non‐Infected
Availability Of Compensation For Owners Of Culled Poultry By Infected/ Non‐Infected Countries [Q13]
No Yes
Figure 3.8
still reporting a low number of schemes in place, as is to be expected due to resource constraints and/or no experience of HPAI outbreaks. Enactment of legislation and administrative procedures for compensation schemes also remain at similar levels to 2007 of around 60% globally. An analysis of infected by non‐infected countries showed a significantly higher number of schemes in place when there have been HPAI outbreaks (see Figure 3.8). Higher income countries also report a higher proportion of schemes in place. Figure 3.7
20/34
9/25
20/25
37/41
9/15
95/140
17/34
6/22
15/24
36/41
8/15
82/136
13/34
6/22
19/24
35/40
7/15
80/135
0%
20%
40%
60%
80%
100%
Africa Americas Asia Pacific ECA MENA Global
Implementation of Compensation Schemes for Poultry Owners Whose Birds Have Been Culled in controlling HPAI( Q 13, 14, 15)
Compensation Available
Legislation Enacted
Funds Have Been Allocated
3.19 FAO reports that compensation is now widely
implemented in the case of sanitary culling (from their assessment of 54 countries). Half of the countries they interviewed in total (and 73% of interviewed infected countries) have a well‐defined compensation strategy or scheme. Even in countries without experience of HPAI outbreaks, well‐defined compensation strategies are in place to encourage early reporting (and more easily accept culling measures when needed). Most countries have developed a specific HPAI compensation policy; however, in a few cases, countries have a general compensation policy applying for all animal diseases.
3.20 Compensation schemes are variable, but common features that have been reported across countries
include: • All backyard and small‐scale productions systems are compensated, while large‐scale commercial
farms may benefit in some cases; • The compensation rate is generally based on the market price of the culled animal (before the crisis),
at anywhere between 50 to 100%. However, FAO reports during the last six months the compensation rate has usually increased;
• 7 days is the usual targeted time for compensation payment; however, many countries have reported a compensation delay of several months which, of course, is not sustainable for farmers, especially at the small‐scale level or backyard farmers;

38
• Compensation funds usually come from the national budget (emergency funds dedicated to all types of emergency); however, in some countries, compensation is paid through external aid;
• In all countries, compensation is provided in cases of preventive culling (‘legitimate’ suspicion); suspicions are classified as positive results;
• Harmonized regional or sub‐regional compensation rates were not reported.
3.21 Reports from national authorities indicate a low number of countries globally (7% (10/131)) have implemented livelihood support schemes which include assistance for households affected by suspensions of poultry rearing practices, market shocks or movement controls. A number of schemes are however being planned (35/131). 24% (32/134) of responding countries have also conducted a livelihood impact assessment of their HPAI control measures either before or after an outbreak. No significant difference was reported between infected and non‐infected countries. Figure 3.9
8/31
1/23
7/23 13/39
6/15
35/131
0
3/23 3/233/39
1/15 10/131
9/33
2/24
7/24 10/39
5/15
32/134
0%
10%
20%
30%
40%
50%
60%
70%
80%
90%
100%
Africa Americas Asia Pacific ECA MENA Global
Livelihood Support Schemes (assistance for households affected by suspension of poultry rearing practices, market shock or movement controls) and Social/Economic Impact Assessments
of HPAI Control Measures (Q 18 and Q 19)
Livelihood Support Scheme Planned
Livelihood Support Scheme Implemented
Livelihoods/ social impact assessment of HPAI control measures conducted
Poultry Vaccination
3.22 Reports from national authorities globally indicate that vaccination, where it is applied, is predominantly used as part of outbreak control. Prohibition of vaccination is high in ECA (in line with commercial nature of majority of poultry) and there are low levels of preventative vaccination strategies globally 13% (18/138). A comparison of data with 2007 shows that a similar number of respondees reported ‘no strategy’ or ‘vaccination is prohibited’. For those countries that reported vaccination being widely used as many as 60% (32/51) do not monitor the protection levels achieved (see Figure 3.10).
Figure 3.10
2/32 2/243/25
8/42 3/14
18/138
15/32
8/2410/25
11/42
5/14 49/138
2/9 1/5
4/9 9/19
3/9 19/51
0%
20%
40%
60%
80%
100%
Africa Americas Asia Pacific ECA MENA Global
Types of Vaccination Strategies Employed and Monitoring of Protection Levels Achieved (Q 20 and Q 21)
Vaccination for Prevention
Vaccination for Outbreak Control
Mechanism is established to monitor protection levels achieved

39
7/35
1/24
4/25
0
3/15
15/139
28/25
23/24
21/25
40/40
12/15
124/139
0%
20%
40%
60%
80%
100%
Africa Americas Asia Pacific ECA MENA Global
Introduction of Biosecurity Standards
No biosecurity improvements made in ANY Sector
Biosecurity standards have been introduced (In ANY of the 4 sectors)
Figure 3.11
3.23 FAO reports that vaccination strategies are not always sufficiently well defined (in terms of duration of the
campaign, targeted vaccination coverage, targeted species, etc) and the exit vaccination strategy is rarely mentioned. The possibility that countries could face a deterioration of their epidemiological situation is rarely anticipated and therefore very few countries are prepared to quickly shift to a vaccination strategy should it be needed (having a vaccination strategy does not imply to ever use it). However, FAO’s assessment shows that in Africa and Central Asia countries where vaccination has already been implemented in the past, countries are well prepared with regard to vaccination.
3.24 It has become clear that use of properly formulated vaccines can play a valuable role in HPAI control, particularly if infection has become widespread in a country. The reasons why only few countries have opted for a vaccination strategy, which include: • no justification for the use of the vaccination (country free from the disease, very rare outbreaks,
control and eradication possible without vaccination); • the cost of large‐scale vaccination campaigns (while stamping out and compensation policies can also
be very costly); • the lack of well‐trained human resources; • the limited access to laboratory facilities to sero‐monitor the efficiency of the vaccination campaign;
and • logistical constraints (such as cold chain).
Biosecurity for Commercial and Household Poultry Production
3.25 Reports from national authorities indicate only 11% (15/139) of responding countries have made no improvements to increase biosecurity in any sector, the majority of those (14/15) were from non‐infected countries (see Figure II.5, Annex II).
3.26 Reports from national authorities indicate
around 83%(114/138) of responding countries have conducted a biosecurity assessment with most assessments being conducted in the commercial or industrial poultry production system. Africa and Asia Pacific report the lowest number of assessments taking place. Further analysis of this data also suggests that infected countries have an increased number of biosecurity assessments taking place.
3.27 In most countries the linkages between different production systems and types of bird are complex and vary from country to country. The more complex the market chain (i.e. the more steps and people involved) the harder it seems to be to control and eradicate H5N1 HPAI. As such, all stages in the chain should be taken into account when biosecurity measures are being devised and recommended. FAO report biosecurity levels are generally fair to good in larger scale commercial production systems, but poor in small scale and backyard production (measures largely non‐existent in all regions). In live‐bird markets, slaughter houses and processing facilities, biosecurity levels are also poor and very few countries actually implement biosecurity measures. In most cases, such measures are not regulatory and therefore not enforceable. Most of the commercial sector is implementing biosecurity measures on a voluntary basis but
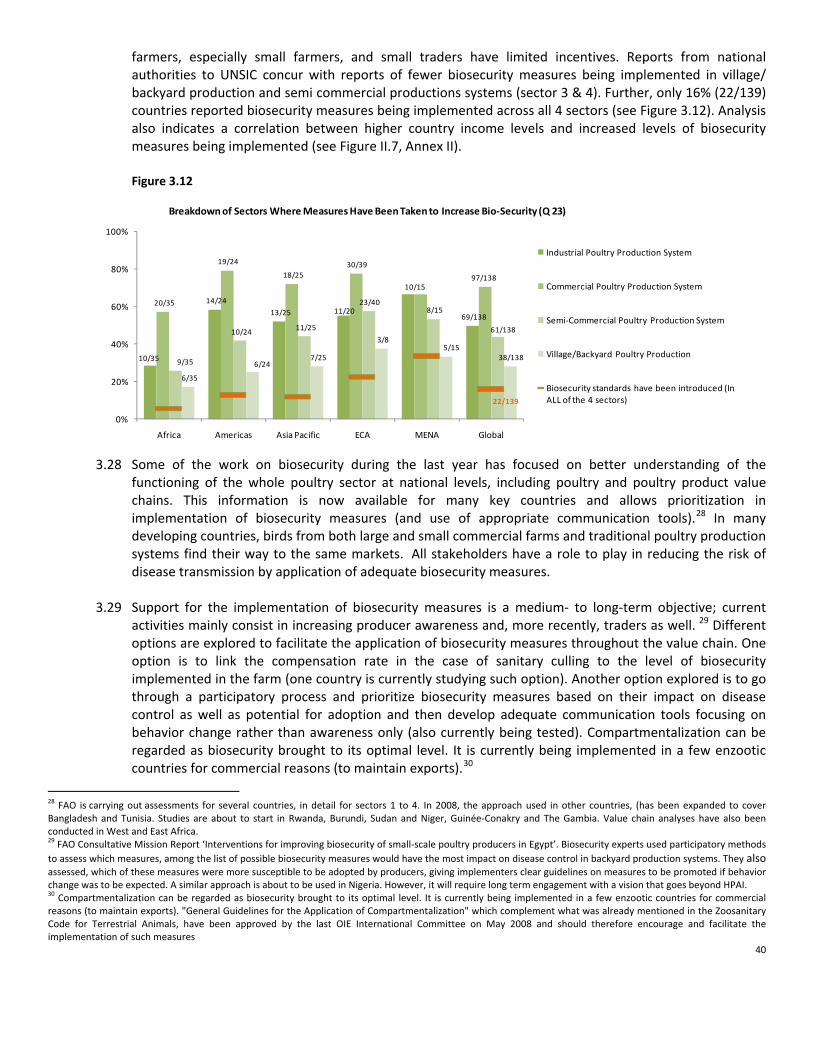
40
farmers, especially small farmers, and small traders have limited incentives. Reports from national authorities to UNSIC concur with reports of fewer biosecurity measures being implemented in village/ backyard production and semi commercial productions systems (sector 3 & 4). Further, only 16% (22/139) countries reported biosecurity measures being implemented across all 4 sectors (see Figure 3.12). Analysis also indicates a correlation between higher country income levels and increased levels of biosecurity measures being implemented (see Figure II.7, Annex II). Figure 3.12
10/35
14/24
13/25 11/20
10/15
69/138
20/35
19/24
18/25 30/39
97/138
9/35
10/24 11/25
23/408/15
61/138
6/35
6/24 7/25
3/8 5/15
38/138
22/139
0%
20%
40%
60%
80%
100%
Africa Americas Asia Pacific ECA MENA Global
Breakdown of Sectors Where Measures Have Been Taken to Increase Bio‐Security (Q 23)
Industrial Poultry Production System
Commercial Poultry Production System
Semi‐Commercial Poultry Production System
Village/Backyard Poultry Production
Biosecurity standards have been introduced (In ALL of the 4 sectors)
3.28 Some of the work on biosecurity during the last year has focused on better understanding of the
functioning of the whole poultry sector at national levels, including poultry and poultry product value chains. This information is now available for many key countries and allows prioritization in implementation of biosecurity measures (and use of appropriate communication tools).28 In many developing countries, birds from both large and small commercial farms and traditional poultry production systems find their way to the same markets. All stakeholders have a role to play in reducing the risk of disease transmission by application of adequate biosecurity measures.
3.29 Support for the implementation of biosecurity measures is a medium‐ to long‐term objective; current
activities mainly consist in increasing producer awareness and, more recently, traders as well. 29 Different options are explored to facilitate the application of biosecurity measures throughout the value chain. One option is to link the compensation rate in the case of sanitary culling to the level of biosecurity implemented in the farm (one country is currently studying such option). Another option explored is to go through a participatory process and prioritize biosecurity measures based on their impact on disease control as well as potential for adoption and then develop adequate communication tools focusing on behavior change rather than awareness only (also currently being tested). Compartmentalization can be regarded as biosecurity brought to its optimal level. It is currently being implemented in a few enzootic countries for commercial reasons (to maintain exports).30
28 FAO is carrying out assessments for several countries, in detail for sectors 1 to 4. In 2008, the approach used in other countries, (has been expanded to cover Bangladesh and Tunisia. Studies are about to start in Rwanda, Burundi, Sudan and Niger, Guinée‐Conakry and The Gambia. Value chain analyses have also been conducted in West and East Africa. 29 FAO Consultative Mission Report ‘Interventions for improving biosecurity of small‐scale poultry producers in Egypt’. Biosecurity experts used participatory methods to assess which measures, among the list of possible biosecurity measures would have the most impact on disease control in backyard production systems. They also assessed, which of these measures were more susceptible to be adopted by producers, giving implementers clear guidelines on measures to be promoted if behavior change was to be expected. A similar approach is about to be used in Nigeria. However, it will require long term engagement with a vision that goes beyond HPAI. 30 Compartmentalization can be regarded as biosecurity brought to its optimal level. It is currently being implemented in a few enzootic countries for commercial reasons (to maintain exports). "General Guidelines for the Application of Compartmentalization" which complement what was already mentioned in the Zoosanitary Code for Terrestrial Animals, have been approved by the last OIE International Committee on May 2008 and should therefore encourage and facilitate the implementation of such measures

41
Cross‐Border, Regional and International Collaboration on HPAI
3.30 Reports from national authorities indicate globally a high percentage of collaboration across borders takes
place ‐ 86% (126/146) of countries report some kind of cross‐border collaboration. However, only 52 of those 126 report participation in a sub‐regional strategy. These results are particularly low in Asia Pacific (5/25), however, a regional as opposed to sub‐regional strategy does exists amongst the countries of the Association of South East Asian Nations (ASEAN). An analysis by infected/ non‐infected countries indicates a higher proportion of collaboration across border by infected countries (see Figure II.8 Annex II). Figure 3.13
5/365/27
6/21
2/42
2/16 21/146
15/36
13/27
14/2525/42
7/16
74/146
16/36
8/27
5/25
16/427/16
52/146
0%
20%
40%
60%
80%
100%
Africa Americas Asia Pacific ECA MENA Global
Collaboration for Cross Border Prevention and Control of HPAI (Q26)
No Cross‐Border Collaboration
Some Cross‐Border Collaboration
Sub‐Regional Strategy for Collaboration
3.31 FAO concludes that regional or cross‐country coordination is generally insufficient. However, amongst the
23 Africa countries they assessed 87% of countries are involved in regional coordination. Interaction amongst those countries occurs mainly for epidemiological reasons (exchange of sanitary information between two neighboring countries) and commercial (purchase of vaccines). In Africa, the regional economic communities (SADC, ECOWAS, WAEMU) play a significant coordination role.

42
Collaboration between Animal and Human Health Sectors
3.32 Reports from national authorities indicate that 145/146 responding countries share information between
animal and human health sectors during outbreaks of HPAI. A formal mechanism is in place for this purpose and used in all cases for 56% of responding countries (82/146). An analysis of infected countries indicates that a higher percentage has a formal mechanism in place than non‐infected countries (see Figure II.9 Annex II).
3.33 With regard to areas of collaboration, the UNSIC data indicates ‘communications’ and ‘training’ have been
targeted the most, closely followed by joint outbreak investigations for collaborative working between the animal and human health sectors (see Figure 3.14). Considering the limited capacity in many countries, collaboration on laboratory services is surprisingly low.
Box 3.6 Cross‐border and Regional Cooperation on HPAI in Western Africa Following Ghana’s first HPAI H5N1 outbreaks, FAO organized a cross‐border meeting among Ghana and 4 of its neighboring countries (Ivory Coast, Benin, Togo and Burkina Faso) in Ghana, June 2007. The objectives of the meeting were to share experience and develop common approach and strategies on avian influenza surveillance, prevention and control, focusing on areas where transborder collaboration is instrumental. This kind of meeting was the first ever organized in Africa. Two follow‐up meetings were organized in Togo (December 2007) and in Ivory Coast (September 2008), with the support of FAO, USAID and the Regional Animal health Center of Bamako, and with an increased participation from countries of the sub‐region (western and central Africa). WAEMU and ECOWAS also attended the meetings. It therefore evolved from a cross‐border to a sub‐regional initiative. The following needs in the sub‐region and among the countries for better cross border collaboration were identified: • Improvement of communication and information exchange between countries in the sub‐region through regular
meetings among the Chief Veterinary Officers, and among authorities at the borders including timely notification of disease events to Directors of Veterinary Services of the neighboring countries;
• Share of technical and human resources along the borders (to join forces), in particular to implement efficient surveillance along the borders;
• Improvement of epidemio‐surveillance and laboratory sub‐regional networks within and between countries in the sub‐region; setting up of socio‐economic and communication networks;
• Design of policy on movement of poultry and poultry products within the sub‐region; • Improvement of biosecurity on poultry farms and safe poultry production and trade in the sub‐region; • Inventory of poultry production systems and mapping of the value chains, thus allowing risk evaluation in the
sub‐region; • Inventory of border control posts, equipment and allocated human resources; • Intensification of awareness creation and education of the citizens of the countries in the sub‐region; • Strengthening of collaboration between stakeholders, e.g. security agencies, Community‐based Organizations,
Farmer‐based Organizations, Non Governmental Organizations, etc; and • Use of legal sanitary certificates (trade, transhumance, etc...) from regional organizations. These needs have been translated into recommendations: One first concrete output of these meetings has been the elaboration of an international veterinary certificate template for ECOWAS countries, to ensure traceability of poultry products, to harmonized documents for easier veterinary controls at the borders and to ensure compliance with required sanitary standards. These templates have been issued in July 2008 by the Bamako RAHC and will be discussed during the forthcoming transborder meetings, before final endorsement by ECOWAS. Source: FAO Global Program on HPAI prevention and control Report, September 2008

43
Figure 3.15
23/32
14/25
23/2731/40 13/17 104/141
31/36
16/27
23/2437/42
12/12
119/141
0
20
40
60
80
100
Africa Americas Asia Pacific ECA MENA Global
A Comparison of National Communications Campaign s to Educate About Risks and Prevent Transmission to Humans
2007 to 2008 (Q 28)
Campaign Launched 2007 Campaign Launched 2008
Figure 3.14
29/36
17/26
21/25
26/43
3/4 103/144
18/36
10/2611/25
16/42
10/15
65/144
32/36
16/26
23/2538/43 7/8
122/144
18/36
16/26
23/25
26/42
7/8
97/144
0%
20%
40%
60%
80%
100%
Africa Americas Asia Pacific ECA MENA Global
Activities Where Collaboration Between Animal and Human Health Professionals Occurs (Q25)
Training
Laboratory Services
Communications
Investigations During Outbreaks
Countries reporting joint working in ALL 4 areas listed above
3.34 FAO finds that inter‐sector coordination exists in nearly all of 54 assessed countries, in a structured (stated
in regulatory texts) or informal manner. Coordination is carried out through a national avian and human influenza (AHI) body involving different ministries, and sometimes professional organisations (such as farmers associations) and non‐governmental organisations (NGOs). In the Asia Pacific Region, FAO, OIE and WHO have developed guidance for collaboration at country level to assist in achieving sustainable and functional collaboration between animal and human health sectors that is necessary to address challenges posed by endemic, emerging, and re‐emerging zoonotic diseases.31
3.35 From a qualitative assessment FAO also comments that coordination between animal and human health
sectors operates at an early stage when drafting the integrated preparedness plan, testing the plan (desktop or field simulation) and also sometimes when implementing responses (i.e. multi‐sectoral response teams comprising not only animal health officers but also human health specialists, communication specialists, ornithologists, etc.). However, the depth of the real collaboration at the country level is not always optimal. It is usually much stronger at the central than at the local level.
Communication to Prevent the Spread of HPAI and Reduce the Risk to Humans 3.36 Since the resurgence of HPAI H5N1
outbreaks since 2003, communication strategies have been used globally for: a) sensitizing and informing the
public at large about the threats posed by HPAI;
b) mobilizing civil society and empowering communities to engage in actions that could limit the spread of the infection and protect oneself; and
31 ‘A Guide to Establishing Animal & Human Health Collaboration at the Country Level’ January 2008. FAO, OIE and WHO

44
7/30
2/19
13/23
18/38 5/10
45/120
0
20
40
60
80
100
Africa Americas Asia Pacific
ECA MENA Global
Assessment of National Communications Campaign Conducted ( Q 29)
Figure 3.16
c) advocating with decision makers for better surveillance, response and compensation policies.
3.37 Figure 3.15 from the UNSIC data indicates that an increased number of campaigns communicating the risk of HPAI has been carried out in the past year. Most countries have implemented some kind of behavior change communication strategy to inform and educate the risk of HPAI (119/141), indicating the importance of communication is widely accepted. The Americas, which is still free of H5N1, understandably remains the region which is the least active in implementing communication campaigns.
3.38 The analysis of infected and non‐infected countries shows that the percentage of countries that have
carried out a communications campaign is higher in the infected than in non‐infected countries, which is to be expected. However, it is positive that also a high number of non‐infected countries has acknowledged the importance of communications for preventing the introduction and spread of the disease.
3.39 The importance of assessing communications
efforts has been stressed continuously to ensure that measures are actually achieving the desired impact, and to adapt the communications efforts if required. The proportion of countries which have evaluated the impact of their campaigns varies greatly per region (Figure 3.16) but on the whole, only a minority of countries have done so (45/120). These results are fairly consistent with the 2007 survey. Countries reported details of the impacts that have been measured. In decreasing order of recurrence, these are: knowledge of risk, behavior change, social demand for products, knowledge of signs and symptoms and mitigation measures.32
3.40 The results also indicate that the general public and commercial sectors have been the primary targets of
these campaigns, although village and backyard production has also been targeted to by communication campaigns to a high percent (see Figure 3.17). This data potentially indicates some neglecting of the semi‐commercial sector, as previously discussed all sectors in the chain have need to be taken into account with regard to adopting better biosecurity measures.
3.41 A UNICEF report on the assessment of communication initiatives for prevention and control of avian
influenza distinguishes between peoples’ awareness about avian influenza (referring to people’s knowledge about the existence of the disease), their knowledge about the diseases (referring to people’s ability to identify routes of transmission and forms of prevention) and the behaviors
32 Specific progress can be identified when comparing the same countries who responded to the UNISC survey between 2007 and 2008, in Asia Pacific 6 out of 19 same responding countries report now having assessed their communications campaign compared to no assessment last year, similar progress was reported by 2 out of 5 countries in the MENA region.

45
Figure 3.17
13/35
12/2511/25
24/42
11/15
71/142
28/35
18/25
20/25
31/42
12/15109/142
22/35
11/25
15/25
20/42
10/15
78/142
25/35
15/25
19/25
28/42
11/1598/142
33/35
12/25
23/25
30/42
11/15
109/142
0%
20%
40%
60%
80%
100%
Africa Americas Asia Pacific ECA MENA Global
Poultry Groups Targeted in Communications Strategy to Inform and Educate About HPAI Risks (Q 12)
Industrial Poultry Production System
Commercial Poultry Production System
Semi‐Commercial Poultry Production System
Village/Backyard Poultry Production
General Public
that people practice, compared to the four key behaviors defined by the concerned international organizations (UNICEF, WHO and FAO) in March 2006 (hand‐washing, cooking thoroughly, separating poultry ‐ new flocks, different species and from living quarters ‐ and reporting all suspected cases of avian influenza infection among poultry and humans). 33 While the report states that there is relative high awareness about avian influenza, the level of knowledge about the disease is generally low. In addition, the report refers to data suggesting that all of the four behaviors are rarely practiced in surveyed communities.
3.42 However, studies have found that in a short‐span of 18‐24 months communication campaigns have
contributed to significant increase in awareness, and that communication interventions have also been reported as being effective in increasing people’s knowledge about HPAI and its prevention. The report analyses that the increased knowledge does not always translate into significant behavior changes; this is in line with experience from other health communications that behavior change is a complex socio‐cultural‐economic phenomenon, and that information alone is important but not sufficient for fostering new behaviors. In HPAI communication, few behavioral changes were found post communication interventions, even when knowledge about prevention and transmission increased substantially.34 Looking into the behaviors in more detail, a few country studies found that communication activities have been seemingly effective in promoting hand washing and proper cooking of poultry products, contrasted by studies showing that no significant behavior changes were found in poultry production, changes in biosecurity and reporting of suspected HPAI cases as a result of communications interventions.35 However, where people have been actively participating as part of the communication and programme interventions, changes in behaviors around biosecurity and reporting of disease were observed (such as in Lao PDR, Egypt or Nigeria). Numerous obstacles and reasons why people do not practice the recommended behaviors exist, ranging from lack of economic means to a distrust of authorities and tolack of functioning surveillance systems. It is thus important to distinguish between obstacles that could be addressed through communication and those that need different and complementary interventions.36
33 Waisboird, S and UNICEF. Assessment of UNICEF supported communication initiatives for prevention and control of avian influenza. March 2008, p. 3 34 Waisbord report, March 2008, p. 8 35 Waisbord report, March 2008, p. 9 36 Waisbord report, March 2008, p. 11

46
Box 3.7 Egypt: Community‐Based Education Campaigns – Empowerment through Education Ranked 3rd in countries most affected by Avian Influenza (AI) and with approximately 91% of the human cases occurring in households with backyard poultry breeding, Egypt has addressed combating the AI threat through communication and education. The Egyptian Government coordinated a national communication plan with the Ministry of Agriculture (MOA) and the Ministry of Health and Population (MOHP) along with other national and international partners to “catch and contain” in the bird population before crossing into the human population. Besides a mass media public campaign, one of the main elements of the strategy is a community‐based education program through community health workers: The community‐based education program, implemented by the MOHP and UNICEF, reaches out to more than 4.8 million families in rural areas of the most‐affected and at‐risk governorates in Egypt. The 10 000 community health workers (Raedat Reefiat) and their 200 supervisors have been well trained and are supported through a tight monitoring and supervision system. The core of the program is a house‐to‐house education campaign facilitating the distribution of the key public health messages “Clean, Protect, Cover up your nose and mouth and report”. Using a package of educational materials that is specially tailored to affect general and relevant breeding practices, members of the families responsible for the poultry breeding learn about means to best protect themselves, and stop infection among birds or humans. Before the house visits commenced in January 2008, a baseline survey was conducted. By the end of June 2008, each of the targeted families had been visited at least 3 – 4 times, and marked improvements in all areas were revealed, thus meeting many of the target goals of: • Outreach education of the correct preventive knowledge of AI to at least 80% of the households visited; • At least 70% of the targeted families understand the importance of and practice the following 3 public health
practices: - Hand washing after handling poultry - Separate poultry from living areas - Keep children away from poultry
• Establish an MOHP institutionalized supervision system supporting AI containment program.
As figure 3.4.1 shows, there have been significant changes in the different breeding practices: for example, washing hand with soap after handling poultry improved from 56% compared to 36% at baseline. Those separating poultry from living areas increased from 64% at baseline to 74% at the fourth visit. Nationally, the percent of positive change for all the 14 measured practices was reported to be 36% after the 4th visit, showing substantive impact within only 6 months.
Figure 3.4.1 Observed and Reported Changes in Practices (Across 17 Governorates)
Source: Unicef

47
International Health Regulations ‘IHR (2005)’ Implementation, Monitoring and their Relation to HPAI
3.43 The IHR (2005), which came into force in June 2007 and which are binding on 194 member states, provide a regulatory framework to enable the sustainable development of a stronger global public health infrastructure. More particularly they aim to increase global preparedness and readiness in detecting, reporting and responding to public health threats arising from (emerging) infectious pathogens, and, as such the regulations are highly relevant for HPAI. At the core of the IHR (2005) is the obligation of States Parties to develop, strengthen and maintain the capacity to detect, assess, notify and report events in accordance with the IHR. States Parties are required to do so as soon as possible, but no later than five years from the entry into force for each State Party37: generally, countries that are States Parties to the Regulations have two years to assess their capacity and develop national action plans followed by three years to meet the requirements of the Regulations regarding their national surveillance and response systems as well as the requirements at designated airports, ports and certain ground crossings.38
3.44 One year after their entry into force, progress in meeting the IHR (2005) was evaluated by WHO through a
survey which was sent to all member states to assist them in assembling their annual State Party report. The preliminary outcomes of the survey as well as information submitted to the 61st World Health Assembly (WHA) show that some overall progress39 in implementation and in complying with IHR (2005) has been achieved at a global level but that many challenges remain to be addressed.
IHR Implementation Progress Reported at Global Level
3.45 To date, the IHR (2005) have been discussed in the context of the current H5N1 avian influenza crisis. They have also come into force in the context of international transport of drug‐resistant tuberculosis patients and the Marburg and Ebola outbreaks in 2006‐07. The following achievements have been identified: • Intense activity in the area of preparedness and response for avian and human pandemic influenza has
been used by WHO regional offices as an entry point to bolster implementation of the Regulations and to raise awareness further of the synergies between these activities and implementation of the Regulations;40
• Strengthening global partnership (or ‘strengthening/establishing IHR communications network’): Between March 2007 and June 2008, the number of member states that have established a National IHR Focal Point (NFP) has nearly doubled (2007: about half of the member states; 2008: 193 member states). As of June 2008, all but one member states have identified a National IHR Focal Point.41 All six WHO regions have designated a WHO Regional IHR Contact Point (RCP);42
• Developing IHR event communication: The IHR Secretariat has launched a restricted‐access Event Information Site (EIS) which provides a platform to share information between the NFP and RFP. Seventy‐five percent of the 144 member states who completed the State Party Survey report having access to the website;43
• Improving understanding about IHR obligations: 94 out of the 194 country offices, spread across the six regions, undertook and completed an online training on their (new) roles and responsibilities in
37 IHR (2005), Part II, Article 5, Para 1. 38 IHR (2005), Part II, Article 5, Para 1 and 2; Annex 1, Part A, Para 2. 39 Comparing the WHA 60th and 61st reports 40 World Health Assembly 61st, p.4, item 18 41 World Health Assembly 60th and IHR news (No.3) 42 World Health Assembly 61st 43 World Health Assembly 61st

48
relation to the implementation of the IHR (2005). A series of briefings and workshops have also been carried out in National IHR Focal Points in all six regions;44
• Monitoring of progress/Developing core capacity for surveillance and response: Each member state is expected to have conducted an assessment of their national capacity in satisfying the minimum standards set by the IHR (2005) within two years of entry into force of the Regulations. As of February 2008, 76 member states had evaluated their national capacity and are now in the process of drafting and implementing action plans to address their gaps;45
• Developing a network of experts: An IHR Roster of Experts has been formed and as of June 2008, 55 member states have/had proposed an expert;46
• Building public health capacities at designated international points of entry (PoE); • Evaluating/modifying current legal framework to enable implementation of IHR (2005): A majority of
countries have still not evaluated their legal framework in providing the legal basis for enforcing the IHR; and
• Participating in regional arrangements: 58% of the countries indicate that they have participated in regional arrangements.
3.46 In the past year, many activities have been directed towards building a solid ‘foundation’ which will
support the implementation of the IHR (2005) in the next years. Most progress has been achieved in developing a network of capable, committed and well‐informed experts and in strengthening communications mechanisms and partnerships between and across domestic, regional and international focal points. At least half of the countries have not yet undertaken a baseline assessment of their current public health capacity, identified their gaps or revised their legal framework.
44 World Health Assembly 61st. The IHR News (June 2008) reports that 258 certificates were delivered upon completion of IHR online briefing in 113 WHO country offices or areas. 45 World Health Assembly 61st 46 World Health Assembly 61st and IHR news (no.3)
Box 3.8 An Example of IHR Implementation Progress in the Asia‐Pacific Region In the Asia‐Pacific Region, the IHR (2005) are principally being implemented through the Asia Pacific Strategy for Emerging Diseases (APSED) launched by the WHO South East Asia Regional Office (SEARO) and the WHO Western Pacific Regional Office (WPRO). APSED is a regional initiative which provides a strategic framework and tool for assisting member states in the region in building essential domestic public health surveillance and response capacity for emerging infectious diseases (EID). A five‐year work plan was approved in 2006 by the Asia Pacific Technical Advisory Group (TAG) and it is expected that, by 2010, all member states in the region will have acquired the essential capacities. APSED is comprised of five programme areas of work: a. Surveillance and response b. Laboratory c. Infection control d. Zoonoses e. Risk communication
Source: APSED progress Report 2008
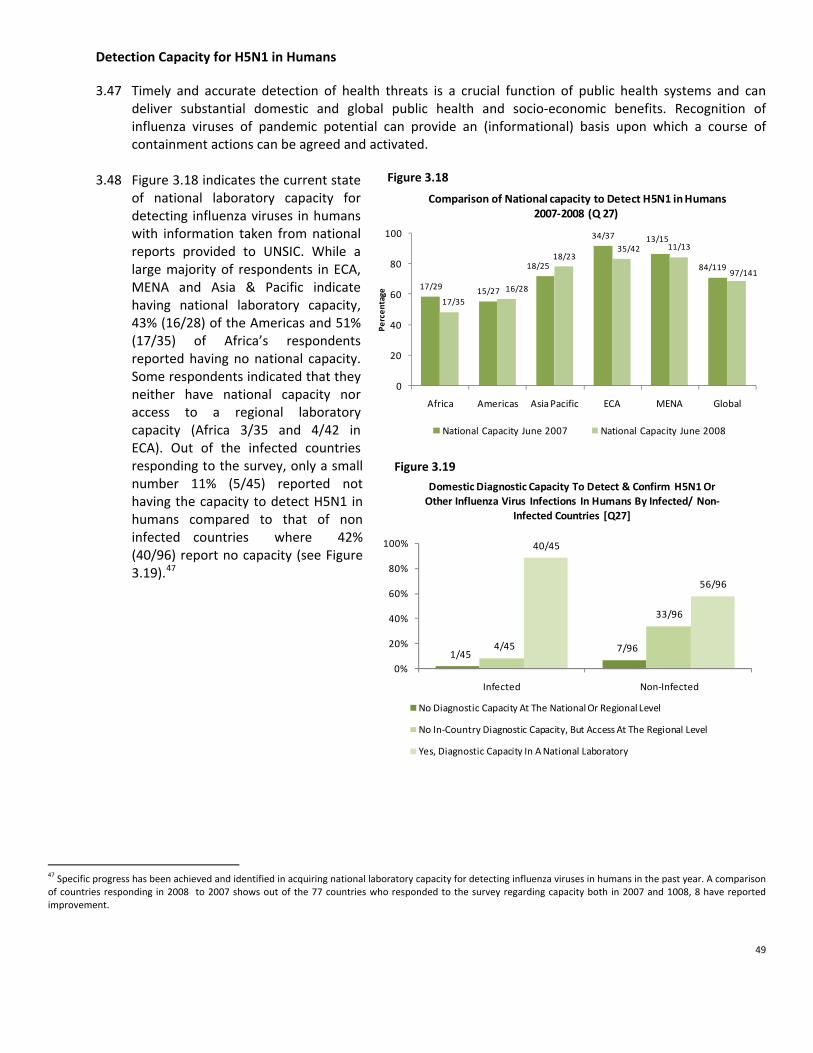
49
17/29 15/27
18/25
34/37 13/15
84/119
17/35
16/28
18/2335/42 11/13
97/141
0
20
40
60
80
100
Africa Americas Asia Pacific ECA MENA Global
Percen
tage
Comparison of National capacity to Detect H5N1 in Humans 2007‐2008 (Q 27)
National Capacity June 2007 National Capacity June 2008
1/457/964/45
33/96
40/45
56/96
0%
20%
40%
60%
80%
100%
Infected Non‐Infected
Domestic Diagnostic Capacity To Detect & Confirm H5N1 Or Other Influenza Virus Infections In Humans By Infected/ Non‐
Infected Countries [Q27]
No Diagnostic Capacity At The National Or Regional Level
No In‐Country Diagnostic Capacity, But Access At The Regional Level
Yes, Diagnostic Capacity In A National Laboratory
Figure 3.18
Figure 3.19
Detection Capacity for H5N1 in Humans
3.47 Timely and accurate detection of health threats is a crucial function of public health systems and can deliver substantial domestic and global public health and socio‐economic benefits. Recognition of influenza viruses of pandemic potential can provide an (informational) basis upon which a course of containment actions can be agreed and activated.
3.48 Figure 3.18 indicates the current state of national laboratory capacity for detecting influenza viruses in humans with information taken from national reports provided to UNSIC. While a large majority of respondents in ECA, MENA and Asia & Pacific indicate having national laboratory capacity, 43% (16/28) of the Americas and 51% (17/35) of Africa’s respondents reported having no national capacity. Some respondents indicated that they neither have national capacity nor access to a regional laboratory capacity (Africa 3/35 and 4/42 in ECA). Out of the infected countries responding to the survey, only a small number 11% (5/45) reported not having the capacity to detect H5N1 in humans compared to that of non infected countries where 42% (40/96) report no capacity (see Figure 3.19).47
47 Specific progress has been achieved and identified in acquiring national laboratory capacity for detecting influenza viruses in humans in the past year. A comparison of countries responding in 2008 to 2007 shows out of the 77 countries who responded to the survey regarding capacity both in 2007 and 1008, 8 have reported improvement.

50
Box 3.9 WHO Global Surveillance Capacity: Advancements and Virus Tracking In response to the concerns voiced by member states at the 60th World Health Assembly (WHA) on the international public health controversy around fairness, transparency, equity and effectiveness of virus sharing and benefit sharing and in light of the entry into force of the IHR (2005), the Assembly recognized the pressing need for the WHO to develop, in consultation with its members states, frameworks and mechanisms to enhance timely sharing of viruses and fair, equitable and transparent access to the viruses and to influenza vaccines and other benefits, especially by developing countries 3. An intergovernmental meeting was assembled in November 2007 to identify and propose immediate solutions 2. Since then, progress has been achieved in addressing some of these issues and two measures are currently being implemented to enhance transparency within the Global Influenza Surveillance Network (GISN). An interim Influenza Virus Tracking System for all influenza A (H5N1) shared within the GISN was launched 4. The information on the viruses and samples shared and analyzed since 2003 can be accessed by all at https://www.who.int/fluvirus_tracker/searchsample. The database includes 1,4:
• H5N1 viruses/specimens shared with WHO • Location of the viruses/specimens • Analyses conducted on the viruses • Development of vaccine viruses • Recipients of vaccine viruses/specimens
It was also agreed by the intergovernmental meeting and 61st WHA to appoint an advisory group to ensure that this System meets its set objectives of fairness, equitability and transparency in virus sharing and benefit sharing 2,4. Sources: 1. Influenza Virus Tracking System (interim). Home page located at https://www.who.int/fluvirus_tracker [last accessed on 21 August 2008] 2. Interim Statement of the Intergovernmental Meeting on Pandemic Influenza Preparedness: Sharing of influenza viruses and access to vaccine
and other benefits. Published on 22 January 2008 http://www.who.int/gb/pip/pdf_files/IGM_PIP‐IntStatement‐en.pdf [last accessed on 21 August 2008]
3. Sixtieth World Health Assembly (60th WHA). Pandemic influenza preparedness: sharing of influenza viruses and access to vaccines and other benefits. WHA 60.28. 23 May 2007. Available at http://www.who.int/gb/ebwha/pdf_files/WHA60/A60_R28‐en.pdf [last accessed on 21 August 2008]
4. Sixty First World Health Assembly (61st WHA). Pandemic influenza preparedness: sharing of influenza viruses and access to vaccines and other benefits. WHA 61.4. Provisional Agenda Item 11.1. 20th March 2008. Available at http://www.who.int/gb/ebwha/pdf_files/A61/A61_4‐en.pdf [last accessed on 21 August 2008]
Source: APSED progress Report 2008

51
Box 3.10: China Country Case Study
Problem & Context. China has a critical role to play in the international response to AHI given its size and population, the significance of China's poultry industry, and the frequency of H5N1 outbreaks to date. The government has formulated a comprehensive response to potential AHI threats. However, there are particular challenges facing the central and sub‐national governments in coordinating a response in such a large and diverse country. Detailed technical assessments of China's response to date indicate that early warning and surveillance capacity ‐‐ particularly at the grass roots level ‐‐ requires considerable strengthening. Rapid response at the grass roots level to investigate and contain human clusters of disease with outbreak potential has often been implemented by different sectors in an uncoordinated way. It is important to identify how the overall response and its coordination can be improved by the wide range of ministries and agencies involved ‐‐ especially those operating at the local level.
Approach & Activities Undertaken. The Avian and Human Influenza Facility grant supports activities to strengthen AHI response capacity at the county level and at the sub‐national level in two Provinces (one has a largely intensive farming system while the other has predominantly backyard farming systems). This support at the local level is complemented by support to the central government in providing technical assistance to pilot local operations as well as to develop knowledge sharing activities that will support the dissemination and exchange of international experience and operational good practice that is emerging from the field.
Activities focus on enhancing prevention and control of animal‐to‐animal, animal‐to‐human, and human‐to‐human transmission and aim to strengthen the national plan for HPAI and human pandemic influenza and to establish mechanisms to enhance transparent, real time multi‐sectoral communication between officials involved at all levels of government. There is a particular emphasis on strengthening the support provided to officials at the grass roots (county) level with the specific objectives of: improving coordination and communication between central and lower levels of government; enhancing the level of human pandemic influenza preparedness amongst animal and human health staff through the provision of training and drills; and, developing health promotion awareness campaigns to effect behavioral change in key vulnerable societal groups.
Results. 1. The project has supported the training of local human and animal health staff together by using some common modules for workers from both sectors. Similarly, animal and human health investigation and response team exercises have jointly undertaken drills at local levels to foster a coordinated response. This has led to recognition by the two sectors of how important it is to work together, indeed, to a greater extent than has been true at the central government level. 2. It has been found more effective to have international and domestic experts talk in seminars on international experience and then let the Chinese officials internalize the implications‐‐this in preference to consultants pointing out shortcomings in the Chinese response system, particularly with respect to surveillance. 3. These efforts have also contributed to a move away from a primary reliance on vaccination campaigns to more emphasis on surveillance and other prevention/response strategies (biosafety, etc).
Next Steps & Remaining Challenges. 1. Experiences at local levels with the benefits of inter‐sectoral coordination need to be better reflected in the national plans and strategies. 2. Attention now needs to be given to effective ways of scaling up these lessons for broader implementation across the country. If successful, the pilots have the potential to identify a more integrated disease response strategy for AHI and other emerging and reemerging infectious diseases. Moreover, if this can be achieved in a country of China’s size, it offers important operational insights for other large countries. 3. Multi‐sector pandemic planning is still quite limited. Progress in these areas could provide a unique and value model for other developing countries to follow. 4. The project is contemplating future efforts to build a more multi‐dimensional approach to surveillance. The all‐hazards approach would focus not just on potential pandemic clusters but also other risk factors using a more event based approach that could be piloted at local levels.
Source: World Bank

52
4/35
0 0 0 0 4/145
6/35
9/28
6/25 12/43
2/14
35/145
25/3519/28
19/25 31/43
12/14
106/145
0%
20%
40%
60%
80%
100%
Africa Americas Asia Pacific ECA MENA Global
National Pandemic Influenza Preparedness Plans and Government Endorsement (Q 31)
No plan Plan Prepared but Not Nationally Endorsed
Plan Prepared and Nationally Endorsed
Figure 4.1
4. Preparedness for Mitigating the Impacts of the Next Influenza pandemic
4.1 This sections draws on data provided by national authorities to UNSIC via the global survey and on
additional assessments conducted by the Pandemic Influenza Contingency Team (PIC) and other institutions.48
Overall Planning 4.2 There has now been nearly
total global coverage of the recognition of the need to plan for pandemic influenza. National authorities’ responses to the UNSIC survey indicate that 97% (141/145) countries have pandemic preparedness plans, a marginal increase on 2007 figures. However, despite this accomplishment further analysis suggests that the quality and comprehensiveness of these plans continues to vary significantly between countries. The UNSIC survey shows that only approximately 70% (106/145) of national plans in responding countries have been endorsed at the top executive level highlighting concerns regarding their implementation. Of the 35 reported plans which remain un‐endorsed 28 are from non‐infected countries implicating the challenges of traction for this issue in the absence of the animal disease (see Figure II.9, Annex II).
4.3 Overall, studies of available national pandemic plans continue to show a focus on planning in the human health sector, with insufficient attention to other ‘non‐health’ sectors that maintain essential services and infrastructure (see section 4.14 for further information).
48 Predominantly this institutions are the London school of Hygiene and Tropical Medicine (LSHTM) and the European Centre for Disease Prevention and Control (ECDC). ‐ Ortu, G., Mounier‐Jack, S., Coker, R. Pandemic influenza preparedness in Africa is a profound challenge for an already distressed region: analysis of national preparedness plans. Health Policy Plan May 2008;23(3):161‐9. ‐ Mensua A, Mounier‐Jack S, Coker R. Pandemic Influenza preparedness in Latin America: Analysis of National Plans. 16 January 2008 [report is yet to be in the public domain] ‐ ECDC. Technical Report. Pandemic Influenza Preparedness in the EU/ EEA. December 2007. http://ecdc.europa.eu/en/Health_Topics/pandemic_influenza/pdf/Pandemic%20prepare%20web%201.pdf

53
Making Planning Operational ‐ Including Simulations and Revision 4.4 It is widely recognized that simulations and table top exercises represent the most effective way to
identify deficiencies in plans and to heighten awareness of pandemic issues. Reports from national authorities show that there has been a moderate increase in the number of countries which have undertaken simulation exercises indicating a move to more sophisticated levels of preparedness.49 Where testing has occurred, 25% (37/145) report that testing took place at both national and local level. Further analysis of this year’s data also shows that 37% (45/120) of countries have incorporated the lessons learned from simulations into plan revisions (see Figure II.12, Annex II). A higher proportion of infected countries have also tested their plans than non‐infected (see Figure II.11, Annex II).
Figure 4.2
6/30
8/28
13/27
22/38
7/1756/140
4/17
6/10
6/14
13/26
3/8 32/75
3/29
14/16
12/25
22/37
7/1658/133
6/35
17/28
20/25
23/43
11/14
77/145
0%
20%
40%
60%
80%
100%
Africa Americas Asia Pacific ECA MENA Global
Comparison of Pandemic Plans being Tested 2005‐2008 (Q33)
Tested Jan 2005 ‐ June 2006
Tested June 2006 ‐ October 2006
Tested October 2006‐June 2007
Tested June 2007 ‐ June 2008
49 A comparison of countries who replied both in 2007 and 2008 showed that 34/69 reported having conducted a simulation this year who had not in 2007 – 11/15 in Americas; 11/13 in Asia Pacific; and 6/6 in MENA
Box 4.1 Cambodia: An Example of Sub‐National Pandemic Planning Cambodia has established a National Working Group on Pandemic Planning to develop agreed inter‐ministerial coordination mechanisms and multi‐sector operational response plans for a pandemic emergency. The National Centre for Disaster Management has been officially assigned as the coordinating body for multisectoral preparedness. A sub‐national pilot project is underway in Siem Reap province to develop a multi‐sector operational pandemic response planning process. Key features of the process include: • dynamic group participation, • acknowledgement of the necessity for self‐reliance, and • an emphasis on the need to plan around currently available resources. This approach has created one of the first and few opportunities for disparate government departments to plan together, and is attracting the active involvement of civil society groups and private businesses and the Cambodian Red Cross has been identified as a key stakeholder in the process. Key outputs will include: • a model provincial pandemic response plan, including standard operating procedures for each sector; • identification of policy gaps by operational, on‐the‐ground personnel to inform national‐level planning; and • a documented process to identify lessons learned by the University of Melbourne to also inform further
extension of planning in Cambodia and other national or regional contexts.
Source: Pandemic Influenza Contingency (PIC) Team, OCHA and WHO Cambodia
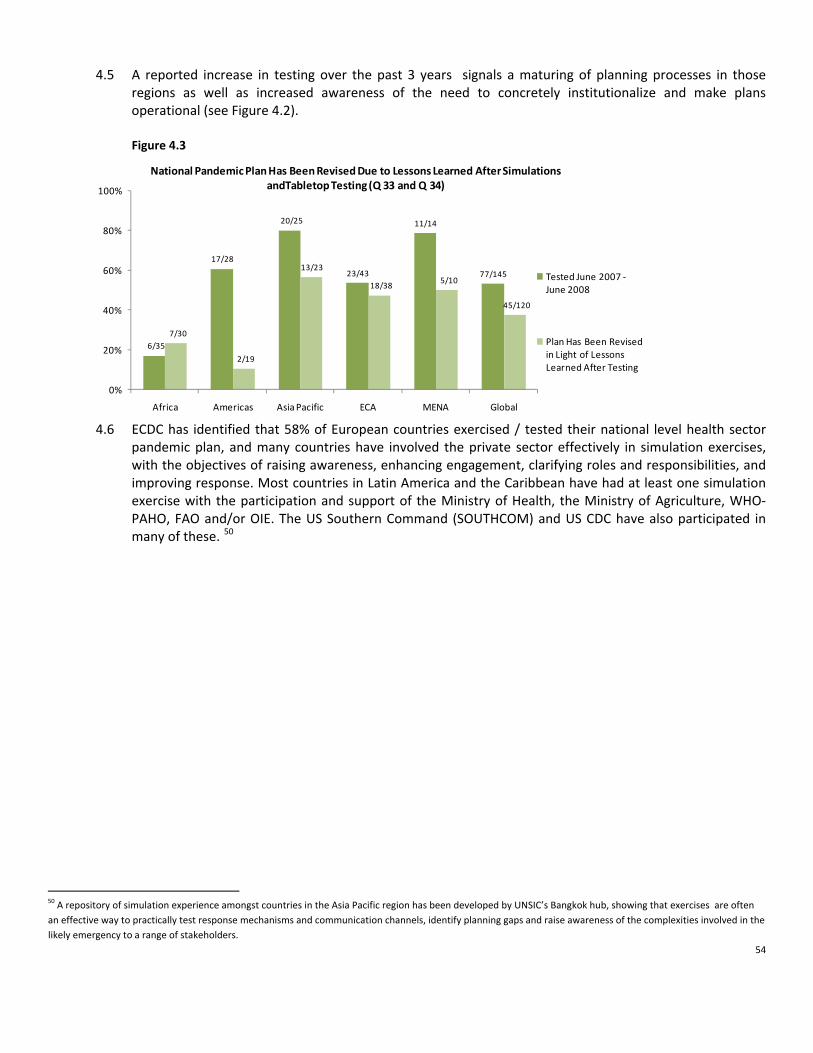
54
4.5 A reported increase in testing over the past 3 years signals a maturing of planning processes in those
regions as well as increased awareness of the need to concretely institutionalize and make plans operational (see Figure 4.2). Figure 4.3
6/35
17/28
20/25
23/43
11/14
77/145
7/30
2/19
13/23
18/385/10
45/120
0%
20%
40%
60%
80%
100%
Africa Americas Asia Pacific ECA MENA Global
National Pandemic Plan Has Been Revised Due to Lessons Learned After Simulations andTabletop Testing (Q 33 and Q 34)
Tested June 2007 ‐June 2008
Plan Has Been Revised in Light of Lessons Learned After Testing
4.6 ECDC has identified that 58% of European countries exercised / tested their national level health sector
pandemic plan, and many countries have involved the private sector effectively in simulation exercises, with the objectives of raising awareness, enhancing engagement, clarifying roles and responsibilities, and improving response. Most countries in Latin America and the Caribbean have had at least one simulation exercise with the participation and support of the Ministry of Health, the Ministry of Agriculture, WHO‐PAHO, FAO and/or OIE. The US Southern Command (SOUTHCOM) and US CDC have also participated in many of these. 50
50 A repository of simulation experience amongst countries in the Asia Pacific region has been developed by UNSIC’s Bangkok hub, showing that exercises are often an effective way to practically test response mechanisms and communication channels, identify planning gaps and raise awareness of the complexities involved in the likely emergency to a range of stakeholders.

55
Incorporation of Pandemic Preparations and Response into National Disaster Management Structures
4.7 The incorporation of pandemic preparedness into disaster management structures makes preparations
sustainable and operational. The multi‐faceted nature of preparing for a pandemic also provides increased resilience for a range of threats. The level of integration of pandemic planning into existing national and local disaster management structures varies by region. Reports from national authorities to UNSIC indicate 83% (118/143) countries report some integration; however, only 36% (52/143) of those report this at both national and local level (see Figure 4.4).51
51 A comparison with the reports from same national authorities in 2007 to 2008 indicates significant advances in the ECA region with 23/31 reporting improvement in this area.
Box 4.2 Indonesia: One of the Largest Full‐Scale Pandemic Influenza Exercises ‐ Planning Process Deemed Just as Important as the Final Simulation The Government of Indonesia conducted a full‐scale three‐day simulation exercise in April 2008, to test and later revise the protocols and operational capacity of Indonesia to promptly and effectively contain an epicenter of human‐to‐human transmission of a novel influenza virus. The core objectives of the simulation were:
• To establish well‐tested capability at the central, provincial, district and local levels to rapidly respond to a pandemic influenza outbreak;
• To establish well‐tested and effective protocols and operational plans to be used to contain an outbreak of pandemic influenza;
• To establish positive inputs that can be used to strengthen the influenza pandemic containment plan. As one of the first simulations exercising the operational coordination across multiple sectors and jurisdictions, the exercise involved more than 8 months of planning and included nearly 1000 planners and participants as well as more than 200 international and local observers. The value in preparing for the exercise was two‐fold: it engaged exercise participants to brainstorm through several sessions to understand the intricate concepts related to outbreak containment; and it provided an opportunity to train local officials from multiple jurisdictions, core simulation centres, controllers, simulators, evaluators and administrators in simulation design and implementation. Sectors participating in the full‐scale exercise included hospitals, the Ngurah Rai International Airport, the Armed and Police Forces, the National Commission for Avian Influenza and Pandemic Influenza, and Ministries of Health, Environment, Internal Affairs, Foreign Affairs, Agriculture, Communication & Information, and Social Welfare. Key issues addressed through the exercise included:
1. Command and coordination; 2. Risk communication; 3. Surveillance; 4. Logistics of supplies and services, including port health; 5. Distribution of essential medical supplies including anti‐virals, personal protective equipment, vaccine; 6. Non‐pharmaceutical interventions and area quarantine.
At the conclusion of the simulation, feedback and observations were collected and consolidated from the observers through evaluative meetings. All lessons captured will contribute towards producing final guidelines, protocols and operational procedures for outbreak containment, which will be packaged into a training programme for all local jurisdictions (provinces and districts) which will be offered through the framework of a train‐the‐trainer module to disseminate advocacy and conduct pandemic preparedness training and simulations.
Source: UNSIC Bangkok Office PanSimEx Booklet

56
Figure 4.4
8/34
2/28
9/25
3/43
3/1325/143
19/3417/28
6/25
18/226/13 66/143
7/34
9/28
10/25
22/43
4/13 52/143
0%
20%
40%
60%
80%
100%
Africa Americas Asia Pacific ECA MENA Global
Integration of Pandemic Plan into Existing National and Local Disaster Management Structures (Q 41)
No Integration of Pandemic Plan into Any Disaster Management Structures
Nationally Endorsed Plan is Integrated into Existing Disaster Management Structures at National Level ONLY
Nationally Endorsed Plan is Integrated into Existing Disaster Management Structures at National AND Local Level
Established and Validated Protocols for a Pharmaceutical Response during a Pandemic 4.8 Reports from national authorities show that, globally, government efforts have been strongly focused on
pharmaceutical interventions in a pandemic, with around 70% (103/142) reporting that they have achieved national endorsement for such interventions (the scale of these interventions is unknown). In Africa, however, only around 50% of countries reported such progress relating to a corresponding reliance only on social distancing measures in plans, see section 4.9 & Figure 4.5 and 4.6. Infected countries also report a higher level of planning for a pharmaceutical response than non‐infected (see Figure II.13, Annex II). For further analysis of the inclusion of these measures by country income level see box .4.9.
4.9 ECDC found that 97% of EU and EEA countries have developed an antiviral strategy, and 87% have developed a pandemic vaccine strategy.52 LSHTM’s analysis of Latin American plans shows that antiviral drug and vaccine strategies (in their plans) have not advanced significantly and their analysis of African plans shows that antiviral and vaccine strategies are not developed or non‐existent. Figure 4.5
18/34
19/27 17/25
37/4312/13
103/14225/34
25/27
25/25
40/43
13/13
128/142
16/34
18/27 17/25
34/43 11/13
96/142
0%
20%
40%
60%
80%
100%
Africa Americas Asia Pacific ECA MENA Global
Nationally Endorsed Procedures for a Pharmaceutical & Non‐Pharmaceutical Response in a Pandemic (Q 35 & Q36)
Nationally endorsed procedures for a pharmaceutical response
Planning is in place for non‐pharmaceutical response
Countries indicating planning for both a pharmaceutical and non‐pharmaceutical response
52 ECDC Report indicates n=30
57
Public Health Interventions and Social Distancing in the Event of a Pandemic 4.10 Public health measures and interventions are the strongest set of response tools communities will have in
order to mitigate the effects of a pandemic. These interventions – which are used to prevent the healthy population from getting infected and becoming ill – include social distancing strategies such as isolation of infected persons and isolation of contacts, limiting public gatherings and restricting travel, through to using physical barriers such as masks and gloves and advocating public health messages such as washing hands with soap and water.
4.11 Globally 90% (128/142) of respondents indicated plans to implement social distancing measures such as school closures or prevention of mass gatherings. However, only 30% (43/142) of those countries globally reported logistical and legislative provisions in place (see Figure 4.6). The UNSIC global survey indicates that there are differences in the approaches taken by governments in various regions and income levels
Box 4.3 Options for the Use of Human H5N1 Influenza Vaccines and the WHO H5N1 Vaccine Stockpile A great number of human H5N1 vaccines, using various technologies, have been developed by at least 16 manufacturers, and are currently at advanced‐stages of development. Options for the use of human H5N1 vaccines (‘how’ and ‘when’): WHO highlight and discuss five options for deploying pandemic influenza vaccines, before, after and during a pandemic. All the options involve complex scientific, ethical and political considerations. Moreover, for many options, the existing scientific evidence and considerations provide little support on which to base decision‐making. Mathematical modeling may provide valuable insights. These strategic considerations include: • To protect groups of people considered at risk of contracting zoonotic avian H5N1 influenza; • To prime (single dose only) selected groups or populations in anticipation of a possible H5N1 influenza pandemic
(In theory, priming selected groups could be effective but there is a lack of data to support this option and further studies are needed. Importantly, many uncertainties surrounding the next pandemic);
• To fully immunize selected groups or populations in anticipation of a possible H5N1 influenza pandemic; • To help contain the initial and localized emergence of a potential H5N1 influenza pandemic; and • To immunize selected groups or populations following sustained human‐to‐human transmission of H5N1: Vaccine
acceptance
Options for the use of the WHO H5N1 vaccine stockpile: It was decided at the 60th World Health Assembly, in May 2007, that WHO establish a global stockpile of H5N1 vaccines within the following three years. Pharmaceutical companies have showed signs of willingness to contribute to the stockpile. WHO’s consultation paper suggests that 100 million doses (covering 50 million people) be made available. However, all this is pending upon the outcomes of ongoing clinical trials and licensure. Two main approaches for the use of the vaccine stockpile in humans have been discussed by WHO: • To help contain the initial and localized emergence of a potential H5N1 influenza pandemic if such an event is
identified early enough: This option could potentially mitigate the development of a pandemic if used in combination with other early‐containment measures.
• To provide countries that are least able to obtain H5N1 vaccines with some level of supplies if sustained human‐to‐human transmission of an H5N1 virus starts: This option may help to increase access to vaccine in some countries.
Source: WHO. Options for the use of human H5N1 influenza vaccines and the WHO H5N1 vaccine stockpile, WHO Scientific Collaboration, 1‐3 October 2007. Meeting of the Immunization Strategic Advisory Group of Experts (SAGE) November 2007 http://www.who.int/wer/2008/wer8301.pdf
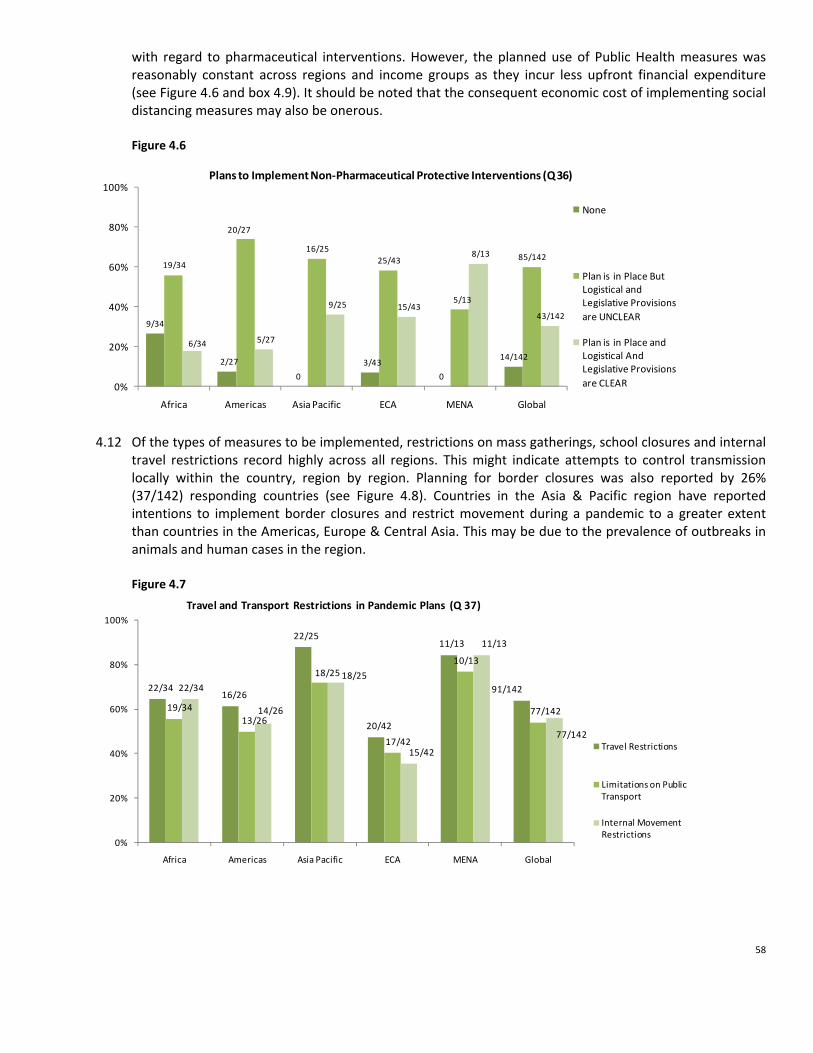
58
with regard to pharmaceutical interventions. However, the planned use of Public Health measures was reasonably constant across regions and income groups as they incur less upfront financial expenditure (see Figure 4.6 and box 4.9). It should be noted that the consequent economic cost of implementing social distancing measures may also be onerous. Figure 4.6
9/34
2/27
0
3/43
0
14/142
19/34
20/27
16/2525/43
5/13
85/142
6/34 5/27
9/25 15/43
8/13
43/142
0%
20%
40%
60%
80%
100%
Africa Americas Asia Pacific ECA MENA Global
Plans to Implement Non‐Pharmaceutical Protective Interventions (Q 36)
None
Plan is in Place But Logistical and Legislative Provisions are UNCLEAR
Plan is in Place and Logistical And Legislative Provisions are CLEAR
4.12 Of the types of measures to be implemented, restrictions on mass gatherings, school closures and internal
travel restrictions record highly across all regions. This might indicate attempts to control transmission locally within the country, region by region. Planning for border closures was also reported by 26% (37/142) responding countries (see Figure 4.8). Countries in the Asia & Pacific region have reported intentions to implement border closures and restrict movement during a pandemic to a greater extent than countries in the Americas, Europe & Central Asia. This may be due to the prevalence of outbreaks in animals and human cases in the region. Figure 4.7
22/3416/26
22/25
20/42
11/13
91/142
19/3413/26
18/25
17/42
10/13
77/142
22/34
14/26
18/25
15/42
11/13
77/142
0%
20%
40%
60%
80%
100%
Africa Americas Asia Pacific ECA MENA Global
Travel and Transport Restrictions in Pandemic Plans (Q 37)
Travel Restrictions
Limitations on Public Transport
Internal Movement Restrictions

59
Figure 4.8
25/34
22/26
25/25
34/42
13/13
119/142
24/34
21/26
22/2534/42
13/13
114/142
10/34
2/26
12/25
7/42
6/13
37/142
0%
20%
40%
60%
80%
100%
Africa Americas Asia Pacific ECA MENA Global
Social Distancing Interventions in Pandemic Plans (Q 37)
Restrictions on Mass Gatherings
School Closures
Border Closures
4.13 Inconsistency in approaches to preparedness for pharmaceutical and public health interventions has been
identified as a potential future challenge for the interoperability of national plans during a pandemic. Border closures will undoubtedly have impacts on other nations including supply chains and the movement of people. The extent of divergence in planning highlights the differences regionally and globally on a) views on the available scientific evidence; b) differing domestic logistical and financial situations; and c) differing political and ethical based decision making. This emphasizes the need for cross border and regional collaboration in planning to not necessarily ensure consistency of approach but compatibility where country level planned responses might impact on other nations or nationals.

60
Box 4.4 Examples of Recent Scientific Research and Policy Discussions on Social Distancing Measures While efforts to improve the global availability and access to a pandemic vaccine and to antiviral medicines (AV) have intensified in the past few years, the current situation indicates that the global manufacturing capacity of both products remains insufficient to satisfy the predicted demand during an influenza pandemic in a timely manner. Hence, it is foreseen that most nations would primarily depend on public health interventions to mitigate the impact of a pandemic. The application of such measures, especially during the early stages of a pandemic, could be particularly important for minimizing the overall impact of a pandemic on public health by delaying its initial geographical spread. It could also provide pharmaceutical manufacturers, especially vaccines producers, with additional time to develop larger quantities of their products. Sound evidence on the effectiveness of public health interventions during an influenza pandemic is largely absent. However, a growing body of retrospective and predictive mathematical modeling studies has emerged in recent years which provides valuable information for contemporary pandemic preparedness and response policies. One of the most insightful retrospective research published in the last year was conducted by Markel et al. It investigated the impact of the timing of activation, duration, choice, and combination of three groups of public health interventions (isolation and quarantine, school closures, and cancellation of public gatherings) on outbreak mitigation in 43 US cities during the 1918‐1919 pandemic. The study revealed that US cities that activated non‐pharmaceutical interventions in the early stages of their outbreak and employed combinations of measures on a continuous and layered manner were associated with both delays and reductions in mortality. Additional research, carried out by Wood et al, explored the impact of imposing internal travel restrictions between air‐connected Australian cities to delay spread of an outbreak. The outcomes of the modeling exercise suggest that the imposition of continuous high level travel restrictions at the onset of an epidemic in a city could create delays in the spread of the virus to another city of up to several weeks. Consideration also needs to be given to the negative impact of such measures on the general functioning of services and infrastructure within countries. Investigation of real rather than theoretical experience looking at school closures / class dismissal has found that the impact of interventions could also be considerably less than suggested by some theoretical work. It is well accepted that public health benefits of imposing social distancing could be greater if these were combined with pharmaceutical interventions. Halloran et al considered this approach in their research, studying the effectiveness of sets of targeted and general containment interventions (also referred to as ‘targeted‐layered containment approaches’) comprising of both pharmaceutical interventions (antivirals) and social distancing (quarantine, isolation, school closure, community and workplace social distancing) on pandemic mitigation. The study results suggest that this approach could greatly lower morbidity rates and delay the spread of the disease. Despite the revealed public health benefits of including non‐pharmaceutical interventions (NPI) as part of pandemic mitigation strategies, however, there is an acknowledgement that the imposition of strict NPI could seriously harm economies by temporarily interrupting trade and movements. Therefore, there is an urgent need to examine strategic options that could enable the maximization of public health benefits during a pandemic while minimizing economic disruptions. Source: • Markel H, Lipman HB, Navarro JA, Sloan A, Michalsen JR, Stern AM, Cetron MS. Nonpharmaceutical Interventions Implemented by US Cities
during the 1918‐1919 Influenza Pandemic. JAMA 2007 Aug 8;298 (6):644‐54. Erratum in: JAMA. 2007 Nov 21;298(19):2264. • Wood JG, Zamani N, Mac Intyre CR, Becker NG. Effects of international border control on spread of pandemic influenza. Emerg Infect Dis
2007;13(7):1038‐45. • Halloran ME, Ferguson NM, Eubank S, Longini IM Jr, Cummings DAT, Lewis B, Xu S, Fraser C, Vullikanti A, Germann TC, Wagener D, Beckman R,
Kadau K, Barrett C, Macken CA, Burke DS, Cooley P. Modeling targeted layered containment of an influenza pandemic in the United States. Proc Natl Acad Sci USA 2008 Mar 25;105(12):4639‐44. Cauchemez S, Valleron A‐J, Boelle P‐Y, Flahault A and Ferguson N Estimating the impact of school closure on influenza transmission from Sentinel data Nature 452, 750‐754 (10 April 2008).

61
6/25
12/24 13/25
21/35 10/16
62/125
14/35
21/28 19/25
35/42
12/16101/146
0%
20%
40%
60%
80%
100%
Africa Americas Asia Pacific ECA MENA Global
A Comparison of Business Continuity Planning for a Pandemic 2007 to 2008 (Q40)
2007 Evidence of continuity planning for essential services
2008 Evidence of continuity planning for essential services
Figure 4.10
Health System Capacity 4.14 Planning is required to ensure continuity of high quality care for existing patients including the preventing
them from becoming infected with pandemic influenza, whilst also caring for the additional case load of those infected with the pandemic influenza virus. Data gathered from national authorities indicate that around 80% (123/142) of countries have a process in their pandemic planning for developing surge capacity in their health care system. However, only 42% (60/142) report this includes the identification of potential extra resources such as extra staff and space. This indicates further advanced preparedness in this area is still needed in many countries.
Figure 4.9
11/33
3/282/25 3/42
0/13
19/142
14/33
14/28
14/25
16/235/14
63/142
8/33
11/289/25
23/42
9/14
60/142
18/3215/28
19/25
35/40
13/13
100/138
0%
20%
40%
60%
80%
100%
Africa Americas Asia Pacific ECA MENA Global
Inclusion in Pandemic Planning for Increased Health Care Demand (Q 38 and Q 39)
None
Plan Includes Capacity for Increased Demand, But Extra Resources Not Identified in Planning
Plan Includes Capacity for Increased Demand, and Planning Includes Identification Extra ResourcesPlan Includes Measures to Maintain Essential Healthcare for Other Emergencies/Chronic Disease Patients
Continuity of Essential Services Beyond Health During a Pandemic 4.15 It is essential that private and public organizations prepare for the potential disruption that a pandemic
will cause beyond the health impact, including those that caused by an increased level of worker absenteeism. Developing robust preparedness plans can enable the continuity of operations during a pandemic and significantly mitigate the likely economic and social impacts.
4.16 Reports from national authorities
indicate an increase in planning for the continuity of vital infrastructure in 2008 compared to 2007. However, of those reporting evidence of planning, less than half have specific sector plans (42/101). Progress in this area varies significantly by region and income level (see Box 4.9) and remains low. The data suggest that where planning exists, it tends to cover key sectors in uniform fashion. This indicates significant gaps remain in efforts to achieve advanced levels of planning globally.

62
Figure 4.11
29/35
18/2815/25
21/42 8/16
91/146
10/35
14/28 12/2518/42
5/16
59/146
4/35
7/28 7/25
17/427/16
42/146
0%
20%
40%
60%
80%
100%
Africa Americas Asia Pacific ECA MENA Global
Existence of Government or Private Sector ‐ Initiated Business Continuity Planning (Q 40)
No Evidence of Planning
Highlighted in the National Plan, But No Sectors Specific Plans
There is Evidence of Planning in Specific Sectors
4.17 While some countries have provided guidance and tools to assist private sector preparedness and
business continuity planning, few have provided practical support for application or followed up on implementation. LSHTM studied advice provided to businesses in European countries on business continuity planning. They found that only 8 of 27 countries surveyed had offered significant and substantive advice. LSHTM concluded that in Latin America plans the issue of maintaining essential services was inadequately addressed and represented the weakest area. However, during the first half of 2008, 6 Central American countries started to develop activities to ensure the continuity of essential services. ECDC identified that less than half of European countries had established preparedness plans for the non‐health sectors, although a number of such plans are in progress.
63
Box 4.5 Financial Services Sector Leading the Way in Planning and Testing for an Influenza Pandemic The financial sector is among the essential sectors whose continuity of service is vulnerable to the impacts of a pandemic both globally and at the national level via employee absenteeism– In a pandemic, minimizing disruptions in financial services (ranging from currency and securities trading, to continuity of the payments systems, to provision of cash) will be very important both to reduce economic costs of a pandemic and to assure a more speedy recovery. For the past three years, large globally‐active financial institutions have been exerting considerable efforts to better understand how a pandemic would affect their businesses and to put in place appropriate business continuity plans. Many have tested their plans at national, regional, or global levels. In addition, regulators in countries with the most advanced financial systems have been actively engaged in promoting pandemic‐related continuity planning in the financial institutions under their jurisdictions: In the 2006 the UK conducted the first thorough test of a financial sector’s resilience to pandemic influenza. Over the course of 6 weeks in October/November 2006, 3,500 people from 70 organizations from across the financial sector participated in the simulation. There was two main objectives: firstly, to provide each of the participants with an opportunity to test the effectiveness of their plans for responding to a flu pandemic; and, secondly, to assess whether there were any sector‐wide issues which might need to be addressed in order to strengthen the capability of the financial sector to cope with a pandemic. The exercise prompted many participating organizations (which included the Bank of England, HM Treasury and the Financial Services Authority) to make adjustments to their business continuity plans in areas such as human resources, third party dependencies, outsourced ancillary services, suppliers, operational priorities and communications. In addition, a number of sector‐wide issues were identified for further consideration such as the constraints on home working and the pressures a pandemic would exert on the retail financial services sector. In October 2007, The United States Department of Treasury, in partnership with the Financial Services Sector Coordinating Council for Critical Infrastructure Protection and Homeland Security, the Financial and Banking Information Infrastructure Committee, and the Securities Industry and Financial Management Association sponsored a sector‐wide pandemic exercise. The exercise was designed to stress test the business continuity plans of the more than 2,700 participating organizations; it simulated absentee rates at up to 49% nation‐wide and stressed critical infrastructures that the sector is reliant on. The exercise provided the opportunity to examine key crisis management issues, foster strategic thinking, and strengthen the sector’s overall preparedness. The U.S. exercise highlighted the need for organizations to include pandemic‐specific focus in their overall business continuity planning efforts. Source: • IMF • Financial and Banking Information Infrastructure Committee (FBIIC) and Financial Services Sector Coordinating Council (FSSCC) Pandemic Flu
Exercise of 2007. After Action Report. January 2008 • Financial Services Authority, HM Treasury and Bank of England. UK Financial Sector. Market Wide Exercise 2007 Report.

64
Disadvantaged and Vulnerable Groups
4.18 Another important aspect of pandemic preparedness is to consider people who are economically and socially disadvantaged and who are likely to suffer most, not only from the impact of a pandemic on human health, but also from the potential social and economic disruption. However, reports from national authorities to UNSIC and analysis conducted by PIC and LSHTM found little evidence that national planning efforts are addressing the rights and interests of disadvantaged groups, despite the likelihood that these groups will be disproportionately affected in a pandemic. None of the reviewed plans in North Africa and the Middle East suggested any systematic attempt to identify such groups, and none made references to any economically or socially disadvantaged groups (with the exception of Egypt). LSHTM identified that only 7 of 35 African plans surveyed consider the needs of disadvantaged groups. Strategies to assess and mitigate the impact on ethnic minorities, migrants, refugees and internally displaced persons is a gap in most African plans. Responses from national authorities to UNSIC for this report indicate globally 65% (91/139) countries have not addressed any disadvantaged groups in their planning (see Figure II.15 Annex II)
Box 4.6 Country Focus: Multi‐Sector Pandemic Preparedness in Egypt Egypt has made significant progress in preparing for a Pandemic. Within the Egyptian framework for Disaster Management, it has set up a strong command and control structure which is divided into three levels: the political level, the planning and preparation level, and the executive or operational level. On the strategic level, the Higher Ministerial Committee for crisis management was established and headed by the Prime Minister with the participation of the Ministries of Defense and Military Production, Interior Affairs, Information, Foreign Affairs and Health and Population. Other concerned ministries can be invited to participate as need be. On the planning and preparation level, the national pandemic inter‐ministerial committee was established and headed by the Minister of Health and Population with the participation of concerned ministers especially those that provide essential services to the public. Egypt has also developed response and preparedness procedures at both the national and sub‐national levels. Recent achievements include establishing a sub‐committee to organize pandemic simulation exercises. The sub‐committee is headed by the Cabinet of Information and Decision Support Centre (IDSC) with the participation of the Ministries of Defense and Military production, Interior Affairs, Health and Population, Information, Agriculture and Land Reclamation, Environment, Local Development and representatives of the National Security Council. At the national level, a simulation exercise was conducted at the Ministry of Health and Population. The exercise was successful in testing the reporting and tracking procedures in case of a pandemic. Training was held in three governorates (El‐Beheria, Red Sea and Menia). At the sub‐national level, the Monofia Pandemic Plan was reviewed, developed and evaluated for use as a model for other governorates. The IDSC ensured that all 26 governorates have Response and Preparedness Plans. The next step is to organize simulation training exercises in all governorates in order to test, revise and validate the plans. On a parallel front, the IDSC was instrumental in providing guidance to the private sector for preparing Business Continuity Plans through advocacy. It will also undertake a survey, the first of its kind in the region, to obtain an indication of the extent to which private and public institutions responsible for providing essential services in Egypt are preparing for a possible pandemic and formulate recommendations on how to improve pandemic readiness in businesses.
Source: Pandemic Influenza Contingency (PIC) Team, OCHA

65
Cross Border, Regional Planning and Inter‐operability 4.19 Pandemic planning should ideally be coordinated with other countries in the region whose actions could
have a cross‐border impact. Cross border preparations appear to be mixed regionally. Evidence from the PIC survey of Middle East and North Africa plans indicates that only 44% (7 /16) of the plans have included details about regional / cross‐border preparations. Similarly, LSHTM’s analyses of national plans identified that only a small minority of African countries have entered into collaborative agreements with their neighbors. However, ECDC has identified that 64% of European countries have undertaken joint policy work with neighboring countries.
4.20 The European Union has been particularly strong on cross border planning within the EU framework, and the ECDC has issued guidance to member states on collaboration. There have been efforts by the wealthier EU states to provide technical and financial support to poorer and accession states. In this vein, the UK’s Health Protection Agency (HPA) has provided support to Romania and Albania, with further support planned for Azerbaijan.
Box 4.7 USAID & IFRC Humanitarian Initiative to Prepare for a Pandemic Influenza Emergency It has been recognized that pandemic planning is likely to affect many of the most vulnerable people and communities in society. During the past year USAID have launched a humanitarian initiative to prepare for a pandemic influenza emergency. USAID is providing some $100m over three years to the IFRC, the CORE Group, InterAction, Save the Children, World Vision, CARE, Schools of Public Health, the Academy for Educational Development and the United Nations system to work with national actors in 25 target countries with the objective of reducing excess mortality during a pandemic. The initiative will focus on care and treatment for those infected with pandemic influenza, limiting transmission through public health interventions, providing care to treat potentially fatal diseases when health services are disrupted, ensuring secure access to food, and providing rapid resumption of income‐generating activities. Activities will include developing a network of Red Cross/Crescent and NGO first responders; mapping who will be responsible for carrying out specified functions where and how; adaptation of technical materials; training; development of detailed plans for local response with designated roles and responsibilities; testing of plans through simulation exercises; identification of necessary materials; and development of plans for procuring, stockpiling and using these commodities.
Source: Pandemic Influenza Contingency (PIC) Team, OCHA
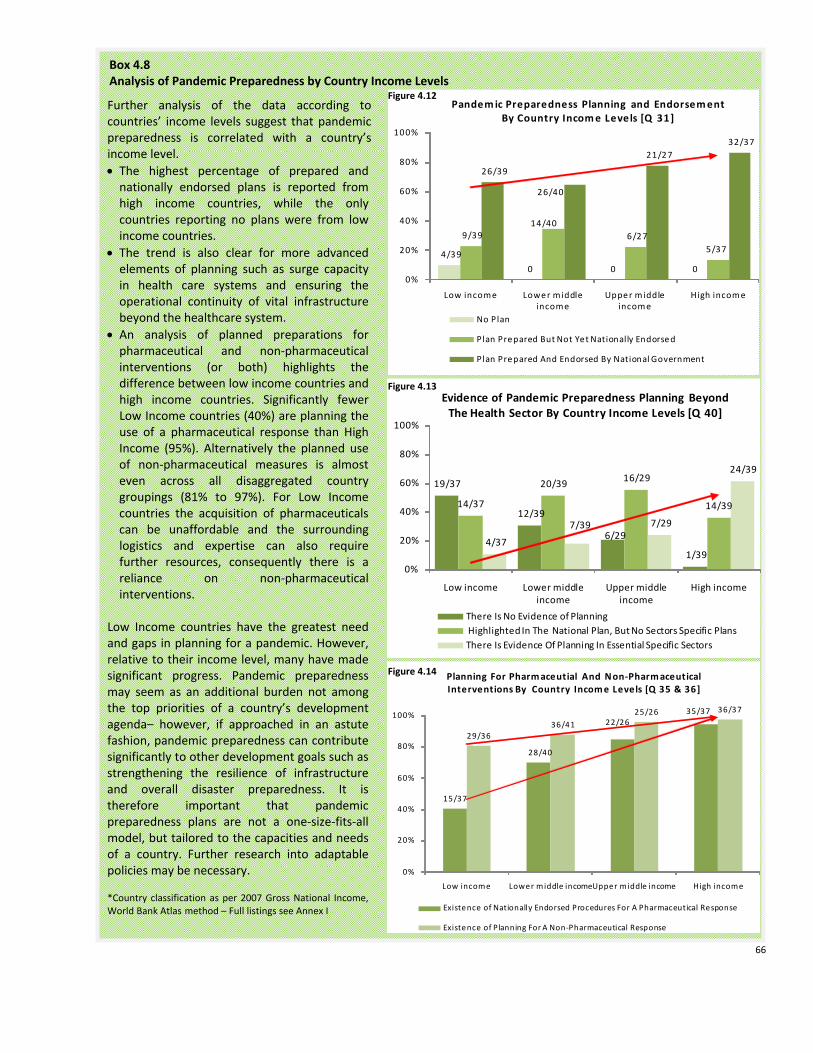
66
Box 4.8 Analysis of Pandemic Preparedness by Country Income Levels
4/39
0 0 0
9/3914/40
6/27 5/37
26/39
26/40
21/27 32/37
0%
20%
40%
60%
80%
100%
Low income Lower middle income
Upper middle income
High income
Pandemic Preparedness Planning and Endorsement By Country Income Levels [Q 31]
No Plan
Plan Prepared But Not Yet Nationally Endorsed
Plan Prepared And Endorsed By National Government
19/37
12/39
6/29
1/39
14/37
20/39 16/29
14/39
4/37
7/39 7/29
24/39
0%
20%
40%
60%
80%
100%
Low income Lower middle income
Upper middle income
High income
Evidence of Pandemic Preparedness Planning Beyond The Health Sector By Country Income Levels [Q 40]
There Is No Evidence of PlanningHighlighted In The National Plan, But No Sectors Specific PlansThere Is Evidence Of Planning In Essential Specific Sectors
15/37
28/40
22/2635/37
29/3636/41
25/26 36/37
0%
20%
40%
60%
80%
100%
Low income Lower middle incomeUpper middle income High income
Planning For Pharmaceutial And Non‐Pharmaceutical Interventions By Country Income Levels [Q 35 & 36]
Existence of Nationally Endorsed Procedures For A Pharmaceutical Response
Existence of Planning For A Non‐Pharmaceutical Response
Further analysis of the data according to countries’ income levels suggest that pandemic preparedness is correlated with a country’s income level. • The highest percentage of prepared and nationally endorsed plans is reported from high income countries, while the only countries reporting no plans were from low income countries.
• The trend is also clear for more advanced elements of planning such as surge capacity in health care systems and ensuring the operational continuity of vital infrastructure beyond the healthcare system.
• An analysis of planned preparations for pharmaceutical and non‐pharmaceutical interventions (or both) highlights the difference between low income countries and high income countries. Significantly fewer Low Income countries (40%) are planning the use of a pharmaceutical response than High Income (95%). Alternatively the planned use of non‐pharmaceutical measures is almost even across all disaggregated country groupings (81% to 97%). For Low Income countries the acquisition of pharmaceuticals can be unaffordable and the surrounding logistics and expertise can also require further resources, consequently there is a reliance on non‐pharmaceutical interventions.
Low Income countries have the greatest need and gaps in planning for a pandemic. However, relative to their income level, many have made significant progress. Pandemic preparedness may seem as an additional burden not among the top priorities of a country’s development agenda– however, if approached in an astute fashion, pandemic preparedness can contribute significantly to other development goals such as strengthening the resilience of infrastructure and overall disaster preparedness. It is therefore important that pandemic preparedness plans are not a one‐size‐fits‐all model, but tailored to the capacities and needs of a country. Further research into adaptable policies may be necessary. *Country classification as per 2007 Gross National Income, World Bank Atlas method – Full listings see Annex I
Figure 4.12
Figure 4.14
Figure 4.13

67
5. Conclusions and Recommendations
Summary of Status of HPAI Control and Pandemic Preparedness as of July 2007: The Third Global UNSIC‐World Bank Progress Report stated the following.
5.1 In 2007 it was reported that countries’ ability to respond to HPAI outbreaks was improving but the continued circulation of the virus and entrenched nature in several countries continued to represent a global threat. Overall: • Surveillance and laboratory systems had improved, plans for response had been developed and
control measures had improved; • The main weaknesses identified were in governance and capacity for animal health services; more
investment in surveillance networks and biosecurity is needed ; • Health system capacity to detect and respond to HPAI threats to humans had increased but varies
significantly between regions; • There had been progress with integrated planning between the human health and livestock sectors
but there was insufficient joint working of animal and human health surveillance and response networks;
• There was increasing awareness of the threat posed by HPAI H5N1, but this was not translating into behavior change;
• 95% of responding countries had developed pandemic preparedness plans: their quality varied greatly and many were not operational and paid insufficient attention to sectors other than health
• More effort was needed to ensure that humanitarian actors are ready to respond to a full blown influenza pandemic and give increased attention to communicable disease threats, especially when they cross borders.
Status of International Financial Assistance as of July 2008:
5.2 The gap between the amount of external assistance required for control of HPAI and pandemic preparedness and the amount pledged each year by bi‐lateral donors, the European Commission and multilateral development banks, has increased since 2005. This means that the funds available have been well below the amount needed. Although there has been continued support from major donor nations, the number of pledging donors has declined, from 35 at the Beijing conference (2005), to 17 at the Bamako conference (2006), and to 9 at the New Delhi conference (2007).
5.3 Against total pledges of $2.7 billion, donors have reported commitments of $2.0 billion, of which $1.5 billion has been disbursed. Of this disbursement, 59% was in cash or loans and 41% was in‐kind. Commitments amount to over 74% of the total pledged, while 72% of the committed amount has been disbursed. Such high commitment and disbursement rates within two and half years of the establishment of the financing framework reflect the exceptional commitment of the donors and the efficient movement of grant funds. However, loan funds from the multilateral development banks and grants from the Avian and Human Influenza multi‐donor financing facility based at the World Bank have been disbursed more slowly: generally they support longer term activities that are financed and implemented by national governments, and their negotiation through budget and planning processes typically takes many months.
5.4 Countries in East and South Asia together received $460 million, or 56% of commitments to date; countries in Eastern Europe and Central Asia received $184 million, or 22% of total commitments; and
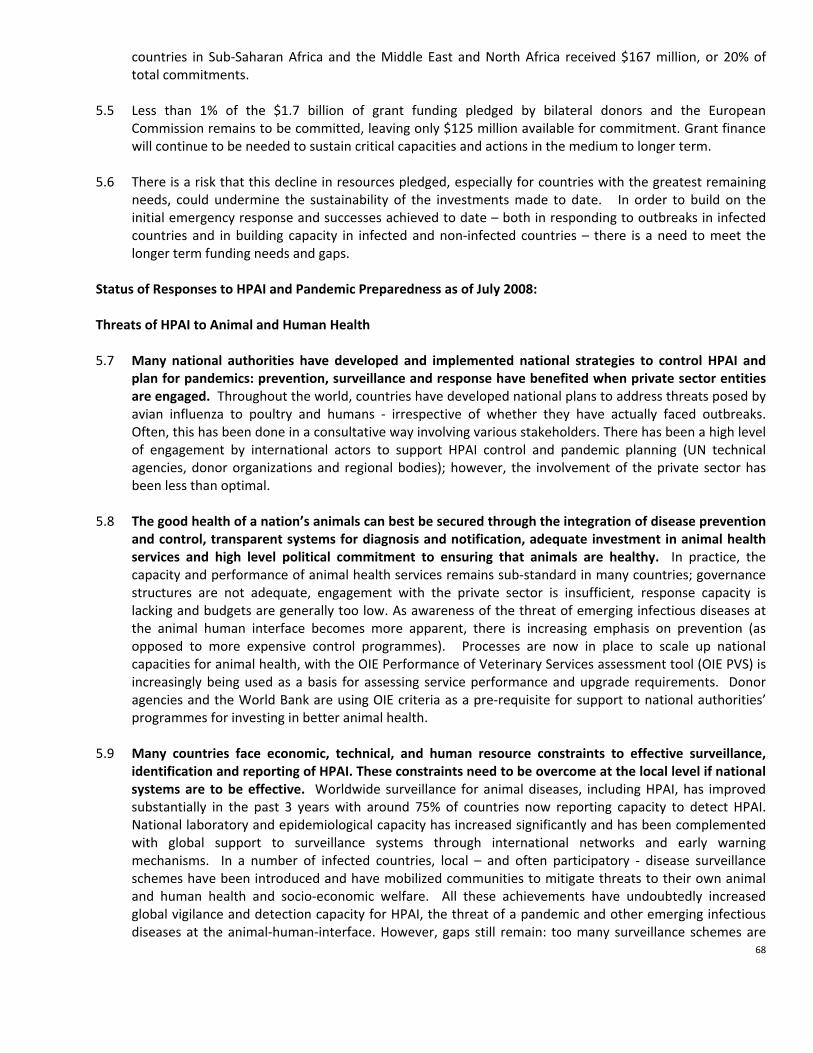
68
countries in Sub‐Saharan Africa and the Middle East and North Africa received $167 million, or 20% of total commitments.
5.5 Less than 1% of the $1.7 billion of grant funding pledged by bilateral donors and the European
Commission remains to be committed, leaving only $125 million available for commitment. Grant finance will continue to be needed to sustain critical capacities and actions in the medium to longer term.
5.6 There is a risk that this decline in resources pledged, especially for countries with the greatest remaining
needs, could undermine the sustainability of the investments made to date. In order to build on the initial emergency response and successes achieved to date – both in responding to outbreaks in infected countries and in building capacity in infected and non‐infected countries – there is a need to meet the longer term funding needs and gaps.
Status of Responses to HPAI and Pandemic Preparedness as of July 2008: Threats of HPAI to Animal and Human Health
5.7 Many national authorities have developed and implemented national strategies to control HPAI and plan for pandemics: prevention, surveillance and response have benefited when private sector entities are engaged. Throughout the world, countries have developed national plans to address threats posed by avian influenza to poultry and humans ‐ irrespective of whether they have actually faced outbreaks. Often, this has been done in a consultative way involving various stakeholders. There has been a high level of engagement by international actors to support HPAI control and pandemic planning (UN technical agencies, donor organizations and regional bodies); however, the involvement of the private sector has been less than optimal.
5.8 The good health of a nation’s animals can best be secured through the integration of disease prevention
and control, transparent systems for diagnosis and notification, adequate investment in animal health services and high level political commitment to ensuring that animals are healthy. In practice, the capacity and performance of animal health services remains sub‐standard in many countries; governance structures are not adequate, engagement with the private sector is insufficient, response capacity is lacking and budgets are generally too low. As awareness of the threat of emerging infectious diseases at the animal human interface becomes more apparent, there is increasing emphasis on prevention (as opposed to more expensive control programmes). Processes are now in place to scale up national capacities for animal health, with the OIE Performance of Veterinary Services assessment tool (OIE PVS) is increasingly being used as a basis for assessing service performance and upgrade requirements. Donor agencies and the World Bank are using OIE criteria as a pre‐requisite for support to national authorities’ programmes for investing in better animal health.
5.9 Many countries face economic, technical, and human resource constraints to effective surveillance,
identification and reporting of HPAI. These constraints need to be overcome at the local level if national systems are to be effective. Worldwide surveillance for animal diseases, including HPAI, has improved substantially in the past 3 years with around 75% of countries now reporting capacity to detect HPAI. National laboratory and epidemiological capacity has increased significantly and has been complemented with global support to surveillance systems through international networks and early warning mechanisms. In a number of infected countries, local – and often participatory ‐ disease surveillance schemes have been introduced and have mobilized communities to mitigate threats to their own animal and human health and socio‐economic welfare. All these achievements have undoubtedly increased global vigilance and detection capacity for HPAI, the threat of a pandemic and other emerging infectious diseases at the animal‐human‐interface. However, gaps still remain: too many surveillance schemes are

69
still in the planning phase, and the planning of some of these many have not been established on the basis of conducted risk assessments for the identification of priority areas.
5.10 There is a continuing need to encourage prompt reporting of disease in animals to national authorities,
and to ensure responses that are both socially and economically sustainable. The lack of functioning compensation schemes serves as a major disincentive for poultry holders to report HPAI or other infectious animal diseases. A significant number of new compensation schemes have been established to encourage reporting, but administrative arrangements for these to work are essential. National authorities should ensure that institutional and budgetary provisions are made, and that compensation schemes can be sustained. Very few countries have implemented livelihood support schemes to provide assistance for households affected by the impact of control measures, and only a few countries have conducted assessments to understand the impact of their control measures.
5.11 Significant efforts are still needed to improve biosecurity, and this requires a multi‐sectoral approach
that is implemented throughout the poultry chain with the involvement of private entities, and the engagement of animal health, production, communication and socio‐economic specialists. The focus should be on biosecurity measures that are sustainable and likely to be embraced at the local level. Good biosecurity enables poultry owners to protect their birds and reduces the spread of disease. Biosecurity standards in poultry production systems are currently insufficient, even in commercial production systems (Sector 1). So far measures have been predominantly launched in HPAI infected countries, mostly concerned with communicating awareness of risks and good practice to poultry owners and producers. Complete biosecurity in poultry production is a long‐term objective that will require political commitment from national authorities as well as ownership from the private sector. Implementing biosecurity measures is especially challenging and costly for small scale and backyard farmers. Countries with lower incomes will need significant financial and technical support to increase biosecurity standards. The better implementation of biosecurity measures is a priority for all countries, regardless of whether they have experienced an HPAI outbreak or not.
5.12 Full implementation of International Health Regulations (2005) will enable a predictable public health response to the spread of HPAI and other infectious diseases within the human population. Low income countries will need significant support to enable them to meet all requirements. Last year’s entering into force of the IHR (2005) was an important achievement in the development of human health capacities for detection, reporting and responding to Avian and Pandemic Influenza. At this point, most countries are still in the process of assessing their capacity and developing national action plans53. Major achievements thus far relate to the building of an infrastructure that will support this implementation process; further progress with the actual implementation of action plans can be expected in the next few years.
5.13 Long term approaches to behaviour change communication are needed, particularly approaches that
are tailored to people’s social, economic and cultural backgrounds. Communication for behavior change remains an essential complementary component to every aspect of avian and human influenza activities. An increasing number of communication campaigns has been reported, and awareness of the avian and pandemic influenza threat is high. Communities need to be provided with the knowledge and the means to put recommendations into practice. Ensuring communities place their trust in authorities, and the control measures they advocate, will be crucial for enabling people to protect themselves from, and limit
53 According to the IHR’s obligations for States Parties to meet the requirements regarding their national surveillance and response systems within three years of each state party’s entry into force.

70
the potential consequences of, HPAI and other emerging infectious diseases. Recent studies have however reaffirmed that translating awareness and knowledge into actual behavior change remains challenging.
5.14 To ensure that the present gains are not lost, stakeholders from all relevant thematic and organizational
backgrounds are encouraged to further sustain and cement their collaboration built around HPAI and use this for a range of activities and other disease threats. International, regional and national stakeholders from various thematic and organizational background have come together to jointly prevent, prepare and respond to the threat of HPAI in animals and humans. In particular, there has been an unprecedented collaboration of the animal and human health sectors. Networks have been formed, which can be built upon not just for future avian and pandemic influenza action, but other emerging infectious diseases at the animal‐human‐interface. Emerging infectious diseases are significantly correlated with socio‐economic, environmental and ecological factors, and in turn require coherent and connected approaches to prevention and control.
Preparedness to Mitigate the Impact of the Next influenza Pandemic
5.15 It is now important to consolidate achievements in pandemic planning, and make the plans operational
by further advocating, endorsing, testing, systematic reviewing of plans with lessons learned, and integrating plans into existing disaster management structures. There is now worldwide recognition of the need to prepare for an influenza pandemic. This is a significant achievement considering that, only 5 years ago, the world was largely unaware of and unprepared for the threat. Between June 2007 and June 2008, substantial and significant progress has been made in pandemic preparedness. The number of countries that have developed a pandemic preparedness plan has increased once again, and more countries have conducted simulation exercises of their plans. However, many plans remain unendorsed at the highest political level and lessons from simulations are not being included in plan revisions. This indicates that many plans are not legally or logistically feasible.
5.16 National authorities need to ensure (a) that necessary logistical and legislative provisions are made for social distancing measures, and (b) that pharmaceutical control strategies are implementable. A combination of social distancing and pharmaceutical measures is the most effective means for containing (or at least limiting) the spread of pandemic influenza. Not all countries are currently prepared to apply both types of response. Social distancing measures are included in the pandemic plans of the majority of countries (irrelevant of national income levels); some of these countries have yet to establish the logistical and legislative provisions required. Pharmaceutical interventions have been planned by a smaller number of responding countries (of which the majority are high‐income countries), however, the quality and feasibility of these strategies – as well as the availability of vaccines and antivirals – is unconfirmed. A combination of both pharmaceutical and social distancing measures will thus most likely only be available to higher income countries.
5.17 National Authorities should ensure that they have planned for the maintenance of essential services
during a pandemic. This will require increased engagement with the private sector on planning assumptions, responsibilities and expectations. Although some individual countries have made significant progress in pandemic planning for essential services beyond the health sector, this area of planning is still very limited in most countries with a lack of sector specific planning. Multi‐sectoral planning for the continuity of essential services is generally low, but correlates clearly with countries’ income levels (higher country income equals higher levels of preparedness). The engagement of civil society and the private sector is still relatively minor, despite their importance for sustainable multi‐sectoral planning.

71
5.18 Countries and regional organizations should engage in cross‐border pandemic preparedness planning
with their neighbours so as to limit potential impacts and tensions across borders and to ensure strategic coherence and interoperability during a pandemic. So far cross‐border pandemic preparedness is not addressed sufficiently. As a pandemic will have cross border impacts, transparent and collaborative cross‐border preparation is needed to achieve inter‐operability during a pandemic. This is particularly relevant for the implementation of social distancing measures, which in some countries’ planning involves border‐closures and travel restrictions that could have wider reaching socio‐economic impacts.
5.19 Successful pandemic preparedness increases the resilience of national institutions in the face of other emergencies: national authorities are encouraged to integrate pandemic planning into national disaster management structures so as to increase sustainability and broaden benefits. The integration of pandemic planning into national disaster management structures is essential for ensuring efficiency and sustainability of preparedness efforts. Many countries report some integration, but this is mostly limited to the national level structures.
5.20 Reports from National Authorities in wealthier countries suggest that they are better prepared than
those in poorer countries: given the interdependence of countries when responding to a pandemic, preparedness within poorer countries will be a critical element of the world’s readiness for the next pandemic. While there has been worldwide progress with development of pandemic preparedness plans, there are also great disparities in preparedness among countries. Political and financial commitment to pandemic readiness tends to be greater in countries that have experienced HPAI outbreaks and countries supported through regional political bodies. Three major categories of country preparedness can be identified: 1. Wealthier industrialized countries that have deepened and developed multi‐sectoral pandemic
preparations, in sectors other than health. 2. Middle‐income countries that have developed the animal health, communications and human health
components of their national plans, but have yet to prepare for continuity in sectors beyond health, including the provision of essential services, to mitigate the economic and social impacts of pandemic.
3. Low‐income countries that have not, during the past year, had the resources needed to advance their level of pandemic preparedness. They seek significant financial and technical support from international actors. They also anticipate putting pandemic preparedness within the context of wider crisis preparations.
5.21 It is essential that national pandemic preparedness efforts be undertaken jointly by all stakeholders –
representatives of public sector bodies (both local and national), private entities, civil society and red cross or red crescent societies, media organizations and faith groups. Pandemic preparedness efforts are designed to ensure continuity of essential services so as to mitigate the impact of an influenza pandemic. Reports from National Authorities reveal the importance of engaging all stakeholders in pandemic preparedness.
5.22 International organizations should continue to monitor the global state of pandemic readiness and seek ways to support poorer countries so that they can contribute adequately to the global effort. Pandemics are global threats. Effective pandemic preparedness means that all countries are prepared to a minimum standard, using compatible protocols, and institutional arrangements that are tailored to the capacities and needs of each country. Poorer countries will require significant financial and technical support to reach this standard: their pandemic preparedness efforts will help them to realize other development goals.

72
5.23 The threats posed by HPAI over the last 5 years have stimulated exceptional cross‐disciplinary, cross sector and cross boundary working practices. These offer a range of long term benefits, and have included: • Unprecedented collaboration amongst professionals in the animal and human health sectors at all
levels; • Institutional arrangements at the national and local level that bring stakeholders together: these have
fostered cross disciplinary understanding and information sharing; • Cross border and regional collaboration on preparations and response; • Recognition that emerging infectious diseases are a worldwide threat to health security; • The mobilization and implementation of multi‐sectoral responses; and • The potential for Pandemic Preparedness to contribute to resilience in the face of a range of other
hazards that threaten national infrastructure and essential services.
Next Steps 1. Authorities from all countries should:
(a) continue to generate and disseminate knowledge about the potential threats of HPAI and other animal diseases, and approaches to pandemic preparedness; (b) maintain vigilance so that existing and emerging pathogens are quickly identified and contained; (c) encourage transparency, increased investment, and political commitment to animal health services so as to ensure animal as well as human health security; and (d) ensure that surveillance, preparation and response measures are continually integrated, tested, reviewed and updated.
2. The desired level of pandemic preparedness should be agreed among all concerned entities at national level (with the help of international entities). Progress against this standard should be carefully recorded – at national and local level, testing should be repeated at intervals and the deficiencies identified should be systematically remedied.
3. During 2009, protocols, frameworks and indicators for longer term multi‐sectoral pandemic preparedness should be developed, and mechanisms proposed for them to be funded adequately (as part of multi‐hazard disaster preparedness) within the context of the International Health Regulations (2005).
4. Nations should take urgent steps to agree on, and pursue, a strategic framework for the better prevention of, preparation for and response to the health, social, economic and political impacts of infectious disease outbreaks and pandemics emerging at the at the animal‐human‐ecosystem‐interface.

73
Annex I: Country Tables Table 1. UNSIC Data Gathering Exercise Regional Country Breakdown (…) Did not participate in the exercise * UN response East Asia & Pacific Africa Middle East &
North Africa (MENA) Europe & Central Asia (ECA)
Americas
Afghanistan (Angola) Algeria Albania Argentina Australia Benin Bahrain Armenia (Bahamas, The) Bangladesh* Botswana (Djibouti) Austria Barbados* Bhutan Burkina Faso Egypt Azerbaijan Belize Brunei Darussalam Burundi* Iran (Belarus) Bolivia (Cambodia) (Cameroon) (Iraq) Belgium Brazil China* Cape Verde Israel Bosnia and Herzegovina Canada DPR Korea Central African Republic Jordan Bulgaria Chile India Chad (Kuwait) Croatia Colombia Indonesia Comoros Lebanon Czech Republic Costa Rica Japan (Republic of the Congo) (Libya) Cyprus Cuba Lao PDR Cote d’Ivoire Morocco Denmark Dominican Republic* Malaysia DR Congo Oman Estonia Ecuador* Maldives* (Equatorial Guinea) Palestine Finland El Salvador Mongolia (Eritrea) (Qatar) France Guatemala Myanmar Ethiopia Saudi Arabia (Georgia) Guyana (Nauru) Gabon Somalia* Germany Haiti Nepal Gambia (Sudan) Greece Honduras* New Zealand (Ghana) Syria Hungary Jamaica (Pacific Islands) Guinea Tunisia Ireland Mexico Pakistan * Guinea‐Bissau United Arab Emirates Italy Nicaragua (Papua New Guinea) (Kenya) Yemen (Kazakhstan) Panama Philippines Lesotho Kosovo* Paraguay* (Republic of Korea) (Liberia) Kyrgyz Republic Peru* Singapore Madagascar Latvia Suriname (Solomon Islands) Malawi* Liechtenstein Trinidad and Tobago Sri Lanka Mali (Lithuania) U.S.A. Thailand Mauritania Luxembourg Uruguay* Timor‐Leste* Mauritius Macedonia Venezuela* Vanuatu Mozambique Malta Vietnam Namibia Moldova Niger Montenegro Nigeria (Netherlands) (Rwanda) Norway Sao Tome and Principe Poland Senegal Portugal Seychelles Romania Sierra Leone (Russian Federation) South Africa St Helena Swaziland Serbia Tanzania Slovakia Togo (Slovenia) Uganda Spain Zambia Sweden Zimbabwe Switzerland Tajikistan Turkey Turkmenistan* United Kingdom (Ukraine) Uzbekistan* 25 36 16 43 28 Total Sent=178 Total Received=148

74
Table 2. List of Countries Interviewed by FAO
Sub‐Saharan Africa South and South East‐ Asia Central Asia North Africa and Middle East
Eastern Europe and Caucasus
Benin Botswana Burkina Faso Cameroon Chad Cote d’Ivoire Congo, Dem Rep. of Gabon Ghana Kenya Lesotho Liberia Madagascar Mali Mozambique Niger Nigeria Sierra Leone Sudan Tanzania Togo Uganda Zambia
Bangladesh Bhutan Cambodia China India Indonesia Laos Maldives Myanmar Nepal Sri Lanka Timor‐Leste Vietnam
Iran Kyrgyzstan Pakistan Tajikistan Turkey Turkmenistan
Egypt Jordan Lebanon Mauritania Yemen
Armenia Azerbaijan Bosnia and Herzegovina Georgia Kosovo Macedonia Serbia
23 13 6 5 7

75
Table 3. OIE PVS Evaluation Country Requests (as of 31 August 2008)
Africa America Asia and Pacific Europe Middle East
Algeria Barbados Bangladesh Albania Bahrain
Benin Belize Bhutan Armenia Jordan
Burkina Faso Bolivia Brunei Azerbaijan Kuwait
Burundi Brazil Cambodia Kazakhstan Lebanon
Cameroon Colombia Fiji Islands Kyrgyz Rep. Oman
Chad Costa Rica Indonesia Romania Palestine (non‐OIE member)
Cote d'Ivoire Dominican Republic Korea (Dem. People's Rep. of) Turkey Qatar
Dem Rep of the Congo Guyana Laos Ukraine Saudi Arabia
Djibouti Honduras Mongolia Uzbekistan Syria
Egypt Jamaica Nepal United Arab Emirates
Eritrea Mexico Philippines Yemen
Gabon Panama Sri Lanka
Ghana Paraguay Vietnam
Guinea Peru
Guinea Bissau Uruguay
Kenya
Lesotho
Madagascar
Malawi
Mali
Mauritania
Mauritius
Morocco
Mozambique
Namibia
Niger
Nigeria
Rwanda
Senegal
Sudan
Swaziland
Tanzania
Togo
Tunisia
Uganda
Zambia
36 15 13 9 11
Total Requests 84
PVS Missions Completed
32 10 9 8 6
Total Missions Complete 65

76
Table 4. Classification of Countries By Income according to the World Bank Classification of Economies as of July 2008* Low Income Lower Middle Income Upper Middle Income High Income
Afghanistan Albania Argentina Australia Bangladesh Algeria Belize Austria Benin Armenia Botswana Bahrain Burkina Faso Azerbaijan Brazil Barbados Burundi Bhutan Bulgaria Belgium Central African Republic Bolivia Chile Brunei Darussalam Chad Bosnia and Herzegovina Costa Rica Canada Comoros Cape Verde Croatia Cyprus Cote d'Ivoire China Cuba Czech Republic DPR Korea Colombia Gabon Denmark Ethiopia Dominican Republic Jamaica Estonia Gambia Ecuador Latvia Finland Guinea Egypt Lebanon France Guinea‐Bissau El Salvador Malaysia Germany Haiti Guatemala Mauritius Greece Kyrgyz Republic Guyana México Hungary Lao Honduras Montenegro Ireland Madagascar India Panama Israel Malawi Indonesia Poland Italy Mali Iran Romania Japan Mauritania Jordan Serbia Liechtenstein Mozambique Lesotho South Africa Luxembourg Myanmar Macedonia Suriname Malta Nepal Maldives The Republic of Seychelles New Zealand Niger Moldova Turkey Norway Nigeria Mongolia Uruguay Oman Pakistan Morocco Venezuela Portugal Sao Tomé and Principe Namibia Saudi Arabia Senegal Nicaragua Singapore Sierra Leone Palestine Slovak Republic Somalia Paraguay Spain Tajikistan Peru Sweden Tanzania Philippines Switzerland Togo Republic of Congo Trinidad and Tobago Uganda Sri Lanka United Arab Emirates Uzbekistan Swaziland United Kingdom Vietnam Syria United States Yemen Thailand Zambia Timor Leste Zimbabwe Tunisia Turkmenistan Vanuatu
40 42 27 37
* Economies are classified according to 2007 gross national income (GNI) per capita, calculated using the World Bank Atlas method. The groups are: low income, $935 or less; lower middle income, $936 ‐ $3,705; upper middle income, $3,706 ‐ $11,455; and high income, $11,456. For the purposes of this report, the usual sub‐classification of high income countries according to OECD or non‐OECD member status has been disregarded. Kosovo and St. Helena have not been integrated in the analyses by income level as these countries are not subject to World Bank classification.

77
Annex II: Additional Charts of Data from National Authorities Figure II.1
18/33
17/23
11/21
25/3510/15 81/127
26/33
10/23
17/21
16/35
9/15 78/127
11/337/23
7/21
6/35
1/15
32/127
0%
20%
40%
60%
80%
100%
Africa Americas Asia Pacific ECA MENA Global
Stakeholders Consulted in Forming National Action Plans for Avian and Human Influenza (Q6)
Scientific Actors
Civil Society Groups/ Non‐Governmental Organizations
Multilateral Development Banks
Figure II.2
19/31
20/23
20/27
34/3615/17
93/11728/35 18/25
18/25
39/41
13/15116/141
0%
20%
40%
60%
80%
100%
Africa Americas Asia Pacific ECA MENA Global
A Comparison of Epidemiological Capacity to Trace HPAI in Animals 2007‐2008 (Q8)
Capacity exits 2007 Capacity exits 2008
Figure II.3
16/31
9/26
19/27
34/36
13/17
78/12020/34
9/25
20/25
37/41
9/15 95/140
0%
20%
40%
60%
80%
100%
Africa Americas Asia Pacific ECA MENA Global
A Comparison of Availablility of Compensation Schemes for Poultry Owners Whose Birds Have Been Culled in controlling HPAI 2007 to 2008
Compensation available (2007) Compensation available (2008)

78
Figure II.4
25/43
61/88
12/43 22/88
6/435/88
0%
20%
40%
60%
80%
100%
Infected Non‐Infected
Availability Of Planned Or Implemented Livelihood Support Schemes By Infected/ Non‐Infected Countries [Q18]
No Support Scheme
Planned Support Scheme
Implemented with a Strategy Document and Funding Mechanism
Figure II.5
1/43
15/77
42/43
62/77
12/43
10/77
0%
20%
40%
60%
80%
100%
Infected Non‐Infected
Biosecurity Measures By Infected/ Non‐Infected Countries [Q 23]
No measures have been taken in any sector
Measures taken in any sector
Measures taken in all sectors Figure II.6
30/3930/36
25/26 34/34
1/39
8/36
3/26
10/34
0%
20%
40%
60%
80%
100%
Low income Lower middle incomeUpper middle income High income
Biosecurity Measures By Country Income Levels [Q 23]
Measures have been taken in any sector Measures have been taken in all sectors

79
Figure II.7
6/50 15/99
30/50
46/99
14/5038/99
0%
20%
40%
60%
80%
100%
Infected Non‐Infected
Existence Of Cross Border Collaboration On HPAI Prevention And Control By Infected/ Non‐Infected
Countries [Q26]
No Cross Border Collaboration Yes, Some Cross Border Collaboration
Yes, a sub‐regional strategy exists
Figure II.8
2/47 9/98
13/4739/98
32/47
50/98
0%
20%
40%
60%
80%
100%
Infected Non‐Infected
I nformat ion Sharing Between Animal and Hum an Health Sectors By I nfected/
Non‐I nfected Count ries [Q 24]
No Formal Mechanism Is In Place But Informal Sharing Of Informat ion Occurs
A Formal Mechanism Is In Place And Occasionally Used
A Formal Mechanism Is In Place And Used In Nearly Al l Cases
Figure II.9
1/47 3/987/47
28/98
39/47
67/98
0%
20%
40%
60%
80%
100%
Infected Non‐Infected
Government Endorsement Of National Pandemic Influenza Plans By Infected/ Non‐Infected Countries [Q31]
National Plan Not Endorsed
Plan Prepared But Not Yet Nationally Endorsed
Plan Prepared And Endorsed By National Government

80
Figure II.10
29/35
11/28
5/25
20/43
3/14
68/145
3/35 3/28 2/25
9/43
4/14
21/145
2/35
5/28
6/25
2/42
4/14
19/1451/35
9/28
12/25
12/42
3/1437/145
0%
20%
40%
60%
80%
100%
Africa Americas Asia Pacific ECA MENA Global
Level at Which Pandemic Preparedness Plans Have Been Tested With Tabletop Exercise or Simulation in Past 12 Months (Q 33)
Not Tested
Tested at Local Level Only
Tested at National Level Only
Tested at National and Local Level
Figure II.11
16/47
52/98
31/47
47/9824/47 47/8623/47 39/86
0%
20%
40%
60%
80%
100%
Infected Non‐Infected
Testing of Pandemic Preparedness Plans And Subsequent Revisions By Infected/ Non‐Infected Countries [Q33 & Q 34]
Not Tested Yes, Tested At Any Level
No Revisions Have Been Made After Test Yes, Revisions Have Been Made After Test
Figure II.12
6/35
17/28
20/25
23/43
11/14
77/145
7/30
2/19
13/23
18/38 5/10
45/20
0%
20%
40%
60%
80%
100%
Africa Americas Asia Pacific ECA MENA Global
National Pandemic Plan Has Been Revised Due to Lessons Learned After Simulations andTabletop Testing (Q 33 and Q 34)
Tested June 2007 ‐ June 2008Plan Has Been Revised in Light of Lessons Learned After Testing

81
Figure II.13
7/47
33/95
40/47
62/95
0%
20%
40%
60%
80%
100%
Infected Non‐Infected
Existence Of Nationally Endorsed Procedures For Pharmaceutical Responses By Infected/ Non‐
Infected Countries [Q 35]
No Nationally Endorsed Procedures for Pharmaceutical Responses
Yes, Nationally Endorsed Procedures for Pharmaceutical Responses Exist
Figure II.14
29/35
18/2815/25
21/42 8/16
91/146
10/35
14/28 12/2518/42
5/16
59/146
4/35
7/28 7/25
17/427/16
42/146
0%
20%
40%
60%
80%
100%
Africa Americas Asia Pacific ECA MENA Global
Existence of Government or Private Sector ‐ Initiated Business Continuity Planning (Q 40)
No Evidence of Planning
The Importance of Planning is Highlighted in the National Plan, But Sectors Have Yet to Develop Specific PlansThere is Evidence of Planning in Specific Sectors
Figure II.15
24/3519/26
15/2324/41
9/14 91/139
4/35
1/26
5/23
3/411/14 14/139
10/35 6/23
4/41
3/1422/126
8/35
4/26
6/229/41 30/139
4/35
0 1/232/41
2/14
9/139
2/22
2/410%
20%
40%
60%
80%
100%
Africa Americas Asia Pacific ECA MENA Total All Regions
Socially and Economically Disadvantaged Groups Addressed in the National Plan (Q 42)
No disadvantaged groups addressedEthnic Minorities
The Poor
The Elderly
Refugees
Internally Displaced Persons

82
Annex III: World Bank Operations Under the Global Program for Influenza Control and Human Pandemic Preparedness and Response (GPAI) Projects Approved up to April 30, 2008 Funding Sources (US$ millions) Region Country/Territory
Total Project Cost Approval Date IBRD IDA PHRD AHIF
Cameroon 1.27 18‐Oct‐07 ‐ ‐ ‐ 1.27Congo, Republic of 1.00 27‐Feb‐08 ‐ ‐ ‐ 1.00Liberia 0.09 28‐Nov‐06 ‐ ‐ ‐ 0.09 Malawi 1.00 16‐Apr‐07 ‐ ‐ ‐ 1.00 Mauritania 0.03 20‐Feb‐07 ‐ ‐ ‐ 0.03 Mozambique 0.10 7‐Jun‐07 ‐ ‐ ‐ 0.10 Niger 4.50 18‐Dec‐07 ‐ 4.50 ‐ ‐Nigeria 62.20 29‐Mar‐06 ‐ 50.00 ‐ ‐Sierra Leone 0.09 29‐Nov‐06 ‐ ‐ ‐ 0.09 Togo 0.56 17‐Dec‐07 ‐ 0.56 ‐Uganda 0.10 26‐Feb‐07 ‐ ‐ ‐ 0.10
Africa
Zambia 1.00 26‐Sep‐07 ‐ ‐ ‐ 1.00 Cambodia 11.00 5‐Mar‐07 ‐ 6.00 3.00 2.00 China 2.65 18‐Oct‐06 ‐ ‐ ‐ 2.65 Indonesia 15.00 15‐Dec‐06 ‐ ‐ 5.00 10.00 Lao PDR 15.96 29‐Jun‐06 ‐ 4.00 2.00 4.40 Mongolia 4.66 21‐Apr‐08 ‐ ‐ ‐ 4.66Myanmar 1.32 16‐May‐07 ‐ ‐ ‐ 1.32
East Asia & Pacific
Vietnam 44.20 3‐Aug‐04 ‐ 25.00 6.90 10.00 Albania 6.10 27‐Jun‐06 ‐ 5.00 0.80 ‐Armenia 11.33 2‐Jun‐06 ‐ 6.25 0.80 2.00 Azerbaijan 6.12 28‐Mar‐06 ‐ 5.15 ‐ ‐Bosnia‐Herzegovina 6.40 20‐Jun‐07 ‐ 5.00 ‐ ‐Georgia 11.87 31‐May‐06 ‐ 7.00 1.40 1.60 Kosovo 3.00 1‐Feb‐07 ‐ 3.00 ‐ ‐Kyrgyz Republic 9.00 9‐Feb‐06 ‐ 4.00 1.00 1.15Moldova 11.60 9‐Jun‐06 ‐ 8.00 0.50 1.00 Romania 47.70 8‐Sep‐06 37.70 ‐ ‐ ‐Tajikistan 6.80 29‐Jun‐06 ‐ 5.00 ‐ 1.50 Turkey 55.19 24‐Apr‐06 34.40 ‐ ‐ ‐Turkmenistan 1.97 16‐Nov‐07 ‐ ‐ ‐ 1.97
Europe & Central Asia
Uzbekistan 3.21 2‐May‐07 ‐ ‐ ‐ 2.96 Argentina 2.00 23‐Jan‐07 2.00 ‐ ‐ ‐Argentina, Bolivia, Brazil, 0.50 22‐Dec‐06 ‐ ‐ ‐ 0.50 Haiti 1.00 7‐Feb‐08 ‐ ‐ ‐ 1.00
Latin America & Caribbean
Uruguay 9.55 19‐Dec‐06 0.50 ‐ ‐ ‐Djibouti 2.54 5‐Jun‐06 ‐ 0.43 ‐ 2.11 Egypt 10.34 13‐Jun‐07 2.72 ‐ ‐ 7.14 Iran 6.10 29‐Dec‐06 6.10 ‐ ‐ ‐Middle East Regional 0.98 19‐Dec‐06 ‐ ‐ ‐ 0.98 Tunisia 0.65 9‐Apr‐08 ‐ ‐ ‐ 0.65West Bank & Gaza 13.00 7‐Sep‐06 10.00 ‐ ‐ 3.00
Middle East & North Africa
Yemen 0.06 5‐Feb‐07 ‐ ‐ ‐ 0.06

83
Projects Approved up to April 30, 2008 Funding Sources (US$ millions) Region Country/Territory
Total Project Cost Approval Date IBRD IDA PHRD AHIF
Afghanistan 13.00 11‐Jan‐07 ‐ 8.00 ‐ 5.00 Bangladesh 18.00 28‐Jun‐07 ‐ 16.00 ‐ 2.00Bhutan 2.50 19‐Jul‐07 ‐ ‐ ‐ 1.30India 88.64 13‐Feb‐07 ‐ 32.63 ‐ ‐Nepal 18.20 19‐Jan‐07 ‐ 18.20 ‐ ‐
South Asia
Sri Lanka 4.93 15‐Oct‐07 ‐ 3.50 ‐ 1.43Total 539.01 93.9 217.22 21.4 77.06Number of projects 53 7 21 9 36 Projects approved since April 30, 2008:
IBRD/IDA: Uganda; AHIF: Honduras, Uganda, Yemen Pipeline for fiscal 2009: IBRD/IDA: Haiti AHIF/PHRD: Bangladesh, Benin, Brazil, Burkina Faso, Burundi, Colombia, El Salvador, Eritrea, Ghana, Guatemala, Guinea, Lesotho, Liberia, Madagascar, Mali, Mauritania, Morocco, Mozambique, Namibia, Nicaragua, Panama, Pakistan, Peru, Senegal, Sierra Leone, Sudan, Syrian Arab Republic, Togo Tunisia, Uganda.
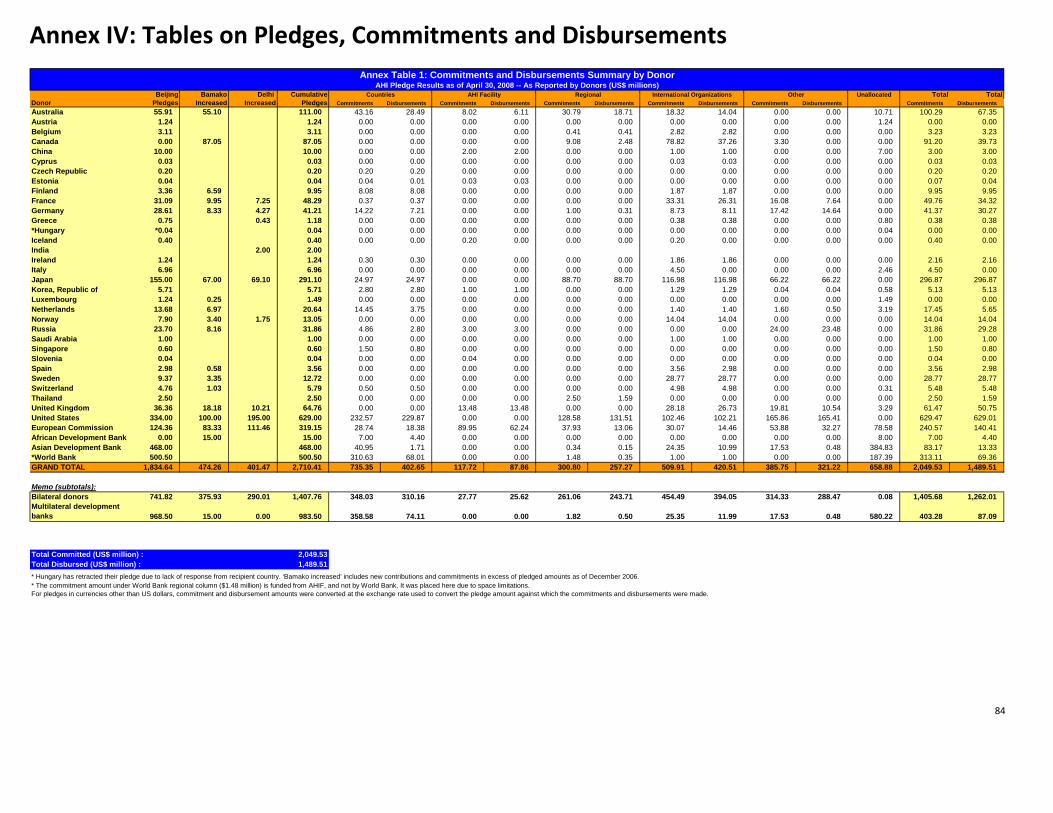
84
Annex IV: Tables on Pledges, Commitments and Disbursements
Beijing Bamako Delhi Cumulative Unallocated Total TotalDonor Pledges Increased Increased Pledges Commitments Disbursements Commitments Disbursements Commitments Disbursements Commitments Disbursements Commitments Disbursements Commitments DisbursementsAustralia 55.91 55.10 111.00 43.16 28.49 8.02 6.11 30.79 18.71 18.32 14.04 0.00 0.00 10.71 100.29 67.35Austria 1.24 1.24 0.00 0.00 0.00 0.00 0.00 0.00 0.00 0.00 0.00 0.00 1.24 0.00 0.00Belgium 3.11 3.11 0.00 0.00 0.00 0.00 0.41 0.41 2.82 2.82 0.00 0.00 0.00 3.23 3.23Canada 0.00 87.05 87.05 0.00 0.00 0.00 0.00 9.08 2.48 78.82 37.26 3.30 0.00 0.00 91.20 39.73China 10.00 10.00 0.00 0.00 2.00 2.00 0.00 0.00 1.00 1.00 0.00 0.00 7.00 3.00 3.00Cyprus 0.03 0.03 0.00 0.00 0.00 0.00 0.00 0.00 0.03 0.03 0.00 0.00 0.00 0.03 0.03Czech Republic 0.20 0.20 0.20 0.20 0.00 0.00 0.00 0.00 0.00 0.00 0.00 0.00 0.00 0.20 0.20Estonia 0.04 0.04 0.04 0.01 0.03 0.03 0.00 0.00 0.00 0.00 0.00 0.00 0.00 0.07 0.04Finland 3.36 6.59 9.95 8.08 8.08 0.00 0.00 0.00 0.00 1.87 1.87 0.00 0.00 0.00 9.95 9.95France 31.09 9.95 7.25 48.29 0.37 0.37 0.00 0.00 0.00 0.00 33.31 26.31 16.08 7.64 0.00 49.76 34.32Germany 28.61 8.33 4.27 41.21 14.22 7.21 0.00 0.00 1.00 0.31 8.73 8.11 17.42 14.64 0.00 41.37 30.27Greece 0.75 0.43 1.18 0.00 0.00 0.00 0.00 0.00 0.00 0.38 0.38 0.00 0.00 0.80 0.38 0.38*Hungary *0.04 0.04 0.00 0.00 0.00 0.00 0.00 0.00 0.00 0.00 0.00 0.00 0.04 0.00 0.00Iceland 0.40 0.40 0.00 0.00 0.20 0.00 0.00 0.00 0.20 0.00 0.00 0.00 0.00 0.40 0.00India 2.00 2.00Ireland 1.24 1.24 0.30 0.30 0.00 0.00 0.00 0.00 1.86 1.86 0.00 0.00 0.00 2.16 2.16Italy 6.96 6.96 0.00 0.00 0.00 0.00 0.00 0.00 4.50 0.00 0.00 0.00 2.46 4.50 0.00Japan 155.00 67.00 69.10 291.10 24.97 24.97 0.00 0.00 88.70 88.70 116.98 116.98 66.22 66.22 0.00 296.87 296.87Korea, Republic of 5.71 5.71 2.80 2.80 1.00 1.00 0.00 0.00 1.29 1.29 0.04 0.04 0.58 5.13 5.13Luxembourg 1.24 0.25 1.49 0.00 0.00 0.00 0.00 0.00 0.00 0.00 0.00 0.00 0.00 1.49 0.00 0.00Netherlands 13.68 6.97 20.64 14.45 3.75 0.00 0.00 0.00 0.00 1.40 1.40 1.60 0.50 3.19 17.45 5.65Norway 7.90 3.40 1.75 13.05 0.00 0.00 0.00 0.00 0.00 0.00 14.04 14.04 0.00 0.00 0.00 14.04 14.04Russia 23.70 8.16 31.86 4.86 2.80 3.00 3.00 0.00 0.00 0.00 0.00 24.00 23.48 0.00 31.86 29.28Saudi Arabia 1.00 1.00 0.00 0.00 0.00 0.00 0.00 0.00 1.00 1.00 0.00 0.00 0.00 1.00 1.00Singapore 0.60 0.60 1.50 0.80 0.00 0.00 0.00 0.00 0.00 0.00 0.00 0.00 0.00 1.50 0.80Slovenia 0.04 0.04 0.00 0.00 0.04 0.00 0.00 0.00 0.00 0.00 0.00 0.00 0.00 0.04 0.00Spain 2.98 0.58 3.56 0.00 0.00 0.00 0.00 0.00 0.00 3.56 2.98 0.00 0.00 0.00 3.56 2.98Sweden 9.37 3.35 12.72 0.00 0.00 0.00 0.00 0.00 0.00 28.77 28.77 0.00 0.00 0.00 28.77 28.77Switzerland 4.76 1.03 5.79 0.50 0.50 0.00 0.00 0.00 0.00 4.98 4.98 0.00 0.00 0.31 5.48 5.48Thailand 2.50 2.50 0.00 0.00 0.00 0.00 2.50 1.59 0.00 0.00 0.00 0.00 0.00 2.50 1.59United Kingdom 36.36 18.18 10.21 64.76 0.00 0.00 13.48 13.48 0.00 0.00 28.18 26.73 19.81 10.54 3.29 61.47 50.75United States 334.00 100.00 195.00 629.00 232.57 229.87 0.00 0.00 128.58 131.51 102.46 102.21 165.86 165.41 0.00 629.47 629.01European Commission 124.36 83.33 111.46 319.15 28.74 18.38 89.95 62.24 37.93 13.06 30.07 14.46 53.88 32.27 78.58 240.57 140.41African Development Bank 0.00 15.00 15.00 7.00 4.40 0.00 0.00 0.00 0.00 0.00 0.00 0.00 0.00 8.00 7.00 4.40Asian Development Bank 468.00 468.00 40.95 1.71 0.00 0.00 0.34 0.15 24.35 10.99 17.53 0.48 384.83 83.17 13.33*World Bank 500.50 500.50 310.63 68.01 0.00 0.00 1.48 0.35 1.00 1.00 0.00 0.00 187.39 313.11 69.36GRAND TOTAL 1,834.64 474.26 401.47 2,710.41 735.35 402.65 117.72 87.86 300.80 257.27 509.91 420.51 385.75 321.22 658.88 2,049.53 1,489.51
Memo (subtotals):Bilateral donors 741.82 375.93 290.01 1,407.76 348.03 310.16 27.77 25.62 261.06 243.71 454.49 394.05 314.33 288.47 0.08 1,405.68 1,262.01Multilateral development banks 968.50 15.00 0.00 983.50 358.58 74.11 0.00 0.00 1.82 0.50 25.35 11.99 17.53 0.48 580.22 403.28 87.09
Total Committed (US$ million) : 2,049.53Total Disbursed (US$ million) : 1,489.51* Hungary has retracted their pledge due to lack of response from recipient country. ‘Bamako increased’ includes new contributions and commitments in excess of pledged amounts as of December 2006. * The commitment amount under World Bank regional column ($1.48 million) is funded from AHIF, and not by World Bank. It was placed here due to space limitations.For pledges in currencies other than US dollars, commitment and disbursement amounts were converted at the exchange rate used to convert the pledge amount against which the commitments and disbursements were made.
Annex Table 1: Commitments and Disbursements Summary by DonorAHI Pledge Results as of April 30, 2008 -- As Reported by Donors (US$ millions)
Countries AHI Facility Regional International Organizations Other

85
Annex Table 2: Details by Recipient Country
AHI Pledge Results as of April 30, 2007 ‐‐ As Reported by Donors (US$ millions)
Committed (USD million)
Disbursed (USD million)
Region Recipient Country Donor a/
In Kind b/
Grants c/
Loans a/
In Kind b/
Grants c/
Loans Total Commt.
Total Disb.
AHIF 0.00 5.00 0.00 0.00 0.50 0.00
US 1.40 1.28 0.00 1.40 1.28 0.00
World Bank 0.00 0.00 8.00 0.00 0.00 0.50
SAR Afghanistan Total 1.40 6.28 8.00 1.40 1.78 0.50 15.68 3.68
PHRD 0.00 0.80 0.00 0.00 0.10 0.00
US 1.10 0.00 0.00 1.10 0.00 0.00
World Bank 0.00 0.00 5.00 0.00 0.00 1.18
ECA Albania Total 1.10 0.80 5.00 1.10 0.10 1.18 6.90 2.38
US 0.00 1.07 0.00 0.00 1.07 0.00
AFR Angola Total 0.00 1.07 0.00 0.00 1.07 0.00 1.07 1.07
US 0.00 1.35 0.00 0.00 1.35 0.00
World Bank 0.00 0.00 2.00 0.00 0.00 0.00
LCR Argentina Total 0.00 1.35 2.00 0.00 1.35 0.00 3.35 1.35
AHIF 0.00 2.00 0.00 0.00 0.44 0.00
PHRD 0.00 0.80 0.00 0.00 0.47 0.00
Russia 0.38 0.00 0.00 0.00 0.00 0.00
US 2.56 0.73 0.00 2.56 0.73 0.00
World Bank 0.00 0.00 6.25 0.00 0.00 3.06
ECA Armenia Total 2.94 3.53 6.25 2.56 1.64 3.06 12.71 7.25
ADB 0.05 0.00 0.00 0.05 0.00 0.00
Russia 0.54 0.00 0.00 0.36 0.00 0.00
US 3.85 0.00 0.00 3.85 0.00 0.00
World Bank 0.00 0.00 5.15 0.00 0.00 2.67
ECA Azerbaijan Total 4.44 0.00 5.15 4.26 0.00 2.67 9.59 6.93
AHIF 0.00 2.00 0.00 0.00 0.15 0.00
US 3.84 3.13 0.00 3.84 3.13 0.00
World Bank 0.00 0.00 16.00 0.00 0.00 0.50
SAR Bangladesh Total 3.84 5.13 16.00 3.84 3.28 0.50 24.97 7.62
Russia 0.54 0.00 0.00 0.36 0.00 0.00
ECA Belarus Total 0.54 0.00 0.00 0.36 0.00 0.00 0.54 0.36
AfDB 0.00 0.50 0.00 0.00 0.38 0.00
AFR Benin Total 0.00 0.50 0.00 0.00 0.38 0.00 0.50 0.38
AHIF 0.00 1.30 0.00 0.00 0.00 0.00
SAR Bhutan Total 0.00 1.30 0.00 0.00 0.00 0.00 1.30 0.00
US 0.32 0.00 0.00 0.32 0.00 0.00
LCR Bolivia Total 0.32 0.00 0.00 0.32 0.00 0.00 0.32 0.32
US 0.40 0.00 0.00 0.40 0.00 0.00
World Bank 0.00 0.00 5.00 0.00 0.00 0.00
ECA Bosnia‐Herzegovina Total 0.40 0.00 5.00 0.40 0.00 0.00 5.40 0.40
US 0.02 1.15 0.00 0.02 1.15 0.00
LCR Brazil Total 0.02 1.15 0.00 0.02 1.15 0.00 1.17 1.17
US 1.02 0.00 0.00 1.02 0.00 0.00
ECA Bulgaria Total 1.02 0.00 0.00 1.02 0.00 0.00 1.02 1.02
AfDB 0.00 0.50 0.00 0.00 0.38 0.00
US 0.20 0.00 0.00 0.20 0.00 0.00
AFR Burkina Faso Total 0.20 0.50 0.00 0.20 0.38 0.00 0.70 0.58
US 0.00 0.00 0.00 0.00 0.00 0.00
AFR Burundi Total 0.00 0.00 0.00 0.00 0.00 0.00 0.00 0.00
ADB 0.00 0.00 9.00 0.00 0.00 0.45
AHIF 0.00 2.00 0.00 0.00 0.00 0.00
Australia 0.00 1.45 0.00 0.00 1.45 0.00
Germany 0.00 0.00 0.00 0.00 0.00 0.00
US 9.20 4.45 0.00 9.20 4.25 0.00
PHRD 0.00 3.00 0.00 0.00 0.00 0.00
World Bank 0.00 0.00 6.00 0.00 0.00 0.00
EAP Cambodia Total 9.20 10.90 15.00 9.20 5.70 0.45 35.10 15.35

86
Committed (USD million)
Disbursed (USD million)
Region Recipient Country Donor a/
In Kind b/
Grants c/
Loans a/
In Kind b/
Grants c/
Loans Total Commt.
Total Disb.
AHIF 0.00 1.27 0.00 0.00 0.00 0.00
AfDB 0.00 0.50 0.00 0.00 0.38 0.00
US 0.21 0.00 0.00 0.21 0.00 0.00
AFR Cameroon Total 0.21 1.77 0.00 0.21 0.38 0.00 1.98 0.58
AfDB 0.00 0.50 0.00 0.00 0.38 0.00
US 0.00 0.00 0.00 0.00 0.00 0.00
AFR Chad Total 0.00 0.50 0.00 0.00 0.38 0.00 0.50 0.38
US 0.04 0.00 0.00 0.04 0.00 0.00
LCR Chile Total 0.04 0.00 0.00 0.04 0.00 0.00 0.04 0.04
AHIF 0.00 2.65 0.00 0.00 0.42 0.00
Australia 0.00 0.38 0.00 0.00 0.38 0.00
Netherlands 0.00 0.04 0.00 0.00 0.04 0.00
US 2.56 7.47 0.00 2.06 7.47 0.00
EAP China Total 2.56 10.54 0.00 2.06 8.31 0.00 13.10 10.37
US 0.11 0.00 0.00 0.11 0.00 0.00
LCR Colombia Total 0.11 0.00 0.00 0.11 0.00 0.00 0.11 0.11
US 0.12 1.19 0.00 0.12 1.24 0.00
France 0.00 0.24 0.00 0.00 0.24 0.00
AFR Congo (DRC) Total 0.12 1.43 0.00 0.12 1.48 0.00 1.55 1.60
AHIF 0.00 1.00 0.00 0.00 0.00 0.00
US 0.01 0.90 0.00 0.01 0.15 0.00
AFR Congo (ROC) Total 0.01 1.90 0.00 0.01 0.15 0.00 1.91 0.16
US 0.00 0.00 0.00 0.00 0.00 0.00
LCR Costa Rica Total 0.00 0.00 0.00 0.00 0.00 0.00 0.00 0.00
AfDB 0.00 0.50 0.00 0.00 0.23 0.00
European Commission 0.00 0.75 0.00 0.00 0.37 0.00
US 0.05 0.72 0.00 0.05 0.72 0.00
AFR Cote D'Ivoire Total 0.05 1.97 0.00 0.05 1.32 0.00 2.03 1.37
US 0.50 0.00 0.00 0.50 0.00 0.00
ECA Cyprus Total 0.50 0.00 0.00 0.50 0.00 0.00 0.50 0.50
AfDB 0.00 0.50 0.00 0.00 0.23 0.00
AHIF 0.00 2.11 0.00 0.00 0.73 0.00
US 0.10 0.00 0.00 0.10 0.00 0.00
World Bank 0.00 0.00 0.43 0.00 0.00 0.43
MNA Djibouti Total 0.10 2.61 0.43 0.10 0.96 0.43 3.14 1.48
US 0.03 0.00 0.00 0.03 0.00 0.00
LCR Dominican Republic Total 0.03 0.00 0.00 0.03 0.00 0.00 0.03 0.03
Australia 0.00 3.82 0.00 0.00 2.37 0.00
US 0.88 0.00 0.00 0.88 0.00 0.00
EAP East Timor Total 0.88 3.82 0.00 0.88 2.37 0.00 4.70 3.25
US 0.00 0.00 0.00 0.00 0.00 0.00
LCR Ecuador Total 0.00 0.00 0.00 0.00 0.00 0.00 0.00 0.00
AfDB 0.00 0.50 0.00 0.00 0.50 0.00
AHIF 0.00 7.14 0.00 0.00 0.00 0.00
US 9.51 0.50 0.00 9.51 0.50 0.00
Korea, Republic of 0.00 0.00 0.00 0.00 0.00 0.00
World Bank 0.00 0.00 2.72 0.00 0.00 2.55
MNA Egypt Total 9.51 8.14 2.72 9.51 1.00 2.55 20.37 13.06
US 0.02 0.00 0.00 0.02 0.00 0.00
LCR El Salvador Total 0.02 0.00 0.00 0.02 0.00 0.00 0.02 0.02
European Commission 0.00 1.00 0.00 0.00 0.62 0.00
US 0.01 0.00 0.00 0.01 0.00 0.00
AFR Eritrea Total 0.01 1.00 0.00 0.01 0.62 0.00 1.01 0.63
Ireland 0.00 0.15 0.00 0.00 0.15 0.00
US 2.88 0.60 0.00 2.88 0.60 0.00
AFR Ethiopia Total 2.88 0.75 0.00 2.88 0.75 0.00 3.63 3.63

87
Committed (USD million)
Disbursed (USD million)
Region Recipient Country Donor a/
In Kind b/
Grants c/
Loans a/
In Kind b/
Grants c/
Loans Total Commt.
Total Disb.
AHIF 0.00 1.60 0.00 0.00 0.43 0.00
PHRD 0.00 1.40 0.00 0.00 0.18 0.00
US 1.56 0.70 0.00 1.56 0.70 0.00
World Bank 0.00 0.00 7.00 0.00 0.00 2.16
ECA Georgia Total 1.56 3.70 7.00 1.56 1.31 2.16 12.26 5.03
AfDB 0.00 0.50 0.00 0.00 0.38 0.00
European Commission 0.00 3.55 0.00 0.00 2.25 0.00
US 2.30 0.00 0.00 2.30 0.00 0.00
AFR Ghana Total 2.30 4.05 0.00 2.30 2.63 0.00 6.35 4.93
US 0.15 0.00 0.00 0.15 0.00 0.00
ECA Greenland Total 0.15 0.00 0.00 0.15 0.00 0.00 0.15 0.15
US 0.02 0.00 0.00 0.02 0.00 0.00
LCR Guatemala Total 0.02 0.00 0.00 0.02 0.00 0.00 0.02 0.02
AHIF 0.00 1.00 0.00 0.00 0.00 0.00
US 0.10 0.00 0.00 0.10 0.00 0.00
LCR Haiti Total 0.10 1.00 0.00 0.10 0.00 0.00 1.10 0.10
US 0.01 0.00 0.00 0.01 0.00 0.00
LCR Honduras Total 0.01 0.00 0.00 0.01 0.00 0.00 0.01 0.01
US 0.00 0.00 0.00 0.00 0.00 0.00
ECA Hungary Total 0.00 0.00 0.00 0.00 0.00 0.00 0.00 0.00
US 1.55 3.19 0.00 1.55 3.19 0.00
World Bank 0.00 0.00 32.63 0.00 0.00 0.00
SAR India Total 1.55 3.19 32.63 1.55 3.19 0.00 37.36 4.73
ADB 0.40 0.00 0.00 0.09 0.00 0.00
AHIF 0.00 10.00 0.00 0.00 1.00 0.00
Australia 0.00 25.97 0.00 0.00 16.65 0.00
Germany 0.00 9.24 0.00 0.00 4.85 0.00
Japan 0.00 16.16 0.00 0.00 16.16 0.00
Korea ROK 0.25 0.00 0.00 0.25 0.00 0.00
Netherlands 12.00 0.00 0.00 2.20 0.00 0.00
PHRD 0.00 5.00 0.00 0.00 0.50 0.00
Singapore 0.60 0.90 0.00 0.60 0.20 0.00
US 39.18 8.45 0.00 39.10 8.35 0.00
EAP Indonesia Total 52.43 75.72 0.00 42.23 47.71 0.00 128.15 89.94
World Bank 0.00 0.00 6.10 0.00 0.00 0.18
MNA Iran Total 0.00 0.00 6.10 0.00 0.00 0.18 6.10 0.18
Korea, Republic of 0.86 0.00 0.00 0.86 0.00 0.00
US 0.91 0.00 0.00 0.61 0.00 0.00
MNA Iraq Total 1.77 0.00 0.00 1.47 0.00 0.00 1.77 1.47
US 0.02 0.00 0.00 0.02 0.00 0.00
LCR Jamaica Total 0.02 0.00 0.00 0.02 0.00 0.00 0.02 0.02
US 0.02 0.00 0.00 0.02 0.00 0.00
MNA Jordan Total 0.02 0.00 0.00 0.02 0.00 0.00 0.02 0.02
Russia 0.86 0.00 0.00 0.86 0.00 0.00
US 0.45 0.45 0.00 0.45 0.52 0.00
ECA Kazakhstan Total 1.31 0.45 0.00 1.31 0.52 0.00 1.76 1.83
AfDB 0.00 0.50 0.00 0.00 0.00 0.00
US 1.06 5.05 0.00 1.06 4.45 0.00
AFR Kenya Total 1.06 5.55 0.00 1.06 4.45 0.00 6.61 5.51
Australia 0.00 0.61 0.00 0.00 0.61 0.00
European Commission 0.00 0.00 0.00 0.00 0.00 0.00
Korea, Republic of 1.27 0.00 0.00 1.27 0.00 0.00
EAP Korea, DPR Total 1.27 0.61 0.00 1.27 0.61 0.00 1.88 1.88
US 0.00 0.48 0.00 0.00 0.48 0.00
EAP Korea, Republic of 0.00 0.48 0.00 0.00 0.48 0.00 0.48 0.48
World Bank 0.00 0.00 3.00 0.00 0.00 0.30
ECA Kosovo Total 0.00 0.00 3.00 0.00 0.00 0.30 3.00 0.30

88
Committed (USD million)
Disbursed (USD million)
Region Recipient Country Donor a/
In Kind b/
Grants c/
Loans a/
In Kind b/
Grants c/
Loans Total Commt.
Total Disb.
AHIF 0.00 1.15 0.00 0.00 0.00 0.00
PHRD 0.00 1.00 0.00 0.00 0.45 0.00
Russia 0.38 0.00 0.00 0.00 0.00 0.00
US 0.10 0.00 0.00 0.10 0.00 0.00
World Bank 0.00 0.00 4.00 0.00 0.00 1.69
ECA Kyrgyzstan Total 0.48 2.15 4.00 0.10 0.45 1.69 6.63 2.24
ADB 0.00 0.00 6.00 0.00 0.00 0.82
AHIF 0.00 4.40 0.00 0.00 0.75 0.00
Germany 0.00 0.00 0.00 0.00 0.00 0.00
Korea, Republic of 0.00 0.22 0.00 0.00 0.22 0.00
PHRD 0.00 2.00 0.00 0.00 0.32 0.00
US 7.31 3.99 0.00 7.31 3.84 0.00
World Bank 0.00 0.00 4.00 0.00 0.00 1.11
EAP Lao PDR Total 7.31 10.61 10.00 7.31 5.13 1.93 27.93 14.37
Ireland 0.00 0.15 0.00 0.00 0.15 0.00
AFR Lesotho Total 0.00 0.15 0.00 0.00 0.15 0.00 0.15 0.15
AHIF 0.00 0.09 0.00 0.00 0.08 0.00
AFR Liberia Total 0.00 0.09 0.00 0.00 0.08 0.00 0.09 0.08
US 0.01 1.25 0.00 0.01 1.25 0.00
MNA Libya Total 0.01 1.25 0.00 0.01 1.25 0.00 1.26 1.26
US 0.50 0.00 0.00 0.50 0.00 0.00
ECA Macedonia, FYR Total 0.50 0.00 0.00 0.50 0.00 0.00 0.50 0.50
AHIF 0.00 1.00 0.00 0.00 0.20 0.00
US 0.60 0.00 0.00 0.60 0.00 0.00
AFR Malawi Total 0.60 1.00 0.00 0.60 0.20 0.00 1.60 0.80
ADB 0.40 0.00 0.00 0.09 0.00 0.00
US 0.02 0.96 0.00 0.02 0.96 0.00
EAP Malaysia Total 0.42 0.96 0.00 0.10 0.96 0.00 1.37 1.06
AfDB 0.00 0.50 0.00 0.00 0.23 0.00
European Commission 0.00 2.49 0.00 0.00 1.24 0.00
US 0.26 0.00 0.00 0.26 0.00 0.00
AFR Mali Total 0.26 2.99 0.00 0.26 1.47 0.00 3.25 1.72
AHIF 0.00 0.03 0.00 0.00 0.03 0.00
AFR Mauritania Total 0.00 0.03 0.00 0.00 0.03 0.00 0.03 0.03
US 0.32 6.43 0.00 0.32 6.43 0.00
LCR Mexico Total 0.32 6.43 0.00 0.32 6.43 0.00 6.75 6.75
AHIF 0.00 1.00 0.00 0.00 0.29 0.00
PHRD 0.00 0.50 0.00 0.00 0.23 0.00
Russia 0.38 0.00 0.00 0.00 0.00 0.00
US 1.51 0.00 0.00 1.51 0.00 0.00
World Bank 0.00 0.00 8.00 0.00 0.00 1.90
ECA Moldova Total 1.89 1.50 8.00 1.51 0.52 1.90 11.39 3.93
AHIF 0.00 4.67 0.00 0.00 0.00 0.00
Korea, Republic of 0.00 0.00 0.00 0.00 0.00 0.00
US 0.95 1.50 0.00 0.95 1.50 0.00
EAP Mongolia Total 0.95 6.17 0.00 0.95 1.50 0.00 7.12 2.45
US 0.00 1.03 0.00 0.00 1.03 0.00
MNA Morocco Total 0.00 1.03 0.00 0.00 1.03 0.00 1.03 1.03
AHIF 0.00 0.10 0.00 0.00 0.05 0.00
US 0.68 0.00 0.00 0.68 0.00 0.00
AFR Mozambique Total 0.68 0.10 0.00 0.68 0.05 0.00 0.78 0.73
AHIF 0.00 1.32 0.00 0.00 0.00 0.00
Australia 0.00 0.76 0.00 0.00 0.76 0.00
European Commission 0.00 0.00 0.00 0.00 0.00 0.00
US 1.07 0.00 0.00 1.07 0.00 0.00
EAP Myanmar Total 1.07 2.08 0.00 1.07 0.76 0.00 3.15 1.83

89
Committed (USD million)
Disbursed (USD million)
Region Recipient Country Donor a/
In Kind b/
Grants c/
Loans a/
In Kind b/
Grants c/
Loans Total Commt.
Total Disb.
US 1.08 0.00 0.00 1.08 0.00 0.00
World Bank 0.00 0.00 18.20 0.00 0.00 2.06
SAR Nepal Total 1.08 0.00 18.20 1.08 0.00 2.06 19.28 3.14
US 0.01 0.00 0.00 0.01 0.00 0.00
LCR Nicaragua Total 0.01 0.00 0.00 0.01 0.00 0.00 0.01 0.01
AfDB 0.00 0.50 0.00 0.00 0.38 0.00
US 0.20 0.00 0.00 0.20 0.00 0.00
France 0.00 0.13 0.00 0.00 0.13 0.00
World Bank 0.00 0.00 4.50 0.00 0.00 0.00
AFR Niger Total 0.20 0.63 4.50 0.20 0.51 0.00 5.33 0.71
AfDB 0.00 0.50 0.00 0.00 0.38 0.00
Japan 0.00 0.73 0.00 0.00 0.73 0.00
Korea, Republic of 0.00 0.20 0.00 0.00 0.20 0.00
US 5.42 1.48 0.00 5.42 1.48 0.00
World Bank 0.00 0.00 50.00 0.00 0.00 30.18
AFR Nigeria Total 5.42 2.91 50.00 5.42 2.79 30.18 58.33 38.39
US 0.96 0.93 0.00 0.96 0.93 0.00
SAR Pakistan Total 0.96 0.93 0.00 0.96 0.93 0.00 1.88 1.88
US 0.15 0.00 0.00 0.15 0.00 0.00
LCR Panama Total 0.15 0.00 0.00 0.15 0.00 0.00 0.15 0.15
Australia 0.00 4.66 0.00 0.00 1.30 0.00
EAP Papua New Guinea Total 0.00 4.66 0.00 0.00 1.30 0.00 4.66 1.30
US 0.01 1.18 0.00 0.01 1.18 0.00
LCR Peru Total 0.01 1.18 0.00 0.01 1.18 0.00 1.18 1.18
ADB 0.40 0.00 0.00 0.09 0.00 0.00
Australia 0.00 0.15 0.00 0.00 0.15 0.00
US 1.73 1.23 0.00 1.73 1.23 0.00
EAP Philippines Total 2.13 1.38 0.00 1.82 1.38 0.00 3.51 3.20
European Commission 0.00 0.62 0.00 0.00 0.62 0.00
Germany 0.00 0.00 0.00 0.00 0.00 0.00
US 2.51 0.63 0.00 2.51 0.00 0.00
World Bank 0.00 0.00 37.70 0.00 0.00 0.77
ECA Romania Total 2.51 1.25 37.70 2.51 0.62 0.77 41.45 3.90
US 1.90 0.45 0.00 1.90 0.45 0.00
ECA Russia Total 1.90 0.45 0.00 1.90 0.45 0.00 2.35 2.35
US 0.10 0.70 0.00 0.10 0.70 0.00
AFR Rwanda Total 0.10 0.70 0.00 0.10 0.70 0.00 0.80 0.80
US 0.00 0.00 0.00 0.00 0.00 0.00
MNA Saudi Arabia Total 0.00 0.00 0.00 0.00 0.00 0.00 0.00 0.00
European Commission 0.00 2.48 0.00 0.00 1.24 0.00
US 0.58 0.00 0.00 0.58 0.00 0.00
AFR Senegal Total 0.58 2.48 0.00 0.58 1.24 0.00 3.06 1.82
US 0.45 0.00 0.00 0.45 0.00 0.00
ECA Serbia&Montenegro Total 0.45 0.00 0.00 0.45 0.00 0.00 0.45 0.45
AHIF 0.00 0.09 0.00 0.00 0.07 0.00
AFR Sierra Leone Total 0.00 0.09 0.00 0.00 0.07 0.00 0.09 0.07
US 3.13 1.00 0.00 3.13 1.60 0.00
AFR South Africa Total 3.13 1.00 0.00 3.13 1.60 0.00 4.13 4.73
AHIF 0.00 1.43 0.00 0.00 0.00 0.00
US 0.91 0.00 0.00 0.91 0.00 0.00
World Bank 0.00 0.00 3.50 0.00 0.00 0.00
SAR Sri Lanka Total 0.91 1.43 3.50 0.91 0.00 0.00 5.84 0.91
AfDB 0.00 0.50 0.00 0.00 0.23 0.00
European Commission 0.00 7.46 0.00 0.00 3.73 0.00
US 0.20 0.00 0.00 0.20 0.00 0.00
AFR Sudan Total 0.20 7.96 0.00 0.20 3.96 0.00 8.16 4.16

90
Committed (USD million)
Disbursed (USD million)
Region Recipient Country Donor a/
In Kind b/
Grants c/
Loans a/
In Kind b/
Grants c/
Loans Total Commt.
Total Disb.
US 0.06 0.04 0.00 0.06 0.04 0.00
EAP Taiwan Total 0.06 0.04 0.00 0.06 0.04 0.00 0.10 0.10
AHIF 0.00 1.50 0.00 0.00 0.15 0.00
Russia 0.38 0.00 0.00 0.00 0.00 0.00
US 0.30 0.00 0.00 0.30 0.00 0.00
World Bank 0.00 0.00 5.00 0.00 0.00 1.41
ECA Tajikistan Total 0.68 1.50 5.00 0.30 0.15 1.41 7.18 1.86
US 0.82 0.64 0.00 0.82 0.64 0.00
AFR Tanzania Total 0.82 0.64 0.00 0.82 0.64 0.00 1.47 1.47
Netherlands 0.00 0.10 0.00 0.00 0.10 0.00
US 2.83 8.05 0.00 2.79 8.05 0.00
EAP Thailand Total 2.83 8.15 0.00 2.79 8.15 0.00 10.98 10.94
US 0.02 0.00 0.00 0.02 0.00 0.00
LCR Trinidad & Tobago Total 0.02 0.00 0.00 0.02 0.00 0.00 0.02 0.02
AfDB 0.00 0.50 0.00 0.00 0.38 0.00
World Bank 0.00 0.00 0.56 0.00 0.00 0.00
AFR Togo Total 0.00 0.50 0.56 0.00 0.38 0.00 1.06 0.38
AHIF 0.00 0.65 0.00 0.00 0.00 0.00
US 0.00 0.00 0.00 0.00 0.00 0.00
MNA Tunisia Total 0.00 0.65 0.00 0.00 0.00 0.00 0.65 0.00
European Commission 0.00 10.39 0.00 0.00 8.31 0.00
US 1.09 0.33 0.00 1.09 0.33 0.00
World Bank 0.00 0.00 34.40 0.00 0.00 8.02
ECA Turkey Total 1.09 10.72 34.40 1.09 8.64 8.02 46.21 17.75
AHIF 0.00 1.97 0.00 0.00 0.00 0.00
US 0.10 0.00 0.00 0.10 0.00 0.00
ECA Turkmenistan Total 0.10 1.97 0.00 0.10 0.00 0.00 2.07 0.10
AHIF 0.00 0.10 0.00 0.00 0.08 0.00
US 1.88 0.73 0.00 1.88 0.73 0.00
AFR Uganda Total 1.88 0.83 0.00 1.88 0.81 0.00 2.70 2.68
Estonia 0.00 0.04 0.00 0.00 0.01 0.00
Russia 0.86 0.00 0.00 0.86 0.00 0.00
US 5.65 1.34 0.00 5.65 1.34 0.00
ECA Ukraine Total 6.51 1.38 0.00 6.51 1.35 0.00 7.88 7.85
US 0.00 0.00 0.00 0.00 0.00 0.00
World Bank 0.00 0.00 0.50 0.00 0.00 0.00
LCR Uruguay Total 0.00 0.00 0.50 0.00 0.00 0.00 0.50 0.00
AHIF 0.00 2.96 0.00 0.00 0.40 0.00
Russia 0.54 0.00 0.00 0.36 0.00 0.00
US 0.30 0.35 0.00 0.30 0.35 0.00
ECA Uzbekistan Total 0.84 3.31 0.00 0.66 0.75 0.00 4.15 1.41
ADB 0.00 0.00 24.70 0.00 0.00 0.12
AHIF 0.00 10.00 0.00 0.00 0.53 0.00
Australia 0.00 5.35 0.00 0.00 4.81 0.00
Czech Republic 0.20 0.00 0.00 0.20 0.00 0.00
Finland 0.00 8.08 0.00 0.00 8.08 0.00
Germany 0.00 4.98 0.00 0.00 2.36 0.00
Japan 0.00 8.08 0.00 0.00 8.08 0.00
Netherlands 2.31 0.00 0.00 1.41 0.00 0.00
PHRD 0.00 6.90 0.00 0.00 2.90 0.00
Switzerland 0.00 0.50 0.00 0.00 0.50 0.00
US 15.10 5.96 0.00 15.10 5.88 0.00
World Bank 0.00 0.00 25.00 0.00 0.00 6.16
EAP Vietnam Total 17.61 49.85 49.70 16.71 33.15 6.28 117.16 56.14

91
Committed (USD million)
Disbursed (USD million)
Region Recipient Country Donor a/
In Kind b/
Grants c/
Loans a/
In Kind b/
Grants c/
Loans Total Commt.
Total Disb.
AHIF 0.00 3.00 0.00 0.00 2.30 0.00
US 0.50 0.00 0.00 0.50 0.00 0.00
World Bank 0.00 0.00 10.00 0.00 0.00 1.18
MNA West Bank & Gaza Total 0.50 3.00 10.00 0.50 2.30 1.18 13.50 3.98
AHIF 0.00 0.06 0.00 0.00 0.03 0.00
US 0.00 0.00 0.00 0.00 0.00 0.00
MNA Yemen Total 0.00 0.06 0.00 0.00 0.03 0.00 0.06 0.03
AHIF 0.00 1.00 0.00 0.00 0.64 0.00
AFR Zambia Total 0.00 1.00 0.00 0.00 0.64 0.00 1.00 0.64
Grand Total 173.18 308.82 350.33 158.57 189.10 69.40 832.33 417.07
a/ In Kind may include technical assistance, supplies, equipments, commodities, workshops, training etc.
b/ All bilateral commitments and disbursements are in the form of Grants whereas ADB and WB amounts are Loans and Credits. 832.33 417.07
c/ ADB and WB amounts mainly include Loans and Credits.
d/ AHIF is a multidonor trust fund facility supervised by the World Bank. PHRD is primarily a Japanese trust fund supervised by the WB. Both facilities allocate resources for Avian and Human Influenza and they are not included in direct World Bank contributions
Total Committed excluding AHIF and PHRD (US$ million) : 735.34 AHIF Committed
(US$m) : 75.59
Total Disbursed excluding AHIF and PHRD (US$ million) : 402.65 PHRD Committed
(US$m) : 21.40
AHIF Disbursed
(US$m) : 9.27
PHRD Disbursed
(US$m) : 5.15
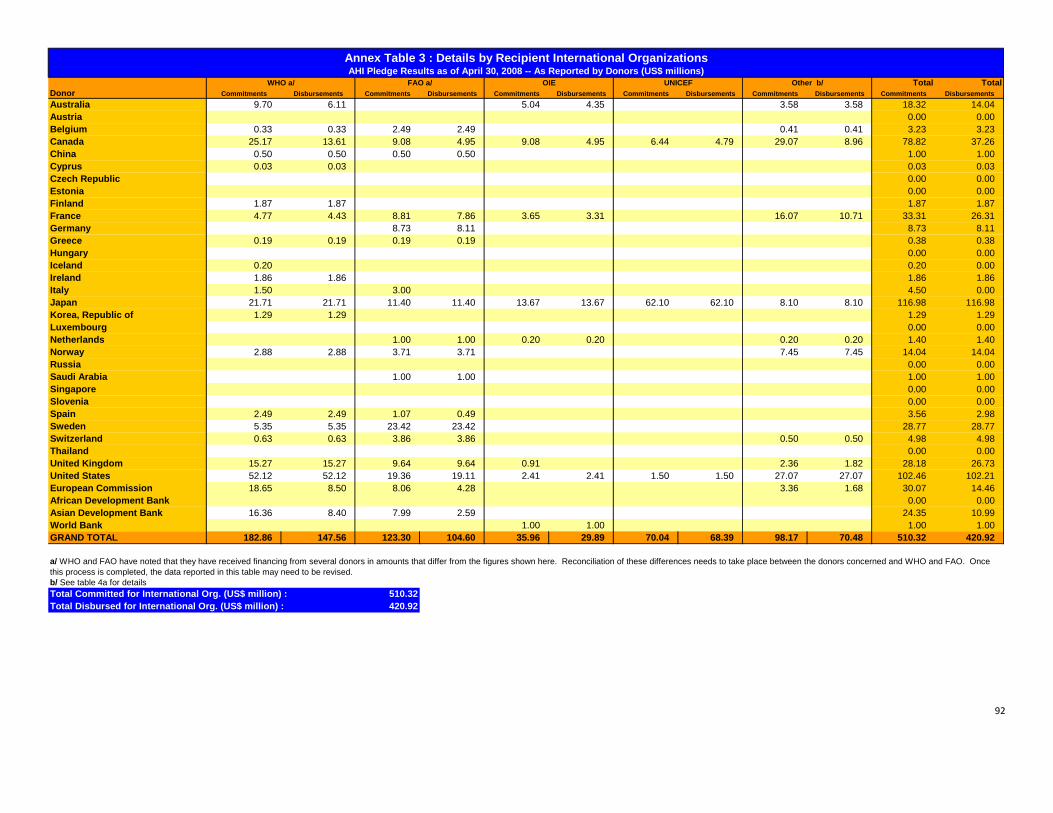
92
Total TotalDonor Commitments Disbursements Commitments Disbursements Commitments Disbursements Commitments Disbursements Commitments Disbursements Commitments DisbursementsAustralia 9.70 6.11 5.04 4.35 3.58 3.58 18.32 14.04Austria 0.00 0.00Belgium 0.33 0.33 2.49 2.49 0.41 0.41 3.23 3.23Canada 25.17 13.61 9.08 4.95 9.08 4.95 6.44 4.79 29.07 8.96 78.82 37.26China 0.50 0.50 0.50 0.50 1.00 1.00Cyprus 0.03 0.03 0.03 0.03Czech Republic 0.00 0.00Estonia 0.00 0.00Finland 1.87 1.87 1.87 1.87France 4.77 4.43 8.81 7.86 3.65 3.31 16.07 10.71 33.31 26.31Germany 8.73 8.11 8.73 8.11Greece 0.19 0.19 0.19 0.19 0.38 0.38Hungary 0.00 0.00Iceland 0.20 0.20 0.00Ireland 1.86 1.86 1.86 1.86Italy 1.50 3.00 4.50 0.00Japan 21.71 21.71 11.40 11.40 13.67 13.67 62.10 62.10 8.10 8.10 116.98 116.98Korea, Republic of 1.29 1.29 1.29 1.29Luxembourg 0.00 0.00Netherlands 1.00 1.00 0.20 0.20 0.20 0.20 1.40 1.40Norway 2.88 2.88 3.71 3.71 7.45 7.45 14.04 14.04Russia 0.00 0.00Saudi Arabia 1.00 1.00 1.00 1.00Singapore 0.00 0.00Slovenia 0.00 0.00Spain 2.49 2.49 1.07 0.49 3.56 2.98Sweden 5.35 5.35 23.42 23.42 28.77 28.77Switzerland 0.63 0.63 3.86 3.86 0.50 0.50 4.98 4.98Thailand 0.00 0.00United Kingdom 15.27 15.27 9.64 9.64 0.91 2.36 1.82 28.18 26.73United States 52.12 52.12 19.36 19.11 2.41 2.41 1.50 1.50 27.07 27.07 102.46 102.21European Commission 18.65 8.50 8.06 4.28 3.36 1.68 30.07 14.46African Development Bank 0.00 0.00Asian Development Bank 16.36 8.40 7.99 2.59 24.35 10.99World Bank 1.00 1.00 1.00 1.00GRAND TOTAL 182.86 147.56 123.30 104.60 35.96 29.89 70.04 68.39 98.17 70.48 510.32 420.92
b/ See table 4a for detailsTotal Committed for International Org. (US$ million) : 510.32Total Disbursed for International Org. (US$ million) : 420.92
a/ WHO and FAO have noted that they have received financing from several donors in amounts that differ from the figures shown here. Reconciliation of these differences needs to take place between the donors concerned and WHO and FAO. Once this process is completed, the data reported in this table may need to be revised.
Annex Table 3 : Details by Recipient International Organizations
Other b/WHO a/ FAO a/ OIE UNICEFAHI Pledge Results as of April 30, 2008 -- As Reported by Donors (US$ millions)

93
Annex Table 4a: Detailed Breakdown by Donors
AHI Pledge Results as of April 30, 2008 ‐‐ As Reported by Donors (US$ millions)
Countries Regional Organizations International Organizations
Committed (USD million)
Disbursed (USD million)
Committed (USD million)
Disbursed (USD million)
Committed (USD million)
Disbursed (USD million)
Donor Recipient a/
In Kind
b/ Grants / Loans
a/ In
Kind
b/ Grants / Loans Recipient
a/ In
Kind
b/ Grants / Loans
a/ In
Kind
b/ Grants / Loans Recipient
a/ In Kind
b/ Grants/ Loans
a/ In
Kind
b/ Grants /Loans
Cambodia 0.00 1.45 0.00 1.45 (ASEAN) Association of Southeast Asian Nations 0.00 3.82 0.00 3.21 WHO 0.00 9.70 0.00 6.11
China 0.00 0.38 0.00 0.38 (APEC) Asia Pacific Economic 0.00 7.64 0.00 4.20 OIE 0.00 5.04 0.00 4.35
East Timor 0.00 3.82 0.00 2.37 Regional Assistance‐ Asia 0.00 13.22 0.00 8.02 UNDP 0.00 0.38 0.00 0.38
Indonesia 0.00 25.97 0.00 16.65 Pacific Island Nations 0.00 6.11 0.00 3.28 WFP 0.00 2.44 0.00 2.44
Korea, DPR 0.00 0.61 0.00 0.61 IFRC 0.00 0.76 0.00 0.76
Myanmar 0.00 0.76 0.00 0.76
Papua New Guinea 0.00 4.66 0.00 1.30
Philippines 0.00 0.15 0.00 0.15
Vietnam 0.00 5.35 0.00 4.81
Australia
Total 0.00 43.16 0.00 28.49 Total 0.00 30.79 0.00 18.71 Total 0.00 18.32 0.00 14.04
Austria
Total 0.00 0.00 0.00 0.00 Total 0.00 0.00 0.00 0.00 Total 0.00 0.00 0.00 0.00
ADB 0.00 0.41 0.00 0.41 WHO 0.00 0.33 0.00 0.33
FAO 0.00 2.49 0.00 2.49 Belgium
Total 0.00 0.00 0.00 0.00 Total 0.00 0.41 0.00 0.41 Total 0.00 2.82 0.00 2.82
(ADB) Asian Development Bank 0.00 4.13 0.00 2.48 FAO 0.00 9.08 0.00 4.95
(AfDB) African Development Bank 0.00 4.95 0.00 0.00 FAO/WHO/OIE 0.00 12.38 0.00 2.48
OCHA 0.00 0.41 0.00 0.41
OIE 0.00 9.08 0.00 4.95
PAHO 0.00 3.16 0.00 0.79
UNDP (Egypt) 0.00 0.33 0.00 0.33
UNDP/FAO/WHO (Vietnam) 0.00 0.83 0.00 0.83
UNHCR 0.00 0.83 0.00 0.83
UNICEF 0.00 3.30 0.00 1.65
UNICEF (Indonesia) 0.00 3.14 0.00 3.14
UNSIC 0.00 4.13 0.00 2.48
WHO 0.00 7.01 0.00 5.36
WHO (Canadian‐Asian Region Emerging Infectious Diseases Initiative) 0.00 12.38 0.00 2.48
WHO (Global Pandemic Influenza Action Plan to Increase Vaccine Supply) 0.00 0.83 0.00 0.83
WHO (Indonesia) 0.00 4.13 0.00 4.13
WHO (Vietnam) 0.00 0.83 0.00 0.83
IFRC (International Federation of Red Cross) 0.00 1.65 0.00 0.83
CFIA (Technical Support for Avian Influenza) 5.36 0.00 0.00 0.00
Canada
Total 0.00 0.00 0.00 0.00 Total 0.00 9.08 0.00 2.48 Total 5.36 73.46 0.00 37.26

94
Countries Regional Organizations International Organizations
Committed (USD million)
Disbursed (USD million)
Committed (USD million)
Disbursed (USD million)
Committed (USD million)
Disbursed (USD million)
Donor Recipient a/
In Kind
b/ Grants / Loans
a/ In
Kind
b/ Grants / Loans Recipient
a/ In
Kind
b/ Grants / Loans
a/ In
Kind
b/ Grants / Loans Recipient
a/ In
Kind
b/ Grants/ Loans
a/ In
Kind
b/ Grants /Loans
WHO 0.00 0.50 0.00 0.50
FAO 0.00 0.50 0.00 0.50 China
Total 0.00 0.00 0.00 0.00 Total 0.00 0.00 0.00 0.00 Total 0.00 1.00 0.00 1.00
WHO 0.00 0.03 0.00 0.03
Cyprus
Total 0.00 0.00 0.00 0.00 Total 0.00 0.00 0.00 0.00 Total 0.00 0.03 0.00 0.03
Vietnam 0.20 0.00 0.20 0.00
Czech Republic
Total 0.20 0.00 0.20 0.00 Total 0.00 0.00 0.00 0.00 Total 0.00 0.00 0.00 0.00
Ukraine 0.00 0.04 0.00 0.01
Estonia
Total 0.00 0.04 0.00 0.01 Total 0.00 0.00 0.00 0.00 Total 0.00 0.00 0.00 0.00
Vietnam 0.00 8.08 0.00 8.08 WHO 0.00 1.87 0.00 1.87
Finland
Total 0.00 8.08 0.00 8.08 Total 0.00 0.00 0.00 0.00 Total 0.00 1.87 0.00 1.87
Congo 0.00 0.24 0.00 0.24 WHO 1.04 3.73 0.70 3.73
Niger 0.00 0.13 0.00 0.13 FAO 2.09 6.72 1.39 6.47
OIE 1.04 2.61 0.70 2.61
Institute Pasteur Network in Asia 0.00 15.55 0.00 10.36
Agronomes & Veterinaires Sans Frontieres (AVSF) 0.52 0.00 0.35 0.00
France
Total 0.00 0.37 0.00 0.37 Total 0.00 0.00 0.00 0.00 Total 4.70 28.61 3.14 23.17
Cambodia 0.00 0.00 0.00 0.00 ILRI / AU‐IBAR 1.00 0.00 0.31 0.00 FAO (Rome) 0.00 2.36 0.00 1.74
Indonesia 9.24 0.00 4.85 0.00 FAO (Cambodia) 0.00 3.23 0.00 3.23
Laos 0.00 0.00 0.00 0.00 FAO (Laos) 0.00 2.99 0.00 2.99
Romania 0.00 0.00 0.00 0.00 FAO (Romania) 0.00 0.15 0.00 0.15
Vietnam 4.98 0.00 2.36 0.00
Germany
Total 14.22 0.00 7.21 0.00 Total 1.00 0.00 0.31 0.00 Total 0.00 8.73 0.00 8.11
WHO 0.00 0.19 0.00 0.19
FAO 0.00 0.19 0.00 0.19 Greece
Total 0.00 0.00 0.00 0.00 Total 0.00 0.00 0.00 0.00 Total 0.00 0.38 0.00 0.38
Hungary
Total 0.00 0.00 0.00 0.00 Total 0.00 0.00 0.00 0.00 Total 0.00 0.00 0.00 0.00
WHO 0.00 0.20 0.00 0.00
Iceland
Total 0.00 0.00 0.0 0.00 Total 0.00 0.00 0.00 0.00 Total 0.00 0.20 0.00 0.00

95
Countries Regional Organizations International Organizations
Committed (USD million)
Disbursed (USD million)
Committed (USD million)
Disbursed (USD million)
Committed (USD million)
Disbursed (USD million)
Donor Recipient a/
In Kind
b/ Grants / Loans
a/ In
Kind
b/ Grants / Loans Recipient
a/ In
Kind
b/ Grants / Loans
a/ In
Kind
b/ Grants / Loans Recipient
a/ In
Kind
b/ Grants/ Loans
a/ In
Kind
b/ Grants /Loans
Lesotho 0.00 0.15 0.00 0.15 WHO 0.00 1.86 0.00 1.86
Ethiopia 0.00 0.15 0.00 0.15 Ireland
Total 0.00 0.30 0.00 0.30 Total 0.00 0.00 0.00 0.00 Total 0.00 1.86 0.00 1.86
WHO 0.00 1.50 0.00 0.00
FAO 0.00 3.00 0.00 0.00 Italy
Total 0.00 0.00 0.00 0.00 Total 0.00 0.00 0.00 0.00 Total 0.00 4.50 0.00 0.00
Nigeria 0.00 0.73 0.0 0.73 (ASEAN) Association of Southeast Asian Nations 0.00 46.80 0.00 46.80 WHO 0.00 21.71 0.00 21.71
Vietnam 0.00 8.08 0.00 8.08 (ADB) Asian Development Bank 0.00 10.00 0.00 10.00 FAO 0.00 11.40 0.00 11.40
Indonesia 0.00 16.16 0.00 16.16 (ECOWAS) Economic Community of West African States 0.00 0.05 0.00 0.05 OIE 0.00 13.67 0.00 13.67
(ASEF) Asia Europe Foundation 0.00 31.85 0.00 31.85 UNICEF 0.00 62.10 0.00 62.10
UNHCR 0.00 5.00 0.00 5.00
WFP 0.00 1.10 0.00 1.10
IOM 0.00 1.00 0.00 1.00
OCHA 0.00 1.00 0.00 1.00
Japan
Total 0.00 24.97 0.00 24.97 Total 0.00 88.70 0.00 88.70 Total 0.00 116.98 0.00 116.98
Egypt 0.00 0.00 0.00 0.00 WHO 0.00 1.29 0.00 1.29
Indonesia 0.25 0.00 0.25 0.00
Iraq 0.86 0.00 0.86 0.00
Korea, DPR 1.27 0.00 1.27 0.00
Lao PDR 0.00 0.22 0.00 0.22
Mongolia 0.00 0.00 0.00 0.00
Nigeria 0.20 0.00 0.20 0.00
Korea, Republic of
Total 2.58 0.22 2.58 0.22 Total 0.00 0.00 0.00 0.00 Total 0.00 1.29 0.00 1.29
Luxembourg
Total 0.00 0.00 0.00 0.00 Total 0.00 0.00 0.00 0.00 Total 0.00 0.00 0.00 0.00
China 0.00 0.04 0.00 0.04 FAO 0.50 0.50 0.50 0.50
Indonesia 12.00 0.00 2.20 0.00 OIE 0.20 0.00 0.20 0.00
Thailand 0.00 0.10 0.00 0.10 UN 0.20 0.00 0.20 0.00
Vietnam 2.31 0.00 1.41 0.00
Netherlands
Total 14.31 0.14 3.61 0.14 Total 0.00 0.00 0.00 0.00 Total 0.90 0.50 0.90 0.50

96
Countries Regional Organizations International Organizations
Committed (USD million)
Disbursed (USD million)
Committed (USD million)
Disbursed (USD million)
Committed (USD million)
Disbursed (USD million)
Donor Recipient
a/ In
Kind
b/ Grants / Loans
a/ In
Kind
b/ Grants / Loans Recipient
a/ In
Kind
b/ Grants / Loans
a/ In
Kind
b/ Grants / Loans Recipient
a/ In
Kind
b/ Grants/ Loans
a/ In
Kind
b/ Grants /Loans
FAO 0.00 3.51 0.00 3.51
FAO (Korea DPR) 0.00 0.20 0.00 0.20
WHO (Korea DPR) 0.00 0.53 0.00 0.53
WHO 0.00 2.35 0.00 2.35
UN Appeal 0.00 1.55 0.00 1.55
UN Central Fund for Influenza Action 0.00 3.62 0.00 3.62
UNSIC 0.00 1.35 0.00 1.35
WFP 0.93 0.00 0.93 0.00
Norway
Total 0.00 0.00 0.00 0.00 Total 0.00 0.00 0.00 0.00 Total 0.93 13.11 0.93 13.11
Armenia 0.38 0.00 0.00 0.00
Azerbaijan 0.54 0.00 0.36 0.00
Belarus 0.54 0.00 0.36 0.00
Kazakhstan 0.86 0.00 0.86 0.00
Kyrgyzstan 0.38 0.00 0.00 0.00
Moldova 0.38 0.00 0.00 0.00
Tajikistan 0.38 0.00 0.00 0.00
Ukraine 0.86 0.00 0.86 0.00
Uzbekistan 0.54 0.00 0.36 0.00
Russia
Total 4.86 0.00 2.80 0.00 Total 0.00 0.00 0.00 0.00 Total 0.00 0.00 0.00 0.00
FAO Global Program 0.00 1.00 0.00 1.00
Saudi Arabia
Total 0.00 0.00 0.00 0.00 Total 0.00 0.00 0.00 0.00 Total 0.00 1.00 0.00 1.00
Indonesia 0.60 0.90 0.60 0.20
Singapore
Total 0.60 0.90 0.60 0.20 Total 0.00 0.00 0.00 0.00 Total 0.00 0.00 0.00 0.00
Slovenia
Total 0.00 0.00 0.00 0.00 Total 0.00 0.00 0.00 0.00 Total 0.00 0.00 0.00 0.00
WHO 0.00 2.49 0.00 2.49
FAO 0.00 1.07 0.00 0.49 Spain
Total 0.00 0.00 0.00 0.00 Total 0.00 0.00 0.00 0.00 Total 0.00 3.56 0.00 2.98
WHO 0.00 5.35 0.00 5.35
FAO 0.00 23.42 0.00 23.42 Sweden
Total 0.00 0.00 0.00 0.00 Total 0.00 0.00 0.00 0.00 Total 0.00 28.77 0.00 28.77
Vietnam 0.00 0.50 0.00 0.50 WHO 0.00 0.63 0.00 0.63
FAO 0.00 3.86 0.00 3.86
UNSIC 0.00 0.50 0.00 0.50 Switzerland
Total 0.00 0.50 0.00 0.50 Total 0.00 0.00 0.00 0.00 Total 0.00 4.98 0.00 4.98

97
Countries Regional Organizations International Organizations
Committed (USD million)
Disbursed (USD million)
Committed (USD million)
Disbursed (USD million)
Committed (USD million)
Disbursed (USD million)
Donor Recipient
a/ In
Kind
b/ Grants / Loans
a/ In
Kind
b/ Grants / Loans Recipient
a/ In
Kind
b/ Grants / Loans
a/ In
Kind
b/ Grants / Loans Recipient
a/ In
Kind
b/ Grants/ Loans
a/ In
Kind
b/ Grants /Loans
ACMECS (Cambodia, Lao PDR, Myanmar) 2.50 0.00 1.59 0.00
Thailand
Total 0.00 0.00 0.00 0.00 Total 2.50 0.00 1.59 0.00 Total 0.00 0.00 0.00 0.00
WHO 6.36 8.91 6.36 8.91
FAO 0.00 9.64 0.00 9.64
OIE 0.00 0.91 0.00 0.00
IFRC 0.00 0.91 0.00 0.91
OCHA 0.00 1.09 0.00 0.55
UNSIC 0.00 0.36 0.00 0.36
United Kingdom
Total 0.00 0.00 0.00 0.00 Total 0.00 0.00 0.00 0.00 Total 6.36 21.82 6.36 20.37
Afghanistan 1.40 1.28 1.40 1.28 NAMRU 2 (Indonesia) 3.90 0.00 3.90 0.00 WHO 52.12 0.00 52.12 0.00
Albania 1.10 0.00 1.10 0.00 NAMRU 3 (Egypt) 3.25 0.00 3.25 0.00 FAO 16.97 2.39 16.72 2.39
Angola 0.00 1.07 0.00 1.07 European CDC (personnel) 0.62 0.00 0.62 0.00 OIE 0.00 2.41 0.00 2.41
Argentina 0.00 1.35 0.00 1.35 (SPC) Secretariat of the Pacific 0.60 0.00 0.60 0.00 UNSIC 2.08 0.00 2.08 0.00
Armenia 2.56 0.73 2.56 0.73 Almaty Regional Platform (Kazakhstan) 1.19 0.00 1.19 0.00 Institute Pasteur Network 3.74 0.00 3.74 0.00
Azerbaijan 3.85 0.00 3.85 0.00 REDI Center (Singapore) 2.68 0.00 2.68 0.00 UNICEF 1.50 0.00 1.50 0.00
Bangladesh 3.84 3.13 3.84 3.13 Gorgas Institute (Panama) 4.58 0.00 4.58 0.00 UNDP 11.25 0.00 11.25 0.00
Bolivia 0.32 0.00 0.32 0.00 NIH International Influenza Research 28.00 0.00 28.00 0.00 IFRC 10.00 0.00 10.00 0.00
Bosnia‐ Herzegovina 0.40 0.00 0.40 0.00 African Regional Programs 15.67 0.00 15.67 0.00
Brazil 0.02 1.15 0.02 1.15 Latin America & the Caribbean Regional Programs 13.51 0.00 13.51 0.00
Bulgaria 1.02 0.00 1.02 0.00 Asia/Pacific/Near East Regional Programs 16.78 0.00 16.78 0.00
Burkina Faso 0.20 0.00 0.20 0.00 Eastern Europe & Eurasian Regional Programs 8.21 0.00 8.21 0.00
Burundi 0.00 0.00 0.00 0.00 Regional Disease Detection Site (China) 6.01 0.00 6.54 0.00
Cambodia 9.20 4.45 9.20 4.25 Regional Disease Detection Site (Egypt) 3.35 0.00 3.85 0.00
Cameroon 0.21 0.00 0.21 0.00 Regional Disease Detection Site (Guatemala) 3.85 0.00 4.00 0.00
Chad 0.00 0.00 0.00 0.00 Regional Disease Detection Site (Kenya) 6.22 0.00 7.12 0.00
Chile 0.04 0.00 0.04 0.00 Regional Disease Detection Site (Thailand) 10.16 0.00 11.01 0.00
China (including Hong Kong) 2.56 7.47 2.06 7.47
Colombia 0.11 0.00 0.11 0.00
Congo (DRC) 0.12 1.19 0.12 1.24
United States
Congo (ROC) 0.01 0.90 0.01 0.15

98
Countries Regional Organizations International Organizations
Committed (USD million)
Disbursed (USD million)
Committed (USD million)
Disbursed (USD million)
Committed (USD million)
Disbursed (USD million)
Donor Recipient
a/ In
Kind
b/ Grants / Loans
a/ In
Kind
b/ Grants / Loans Recipient
a/ In
Kind
b/ Grants / Loans
a/ In
Kind
b/ Grants / Loans Recipient
a/ In
Kind
b/ Grants/ Loans
a/ In
Kind
b/ Grants /Loans
Costa Rica 0.00 0.00 0.00 0.00
Cote D'Ivoire 0.05 0.72 0.05 0.72
Cyprus 0.50 0.00 0.50 0.00
Djibouti 0.10 0.00 0.10 0.00
Dominican Republic 0.03 0.00 0.03 0.00
East Timor 0.88 0.00 0.88 0.00
Ecuador 0.00 0.00 0.00 0.00
Egypt 9.51 0.50 9.51 0.50
El Salvador 0.02 0.00 0.02 0.00
Eritrea 0.01 0.00 0.01 0.00
Ethiopia 2.88 0.60 2.88 0.60
Georgia 1.56 0.70 1.56 0.70
Ghana 2.30 0.00 2.30 0.00
Greenland 0.15 0.00 0.15 0.00
Guatemala 0.02 0.00 0.02 0.00
Haiti 0.10 0.00 0.10 0.00
Honduras 0.01 0.00 0.01 0.00
Hungary 0.00 0.00 0.00 0.00
India 1.55 3.19 1.55 3.19
Indonesia 39.18 8.45 39.10 8.35
Iraq 0.91 0.00 0.61 0.00
Jamaica 0.02 0.00 0.02 0.00
Jordan 0.02 0.00 0.02 0.00
Kazakhstan 0.45 0.45 0.45 0.52
Kenya 1.06 5.05 1.06 4.45
Korea, ROK 0.00 0.48 0.00 0.48
Kyrgyzstan 0.10 0.00 0.10 0.00
Laos 7.31 3.99 7.31 3.84
Libya 0.01 1.25 0.01 1.25
Macedonia 0.50 0.00 0.50 0.00
Malawi 0.60 0.00 0.60 0.00
Malaysia 0.02 0.96 0.02 0.96
Mali 0.26 0.00 0.26 0.00
Mexico 0.32 6.43 0.32 6.43
Moldova 1.51 0.00 1.51 0.00
Mongolia 0.95 1.50 0.95 1.50
Morocco 0.00 1.03 0.00 1.03
United States (cont)
Mozambique 0.68 0.00 0.68 0.00

99
Countries Regional Organizations International Organizations
Committed (USD million)
Disbursed (USD million)
Committed (USD million)
Disbursed (USD million)
Committed (USD million)
Disbursed (USD million)
Donor Recipient a/
In Kind
b/ Grants
/ Loans
a/ In Kind
b/ Grants / Loans Recipient
a/ In Kind
b/ Gran
ts /
Loans
a/ In Kind
b/ Grant
s /
Loans Recipient
a/ In
Kind
b/ Grants/ Loans
a/ In
Kind
b/ Grants /Loans
Myanmar 1.07 0.00 1.07 0.00
Nepal 1.08 0.00 1.08 0.00
Nicaragua 0.01 0.00 0.01 0.00
Niger 0.20 0.00 0.20 0.00
Nigeria 5.42 1.48 5.42 1.48
Pakistan 0.96 0.93 0.96 0.93
Panama 0.15 0.00 0.15 0.00
Peru 0.01 1.18 0.01 1.18
Philippines 1.73 1.23 1.73 1.23
Romania 2.51 0.63 2.51 0.00
Russia 1.90 0.45 1.90 0.45
Rwanda 0.10 0.70 0.10 0.70
Saudi Arabia 0.00 0.00 0.00 0.00
Senegal 0.58 0.00 0.58 0.00 Serbia & Montenegro 0.45 0.00 0.45 0.00
South Africa 3.13 1.00 3.13 1.60
Sri Lanka 0.91 0.00 0.91 0.00
Sudan 0.20 0.00 0.20 0.00
Taiwan 0.06 0.04 0.06 0.04
Tajikistan 0.30 0.00 0.30 0.00
Tanzania 0.82 0.64 0.82 0.64
Thailand 2.83 8.05 2.79 8.05 Trinidad & Tobago 0.02 0.00 0.02 0.00
Tunisia 0.00 0.00 0.00 0.00
Turkey 1.09 0.33 1.09 0.33
Turkmenistan 0.10 0.00 0.10 0.00
Uganda 1.88 0.73 1.88 0.73
Ukraine 5.65 1.34 5.65 1.34
Uruguay 0.00 0.00 0.00 0.00
Uzbekistan 0.30 0.35 0.30 0.35
Vietnam 15.10 5.96 15.10 5.88
West Bank/Gaza 0.50 0.00 0.50 0.00
Yemen 0.00 0.00 0.00 0.00
United States (cont)
Total 149.58 82.99 148.67 81.20 Total 128.58 0.00 131.51 0.00 Total 97.66 4.80 97.41 4.80

100
Countries Regional Organizations International Organizations
Committed (USD million)
Disbursed (USD million)
Committed (USD million)
Disbursed (USD million)
Committed (USD million)
Disbursed (USD million)
Donor Recipient
a/ In
Kind
b/ Grants / Loans
a/ In
Kind
b/ Grants / Loans Recipient
a/ In
Kind
b/ Grants / Loans
a/ In
Kind
b/ Grants/ Loans Recipient
a/ In
Kind
b/ Grants/ Loans
a/ In
Kind
b/ Grants /Loans
Eritrea 0.00 1.00 0.00 0.62 EDF via African Union and Alive 0.00 37.31 0.00 12.44 FAO (Chad) 0.00 4.98 0.00 2.49
Ghana 0.00 3.55 0.00 2.25 ACP Africa 0.00 0.62 0.00 0.62 FAO (Gabon) 0.00 1.24 0.00 0.62
Ivory Coast 0.00 0.75 0.00 0.37 FAO (Korea DPRK) 0.00 0.62 0.00 0.56
Korea DPR 0.00 0.00 0.00 0.00 FAO (Nigeria) 0.00 0.97 0.00 0.49
Mali 0.00 2.49 0.00 1.24 FAO (Zambia) 0.00 0.25 0.00 0.12
Myanmar 0.00 0.00 0.00 0.00 UNDP (Cameroon) 0.00 3.36 0.00 1.68
Romania 0.00 0.62 0.00 0.62 WHO (Indonesia) 0.00 17.41 0.00 7.69
Senegal 0.00 2.48 0.00 1.24 WHO (Myanmar) 0.00 1.24 0.00 0.81
Sudan 0.00 7.46 0.00 3.73
Turkey 0.00 10.39 0.00 8.31
European Commission
Total 0.00 28.74 0.00 18.38 Total 0.00 37.93 0.00 13.06 Total 0.00 30.07 0.00 14.46
Benin 0.00 0.50 0.00 0.38
Burkina Faso 0.00 0.50 0.00 0.38
Cameroon 0.00 0.50 0.00 0.38
Chad 0.00 0.50 0.00 0.38
Côte d'Ivoire 0.00 0.50 0.00 0.23
Djibouti 0.00 0.50 0.00 0.23
Egypt 0.00 0.50 0.00 0.50
Ghana 0.00 0.50 0.00 0.38
Kenya 0.00 0.50 0.00 0.00
Mali 0.00 0.50 0.00 0.23
Niger 0.00 0.50 0.00 0.38
Nigeria 0.00 0.50 0.00 0.38
Sudan 0.00 0.50 0.00 0.23
Togo 0.00 0.50 0.00 0.38
African Development Bank
Total 0.00 7.00 0.00 4.40 Total 0.00 0.00 0.00 0.00 Total 0.00 0.00 0.00 0.00
Azerbaijan 0.05 0.00 0.05 0.00 ASEAN 0.00 0.34 0.00 0.15 WHO 0.00 16.36 0.00 8.40
Cambodia 0.00 9.00 0.00 0.45 FAO 0.00 7.99 0.00 2.59
Indonesia 0.40 0.00 0.09 0.00
Lao PDR 0.00 6.00 0.00 0.82
Malaysia 0.40 0.00 0.09 0.00
Philippines 0.40 0.00 0.09 0.00
Vietnam 0.00 24.70 0.00 0.12
Asian Development Bank
Total 1.25 39.70 0.31 1.39 Total 0.00 0.34 0.00 0.15 Total 0.00 24.35 0.00 10.99

101
Countries Regional Organizations International Organizations
Committed (USD million)
Disbursed (USD million)
Committed (USD million)
Disbursed (USD million)
Committed (USD million)
Disbursed (USD million)
Donor Recipient
a/ In
Kind
b/ Grants / Loans
a/ In
Kind
b/ Grants / Loans Recipient
a/ In
Kind
b/ Grants / Loans
a/ In
Kind
b/ Grants / Loans Recipient
a/ In
Kind
b/ Grants/ Loans
a/ In
Kind
b/ Grants /Loans
Albania 0.00 5.00 0.00 1.18 AHIF funding ‐ Southern Agricultural Council (CAS) 0.00 0.50 0.00 0.05 OIE 0.00 1.00 0.00 1.00
Argentina 0.00 2.00 0.00 0.00
AHIF funding ‐ (MECIDS) Middle East Consortium on Infectious Disease Surveillance 0.00 0.98 0.00 0.30
Afghanistan 0.00 8.00 0.00 0.50
Armenia 0.00 6.25 0.00 3.06
Azerbaijan 0.00 5.15 0.00 2.67
Bangladesh 0.00 16.00 0.00 0.50 Bosnia‐Herzegovina 0.00 5.00 0.00 0.00
Cambodia 0.00 6.00 0.00 0.00
Djibouti 0.00 0.43 0.00 0.43
Egypt 0.00 2.72 0.00 2.55
Georgia 0.00 7.00 0.00 2.16
India 0.00 32.63 0.00 0.00
Iran 0.00 6.10 0.00 0.18
Kosovo 0.00 3.00 0.00 0.30
Kyrgyzstan 0.00 4.00 0.00 1.69
Lao PDR 0.00 4.00 0.00 1.11
Moldova 0.00 8.00 0.00 1.90
Nepal 0.00 18.20 0.00 2.06
Niger 0.00 4.50 0.00 0.00
Nigeria 0.00 50.00 0.00 30.18
Romania 0.00 37.70 0.00 0.77
Sri Lanka 0.00 3.50 0.00 0.00
Tajikistan 0.00 5.00 0.00 1.41
Togo 0.00 0.56 0.00 0.00
Turkey 0.00 34.40 0.00 8.02
Uruguay 0.00 0.50 0.00 0.00
Vietnam 0.00 25.00 0.00 6.16 West Bank/Gaza 0.00 10.00 0.00 1.18
World Bank
Total 0.00 310.63 0.00 68.01 Total 0.00 1.48 0.00 0.35 Total 0.00 1.00 0.00 1.00
Total Total 187.60 547.75 165.98 236.67 Total 132.08 168.72 133.41 123.86 Total 115.91 394.00 108.7
4 311.77
a/ In Kind may include technical assistance, supplies, equipments, commodities, workshops, training etc.
b/ All bilateral commitments and disbursements are in the form of Grants whereas ADB and WB amounts mainly include Loans and Credits. % Disb. % Comm.
Total Committed Annex 4a +4b (US$ million) : 2,049.53 In Cash 60 900.85 69 1,423.8
1
Total Disbursed Annex 4a + 4b (US$ million) : 1,489.51 In Kind 40 588.66 31 625.72
Total 100 1,489.5
1 100 2,049.5
3
102
Annex Table 4b: Detailed Breakdown by Donors AHI Pledge Results as of April 30, 2008 (US$ millions)
AHI Facility Other Unallocated
Committed
(USD million) Disbursed
(USD million) Committed
(USD million) Disbursed
(USD million)
Donor Recipient
a/ In
Kind
b/ Grants
/ Loans
a/ In
Kind
b/ Grants
/ Loans Recipient
a/ In
Kind
b/ Grant
s/
Loans
a/ In
Kind
b/ Grant
s/
Loans Recipient
Inkind / Grants / Loans
AHI Facility 0.00 8.02 0.00 6.11 Unallocated 10.71
Australia
Total 0.00 8.02 0.00 6.11 Total 0.00 0.00 0.00 0.00 Total 10.71
Unallocated 1.24
Austria
Total 0.00 0.00 0.00 0.00 Total 0.00 0.00 0.00 0.00 Total 1.24
Unallocated -0.12
Belgium
Total 0.00 0.00 0.00 0.00 Total 0.00 0.00 0.00 0.00 Total -0.12
Global Health Research Initiative 0.00 3.30 0.00 0.00 Unallocated -4.15
Canada
Total 0.00 0.00 0.00 0.00 Total 0.00 3.30 0.00 0.00 Total -4.15
AHI Facility 0.00 2.00 0.00 2.00 Unallocated 7.00
China
Total 0.00 2.00 0.00 2.00 Total 0.00 0.00 0.00 0.00 Total 7.00
Unallocated 0.00
Cyprus
Total 0.00 0.00 0.00 0.00 Total 0.00 0.00 0.00 0.00 Total 0.00
Unallocated 0.00
Czech Republic
Total 0.00 0.00 0.00 0.00 Total 0.00 0.00 0.00 0.00 Total 0.00
AHI Facility 0.00 0.03 0.00 0.03 Unallocated -0.03
Estonia
Total 0.00 0.03 0.00 0.03 Total 0.00 0.00 0.00 0.00 Total -0.03
Unallocated 0.00
Finland
Total 0.00 0.00 0.00 0.00 Total 0.00 0.00 0.00 0.00 Total 0.00
Diagnostic in Africa 0.00 0.97 0.00 0.97 Unallocated -1.47
AI research in epidemiology (Asia and Africa) 0.00 4.48 0.00 1.49
AI research in virology and genetic resistance 0.00 5.70 0.00 1.90
Researchers 4.93 0.00 3.28 0.00
France
Total 0.00 0.00 0.00 0.00 Total 4.93 11.15 3.28 4.36 Total -1.47
Vaccination Development Project 0.00 12.44 0.00 12.44 Unallocated -0.16
Task Force Development Network (developing countries) 4.98 0.00 2.20 0.00
Germany
Total 0.00 0.00 0.00 0.00 Total 4.98 12.44 2.20 12.44 Total -0.16

103
AHI Facility Other Unallocated
Committed
(USD million) Disbursed
(USD million) Committed
(USD million) Disbursed
(USD million)
Donor Recipient
a/ In
Kind
b/ Grants
/ Loans
a/ In
Kind
b/ Grants
/ Loans Recipient
a/ In
Kind
b/ Grants
/ Loans
a/ In
Kind
b/ Grants
/ Loans Recipient
Inkind / Grants / Loans
Unallocated 0.80
Greece
Total 0.00 0.00 0.00 0.00 Total 0.00 0.00 0.00 0.00 Total 0.80
Unallocated 0.04
Hungary
Total 0.00 0.00 0.00 0.00 Total 0.00 0.00 0.00 0.00 Total 0.04 AHI Facility 0.00 0.20 0.00 0.00 Unallocated 0.00
Iceland
Total 0.00 0.20 0.00 0.00 Total 0.00 0.00 0.00 0.00 Total 0.00
Unallocated -0.92
Ireland
Total 0.00 0.00 0.00 0.00 Total 0.00 0.00 0.00 0.00 Total -0.92
Unallocated 2.46
Italy
Total 0.00 0.00 0.00 0.00 Total 0.00 0.00 0.00 0.00 Total 2.46
World Bank (through PHRD) 0.00 14.50 0.00 14.50 Unallocated -5.77
Program of funding Research Centers (in 6 developing countries) 0.00 51.72 0.00 51.72
Japan
Total 0.00 0.00 0.00 0.00 Total 0.00 66.22 0.00 66.22 Total -5.77 AHI Facility 0.00 1.00 0.00 1.00 Technical Cooperation 0.04 0.00 0.04 0.00 Unallocated 0.58
Korea, Republic of
Total 0.00 1.00 0.00 1.00 Total 0.04 0.00 0.04 0.00 Total 0.58
Unallocated 1.49
Luxembourg
Total 0.00 0.00 0.00 0.00 Total 0.00 0.00 0.00 0.00 Total 1.49
AI-firebrigade 1.60 0.00 0.50 0.00 Unallocated 3.19
Netherlands
Total 0.00 0.00 0.00 0.00 Total 1.60 0.00 0.50 0.00 Total 3.19
Unallocated -0.99
Norway
Total 0.00 0.00 0.00 0.00 Total 0.00 0.00 0.00 0.00 Total -0.99 AHI Facility 0.00 3.00 0.00 3.00 Establishment of the WHO collaboration centre in Russia 0.00 24.00 0.00 23.48 Unallocated 0.00
Russia
Total 0.00 3.00 0.00 3.00 Total 0.00 24.00 0.00 23.48 Total 0.00
Unallocated 0.00
Saudi Arabia
Total 0.00 0.00 0.00 0.00 Total 0.00 0.00 0.00 0.00 Total 0.00

104
AHI Facility Other Unallocated
Committed
(USD million) Disbursed
(USD million) Committed
(USD million) Disbursed
(USD million)
Donor Recipient
a/ In
Kind
b/ Grants
/ Loans
a/ In Kind
b/ Grants
/ Loans Recipient
a/ In Kind
b/ Grants
/ Loans
a/ In
Kind
b/ Grants
/ Loans Recipient
Inkind / Grants / Loans
Unallocated 0.00
Saudi Arabia
Total 0.00 0.00 0.00 0.00 Total 0.00 0.00 0.00 0.00 Total 0.00
Unallocated -0.90
Singapore
Total 0.00 0.00 0.00 0.00 Total 0.00 0.00 0.00 0.00 Total -0.90 AHI Facility 0.00 0.04 0.00 0.00 Unallocated 0.00
Slovenia
Total 0.00 0.04 0.00 0.00 Total 0.00 0.00 0.00 0.00 Total 0.00
Unallocated 0.00
Spain
Total 0.00 0.00 0.00 0.00 Total 0.00 0.00 0.00 0.00 Total 0.00
Unallocated -16.05
Sweden
Total 0.00 0.00 0.00 0.00 Total 0.00 0.00 0.00 0.00 Total -16.05
Unallocated 0.31
Switzerland
Total 0.00 0.00 0.00 0.00 Total 0.00 0.00 0.00 0.00 Total 0.31
Unallocated 0.00
Thailand
Total 0.00 0.00 0.00 0.00 Total 0.00 0.00 0.00 0.00 Total 0.00 AHI Facility 0.00 13.48 0.00 13.48 Investment in AI World Reference Laboratory, VLA Weybridge 6.00 0.00 6.00 0.00 Unallocated 3.29
National Institute of Biological Standards and Control (on vaccine development) 1.27 0.00 1.27 0.00
Research by Medical Research Council; some goes into collaboration with WHO centers 5.45 0.00 1.82 0.00
FAO/IFPRI/ILRI/Royal Veterinary College/ University of California at Berkeley: research into pro poor control options 0.00 7.09 0.00 1.45
United Kingdom
Total 0.00 13.48 0.00 13.48 Total 12.72 7.09 9.09 1.45 Total 3.29
Global wild bird surveillance 7.01 0.00 7.01 0.00 Unallocated -0.47
Global communications & outreach 15.59 0.00 15.59 0.00
International coordination 43.39 0.00 42.94 0.00
Stockpile (non-pharmaceuticals) 66.63 0.00 66.63 0.00
International technical assistance 16.20 0.00 16.20 0.00
Humanitarian assistance 6.42 0.00 6.42 0.00
International research (vaccines,flu modelling,human-animal, etc.) 10.64 0.00 10.64 0.00
United States
Total 0.00 0.00 0.00 0.00 Total 165.86 0.00 165.4
1 0.00 Total -0.47

105
AHI Facility Other Unallocated
Committed
(USD million) Disbursed
(USD million) Committed
(USD million) Disbursed
(USD million)
Donor Recipient
a/ In
Kind
b/ Grants
/ Loans a/
In Kind
b/ Grants
/ Loans Recipient
a/ In
Kind
b/ Grants
/ Loans
a/ In
Kind
b/ Grants
/ Loans Recipient
Inkind / Grants / Loans
AHI Facility 0.00 89.95 0.00 62.24 6 th Framework Programme - DG Research 0.00 34.83 0.00 20.90 Unallocated 78.58
7 th Framework Programme - DG Research 0.00 19.05 0.00 11.37
European Commission
Total 0.00 89.95 0.00 62.24 Total 0.00 53.88 0.00 32.27 Total 78.58
Unallocated 8.00
African Development Bank
Total 0.00 0.00 0.00 0.00 Total 0.00 0.00 0.00 0.00 Total 8.00
Others: Emergency Fund for Developing Countries (ADB) 0.00 17.53 0.00 0.48 Unallocated 384.83
Asian Development Bank
Total 0.00 0.00 0.00 0.00 Total 0.00 17.53 0.00 0.48 Total 384.83
187.39
World Bank
Total 0.00 0.00 0.00 0.00 Total 0.00 0.00 0.00 0.00 Total 187.39
Total 0.00 117.72 0.00 87.86 Total 190.13 195.61 180.52 140.70 Total 658.88
a/ In Kind may include technical assistance, supplies, equipments, commodities, workshops, training, etc.
b/ All bilateral commitments and disbursements are in the form of Grants whereas ADB and WB amounts mainly include Loans and Credits. % Disb. % Comm.
Total Committed Annex 4a + 4b (US$ million) : 2,049.53 In Cash 60 900.85 69 1,423.81
Total Disbursed Annex 4a + 4b (US$ million) : 1,489.51 In Kind 40 588.66 31 625.72
Total 100 1,489.51 100 2,049.53