restoration of the clanwilliam cedar, widdringtonia
TRANSCRIPT

Univers
ity of
Cap
e Tow
n
Restoration of the Clanwilliam cedar, Widdringtonia cedarbergensis:
a study on the potential for fire as a management tool.
Sean Privett
Widdringtonia cedarbergensis in the Cedar Reserve.
Honours thesis, Department of Botany
University of Cape Town. 1994
Supervisor: Prof. W J Bond

The copyright of this thesis vests in the author. No quotation from it or information derived from it is to be published without full acknowledgement of the source. The thesis is to be used for private study or non-commercial research purposes only.
Published by the University of Cape Town (UCT) in terms of the non-exclusive license granted to UCT by the author.
Univers
ity of
Cap
e Tow
n

-...
-----
-----------
BOLUS LIBRARY
Abstract
C24 0004 7828
111111111 U 111
Flammability tests were undertaken on the foliage ofW.cedarbergensis. Juvenile
foliage was found to be more sensitive to heating than adult foliage on the same
tree, while foliage collected from the top of the canopy was more tolerant to
heating than foliage from the base of the canopy in the same tree. The sensitivity
to heating did not differ between two geographically separate populations, one
from a dry site and the other from a moist site. Foliage was more resistant to
heating in winter than in summer. The sensitivity of foliage to heating did not
correlate with the moisture content of that foliage. Factors influencing the
survival of W .cedarbergensis in fire were explored at five sites by examining the
characteristics of trees which survived and were killed by fires. Fire intensity
had a major impact on survival at all five sites. At four of the sites the size of
the trees, their crown base height, shape and degree of protection by rocks all
influenced whether they survived or not. At the fifth site, none of the variables
measured had a significant bearing on whether the trees survived or not. A
sensitivity analysis to determine the relative importance of the various stages of
the cedars life cycle in influencing population growth was calculated. The large
seed producing trees were found to make the major contribution to population
growth. A model using data on fire mortality collected in the field was
developed to investigate the implications of various management options for the
conservation of the cedar. This model predicted that an interval of fifteen years
between typical intense summer wildfires will result in the rapid extinction of the
species, while late summer/autumn prescribed burns require a minimum interval
of 12 years between fires. The model predicted that conservation of the natural
cedar forest at Die Bos will require complete protection from fire for at least 50
years. The model's simulations emphasised the importance of ensuring low
mortalities in the largest size classes in prescribed burns as well as the value of
the addition of nursery reared seedlings after fire. The model predicts that the
present management strategy in the cedar reserve will be effective if mortality of
existing trees in prescribed burns is minimized.

--...
-
--------
-----
INTRODUCTION
W. cedarbergensis (Marsh) is a member of the family Cupressaceae, confined to
the Cedarberg mountains of the south western Cape Province, South Africa. The
species is currently classified as 'vulnerable', indicating its reduced status and
that it could become endangered if the factors causing its decline continue to
operate (Hall and Veldhuis 1985). This decline in status over historical time has
been well documented (Hubbard 1937, Smith 1955, Luckoff 1972 Andrag 1977,
Meadows and Sudgen 1991), while there has been a consistent concern expressed
over its potential to survive in the future (Kruger and Haynes 1978, Manders
1986). As a result of its 'flagship' status and vulnerability to extinction,
W. cedarbergensis has been the subject of scientific study for nearly 100 years and
has been credited as the most researched indigenous plant species in the fynbos
biome (Richardson 1993).
There has been much speculation as to why this species has undergone such a
dramatic decline in status. According to Meadows and Sudgen (1991), the
demise of the cedar must be viewed against a backdrop of late Quaternary
environmental change which has led to alterations in the composition of the
cedars co-occurring species and hence changes in fire regimes. Other authors
have highlighted the over exploitation of the species as a timber source which
resulted in a major decline in the healthy reproductively active trees (Smith 1955,
Andrag 1977). However the most worrying aspect for managers of the Cedar is
that despite prohibiting the felling of live cedars since 1876 (Andrag 1977), and
engaging in a variety of proactive conservation and rehabilitation initiatives since
the turn of the century, the status of the tree has continued to decline at an
alarming rate.

-
----
---------...
--
The reason for this, and the problem central to the survival and hence
management of the cedar, revolves around fire (Hubbard 1937, Luckhoff 1972,
Andrag 1977, Kruger and Haynes 1978, Manders 1986, Manders etal. 1990).
W. cedarbergensis grows in fire prone fynbos vegetation which naturally burns at
an interval of approximately every sixteen years (Brown etal. 1991). The critical
characteristic of W cedarbergensis biology is its inability to resprout after fires.
Thus individuals are killed by fire and rely entirely on successful regeneration
from seed for recruitment. The enigma is that the cedar is a slow grower, which
despite producing its first cones after about 12 years only reaches full
reproductive maturity after 30 years (Andrag 1977); a period far longer than the
average fire interval. A further dilemma facing management involves the season
of burn. Tree survival varies with fire season and is generally best after winter
or spring burns due to their lower intensity (van Wilgen 1980), however for
recruitment cedars require high intensity fires such as occur in summer, and
result in high adult mortality (Bond 1993).
Fire is the major manipulative tool available to managers for cedar conservation.
Fire control was first initiated at the turn of the century when a complete ban on
all fires in cedar areas was imposed (Bands 1981). However fire suppression
proved impossible and the resultant wild fires were intense and burnt considerable
areas of vegetation (Brown etal 1991). As a result, a policy of prescribed
burning on a 12-year cycle was initiated in 1972 in an attempt to reduce the
probability of large wild fires (Andrag 1977). Although this has been effective
in reducing the number and frequency of wildfires, their average size has almost
doubled (Brown etal 1991) and their impact on the status of W. cedarbergensis
has in no way diminished. As a result many populations have been totally
eradicated while the majority of those that remain are so reduced in numbers that
natural regeneration can no longer occur (Manders and Botha 1987, Mustart
1993).

-...
--
----------.. ..
--
It is thus evident that past attempts at fire management in the Cedarberg have
been largely ineffective as a means of cedar conservation. This has led to the
initiation of a 'Cedar Reserve', an area set aside for pro-active re-establishment
and conservation of W. cedarbergensis. The reserve is about 5 252 ha in extent
and encompasses approximately 21 % of the current cedar distribution (van der
Merwe 1986). Its management strategy is separate to that of the remaining
wilderness area where the objective is the maintenance of overall biodiversity
(van der Merwe 1986). The management guidelines for the reserve require the
application of short frequency, low intensity winter burns in order to reduce the
loss of adult trees in wild fires (van Der Merwe and Wessels 1993). The
problem of low germination after these cool burns is resolved by boosting
seedling numbers through large-scale plantings of nursery-grown seedlings in the
newly burnt areas (Van der Merwe and Wessels 1993).
Although, at first glance, this strategy for cedar reserve management seems well
defined and straight forward, the problems which have thwarted cedar fire
management in the past remain major stumbling blocks to the implementation of
this scheme (Wessels pers. comm. ) . The manager has important decisions to
make as to where and when to burn in the reserve each year. When selecting a
potential site for patch burning, or burning for planting, it is important to be able
to predict what impact a controlled fire is likely to have on existing cedar stands.
For this it is necessary to understand which factors enable certain trees to survive
fires while others are killed and also whether the trees themselves change in their
resistance to fire between seasons. This prediction for adult survival needs to be
related to an acceptable level of adult mortality and in turn considerations of how
many seedlings will need to be planted in order to ensure adequate artificial post
fire recruitment. A further important consideration relates to the interval
required before a planted area is re-burnt so as to ensure adequate survival of the
artificial regenerates.

-
-----
--
----.. ...
--
This project aims to answer some of these questions relating to fire management
of the cedar in general, and in particular within the cedar reserve. It is divided
for convenience into three separate, but interrelated, components. Part A
explores the significance of seasonal changes in the tolerance of foliage to fire
and the potential of using this to determine the best time to burn. Part B
examines the various factors which influence the level of mortality in fire, with
the aim of predicting approximate mortality of a population in prescribed burns.
Finally part C uses real data on mortality collected in the field and matrix
modelling to examine a variety of management options relating to the
manipulation of frequency and intensity of fire.

---
----
--
--...
·----
PART A Flammability tests.
Introduction
Fire mortality of W. cedarbergensis varies considerably, with figures as low as
6.5% during prescribed winter burns (van Wilgen 1979) and as high as 91 % in
summer wildfires (van der Merwe 1988) being recorded. These differences in
mortality have in the past been ascribed exclusively to differences in fire
intensity. However it has recently been suggested that mortality in cedars may
depend more on the condition of the plant than on fire intensity (Bond 1993).
Cedar foliage is particularly sensitive to scorching and the majority of trees
appear to be killed by crown scorch rather than cambium damage. Evidence for
death by scorching can be seen after fires where numerous canopies are destroyed
without actually igniting (pers. obs.). In some instances trees outside the path of
the fire appear to have been killed by heat alone (pers. obs.).
It is therefore the sensitivity of the foliage to heat, rather than to the flames
themselves, which will determine whether the plant will survive fire or not.
Heated twigs of W. cedarbergensis "blush" from green to brown at their lethal
temperature threshold (Bond 1993) (plate 1). This blushing can be used as an
indicator to determine the sensitivity of cedar foliage to heat. Relative
differences in resistance to the heat treatment are thus likely to be biologically
valid simulations of the relative tolerances of individuals to fire.
The primary objective of the following experiments is to investigate whether the
sensitivity of the species changes with season and if so whether this can be
related to the moisture content of the foliage. A similar relationship has been
documented by Xanthopoulos and W akimoto (1992) for three western United
States conifers, and could prove useful in providing a rapid test for managers to
ascertain sensitivity levels of populations to fire. Secondary investigations will
explore whether differences exist in the sensitivity to heat exposure between
different size classes, between adult and juvenile growth forms, between upper
and lower branches and between geographically separated populations.

Plate 1. Heat damaged foliage of W.cedarbergensis 24 hours after exposure to heat treatment
in the oven. A - green foliage unaffected by heat,
turned brown and will be unable to recover.
B - damaged foliage that has

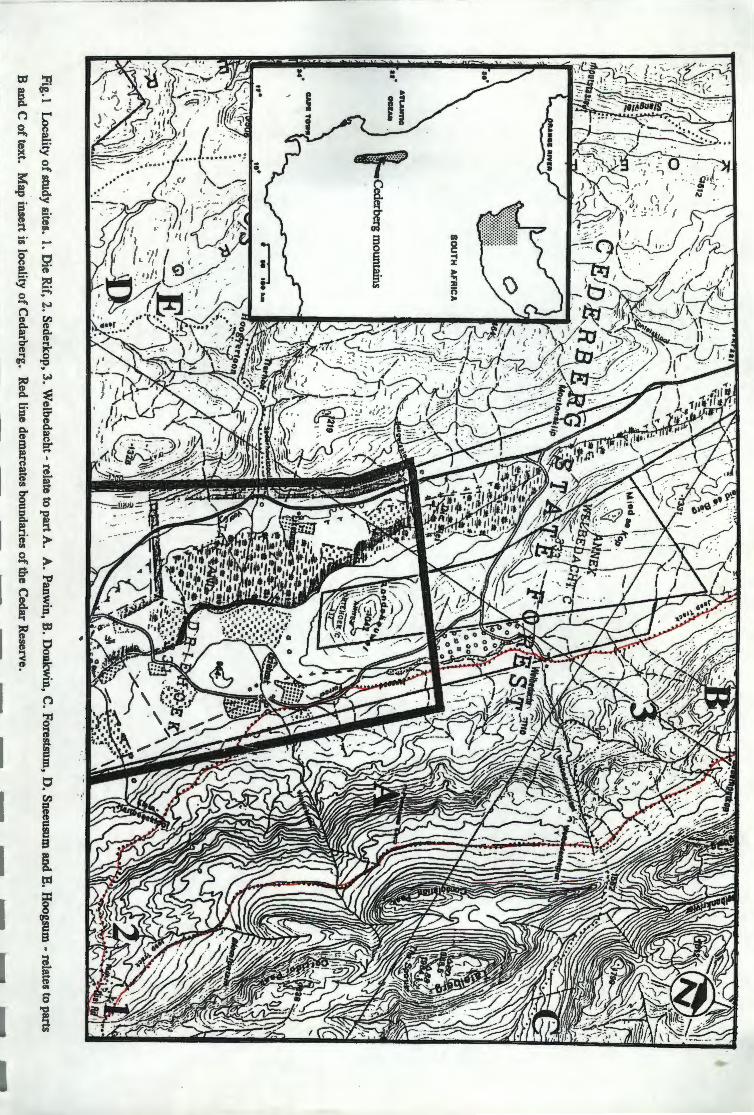
Sample sites
Three sampling sites were used for these experiments at De Rif (site 1), Sederkop
(site 2) and Welbedacht (site 3), and are demarcated in fig.1. The De Rif
samples were collected from within the plantation at the old farmstead of the
same name. This site is shaded and occurs on damp soils. Sederkop is the name
I gave to the conspicuous cedar population which is situated west of De Rif,
above the footpath leading from Driehoek farm to De Rif. This cedar clad ridge
was previously delimited as part of a phytosociological study of Cedarberg plant
communities {Taylor in prep). Taylor's plot number for this site is HCT 860016.
The sampling at Welbedacht was carried out on three trees growing in close
proximity to each other, approximately 1 kilometre south east of the nursery.
Methods
Circa 30 cm long branch tips of W. cedarbergensis were collected during three
field trips in March, May and July 1994. The March field trip was used to
collect the following samples for a pilot study;
*
*
*
*
Branches from class eleven trees at two separate sites, in order to test
whether differences exist between trees at a wet (De Rit) and a drier
(Sederkop) site.
Differences in flammability between class 2 seedlings ( only juvenile
foliage) and the largest size (class 11) trees (only adult foliage) was also
examined.
Branches from class three trees with both juvenile and adult foliage on the
same branch. These were used to examine whether differences exist
between the flammability of adult and juvenile foliage growing on the
same tree.
Branches from the top and bottom of the crown to test for differences
within a single tree.
... ••• ·~
--S
OU
TH
AFR
ICA
1-C<deri,ag mo
un
-
'
Fig. l L
ocality of study sites. 1. D
ie Rif, 2. S
ederkop, 3. Welbedacht • relate to part A
. A
. Panw
in, B. D
oakwin, C
. Forestsum
, D. Sneeusum
and E. H
oogsum -
relates to parts
B and C
of text.
Map insert is locality o
f Cedarberg.
Red line dem
arcates boundaries of the C
edar Reserve.
-

I I
I I
I
In all cases five replicates from each of five trees was collected. The May and
July field trips were then used to determine whether the flammability of W.
cedarbergensis changes with season. Three class eleven trees were selected at
Welbedacht and five branches were removed from each tree in May and again
in July. In all cases the branches were sealed in plastic bags immediately after
cutting, whereafter they were transferred to a 0°C room within 24 hours and
stored until required.
The methodology for testing flammability was developed during similar tests
which examined the relationship between xylem potential and damage to foliage
at various temperatures and time intervals (Honig and Bond unpublished data).
The results of this study indicated that the complete range of damage to cedar
foliage could be achieved by placing branches in an oven at 80°C for various time
intervals up to two minutes.
Small branchlets (8-10 cm long) were thus cut from each branch and subjected
to a temperature of 80°C in an oven for one of 11 different durations between
5 sec;onds and 2 minutes . After 24 hours the degree of damage was scored
according to the following five categories:
0 = no change
1 = branch tips turned brown
2 = < 1 /2 the branch turned brown
3 = > 1 /2 the branch turned brown
4 = entire branch turned brown
Variation in moisture content was obtained through placing a sample of green leaf
material in a petri dish of known weight, weighing on a balance to a precision
of 0.0001 g, placing in a drying oven at 100°C for 48 h, and reweighing. Care
was taken to ensure that only fresh green foliage was sampled for moisture
content.

I I I I
I I
Statistical analyses
The mean damage of the five replicates at each time interval was calculated.
This resulted in a set of matched pairs of damage for each time interval in the
oven for each test. Owing to the non-normality of this data it was necessary to
make use of the non-parametric Wilcoxon paired-sample test which is analogous
to the paired sample t test for normal data (Zar 1984). It thus tests the null
hypothesis that the two samples are from the same population.
A regression equation was calculated to determine the relationship between plant
moisture content and the degree of damage for experiments involving trees with
adult foliage . Juvenile foliage was excluded owing to its much higher moisture
content. For each experiment (eg. lower branches) the mean of the damage for
all exposure times was calculated, as was the mean moisture content. These
values were then regressed against each other with moisture content as the
independent variable. All statistics were calculated using the statistical software
package Statgraphics.
Results
Spatially separated populations.
4.5-r----------------.
4
8, 3.5
~ 3 al -o 2.5
0 2 Q) Q)
~ 1.5 0 1
0.5
o..L.....r--f!L-..... w 5 1 0 15 25 30 45 60 70 80 90 120
Time in oven (seconds)
,~ DeRif - Cederkoppie I
Fig. 2. Flammability of class 11 trees from geographically separated
populations. Values are means of five branchlets.
(Wilcoxons two-tailed probability = 0.333, accept~)

There was no significant difference in the flammability of the class 11 trees from
De Rif and Sederkop. The mean moisture content of the foliage sampled at De
Rif was 50.475 % (sd.2.15%) as against the 48.75 % (sd.0.94%) of the trees
growing at the drier Sederkop site.
Different size classes.
6
4.6
(I) 4 Cl <11 3.6 E <11 3 'C - 2.6 0 (I) 2 (I)
Cl 1.6 (I)
C 1 0.6
0 6 1 0 1 6 26 30 46 60 70 80 90 1 20
lime In oven (seconds)
I ~ class 2 • class 11
Fig. 3. Flammability of foliage from the two extreme size classes. (Wilcoxons
two-tailed probability = 0.124, accept Ho)
The juvenile foliage of the class two trees is more sensitive to heat over the
shorter exposure times (15 - 45 s). Over the longer intervals the adult foliage is
slightly more sensitive. Overall the juvenile vegetation was more sensitive to
heat, however the two size classes do not demonstrate a significant difference in
their response to heat treatment. The mean moisture content of the class two
samples was 60.75 % (sd.4.1 %) whereas that of the class 11 trees was 49.53 %
(sd.0.82%).

I
I
I
I
Adult and juvenile foliage
4.6
4
Cl) 3.6 C) C1' 3 E C1' "C 2.6 0
2 Cl) Cl)
C) 1.6 Cl)
0 1
0.6
0 6 1 0 1 6 26 30 46 60 70 80 90 1 20
llrne in oven (seconds)
I~ adult • Juvenile
Fig. 4. Flammability of adult and juvenile foliage growing on the same trees.
(Wilcoxons two-tailed probability = 0.0254, reject Ho)
The juvenile foliage is more vulnerable to heat treatment, especially at the low
exposure times (10 to 25 s), than the adult foliage. The mean moisture content
of the adult foliage was 57.71 % (sd.1.76%) and the juvenile foliage was 56.32
% (sd.1.61 % )
Upper and lower branches.
4.6
4
Cl) C)
3.6 C1' 3 E C1' "C 2.6 0
2 Cl)
~ 1.6 C) Cl)
0 1
0.6
0 6 1 0 1 6 26 30 46 60 70 80 90 1 20
llrne in oven (seconds)
I~ Lower - Upper j
Fig. 5. Flammability of the lower and upper branches of class 11 trees
growing at Welbedacht. (Wilcoxons two-tailed probability = 0.0225, reject
Ho)

There was a significant difference in the response of upper and lower branches
to the heating treatment. The sixty to eighty second exposure times resulted in
differences of greater than 0.5 in the degree of damage between upper and lower
branches. The mean moisture content of the lower branches was 47 .97 %
(sd.2.45%) as against the 52.98 % (sd.1.7%) of the upper branches sampled.
Temporal separation.
4.5
4
(I) 3.5 C, <IS 3 E <IS
2.5 'C
0 2 (I) (I) ... 1.5 C, (I)
C 1
0.5
0 5 1 0 1 5 25 30 45 60 70 80 90 1 20
Time In oven (seconds)
1~May-July j
Fig. 6. Flammability of foliage sampled from class 11 trees in autumn and
winter. (Wilcoxons two-tailed probability = 0.0178, reject HJ
The flammability of the foliage decreased in winter for all the exposure times.
Consequently the temporal differences in sensitivity proved highly significant.
The mean water content of the foliage sampled in May was 48.55 % and
increased to 50.05 % in July.
Relationship between moisture content and heat exposure damage.
The R squared value of 0.265 (n = 11, DF = 9, p=0.1) indicates that the
degree of damage is not closely related to the moisture content of the tree.

Discussion
Although there was no significant difference in the sensitivity of the extreme size
classes to heat exposure, it would appear that juvenile foliage is more vulnerable
to fire than adult foliage, despite its much higher moisture content. Plants
bearing juvenile foliage rely on their atypical ability of undergoing epicormic
resprouting in order to survive fires. However this adaptation to fire would only
appear to be successful after very favourable cool fires (pers. observation)
(plate 2). The very high mortality of juvenile individuals in all fires (see figure
7) is probably much more a function of their size than their greater sensitivity to
the flames. Nevertheless this finding further highlights the extreme sensitivity
of juveniles to fire.
The sensitivity to heat exposure of foliage collected from the lower branches of
trees was significantly higher than that from the uppermost branches. Although
this pattern is unexpected and may be a product of the small sample size, if valid
it could be a weak form of adaptation to fire. Many trees are left with only the
uppermost portion of the canopy after fire (plate 3) (pers. observation).
Although it is to be expected that the highest mortality should occur near the
ground where intensity is greatest, a slightly higher resistance to heat by the
upper foliage may be a trait which augments their survival. A further advantage
of preserving the upper foliage is that it bears the majority of the reproductive
structures. The mechanism behind this attribute could relate to the measured
increase of 5 % in moisture content of the upper foliage when compared with the
lower foliage. This in turn could be a result of the greater demand for water in
the younger actively growing upper foliage.
There was no evidence for differences between populations in the sensitivity of
class 11 trees to heat exposure. Despite the sample sites having been especially
chosen for their differences in microclimate, the moisture content of the trees
growing adjacent to a spring at De Rif was only 1. 75 % higher than those

Plate 3. An adult cedar with much of its trunk
and lower branches killed by fire but upper
canopy undamaged and carrying cones.
Plate 2. A young cedar scorched by a
prescribed burn in the cedar reserve. Fresh
foliage which sprouted since the fire is clearly
evident.
I
sampled from the dry Sederkop site which had received virtually no moisture for
eight months. However recent findings by Cohen etal. (1989 - cited in
Rothermel 1991) have shown that tree branchlets are able to release large
amounts of moisture to the air when heated. Furthermore this effect was shown
to be possible only when adequate soil moisture is available. As an example,
Pinus contorta needles which released moisture were found to require 49 % more
energy to reach ignition than specimens without this capability (Rothermel 1991).
It is thus likely that although laboratory investigations found minimal differences
in flammability between the two sites, the greater potential for the De Rif
population to rapidly draw on soil water resources when heated would increase
their resistance to a fire relative to the drier Sederkop population.
As a result of methodological error in the March sampling, only two temporally
separated experiments were undertaken. Fortunately virtually no rain had fallen
in the eight months prior to the May sampling trip, whereas 376.2 mm fell
between the May and July trips (Algeria weather station). During this time the
sensitivity of the foliage from each of the three trees sampled decreased
significantly. This suggests that physiological changes within a single tree over
time can reduce its vulnerability to fire. Given the findings of Rothermel (1991),
it is also possible that the trees insitu resistance to fire would be further increased
after rains by the greater soil moisture availability. It is however uncertain
whether the changes measured in the laboratory experiments would result in a
significant increase in the survival of the tree in a fire. This uncertainty exists
because we still do not know the relative importance of fire intensity versus tree
state in influencing fire survival. The above investigations have demonstrated
that the physiological status of the tree can influence foliage flammability.
However further research is needed to investigate how differing fire intensities
influence the mortality of trees with the same sensitivity to fire.
It was hoped that the sensitivity status of a population could be determined and
combined with fire intensity projections to improve the predictions for suitable

I I
I
I I
I
burning times . Unfortunately the moisture content, which it was thought might
be useful as an indicator of sensitivity, does not correlate with the level of
damage experienced by a tree . This is despite increases in moisture content
relating to increases in tolerance in all the significant experimental results
discussed above. Sensitivity of foliage to fire is not driven by a simple moisture
content relationship and it is therefore not possible to use this measure to make
predictions with regards a populations sensitivity to fire. Future research should
be aimed towards increasing knowledge on changes in tolerance throughout the
year and finding correlations between these changes and some easily measurable
parameter such as plant water potential or soil water content. From this limited
study it would however appear that seasons of lowest fire intensity do correspond
with the trees period of greatest physiological resistance to fire.

I
PART B Factors influencing survival of W. cedarbergensis in
fire.
Introduction
Prescribed burning is the only viable management option for reducing fuel loads
and thereby diminishing the probability of intense wildfires destroying cedar
populations. It is however essential that cedar mortality be kept to a minimum
in these burns. At first appraisal W .cedarbergensis, unlike most other fynbos
species, appears to have no effective traits for fire survival. However, Kruger
and Haynes (1978) found a high proportion ofliving trees bearing fire scars, thus
indicating that some cedars are able to survive fires. When selecting sites for
prescribed burning it is important to be able to predict the expected mortality of
trees in a given population, in a given fire. As discussed in part A, fire intensity
as well as the physiological status of the tree will influence cedar mortality in
fire . Both these variables can, to a degree, be controlled by management. This
section examines other characteristics of a population which might influence its
survival in fire. Similar studies using multivariate techniques have been
undertaken in Californian redwood forests to distinguish between trees destined
to die and those that will survive prescribed burning (Finney and Martin 1992).
In these studies the height of trees and foliage height above ground ( crown base
height) have proven significant predictors of tree mortality in fire (Finney and
Martin 1992).
Manders (1986) suggested that factors affecting survival of W. cedarbergensis in
fire include fuel load and weather conditions (both relating to intensity) as well
as the size of the tree and rockiness, while I have added to these the trees shape
and crown base height. An understanding of which of these factors , if any,
promote cedar survival in fire has important implications for the choice of sites
to burn, as well as in planting programs.

I
I
Methods
Study sites.
Five study sites were selected to cover the requirements of both parts B and part
C of this study. These sites were all burnt within the last decade, showed
differing degrees of cedar survival, and had experienced fires of differing
intensities. Their locality is given in Fig 1. Sites A and Bare situated within the
cedar reserve and were burnt in a controlled early winter burn in 1989
(Hendricks pers.comm.). The cedar populations at both these sites had
previously been enumerated for a demographic study (Marais unpublished data).
At the time of the fires the vegetation at both sites A and B was well in excess
of 40 years old (Table 1). Site C is situated at De Bos, within the last remaining
natural cedar forest. This closed canopy forest was burnt out by a wild fire
during an extremely dry spell in November 1984 (van der Merwe 1988). The
age of two felled trees at this site was found to be in excess of 200 years . The
absence of fire scars on any of the growth rings analyzed suggests that the area
had not experienced fire for at least this time span. Site D and E are situated
at the Hoogvertoorn and Sneeuberg sites used by Manders in developing his
transition model. These two sites were burnt in the same summer wild fire in
December 1988. The vegetation was thirteen years old at the time of the fire.
Table 1. Details of plots used in parts Band c.
Plot Name Date and nature of burn Approx . Veg.Age at burn (yrs)
A Panwin May 1988 (prescribed burn) >40
B Donkwin May 1988 (prescribed burn) >40
C Forests um November 1984 (wildfire) >200
D Sneeusum January 1989 (wildfire) 13
E Hoogsum January 1989 (wildfire) 13
(Pan from Panorama which is locality name and win from fire season, winter)

I
Data collected
At each of the five sites a random sample of approximately two hundred trees
was examined to determine the survival of all size classes following the differing
intensity fires. At Panwin and Donkwin the trees which had been randomly
selected and tagged with metal stakes for an earlier study were sampled. At the
other three sites the trees were randomly chosen by sampling the first 200
individuals encountered along a line transect. Using Manders (1987) size class
categ~ries, trees less than 150 cm were allocated to classes 2 to 6 on the basis of
height, whereas trees taller than 150 cm were allocated to classes 7 to 11 on the
basis of DBH (appendix 1). The trees were classified as either having survived
(s), been killed (k) or having not been reached (e) by the fire (table 2).
A separate survey was employed to collect data on equal numbers of living and
dead trees in an attempt to determine which variables best predict a trees survival
or death in fire. At each of the sites approximately 100 trees were selected and
their status (alive or dead) recorded. Where possible trees were chosen so as to
be representative of all size classes. Owing to a shortage of living trees at some
sites, more dead than living trees were surveyed and it was not always possible
to include equal numbers of the various size classes .
For each of the trees selected the following characteristics were noted:
i. Tree height. Height in meters was measured, with the aid of a clinometer
for the taller trees
ii. Stem diameter. Diameter of the stem 1 metre above the ground was
measured for all trees > 1.5 m tall.

I
iii. Crown base height. The height of the lowest living foliage above the
ground at the time of the last fire was measured and categorized
according to the following index:
1. < 1.0 m
2. 1.0 - 2.5 m
3. 2.5 - 5.0 m
4. > 5.0m
iv. Rock protection. An index was formulated to classify the degree of
protection offered by surrounding rocks . This is analogous with an index
of decreasing fuel load.
1 - Entirely surrounded by undergrowth.
2 - < 50 % Protection by rocks.
3 - > 50 % Protection by rocks, but with some undergrowth accessible
to fire .
4 - Entirely surrounded by rocks .
v. Tree Shape. The shape of the tree was classified according to one of the
following categories :
1 - Conical shaped with single main stem (including juveniles with no
main branching) .
2 - Main stem branched (branching < 3m above ground) .
3 - Single straight stem, only branching > 3m above ground.
4 - No main stem (branching outwards from ground level) .
The trees were allocated to the 11 size classes of Manders (1987) according to
their height (if < 150 cm) or otherwise their diameter at breast height (appendix
1). The surveyed trees provided an uneven spread between these classes , with

some classes having very few individuals and others many. The classes were
therefore grouped as follows:
Manders (1987) classes
2 to 6
New classes
class 1
( plants < 150 cm )
7 to 9 class 2
(trees > 150cm and diameter < 20cm)
10 and 11 class 3
(trees diameter > 20 cm)
Combining winter and summer mortality data.
Although this data was collected at five geographically isolated sites, similarities
existed between the fire intensities and therefore mortalities experienced by some
of the sites. Panwin and Donkwin which had equal aged vegetation were burnt
separately, but at the same time of the year, while Sneeusum and Hoo gs um were
burnt in the same fire. The data collected on the levels of mortality of 200
randomly selected trees at each site was used to ascertain whether mortality of
each size class was comparable between any of the sites using chi-squared
goodness-of-fit analysis on Statgraphics. The assumption being that sites with
similar proportions of mortality in all size classes experienced equal intensity
burns and can thus be combined to increase sample size.
Statistical analyses
The computer software package GLIM (Generalised Linear Interactive
Modelling) was used to assess the affects of the four variables; tree class, rock
protection, shape and crown base height on the probability of survival of a tree
during fire. This package makes use of generalised linear modelling (McCullagh

I
and Nelder 1983) to define a logistic regression for the relationship between these
variables and the status (dead or alive, ie a binomial function) of the tree. Each
of the four variables were individually entered into the model as the only
explanatory variable for the probability of survival (the marginal effect). They
were also entered in conjunction with the other explanatory variables to examine
their partial effect on survival. A variable that is significant with regards both
its marginal and partial effects should be retained as an explanatory variable
(Mustart etal. in press). The raw data which was used in the GLIM analysis,
together with the GLIM printouts showing the outputs of the statistical operations
are presented in appendix 2.
Results
Table 2. Percentages of the total trees enumerated at each site which were
killed, not reached by, or survived the fire.
Site n % killed % survived % not %alive reached after fire
Panwin 110 67.3 8.2 24.5 32.7
Donkwin 105 53 27 20 48.6
Forsum 227 56 13.7 30.3 44.1
Sneeusu 190 86.8 7.4 5.8 13.2
Hoogsum 208 76 13.5 10.5 24
Mortality in fire was over 50 % at all the sites examined. The lowest mortality
in fire was recorded at Donkwin. The higher survival at Panwin, Donkwin and
Forestsum was largely a result of the large number of trees which were not
reached by the fires.

100
90
80
] 70 -~ ::, 60 ., ~ 50 s 5i 40 u l 30
20
10
2 to 6 7 8 9 10 11
Tree classes
Fig 7. Survival of trees in the various size classes that were reached
by the fire at each of the five sites.
All the size classes suffered higher mortalities in the wildfires (C, D and E) when
compared with the controlled burns (A and B). Survival was low in the smaller
size classes in all fires, whereas in the larger size classes survival was much
higher in the prescribed burns than in the wildfires. It is important to note that
the majority of trees at Panwin and Donkwin were in the smaller size classes,
whereas at Forestsum, Sneeusum and Hoogsum most trees were in the larger
classes (9 - 11).
Table 3. Chi squared goodness-of-fit tests to determine whether fire
mortality at sites are similar enough to group them. (figures in table
are p values)
A B C D E
A 0.1295 0.000 0.000 0.00978 ** ** *
B 0.00 0.000 0.0978 ** ** *
C 0.9078 0.4546
D 0.9858
* p < 0.5 ** p < 0.05

I
I
I
I I
I I
The chi-squared analysis on the class survival proportions at the various sites
indicated that there were no significant differences between mortality in the two
controlled winter burns (sites A and B), or between the two summer wildfires
(sites C and D). There was however a significant difference between the
mortalities of the summer and winter burns. It was thus possible to group the data
from Panwin with Donkwin and from Sneeusum with Hoogsum. Forestsum,
despite its similarity with Sneeusum and Hoogsum, was analyzed separately
owing to the unique characteristics of the population at this site (see discussion).
Table 4. The percentage of the total trees enumerated within each category
of the four variables which survived fire. This data only includes
trees which were reached by the fire.
LOW INTENSITY
SITES A& B
HIGH INTENSIT SITES D & E
FORESTSUM
SiteC
Total number
of trees observed
% survival Total number
of trees observed
% survival I otal number
of trees observed
% survival
1
85
7.1
29
6.9
1
0
Class
2 3
55 17
22 100
66 77
24 66
28 50
36 54
Shape
1 2 3 4
137 16 0 4
15 69 I 100
61 86 7 18
8.2 58 86 64
18 36 24 1
33 39 67 100
Foliage height Rock protection
1 2 3 4 1 2 3 4
139 11 5 2 95 34 24 4
14 90 80 100 1.6 22 67 100
67 68 23 14 54 34 56 28
11 49 70 61 13 41 59 67
59 12 5 3 60 8 11 0
56 50 40 33 50 25 45 0
At all sites the percentage of trees surviving the fire increased with the size of the
tree. However at forestum only one tree in the smallest size classes was found
making the relationshp at that site unclear. Relative to the other categories,
survival was very low for the unbranched conically shaped trees (shape class 1)
at the low and high intensity sites. With the exception of Forestsum survival
generally increased with increases in rock protection as well as crown base
height.

I I
I
I I I I I
Glim analysis
Table 5. Analysis of deviance of the four variables in the low intensity fires
(sites A and B)
Effect Variable df Marginal df Partial
Class 2 69.55 ** 11 98.42 **
Shape 2 44.5 ** 11 109.52 **
Foliage Ht. 3 53.39 ** 10 107.83 **
Rocks 3 53.54 ** 10 102.21 ** ** p, 0.01 * p < 0.05
Table 6. Analysis of deviance of the four variables in the high intensity fires
(sites D and E).
Effect Variable df Marginal df Partial
Class 2 45.53 ** 9 82.41 **
Shape 3 45.93 ** 8 79.97 **
Foliage Ht. 3 48.71 ** 8 71.57 **
Rocks 3 51.43 ** 8 70.31 ** ** p, 0.01 * p < 0.05
Table 7. Analysis of deviance of the four variables. Data collected from
Forestsum (site C)
Effect Variable df Marginal df Partial
Class 2 3.7068 NS 8 9.995 NS
Shape 3 7.916 * 7 6.071 NS
Foliage Ht. 3 0.829 NS 7 12.579 NS
Rocks 2 1.867 NS 8 12.181 NS ** p, 0.01 * p < 0.05
The importance of the measured variables in influencing fire survival varies
between sites. All four variables showed significant marginal and partial effects
on the probability of W. cedarbergensis surviving fire in the intense fire (sites D
& E) as well as the cooler fires (sites A & B). However only shape, which
showed significant marginal affects, was found to influence survival at
Forestsum.
Discussion
The high mortality at Sneeusum and Hoogsum of 81 % corresponds well with
other mortality figures for wildfires quoted in the literature, such as the 81.2 -
97% cited by Forsyth (1979) and the 91 % of van der Merwe (1988). The cedar
populations at Panwin and Donkwin also suffered surprisingly high mortalities
during the controlled winter burns of 1988 (59.5 % of the trees sampled were
killed by these fires). Previous reported surveys on mortality in prescribed burns
have revealed much lower values such as the 6.4% of van Wilgen (1980), and
the 6 - 18 % of Forsyth (1979). However the high mortality in this study is
probably explained by the large proportion of juvenile cedars together with the
occurrence of forty year old vegetation at the two sites. The survival in the
individual age classes was nevertheless much higher than that for the wildfires.
This was partly because of the considerably better survival of the larger size
classes, but also because of the increased proportion of the total trees which were
not burnt at all in the patchy, low intensity fires. It would thus appear that the
major differences between high and low intensity fires, with regards their impact
on cedar mortality, is increased survival of the larger size classes and increased
patchiness with reduction in intensity. The factors which influence the
movements, and thus patchiness, of a fire are poorly understood. Both the
rockiness of the terrain as well as fire intensity must be important in this regard.
However an inability to quantitatively predict the movements of a flame front
remain a major stumbling block to estimating the proportion of trees which will
escape fire by not being burnt.
With the exception of the population at Forestsum, certain characteristics of the
individual trees and their direct environment were found to influence the
probability of their survival in fire. It is important to note that while GLIM
calculates whether trees that survived fires have different characteristics to those
that were killed, it takes no cognisance of the overall mortalities recorded in the
different fire intensities discussed above. What is apparent from table 4, as well

I
I
as observations in the field, is that as the intensity of the fire increases, so the
influence of these characteristics diminishes.
The findings of this study indicate that with increasing size the probability
improved of individuals surviving the fires at all sites except Forestsum. A
number of authors have noted that bigger cedars have better survival rates in fire
(Andrag 1977, Forsyth 1979, Manders 1986). While size in itself is important
in promoting fire survival, other attributes related to a trees physiognomy also
influence fire survival. In this regard the crown base height, although partly
related to tree size, would appear to be an important autonomous characteristic
influencing survival (see plate 3). Thus some very large trees having foliage in
the undergrowth are likely to be more vulnerable to canopy damage than a
smaller tree with branches a few metres above the ground. The results of the
survey indicate that there is a general increase in survival with increasing crown
base height. Tree shape was also found to be significantly related to fire
survival. However this relationship is probably a corollary of the relationship
between the four shape categories and their different sizes and foliage heights.
Thus the low survival in shape category one at Sneeusum and Hoogsum is more
likely a result of the trees belonging to the smaller size classes than the shape of
the tree itself.
The protection afforded by rocks also plays a crucial role in promoting survival
of cedars in fire. As the degree of rock cover around an individual increases so
the level of combustible undergrowth decreases. Thus rocks act directly to
reduce the intensity of fire. Rocks also act to isolate islands of vegetation from
the fire, thereby preventing some cedars from being burnt at all (pers. obs.).
Andrag (1977) noted that the majority of established trees which have previously
survived fires grow in well protected rocky environments. Scattered individual
trees with their foliage confined above large boulders are often the only surviving
remnants of cedar populations in some areas (plates 4 and 5). Thus the degree
of rockiness can be utilised by managers to assess the potential fatalities of cedars

I
I
I
I
Plate 4. The large rock in the foreground has provided these two cedars with essential protection
from fires which generally move upslope (right to left). The unprotected side of the tree has
experienced extensive foliage and cambium damage.
Plate 5. A single adult cedar growing out
of a rocky substrate which has offered
protection from the fires which have killed
its neighbours.

I
in prescribed burns, with populations growing in the more open habitats being
expected to accrue higher mortalities. Furthermore rocks appear to form the
only effective barriers between cedar seedlings and mortality in even the coolest
of fires. The selection of microhabitats effectively protected by rocks should thus
be the main criteria upon which restoration programs involved in the planting of
nursery grown seedlings are based.
The discussion thus far has not dealt with the atypical findings from Forestsum.
At this site none of the four variables influenced the survival of trees during the
intense wildfire experienced in November 1984. The explanation for this relates
to the unusual characteristics of this particular fire. Forestsum is situated within
what was, prior to the 1984 fire, the largest remaining extensive forest of
W. cedarbergensis. It contained a very even age structure of trees in excess of
200 years old. Many of the trees at Die Bos, as this forest is locally called, are
characterised by an unusual shape. They branch extensively from the base, with
their lower foliage at ground level, suppressing the undergrowth (plate 6).
Furthermore the forest is situated on a gentle slope with very few rocks for
protection. The fire itself burnt at very high intensity (Hendricks pers. comm.)
and, unusually for cedars, predominantly as a canopy fire (plate 7). This was
probably a result of the shape of the trees together with their high density.
Consequently the normal characteristics by which a tree survives heat scorching
were ineffective and there was thus no relationship between class, or crown base
height, and survival. Similarly the few rocks that were present at the site were
ineffective in influencing the movement of the fire between canopies . Evidence
of senescent fynbos among the islands of surviving trees at this site suggest that
survival was more a function of the random spread of the fire than any
characteristics of the trees themselves.
With regard the selection of sites for prescribed burning in the more typical
scattered habitat of contemporary cedar populations, this study suggests that
characteristics of the site and tree can be utilised in predicting the expected levels

Plate 6. A typical cedar from Die Bos
(Forestsum) branching extensively from
ground level. The vegetation around these
trees is minimal.
Plate 7. The 1984 fire which infiltrated Die Bos devastated vast tracts of the forest. A single living tree
is visible on the skyline, while a clump that was missed by the fire is visible in the right foreground.

I
I
of mortality in fire. The more protection afforded trees by rocks at a site, the
lower will be the mortality in prescribed burns. Furthermore survival in cool or
moderate fires requires the attainment of a basic size structure at which stage the
trees bark is sufficiently well developed to survive scorching, while its height
permits at least some foliage to be above the critical heat zone of the fire. Field
data indicates that this basic size requirement is only reached in trees of 20 cm
and more in diameter (Fig.7). A cool fire is then likely to only burn the lower
foliage, leaving the more resistant upper foliage undamaged. In this way trees
surviving controlled burns become more resistant to the threat of wild fires in
that their living foliage is situated higher above the flames. Thus where possible
controlled burns should not be carried out at sites containing cedar populations
with a high proportion of the more vulnerable size classes. Juvenile dominated
populations such as occurred at Panwin and Donkwin should not be burnt until
the populations balance shifts towards the more tolerant size classes . In these
cases it would be better to reduce the threat of wildfires by patch burning
peripheral areas until the trees have grown sufficiently to provide them with a
better chance of survival. There are many areas both inside and outside the cedar
reserve which contain predominantly older tree classes, or lack cedars
completely. It is these areas which need to be prioritized for prescribed burning
in order to reduce the threat of large wild fires. This management option will be
discussed further in part C of this study.

I 11
I
Part C. Application of a transition matrix model to explore
mana2ement options for the Clanwilliam cedar.
Introduction
Matrix models are a powerful tool for investigating population dynamics . They
are becoming increasingly more common as a means of investigating population
processes of plants at the individual species as well as community levels (Silva
etal. 1991). By incorporating data on survival, growth and fecundity for plant
populations with mixed age (or stage) structures, they can be utilised to predict
the future development of a population. For each stage in a plants life cycle the
probability of remaining at that stage or changing to any of the others in a given
time interval is calculated ·from observations in the field . The transition
probabilities for each stage in the plants life cycle are entered into a transition
matrix. The matrix is square with the same number of rows and columns
representing the probability of every transition from one stage class to another
(see appendix 3). By multiplying the matrix by a starting population (a vector
giving the number of trees in each stage class) the population development over
one time interval can be calculated. This can be represented as follows
A X n(t) n(t + 1)
where A is a population matrix, n(t) is the starting population and n(t + 1) is the
population size after one time interval. With repeated multiplication of the
transition matrix:
A X n(t) - n(t + 1), A X n(t + 1) n(t + 2), etc,
the size structure of the population will stabilize at a constant ratio of stage
classes. Once the stable age structure has been reached, A (the population growth

rate) can be calculated
n(t + 1)
n(t)
If the eigenvalue (A) derived for the transition probability matrix is > 1, the
population should theoretically expand, whereas if this value is < 1, the
population will decline. It is important to note that this approach is entirely
deterministic and based on certain underlying assumptions. If these assumptions
are not met, A, as well as any predictions made by the model, will be inaccurate.
This matrix model approach was utilised by Manders (1987) to simulate the
dynamics of W. cedarbergensis. In particular he wished to determine whether this
species is capable of expanding its population, or whether it will become extinct
regardless of attempts at conservation. He also aimed to investigate the optimum
interval between fires to allow for the survival of the species .
The Model
Manders (1987) divided the cedars into eleven tree classes starting at seed
through to trees with dbh of greater than 40cm (appendix 1). He made use of
enumeration data which had been collated for a number of permanent plots
established between 1970 - 78. Certain plots with reliable and complete data
were re-enumerated during 1983 and 1984. In each plot, all individuals were
labelled with numbered steel labels and diameters recorded at the first
enumeration. Subsequently, individuals were re-measured and deaths due to fire
and other reasons were recorded. Using this information it was possible to
develop a transition count matrix for each plot and then standardize these
matrices into a transition probability matrix covering a one year interval for the
species (appendix 3). Using this transition matrix he calculated an eigenvalue (A)

of 1.02026, after 198 iterations (years), thus indicating that if the assumptions of
the model are met, cedar populations are capable of increasing in the absence
of fire.
The major shortcoming of this model relate to its predictions on mortality in fire.
As mentioned earlier fire plays a major role in the dynamics of cedar populations
and is the primary tool with which the species can be managed. Manders
admitted that the estimation of mortality in a fire presented a considerable
problem. The model assumes that mortality in fire increases with vegetation age
as the fuel loads around trees increase. This was supported by the findings of
Andrag (1977) and by Manders (1987) data on mortality in wildfires. A crude
estimate of increasing mortality in fire with increasing vegetation age was
estimated by fitting a quadratic function to three points, consisting of an arbitrary
rate of 0.99 in vegetation up to 4 years old, and observed survival at 17 and 35
years. This function takes no account of varying fire intensities. Using the
function to calculate mortality in fire after various time intervals, it was predicted
that an interval of 15 to 20 years between successive fires would ensure the
conservation of existing stands of cedars. It was concluded that, "as the bulk of
the cedar habitat is of much the same age (ca. 10 years) after fire, it should be
possible to collect more appropriate data in a few years time, and use the model
with modified fire mortalities to make more substantive prescriptions" (Manders
1987). The devastating fire of December 1988 - January 1989, which totally
destroyed vast areas of cedar habitat, burnt predominantly in vegetation of just
13 years old. This highlights the need for improving the fire mortality
component in the model.
This study uses field data on cedar mortality after fires of varying intensity to
simulate the impacts of fire on cedar populations. I make use of Manders (1987)
transition matrix for the cedar and incorporate real post-fire mortality data from
both wildfires and controlled burns to investigate various management options for
the future conservation of this species.

Four aims were highlighted for the modelling component of this project;
1. To evaluate the importance of the different components of the life
cycle using elasticity analysis. This will have important implications for
setting management priorities.
2. To explore Manders (1987) proposed 15 - 20 year fire cycle using real
post-fire mortality data. By exploring various fire cycles and fire
mortality levels it is hoped that better predictions can be made with
regards future management strategies for the general cedar habitat.
3. To explore the fire control requirements of the natural cedar forest
(Forestsum).
4. To examine the theoretical long term predictions of implementing the
proposals of the cedar reserve.
Methods
Elasticity analyses
Transition probability matrices not only provide a means of predicting the future
development of a population, but can also act to measure the response in
population growth rate (A) to changes in each transition probability. It is thus
feasible to examine what impact potential ti mistakes ti made in generating a
transition will have on overall population growth rate. Manders (1987) used this
technique to analyze what impact changes in the most variable transition in his
model, seeds to seedlings, would have on growth rate. By reducing the
proportion of seeds developing to class 2 plants by a factor of 10, he found that
A only decreased to 1.00103. From this he could conclude that even if this
transition value was inaccurate, it would have little impact on the outcome of the
simulation.

A technique, developed since Manders study, is the derivation of elasticity
indices which calculate the relative importance of each transition in influencing
population growth. Elasticity analysis provide a rapid method for calculating the
proportional change in A resulting from proportional changes in the matrix
coefficients and thus quantifies the degree to which population growth 1s
determined by the individual transition values in the matrix model. It 1s
calculated using the equation
e .. IJ y . X W·
I J
X <v,w>
where eij is the elasticity, ~j is the (i,j)th element of the matrix A, and v and w
are the dominant left and right eigenvectors, respectively (de Kroon etal. 1986)
The derivation of the elasticity analyses from Manders cedar transition probability
matrix is presented in appendix 4.
Simulations
The model
A simple program was designed, using true basic, in order to model the long
term impacts of various fire regimes on cedar populations ( appendix 5).
Simulations of this type can be· modelled using a spreadsheet package. However
the large amount of data, making spreadsheet operations very slow, together with
th~ necessity for loop operations, makes programming a more effective method.
This program allows for manipulation of the starting populations of all size
classes, the fire frequency, the number of fires and the degree of mortality in
each fire. A flow diagram showing the major steps in the program is given
in appendix 5.

Calculating mortality at a site.
For the model it was necessary to determine the proportion of trees in each size class
which survived in the various fires. The proportion of trees surviving the effects of
fire was calculated from random samples of approximately 200 trees at each site (see
part B methods and table 2) . As all tree classes have equal chance of growing in a
patch which is not burnt by the fire, the overall proportion of all trees which escaped
being burnt was calculated and this value added to the proportion which survived
being burnt in each size class;
eg. overall propn. of class 7 surviving at a site +E
where s7 is the proportion of trees in class 7 which survived the fire , k7 is the
proportion killed by the fire and E is the proportion of all the trees enumerated which
survived by growing in patches within the site which were not burnt. In this way the
proportion of trees in each size class which were not killed by the fire were calculated
for each site (Table 2) .
The value of E can be expected to decrease with the intensity of the fire. However
as mentioned earlier, other factors such as vegetation type, rock cover and the
patchiness of previous fires will all influence the movements of a fire front. Thus E
is a highly simplified index for fire patchiness. A better understanding of factors
influencing the dynamics of fire patchiness will be necessary before more accurate
predictions are to be made with regards its influence at the population scale.
Combining mortalities from different sites.
Calculations in part B established that the results for the two sites which experienced
low intensity fires (A and B) were very similar to each other, as were those for the
two sites which experienced high intensity fires (D and E) . The survival data for
Panwin and Donkwin were therefore combined and the proportion of each size class

surviving a low intensity fire calculated. These values were then used as survivorship
rates for prescribed burns in the model. The same process was adopted with
Sneeusum and Hoogsum data for high intensity burns (appendix 6).
Owing to the very poor recruitment after prescribed burns in winter, current
management guidelines require that the burns should be carried out in late summer or
autumn (1 January to 15 April) under conditions which minimize adult cedar mortality
but ensure adequate recruitment (Anon. 1986). It was unfortunately not possible to
collect field data on mortality levels for a late summer/autumn prescribed burn. The
mortality figures recorded for the prescribed May 1988 fires at Panwin and Donkwin
were unusually high and probably correspond quite closely with favourably selected
late summer/autumn burns. However to test a worse case scenario for a late summer
prescribed burn, class mortalities intermediate to those recorded for summer wildfires
and winter prescribed burns were calculated (appendix 6).
The procedures used to simulate the various management options with the aid of the
model.
1. General cedar habitat
The model was used to examine the theoretical population development of cedars
growing in the general cedar habitat under various fire regimes. A number of
different fire cycles were tested by running the model for the stipulated number of
years between fires and then reducing the population according to the survivorship
rates calculated by the method described above. The same starting population as
utilised by Manders (1979 population at site A, Sneeuberg) was used for these
simulations (appendix 6). Ten fire cycles were executed for all simulations, as this
was found to be sufficient for determining future population trends resulting from the
various management options. From the elasticity matrix it was evident that size
classes 8 to 11 are the most important for population growth (see later discussion).

Thus in the figures, the effects of different fire cycles are demonstrated by their
impacts on these classes by summing the number of class 8 to 11 trees alive after each
fire .
1.1 Wildfires
Fire free intervals of 15, 50 and 80 years were simulated. Fifteen years was the
minimum interval between fires predicted by Manders (1987) to enable cedar
population to sustain themselves , and approximates the natural fire interval. The 50
and 80 year intervals are unrealistically long (unless protected) . They were simulated
to explore the time needed between intense wildfires if a population is to recover and
expand. At each fire the number of trees in each size class were multiplied by the
fraction which would be expected to survive in an intense wildfire (appendix 6) .
1. 2 Prescribed burns
To assess the impact of controlled winter burns as a management option, the model
was run using the mortality data collected from Pan win and Donkwin ( appendix 6).
Simulations of 12, 15 and 20 year intervals were investigated. To test a worst case
scenario for a late summer prescribed burn, the model was run for 15 and 20 year
intervals with fire mortalities intermediate to those observed for summer wildfires and
winter prescribed burns (appendix 6). One of the options available to managers is to
clear vegetation away from around the large adult trees before burning, and thereby
increase their chances of survival in prescribed burns . To examine the potential
impact of this action on a worst case scenario late summer burn, the proportion of
class 10 and 11 trees surviving a fire were increased to 1 (ie 100 % survival) while
leaving all other survival probabilities constant.

2. Die Bos
In order to gain some insight into the management strategy required to conserve the
forest at Die Bos, the mortality figures from the 1985 fire at this site (appendix 6)
were incorporated into the matrix model and various fire intervals examined. The
starting population is given in appendix 6 and was calculated from a survey of
approximately 1 Ha of part of the existing (1994) population at the site. The number
of seeds (class 1) was calculated by multiplying trees in the seed producing classes by
their average annual seed production calculated by Manders (1987). The model was
run for ten fires at an interval of 15, 40 and 50 years between fires .
3 The cedar reserve
Management guidelines for the cedar reserve require low intensity patch burning at
a three to four year cycle in late autumn/early winter (van der Merwe and Wessels
1993). Both Panwin and Donkwin were burnt for the first time as part of this
program, resulting in high mortality in all except the largest tree classes. It is to be
expected that mortality will be higher in the initial fire, as the surrounding vegetation
in most of the cedar reserve is in excess of forty years old (Hendricks pers. comm.)
(plate 8). A second fire after only four years is unlikely to burn the same area,
instead burning patches missed by the previous fire. Thus a more realistic simulation
of what might be expected in the cedar reserve is an initial fire resulting in high
mortality, followed by lower mortalities in fires with an 8 year interval. Management
guidelines also require that nursery-reared seedlings be planted out after fires to
booster recruitment. It has been proposed that the reserve be divided into four blocks
and that planting be carried out sequentially in one block a year (Privett Unpublished
report). This will mean that seedlings are planted at the same site at a minimum
period of four years apart. However seedlings are only planted after an area is burnt
and thus, for simplicity, plantings in the model was confined to the year after each
prescribed burn. Although it was originally proposed that a target density of 1000
seedlings per hectare be aimed for (van der Merwe and Wessels 1993), a shortage of

suitable microhabitats means that this figure is probably closer to 500 seedlings per
hectare in reality. Two hypothetical scenarios for managing the cedar reserve
according to the required guidelines can be simulated using the model.
* In those instances where cedar stands already exist.
* In those situations where no cedars are present.
3.1. Starting population of adult cedars.
The pre-fire populations at Donkwin and Panwin were combined and utilised as the
starting population (appendix 6) . In order to stimulate the planting out of nursery
reared seedlings, a value of 500 was added to class two after every fire . The model
was adapted to incorporate the initial high mortality as measured at Panwin and
Donkwin, followed by reduced mortality in fires at a eight year cycle. As no
secondary prescribed burns have as yet been carried out in the reserve, an arbitrary
20 % increase in survival was added on to the figures derived from the initial winter
burns at sites A and B (appendix 6). Although this value is purely subjective, it is,
if anything, likely to be an underestimate of fire survival in eight year old vegetation.
To test the importance of planting seedlings, the model was also run without the
addition of any class 2 individuals after fires.
3.2 Sites with no living cedars
Many suitable cedar habitats within the reserve contain no, or very few, living trees .
It is been considered by management to burn and plant these areas first , before
disturbing the existing stands of trees (Wessels pers. comm.). The model was thus
run with a starting population of 1000 class two seedlings and no other trees. In order
I to examine the time needed for seedlings to reach the more fire resistant size classes,
the model was initially run without fires for 100 years . The model was also used to
simulate the impacts on a starting population of seedlings of an eight year fire cycle
with and without the addition of 500 seedlings after each fire .

2 3 4 5 6 7 8 9 10
11
Results
Elasticity analysis.
2 3 4 5 6 7 8 9 10
0 0 0 0 0 2.7E-05 0.00127 0.00076 0.00223 0 .00325 0.01574 0.04218 0 0 0 0 0 0 0 0
0 0.0139 0.02827 0 0 0 0 0 0 0 0 0.00184 0.01013 0.02465 0 0 0 0 0 0 0 0 0.00137 0.0052 0.01828 0 0 0 0 0 0 0 0.00241 0.00338 0.00328 0.00892 0 0 0 0 0 0 0 0.00034 0.00033 0.0009 0.00698 0 0 0 0 0 0 0 0 0 0.00977 0 .10381 0 0 0 0 0 0 0 0 0.00467 0.00902 0.14574 0 0 0 0 0 0 0 0 0 0.01146 0.15272 0 0 0 0 0 0 0 0 0 0.00821
Table 10. Elasticity analysis for W.cedarbergensis derived from the transition
probability matrix of Manders in appendix 3.
The elasticity indices provides information about the extent to which population
growth depends on survival, growth, and reproduction at different stages in the life
cycle (Caswell 1989). It is thus evident that size classes 8-11 make the largest
contribution to population growth, whereas the smaller size classes contribute very
little. Together these three largest classes have a proportional contribution of 75 .3 %
of the total elasticity of the life cycle, while no other size class contributes more than
5%.
l
11
0.00821 0 0 0 0 0 0 0 0 0
0.35111

Simulations
1. General cedar habitat
1.1 Wild.fires
9 CD 1/) 1/)
cc u o E 1 :J en
0 2 3 4 5 6 7 8 9 10
Number of fires
1--- 15 yr Interval -- 50 yr interval -- 00 yr interval
Fig. 8. The development of a cedar population subjected to intense wildfires at various intervals.
The population rapidly declines to extinction in both the 15 and 50 year interval
simulations. It is only once the interval between intense fires is extended to 80 years
that the population can be expected to increase slightly.
1. 2 Prescribed bums
1/)
~ 1 u o E :J en
0 1 2 3 4 5 6 7 8 9 1011121314151617181920 Number of fires
1--- 1 2 yr interval -- 1 5 yr interval -- 20 yr Interval I Fig. 9. The development of a cedar population subjected to prescribed burns at various intervals.

At all three intervals there is an initial decrease in the sum of classes 8 to 11 followed
by varying degrees of population expansion. The population remains virtually stable
with a 12 year interval, increases very slightly with a 15 year interval and increases
rapidly with a 20 year interval between prescribed burns.
Worst case sce,iarip prescribed bums.
Fig. 10.
E CD
"' "' rn u 0 E :::J
(/)
0 2 3 4 5 6 7 8 9 10 Number of fires
1-- Intermediate ---- class 1 o + 11 = 1
The theoretical development of a population of cedars subjected to a worst case
scenario prescribed burn (i.e. mortality is intermediate between that recorded for the
wildfires and the prescribed burns) on a twenty year cycle. (The upper curve
represents a population in which all class 10 and 11 trees survive the fires).
At both fifteen and twenty year intervals the model predicts that the population will
decline rapidly (fifteen year interval not included in graph). However by reducing the
mortality of classes 10 and 11 to a value of zero, while keeping all other mortality
values constant, the population, after initially decreasing, will increase if exposed to
a twenty year interval between fires.
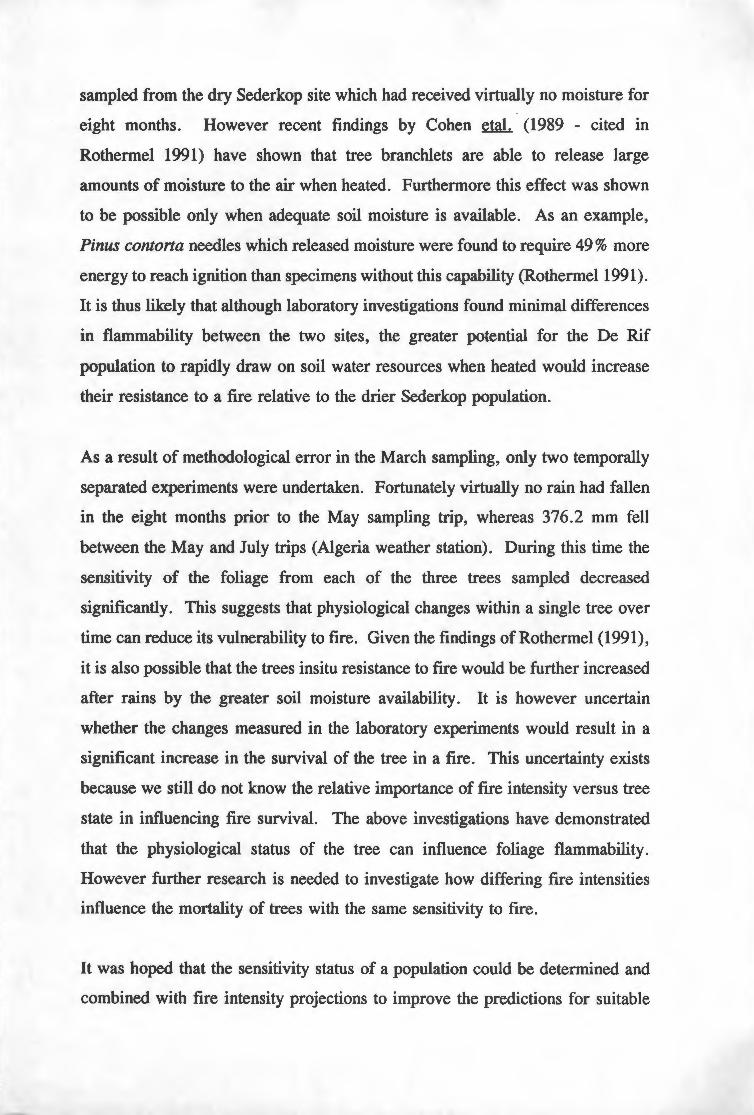
2. Future management of Die Bos a, ~ I;:
iii 250 'a a, 2 200 ai ~
~
fl 150 CD
"' 100 "' [tJ
u a 50 E :, (/)
0 0 2 3 4 5 6 7 8 9 10
Number of fires
1---- 15 yr Interval --- 40 yr interval ----- 50 yr interval J
Fig. 11. Theoretical population development at Forestsum Bos under alternative fire intervals.
On the basis of the model, the population at Forestsum will decline rapidly towards
extinction if exposed to a fifteen year fire interval. It is predicted that a fire interval
of forty-two years is the minimum timespan required to enable a long-term positive
growth rate for this population. A fifty year interval between fires will ensure,,i,n a
steady increase in population size.
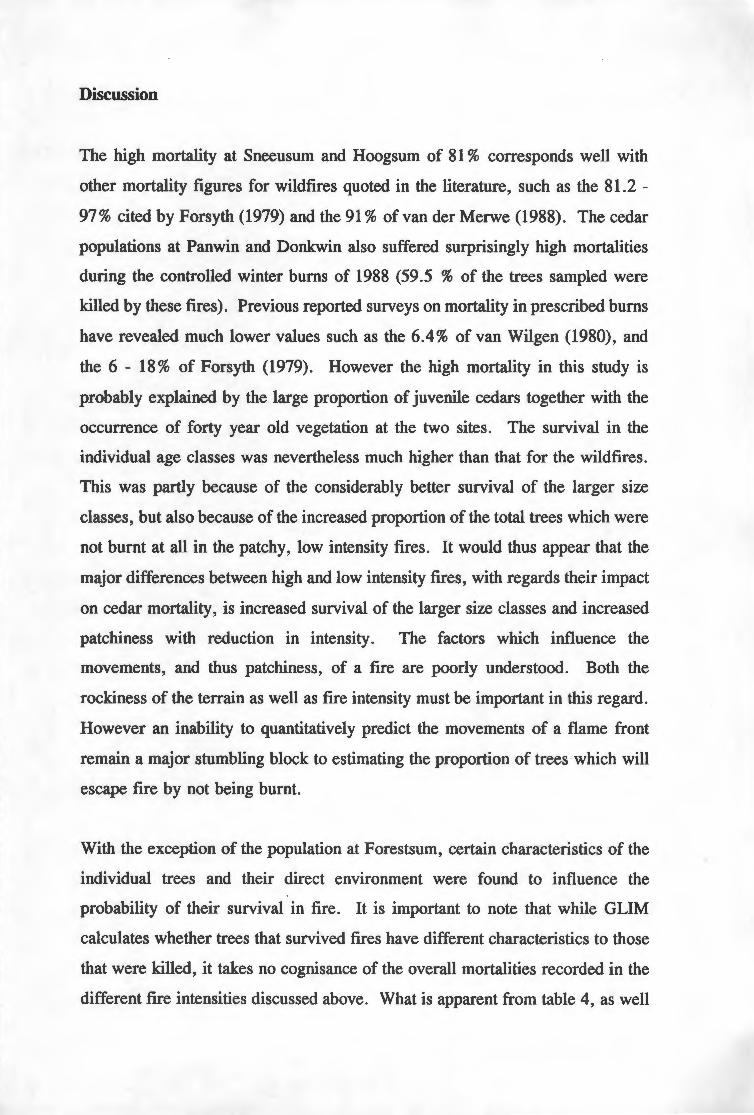
3. Management of the cedar reserve.
3.1 Starting population of cedars
Fig. 12.
fl CD
"' "' [tJ
u a E :, (/)
0 1 2 3 4 5 6 7 8 9 10 11 12 13 14 15 Number of fires
1---- + 500 class 2 ---- no seedlings added J
Theoretical development of a population of cedars in the cedar reserve exposed to an
8 year fire interval, with and without the addition of 500 seedlings after each fire.

The model predicts that the initial fire has a maJor impact on the population.
However the population is able to gradually recover under the reduced mortality levels
of fires burning in eight year old vegetation. The addition of 500 seedlings after each
fire results in a much more rapid increase in population development.
3. 2 Sites with no living natural cedars
When the model was run with a starting population of 1000 seedlings and no fires, 47
classes 8 - 11 became established in 100 years. The model predicted that it would
take at least 30 years for class 2 individuals to reach a DBH of 20 cm. In the absence
of fire the population growth rate 'A stabilizes at 1.020299 after 233 years.
G) L.
i.: L. G)
~ G)
-~ ca .... .... 0 ... (0
1/) 1/) Ctl () -0
E :J
(/)
Fig. 13.
18
16
14
12
10
8
6
4
2
0 0 1 2 3 4 5 6 7 8 9 10 11 12 13 14 15
Number of fires
1----- + 500 class 2 - no seedlings added
The development of 1000 seedlings exposed to prescribed burns at an 8 year fire
interval, with and without the addition of 500 planted seedlings after each fire.
When no post-fire seedlings were planted the population was unable to establish. The
addition of 500 seedlings after each fire enabled the population to expand.

I I
Discussion
Elasticity analysis
The results of the elasticity analysis emphasises the importance of the larger size class
trees for cedar conservation, as it is their survival/transition which contributes most
to population growth. Mortality in these size classes will most strongly influence the
future survival of cedar populations. This highlights the necessity of conserving the
larger size classes in fires and thus supports the objectives of the cedar reserve. Much
of the emphasis of recent cedar research and management has been directed towards
ensuring adequate postfire regeneration (Manders and Botha 1989, Mustart etal. in
press). While not discounting the importance of this aspect, any management action
which leads to the death or damage of adult trees will be having a major negative
impact on the status of this species. As an example, the Panwin site in the cedar
reserve was burnt in prescribed fire and subsequently planted with seedlings.
However the fire was unexpectedly intense, killing or damaging the majority of
reproductively active trees, while the majority of seedlings planted have since died
(pers obs.). Thus despite the good intentions of management, a healthy and viable
population before human intervention has been severely and possibly irreversibly
impacted by injudicious fire management.
The value of the adult trees in contributing to population growth also provides
evidence for the immense impact that wood cutters must have had on cedar
populations. By selecting only the most healthy adult trees for felling, they removed
the crucial components of population growth. With every adult tree -removed,
population fecundity was proportionally reduced, and the impacts of later fires would
have become all the more devastating.
General cedar area
Summer wildfires such as occurred in 1988/89 have a devastating impact on cedar
populations. Given the importance of the large size classes to population
development, it is the high levels of damage and death of these trees in wildfires

I I
I
I I
I
which has the greatest impact on the future of the population. It is evident that if the
high intensity wildfires such as occurred on the Sneeuberg range in 1975 and 1988/9
continue to occur at a similar interval in the future, the population will rapidly decline
towards extinction. The model predicts that a fire free interval of 80 years is required
if the population is to remain viable. However in the general cedar habitat,
management has to be directed toward the maintenance of species diversity (Kruger
and Bigalke 1984, van der Merwe and Wessels 1993) which according to Bond (1980)
and van Wilgen (1981) requires a fire interval of between 12 and 20 years.
Furthermore the fire history of the Cedarberg mountains for the period 1956-1986
showed an average frequency of 11-15 years between fires (Brown etal. 1991). The
only viable option is thus to pre-empt intense wildfires, by implementing prescribed
burns under more favourable conditions within the required fire cycle.
The major advantage of prescribed burns under cool favourable conditions is that they
have little impact on the largest size classes (fig. 7) Evidence from the field also
suggests that the cooler fires tend to burn more patchily, thereby allowing more trees
to escape damage. As evident from the simulations, these factors combine to reduce
the impact of the fire and enable cedar populations to recover between fires. Even
under the most severe prescribed burns (as simulated with the intermediate fire
mortalities), the model predicts that at a 20 year interval cedar populations will expand
if the two largest size classes are protected from fire. This once again illustrates the
importance of the larger size classes and thus the need to prevent mortality of these
classes in prescribed burns.
The idea behind using prescribed burns is to preempt large devastating wildfires. It
is therefore necessary to make the interval between fires as short as possible while not
having a detrimental impact on cedar populations. The model predicts that a fire cycle
of 15 to 20 years will ensure that the population expands, while an interval of 12 years
will result in the population remaining virtually constant. This presents a major
dilemma to managers, as an interval as short as thirteen years can, as was the case
with the 1988/89 fire, result in devastating wild fires. Thus the decision has to be

I I I
I
I I
made as to whether to leave a block for 15 - 20 year interval and thereby ensure
adequate post fire recovery while running the risk of the increased threat of wild fires,
or to burn after a 10 - 11 year interval, preempting wildfires, but reducing population
size. A possible solution may lie in selecting low cedar density areas for the shorter
interval burns to reduce the overall threat of wild fire threat, while leaving the more
populous cedar sites for the longer intervals.
Regardless of the precise interval adopted, the essential criteria is to reduce
flammability on the landscape scale by breaking the vegetation up into different aged
compartments. The present uniformity of vegetation age structure ( 6-10 yrs) over the /
majority of the cedars distribution is once again posing the threat of a large scale
wildfire within the next decade.
Die Bos
The forest at Die Bos provides management with a major conservation challenge. It
also provides scientists with valuable clues as to how cedars have declined to their
present status. A variety of sources have argued, with little evidence, for the theory
that cedars were much more abundant in the past, and that their dense stands
suppressed undergrowth, thereby increasing resistance to fires (Van der Byl 1895).
The 1985 fire which burnt the extensive closed canopy forest at Die Bos provides an
excellent opportunity for further investigating this hypothesis. The fire burnt under
extremely dry and windy conditions, and moved rapidly through the forest
(Hendrickse pers.com). However despite the devastated appearance of the forest,
closer inspection reveals some interesting facts. Although only 14% of the trees
growing in the fire's path survived, a further 30% of the trees sampled survived as a
result of the fires patchiness (table 2). It is therefore probable that although these
large forests would burn, they would do so only under the most intense conditions.
Under these conditions the fire moves rapidly through the canopy bypassing certain
tracts of the forest.

I
I
I
Post fire regeneration at Die Bos ranged from very good to virtually non-existent.
The post fire recruits are now over 1 metre tall and well established (plate 9). A
survey on the upper northern boundary of the forest revealed virtually no visible
recruitment. Although there were reports of severe seedling mortality due to livestock
browsing after the fire (Bands 1986), a more likely explanation for this lack of
recruitment was the intensity of the fire in this area. This is evident from the many
trees which were burnt to the ground as well as the large scale soil erosion which has
exposed tree roots. The fire appears to have burnt less intensely through the rest of
the forest and consequently post-fire recruitment was much better in these areas. A
survey of approximately 100 m2 above the Agtertafelberg footpath revealed a sapling
to adult ratio of 7. 9: 1 ( 435 saplings: 55 adults). A similar ratio was obtained from
a survey of the recruitment of seedlings after a fire in the planted forest at De Rif.
Recruitment from closed canopy forests can be expected to be far superior to that in
more scattered populations, both as a result of greater seed loads and better
microhabitats for seedling development.
It can thus be hypothesised that large cedar groves were able to suppress undergrowth
and thereby prevent all but the most intense fires from infiltrating them. These intense
fires were probably seperated by long fire free intervals, as was the case at Die Bos,
allowing the population to reach maturity and expand between fires. Even the
occurrence of these very intense fires would probably have left some portions of the
population undamaged. Except under the most intense conditions, post-fire
regeneration in the burnt areas would have been very good, while the unburnt patches
would have further supplemented population recovery.
While not suggesting that the Cedarberg was ever covered with a blanket of cedars,
evidence from this site suggests that similar large groves might well have occurred at
other favourable localities within the range. An increase in fire occurrence relating
to human activities, together with the influence of woodcutters could thus explain the
demise of these cedar groves. It is apparent from Die Bos that large areas covered
by dense trees prior to the fire, and which showed no post-fire recruitment, are

Plate 8. Dense restio-veld such as this is
typical over much of the cedar reserve. The
young cedars at this site will almost certainly
be killed in a prescribed fire.
Plate 9. Regeneration at Die Bos 9 years after the fire. Trees in this area were killed by a canopy
fire as is evident by the tall individual on the left.

already covered in typical Cedarberg fynbos . A further fire before recruits reach
maturity, and this once great population will have been reduced to a few scattered
trees inside the space of twenty years.
Thus as would have been the case in the cedar groves of the past, the biggest threat
to Die Bos is the occurrence of another fire before the recruits have matured and
established a large enough seed bank. The model predicts that a fifty year interval is
the minimum protection period that management should aim for to conserve Die Bos.
The current status of the forest, with its many dead trees and young saplings, makes
it particularly susceptible to wild fires which occur naturally at a frequency of about
15 years. It will thus be necessary for management to embark on a proactive fire
protection program for this population if this unique remnant of cedar heritage is to
be conserved.
Cedar Reserve
At this stage it is difficult to simulate the proposed management guidelines for the
cedar reserve as no sites have been patch burnt twice, and none of the planted sites
have been re-burnt. However if the assumptions of the model are met, an existing
population of cedars, supplemented with seedlings after each fire, can be expected to
increase with an eight year interval between prescribed burns. Even if no post-fire
seedlings are added, the model predicts that given the expected lower mortality in
secondary fires, populations of cedars will gradually expand. The addition of the
nursery-reared seedlings does however lead to a marked improvement in the rate of
the recovery of the population, and is thus an important component of the program.
There are many areas of suitable cedar habitat within the Cedar Reserve which contain
no, or very few, trees. It is primarily these areas which have up until now been
selected for burning and planting of cedars. A starting population of 1000 class 2
individuals burnt on an 8 year rotation result in the rapid decline of the population
unless it is continuously bolstered by more seedlings after each fire . The mortality of

planted seedlings in fire is one of the major concerns of management in the reserve.
Thus far no planted sites have been re-burnt owing to concern for the expected high
mortality of the artificial regenerates. It makes no sense to go to the considerable
effort of growing and planting seedlings only to kill them in their first prescribed
burn. However attempts to protect them from fire until they reach maturity and thus
become more fire resistant opposes the policy of maintaining young vegetation in the
reserve.
It is therefore most important that seedlings are only planted in very fire protected
microsites. If the site is then burnt and the seedlings die, it is evidence that those
sites are unsuitable and should not be re-planted. Another option is to avoid burning
recently planted sites. By patch burning the many unplanted areas in the reserve it
will still be possible to reduce the overall fire threat considerably, and at the same
time allow the artificial regenerates to become better established. According to the
model a minimum fire free period of approximately thirty years is necessary to enable
seedlings to reach the 20 cm diameter required for adequate protection against
prescribed burns. The decision as to whether planted sites should be burnt at an eight
year interval, or left until they reach maturity, can only be made once some trial plots
are burnt and mortalities of planted seedlings measured.
As was the case with the general cedar habitat, the aspect crucial to the success of the
reserve will be to minimize the loss of larger size class trees in fires. The model's
prediction of increasing populations at an eight year interval is dependent on the high
level of survival in prescribed burns. These can only be achieved by burning under
optimum conditions. Furthermore those sites with few or no adult cedars should be
prioritized for initial burning. As a further precaution, the few large trees at these
sites could have the vegetation cleared away from underneath them. Thus the model
predicts that if mortality in fire can be kept low enough to ensure adequate survival
of trees (especially in the larger size classes), populations of cedars will expand under
the current management guidelines for the reserve.

I I
GENERAL DISCUSSION
This study has highlighted the importance of conserving the larger size class trees in
cedar management. The four largest size classes provide the major contribution to
population growth and should thus be granted the main conservation status. Owing
to the high mortality in these classes during intense wildfires, a continuance of fires
such as occurred in the Sneeuberg range in 1975 and 1988 could result in the
extinction of the Clanwilliam cedar over much of its distribution range. It is thus
essential that the threat of wildfires be reduced by prescribed burning both inside and
outside the cedar reserve. In areas containing cedars, the most important aspect of
these prescribed burns is that they be performed under optimum conditions allowing
for both adult survival and adequate post-fire regeneration. The findings of this study
suggest that the sensitivity of cedar foliage to scorching changes with season, and
consequently decisions as to when to burn should take this into account. However the
importance of this characteristic needs to be further explored and a correlative test for
determining the best time to burn derived. At this stage the present strategy of
burning in late summer/early spring after the first rains would appear to be the most
appropriate.
To enable populations to persist in the general cedar area requires as much time as
possible between fires to enable the population to develop many large seed producing
trees and ther~by ensure adequate post fire recruitment. However at the same time
prescribed burns are necessary to reduce the threat of wildfires. It is therefore
proposed that the interval between prescribed burns should range from 10 to 20 years
at the discretion of the manager, with the cedar rich compartments being allocated the
longest intervals. Where feasible, populations with a large juvenile component should
not be burnt until they have reached a more fire tolerant size (preferably 20cm DBH).
The establishment of the cedar reserve should not mean that populations outside the
reserve are neglected. Careful fire management which reduces the threat of large
wildfires, but at the same time conserves biodiversity, is required. Furthermore
artificial regeneration need not be confined solely to the reserve. There are many

easily accessible populations which showed minimal regeneration after the 1988 fire
that could be bolstered by seedling planting.
The future of the large cedar forest along the Agtertafelberg footpath (Die Bos) is
threatened by further wildfires. Owing to the uniqueness of this population it is
suggested that some form of proactive fire prevention strategy be instigated at this site.
Die Bos needs at least a further forty years of protection to allow for adequate
I recovery from the last fire.
The selection of sites to burn in the cedar reserve needs to take cognisance of the
number of cedars present, their size and the degree of protection afforded by rocks.
Ideally the best sites for patch burning are those with the lowest density of cedars
(preferably large size classes) and with a very rocky terrain. Owing to the age of the
vegetation in much of the cedar reserve, it is important for the conservation of existing
populations that prescribed burns are only administered under optimal conditions.
Populations with a large proportion of the more vulnerable size classes can be
expected to show high mortality and where possible should not be burnt. The most
important component of the seedling transplant program is that seedlings are only
planted in habitats well protected from fire. Although mortality in prescribed burns
of planted seedlings requires investigation, it may be preferable if the planted sites are
not burnt for up to thirty years after planting to allow for individuals to become more
tolerant to fires. This will require that areas peripheral to planted sites are regularly
burnt to reduced the risk of wildfires.

Acknowledgements
I am grateful to Prof W. Bond for his time spent in supervising this project and for
reviewing an earlier draft of the manuscript. Special thanks to Penny Mustart for
originally involving me in the Cedar workshop and encouraging me to carry out this
research. I am also most grateful to Mr S W van der Merwe and Cape Nature
Conservation for allowing me to carry out this research in the Cedarberg. The
discussions, hospitality and logistic assistance provided by Nigel Wessels of Algeria
Forestry Station was invaluable and much appreciated. Thanks also to Petrus
I Hanekom and in particular Abie Hendrickze for their valuable assistance and
knowledge in the field.

I I
Literature cited
Andrag RH 1977. Studies in die Sederberge oor (i) Die status van die Clanwilliam
seder (Widdringtonia cedarbergensis) (ii) Buitelugontspanning. Unpublished
Msc. thesis. University of Stellenbosch.
Anon 1986. Guide lines for the management of the Clanwilliam cedar. Unpublished
report Jonkershoek Forestry Research centre. Dept. of Env. Affairs
Bands D P 1977. Prescribed burning in Cape fynbos catchments.
Proceedings of the Symposium on the Environmental Consequences of fire and
fuel management in Mediterranean Ecosystems. In: Mooney HA and Conrad
CE (Eds.) United States Department of Agriculture forest Services, Technical
Report, W0-3 pp. 245-256
Bands DP 1981. Policy memorandum Cedarberg catchment Area no.1 . Management
plan for the period 1979/80 to 1983/84. Department of forestry , Cape Town
(Unpublished report).
Bands D P 1986. Regeneration of Widdringtonia cedarbergensis at Die Bos,
Cedarberg State Forest. Unpublished report. Department of Environment
Affairs. Directorate of Forestry.
Bond W J 1980. Fire and senescent fynbos m the Swartberg, southern Cape,
S.Afr.For. J. Vol.114 pp.68-71
Bond W J 1993 Widdringtonia - An ecological paradox. Proceedings of the workshop:
The Clanwilliam Cedar: What is being done? FCC Report pp 6-8.
Brown P J, Manders PT, Bands DP, Kruger F J and Andrag RH 1991 . Prescribed
burning as a conservation management practise: A case history from the
Cedarberg mountains, Cape Province, South Africa. Biological Conservation,
56, 133-150.
Caswell H 1989. Matrix population models. Sinauer Associates, Inc. Publishers.
DeKroon H, Plaiser A, van Groenendael J and Caswell H 1986. Elasticity: the relative
contribution of demographic parameters to population growth rate. Ecology
Vol.59 pp.53-66
Finney M A and Martin R 1992. Modelling effects of prescribed fire on young
growth coast redwood trees. Can. J. For. Res. Vol. 23 pp.1125-1133

Forsyth G 1979. Report in training in conservation forestry at Jonkershoek forestry
research Station, Stellenbosch. Unpublished report, Dept. of Forestry
Hall A V and Veldhuis HA 1985. South African National Scientific Programmes
Report No 117. South African Red Data Book: Plants - Fynbos and Karoo
Biomes. Council for scientific and industrial research, Pretoria.
Hubbard C S 1937. Observations on the distribution and the rate of growth of the
Clanwilliam cedar Widdringtonia juniperoides. Endl. S.Afr.J.Sci. Vol.33
pp.572-586
Kruger F J and Haynes RA 1978. Preliminary results of studies on the demography
of Widdringtonia cedarbergensis Marsh and its interaction with fire.
Unpublished report Department of forestry.
Kruger F J and Bigalke RC 1984. Fire in fynbos . In Ecological studies 48, Ecological
effects of fire in South African ecosystems de V Booysen P and Tainton N M
(Eds.) Springer-verlag, Berlin pp 446-472.
Luckhoff H A 1972. The Clanwilliam Cedar. Its past history and present status.
Journal of Mountain Club of South Africa. Vol.74 pp 33.39.
Manders P T 1986. An assessment of the current status of the Clanwilliam Cedar
(Widdringtonia cedarbergensis) and the reasons for its decline. South African
Forestry Journal No. 139, pp. 48-53
Manders P T 1987. A transition matrix model of the population dynamics of the
Clanwilliam cedar (Widdringtonia cedarbergensis) in natural stands subject to
fire. For. ecol. Management. Vol.20 pp.171-186
Manders P T and Botha S A 1987. Experimental re-establishment of the Clanwilliam
cedar Widdringtonia cedarbergensis: A preliminary study. S. Afr. Tydskr.
Natuurnav. Vol. 17(3) pp.86 - 90_
Manders P T and Botha S A 1989. A note on establishment of Widdringtonia
cedarbergensis (Clanwilliam cedar). Journal of applied Ecology Vol. 26 pp. 571-
574
Manders P T, Botha S A, Bond W J and Meadows M E 1990. The enigmatic
Clanwilliam cedar. Veld and Flora Vol. 76(1) pp.8-11

McCullagh P and Nelder J A 1983. Generalised Linear Models. Chapman and Hall,
London.
Meadows ME and Sudgen J M 1991. A vegetation history of the last 14 000 years
on the Cedarberg, south-western Cape Province. South Afr. J. Sci. Vol.87
pp.34-43
Mustart P 1993. What is the Cedarberg without the Cedar? Details of a workshop on
cedar conservation management. Veld and Flora pp.114-117
Mustart P, Makua C, van der Merwe S W, Wessels N and Juritz J (in press).
Restoration of the Clanwilliam cedar Widdringtonia cedarbergensis: the
importance of monitoring seedlings planted in the Cedarberg, South Africa.
Richardson D M 1993. A review of the work on the Clanwilliam cedar by the South
African Forestry Research Institute. In: Mustart P. (Ed) Proceedings of the
workshop: The Clanwilliam cedar: What is being done? FCC report pp.3-5
Rothermel R C 1991. Predicting behaviour of the 1988 Yellowstone fires: Projections
versus reality. Int. J. Wildland Fire Vol.1(1) pp. 1-10
Silva J F, Raventos J, Caswell Hand Trevisan M C 1991. Population responses to
fire in a tropical savanna grass, Andropogon semiberbis: A matrix model
approach. Journal of Ecology Vol.79 pp. 345-356.
Smith CA 1955. Early 19th century records of the Clanwilliam Cedar (Widdringtonia
juniperoides Endl.) I.South Afr.For.Ass. Vol.25 pp.1-8
van der Byl J C 1895. Reports for the Conservators of forests for the year 1895.
Government printer, Cape Town.
Van Der Merwe S W 1986. Widdringtonia cedarbergensis : Voorstelle tov.
Sederreservaat - Cederbergstaatsbos. Unpublished Report, Department of
Forestry.
van der Merwe S W 1988. Die voorkoms en oorlewing van Widdringtonia
cedarbergensis in 'n brandgeneigde ekosisteem. Saasveld school of forestry .
Unpublished report.
van der Merwe S Wand Wessels N 1993. Current management - What is being done?
Proceedings of the workshop: The Clanwilliam Cedar: What is being done?
FCC Report pp 9-11

van Wilgen B W 1980. Assessment of the effects of burning on populations of the
Clanwilliam Cedar using aerial photography. South African Forestry Journal
No. 114 pp. 72-78
van Wilgen B W 1981. Some effects of fire frequency on fynbos plant community
composition and structure at Jonkershoek, Stellenbosch. S.Afr.For.J Vol.118
pp.42-55
Xanthopoulos G and Wakimoto R H 1992. A time to ignition - temperature -
moisture relationship for branches of three western conifers. Can. J. For. Res
Vol. 23 pp. 253 - 258
Zar J H 1984 Biostatistical analysis. Second Edition Prentice-Hall

APPENDIX 1. Categories used for the clasmication of cedars by height and
diameter for the transition count matrices. (after Manders 1987)
Definition Class
Seed 1
Seedling < 25cm high 2
Plants > 25 cm and< 50 cm high 3
Plants > 50 cm and< 75 cm high 4
Plants > 75 cm and< 100 cm high 5
Plants > 100 cm and< 150 cm high 6
Trees > 150 cm high with dia. < 5 cm 7
Trees > 5 cm dia. and< 10 cm dia. 8
Trees > 10 cm dia and< 20 cm dia. 9
Trees > 20 cm dia and< 40 cm dia. 10
Trees > 40 cm dia. 11

Appendix 2
Th
e results of the G
LIM
analysis.
1_;1_1M A
NA
LY
SIS OF C
OM
BIN
ED PA
NW
IN A
ND
DO
NK
WIN
DA
TA
. I
[ .i J $R
EA
? 3
1 2
1 2
1 0
[i
] $R
EA
? 3
1 2
3 2
2 0
[i]
$RE
A?
3 2
2 3
1 3
0 [o
] G
LIM
3
. 77
L
tpd
ate 0
(co
py
righ
t)19
85
k
oy
al
Sta
t.isl.ic:a
l (i]
SR
EA
? 3
2 2
3 2
1 0
So
cie
ty,
Lo
nd
on
(i]
$R
EA
? 3
2 2
4 2
1 0
[o]
(i]
SR
EA
? 3
2 3
3 2
1 0
(i]
?
SL
1n
its 3
9S
[i)
$R
EA
? 3
2 4
4 1
1 0
(i]
?
$d
ata
cla
a
shap
fo
lh
rock
in
te aliv
n
ot$
I [i)
$R
EA
? 3
4 1
1 2
1 0
(i)
?
$re
ad
[i]
SR
EA
? 3
4 3
3 1
2 0
[i]
11R
EA
? 1
1 1
1 1
3 1
6
I [i]
$R
EA
? 3
-4 3
3 2
~ 0
• (i]
$RE
A?
1 1
1 1
2 0
33
[i]? S
cale
x
•liv
e
+
no
ts
[i]
S
RE
A?
1 1
1 1
3 0
12
[f] **
Ltn
defin
ed
o
r d
ele
ted
id
en
tifie
r,
at
[ive
+
ncit$
]
(i]
S
RE
A?
1 1
1 1
4 0
1 [f]
[i]
SR
EA
? 1
1 1
2 1
2 6
[h]
Th
e id
en
tifie
r
LIV
E
LISed
in
the
$CA
L
dire
ct'J.v
e
l.S
[ i]
SRE
A?
1 1
1 2
2 0
9 L
tnd
efin
ed
, p
ossib
ly
becaL
1se
[i]
S
RE
A?
1 1
1 3
3 0
1 [h
] it
was
pre
vio
usly
d
ele
ted
. Its
ty
pe is
n
ot
defin
ed
b
y
[i]
•R
EA
? 1
1 1
4 1
1 0
its
pra
san
t u
sag
e.
[i]
$R
EA
? 1
2 1
1· 2
0 1
[h]
(i]
S
RE
A?
2 1
1 1
1 0
7
ftl?
tca
lc
H•a
liv
+ n
ot•
. C
iJ $
RE
A?
Sre.ad
i]? S
fac cla
s
3 sh
ap
4
folh
4
rock
4
inte
4
$
[f] **
no
t a
rea
l n
um
ber,
at
[fRE
A?
$]
tij ~
tyv
ar liv
•• ( f]
CiJ
7 ••rro
r
b H
• [h
] A
re
al
nL
lmb
er w
as ex
pecte
d
for
the
SRE
A
dir
ectiv
e
bLtt
was
[i]? S
link
gS
n
ot
pre
sen
t. T
ha
[i]? S
dis
pla
y
mS
[h]
cu
rren
t lin
e
wid
th is
8
0
-is
th
is
sLtff
icie
nt
for
all
Col
Cu
rr,mt
111001111 n
Llm
bers
to
be
rea
d.
Co
l C
h]
Re-e
nte
r th
e
co
mp
lete
d
irectiv
e.
[o]
nLtm
ber o
f u
nits
is
3
9
[h]
[o]
' [i]
? SL
mi ts
3
9$
C
o]
y-v
c1ria
te L
IVE
[w
] --
mo
del
re-in
itialis
ed
C
o]
weig
ht
* [i]
?
$d
ata
cla
s
sha
p
folh
ro
ck
in
te aliv
n
ot$
[o
] o
ffset
* [i]
?
$re
ad
C
o) (i]
$
RE
A?
1 1
1 1
1 3
16
[o
] p
rob
ab
ility d
istrib
Lttio
n is
B
INO
MIA
L
[i)
$R
EA
? 1
1 1
1 2
0 3
3
[o)
with
b
ino
mia
l d
en
om
inato
r X
[i]
S
RE
A?
1 1
1 1
3 0
12
[o
] lin
k
fun
ctio
n
is
LO
GIT
[i]
S
RE
A?
1 1
1 1
4 0
1 [o
] sca
le
parc1
meter
is
1.0
00
CiJ
$R
EA
? 1
1 1
2 1
2 6
Co]
(i]
S
RE
A?
1 1
1 2
2 0
9
I [o
) te
rms=
1
[i]
S
RE
A?
1 1
1 3
3 0
1 [o
) (i]
S
RE
A?
1 1
1 4
1 1
0 [i]
7
Sy
va
r a
livS
[i]
tR
EA
? 1
2 1
1 2
0 1
I [i)? $
erro
r b
xS [i]
SR
EA
? 2
1 1
1 1
0 7
I [1
] 7
Slin
k
gS
I
CiJ
tRE
A?
2 1
1 1
2 0
10
I
Ci)
7 $
dis
pla
y
ms
I
Ci]
SR
EA
? 2
1 1
1 3
0 ~
Co]
Cu
rren
t m
od
al1
Ci]
SR
EA
? 2
1 1
2 1
4 4
Co
l C
i] tR
EA
? 2
1 1
2 2
0 7
i C
o] n
um
bar
of
un
its is
3
9
Ci]
SRE
A?
2 1
1 2
3 0
1 i
(OJ
CiJ
SRE
A?
2 1
1 3
1 2
1 C
ol
· ,y-v
ar1
at•
AL
IV
CiJ
tRE
A?
2 1
1 3
~ 1
2 C
ol
· wa
i;ht ·
• C
iJ SR
EA
? 2
1 1
3 ~
0 2
Co]
offs
et
* [1
] SR
EA
? 2
1 1
4 r
1 0
Co
) [ i]
SR
EA
? 2
2 1
1 l
1 1
Co
l, p
rob
ab
ility d
istr
ibu
tion
is
B
INO
MIA
L
[i]
tR
EA
? 2
2 1
2 2
0 1
[oj
with
b
ino
mi•l
den
om
inato
r X
[i]
SR
EA
? 2
2 2
1 l
1 0
Co
l lin
k
1u
nctio
n is
L
OG
IT
[i]
S
RE
A?
2 2
2 3
1 1
0 [c
)
scale
p
~r~
mete
r i~
1
.00
0
[i]
$R
EA
? 3
2 2
3 2
0 l
Co)
[i]
S
RE
A?
2 2
3 3
1 0
1 C
o] te
rm
s•
1 C
i] SR
EA
? 2
2 4
1 l
1 0
[o)
[i]
S
RE
A?
3 1
1 1
2 1
0 [i]
S
RE
A?
3 1
1 3
1 1
0 [i]
tRE
A?
3 l
1 3
2 1
0
--
l ---
-----
--
----

Lil
7 $
fit$
[o
.J d
. -f. ==
27
( C h
iHH
~e
== -·
I.I
Co
] ~
cale
d
dev
ian
ce~
1
31
.~0
~
t cv
cle
..:,;
[oJ
[o]
d. f
. =
3
8 [i]
?
~;lo
of;
:l.>:2 Y
.t1"f$
(o]
[o]
65
.27
27 .12)0
[i]
?
$lo
ok
Y
.x2 X
df$
(i J
? $
fit
:inte
$
[o]
11
7.6
38.0111
(o]
scale
d
dev
ian
ce=
1
31
.2
0 at
cy
cle
3
[i]
?
$fit
:+cla
s
+sh
ap
+
tolh
+
roc
k +
inte
,~ [o
J d
.L
=
38
[o]
scale
d
dev
ian
ce=
131.2111
at
cy
cle
3
Co
]
[o)
d .f.
=
38
[o
] scale
d
dev
ian
ce=
1
10
.49
at
cy
cle
7
[o]
[o)
d. f
. =
3
5
[o)
scale
d
dev
ian
ce=
1
9.5
36
(c
han
ge=
-1
11
.66
) at.
cy
cle
.l0
[o]
[o]
d. f
.
=
25
(c
han
ge
=
-13
)
[ i]
? $
fit
:+in
te$
[o)
(no
co
nv
erg
en
ce
yet)
[o]
scale
d d
ev
ian
ce=
1
31
.20
at
cy
cle
3
[o]
Co]
d. f.
=
38
[i]
7 $
loo
k
Y.x2
Y.df$
l~\ sca
led
d
ev
i~n
~e ~
1~
~-4
9
[o]
53
.13
2
s·.0111
~c ?,an<~t
=
-'?.11,• 7 .1 \ a t
CY
c:: l I?
0 ••
-..._\
c an
_e
=
[i]
?
$fit
:+cla
s
+
sh
ap
+
fo
lh
+ro
ck
$
[o]
[!"-o>jl ~
i'~
~Yi~R
G!? o: 1t:s:iJ-•• 2@
a¥-~
~l4!-~
j:,
[i
] ?
$lo
ok
%
>:2
%d
f$
[OJ
d
·. t. -3
8
[o]
10
4.7
3
5.1210
[o]
[i]
?
$fit
:+ro
cf;$
EB
j §
eaie~
g~viaHew
s
41
.11
8
(ch
an
ge
=
-90
.12)8) a
t e
ve le
.l.l~ scale
d
dev
ian
ce
=
13
1.212l
at
cy
cle
7
[o]
[o]
d.f
. =
2
8
(ch
an
ge
=
-112)
) [o
] d
. f.
=
38
[o]
[o]
[ i]
7 $
loo
k
Y.x2
Y.df$
[o]
scale
d
dev
ian
ce
=
77
.65
9
(ch
an
ge
=
-5-3
. S'f I
Clt
C'/
Cl
e u
Co
] -
10
1.1
2
8.0
0
[o)
d .f.
=
35
(c
han
ge=
-3
)
[i]
7
$fit
1+
cla
s
+
sha
p
+fo
lh
+
inte
$
[oJ
[o]
sca
led
d
ev
ian
ce
a 1
31
.20
a
t cy
cle
3
CiJ
? $
loo
k
%>:2
Y.df$
[o)
d. f. -
38
[o
] 9
1. llll
35
.00
[o]
[i]
? $
fit
:+fo
lh
$
[o]
sca
led
d
ev
ian
ce•
28
.99
0
(ch
an
ge=
-1
02
.2
1)
at
cy
cle
1
0
[o]
scale
d
dev
ian
ce=
1
31
.20
at
cy
cle
3
[o]
d.f
. •
28
(c
han
ge=
-1
0
) [o
] d
. f.
=
38
[o]
[o]
at
cv
cle
[i]
?
$lo
ok
Y
.x2 Y
.df$ [o
] scale
d
dev
ian
ce=
7
6.8
08
(c
han
ge
=
-5
4.3
9)
[o]
4111.45 28.1110
I [o
) d
. f.
=
35
( c
han
ge
=
-3
)
[ i]
? $
fit
:+cla
s
+
sh
ap
+
ro
ck
+
inte
$
I [o
)
Co
] scale
d
dev
ian
ce=
131.2111
at
cy
cle
3
[ i J ?
$lo
ok
%
>:2 Y
.df$
Co
] d
.f. .
38
[o
] 9
2.4
0
35
.lll0
[o]
[i]
?
$fit
:shap
'fi
[o]
scale
d d
ev
ian
ce•
23
.37
3 (c
han
ge=
-1
07
.83
) [o
] ~
cale
d
dev
ian
ce=
1
31
.2
0 at
cy
cle
3
at
cy
cle
1
0
I
Co
] d
. f. •
28
(c
han
ge
=
-10
) I
[o]
d.L
=
3
8
[o]
(o]
[i]
?
$lo
ok
Y
.x2 'l.d
f$
(o]
scale
d
dev
ian
ce=
8
6.
70
at
cy
cle
8
[o]
33
.26
2
8.0
0
[o]
d. f
.
=
36
[i]
7 $
fit
1+
cla
s
+
folh
+
ro
ck
+
inte
$
(o]
[o]
sca
led
d
ev
ian
ce•
131.2111 at
cy
cle
3
[i]
? $
fit
:+sh
ap
$
Co
] d
.f. .
38
(o
] scale
d d
ev
ian
ce=
1
31
.20
at
cy
cle
3
Co
J lil
scale
d
dev
iSo
/e B
jj.1
0
(eh
afl!jf! =
-4
1.
5121) at
cy
cle
8
Cw
] --
un
it 3
6
h•ld
a
t lim
it C
oJ
CcJ
sca
led
d
•v
ian
c•
• 2
1.6
80
(ch
an
ge•
-11
11
9.5
2)
at
cy
cle
1
0
Ci]
? $
loo
k
'l.x2 'l.d
ft
Co
J d
.f.
• 2
7
(ch
an
ge•
-11
)
Co
] 9
1.6
4
36.111111
Co
] I
Ci]
? tfit
1+
cl•••
CiJ
~.$
loo
k
'l.x2 'l.d
f$
I C
o] .•
c•l•
d
d•v
ian
c•
• 131.2111
at
cy
cle
3
Co
J 69.2111
27
.00
[o
]
d. f
. .. 3
8
CiJ
7 $
fit
1
+•h
ap
+
fo
lh +
ro
ck
+
inte
$
(oj
Co
] scale
d d
ev
ian
ce•
13
1.2
0 at
cy
cle
3
Co
] d
. t. -3
8
Co
J C
o]
sca
l•d
d
ev
ian
ce•
32
.78
0
(ch
an
ge =
-
98
.42
) at
cy
cle
1
1/l

GLIM
AN
AL
YSIS O
F FOR
EST
SUM
DA
TA
.
Co]
GL
IM
3.7
7
up
date
0
(co
ov
righ
t)19
85
R
ov.:,1 S
tati
stic.a
.I
So
cie
ty,
Lo
nd
on
7 $
UN
ITS
2
5$
7
$DA
TA
C
LA
S SH
AP
FOL
H
RO
CK
A
LIV
N
OT
$ ?
$RE
AD
$R
EA
? 1
3 1
3 0
1 tR
EA
? 2
1 1
1 3
~
SR
EA
? 2
1 1
2 0
4 S
RE
A?
2 1
2 1
1 1
$RE
A?
2 1
2 2
0 1
$RE
A?
2 2
1 ~
-1 4
$RE
A?
2 2
3 1
1 1
tRE
A?
2 2
3 2
0 1
$RE
A?
2 3
1 1
2 1
SR
EA
? 2
3· 2
1 1
0 •R
EA
? 2
4 3
1 1
0 tR
EA
? 3
1 1
1 2
0 S
RE
A?
3 1
2 1
0
1 tR
EA
? tP
RIN
T
RE
AD
t **
no
t a
rea
l n
um
ber,
at
($R
EA
?$
)
[oJ
[iJ
[i]
(i]
(i]
(iJ
(iJ
(i]
(i]
(iJ
C
iJ (iJ
[ i
]
(i]
(i]
(i]
(i]
(iJ
(f]
[fJ
'[h]
A
rea
l ~
um
ber
wa
s ex
pecte
d
for
the
$RE
A d
irecti
ve
bu
t n
ot
presen
t, T
h•
[hJ
cu
rren
t lin
e
wid
th
is
80
-
is th
is
su
ffic
ien
t fo
r n
um
bers
to
be
rea
d.
(hJ
Re-e
nte
r th
e
co
mp
lete
d
irectiv
e.
( h]
[ i]
Ci J
(i]
Ci J
(i]
CiJ
Ci]
Ci J
( i J [iJ
[iJ
C
iJ [iJ
C
il C
il C
iJ [i]
Cil
CiJ
CiJ
[ i J C
i J (iJ
C
i J [iJ
C
i J [iJ
C
iJ C
iJ C
iJ
? SR
EA
D
SR
EA
? 1
3 1
3 0
1-
SR
EA
? 2
1 1
1 3
~
*RE
A?
2 1
1 2
0 4
•RE
A?
2 1
2 1
1 1
$RE
A?
2 1
2 2
0 1
SR
EA
? 2
2 1
1 1
4 S
RE
A?
2 2
3 1
1 1
. S
RE
A?
2 2
3 2
0· 1
•RE
A?
2 3
1 1
2 1
•RE
A?
2 3
2 1
1 0
•RE
A?
2 1
31
1
0 •R
EA
? 3
1 1
1 2
0 •R
EA
?,3
-1 2 l
l!I 1
•FtE
A?
.,3 2 ·1,.~ ·7
• ~
•RE
A?
3 1 2 1
3. 2
2 •R
EA
? 3
2 2
1; 1
~
:=::; ; ; ~ r ~ ~ •R
EA
? 3
2 4
1 1
1 •R
EA
? 3
3 1
1: 8 4
*RE
A?
3 3
1 2
1 0
tRE
A?
3 3
1 ~
2
1 •R
EA
? 3
3 2
1 1
0 tR
EA
? 3
3 2
2 1
0 •R
EA
? 3
3 4
3 0
1 ?
SCA
LC
X
•AL
IV+
NO
T•
? •F
AC
C
LA
S 3
8HA
P 4
7 •Y
VA
R
AL
IVt
? •E
RR
OR
B
~U
FOL
H
4 R
OC
K
4$
was
all
Li]
? ,t,L
IN~
: G
1; [i]
7
$DIS
PL
AY
M
$ [o
] C
urre
nt
mo
del:
[o)
[o
]
nu
mb
er o
f u
nits
is
2
5
[o
]
[o)
y-v
aria
te
AL
IV
[o]
weig
ht
* [o
] o
ffset
* [o
]
[o)
pro
bab
ility d
istrib
utio
n is
B
INO
MIA
L
[o]
with
b
ino
mia
l d
en
om
ina
tor
X
[o)
link
fu
nctio
n
is
LO
GIT
[o
] scale
p
ara
mete
r is
1
.00
0
(o
]
(o]
term
s ~
1
? S
FIT
$
scale
d d
ev
ian
ce•
30
.71
0 at
cy
cle
4
'd
. f. s:
24
7 SF
IT
1+C
LA
S•
scale
d d
ev
ian
ce=
3
0.7
10
at
cy
cle
4
d. f
.
• 2
4
(o]
[i)
[o
]
[o
]
[o
)
[i]
[o
]
[o
]
[o
]
[o]
5ca
led
d
ev
ian
ce•
27
.00
3
(ch
an
ge•
-3.7
06
8)
at
cy
cle
6
[oJ
d.f
. a
22
(c
han
ge=
-2
)
[oJ
Ci]
7 $L
OO
K
'l.X2
'l.DF$
[OJ
2f.2
6
22
.00
[iJ?
$F
IT
:+S
HA
P$
[oJ
sca
led
d
ev
ian
ce•
30
.71
0 at
cy
cle
4
[OJ
d.f
. =
2
4
scale
d
dev
ian
ce
a 2
3.0
91
(c
han
oe
=
-7
.61
90
) ) d
. f. •
21
(c
han
ge=
-3
7 $L
OO
K
'l.X2
'l.DF$
18
,33
2
1.0
0
? $
FIT
1+
FOL
H$
5ca
led
d
ev
ian
ce• 3
0.7
10
at
cycle
4
d. f.
• 2
4
scale
d
dev
ian
ce~
2
9.8
81
(c
han
ge=
-
12).829)
d. f.
=
21
(c
han
ge=
-3
)
? •L
OO
K
'l.X2
'l.DF
• 2
3,4
QI
21.1110
? •F
IT
1+R
OC
K•
~ca
l•d ,~
•1d
,an
c• •
31!1, 71
0
at
cy
cl•
4
d,f
. •
24
[o
]
(o]
[o
]
[oJ
[i]
[o
]
[iJ
C
o] [o
)
[o
]
Co]
[oJ
[OJ
[iJ
[o
J C
i] C
o) C
o)
[o]
Co]
co
j [o
]
Ci]
[o
]
CiJ
sca
led
d
ev
ian
ce•
28
,84
3
(ch
an
ge=
-1
.86
71
d. f.
• 2
2
(cha1
ng
e •
-2
)
7 SLO
OK
'l.X
2 'l.D
F•
23
,94
2
2.0
0
? S
FIT
1 +C
LA
S +
SH
,AP
+
FOL
H
+
RO
CK
~;
at
cv
cl
e 8
at
cy
cle
4
at
cy
cle
4

CL
IM A
NA
LY
SIS OF C
OM
IHllll;D
SNE
EU
SUM
AN
D H
OO
GSU
M DA
TA
.
Co"J
GL
IM
3.7
7
up
date
0
(co
pyri
gh
t) 1
98
5
Hov
al
!::>ta
t.1.s
tJ.c
2..l
So
ciety
, L
on
do
n
[o]
(i]
?
$u
nits
52
$ (i]
? $
data
cla
s
shap
fo
lh
roc
k aliv
n
ot$
(i]?
$re
ad
[i]
$R
EA
? 1
11
10
1
[f] ** in
teg
er
or
nu
mb
er to
o
larg
e,
at
[EA
? 1.ll
H:'ll
] [f)
[o
] sc
ale
d
dev
ian
ce=
30
.71
0
at
cycle
4
[h]
Th
e · la
rgest
inte
ger
that
can
b
e
st
or
ed
c>n th
J.5
[ o)
d. f
. =
2
4
imp
lem
en
tatio
n is
3
27
~9
[o
) [h
] [o
] s
cal
ed
d
ev
ian
ce=
1
7.3
24
(c
han
ge
=
-13
.38
6)
at
cvcl
E, n
[i]
? $
rea
d
(o]
d. f
. ~
14
(c
ha
ng
e=
-
10
) [i]
$R
EA
? 1
1 1
l 0
1 [o
] C
i) $R
EA
? 1
1 1
2 0
2 C
iJ ?
$F
IT
:+C
LA
S
+
SHA
P +
FO
LH
$·
[i]
SR
EA
? 1
2 1
l 0
17
[o
] scale
d
dev
ian
~e
• 3
0.7
10
a
t cy
cle
4
(i]
$R
EA
? 1
2 1
· 2 0
5 [o
] d
. f.
=
24
[i]
$R
EA
? 1
2 4
4 2
0 [ o
] [i]
$R
EA
? 1
3 1
1 0
1 [o
] scale
d
dev
ian
ce
a 1
8.5
29
(c
han
ge
=
-12
.18
1)
at
cy
cle
B
[i]
$R
EA
? 1
3 1
3 0
1 [o
) d
.t. •
16
(c
han
ge
=
-8
) [i)
$R
EA
? 2
2 1
1 1
10
[O
J [i]
$R
EA
? 2
2 1
2 1
4 (i]?
$F
IT
:+C
LA
S
+SHA
P +R
OC
K$
[i)
$R
EA
? 2
2 1
3 0
2 [o
) scale
d
dev
ian
ce
a 3
0.7
10
at
cycle
4
Ci]
$RE
A?
2 2
1 4
0 1
CoJ
d. f
. a
24
C
i] $R
EA
? 2
2 2
1 0
11
C
oJ Ci
) $
RE
A?~
2
2 3
0 1
[o]
scale
d
~ev
ian
ce
=
18
.13
1
(ch
an
ge=
-
12
.57
9)
at
cy
cle
8 C
i) $R
EA
? 2
2 2
4 1
1 (o
) d
. t. •
17
(c
han
ge
"' -7
)
Ci]
$RE
A?
2 3
1 1
0 4
[o]
I [i)
$R
EA
? 2
3 1
2 2
2 [i]
?
$F
IT
:CL
AS
+FO
LH
+R
OC
K$
Ci)
$RE
A?
2 3
1 3
3 0
Co)
scale
d d
ev
ian
ce=
3
0.7
10
at
cy
cle
4
Ci)
$RE
A?
2 3
2 1
0 3
[o)
d.t.
• 2
4
(i]
$R
EA
? 2
3 2
2 2
3 [o
) [i)
$R
EA
? 2
3 2
3 1
4 [o
) scale
d
dev
ian
ce=
2
4.6
39
at
cy
cle
6
[i)
$R
EA
? 2
3 2
4 3
1 C
o) d
. t. =
1
7
[i)
$R
EA
? 2
3 3
3 0
1 [o
] C
i] $R
EA
? 2
4 1
1 0
1 [i J
? $
FIT
:+
CL
AS
+
FO
LH
+
R
OC
K$
[i)
$R
EA
? 2
~
2 3
l 0
[o)
scale
d d
ev
ian
ce=
3
0.7
10
at
cy
cle
4
Ci)
$RE
A?
2 5
3 3
0 l
[o]
d. t.
• 2
4
[i)
$R
EA
? 2
5 3
4 1
0 C
o] C
i) $R
EA
? 3
2 2
3 0
1 C
o] scale
d d
ev
ian
ce=
2
4.6
39
(c
han
ge
=
-6.0
71
) at
cy
cle
6 [i)
$R
EA
? 3
3 1
l 1
1 [o
] d
.f;
• 1
7
(ch
an
ge
u -7
)
[i]
$R
EA
? 3
3 1
2 0
1 C
o) [i]
$R
EA
? 3
3 2
2 5
3 [i J
? $
FIT
1+
SH
AP
+
FO
LH
+
R
OC
K$
Ci)
$RE
A? .3
3 2
3 1
8
3 C
o) sca
led
d
•via
nc•
• 3
0.7
10
a
t cy
cle
4
Ci)
$RE
A?
3 3
2 4
2 3
Co
l d
. t. •
24
C
i) $R
EA
? 3
3 3
1 0
1 (O
J .. ~
~
Ci)
$RE
A?
3 3
3 2
1 0
[oJ ·&
4:ai"o .. cfe
~n
c• .. -'211t.11,
(ch
an
g•
• -9
.99
~)
at
cycle
8
Ci]
$RE
A?
3 3
3 3
4 4
[o) ....
.. d .1.
• 1
6
(ch
an
g•
• -8
)
Ci)
$RE
A?
3 3
3 4
4 0
Co
l C
i] .•RE
A?
3 3
4 1
1 1
Ci)
?-•S
TO
P$
C
iT-
•RE
A?
3 3
4 2
1 0
Ci]
$RE
A?
3 3
4 3
1 0
Ci]
$RE
A?
3 4
1 3
0 1
[iJ
$R
EA
? 3
4 1
4 0
1 [i)
$R
EA
? 3
4 3
2 1
0 [i
J $R
EA
? 3
4 3
3 1
0 [i)
$R
EA
? 3
4 4
3 2
0 [i)
$R
EA
? 3
5 1
3 0
2
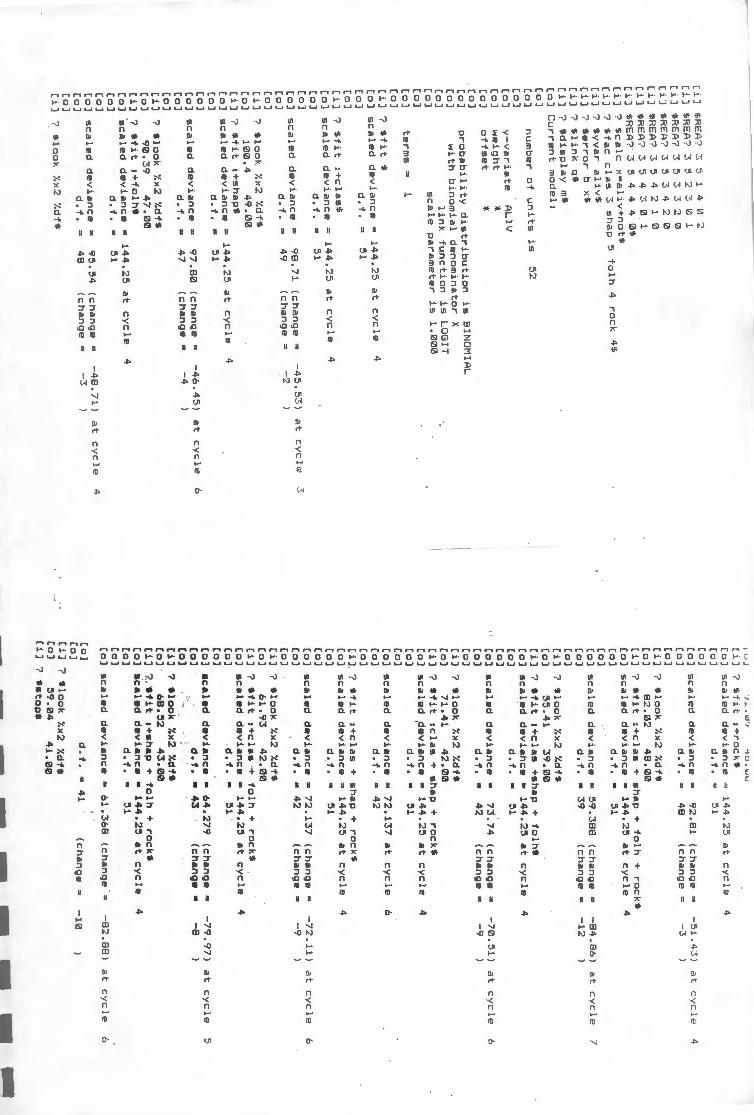
[i]
[i]
[i]
[i]
[i
] (i]
(i]
(i
] [i]
[i]
(i]
[i
]
CiJ
[o
]
[o
]
[oJ
[oJ
[O]
[oJ
[o
] [o
]
[oJ
[o
]
[oJ
[o
]
[oJ
[o
]
[o) 1·,R
E/~?
3 5
.1 4
1/l 2
IRE
A?
3 5
2 3
0 1
$R
EA
?
3 5
3 3
2 0
IRE
A?
3 5
3 4
2 0
IRE
A?
3 5
4 2
1 0
$RE
A?
3 5
4 3
0 1
IRE
A?
. 3 5
4 4
4 0
$
? lc
alc
>:=
aliv
+n
otl
? $
fac
cla
s
3 sh
ap
5
folh
4
rock
4
$
? $
yv
ar
aliv
$
? $
erro
r b
>:$ ?
$lin
k
q$
?
$d
ispla
y m
l C
L1
rrent
mo
del:
nL1m
ber o
f u
nits
is
5
2
y-v
aria
te
AL
IV
weig
ht
* o
ffse
t *
pro
ba
bility
d
istr
ibu
tion
is
w
ith
bin
om
ial
den
om
inato
r lin
k
fun
ctio
n is
scale
p
ara
mete
r is
BIN
OM
IAL
X
term
s=
1
? If it
$ sca
led
d
ev
ian
ce=
d
.L
=
? $
fit
:+cl a
s$
scale
d
dev
ian
ce=
d
. f.
=
scale
d
dev
ian
ce=
d
. f. =
? $
loo
k
'l.>:2 'l.d
f$
10
0.4
49.012)
? $
tit
:+sh
ap
$
scale
d d
ev
ian
ce=
d
. f.
=
scale
d
dev
ian
ce=
d .1
. =
? S
loo
k
'l.x2 'l.d
fS
90
.3
9 4
7 .0
0
? S
f it
:+fo
lhS
·s
cale
d
dev
ian
ce=
d
. f.
=
LO
GIT
1.12)012)
14
4.2
5 at
cy
cle
5
1
14
4.2
5 at
cy
cle
51
98
.71
(c
han
ge
=
49
(c
han
ge
=
14
4.2
5 at
cy
cle
5
1
97
.80
(c
han
ge=
4
7
(ch
an
ge=
14
4.2
5 at
cy
cle
5
1
4 4 -4
5.5
3)
-2
)
4 -4
6.4
5)
-4
)
4
at
cy
cle
at
cv
cle
[ j_]
[o
]
[o
]
[o
]
[i]
(o
]
[o)
(oJ
[o
]
[o
]
(o]
(i]
[o)
(i]
(o
]
Co
] [o
) [o
]
Co
] C
o]
(i]
[o
]
[i]
[o)
(o]
[o
]
(o]
[o
]
(o]
[i]
?
scale
d
dev
ian
ce
d. f
.
95
.54
(c
han
ge
48
(c
han
ge
-4
8.
71
) a
t cy
cle
-3
)
$lo
ok
'l.>:2
'l.df'li
3 6 4
I \.J J
'I..: •• II.P
l ·tu
.1
uu
? lf
H
:·1-ro
cf,$ seal ,?d
d
ev
ian
ce -
d. f.
=
scale
d
dev
ian
ce
'" d
. t.
? $
loo
k
'l.>e2 'l.d
f$
82
.02
4
8.0
0 =
.144.25
at
cy
cle
4
51
92
.81
(c
han
ge
=
48
(c
han
ge=
( J.] [o
]
[oJ
(o
]
Co]
[o
]
[o]
[i]
[o
]
[i)
[o
]
[o
]
[o
]
? $
fit
:+cla
s
+
shap
+
fo
lh
+
rock
$
scale
d d
ev
ian
ce'"
1
44
.25
at
cy
cle
4
d. f
.
• 5
1
[o]
scale
d
dev
ian
ce=
5
9.3
88
(c
han
ge
[o]
d.f
. •
39
(c
han
ge
m
Slo
ok
'l.>12
'l.dfS
5
5.4
1
39.0(1)
[o
]
[i]?
[o
]
[i)
[o
]
[o
)
[o
]
? S
fit 1
+cla
s +
sha
p
+
tolh
S
sca
led
d
ev
ian
ce•
14
4.2
5
at
cy
cle
d
. f.
• 5
1
73
.74
(c
han
ge=
4
2
( ch
an
ge
=
[o
]
sca
led
d
ev
ian
ce
z
[o
]
d.t.
• [C
l] [i]
Co]
[i)
[o]
Co)
[o]
? $
loo
k
'l.x2 'l.d
fS
71
.41
4
2.0
0
? S
fit
:c
las
+
sha
p
+
rock
$
sca
led
d
ev
ian
ce
m
14
4.2
5 at
cy
cle
'
d.f
. •
51
[o]
scale
d
dev
ian
ce
a 7
2.1
37
a
t cy
cle
[o
)
d.f
. =
4
2
[o
]
[i l
[o
]
[o)
[oJ
? $
fit
:+cla
s
+
shap
+
ro
ck
$
scale
d d
ev
ian
ce=
1
44
.25
at
cy
cle
d .1
. =
5
1
[o)
scale
d
dev
ian
ce=
7
2.1
37
(c
han
ge
[o)
d.t.
a 4
2
(ch
an
ge
[o
]
[i]
[o)
(i]
Co]
[o)
CoJ
? $
loo
k
'l.x2 'l.df'li
61
.93
4
2.0
0
? S
fit 1
+cla
s -~ fo
lh
+
rock
$
sca
led
d
ev
ian
ce•
14
4.2
5 at
cy
cle
d
.f.
• :H
·
Co)
sca
l•d
d•v
ian
c•
• 6
4.2
79
(c
han
ge
Co]
d.t.
• 4
3
(ch
an
g•
Col
Cil
Co]
Ci)
Co]
[o
]
Co]
? •lo
ok
'l.><2
'l.dt•
68
.52
4
3.0
0
?.•
tit
1+
•h•p
+
to
lh
+
rock
$
•ca
led
d
•via
nc•
• 1
44
.25
at
cy
cle
d
. f. •
51
4
4
6 4
4
4 -5
1. 4
3)
at
cy
cle
-3
)
-84
.86
) at
cv
cle
-1
2
)
-7
0.5
1)
at
cy
cl
e -9
)
-72
.11
) a
t cy
cle
-9
)
-79
.97
) at
cy
cle
-8
)
[o]
sca
led
d
ev
ian
ce'"
6
1.3
68
(c
han
ge
·=
-82
.88
) at
cy
cle
[o
]
Co]
Ci]
Co
] C
i J
d.t.
=
41
7 $
loo
k
'l.x2 'l.d
t• 5
9.0
4
41
.00
7
••to
p•
(ch
an
ge
=
-10
~
7
6
6 :, 6

Appendix 3 Transition probability matrix for the Clanwilliam cedar
size class 1 2 3 4 5 6 7 8 9 10 11
0 0 0 0 0 2 .5 34 110 510 1200 2800 2 0 .00259 0 0 0 0 0 0 0 0 0 0 3 0 0 .1787 0 0 0 0 0 0 0 0 0 4 0 0 .0156 0 .1615 0 0 0 0 0 0 0 0 5 0 0 0 .0249 0.1649 0.7504 0 0 0 0 0 0 6 0 0 0 .0195 0.0478 0 .0601 0.5063 0 0 0 0 0 7 0 0 0 0.0345 0 .0435 0 .3685 0 .8327 0 0 0 0 8 0 0 0 0 0 0 0 .0162 0 .9325 0 0 0 9 0 0 0 0 0 0 0.0035 0 .0366 0 .9327 0 0
10 0 0 0 0 0 0 0 0 0 .0441 0.9491 . 0 11 0 0 0 0 0 0 0 0 0 0.0252 0.997

Appendix 4 Calculations for the derivation of the elasticity matrix from
the transition probability matrix for the Clanwilliam cedar. 1 0-. h nwD'I ~~ tar h Clda' ,..., Mandarl 1"87)
rdm.JllplytJr' ... pap.lilllc)r'IWCOr.w111h~O"'Qd,,_(llntJdl)dlbba
0 25
2 0"""'8 07'3 0 017117 0-
OOl!iO Q18'15 011111
0 00240 0 1- 0""4
00106 0047'11 OOIIOI O!IOll3
0""'5 OO<l!i 0'""6 0 0
10
21,....,._ .. .....,~,,..(IIIINka,a,wsntDCCU'l'l'llrd~ rd rrulll::tt br' .. p(lplJab, ...c:1Dr U'1'I .. ~ grawt, ,_ (WTt>dlJ mblaa.
OIXXBB 0
07'3 01787 OOl!iO
0 0- 01e,5 00240 00106 0!1111 01 ... 00478
0 0""4 OOIIOI 25 05DID .. 110 510
1Zl0
""" llrrtlell.11 1.ai!ai!lillil
..
0113'27 00,0,
ocm;
0
0""6
OO<l!i
0'""6
0""1
110
0
0
011"5
o"""
00,0,
011"5
510
0
011327 004'1
ocm; o""" 011327
0
10
1,00
0
00441
"°""
"""
0
0001
0""'2 0001
Q9'7SXl24 4.al!!E-09 QDOUIISl!I QODZl72 QCXD444!1 QOD::Ui!D QCIJS18 Qm:JliM3 QOIS78iiJ1 Q.150237 0.2487111 0505tS
O<X»\181
0004845\
QCD277311 QCD214UI
Q!IDl!Oi12
Qcuz:m,
Q<XX><31111
oa:am QDXn71 5
0000\866
4.~v •wm gethlcallrp-cO..cl
(Ttanutba 00,,. rth,tg'II crdlr la. rnntlt~ clVKD'YXWCUJr.., f'il II IC*lf" p,OCM:1 Iii <V,W>
Qlm!l!1 1
s~w·v lnd.-..ooNh,_.....~ ('NlfflllltcQJ'191"1'1111Ncttoetlt.Md"1 .. ....-.ctly"*"'~
4.1ClilE-OS 30£-QB 2!Xll!E-QI US1E-<II aa:as-00 29'11EG aas:£-00 QCIJ'lfflUU 1.513:-05 &m:£-OII 4.!IIIE-OII 35151E<ll!I 1.1"8E-Ol5 3112:£-00 00022107 2or.E-06 1.101E-05 ·--OIi 4.--0II 1.ST.£-OIS ·--OIi """"""" :1143:.QS UJ7E.Q5 a--00 7.JBE-OIS 2--0II l.154E-OIS
QID1061Zl 2 1"'£-06 1 . ...:-os l.401E-05 ·--OIi 2001E-OII 7.H57E-OIS o..-. 8.18.£-05 3211!£-QS U111E-05 1.45'iiE-05 4.s£-OII 1.eoE-05
O<XX1121 1 &5"1£-0II 4.5118E-OII 2.8'1~-0IS 2.o,a::-05 """""' 2.ZJ'1E-OIS Qooo:>340 Qaxlll101 Q<XXXJal 000011183 QCUJ'l4St 4.7E-06 0000\"'7 01407804 DIil\- OCXXJ7279 QCXD41S7 oooc=1 0000\04 Q<Xm!",00
0244041 QCG'2779 QD'J'l2HD QllOOllll3I OIXES>40 0000\no 00006011
""""""" QClO<IIOBB 0""'440 Olll\402 Olll\OB:15 QttXD<OO QD'J'l 1U81
e. hn ~rnuuls (~·tvt--v<v.w>)
1.1131£-0D 1.111£.(19
7.Zl/i/E.-07 4.Sli£-07 au-01 ·-"' Ui6;-0IS a544E-01
1.S1'..ii£-OIS ·-"' 20!£-0II 1.B711E-OD
4.11«:.-07 2."11E-07
2--05 1.aE-05
·--as 4.1fflE.Q5
0000\00\ 69'11£-05 O!Ul2Zll 0000\4
(lah"1...,..cl~~g,owt1 ... )•(hllf'lllllnWl:olhlabowelM1nlf/lC*lt'p,od.JcO
0 2T.1£-06 Q!l)\2707 QIJXl758!1
Q0, 57424 QD421ID5
0 Q01S011 QD2827 ..
0 Q!l)\""'7 QDID1257 0024""2 0 0 Olll\3723 0005:a0>4 QO,..,..
Q<Xl>4005 o"""""' ocm,n 0000>223
0 QODaXl88 oamaoa oooaao:, ODOII0711 0 00001138 0 1""""'2
0 O<D<m>< 00000152 10 0 0
7.21!£·10 7,l!I04E·10
2844f-07 307!E-07 3111!E-07 4.21!!£-07
59'11E-07 """""' 518'£-07 '""'"' 1.HS::£-OIS 1.2!ilE-OII
un1E-01 1.74'1:-07
1.H115E-015 1.21£-05
2571E-as 2787E-06
4.211!£-06 ~--as BS71E-<!i a:m£-a;
.. QOOZZ,, 00032514 0CIB3)64
0
0145737 Q0,14557 Q15272!J>
0 QCIB3)64 QJ1511142
1(D)
0
0 2887"825 -··-····.
7<13 552.048 41017241 ·--·-··-· 171. 7 256.0048 273.07451 ---
159 51 .1""°"" &UM1511 --
0 1.D2"A11 2105SDI ----
4.um RGIB:21""3 ·-·-···---
a.5382 4.r:rrrr.li11 -----0 DCIJB7188 --
0 QCD111D7 -o __
Q ___ ....
1CXX> li07.3 870D'ICl5 BJ'1 .1SID -
Qa:J13 Qa:Bi!ll7 Qlil6SJ787 --
...... o""""" o"""""' QOT.)4107 --"'
,.,.,.. ,..,....,, 15421102 ---.. "18430 """'""" 3ilOIXUi131!S _ .. ____ .. :aD.4412 81'917.SIIS 1~815.97 --.. 1ao757 ....,..,. 180&4,2.lQ __
13 1313157.22 ,....,_04 '840401m ---.. 1791J13U 107' ... 151iM8ii12.2 ·-· .. -· .. -· 1 577'11627.1 .,_,..,
8'11664e1S5 --···--17 """"""" 27788314 211701507 --11 S:llD8'11 "'"'"'"o
..-,40 __
10 147DIUS'IO 1- 1- ---
"""" ....,5m ....,,.,,, .....,,... ___
143 , .. 10i1001 .8B 1D40723i
Sil51.lil7511 .,,_,...,, 50686681 511l1Z!l3
211H1475 ""'""""' 2Zl"""" 2'"'13727
n2111163 7373321D
247.0&4Q8 25207047 ........ 4451 41815
'"'"""' 2HllJ\O 17.SICD73'I 18297488
11l37J817 1a711187
1DM04.0, 1DIIS1327
1-"""""" 1-"""""'
136Q'l .748 13857.8' -· -· ""21171 .5 748'1Sli!59 1113572:., 11Jl51771
V711r197.e 1111711\25
21"""57 22354045
304071n3 "'""""" 211M0114311 >Zlll!IZl7II --..,,, .,,.., 823573<lll
1.e::,:EOlil U!197E oa 3231ECIII 3207E Ill
1'5 1411
1De'1&UM 1CJD«l:,O
GU\ .014(1; 1011 ., xn 5211"""1 537.al811
"'1 ....... "'7.5m6 2:278741 237.4'1'18'1
75"""'73 78.75!1543 257.IQJB!S :lm.'13'11 4U51114Q ........ :n-., :1J.11 1cm 1&o:m:J7 11lD'lT.25
201010\ 205771
1081111!'57 11DllliiJ'l .n
1-"""""" 1."'°"""'
14148.131!1 1+4315.3'7 .,,., ... 551141& 1 - ,,..,.,.. ,, ...... ,,.,,,., 101"""2 10307!l27
"""7'1123 23l7tlll12
31717."7 ..,.,117 22ll40t!727 zm'3325
506«GDII .,_, """"1578 ..,....,,.
UEOlil 1.T.!'£ oa ·-Ill 3c,:;£111

Appendix 5 True Basic program and flow diagram.

Leslie matrix cedar model
This is a program to model population development of the Clanwilliam cedar under various fire regimes. The input variables are the population transition matrix, the starting population vector, the fire survival vector, the the interval between fires and the number of fires.
dim 1(11, 11) ... transition matrix dim x(ll) ... population vector dim p(ll) ... fire survival
let brnmx=20 ... defines number of fire cycles let intmx = 15 ... defines length of fire free interval
declare def poptot mat read 1 mat read x mat read p
let t = 0 let format$ = 11 ######.## 11
let fmt$ = 11 ######## > 11
let y$= 11 ####> II
clear
Print using fmt$·"year" "6" "7" "8" 119" "10" "11" "total" . ' ' ' ' ' ' ' print
for n = 0 to brnmx ... number of fire cycles print "fire cycle ",n for t = 1 to intmx ... t is number of fire free years mat x = l*x print using format$: t, x(6), x(7), x(8), x(9), x(lO), x(l l), poptot(X) next t print let q=12*n+t for i=6 to 11 let sum=sum+x(i)
next i let sum"=O for k = 1_ to size( x ) let x(k) = x(k) * p(k) next k next n
Data 0, 0, 0, 0, 0, 2.5, 34, 110, 510, 1200, 2800, .002588, 0.7430, 0, 0, 0, 0, 0, 0, 0, 0, 0, 0, 0.1787, 0.6840, 0, 0, 0, 0, 0, 0, 0, 0, 0, 0.0156, 0.1615, 0.6869, 0, 0, 0, 0, 0, 0, 0, 0, 0, 0.0249, 0.1649, 0.7504, 0, 0, 0, 0, 0, 0, 0, 0, 0.0195, 0.0478, 0.0601, 0.5063, 0, 0, 0, 0, 0, 0, 0, 0, 0.0345, 0.0435, 0.3685, 0.8327, 0, 0, 0, 0, 0, 0, 0, 0, 0, 0, 0.0162,

0.9325, 0, 0, 0, 0, 0, 0, 0, 0, 0, 0.0035, 0.0366, 0.9327, 0, 0, 0, 0, 0, 0, 0, 0, 0, 0, 0.0441, 0.9491, 0, 0, 0, 0, 0, 0, 0, 0, 0, 0, 0.0252, 0.9970 ... Transition matrix
Data 52532, 31, 39, 21, 21, 13, 56, 7, 17, 11, 10 ... Starting pop
Data 0.001814, 0.18885, .1566, .1566, .2566, .2336, .22795, .2801, .38325, .6066, .6861 . . . Mortality vector end
Def pop tot( xO) !sums the components of any vector x
for 1 = 6 to size( X) let sum = sum + x(l) next 1
Let poptot = sum end def

Flow diagram of true basic cedar model;
A... transition matrix
n(t) ... starting population
x... interval between fires, fireint
m... mortality in fire
y... number of fires, firenum
START
Defme
A, n(t), x, m, y
NO
i.e. n(t)=x
Multiply popn. vector
by fire mortality vector
Print post-fire
popn. vector
(new n(t)
NO
END
>----YES
YES
Multiply matrix by popn.
vector n(t), n(t+ 1),
n(t+2) ... etc

APPENDIX 6. starting population and survival data used in model.
Table A.
Table B.
Table c.
Starting populations.
class Manders Die Bos Cedar site A Reserve
1 52532 59499 49663 2 31 3 34 3 39 3 22 4 21 5 9 5 21 6 11 6 13 11 31 7 56 13 39 8 7 7 24 9 17 6 22
10 11 11 10 11 10 15 8
Proportion of trees surviving in each size class in prescribed burns, at Forestsum and in wildfires.
PRESCRIBED BURNS DIE BOS WILDFIRE SNEEUBERG WILDFIR (Sites A and B) (Site C) (Sites D and E)
CLASS PROPN. +E PROPN. +E PROPN. +E SURVIVAL SURVIVAL SURVIVAL
2 0.0645 0.2925 0 0.288 0 0.0852 3 0 0.228 0 0.288 0 0.0852 4 0 0.228 0 0.288 0 0.0852 5 0.2 0.428 0 0.288 0 0.0852 6 0.154 0.382 0.05 0.338 0 0.0852 7 0.111 0.339 0 0.288 0.037 0.1169 8 0.222 0.45 0 0.288 0.0435 0.1102 9 0.43 0.658 0.18 0.468 0 0.1085
10 1 1 0.3 0.588 0.16 0.2132 11 1 1 0.246 0.534 0.2333 0.3722
Survival figures calculated for a worst case scenario prescribed burn (intermediate) and 8 year rotation prescribed burns.
CLASS INTERMEDIATE 20% BELOW PRESCRIBE
2 0.1889 0.234 3 0.1566 0.1824 4 0.1566 0.1824 5 0.2566 0.3424 6 0.2336 0.3056 7 0.2279 0.2712 8 0.2801 0.36 9 0.3832 0.5264
10 0.6066 0.8 11 0.6861 0.8