results from newberry volcano egs demonstration
TRANSCRIPT

PROCEEDINGS, Fourtieth Workshop on Geothermal Reservoir Engineering
Stanford University, Stanford, California, January 26-28, 2015
SGP-TR-204
1
Results from Newberry Volcano EGS Demonstration
Trenton T. Cladouhos, Susan Petty, Michael W. Swyer, Matthew E. Uddenberg, and Yini Nordin
4010 Stone Way North, Suite 400, Seattle WA 98103
Keywords: EGS, enhanced geothermal system, Newberry, stimulation, microseismicity, hydroshearing
ABSTRACT
The Newberry Volcano EGS Demonstration is a 5 year field project designed to demonstrate recent technological advances for
engineered geothermal systems (EGS) development. Advances in reservoir stimulation, diverter, and monitoring are being tested in a
hot (>300 ◦C), dry well (NWG 55-29) drilled in 2008. These technologies could reduce the cost of electrical power generation from
geothermal resources. The project, funded in part by the Department of Energy, began in 2010 with two years of permitting, technical
planning, and development of a project-specific Induced Seismicity Mitigation Plan (ISMP). Well stimulation carried out in 2012
indicated that casing repairs were needed; confirmed by further wellbore logging and analysis in 2013. Repairs were completed and the
well in August 2014 and the well re-stimulated in the fall. 2.5 million gallons (9,500m3) of groundwater were injected at a maximum
wellhead pressure of 2850psi (195bar) over 4 weeks of hydraulic stimulation. Injectivity changes, thermal profiles and seismicity
indicate that fracture permeability in well NWG 55-29 was enhanced. The fifteen-station microseismic array (MSA) located 398 events,
ranging in magnitude from M 0 to M 2.26. Temperature logs after injection of thermally-degradable zonal isolation material (TZIM)
showed that at least two flow zones were blocked and one or two new zones opened due to the diverter. Break-down products of TZIM
were detected in flow-back fluids, indicating that the material degraded as predicted. This work successfully demonstrates the viability
of large-volume low-pressure stimulation coupled with non-mechanical diverter technology and microseismic monitoring for reservoir
mapping.
1. INTRODUCTION
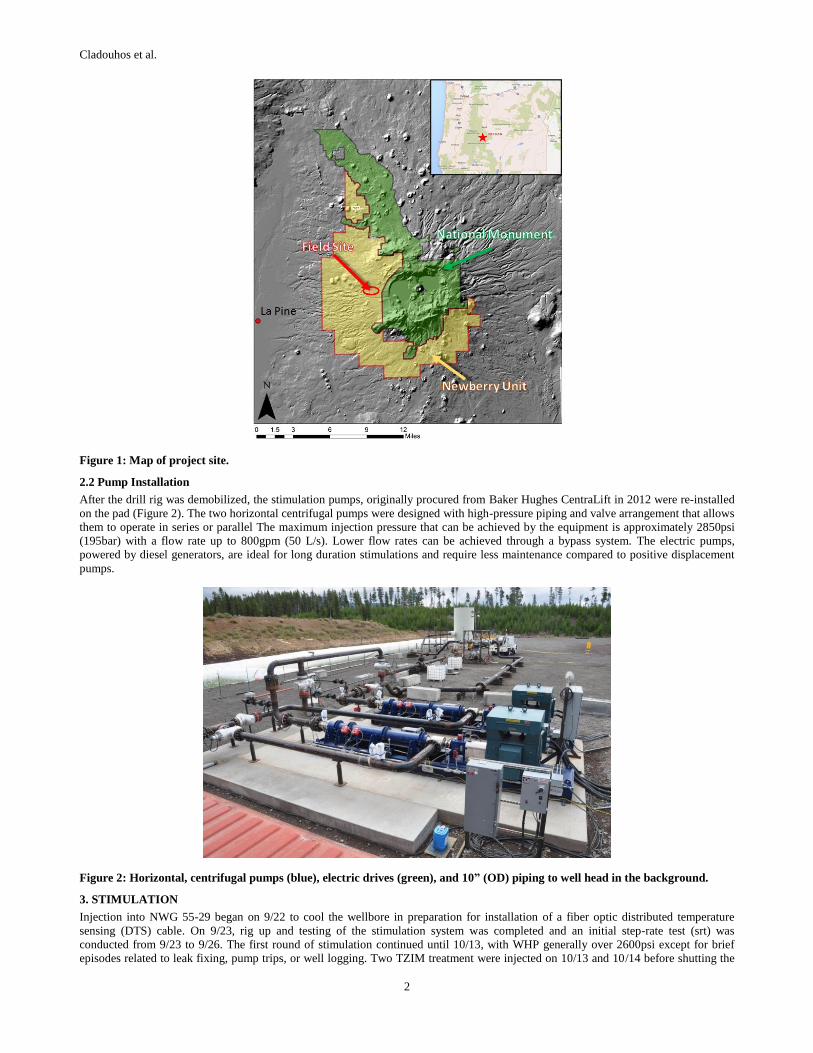
Newberry Volcano is a shield volcano located in central Oregon, about 35 km south of the city of Bend and 65 km east of the crest of
the Cascade Range. The Newberry EGS Demonstration is being conducted on federal geothermal leases and National Forest Service
lands located in the Deschutes National Forest, adjacent to Newberry National Volcanic Monument (Figure 1).
The goals of the demonstration include (Osborn et al., 2010):
Create an EGS reservoir,
Stimulate multiple zones in existing well NWG 55-29 using AltaRock’s proprietary thermally-degradable zonal isolation
materials (TZIM) and associated technologies,
Test single-well tracers,
Confirm EGS reservoir viability through a flow-back test of the injected water,
Drill one or two production wells to intersect the EGS reservoir, and
Demonstrate EGS viability through a circulation test.
During Phase 1 of the demonstration an environmental assessment (BLM, 2011), project-specific Induced Seismicity Mitigation Plan
(ISMP)(AltaRock, 2011), and technical plans (Cladouhos et al., 2011; 2012) were completed. This allowed the project to proceed to the
Phase 2.1, well stimulation. In Phase 2.1, a microseismic array (MSA) was installed, stimulation pumps procured and installed, and the
well stimulated for 7 weeks (Cladouhos et al., 2013a, 2013b; Petty et al., 2013). During the first stimulation, the well head pressure
(WHP) reached 2450psi (167 bar), 11 million gallons (40,000 m3) of water were injected, and over 170 microearthquakes were located,
illuminating an EGS reservoir at an average depth of 3200ft (1 km). Further study and well surveys in 2013 determined that well repairs
and a second stimulation would be necessary to create a deeper, hotter EGS reservoir. Additionally, the surveys confirmed that a
blockage had formed during the 2012 stimulation at 6888ft, so that a slotted liner would be required to keep this section of the hole open
and available for logging.
Phase 2.2 of the demonstration was performed from late August to November 2014. Analysis of the extensive data set collected is
ongoing; this paper is a progress report, focused on the data and observations.
2. PHASE 2.2 PREPARATION
2.1 Rig Work
The Paul Graham Drilling Rig 9 was mobilized to the site and rigging up completed on 8/9. After running a bit to bottom to clear
obstructions, a bridge plug was set and 9 5/8” casing was tied-back from 4100ft to the surface, inside 13 3/8” casing. The casing was
then cemented in place. Next a 7” slotted liner was installed in the open-hole from the 9 5/8” shoe to bottom. The rig was released 8/23.
Cladouhos et al.
2
Figure 1: Map of project site.
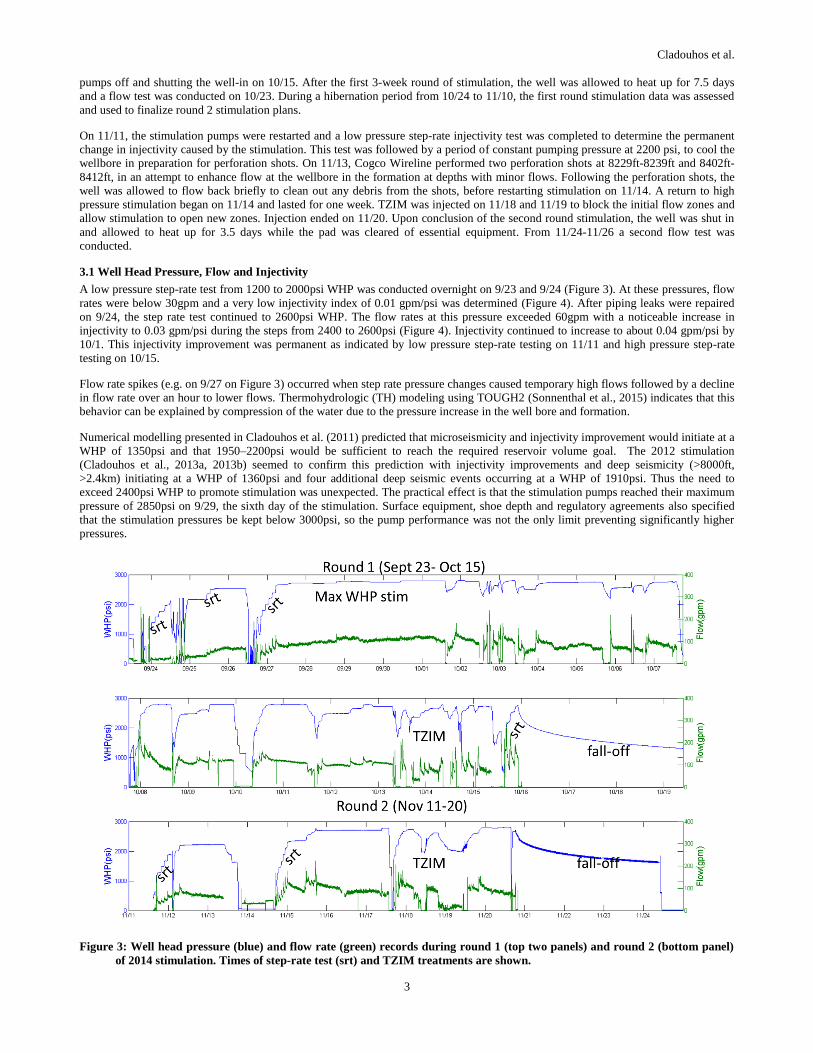
2.2 Pump Installation
After the drill rig was demobilized, the stimulation pumps, originally procured from Baker Hughes CentraLift in 2012 were re-installed
on the pad (Figure 2). The two horizontal centrifugal pumps were designed with high-pressure piping and valve arrangement that allows
them to operate in series or parallel The maximum injection pressure that can be achieved by the equipment is approximately 2850psi
(195bar) with a flow rate up to 800gpm (50 L/s). Lower flow rates can be achieved through a bypass system. The electric pumps,
powered by diesel generators, are ideal for long duration stimulations and require less maintenance compared to positive displacement
pumps.
Figure 2: Horizontal, centrifugal pumps (blue), electric drives (green), and 10” (OD) piping to well head in the background.
3. STIMULATION
Injection into NWG 55-29 began on 9/22 to cool the wellbore in preparation for installation of a fiber optic distributed temperature
sensing (DTS) cable. On 9/23, rig up and testing of the stimulation system was completed and an initial step-rate test (srt) was
conducted from 9/23 to 9/26. The first round of stimulation continued until 10/13, with WHP generally over 2600psi except for brief
episodes related to leak fixing, pump trips, or well logging. Two TZIM treatment were injected on 10/13 and 10/14 before shutting the
Cladouhos et al.
3
pumps off and shutting the well-in on 10/15. After the first 3-week round of stimulation, the well was allowed to heat up for 7.5 days
and a flow test was conducted on 10/23. During a hibernation period from 10/24 to 11/10, the first round stimulation data was assessed
and used to finalize round 2 stimulation plans.
On 11/11, the stimulation pumps were restarted and a low pressure step-rate injectivity test was completed to determine the permanent
change in injectivity caused by the stimulation. This test was followed by a period of constant pumping pressure at 2200 psi, to cool the
wellbore in preparation for perforation shots. On 11/13, Cogco Wireline performed two perforation shots at 8229ft-8239ft and 8402ft-
8412ft, in an attempt to enhance flow at the wellbore in the formation at depths with minor flows. Following the perforation shots, the
well was allowed to flow back briefly to clean out any debris from the shots, before restarting stimulation on 11/14. A return to high
pressure stimulation began on 11/14 and lasted for one week. TZIM was injected on 11/18 and 11/19 to block the initial flow zones and
allow stimulation to open new zones. Injection ended on 11/20. Upon conclusion of the second round stimulation, the well was shut in
and allowed to heat up for 3.5 days while the pad was cleared of essential equipment. From 11/24-11/26 a second flow test was
conducted.
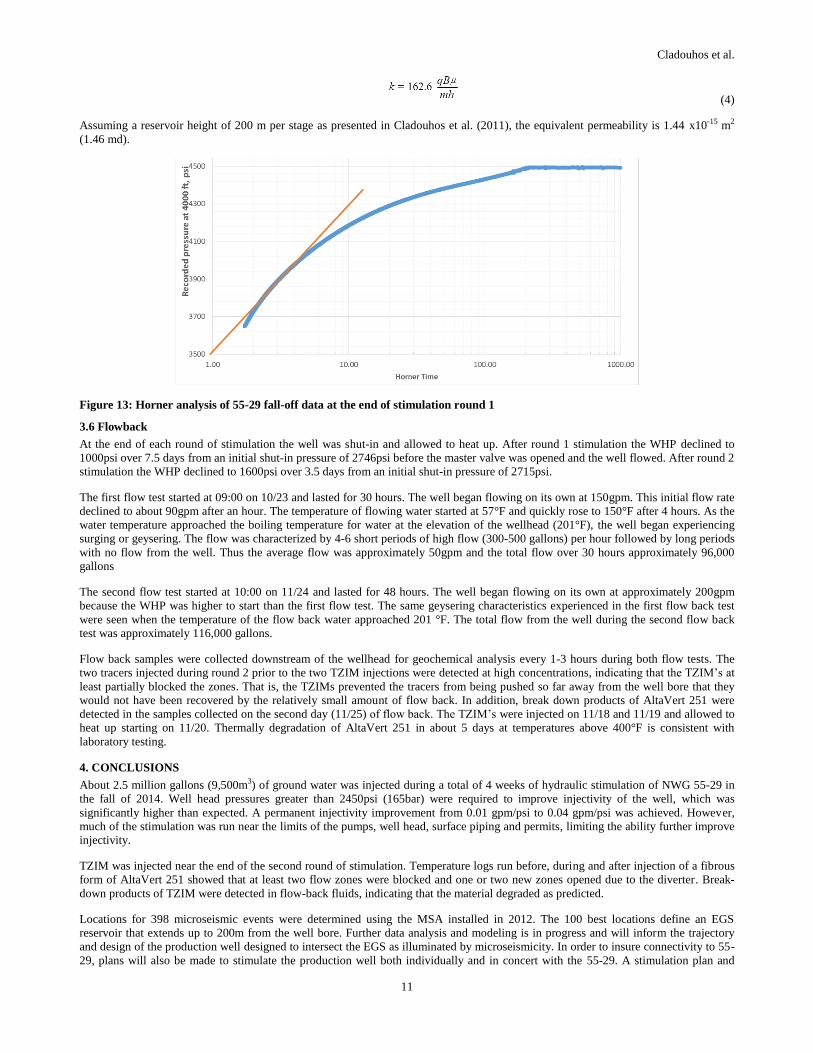
3.1 Well Head Pressure, Flow and Injectivity
A low pressure step-rate test from 1200 to 2000psi WHP was conducted overnight on 9/23 and 9/24 (Figure 3). At these pressures, flow
rates were below 30gpm and a very low injectivity index of 0.01 gpm/psi was determined (Figure 4). After piping leaks were repaired
on 9/24, the step rate test continued to 2600psi WHP. The flow rates at this pressure exceeded 60gpm with a noticeable increase in
injectivity to 0.03 gpm/psi during the steps from 2400 to 2600psi (Figure 4). Injectivity continued to increase to about 0.04 gpm/psi by
10/1. This injectivity improvement was permanent as indicated by low pressure step-rate testing on 11/11 and high pressure step-rate
testing on 10/15.
Flow rate spikes (e.g. on 9/27 on Figure 3) occurred when step rate pressure changes caused temporary high flows followed by a decline
in flow rate over an hour to lower flows. Thermohydrologic (TH) modeling using TOUGH2 (Sonnenthal et al., 2015) indicates that this
behavior can be explained by compression of the water due to the pressure increase in the well bore and formation.
Numerical modelling presented in Cladouhos et al. (2011) predicted that microseismicity and injectivity improvement would initiate at a
WHP of 1350psi and that 1950–2200psi would be sufficient to reach the required reservoir volume goal. The 2012 stimulation
(Cladouhos et al., 2013a, 2013b) seemed to confirm this prediction with injectivity improvements and deep seismicity (>8000ft,
>2.4km) initiating at a WHP of 1360psi and four additional deep seismic events occurring at a WHP of 1910psi. Thus the need to
exceed 2400psi WHP to promote stimulation was unexpected. The practical effect is that the stimulation pumps reached their maximum
pressure of 2850psi on 9/29, the sixth day of the stimulation. Surface equipment, shoe depth and regulatory agreements also specified
that the stimulation pressures be kept below 3000psi, so the pump performance was not the only limit preventing significantly higher
pressures.
Figure 3: Well head pressure (blue) and flow rate (green) records during round 1 (top two panels) and round 2 (bottom panel)
of 2014 stimulation. Times of step-rate test (srt) and TZIM treatments are shown.

Cladouhos et al.
4
Figure 4: Injectivity index (gpm/psi) on various dates. Points linked by lines are from step rate tests (srt) labeled in Fig 3.
3.2 Temperature data
A fiber optic distributed temperature sensing cable (DTS) was installed to the well on 9/22. While running the DTS cable into the well,
the cable was weight tested every 1000ft and signal tested periodically to ensure good signal return to surface. When the cable reached
9556ft, a signal test with a power meter showed no signal returns. After connecting the fiber to the signal box, it was determined that a
fiber break occurred at approximately 7800-7850ft in both channels. The decision was made to lower the cable as much as possible and
reconfigure the DTS box for single channel mode and monitor depth to approximately 8000ft downhole. This length of cable allowed
operators to monitor well bore cooling and confirm the integrity of the casing and casing shoe, however it did not capture any
information about fluid exit zones within the well, all of which were located below the monitored depth. Therefore, the DTS cable was
pulled out on 10/15.
After retrieving the DTS cable, a memory pressure, temperature, and spinner (PTS) tool was used to log to 9800ft while the well was
put on flow back. After the first survey run, the well was then put on injection and the PTS tool was again lowered to 9800ft in order to
observe permeable zones. At the end of the injection survey, the PTS tool was pulled up to 4000ft and used to monitor downhole
pressure while a step-rate injectivity test was performed. At the end of the injectivity test, the well was shut-in and the PTS tool sat at
4000ft for 11 hours while monitoring downhole pressure fall-off (analysis of this data is in Section 3.5).
Four PTS log runs were also collected as part of the TZIM treatment from 11/17-11/20. These logs are discussed below in Section 3.3.
3.3 Microseismicity
Microseismic monitoring is a key component of EGS development, as it is the best way to map the progress and extent of EGS growth.
3.3.1 Microseismic array and Background events
A microseismic array was installed in August 2012 as part of Phase 2.1. Two-Hz 3 component geophones were installed at seven
surface sites and eight borehole sites (Figure 5). The 15 stations stream continuous data via cell phone modem to a server running
acquisition software at AltaRock’s office in Seattle where the continuous data are saved and archived. Triggered waveforms were sent
to Lawrence Berkeley National Lab (LBNL) for locating and publishing to their public website (LBNL, 2015). Microseismic events
were also analyzed by the Pacific Northwest Seismic Network (PNSN, 2015) and Foulger Consulting, who focused on deriving moment
tensor solutions (Julian and Foulger, 2004).
The regional seismic network at Newberry Volcano has improved greatly in the past two years. In 2009, the only station was NCO, a
single-component, short-period seismometer on the east flank and only four microearthquakes (M 1.3-2.2) were detected on Newberry
in the prior 25 years (PNSN, 2015). In 2011, the USGS installed six three-component broadband seismometers and one three-
component short-period sensor (PNSN, 2015). Four of the borehole stations in the AltaRock Newberry MSA (NN32, NN19, NN17, and
NN21) were also added to the PNSN network. The seismic coverage on Newberry Volcano is now comprehensive, with events smaller
than M 0.0 being locatable. During the 2012 stimulation, about 175 events were located in the stimulation zone with magnitude between
M 0.0 and M 2.3 (Cladouhos et al., 2013a, 2013b). Between 3/1/2013 and 9/20/2014 there were about 60 natural seismic events located
on the Newberry edifice (PNSN, 2015). This apparent increase in Newberry Volcano seismicity since 2012 is due a much improved
seismic network, not EGS activities.

Cladouhos et al.
5
Figure 5: MSA locations, EGS well 55-29, and Newberry National Volcanic Monument (green shading).
3.3.2 Microseismicity rate during stimulation
As is typical of hydraulic well stimulation, the rate of seismicity correlates to well head pressure and flow rate (Figure 6).
Microseismicity did not commence until a WHP of 2600psi was exceeded. Over 30 events per day were located on 10/1-10/3 after the
WHP exceeded 2800psi. After five days of increasing seismicity and improving injectivity, the seismicity rate dropped by more than
50% by 10/6. Additional modeling (i.e. Sonnenthal et al, 2015) and further analysis have been undertaken to better understand the drop
in seismicity rate and early peaking of the injectivity improvement.
Figure 6: Temporal histogram of microseismic events. Green bars show frequency (N=100) of events for which moment tensors
were derived by Foulger Consulting using the methods described in Julian and Folger (2004). Red bars show all events
located in the stimulation zone (N=398).

Cladouhos et al.
6
3.3.3 EGS Seismic Event Locations
Triggered waveforms were analyzed by multiple means. First, the seismic acquisition software automatically identified events,
generating preliminary P- and S-wave picks and locations. The software sent an alert email to project scientists and seismologists
including a map of the preliminary location. In addition, waveforms were sent to LBNL and Foulger Consulting. The P&S picks for all
triggered events were reviewed by a seismologist within a day, resulting in location catalog of 398 hand-picked events. The locations of
the 398 microseismic events are diffuse likely due to location errors and plot up to 500 m from the injection well (Figure 7, left).
Figure 7: Locations of microseismic events in relation to well bore. (Left) all events, (Right) 100 best located events which also
have moment tensors derived. Circle is 1 km in radius. (Bottom) West-looking cross section of bottom part of 55-29.
To determine more accurate individual locations, and calculate moment tensors, Foulger Consulting re-measured arrival times for the
100 largest individual earthquakes as follows.
1. The triggered waveforms were imported into the Foulger Consulting interactive seismogram processing program epick;
2. In a first sweep through the data, P- and S-wave arrival times were measured and an initial location calculated;
3. In a second sweep through the data, each channel was re-processed, rotating the Z, E, and N channels to the earthquake
epicenter, and displaying U, R (radial) and T (transverse) seismograms;

Cladouhos et al.
7
4. The seismograms were filtered with a 5-Hz high-frequency cut-off, P- and S-wave polarities and amplitudes were measured,
and additional S-wave measurements were added where enhancement by the rotation process made this possible;
5. The earthquake was relocated, the residuals examined, and arrival-time measurements with large residuals are checked and
corrected where appropriate.
This process resulted in a catalog of best quality locations and moment tensors for 100 events. The locations of the 100 best-located
events (Figure 7, right, bottom), mostly within 200 m of the well bore, are significantly less diffuse than the full catalog.
To hydraulically characterize the seismically active stimulated region around the well, pore-pressure diffusion theory was applied to the
temporal distribution of events around the well. This is done by measuring the distance of each event from the well (r) and plotting
against the time of the event (t)(Figure 8). The spatial distribution of the events over time has a triggering front with a parabolic
signature (Parotidis, et al., 2004):
𝑟 = √4𝜋𝐷𝑡 (1)
where r is the distance of the triggering front, t is time, and D is the hydraulic diffusivity of the surrounding rock. After pumping of the
well has ceased, and the well is shut-in, seismicity continues to spread away from the well but develops a parabolic back-front:
𝑟 = √6𝐷𝑡 (𝑡
𝑡0− 1) 𝑙𝑛 (
𝑡
𝑡−𝑡0) (2)
where to is the shut-in time. The event distances with time were fit to parabolic triggering (Equation 1) and back fronts (Equation 2)
using a hydraulic diffusivity value of 0.004 m2/s and is shown with the wellhead pressure and flow curves in Figure 8. This value of
hydraulic diffusivity is in the range of observed diffusivity values for fractured and unfractured igneous rocks (Roeloffs, 1996).
Figure 8: Plot of radial distance of microseismic event from the well vs event time. Size of circles indicate event magnitudes.
Hydraulic diffusivity (D) of curves (equations 1 & 2) shown is 0.004 m2/sec.
3.3.4 Size Distribution
The most reliable moment magnitudes for the induced microseismic events were determined by LBNL. The 350 LBNL magnitudes
were used to determine the Gutenberg-Richter Law b-value of 1.0 (Figure 9). The only two events above M 2.0 during the stimulation
were a M 2.1 on 10/4 and M 2.3 on 11/17/1. There were 23 events between M 1.0 and 2.0. The rollover of the size distribution below M
0.0 (Figure 9) indicates that the seismic system’s lower sensitivity threshold was near M 0.0.

Cladouhos et al.
8
Figure 9: Log-log plot of size distribution of MEQs. Slope of line is b-value in the Gutenberg-Richter Law
Figure 10: Evolution of b-value during stimulations. Calculated from last 100 events up to including the date shown
In addition, we tracked the evolution of the b-value during the stimulation as part of the ISMP. At the end of each day the size
distribution of the previous 100 events was plotted and the b-value calculated (Figure 10). This figure shows that although the overall b-
value was 1.0, the sliding window of 100 events started low (0.85) and trended upward (1.1). Dips in the trend were associated with
events with M> 1.3 on 10/5, 10/12, 10/13, 11/16, and 11/17.
3.3.5 Size Distribution
McGarr (2014) proposed a simple relationship between the maximum moment of induced seismicity and volume change due to
extraction or injection of fluid:
Mo(max) = G Vinj (3)
where Mo(max) is the moment of the largest possible induced event, G is the modulus of rigidity of the rock mass and Vinj is the injected
volume of fluid in cubic meters (we only need consider injection here). McGarr (2014) compiled data from injection projects worldwide
to compare to the theoretical limit on induced seismicity magnitudes. In order to track seismic risk at Newberry, we plotted cumulative
injected volume, cumulative moment magnitude, and maximum moment magnitude and overlaid them on the McGarr (2014) data
compilation (Figure 11). The ratio of seismic energy to volume of injected water at Newberry was significantly lower than at other sites
that have experienced seismicity due to fluid injection. Thus, the Newberry site appears to have a much lower seismogenic index
(Shapiro et al., 2010) than other sites. The Newberry data points fall far below the line plotted from the empirical formula developed by
McGarr (2014) on a plot of maximum seismic moment to injected volume.

Cladouhos et al.
9
Figure 11: Maximum seismic moment and magnitude as functions of total volume of injected fluid from the start of injection
until the time of the largest induced earthquake compiled by McGarr (2014). For Newberry data points, the values were
plotted daily, and cumulative moment magnitude included as well as the maximum moment.
3.4 Thermally-degradable zonal isolation materials (TZIM)
During both rounds of the 2014 stimulation, AltaVert 251, designed to degrade above 400°F (200°C) in less than a week, was used in
two forms: powdered and fibrous. During round 2 injection of TZIM, a conservative tracer was injected as well prior to each TZIM
stage.
In order to monitoring diversion in real time during round 2 TZIM injection, a surface readout PTS provided by Well Analysis Corp was
used. Four PTS surveys were completed from 11/17-11/20 (Figure 12).
The first injecting temperature survey was taken on 11/17, prior to any TZIM injection in this round. This temperature profile showed a
pronounced inflection in the temperature gradient at approximately 9600ft, indicating fluid exiting the well bore at that depth. The
remaining fluid exited below the depth of the logging run at 9950ft, as indicated by the relatively cool (348°F) temperature at the bottom
of the log compared to the static temperature of 620°F. After the injection of the granular TZIM, another temperature survey was run on
11/18. This survey, showed a similar profile to the 11/17 log, with one zone at approximately 9600ft taking fluid and the remaining fluid
exiting below 9950ft. This indicates that the powdered TZIM did not cause significant diversion.
After the injection of the fibrous TZIM, two more PTS surveys were performed in order to assess the effectiveness of TZIM injection. A
11/19 survey showed that the 9600ft zone was taking less fluid (a less pronounced temperature inflection), and that an interval between
9720-9800ft began to take fluid as shown by a 40°F increase in temperature across this depth interval. In addition, the temperature at the
bottom of the log at 9950ft increased to 411°F while under continuous injection, indicating that the bottom 50ft of the hole was no
longer being significantly cooled, due to plugging of exit zones in that interval.
Another survey was conducted on 11/20 to confirm the observed downhole diversion. The 11/20 temperature survey continued to show
a reduced flow into the 9600ft zone. The cooling observed in a 80ft interval 12 hours before became more pronounced and localized to
9766ft in the 11/20 survey, showing cooling at this depth to 302°F lower than the previous three surveys. In addition, the temperature at
9950ft reached 440°F, an temperature increase of almost 100°F when compared to the pre-TZIM injecting survey. This indicates that
little or no fluid was exiting out of the bottom hole section of the wellbore and that the bottom of the hole was rapidly heating back up to
the native, static temperature of 620°F.

Cladouhos et al.
10
Figure 12: Temperature profiles from PTS logging. (top) 5000ft to TD to show all open hole and static profile (bottom) Detail in
bottom 1000ft of open hole to show blocking and opening of flow zones caused by TZIM
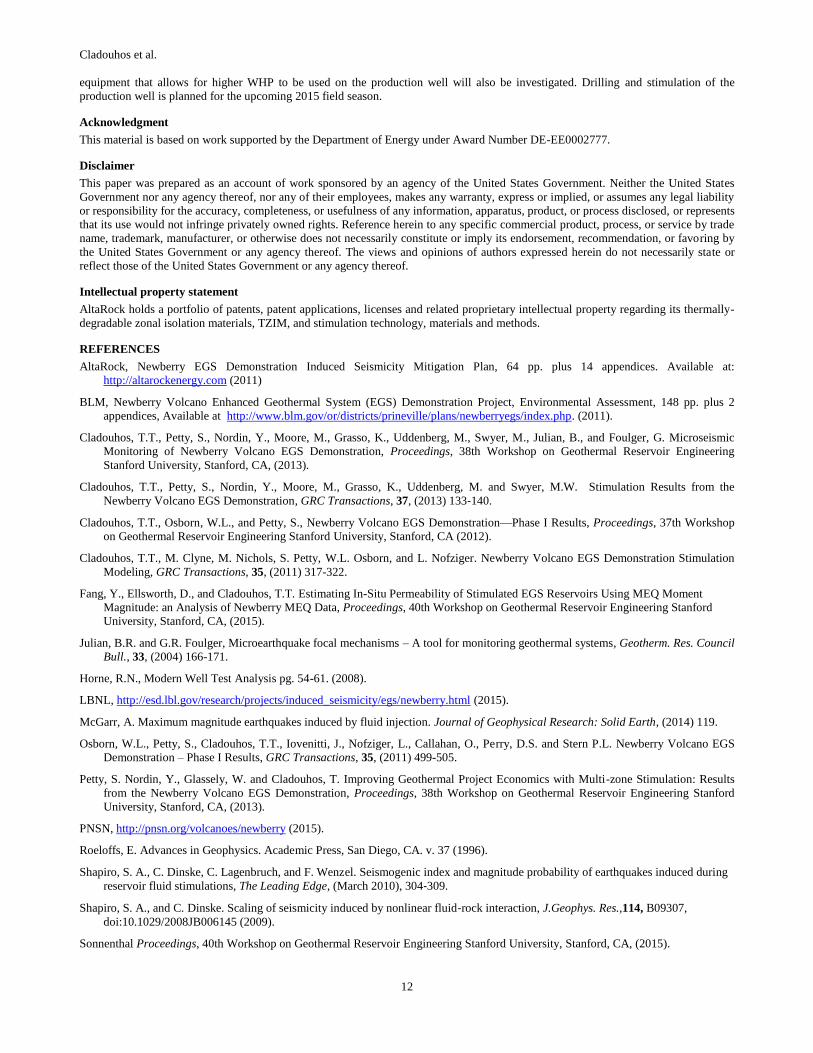
3.5 Fall Off
At the end of round 1 stimulation, a PTS tool was set at 4000ft while monitoring downhole pressure fall-off for 11 hours after shut-in.
The pressure fall-off data was used to conduct a Horner analysis in order to estimate the transmissivity of the well. Using first a semi-
log analysis approach, the reservoir behavior is anticipated to start after a shut-in time of 4.74 hours. This corresponded to a Horner time
of 2.69. Using Equation 4 from Horne (2008), the transmissivity is calculated to be 2.88 x10⁻¹³ m3 (957 md-ft).
Cladouhos et al.
11
(4)
Assuming a reservoir height of 200 m per stage as presented in Cladouhos et al. (2011), the equivalent permeability is 1.44 x10⁻¹⁵ m2
(1.46 md).
Figure 13: Horner analysis of 55-29 fall-off data at the end of stimulation round 1
3.6 Flowback
At the end of each round of stimulation the well was shut-in and allowed to heat up. After round 1 stimulation the WHP declined to
1000psi over 7.5 days from an initial shut-in pressure of 2746psi before the master valve was opened and the well flowed. After round 2
stimulation the WHP declined to 1600psi over 3.5 days from an initial shut-in pressure of 2715psi.
The first flow test started at 09:00 on 10/23 and lasted for 30 hours. The well began flowing on its own at 150gpm. This initial flow rate
declined to about 90gpm after an hour. The temperature of flowing water started at 57°F and quickly rose to 150°F after 4 hours. As the
water temperature approached the boiling temperature for water at the elevation of the wellhead (201°F), the well began experiencing
surging or geysering. The flow was characterized by 4-6 short periods of high flow (300-500 gallons) per hour followed by long periods
with no flow from the well. Thus the average flow was approximately 50gpm and the total flow over 30 hours approximately 96,000
gallons
The second flow test started at 10:00 on 11/24 and lasted for 48 hours. The well began flowing on its own at approximately 200gpm
because the WHP was higher to start than the first flow test. The same geysering characteristics experienced in the first flow back test
were seen when the temperature of the flow back water approached 201 °F. The total flow from the well during the second flow back
test was approximately 116,000 gallons.
Flow back samples were collected downstream of the wellhead for geochemical analysis every 1-3 hours during both flow tests. The
two tracers injected during round 2 prior to the two TZIM injections were detected at high concentrations, indicating that the TZIM’s at
least partially blocked the zones. That is, the TZIMs prevented the tracers from being pushed so far away from the well bore that they
would not have been recovered by the relatively small amount of flow back. In addition, break down products of AltaVert 251 were
detected in the samples collected on the second day (11/25) of flow back. The TZIM’s were injected on 11/18 and 11/19 and allowed to
heat up starting on 11/20. Thermally degradation of AltaVert 251 in about 5 days at temperatures above 400°F is consistent with
laboratory testing.
4. CONCLUSIONS
About 2.5 million gallons (9,500m3) of ground water was injected during a total of 4 weeks of hydraulic stimulation of NWG 55-29 in
the fall of 2014. Well head pressures greater than 2450psi (165bar) were required to improve injectivity of the well, which was
significantly higher than expected. A permanent injectivity improvement from 0.01 gpm/psi to 0.04 gpm/psi was achieved. However,
much of the stimulation was run near the limits of the pumps, well head, surface piping and permits, limiting the ability further improve
injectivity.
TZIM was injected near the end of the second round of stimulation. Temperature logs run before, during and after injection of a fibrous
form of AltaVert 251 showed that at least two flow zones were blocked and one or two new zones opened due to the diverter. Break-
down products of TZIM were detected in flow-back fluids, indicating that the material degraded as predicted.
Locations for 398 microseismic events were determined using the MSA installed in 2012. The 100 best locations define an EGS
reservoir that extends up to 200m from the well bore. Further data analysis and modeling is in progress and will inform the trajectory
and design of the production well designed to intersect the EGS as illuminated by microseismicity. In order to insure connectivity to 55-
29, plans will also be made to stimulate the production well both individually and in concert with the 55-29. A stimulation plan and
Cladouhos et al.
12
equipment that allows for higher WHP to be used on the production well will also be investigated. Drilling and stimulation of the
production well is planned for the upcoming 2015 field season.
Acknowledgment
This material is based on work supported by the Department of Energy under Award Number DE-EE0002777.
Disclaimer
This paper was prepared as an account of work sponsored by an agency of the United States Government. Neither the United States
Government nor any agency thereof, nor any of their employees, makes any warranty, express or implied, or assumes any legal liability
or responsibility for the accuracy, completeness, or usefulness of any information, apparatus, product, or process disclosed, or represents
that its use would not infringe privately owned rights. Reference herein to any specific commercial product, process, or service by trade
name, trademark, manufacturer, or otherwise does not necessarily constitute or imply its endorsement, recommendation, or favoring by
the United States Government or any agency thereof. The views and opinions of authors expressed herein do not necessarily state or
reflect those of the United States Government or any agency thereof.
Intellectual property statement
AltaRock holds a portfolio of patents, patent applications, licenses and related proprietary intellectual property regarding its thermally-
degradable zonal isolation materials, TZIM, and stimulation technology, materials and methods.
REFERENCES
AltaRock, Newberry EGS Demonstration Induced Seismicity Mitigation Plan, 64 pp. plus 14 appendices. Available at:
http://altarockenergy.com (2011)
BLM, Newberry Volcano Enhanced Geothermal System (EGS) Demonstration Project, Environmental Assessment, 148 pp. plus 2
appendices, Available at http://www.blm.gov/or/districts/prineville/plans/newberryegs/index.php. (2011).
Cladouhos, T.T., Petty, S., Nordin, Y., Moore, M., Grasso, K., Uddenberg, M., Swyer, M., Julian, B., and Foulger, G. Microseismic
Monitoring of Newberry Volcano EGS Demonstration, Proceedings, 38th Workshop on Geothermal Reservoir Engineering
Stanford University, Stanford, CA, (2013).
Cladouhos, T.T., Petty, S., Nordin, Y., Moore, M., Grasso, K., Uddenberg, M. and Swyer, M.W. Stimulation Results from the
Newberry Volcano EGS Demonstration, GRC Transactions, 37, (2013) 133‐140.
Cladouhos, T.T., Osborn, W.L., and Petty, S., Newberry Volcano EGS Demonstration—Phase I Results, Proceedings, 37th Workshop
on Geothermal Reservoir Engineering Stanford University, Stanford, CA (2012).
Cladouhos, T.T., M. Clyne, M. Nichols, S. Petty, W.L. Osborn, and L. Nofziger. Newberry Volcano EGS Demonstration Stimulation
Modeling, GRC Transactions, 35, (2011) 317-322.
Fang, Y., Ellsworth, D., and Cladouhos, T.T. Estimating In-Situ Permeability of Stimulated EGS Reservoirs Using MEQ Moment
Magnitude: an Analysis of Newberry MEQ Data, Proceedings, 40th Workshop on Geothermal Reservoir Engineering Stanford
University, Stanford, CA, (2015).
Julian, B.R. and G.R. Foulger, Microearthquake focal mechanisms – A tool for monitoring geothermal systems, Geotherm. Res. Council
Bull., 33, (2004) 166-171.
Horne, R.N., Modern Well Test Analysis pg. 54-61. (2008).
LBNL, http://esd.lbl.gov/research/projects/induced_seismicity/egs/newberry.html (2015).
McGarr, A. Maximum magnitude earthquakes induced by fluid injection. Journal of Geophysical Research: Solid Earth, (2014) 119.
Osborn, W.L., Petty, S., Cladouhos, T.T., Iovenitti, J., Nofziger, L., Callahan, O., Perry, D.S. and Stern P.L. Newberry Volcano EGS
Demonstration – Phase I Results, GRC Transactions, 35, (2011) 499-505.
Petty, S. Nordin, Y., Glassely, W. and Cladouhos, T. Improving Geothermal Project Economics with Multi-zone Stimulation: Results
from the Newberry Volcano EGS Demonstration, Proceedings, 38th Workshop on Geothermal Reservoir Engineering Stanford
University, Stanford, CA, (2013).
PNSN, http://pnsn.org/volcanoes/newberry (2015).
Roeloffs, E. Advances in Geophysics. Academic Press, San Diego, CA. v. 37 (1996).
Shapiro, S. A., C. Dinske, C. Lagenbruch, and F. Wenzel. Seismogenic index and magnitude probability of earthquakes induced during
reservoir fluid stimulations, The Leading Edge, (March 2010), 304‐309.
Shapiro, S. A., and C. Dinske. Scaling of seismicity induced by nonlinear fluid‐rock interaction, J.Geophys. Res.,114, B09307,
doi:10.1029/2008JB006145 (2009).
Sonnenthal Proceedings, 40th Workshop on Geothermal Reservoir Engineering Stanford University, Stanford, CA, (2015).