results from the college at brockport 2014 nsse survey presentation to president’s advisory...
TRANSCRIPT

Results from The College at Brockport 2014 NSSE Survey
Presentation to President’s Advisory Council– 3/4/15

Presentation Overview
1.NSSE and the Concept of Student Engagement
2.Selected NSSE Results for Brockport3.Using Our NSSE Data4.Questions & Discussion

What is Student Engagement?
What students do – Time and energy devoted to studies and other educationally purposeful activities
What institutions do – Using resources and effective educational practices to induce students to do the right things
Educationally effective institutions channel student energy toward the right activities

NSSE Survey Content
Engagement in meaningful academic experiences
Engagement in meaningful academic experiences
Engagement in High-Impact Practices
Engagement in High-Impact Practices
Student Reactions to College
Student Reactions to College
Student BackgroundInformation
Student BackgroundInformation
Student Learning & Development
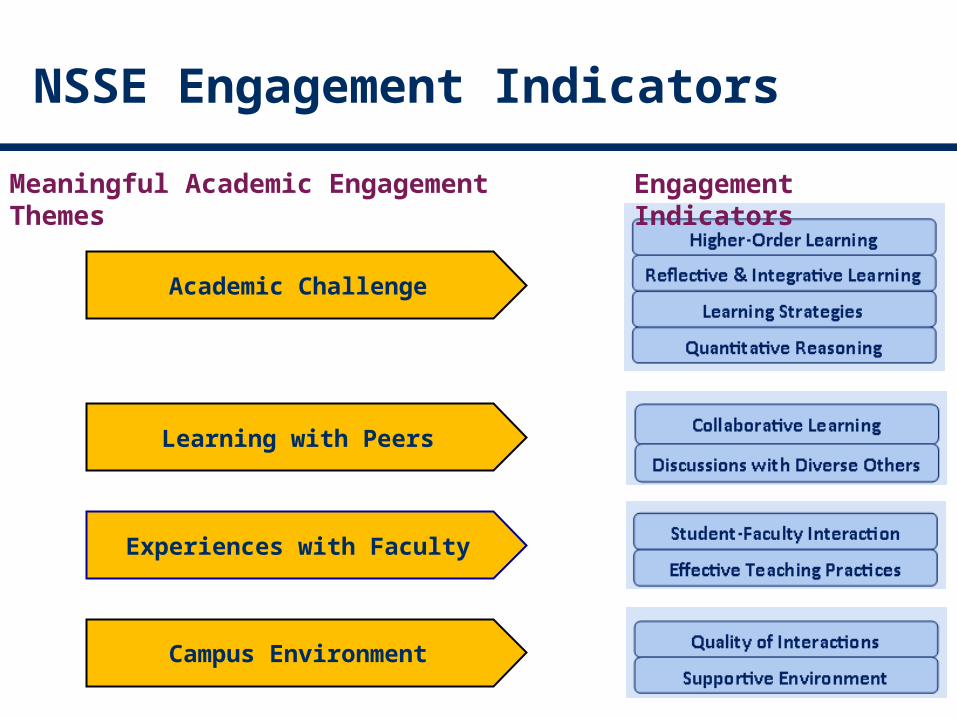
NSSE Engagement Indicators
Student – Faculty
Interaction
Academic Challenge
Experiences with Faculty
Learning with Peers
Campus Environment
Meaningful Academic Engagement Themes Engagement Indicators

Survey Administration
Census-administered to first-year & seniors
Spring administration
Multiple follow-ups to increase response rates
Topical Modules provide option to delve deeper into the student experience
Academic Advising
Development of Transferable Skills

Brockport’s Response Rate compared to NSSE 2014
Brockport’s response rate = 26% All NSSE 2014 institutions = 32%
NSSE 2014 U.S. Average Institutional Response Rates by Enrollment:
Undergraduate Enrollment
Number of Institutions
Avg. Institutional Response Rate
2,500 or fewer 271 39%
2,501 to 4,999 136 30%
5,000 to 9,999 111 24%
10,000 or more 104 22%
All institutions 622 32%

NSSE 2014 Respondents Compared to Population
Selected Sample ParametersFirst-year Students
Seniors
Resp % Pop % Resp % Pop %
African American/Black 10 9 5 7
Hispanic 3 4 4 4
White 73 75 81 79
Female 64 57 68 56

Selected NSSE Results for The College at Brockport
9

Using NSSE Data
General Barometer – How are we doing?
Monitoring strategic plan progress
Survey results as conversation starters
More in-depth planning aids

Key to next 2 slides
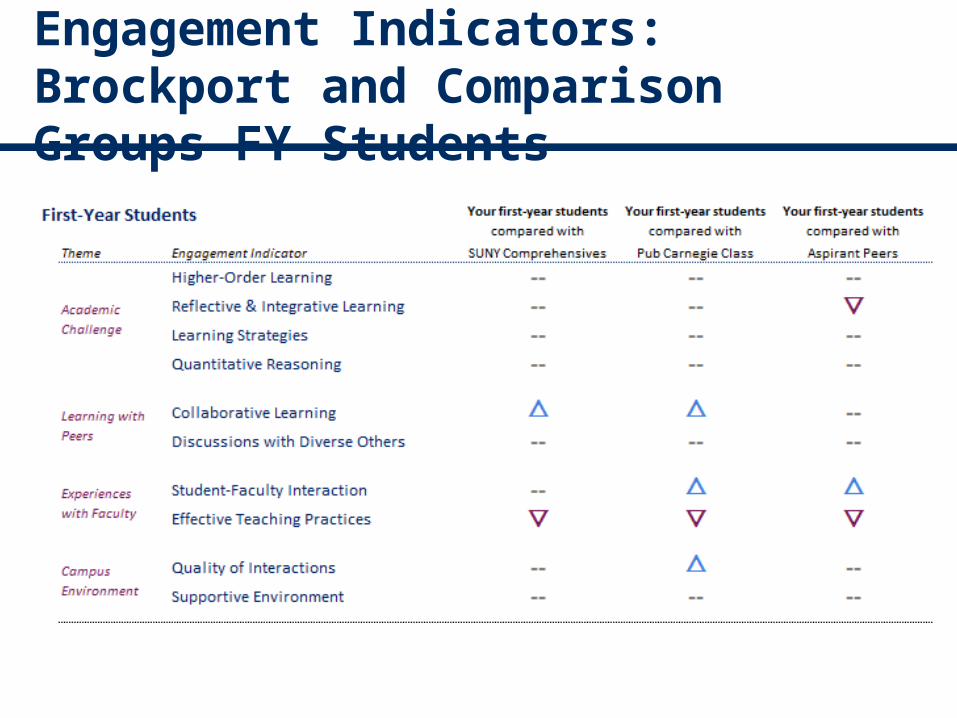
Engagement Indicators: Brockport and Comparison Groups-FY Students

Engagement Indicators: Brockport and Comparison Groups-SR Students

Highest and lowest performing items among FY students compared to SUNY Comprehensives
.

Highest and lowest performing items among SR students compared to SUNY Comprehensives

Monitoring Strategic Plan Progress Using NSSE Data (all items are mean scores)

Progress with HIPs

Progress with HIPs, cont.

Data Exercise with NSSE: More HIPs
Respondent Group
High Impact Practice
Participation Prediction
Participation Preference
Actual Participation
Looking w/in [subpop]
Faculty Value
Seniors Research w/faculty
• “Actual Participation”=% of students saying “done” or “in progress” by the time they graduate
• “Faculty value”=% of faculty who taught an upper-division course in spring ‘14 saying that they think it is “important” or “very important” that students work with a faculty member on a research project
• Subpopulations (Gender—M, F; Race/ethnicity—white, nonwhite as “Maj” and “Min”)
25% M F27% 25%
Min Maj37% 25%
62%

Do HIPs Matter? – Yes!
Not a cure-all but our HIPs index has small to moderate stat. sig. associations with a variety of other measures of student achievement, development, and satisfaction (all students). Outcomes Correlation
Self-reported grades .22
“Global” satisfaction measures
.12 & .17
Institution’s contribution to students’ knowledge, skills, and personal development in variety of areas
Corr coefficients ranging from .11 to .26 depending on specific item
Quality of Interactions w/Faculty
.26

Pay-off for minority students: HIPs correlation with self-reported institutional contributions to personal development in the following areas:
Item White Nonwhite Comparison
Writing .25 .35 ↑
Speaking .22 .30 ↑
Critical thinking
.24 .30 ↑
Job-related .23 .26 ↑
Working w/others
.22 .32 ↑
Personal code
.23 .28 ↑
Informed citizen
.15 .23 ↑
Questions & Discussion
22