results matter - colorado matter... · results matter data ... • funds 2.5 hrs/week/session for...
TRANSCRIPT


Results Matter
A national model for measuring early childhood outcomes
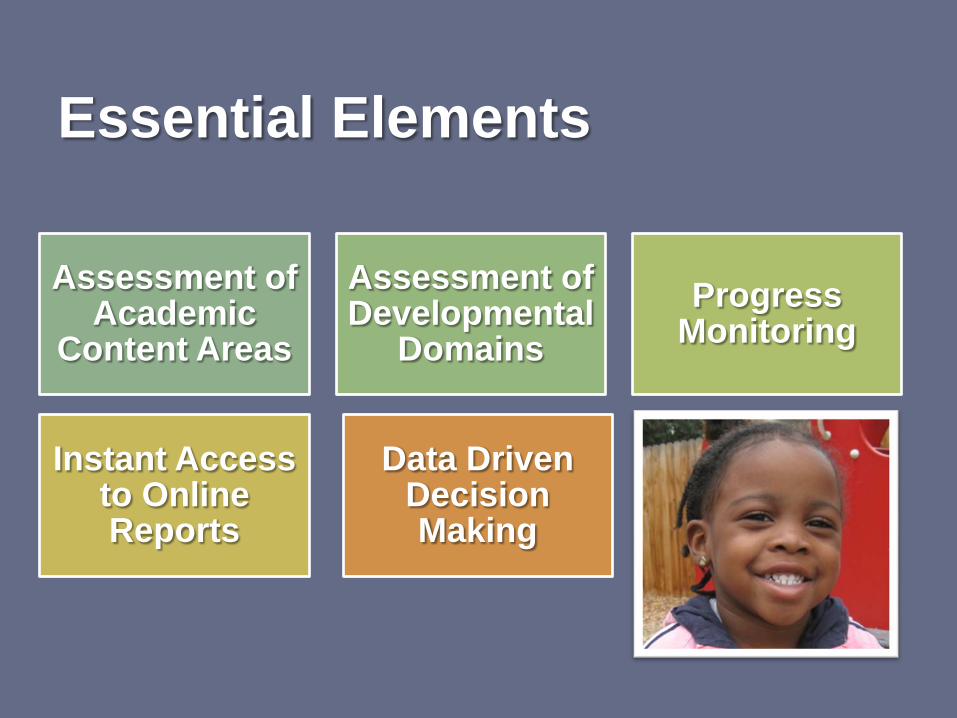
Essential Elements
Assessment of Academic
Content Areas
Assessment of Developmental
DomainsProgress
Monitoring
Instant Access to Online Reports
Data Driven Decision Making
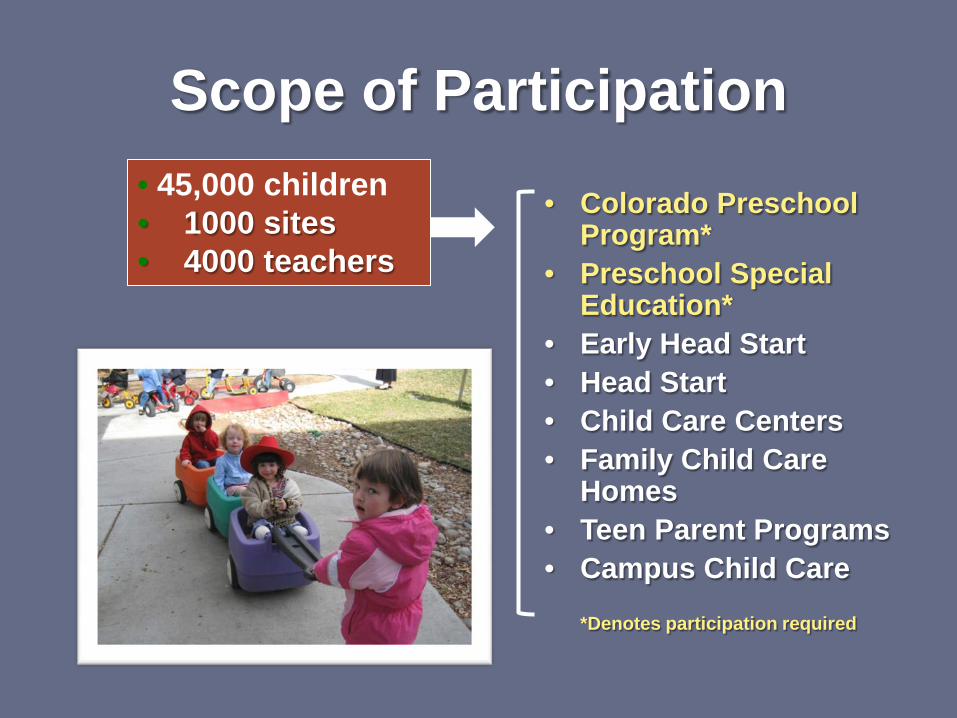
Scope of Participation
• Colorado Preschool Program*
• Preschool Special Education*
• Early Head Start• Head Start• Child Care Centers• Family Child Care
Homes• Teen Parent Programs• Campus Child Care
*Denotes participation required
• 45,000 children• 1000 sites• 4000 teachers

Questions We Can Ask of Results Matter Data
• How many children are meeting age expectations for development and learning?
• How do results for different groups of children compare? Criteria such as gender, funding source and primary language could be explored.
• How are instructional and intervention strategies changing developmental trajectories?

Early Childhood Outcomes Center 6
0
10
20
30
40
50
60
70
1 2 3 4 5 6 7 8 9 10 11 12
Gro
wth
in O
utco
me
Age in Months
Developmental Trajectories

Early Childhood Outcomes Center 7
0
10
20
30
40
50
60
70
0 6 12 18 24 30 36 42 48 54 60 66
Gro
wth
in O
utco
me
Age in Months
Developmental Trajectories

Early Childhood Outcomes Center 8
0
10
20
30
40
50
60
70
0 6 12 18 24 30 36 42 48 54 60 66
Gro
wth
in O
utco
me
Age in Months
Developmental TrajectoriesSame Trajectory = Widening Gap

Early Childhood Outcomes Center 9
0
10
20
30
40
50
60
70
0 6 12 18 24 30 36 42 48 54 60 66
Gro
wth
in O
utco
me
Age in Months
Developmental TrajectoriesChanged Trajectory = Closing Gap

Colorado Preschool Program
Presentation Companion to2011 Legislative Report
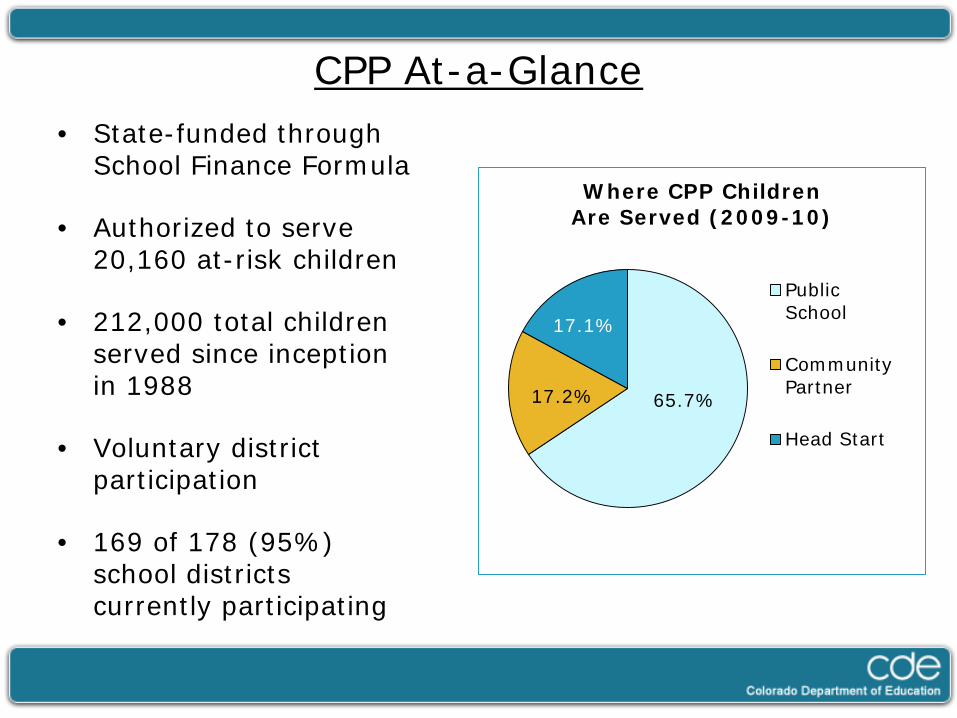
CPP At-a-Glance
65.7%17.2%
17.1%
Where CPP ChildrenAre Served (2009-10)
Public School
Community Partner
Head Start
• State-funded through School Finance Formula
• Authorized to serve 20,160 at-risk children
• 212,000 total children served since inception in 1988
• Voluntary district participation
• 169 of 178 (95%) school districts currently participating

• Preschoolers served minimum of 10 hrs/week
• Funds 2.5 hrs/week/session for teacher planning, child assessment, training, and family support activities
• Family involvement and support are required
• Child outcomes measured throughauthentic assessment
• District Advisory Councils supportthe implementation of the program
Critical Elements of CPP

CPP Enrollment over the Last Few Years
71,827 72,264 72,797
28,22830,857
34,943
20,160 20,160 20,160
0
10,000
20,000
30,000
40,000
50,000
60,000
70,000
80,000
2008 2009 2010
Total Number of Four-Year-Olds in Colorado
Estimated Number of Four-Year-Olds Eligible for Free/Reduced-Price Lunch
Number of Children Served by CPP
‡Estimate based on actual numbers from grades 1-8
(39.2%)
(42.7%) (48.0%)
†
‡
†Colorado State Demography Office

Who Are the Children in CPP?
0% 10% 20% 30% 40% 50% 60% 70% 80% 90%
Eligible for free/reduced-cost lunch
In need of language development
Poor social skills
Parent or guardian without high school degree or equivalent
Receiving services as neglected or dependent child
Frequent relocations
Unmarried teenage parent
Homelessness
Parent who abuses drugs or alcohol
Abusive adult in home
2009-10 School year
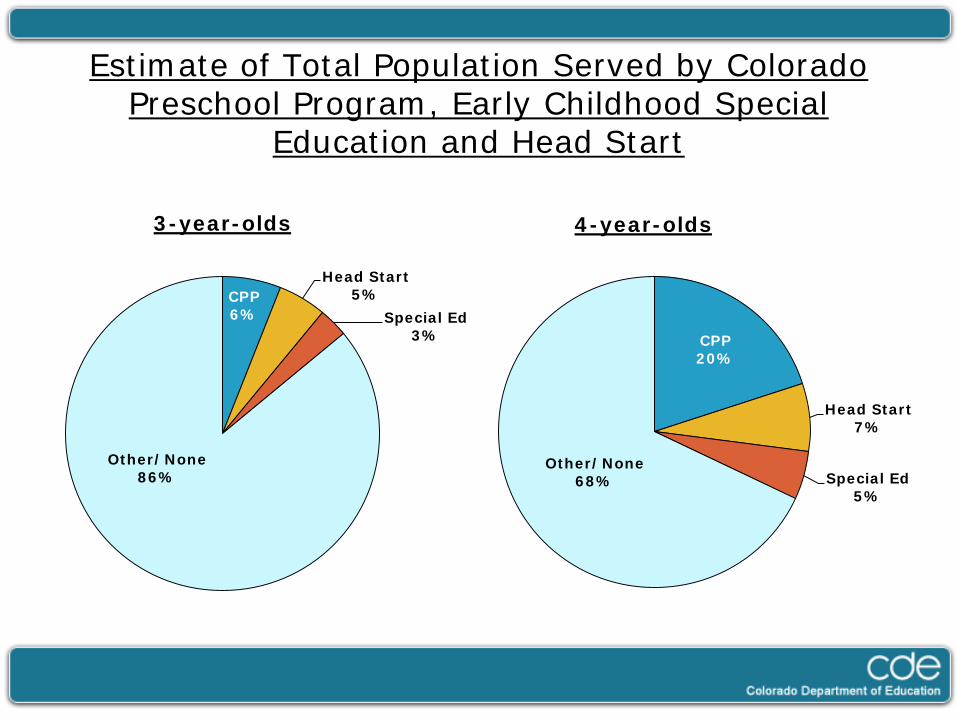
Estimate of Total Population Served by Colorado Preschool Program, Early Childhood Special
Education and Head Start
CPP20%
Head Start7%
Special Ed5%
Other/None68%
4-year-olds
CPP6%
Head Start5%
Special Ed3%
Other/None86%
3-year-olds

Closing the Achievement Gap

Physical Development
3.0
3.2
3.4
3.6
3.8
4.0
4.2
4.4
4.6
4.8
Fall Winter Spring
Avera
ge S
core
Creative CurriculumDevelopmental Continuum
CPP
Tuition
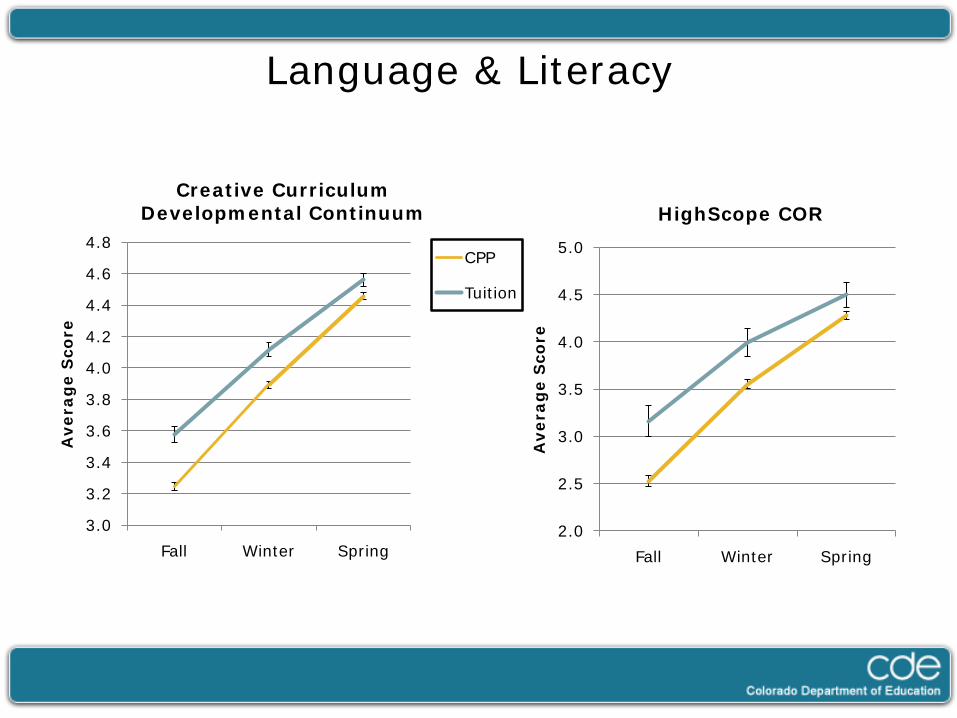
Language & Literacy
3.0
3.2
3.4
3.6
3.8
4.0
4.2
4.4
4.6
4.8
Fall Winter Spring
Avera
ge S
core
Creative Curriculum Developmental Continuum
CPP
Tuition
2.0
2.5
3.0
3.5
4.0
4.5
5.0
Fall Winter SpringA
vera
ge S
core
HighScope COR

Social & Emotional Development
3.0
3.2
3.4
3.6
3.8
4.0
4.2
4.4
4.6
4.8
Fall Winter Spring
Avera
ge S
core
Creative CurriculumDevelopmental Continuum
CPP
Tuition
2.0
2.5
3.0
3.5
4.0
4.5
5.0
Fall Winter SpringA
vera
ge S
core
HighScope COR

Math & Science
3.0
3.2
3.4
3.6
3.8
4.0
4.2
4.4
4.6
4.8
Fall Winter Spring
Avera
ge S
core
Creative Curriculum Developmental Continuum
CPP
Tuition
2.0
2.5
3.0
3.5
4.0
4.5
5.0
Fall Winter SpringA
vera
ge S
core
HighScope COR

Data Beyond Preschool

Results from the Colorado Basic Literacy Assessment
40%
45%
50%
55%
60%
65%
70%
Perc
en
t A
t o
r A
bo
ve G
rad
e L
evel
2008-09 K-3 CBLA Outcomes
- CPP* - At-Risk Children Who Did Not Participate in CPP**
K(2008)
2nd
(2009)
2nd
(2008)3rd
(2009)
- CPP* - At-Risk Children Who Did Not Participate in CPP**
1st
(2009) 1st
(2008)
5.7
9.3
8.57.28.7
6.8
= Percentage Point Difference*Children who participated in CPP using one slot
**Defined as eligible for Free/Reduced Price Lunch in 1st grade with no history of involvement in CPP
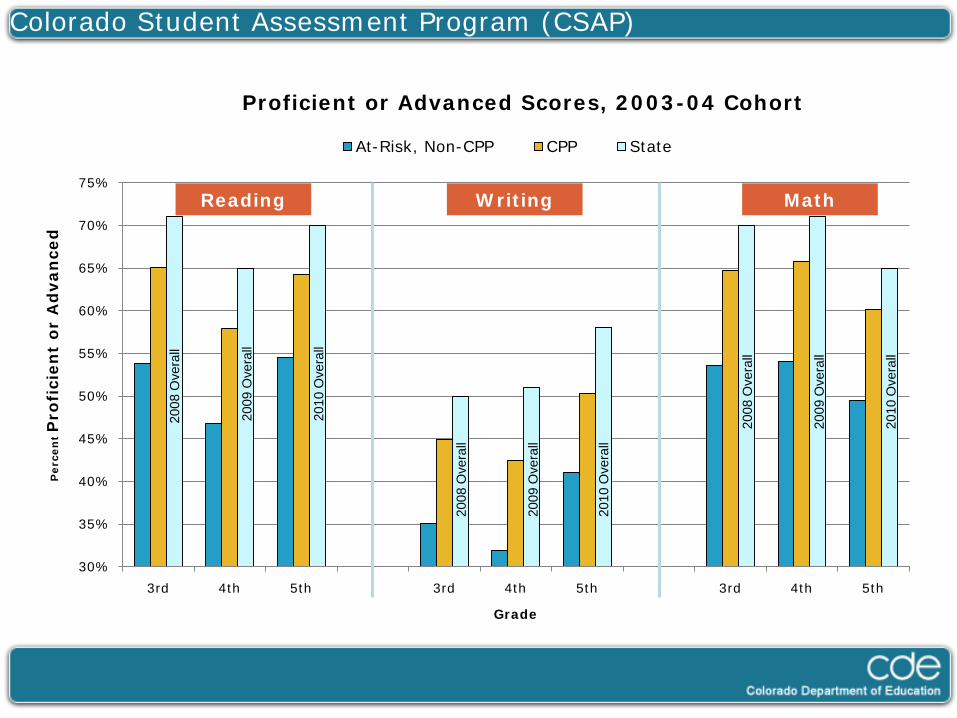
2006-07 Cohort 2005-06 Cohort 2004-05 Cohort
30%
35%
40%
45%
50%
55%
60%
65%
70%
75%
3rd 4th 5th 3rd 4th 5th 3rd 4th 5th
Perc
en
t P
rofi
cien
t o
r A
dvan
ced
Grade
Proficient or Advanced Scores, 2003-04 Cohort
At-Risk, Non-CPP CPP State
Colorado Student Assessment Program (CSAP)
Reading Writing Math20
08 O
vera
ll
2009
Ove
rall
2010
Ove
rall
2008
Ove
rall
2009
Ove
rall
2010
Ove
rall
2008
Ove
rall
2009
Ove
rall
2010
Ove
rall

0%
5%
10%
15%
20%
25%
3rd 4th 5th 3rd 4th 5th 3rd 4th 5th
Perc
en
tU
nsa
tisf
act
ory
Grade
Unsatisfactory Scores, 2003-04 Cohort
At-Risk, Non-CPP CPP State
Colorado Student Assessment Program (CSAP)
Reading Writing Math20
08 O
vera
ll
2009
Ove
rall
2010
Ove
rall
2008
O
vera
ll
2009
O
vera
ll
2010
O
vera
ll
2008
Ove
rall
2009
Ove
rall
2010
Ove
rall

Retention: Were Children Ever HeldBack in a Grade?
0% 1% 2% 3% 4% 5% 6% 7% 8% 9%
At-Risk ChildrenWho Did Not Attend CPP(N=13,261)
CPP2004-05 Cohort
(N=5278)
Percent Retained in Any Grade K-3
2005-09K-3 Cumulative Retention History

0.0%
0.5%
1.0%
1.5%
2.0%
2.5%
3.0%
3.5%
K 1st 2nd 3rd
Perc
en
t R
eta
ined
Grade
Were children ever retained in…
CPP 2004-05 Cohort At-Risk Who Did Not Attend CPP
Retention Rates
Retention rate cut in half!

Cost Benefits of CPP
• Average cost of providing an at-risk child a half-day preschool program (0.5 PPR): $3,537.75*
• Average cost of retaining a child in kindergarten (.58 PPR): $4,103.79*
• Average cost of retaining a child in first grade (1.0 PPR) : $7,075.50*
*Figures from FY 2010 Funding Levels

0%
10%
20%
30%
40%
50%
60%
3rd 4th 5th 6th 7th 8th 9th 10thStu
den
ts s
cori
ng
Pro
fici
en
t/A
dvan
ced
Grade
CSAP Reading: 2001-08
District Average 1996-97 CPP
Denver Public Schools

0%
10%
20%
30%
40%
50%
60%
3rd 4th 5th 6th 7th 8th 9th 10thStu
den
ts s
cori
ng
Pro
fici
en
t/A
dvan
ced
Grade
CSAP Reading: 2002-2009
District Average 1997-98 CPP
Denver Public Schools

14.5
15.0
15.5
16.0
16.5
17.0
17.5
18.0
18.5
English Math Reading Science
Avera
ge S
core
ACT College Entrance Exam Outcomes(Combined Average Scores: 2009-2010)
Other 11th graders Previous CPP Students
Denver Public Schools

CPP - The Bottom Line
Saves taxpayer money by reducing number of children held back in K-3
Reduces need for intensive intervention for children scoring “unsatisfactory” on CSAP
Closes the achievement gap with durable effects beyond preschool
Reaches variety of children in diverse settings while maintaining high quality

Early experiences can translate into school readiness, academic success, and lifetime well-being.
Success builds upon success.
When more children in a community are ready to learn, communitywide levels of human and social capital rise.
James HeckmanNobel Prize Winner
Economics