results presentation for year ended 31 december 2014 · net asset backing per share 17.2p (31 dec...
TRANSCRIPT

GPG Group and Coats plc
Results presentation for year ended
31 December 2014
26 February 2015

© GPG Group and Coats plc | Results presentation for year ended 31 December 2014 Page 2
Disclaimer
Restricted distribution
This presentation is not for release, publication or distribution, in whole or in part, directly or indirectly, in, into or from any jurisdiction where to do so would constitute a
violation of the relevant laws or regulations of such jurisdiction (the ‘Restricted Jurisdictions’).
Not an offer
This presentation is not intended to and does not constitute, or form part of, any offer to sell or subscribe for or an invitation to purchase or subscribe for any securities or
the solicitation of any vote or approval in any jurisdiction pursuant to the matters contained herein or otherwise.
Website
A copy of this presentation will be available subject to certain restrictions relating to persons resident in the Restricted Jurisdictions on GPG's website (www.gpgplc.com)
and Coats’ website (www.coats.com). The contents of both websites are not incorporated into and do not form part of this presentation.
Forward-looking statements
This document contains certain forward-looking statements, including statements regarding GPG's and Coats’ plans, objectives and expected performance. Such
statements relate to events and depend on circumstances that will occur in the future and are subject to risks, uncertainties and assumptions. There are a number of
factors which could cause actual results and developments to differ materially from those expressed or implied by such forward-looking statements, including, among
others the enactment of legislation or regulation that may impose costs or restrict activities; the re-negotiation of contracts of licences; fluctuations in demand and pricing
in the industry; fluctuations in exchange controls; changes in government policy and taxations; industrial disputes; and war and terrorism. These forward-looking
statements speak only as at the date of this document.
Not a profit forecast
The financial information contained in this presentation is based on publicly available historic financial information of the GPG group and is not intended to be a profit
forecast or profit estimate under applicable rules.
Rounding
Due to rounding, numbers presented throughout this document may not add up precisely to the totals provided and percentages may not precisely reflect the absolute
figures.

© GPG Group and Coats plc | Results presentation for year ended 31 December 2014 Page 3
Agenda
GPG
– Highlights
– Corporate changes, pensions and overheads
Coats
– Overview
– Financial performance
– Summary and outlook
Appendices
– Coats strategy
– Pensions
GPG

© GPG Group and Coats plc | Results presentation for year ended 31 December 2014 Page 5
GPG highlights
Corporate changes
Company to be renamed Coats Group plc
Coats - a world class, manufacturing business - returning to market under own name in in the
125th anniversary year of first listing on London Stock Exchange
Single Board of Directors to lead the Coats business, rather than an investment company
Financial performance
Operating profit £64m (2013: £41m) - increase driven by significant reduction in admin costs
Net attributable profit £9m, £23m in 2013 includes £46m profit from discontinued operations
Net asset backing per share 17.2p (31 Dec 2013: 31.5p) - decline reflects actuarial losses in
respect of retirement benefit schemes
Pensions
Continue to actively engage with UK Pensions Regulator’s (tPR’s) investigations

© GPG Group and Coats plc | Results presentation for year ended 31 December 2014 Page 6
Company name and Board changes
Establishes Coats as standalone, listed entity
Company becomes focused, global manufacturing business with market leading
positions; moves on from being investment company with diversified portfolio of assets
Renaming to Coats Group plc expected to become effective over coming days
Directors of Coats plc Board stepping up to Coats Group plc Board – two independent
NEDs and three executives (Group Chief Exec, CFO and CEO Industrial); three GPG
Directors retiring
Intend to put in place suitable capital structure – to this end Coats successfully
refinanced main debt facility with extended maturity and lower margin
Will look to grant share-based long term incentives for senior executives, in line with
standards of a FTSE 250 company - plan to fund employee benefit trust to buy shares
in open market over time

© GPG Group and Coats plc | Results presentation for year ended 31 December 2014 Page 7
Pensions and overheads
Pensions
IAS19 deficit increased to £375m (31 Dec 2013: £178m): main driver was increase in liabilities as decrease in
discount rate more than offset decrease in inflation rate
Triennial valuations: Coats Plan due to start Apr 2015; Brunel and Staveley ongoing, timing impacted by
investigations
Appointed new Group Pensions Director
tPR investigations update
Company moving on: continue to actively engage with investigations balancing interests of stakeholders
During investigations cannot make returns to shareholders
Warning Notice received on Coats Plan in Dec 2014 – having reviewed with legal and other advisers will continue
to robustly oppose tPR's view on insufficiency of resources; will litigate unless matter resolved via negotiation
In early 2015 proposal put to tPR and trustees to settle across three schemes; proposal not accepted
tPR indicated all three cases to be heard at same time, therefore any hearing unlikely before H2 2016 at earliest
Overheads
Reduced overhead costs, excluding foreign exchange, by 56% to £18m
Company continued to focus on minimising costs at Group level

Coats
Overview

© GPG Group and Coats plc | Results presentation for year ended 31 December 2014 Page 9
Overview
Delivered good profit and free cash flow growth
Net attributable profit, before exceptional items, up 21%, to $45m
Adjusted free cash flow of $70m
Continued margin improvement in Industrial
Executing growth strategy
14% revenue growth in Speciality driven by global expansion and new products
Share gains in core Industrial business based on innovation in services and products
North American Crafts sales grew 3%, excluding anticipated fashion yarn decline
Positioning Coats for future growth
Agreed EMEA Crafts sale - focus on high performing global Industrial and strong Americas Crafts businesses
Successfully refinanced debt facility and reduced leverage: platform to invest in internal and inorganic growth

© GPG Group and Coats plc | Results presentation for year ended 31 December 2014 Page 10
Geographic
Balanced Industrial growth
across regions
Double digit Industrial sales
growth in key markets
Innovative products
Sales of engineered
performance threads,
including Flamepro (aramids
used in personal protective
equipment), up $6m
Sales of aramid composites
(that enable replacement of
steel natural gas pipes with
reinforced thermoplastic
pipes) up $3m
Digital services
eCommerce: live in 15
markets and with >2,000
customers; orders fulfilled at
least one day faster than off
line orders
Coats Colour Express:
enabled 17% yoy growth in
colour sampling volumes, at
no incremental cost
Americas 5%
EMEA 6%
Asia 4%
Vietnam
14%
Turkey
22%
USA
11%
Delivering Profitable Sales Growth…
Industrial sales growth (yoy)

© GPG Group and Coats plc | Results presentation for year ended 31 December 2014 Page 11
… and increased productivity
Return on capital employed increased to 26% (2013: 22%);
primarily driven by sustainable improvement in Industrial
inventory and debtor management
Industrial manufacturing productivity and sourcing gains:
$15m y-o-y
Mix of incremental improvements and capital investments eg
bio mass plant for steam generation at Indian factory
Increasingly digital Industrial business model helping
continued internal efficiencies
Significantly expanded network of Lean and Six sigma experts
Increased employee productivity: Industrial sales per FTE up
5% y-o-y (like-for-like basis)
© GPG Group and Coats plc | Results presentation for year ended 31 December 2014 Page 12
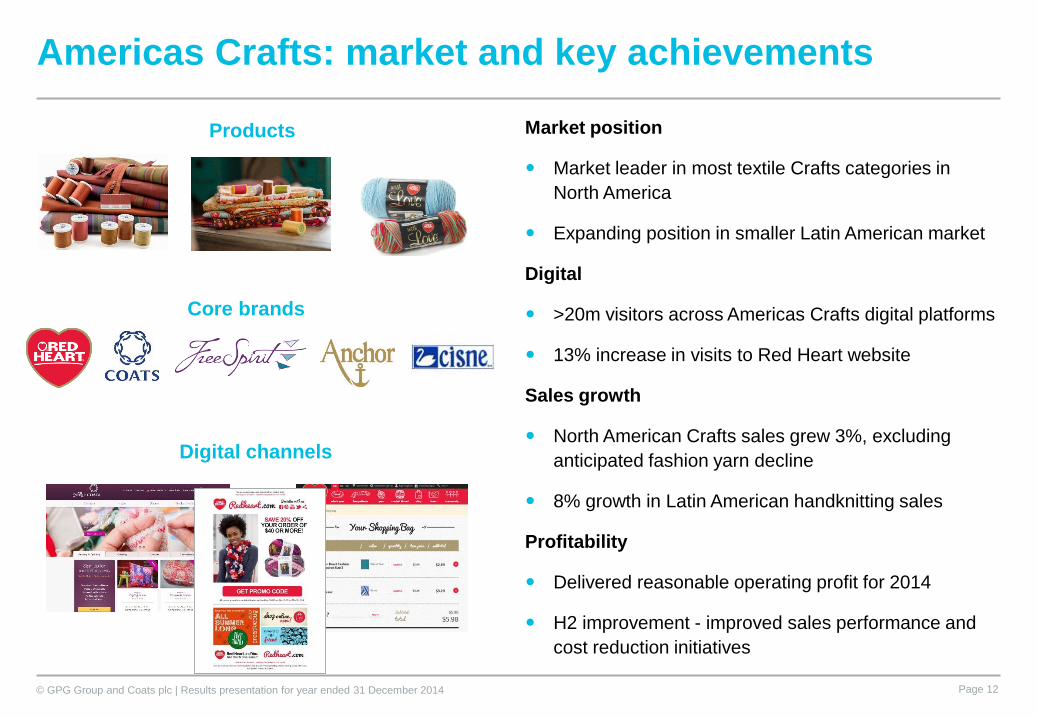
Americas Crafts: market and key achievements
Market position
Market leader in most textile Crafts categories in
North America
Expanding position in smaller Latin American market
Digital
>20m visitors across Americas Crafts digital platforms
13% increase in visits to Red Heart website
Sales growth
North American Crafts sales grew 3%, excluding
anticipated fashion yarn decline
8% growth in Latin American handknitting sales
Profitability
Delivered reasonable operating profit for 2014
H2 improvement - improved sales performance and
cost reduction initiatives
Digital channels
Core brands
Products

© GPG Group and Coats plc | Results presentation for year ended 31 December 2014 Page 13
Sale of EMEA Crafts business
Transaction
Announced sale to Aurelius Group on 19
Feb 2015
Follows strategy review of business
Sale better positions Coats for future
profitable growth and focus attention on
strong Americas Crafts and high performing
global Industrial businesses
Total consideration $10.0m1, overall deal
expected to be marginally cash negative
due to cash retained within business
Completion conditional upon customary
clearances; expected to complete Q2 2015
UK Crafts business to remain within Coats1) Payable in cash on completion subject to customary adjustments
2) For the EMEA Crafts business being sold
Financials
2014 revenues: $124.9m2
2014 pre-exceptional operating loss: $9.8m2
31 Dec 2014 net tangible assets (NTA), after
impairment: $35m2
$18.8m impairment charged to Coats in 2014
Given consideration and NTA position a
substantial loss on disposal expected
(quantum to be finalised on completion)
During transition period continue to incur costs
previously allocated to EMEA Crafts - will
impact Coats operating profit from ongoing
operations (to be reviewed to ensure medium
term Group margins not impacted)

© GPG Group and Coats plc | Results presentation for year ended 31 December 2014 Page 14
Improving returns and quality of earnings
14%
18%20%
18%
22%
26%
2009 2010 2011 2012 2013 2014
Return on capital employed (ROCE)1
6%
9%9%
8%
9%
11%
2009 2010 2011 2012 2013 2014
Return on invested capital (ROIC)1
Profitable Sales Growth – share gains, new
product and service innovation, geographic
expansion
Increased productivity – offsetting inflation
Expert pricing management
SD&A efficiency programmes and new
structures being implemented
Focus on working capital management
Capital discipline – capex ≤ x1.0 depreciation
Strong five year improvement trend in key
return metrics
1) 2009-11 figures adjusted by $6m (estimate) to reflect impact of adoption of IAS19 (revised) on operating profit

Coats
Financial performance

© GPG Group and Coats plc | Results presentation for year ended 31 December 2014 Page 16
Before
exceptional
items
Revenue 1,686 - 1,686 1,704 - 1,704
Operating profit 131 (24) 107 133 (9) 124
Profit before tax 100 (24) 76 97 (9) 88
Profit after tax 55 (24) 31 45 (8) 37
Attributable profit 45 (24) 21 37 (8) 29
KPIs Industrial Crafts Group
Sales Growth 2 5% (9)% 1%
Operating profit growth 3 18% (88)% -
Attributable profit growth 4 21%
Adjusted Free Cash Flow 5 $70m
$mExceptional
items 1Total
Before
exceptional
items
Exceptional
items 1Total
Financial performance
1) Exceptional items set out on slide 21
2) On a like-for-like basis (restates 2013 comparative figure at 2014 exchange rates)
3) On a like-for-like basis before exceptional items
4) On a reported basis before exceptional items
5) Adjusted for exceptional items (see slide 24)
© GPG Group and Coats plc | Results presentation for year ended 31 December 2014 Page 17
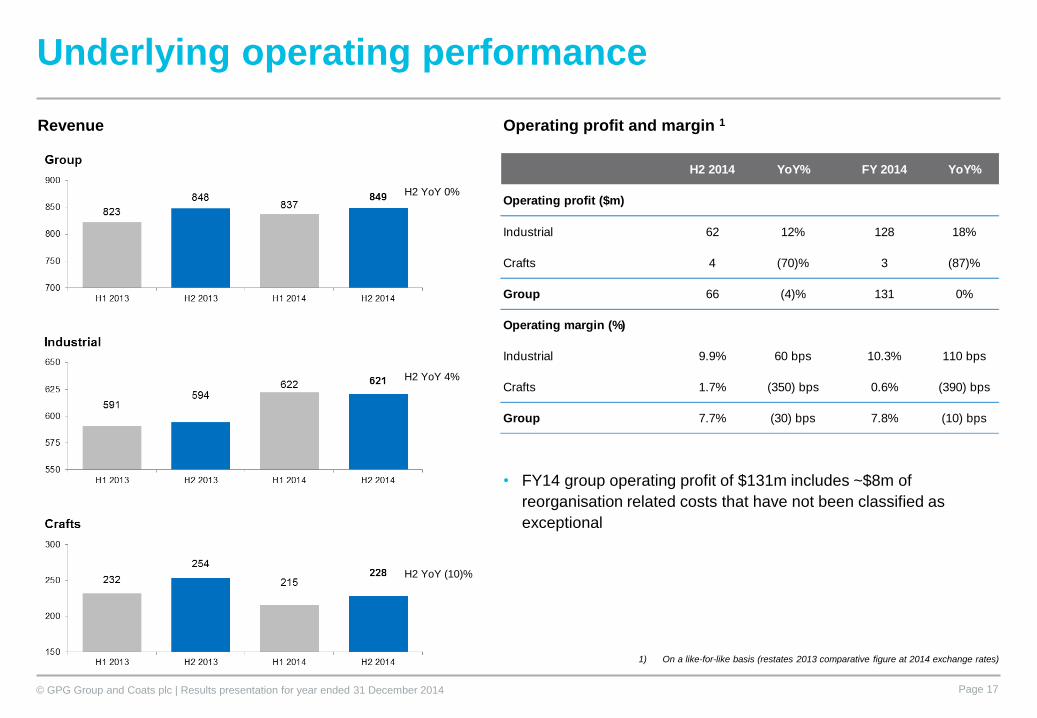
Underlying operating performance
Operating profit and margin 1
1) On a like-for-like basis (restates 2013 comparative figure at 2014 exchange rates)
Revenue
H2 YoY 0%
H2 YoY 4%
H2 YoY (10)%
• FY14 group operating profit of $131m includes ~$8m of
reorganisation related costs that have not been classified as
exceptional
H2 2014 YoY% FY 2014 YoY%
Operating profit ($m)
Industrial 62 12% 128 18%
Crafts 4 (70)% 3 (87)%
Group 66 (4)% 131 0%
Operating margin (%)
Industrial 9.9% 60 bps 10.3% 110 bps
Crafts 1.7% (350) bps 0.6% (390) bps
Group 7.7% (30) bps 7.8% (10) bps
© GPG Group and Coats plc | Results presentation for year ended 31 December 2014 Page 18
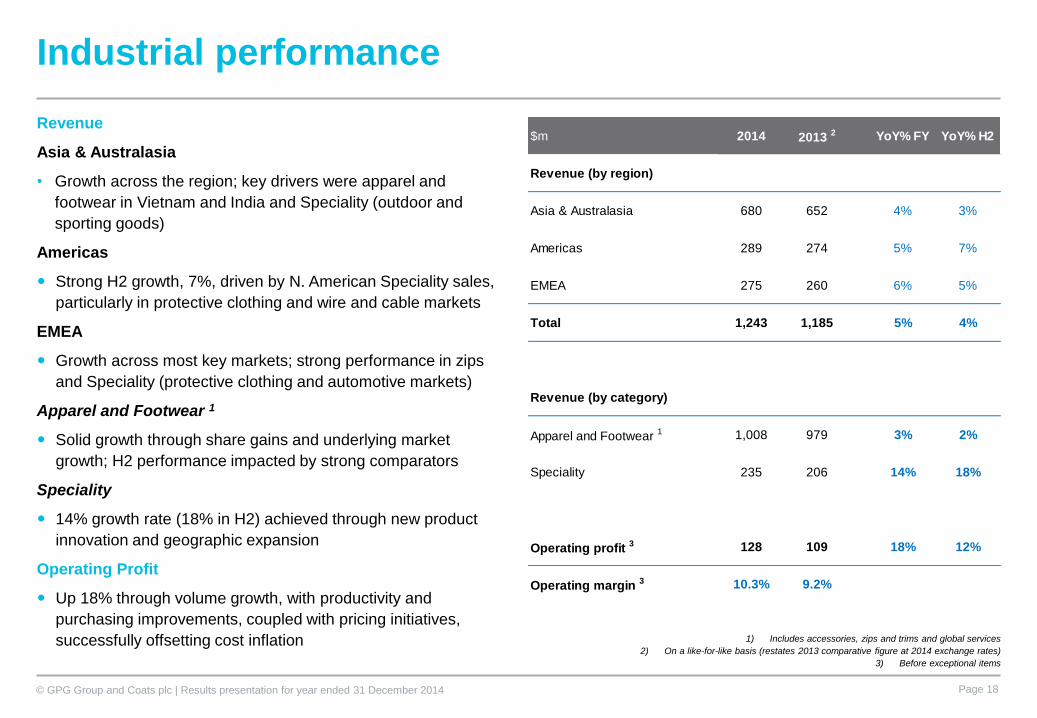
Industrial performance
Revenue
Asia & Australasia
• Growth across the region; key drivers were apparel and
footwear in Vietnam and India and Speciality (outdoor and
sporting goods)
Americas
Strong H2 growth, 7%, driven by N. American Speciality sales,
particularly in protective clothing and wire and cable markets
EMEA
Growth across most key markets; strong performance in zips
and Speciality (protective clothing and automotive markets)
Apparel and Footwear 1
Solid growth through share gains and underlying market
growth; H2 performance impacted by strong comparators
Speciality
14% growth rate (18% in H2) achieved through new product
innovation and geographic expansion
Operating Profit
Up 18% through volume growth, with productivity and
purchasing improvements, coupled with pricing initiatives,
successfully offsetting cost inflation 1) Includes accessories, zips and trims and global services
2) On a like-for-like basis (restates 2013 comparative figure at 2014 exchange rates)
3) Before exceptional items
$m 2014 2013 2 YoY% FY YoY% H2
Revenue (by region)
Asia & Australasia 680 652 4% 3%
Americas 289 274 5% 7%
EMEA 275 260 6% 5%
Total 1,243 1,185 5% 4%
Revenue (by category)
Apparel and Footwear 1 1,008 979 3% 2%
Speciality 235 206 14% 18%
Operating profit 3 128 109 18% 12%
Operating margin 3 10.3% 9.2%

© GPG Group and Coats plc | Results presentation for year ended 31 December 2014 Page 19
Crafts performance
1) Includes other textile craft products
2) On a like-for-like basis (restates 2013 comparative figure at 2014 exchange rates)
3) Before exceptional items
Revenue
Americas
• N. America impacted by decline in fashion handknittings following
2013 demand peak; excluding this product range sales grew 3%
• Latin American y-o-y growth in Handknittings continued in H2,
despite tough market conditions, although Needlecrafts declined
EMEA
• Sales down across both Handknittings, due to significant decline in
demand for fashion products, and Needlecrafts
• Change in Scandinavian business model had a FY impact of $11m
/ 6% on EMEA revenue y-o-y (H2: $4m)
Needlecrafts 1
• Lower revenues reflect long term market decline
Handknittings
• Impacted by changing fashion trends following 2013 demand peak
Operating Profit
• Year-on-year decline primarily due to lower overall sales
• Returned to profitability in H2, in line with guidance, due to
improved sales in Americas, cost reduction initiatives and avoiding
one-offs incurred in H1
• Americas business delivered reasonable operating profit
$m 2014 2013 2 YoY% FY YoY% H2
Revenue (by region)
Americas 296 312 (5)% (6)%
EMEA 147 173 (15)% (17)%
Total 443 485 (9)% (10)%
Revenue (by category)
Needlecrafts 1 206 220 (6)% (6)%
Handknittings 236 265 (11)% (13)%
Operating profit 3 3 22 (87)% (70)%
Operating margin 3 0.6% 4.5%

© GPG Group and Coats plc | Results presentation for year ended 31 December 2014 Page 20
Income statement
Attributable profit before exceptional
items up $8m (21%):
• Operating profit decrease ($2m)
• Lower pension finance costs ($5m)
due to lower IAS19 pensions deficit at
start of 2014 compared to start of
2013
- Higher charge in 2015 due to
increase in deficit for UK funded
scheme during 2014
• Decline in finance costs driven by $4m
reduction in interest charges, due to
lower debt and reduction in average
interest rate
• Lower tax charge; underlying tax rate
reduced 500bps y-o-y to 42% (see
slide 22)
1) Exceptional items set out on slide 21
$mBefore
exceptional
items
Exceptional
items 1Total
Before
exceptional
items
Exceptional
items 1Total
Revenue 1,686 - 1,686 1,704 - 1,704
Operating profit 131 (24) 107 133 (9) 124
Share of profit of JVs 2 - 2 1 - 1
Investment income 3 - 3 5 - 5
Pension finance costs (7) - (7) (12) - (12)
Finance costs (27) - (27) (29) - (29)
Profit before tax 100 (24) 76 97 (9) 88
Tax (46) (0) (46) (51) 0 (51)
Profit after tax 55 (24) 31 45 (8) 37
Minority interest (10) - (10) (8) - (8)
Attributable Profit 45 (24) 21 37 (8) 29

© GPG Group and Coats plc | Results presentation for year ended 31 December 2014 Page 21
Exceptional items
• $19m impairment of property, plant and equipment
and intangible assets in EMEA Crafts
• No exceptional reorganisation charges incurred in
2014 (in line with guidance)
• Operating profit includes ~$8m of reorganisation
related costs that have not been classified as
exceptional
• $4m tPR charge relates to costs incurred by trustee
of Coats UK pension plan in 2014 in responding to
tPR’s investigation into scheme and provision made
for trustee’s expected costs to respond to WN
• $3m profit on property disposals (related to activities
in 2014 and in prior years)
• Other exceptional items in 2014 relate to capital
incentive plan (expected to be lower in 2015)
$m 2014 2013
Reorganisation - (22)
tPR (4) -
Property gain on disposal 3 20
US antitrust settlement - (7)
Impairment of non-current assets in
EMEA Crafts(19) (1)
Other exceptionals (4) 1
Total exceptional costs (24) (9)

© GPG Group and Coats plc | Results presentation for year ended 31 December 2014 Page 22
Taxation
• Reported tax rate of 60%
- Marginal increase y-o-y due to higher
level of exceptional items (no tax relief)
• Underlying tax rate1 reduced by 500bps y-o-y
to 42%, primarily reflecting:
- change in mix as regions with lower
statutory tax rates contributed higher
profits
- reduction in unrelieved losses
1) Pre-exceptional items and IAS 19 interest
2) Adjusted for tax on reorganisation, property sales and US antitrust litigation. 2014 cash outflow on a reported basis $56m
• Tax cash outflow in 2014 of $53m2, a 5% decline y-o-y
Tax PBT % Tax PBT %
As reported (46) 76 60% (51) 88 58%
Exceptional items - 24 - 9
Pension interest IAS19 - 7 - 12
Underlying tax rate (46) 107 42% (51) 109 47%
Cash Outflow (53) (56)
$m 2014 2013
2
© GPG Group and Coats plc | Results presentation for year ended 31 December 2014 Page 23
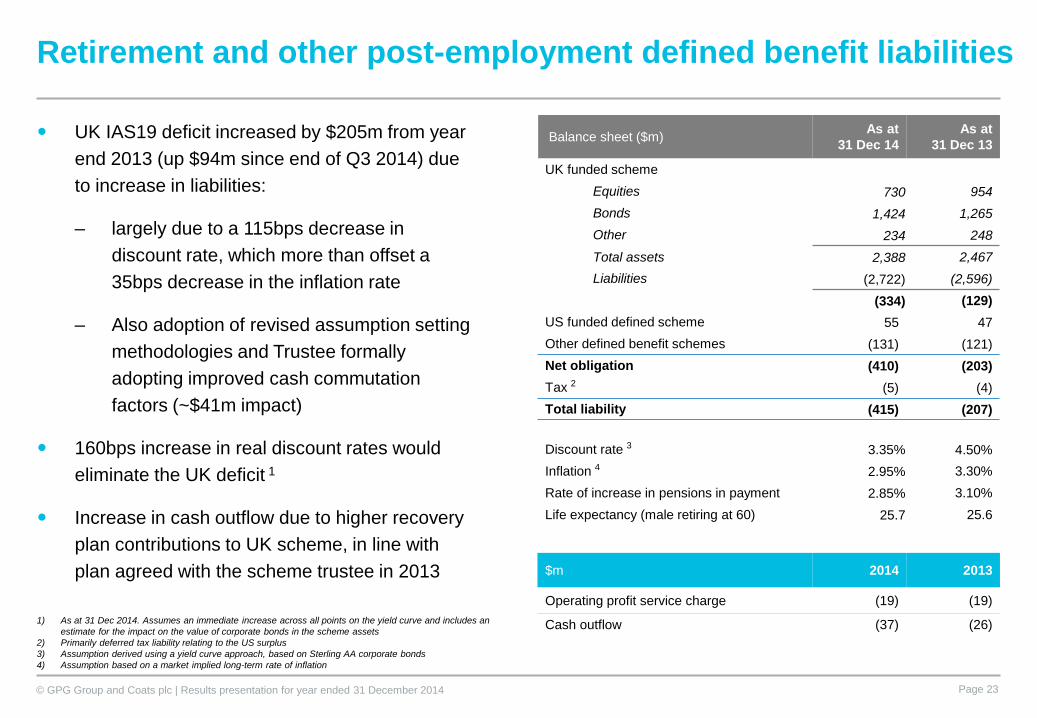
Retirement and other post-employment defined benefit liabilities
1) As at 31 Dec 2014. Assumes an immediate increase across all points on the yield curve and includes an
estimate for the impact on the value of corporate bonds in the scheme assets
2) Primarily deferred tax liability relating to the US surplus
3) Assumption derived using a yield curve approach, based on Sterling AA corporate bonds
4) Assumption based on a market implied long-term rate of inflation
Balance sheet ($m)As at
31 Dec 14
As at
31 Dec 13
UK funded scheme
Equities 730 954
Bonds 1,424 1,265
Other 234 248
Total assets 2,388 2,467
Liabilities (2,722) (2,596)
(334) (129)
US funded defined scheme 55 47
Other defined benefit schemes (131) (121)
Net obligation (410) (203)
Tax 2 (5) (4)
Total liability (415) (207)
Discount rate 3 3.35% 4.50%
Inflation 4 2.95% 3.30%
Rate of increase in pensions in payment 2.85% 3.10%
Life expectancy (male retiring at 60) 25.7 25.6
$m 2014 2013
Operating profit service charge (19) (19)
Cash outflow (37) (26)
UK IAS19 deficit increased by $205m from year
end 2013 (up $94m since end of Q3 2014) due
to increase in liabilities:
– largely due to a 115bps decrease in
discount rate, which more than offset a
35bps decrease in the inflation rate
– Also adoption of revised assumption setting
methodologies and Trustee formally
adopting improved cash commutation
factors (~$41m impact)
160bps increase in real discount rates would
eliminate the UK deficit 1
Increase in cash outflow due to higher recovery
plan contributions to UK scheme, in line with
plan agreed with the scheme trustee in 2013

© GPG Group and Coats plc | Results presentation for year ended 31 December 2014 Page 24
Cash flow and leverage
Cash flow
Adjusted free cash flow up 30% y-o-y
Working capital inflow due to improvements in
Industrial inventory and debtor management, and
reduced Crafts sales
Capex at x1.0 depreciation1; y-o-y increase in spend
driven by investment in IT and digital services and
efficiency initiatives
Interest $4m down due to reduced debt and
average rates
5% reduction in tax cash paid
Pension payments up $11m; in line with recovery
plan agreed with trustee of Coats UK plan in 2013
Other includes provisions and payments of
dividends to minorities
Leverage
Reduction in net debt and leverage ratio due to
strong operating cash flows
1) Depreciation and computer software amortisation
Cash flow bridge
2013 182 10 (36) (26) (56) (7) (13) 54 (9) 45
$m 2014 2013 2012
Leverage ratio 1.4x 1.8x 2.1x
Net debt 263 329 368
NWC%sales 12% 15% 17%

© GPG Group and Coats plc | Results presentation for year ended 31 December 2014 Page 25
Successfully refinanced debt facility
$760m syndicated bank facility successfully
replaced with new $680m revolving facility
Facility oversubscribed
Margin reduced by ~25bps
Changed group of international banks -
better reflects Coats’ global footprint
Size of facility reflects Coats’ ability to
generate free cash
No change in financial covenants
Key terms and features
Size $680m
Maturity (date) 5 years (Feb 2020)
Margin structure Margin dependent on
financial leverage
2015 pricing
(indicative)
LIBOR +150bps
Leverage covenant Net debt / EBITDA
≤ 3x
Interest cover EBITDA / net finance
charges ≥ 4x

Coats
Outlook and summary

© GPG Group and Coats plc | Results presentation for year ended 31 December 2014 Page 27
Consumer demand
• Mixed regional picture expected to continue: broadly positive in Asia, solid growth in North America, Europe
dependent on underlying macroeconomic situation and relatively flat situation in Latin America
Industrial
• In deflationary environment, more challenging to offset payroll and other cost pressures with price improvements
• Apparel and Footwear: focus on increased digitisation of customer engagement and order management
• Speciality: sales growth through geographic expansion and product innovation (eg aramids and composites)
• Continue to invest in growing the business and exploring potential inorganic growth opportunities
Crafts (Americas)
• Expected growth in core handknittings to be offset by reduced demand for fashion handknitting products
Group
• Mixed consumer demand, inflationary challenges and continued strengthening of USD to negatively impact
operating profits; somewhat mitigated by losses attributable to EMEA Crafts as discontinued items
• Leading to broadly stable operating profit; with profitability weighted towards H2
• Attributable profit affected by increase in pensions finance costs; offset by improvements in tax and interest
2015 outlook

© GPG Group and Coats plc | Results presentation for year ended 31 December 2014 Page 28
• Global market leader with robust fundamentals; strong and defendable core
• Defined growth strategy
− Apparel and Footwear: share gains based on innovation in services and products
− Speciality: growth through global expansion and new products
− Crafts: focus on strong and profitable Americas business
• Supported by key differentiators: world class asset base, product innovation, service
enhancements (including digital), highly engaged workforce and corporate responsibility
• Delivering attributable profit growth and generating significant free cash flow
• Well positioned for future sales, earnings and free cash flow growth
Summary

Appendices
Coats strategy
GPG pensions, investigations and overheads
Coats pension schemes

© GPG Group and Coats plc | Results presentation for year ended 31 December 2014 Page 30
With a rich heritage dating back to the
1750s, Coats is the world’s leading
industrial thread and consumer textile crafts
business employing ~20,000 employees in
over 70 countries across six continents
• Group revenues of US$1.7bn in 2014
• World’s leading industrial thread
producer
• Leading and expanding position in
Speciality thread and yarn market
• Largest global player in textile crafts
• Headquartered in UK
Coats is the world’s leading industrial thread
and textile crafts business
Countries in which Coats operates
Manufacturing sites
Who we are

© GPG Group and Coats plc | Results presentation for year ended 31 December 2014 Page 31
Targeting known markets through
organic and acquisitive growth
Strong and defendable core business
Leadership, peopleand systems to deliver growth
Focus on sales, earnings and free cash flow
growth
Key differentiators that provide a platform for growth
Five elements to our value
3. Global
presence and
capabilities
4.
Experienced
management
team
1. Global
market leader
with robust
fundamentals
5. Cash
generative;
consistent
growth
2. Defined
growth
strategy

© GPG Group and Coats plc | Results presentation for year ended 31 December 2014 Page 32
1 in 5garments
around the
world is held
together using
Coats’ thread
In 2014 Coats
produced
enough flame
retardant
thread to sew
7million
fireman suits
Over
teabags using
Coats’ thread
are brewed
every week
Coats is the
and fastest
growing
global zip
manufacturer
2nd largestIn 1879 Thomas Edison
used Coats’
thread in his
experimentsto invent the
light bulb
Thousands of
operations
take place
every
dayusing Coats’
thread
Global market leader…
More than
car airbags are
made using
Coats’ thread
every year
More than
450million
pairs of
shoes are
made every
year using
Coats’ thread
Every
3 hoursCoats makes
enough thread
to go to the
moon and
back
100million
10billion

© GPG Group and Coats plc | Results presentation for year ended 31 December 2014 Page 33
… servicing several markets and global customers…
Customers include
Brands
include
Industrial
End use applications include
Crafts
End uses include

© GPG Group and Coats plc | Results presentation for year ended 31 December 2014 Page 34
Strong link between clothing retail sales and GDP growth. For the US, clothing retail sales
growth is approximately 1.7 times GDP growth
CRS: Clothing Retail Sales
Source: IMF, US Census Bureau
US GDP growth vs consumer retail
sales growth (2000-2014)
… and stable underlying trends
© GPG Group and Coats plc | Results presentation for year ended 31 December 2014 Page 35
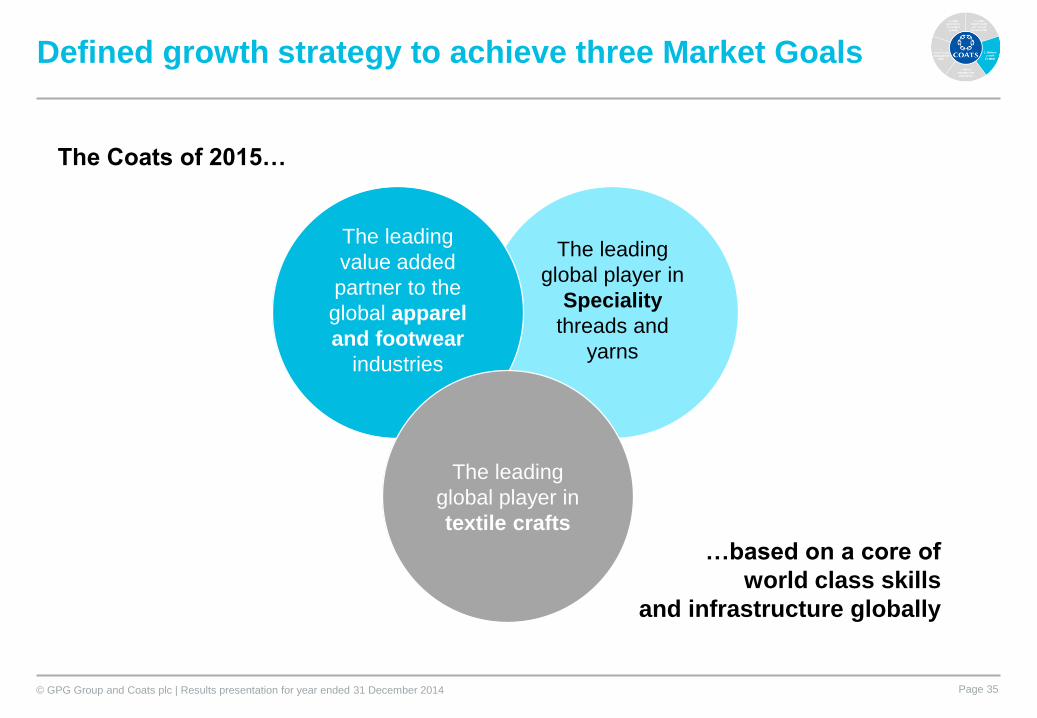
The Coats of 2015…
…based on a core of
world class skills
and infrastructure globally
The leading
global player in
Speciality
threads and
yarns
The leading
value added
partner to the
global apparel
and footwear
industries
The leading
global player in
textile crafts
Defined growth strategy to achieve three Market Goals

© GPG Group and Coats plc | Results presentation for year ended 31 December 2014 Page 36
Truly global footprint with more than 70 manufacturing facilities across the world
Countries in which
Coats operates
Manufacturing sites
• Well invested asset
base
• Restructured
manufacturing
footprint: reduced
number of plants in
higher cost Europe
and North America
Strategy supported by a global, world class asset base…
© GPG Group and Coats plc | Results presentation for year ended 31 December 2014 Page 37
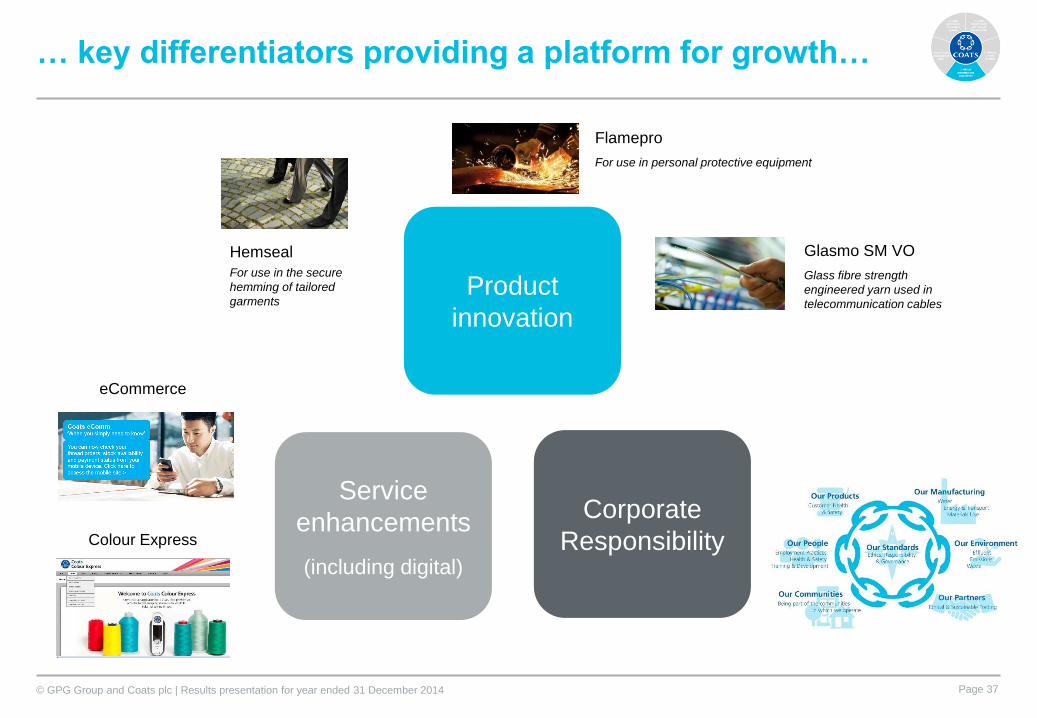
Glasmo SM VO
Glass fibre strength
engineered yarn used in
telecommunication cables
Hemseal
For use in the secure
hemming of tailored
garments
Flamepro
For use in personal protective equipment
Product
innovation
Service
enhancements
(including digital)
Corporate
Responsibility
eCommerce
Colour Express
… key differentiators providing a platform for growth…

© GPG Group and Coats plc | Results presentation for year ended 31 December 2014 Page 38
Global employee engagement survey results
66%
72%
77%
80%81%
2010 2011 2012 2013 2014
Industry norm
90th percentile
performance
Global recordable accident rate
Consistently better
than the OSHA average
… and a highly engaged and safe workforce

© GPG Group and Coats plc | Results presentation for year ended 31 December 2014 Page 39
17
37
45
2012 2013 2014
Attributable profit - $m(pre-exceptional)
65
54
70
2012 2013 2014
Adjusted free cash flow - $m
Leading to attributable profit growth and
significant free cash flow

© GPG Group and Coats plc | Results presentation for year ended 31 December 2014 Page 40
GPG overhead costs
Reduced overhead costs, excluding foreign exchange, by
56% to £18m
Company continued to focus on minimising costs at
Group level
FX gains partly driven by strengthening USD vs GBP
tPR
Costs incurred in 2014 covered by £8m provision made
at the end of 2013 for work in 2014
£8m 2014 charge is provision for committed costs of
GPG and Trustees of Brunel and Staveley schemes
Staff costs
Completed downsizing and outsourcing of support
services at mid year with closure of London office
Outlook
Excluding pension investigations costs, expect
annualised overheads of £3-4m for pensions related
expenses
With change in corporate structure expect ~£3m for other
costs1 (previously £3-4m)
Overheads (£m) H2 2014 2014 2013
Pension related
expenses1 (3) (4) (2)
Staff costs (0) (2) (13)
Other 2 (1) (4) (8)
Other Group expenses (1) (6) (21)
Sub total (4) (10) (23)
tPR advisory costs (8) (8) (18)
Foreign exchange 10 11 (2)
Total (2) (7) (43)
1) Includes ~$2m of one-off costs in 2014 (~$1m in H2 2014)
2) Other costs include GPG Board expenses and legal, audit and other professional fees

© GPG Group and Coats plc | Results presentation for year ended 31 December 2014 Page 41
Pensions overview
1) Assumes immediate increase across all points on yield curve and includes estimate for impact on value of corporate bonds in scheme assets
Real discount rate increases required to eliminate UK deficits at
31 Dec 20141: Coats: 160 bps, Brunel: 390 bps, Staveley: 250 bps
Triennial valuations
– Coats UK: £14m pa deficit reduction payments started Nov 2013
for ~14 years following trustee agreement. Next valuation due
with effect from 1 Apr (deficit one of several considerations)
– Brunel and Staveley: valuation ongoing, timing impacted by
tPR’s investigations but expected to complete in due course
Appointed new Group Pensions Director, John Lovell
Main driver for increase in IAS19 deficit since end of 2013 was
increase in liabilities; largely due to 115bps decrease in discount rate,
which more than offset 35bps decrease in inflation rate, adoption of
revised assumption setting methodologies and Coats Plan Trustee
adopting improved cash commutation factors for members
UK Pensions Regular (tPR) investigations
Overall: moving on with running Company – new Board and
Management will continue to actively engage with
investigations balancing interest of stakeholders
During investigations cannot return capital to shareholders
Coats UK Plan: Warning Notice (WN) received Dec 2014;
states tPR's view that sponsoring employers of Plan were
insufficiently resourced at relevant date and reasonable for
tPR’s Determinations Panel (DP) to issue a Financial Support
Direction (FSD); could result in further financial support for Plan
Having reviewed WN with advisers will continue to robustly
oppose tPR's view on insufficiency of resources
Will litigate matter as far as necessary unless it can be
resolved via negotiation
Brunel and Staveley: WN’s received Dec 2013; submitted
written representations at end of Sep 2014 within tPRs
deadline, however yet to receive responses
Timing and settlement discussions: in Coats WN, tPR
indicated it appropriate for DP to hear all 3 cases at same time
Therefore any hearing unlikely before H2 2016 at earliest
In early 2015 proposal put to tPR and trustees to settle across
3 schemes to resolve all investigations; proposal not accepted
IAS19 deficit (£m) 31 Dec 2014 31 Dec 2013
Coats UK 214 78
Coats other 49 44
Coats total 263 122
Brunel 54 28
Staveley 58 28
Total 375 178
© GPG Group and Coats plc | Results presentation for year ended 31 December 2014 Page 42
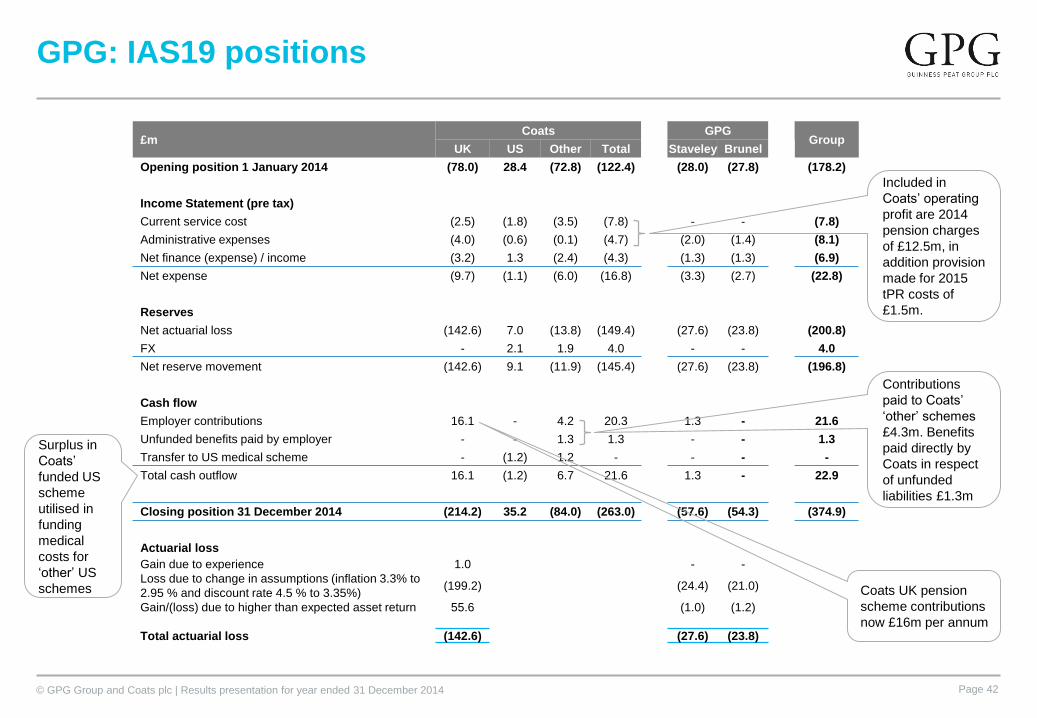
GPG: IAS19 positions
Surplus in
Coats’
funded US
scheme
utilised in
funding
medical
costs for
‘other’ US
schemes
£mCoats GPG
Group UK US Other Total Staveley Brunel
Opening position 1 January 2014 (78.0) 28.4 (72.8) (122.4) (28.0) (27.8) (178.2)
Income Statement (pre tax)
Current service cost (2.5) (1.8) (3.5) (7.8) - - (7.8)
Administrative expenses (4.0) (0.6) (0.1) (4.7) (2.0) (1.4) (8.1)
Net finance (expense) / income (3.2) 1.3 (2.4) (4.3) (1.3) (1.3) (6.9)
Net expense (9.7) (1.1) (6.0) (16.8) (3.3) (2.7) (22.8)
Reserves
Net actuarial loss (142.6) 7.0 (13.8) (149.4) (27.6) (23.8) (200.8)
FX - 2.1 1.9 4.0 - - 4.0
Net reserve movement (142.6) 9.1 (11.9) (145.4) (27.6) (23.8) (196.8)
Cash flow
Employer contributions 16.1 - 4.2 20.3 1.3 - 21.6
Unfunded benefits paid by employer - - 1.3 1.3 - - 1.3
Transfer to US medical scheme - (1.2) 1.2 - - - -
Total cash outflow 16.1 (1.2) 6.7 21.6 1.3 - 22.9
Closing position 31 December 2014 (214.2) 35.2 (84.0) (263.0) (57.6) (54.3) (374.9)
Actuarial loss
Gain due to experience 1.0 - -
Loss due to change in assumptions (inflation 3.3% to
2.95 % and discount rate 4.5 % to 3.35%)(199.2) (24.4) (21.0)
Gain/(loss) due to higher than expected asset return
Total actuarial loss
55.6 (1.0) (1.2)
(142.6) (27.6) (23.8)
Coats UK pension
scheme contributions
now £16m per annum
Included in
Coats’ operating
profit are 2014
pension charges
of £12.5m, in
addition provision
made for 2015
tPR costs of
£1.5m.
Contributions
paid to Coats’
‘other’ schemes
£4.3m. Benefits
paid directly by
Coats in respect
of unfunded
liabilities £1.3m

© GPG Group and Coats plc | Results presentation for year ended 31 December 2014 Page 43
Coats pension schemes: income statement and
cashflow impact
* Difference between $37m cash outflow and $19m charge to operating profit represents the non-cash movement in the cash flow bridge on slide 24
$mUK funded scheme US funded Scheme RoW Total
2014 2013 2014 2013 2014 2013 2014 2013
Service charge 4 4 3 4 6 4 13 12
Administrative expenses 5 6 1 1 - - 6 7
Pre-exceptional operating profit impact 9 10 4 5 6 4 19* 19
Exceptional past service credit - (7) - - - - - (7)
Exceptional administrative expenses 4 - - - - - 4 -
Operating profit impact 13 3 4 5 6 5 23 12
Finance charge / (income) 5 10 (2) (1) 4 4 7 12
Total income statement impact 18 13 2 4 10 9 30 25
UK recovery contributions 23 13 - - - - 23 13
UK Contributions for active members 3 3 - - - - 3 3
Cash payments to pensioners and other - - - - 11 10 11 10
Cash outflow 27 16 - - 11 10 37* 26

© GPG Group and Coats plc | Results presentation for year ended 31 December 2014 Page 44
Further information
GPG plc
www.gpgplc.com
For more
information
Coats plc
www.coats.com
Coats Industrial
www.coatsindustrial.com
Coats Crafts
www.makeitcoats.com
Jaideep Thatai
Head of Investor Relations
+44 20 8210 5086 / +44 7827 882 405