rethinking the future of plastics in the gcc · mckinsey & company 2 contents future for...
TRANSCRIPT
Rethinking the future of plastics in the GCCTheo Jan Simons
2McKinsey & Company
Contents
Future for plastics in the GCC
Enter the Circular Economy
I have word for you "Plastics"
3McKinsey & Company
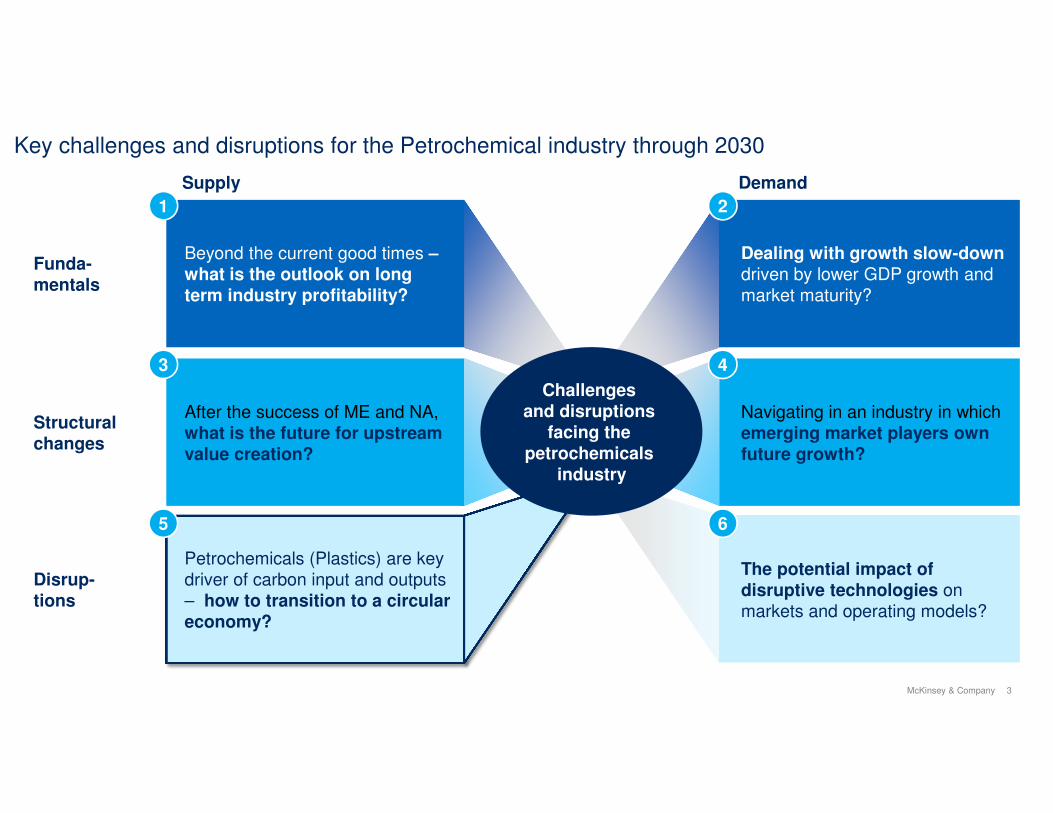
Key challenges and disruptions for the Petrochemical industry through 2030
1
Beyond the current good times –what is the outlook on long term industry profitability?
Petrochemicals (Plastics) are key
driver of carbon input and outputs
– how to transition to a circular economy?
The potential impact of disruptive technologies on
markets and operating models?
Navigating in an industry in which
emerging market players own future growth?
Dealing with growth slow-down driven by lower GDP growth and
market maturity?
After the success of ME and NA,
what is the future for upstream value creation?
Supply Demand
Challenges and disruptions
facing the petrochemicals
industry
1 2
3
5
4
6
Funda-mentals
Structuralchanges
Disrup-tions
4McKinsey & Company
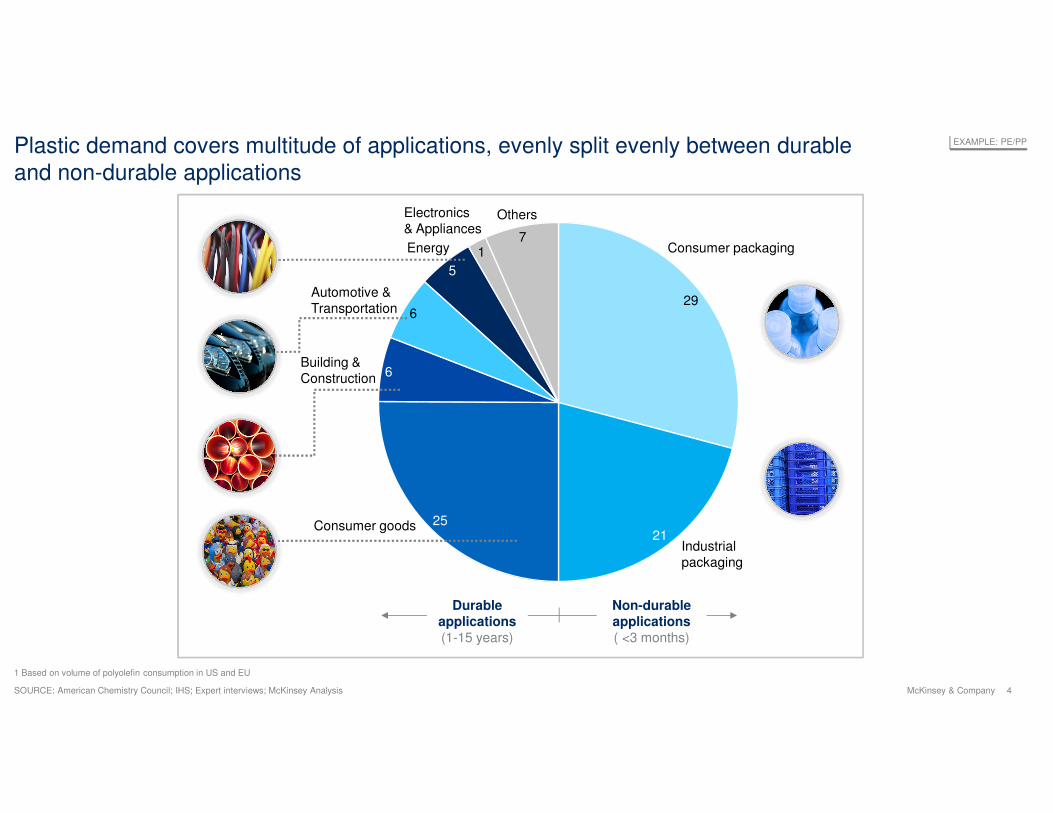
Plastic demand covers multitude of applications, evenly split evenly between durable
and non-durable applications
SOURCE: American Chemistry Council; IHS; Expert interviews; McKinsey Analysis
1 Based on volume of polyolefin consumption in US and EU
Consumer goods
Industrial
packaging
29
2521
Consumer packaging
Automotive &
Transportation
Electronics
& Appliances
Energy
5
Building &
Construction
Others
71
6
6
EXAMPLE: PE/PP
Durable applications (1-15 years)
Non-durable applications ( <3 months)
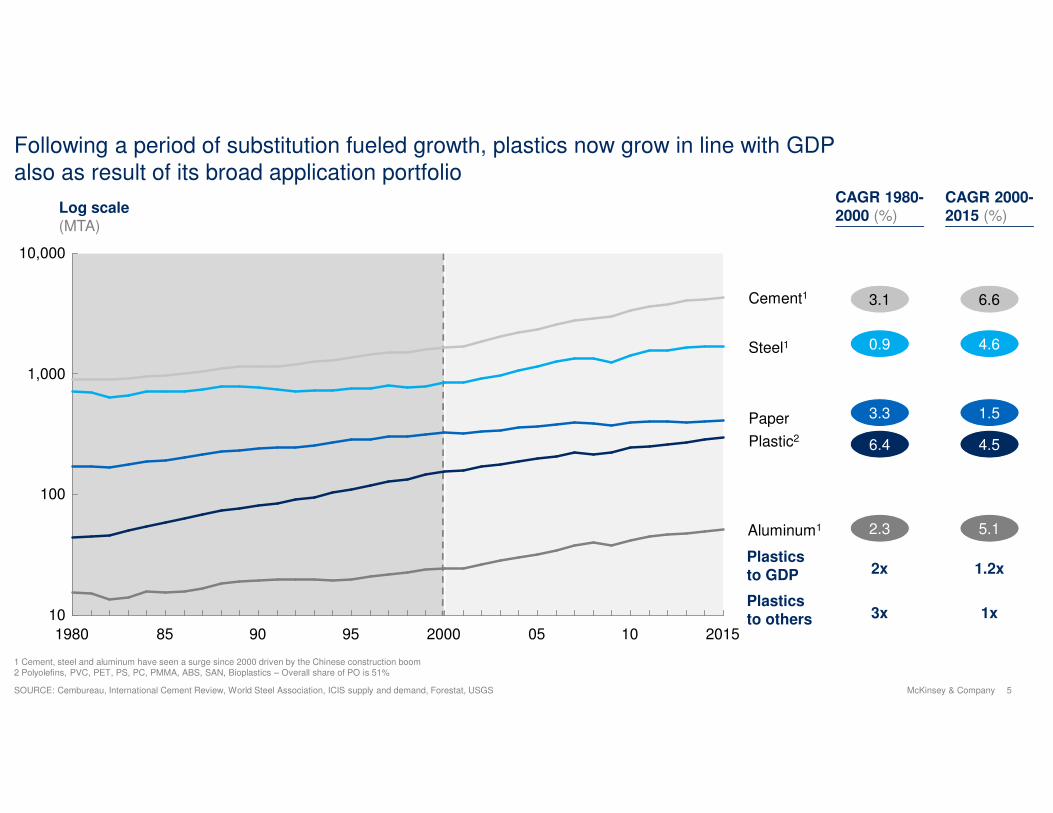
5McKinsey & CompanySOURCE: Cembureau, International Cement Review, World Steel Association, ICIS supply and demand, Forestat, USGS
10,000
1,000
100
10
Aluminum1
Cement1
Steel1
2015
Paper
Plastic2
1980 200095 109085 05
Log scale(MTA)
1 Cement, steel and aluminum have seen a surge since 2000 driven by the Chinese construction boom2 Polyolefins, PVC, PET, PS, PC, PMMA, ABS, SAN, Bioplastics – Overall share of PO is 51%
Following a period of substitution fueled growth, plastics now grow in line with GDP
also as result of its broad application portfolio
Plasticsto GDP
Plasticsto others
6.6
4.5
4.6
1.5
5.1
3.1
6.4
0.9
3.3
2.3
1.2x2x
1x3x
CAGR 1980-2000 (%)
CAGR 2000-2015 (%)
6McKinsey & Company
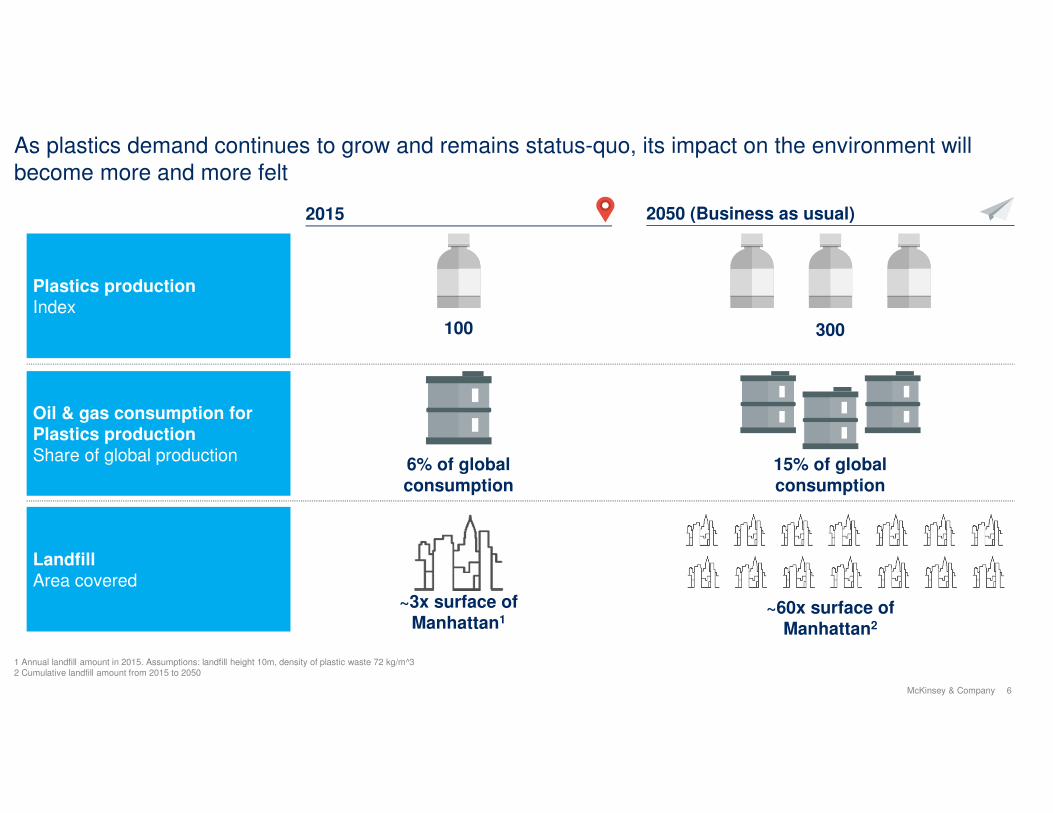
As plastics demand continues to grow and remains status-quo, its impact on the environment will
become more and more felt
1 Annual landfill amount in 2015. Assumptions: landfill height 10m, density of plastic waste 72 kg/m^32 Cumulative landfill amount from 2015 to 2050
Oil & gas consumption for Plastics productionShare of global production
6% of global consumption
15% of global consumption
LandfillArea covered
~3x surface of Manhattan1
~60x surface of Manhattan2
Plastics productionIndex
2050 (Business as usual)2015
100 300
7McKinsey & Company
Future for plastics in the GCC
Enter the Circular Economy
I have word for you "Plastics"
Contents
8McKinsey & Company
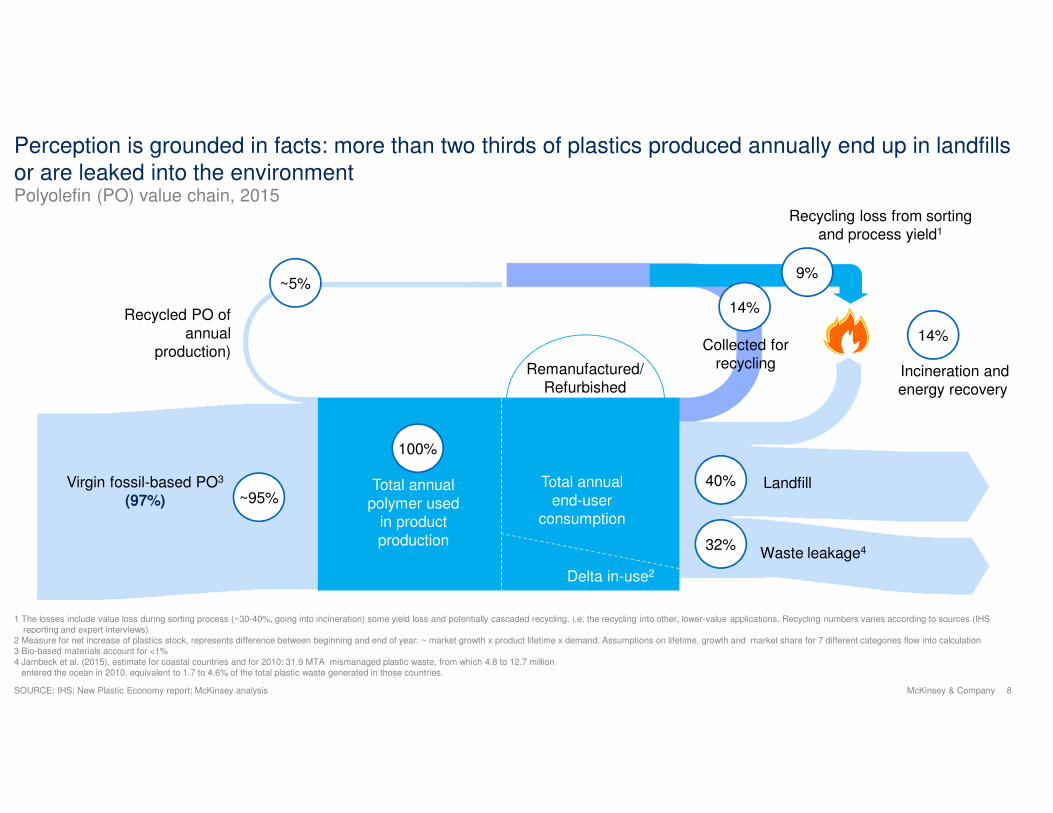
Perception is grounded in facts: more than two thirds of plastics produced annually end up in landfills
or are leaked into the environment
SOURCE: IHS; New Plastic Economy report; McKinsey analysis
1 The losses include value loss during sorting process (~30-40%, going into incineration) some yield loss and potentially cascaded recycling, i.e. the recycling into other, lower-value applications. Recycling numbers varies according to sources (IHS reporting and expert interviews)
2 Measure for net increase of plastics stock, represents difference between beginning and end of year: ~ market growth x product lifetime x demand. Assumptions on lifetime, growth and market share for 7 different categories flow into calculation3 Bio-based materials account for <1%
4 Jambeck et al. (2015), estimate for coastal countries and for 2010: 31.9 MTA mismanaged plastic waste, from which 4.8 to 12.7 millionentered the ocean in 2010, equivalent to 1.7 to 4.6% of the total plastic waste generated in those countries.
Polyolefin (PO) value chain, 2015
Remanufactured/Refurbished
Total annual
polymer used in product
production
Recycled PO of
annual production)
Recycling loss from sorting and process yield1
Collected for recycling
Landfill
Waste leakage4
Virgin fossil-based PO3
(97%)
Total annual
end-user consumption
Delta in-use2
14%
~5%
~95%
100%
40%
32%
14%
Incineration and energy recovery
9%
9McKinsey & Company
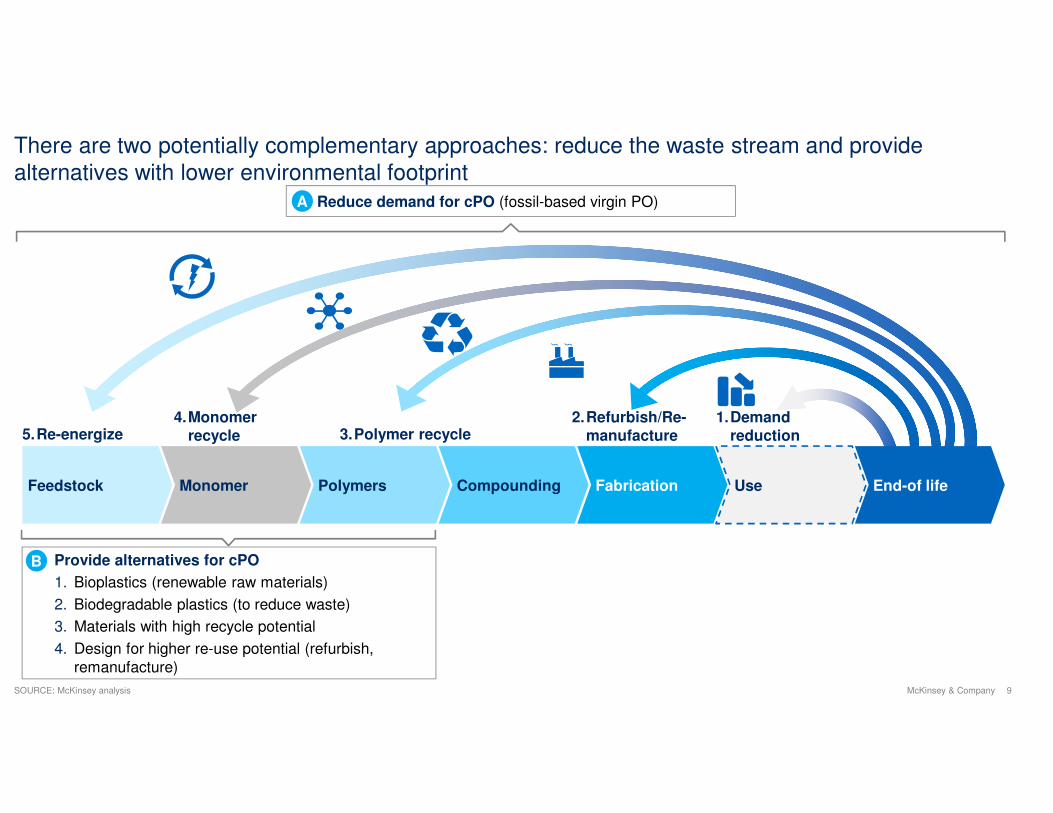
There are two potentially complementary approaches: reduce the waste stream and provide
alternatives with lower environmental footprint
SOURCE: McKinsey analysis
5.Re-energize4.Monomer
recycle1.Demand
reduction2.Refurbish/Re-
manufacture3.Polymer recycle
Provide alternatives for cPO
1. Bioplastics (renewable raw materials)
2. Biodegradable plastics (to reduce waste)
3. Materials with high recycle potential
4. Design for higher re-use potential (refurbish,
remanufacture)
B
Feedstock Monomer Polymers Compounding Fabrication Use End-of life
Reduce demand for cPO (fossil-based virgin PO)A
10McKinsey & Company
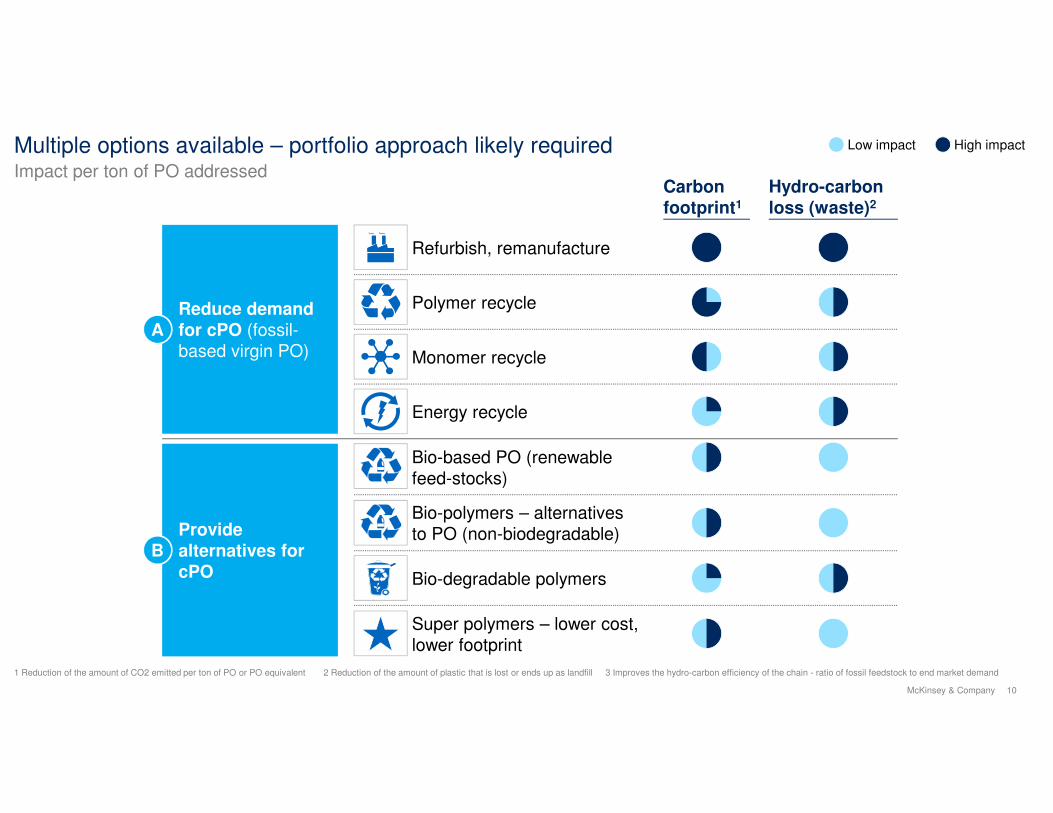
Multiple options available – portfolio approach likely required
1 Reduction of the amount of CO2 emitted per ton of PO or PO equivalent 2 Reduction of the amount of plastic that is lost or ends up as landfill 3 Improves the hydro-carbon efficiency of the chain - ratio of fossil feedstock to end market demand
Low impact High impact
Impact per ton of PO addressedHydro-carbon loss (waste)2
Refurbish, remanufacture
Polymer recycle
Monomer recycle
Energy recycle
Super polymers – lower cost,
lower footprint
Bio-degradable polymers
Bio-based PO (renewable
feed-stocks)
Bio-polymers – alternatives
to PO (non-biodegradable)
Carbonfootprint1
Reduce demand for cPO (fossil-
based virgin PO)
A
Provide alternatives for cPO
B
11McKinsey & Company
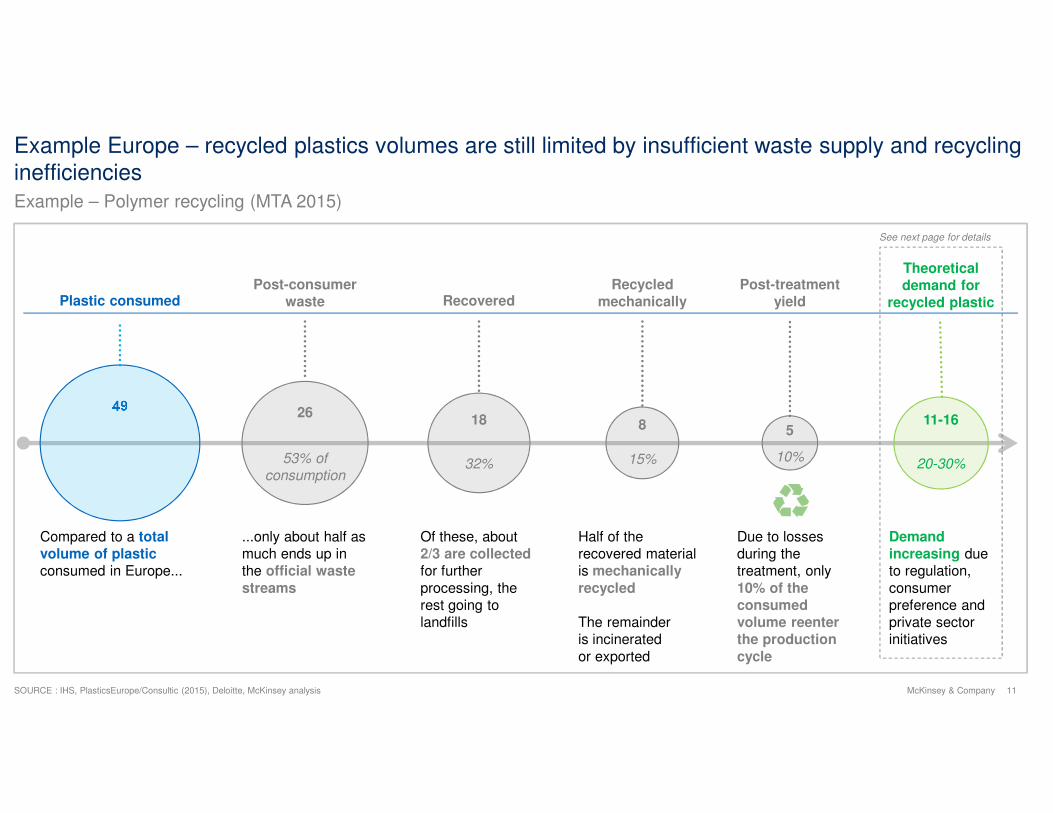
Example Europe – recycled plastics volumes are still limited by insufficient waste supply and recycling
inefficiencies
SOURCE : IHS, PlasticsEurope/Consultic (2015), Deloitte, McKinsey analysis
49
Plastic consumed
Compared to a total volume of plastic consumed in Europe...
Post-consumerwaste
26
...only about half as
much ends up in
the official waste
streams
53% of
consumption
Recovered
18
Of these, about
2/3 are collected for further
processing, the
rest going to
landfills
32%
Recycledmechanically
8
Half of the
recovered material
is mechanically
recycled
The remainder
is incinerated
or exported
15%
Post-treatment yield
5
Due to losses
during the
treatment, only
10% of the consumed volume reenter the production
cycle
10%
Theoreticaldemand for
recycled plastic
11-16
Demand increasing due
to regulation,
consumer
preference and
private sector
initiatives
20-30%
See next page for details
Example – Polymer recycling (MTA 2015)
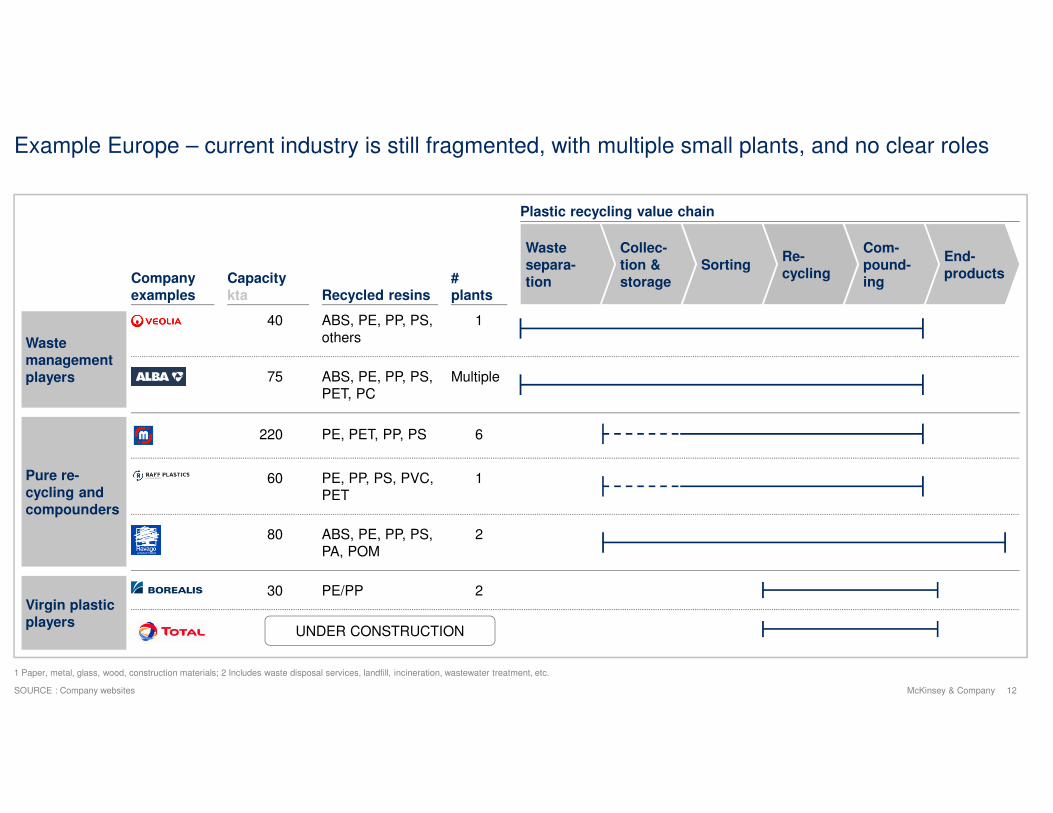
12McKinsey & CompanySOURCE : Company websites
1 Paper, metal, glass, wood, construction materials; 2 Includes waste disposal services, landfill, incineration, wastewater treatment, etc.
Example Europe – current industry is still fragmented, with multiple small plants, and no clear roles
Waste management players
Virgin plastic players
Pure re-cycling and compounders
Capacity kta
#plants
Collec-tion & storage
SortingRe-cycling
Com-pound-ing
Waste separa-tion
End-productsCompany
examples
Plastic recycling value chain
Recycled resins
40 1ABS, PE, PP, PS,
others
75 MultipleABS, PE, PP, PS,
PET, PC
60 1PE, PP, PS, PVC,
PET
220 6PE, PET, PP, PS
80 2ABS, PE, PP, PS,
PA, POM
30 PE/PP 2
UNDER CONSTRUCTION
13McKinsey & Company
Future for plastics in the GCC
Enter the Circular Economy
I have word for you "Plastics"
Contents
14McKinsey & Company
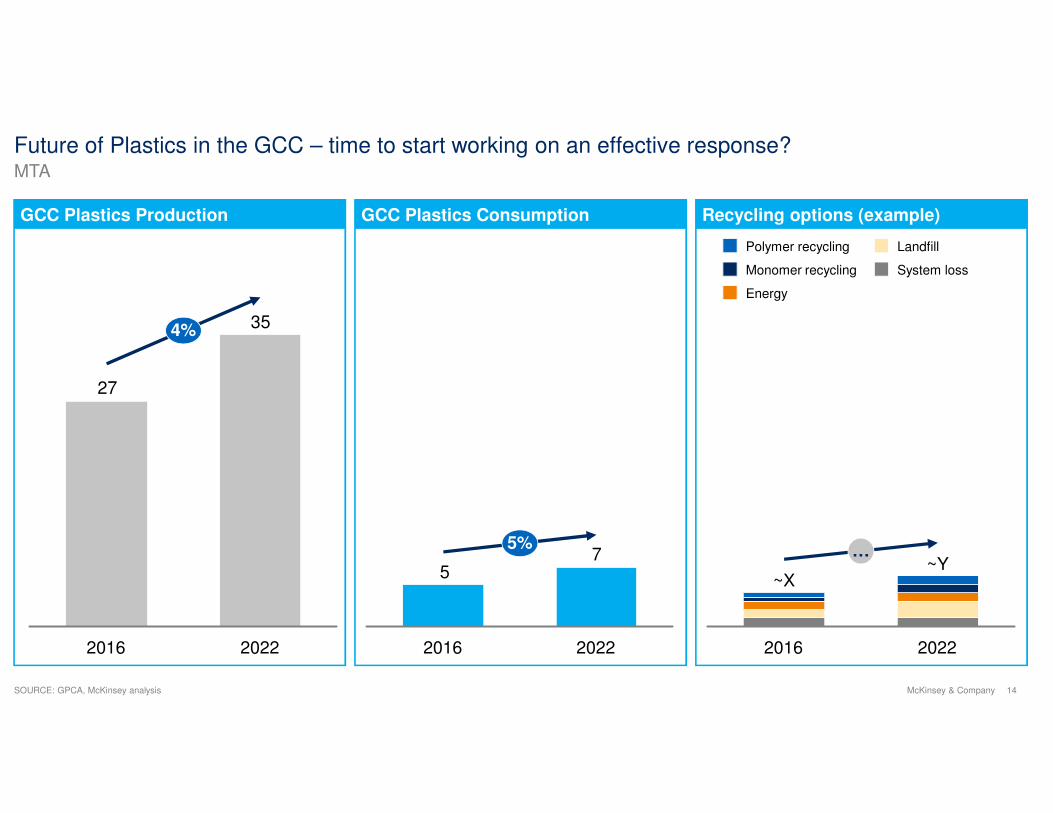
GCC Plastics Production GCC Plastics Consumption Recycling options (example)
Future of Plastics in the GCC – time to start working on an effective response?
SOURCE: GPCA, McKinsey analysis
MTA
35
27
2016 2022
4%
75
2016 2022
5%
2022
~X
…
2016
~Y
System loss
Landfill
Energy
Monomer recycling
Polymer recycling
15McKinsey & Company
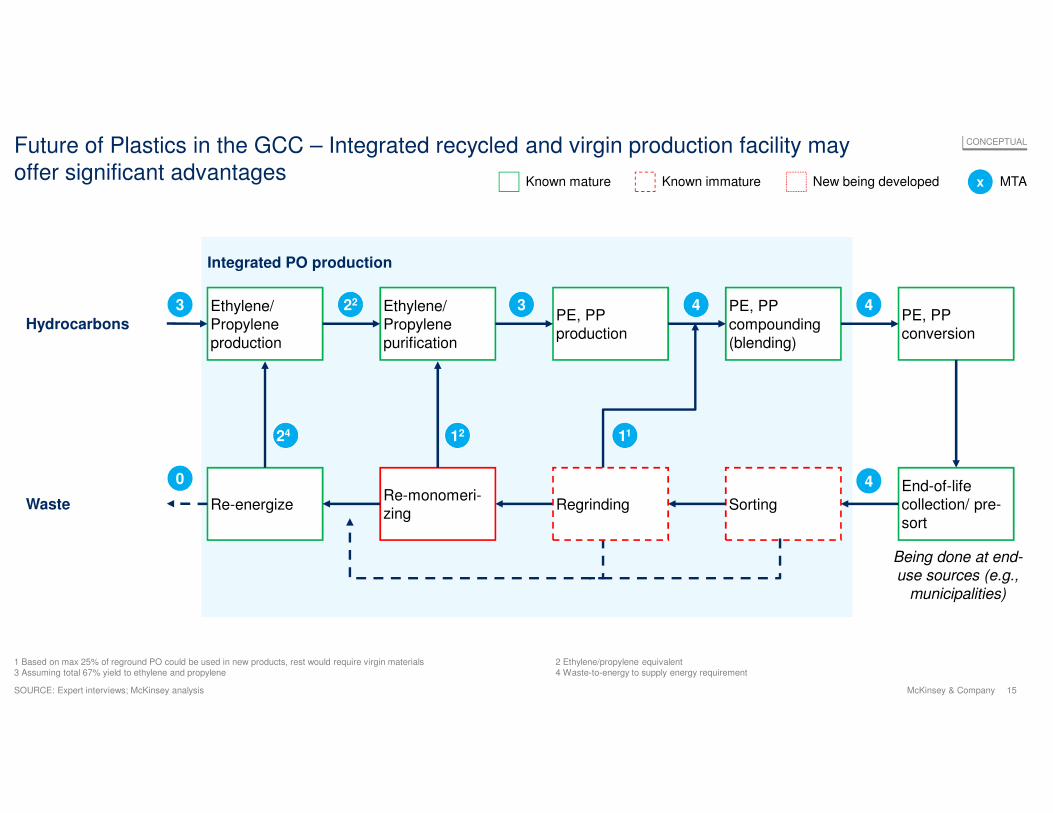
Future of Plastics in the GCC – Integrated recycled and virgin production facility may
offer significant advantages Known mature Known immature New being developed x MTA
1 Based on max 25% of reground PO could be used in new products, rest would require virgin materials 2 Ethylene/propylene equivalent3 Assuming total 67% yield to ethylene and propylene 4 Waste-to-energy to supply energy requirement
SOURCE: Expert interviews; McKinsey analysis
CONCEPTUAL
HydrocarbonsEthylene/ Propylene
production
Ethylene/ Propylene
purification
PE, PP production
PE, PP compounding
(blending)
PE, PPconversion
Waste Re-energizeRe-monomeri-zing
Sorting
End-of-life collection/ pre-
sort
3 22 4 4
40
24 12 11
3
Integrated PO production
Being done at end-use sources (e.g.,
municipalities)
Regrinding
16McKinsey & Company
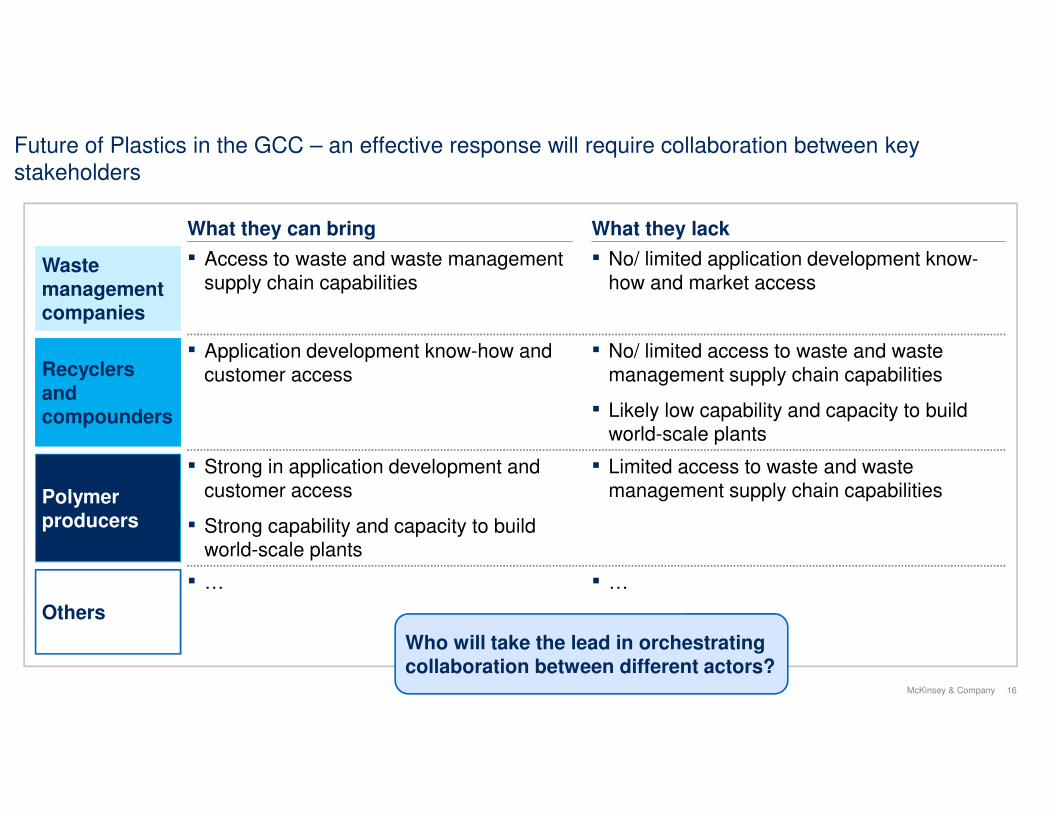
Future of Plastics in the GCC – an effective response will require collaboration between key
stakeholders
Others
What they can bring What they lack
Waste management companies
▪ Access to waste and waste management
supply chain capabilities
▪ No/ limited application development know-
how and market access
Recyclers and compounders
▪ Application development know-how and
customer access
▪ No/ limited access to waste and waste
management supply chain capabilities
▪ Likely low capability and capacity to build world-scale plants
Polymer producers
▪ Strong in application development and
customer access
▪ Strong capability and capacity to build world-scale plants
▪ Limited access to waste and waste
management supply chain capabilities
▪ … ▪ …
Who will take the lead in orchestrating collaboration between different actors?
Thank youwww.gpca.org.ae