reti complesse 2011/2012 social media analysis: from raw data to services
Post on 21-Dec-2015
215 views
TRANSCRIPT

Reti complesse 2011/2012
Speaker:Luca Maria AielloComputer Science department, TorinoArc2s group
Social media analysis:From raw data to services

WORKFLOW
Data collection
Static data analysis
Dynamics (homophily and
influence) Prediction
Soci
al m
edia
web
site
Serv
ices
Why social links are formed?To what extent are users influenced by each other?
Can we predict the evolution of the network?

WORKFLOW
Data collection
Static data analysis
Dynamics (homophily and
influence) Prediction
Soci
al m
edia
web
site
Serv
ices

ANOBII PAGE OVERVIEW

MODELING THE SOCIAL NETWORK
FriendshipNeighborhoodCommunication
Social
ID, gender, books,
groups, …

DATA COLLECTION
Crawlers
Scraper
Storage
Get
WebBFS or
“Snowball sampling”
Python standard libraries:urllib, urllib2, cookielib,threadingPyhton igraph to load the graph from file: g=igraph.read(networkfile)
010011010111010

WORKFLOW
Data collection
Static data analysis
Dynamics (homophily and
influence) Prediction
Soci
al m
edia
web
site
Serv
ices

g.diameter(), g.average_path_length(directed=True), g.components(mode=STRONG/WEAK), g.density(loops=FALSE), g.reciprocity(), …
BASIC STATISTICS
Friendship Neighborhood Social Communication
#Nodes 126,858 77,356 140,686 80,303
#Edges 557,258 633,635 1,187,650 574,281
#Loops 0 0 0 22,579
Reciprocation 0.60 0.43 0.54 0.61
⟨kout⟩ 4.4 8.2 8.4 7.2
GWCC size 121,143 76,760 140,686 75,965
GSCC size 81,292 41,063 100,492 38,336
Density 3.4 · 10-5 1.1 · 10-4 6.0 · 10-5 8.9 · 10-5
⟨SPL⟩ 7.3 4.7 5.3 4.8
Diameter 25 15 20 17
SO WHAT?
Take your time, look carefully and compare…

CLUSTERING AND FIRST VISUALIZATION
Visualization with Gephi 0.8 (plus some post-editing). Gephi can import several graph formats, including simple CSV
gephi.org

DISTRIBUTIONS
LEGENDg=groupsb=booksw=wishlistr=reviewss=ratingst=tagsa=annotations
Broadbehavior
Python igraph:g.degree_distribution()XMGrace, a very useful plotting tool:http://plasma-gate.weizmann.ac.il/Grace

CORRELATIONS
Are the different activities of a user correlated between each other?
Strong correlations emergeActivity1
Activ
ity2

MIXING PATTERNS
•General assortative behavior•Disassortative trend for some particular ranges and features
Is the activity of a user correlated with the activity of her neighbors?

TOPICAL OVERLAP
Does similarity between user profiles depend on the social distance?
vnun
bbvu
bb
b vub
,
• Statistical correlation because of assortative biases?• Null model to discern real overlap from purely statistical effects• No topical overlap other than that caused by statistical mixing patters

TOPICAL OVERLAP
d
Do “interaction” ties imply higher similarity?
(Slightly) Stronger similarity in interaction network

GEOGRAPHIC OVERLAP
What about local overlap of the “geographic” features?
Null model test with random link rewire
g.rewire()

• Two-core network (language barriers)• Friendship & neighborhood used slightly
differently• High reciprocation• Broad activity behavior • Assortative mixing patterns• Correlations between different activities• People residing closer in the network are more
similar, on average• Communication determines stronger ties
SUMMARY OF FINDINGS

WORKFLOW
Data collection
Static data analysis
Dynamics (homophily and
influence) Prediction
Soci
al m
edia
web
site
Serv
ices

DYADIC CENSUS AND TRIANGLE CLOSURE
Direct 75%
Reciprocated 20%
Bidirectional 25%
Closure 30% Double closure 10%
New edges can be classified as:
Python iGraph:g=Graph.Erdos Renyi(100, 0.2, directed=True)dc=g.dyad_census()tc=g.triad_census()

DYNAMICS TO EXPLORE CAUSES
Explore the causality relationship between profile similarity and link creation using the time dimension
Topical overlap might be caused by:
1. Homophily 2. Influence 3. Both
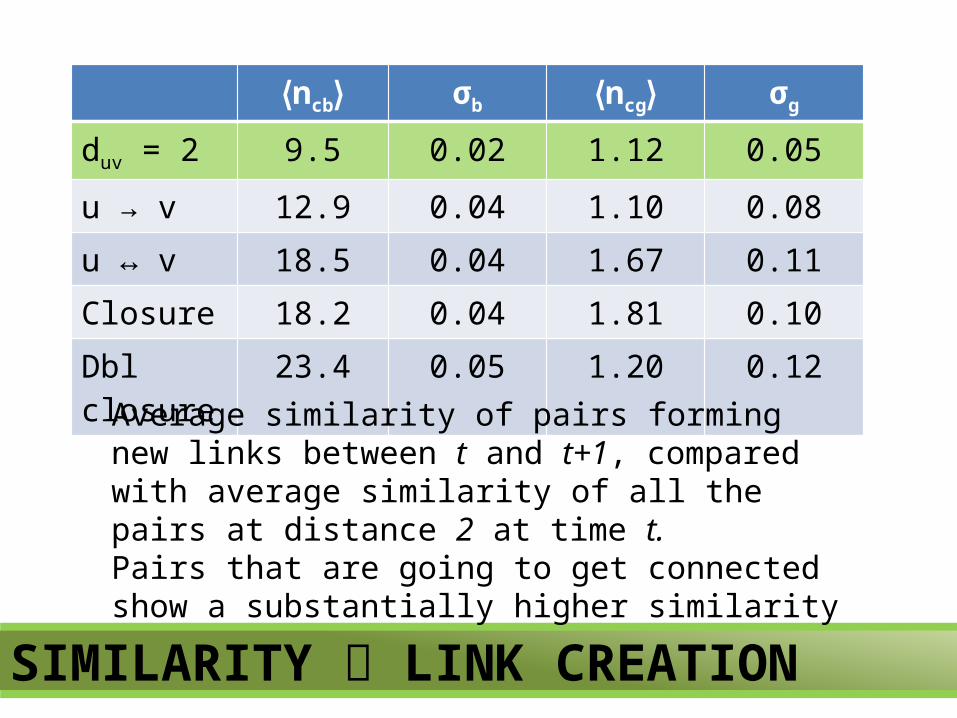
SIMILARITY LINK CREATION
⟨ncb⟩ σb ⟨ncg⟩ σg
duv = 2 9.5 0.02 1.12 0.05
u → v 12.9 0.04 1.10 0.08
u ↔ v 18.5 0.04 1.67 0.11Closure 18.2 0.04 1.81 0.10Dbl closure 23.4 0.05 1.20 0.12
Average similarity of pairs forming new links between t and t+1, compared with average similarity of all the pairs at distance 2 at time t.Pairs that are going to get connected show a substantially higher similarity

LINK CREATION SIMILARITY
Groups
Books
Evolution of the similarity between pairs linking together at different times

INFLUENCE AS “BOOK CONTAGION”
Susceptible
Infected
Social tie
TIME = 0
A
B
C
Kb(A)=2, Fb(A)=1Kb(B)=0, Fb(B)=0Kb(C)=3, Fb(C)=0.75
TIME = 1

ADOPTERS vs NON-ADOPTERS
Adopters are more likely to have a higher number/fraction of neighbors with the book
At fixed out-degree, adopters have on average much more neighbors with the
book than non-adopters

INFLUENCE IS STRONGER WHEN INTERACTING
Pa = #adopters with Kb / #users with Kb

• Link creation is driven by– Balance (triangle closure)– Reciprocation – Homophily– Proximity
• Link creation triggers a boost in similarity• Influence spreads along social ties
SUMMARY OF FINDINGS

WORKFLOW
Data collection
Static data analysis
Dynamics (homophily and
influence) Prediction
Soci
al m
edia
web
site
Serv
ices

FRIENDSHIP RECOMMENDATION SERVICE
Predicting the creation of new links and anticipate the action of the users can be used for contact recommendation
1. Focus on a user u2. Compute some similarity between u
and all* the other users3. Rank the users according to their
similarity4. Recommend the top N
* Computational constraints apply…

FRIENDSHIP RECOMMENDATION
Pre
cisi
on a
t N
• Many features can be used (common neighbors, reciprocity, similarity of profile features, etc.)
• Features can be profitably combined with classifiers (http://www.cs.waikato.ac.nz/ml/weka)

NOTE ON METHODOLOGY
• Compare your results with other real networks or ad-hoc null models
• Quantitative and qualitative analysis• Keep in mind that correlation != causation• Plots help lots!

REFERENCES
L. M. Aiello, A. Barrat, R. Schifanella, C. Cattuto, B. Markines, F. MenczerFriendship prediction and homophily in social mediaACM Transaction on the Web (TWEB). To appear
www.di.unito.it/~aiello
L. M. Aiello, A. Barrat, C. Cattuto, G. Ruffo, R. Schifanella "Link creation and profile alignment in the aNobii social network."In SocialCom’10: Proceedings of the 2nd IEEE International Conference on Social Computing, Minneapolis, MN, USA, 2010
Ask for more references! [email protected]
