retrospective data collection in europe - mea - munich center
TRANSCRIPT
INTERVIEWER EFFECTS ON NONRESPONSE IN THE EUROPEAN SOCIAL SURVEY
Annelies G. Blom, Edith D. de Leeuw,
Joop J. Hox
202-2010

Interviewer Effects on Nonresponse
in the European Social Survey
Annelies G. Blom1, Edith D. de Leeuw and Joop J. Hox2
Abstract
In face-to-face surveys interviewers play a crucial role in making contact with and gaining cooperation from sample units. While some analyses investigate the influence of interviewers on nonresponse, they are typically restricted to single-country studies. However, interviewer training, contacting and cooperation strategies as well as survey climates may differ across countries. Combining call-record data from the European Social Survey (ESS) with data from a detailed interviewer questionnaire on attitudes and doorstep behavior we find systematic country differences in nonresponse processes, which can in part be explained by differences in interviewer characteristics, such as contacting strategies and avowed doorstep behavior.
Keywords: Contact, cooperation, interviewer attitudes, doorstep behavior, interviewer questionnaire, paradata, contact data, cross-cultural research, international surveys.
JEL codes: C81, C83
Acknowledgements Authors are listed in alphabetical order. The authors would like to thank Heikki Ervasti (Finland), Lilli Japec (Sweden), Dominique Joye (Switzerland), Geert Loosveldt (Belgium), Peer Scheepers and Frans Louwen (the Netherlands), Katarina Thomson and Peter Lynn (UK), Pawel Sztabinski (Poland), and Jorge Vala (Portugal) for their enthusiastic support in translating and implementing the interviewer questionnaire in their countries.
1 Corresponding author: Mannheim Research Institute for the Economics of Aging (MEA), Mannheim University, 68131 Mannheim, Germany. Email: [email protected] 2 Department of Methodology and Statistics, Utrecht University, Post Box 80.140, 3508 TC Utrecht, Netherlands. Email: [email protected], [email protected]

1 Introduction Nonresponse in surveys is a serious concern of surveys researchers all over the world, and
there is considerable evidence that survey nonresponse has been increasing over time due to
an increase in both noncontact and refusal rates (De Leeuw and De Heer, 2002; Couper and
De Leeuw, 2003). All sectors of the survey industry – academic, government, business, and
media – are suffering from falling response rates (Brehm, 1994); also, all modes of data
collection show this trend (Goyder, 1987; Hox and De Leeuw, 1994). In the past two decades,
researchers have developed theoretical frameworks for the nonresponse process (Dillman,
1978; Dillman, Smyth and Christian, 2009; Goyder, 1987; Groves, Cialdini, and Couper,
1992; Groves and Couper, 1998; Hox, De Leeuw, and Vorst, 1996), and practical
implementations based on these theories have been described (e.g., Campanelli, Sturgis, and
Purdon, 1997; Stoop, 2005, see also the JOS special issue on survey nonresponse, 1999).
Several design features have been proven to be effective in reducing nonresponse for
all types of surveys and modes, and across different countries. Meta analyses, giving a
statistical summary and synthesis of empirical research, provide evidence that both the use of
pre-notification (advance) letters (De Leeuw, Callegaro, Hox, Korendijk, Lensvelt-Mulders,
2007) and the use of incentives (Singer, 2002; Singer, Van Hoewyk, Gebler, Raghunathan, and
McGonagle, 1999; Cantor, O’Hare, and O’Connor 2008) raise response rates, although the
effect sizes are modest.
Groves and Couper (1998, p.30) point out that many factors influencing survey
response, such as the social environment, are out of the researcher’s control, while others,
such as the survey design can be influenced by the researcher. In face-to-face surveys, the
interviewer is the researcher’s representative, and through selection, training, and supervision,
the researcher may influence the interviewer’s work. While the main role of interviewers is
conducting high quality interviews, they also play a key role in contacting and convincing
sample units. As a consequence, research into the role of interviewers in the nonresponse
process is growing, and attention has been paid to interviewer attributes, such as experience
(Durban and Stuart, 1951; Couper and Groves, 1992; Singer, Frankel, and Glassman, 1983;
Snijkers, Hox, and De Leeuw, 1999), and interviewer skills (Campanelli, et al, 1997; Morton-
Williams, 1993), interviewer-respondent interaction (Groves and Couper, 1998), as well as
survey design characteristics, such as interviewer burden (Japec, 2008) and interviewer
payment (De Heer, 1999; Durrant, Groves, Staetsky, and Steele, 2010).
1
To explain differential response rates between interviewers and why more experienced
interviewers achieve higher response rates, survey methodologists have examined interviewer
attitudes and motivation (Campanelli, et al, 1997; Groves and Couper, 1998; Hox and De
Leeuw, 2002; Durrant et al, 2010). This strand of research was inspired by the work of
Lehtonen (1996), who developed a short interviewer attitudes scale and showed that attitudes
correlate with attained response rate. A second line of studies focuses on interviewer behavior
and interviewer-respondent interaction (Campanelli et al, 1997; Couper and Groves, 1992;
Groves and Couper, 1998; Snijkers et al, 1999). This started with the pioneering work of
Morton-Williams (1993), who analyzed tape recordings of survey introductions and identified
successful interviewer strategies, such as, using professional and social skills, and adapting
these to the doorstep situation.
Previous research has shown that the magnitude and composition of nonresponse
differ across countries (De Leeuw and De Heer, 2002; Couper and De Leeuw, 2003; Billiet,
Phillipsen, Fitzgerald, and Stoop, 2007; Symons, Matsuo, Beullens, and Billiet, 2008), and
that there are cross-country differences in contact and cooperation processes (Blom 2009;
Kreuter and Kohler 2009). Precious research has also shown, that interviewers’ experience,
motivation, attitudes, and behavior are related to interviewers’ response rates within a single
country (Campanelli et al, 1997; Couper and Groves, 1992; Groves and Couper, 1998;
Pickery and Loosveldt, 2002; Snijkers et al, 1999; Durrant et al, 2010), and that interviewers’
attitudes and behavior differ between countries (Hox and De Leeuw, et al, 2002). However,
cross-national analyses of the influence of interviewers on contact and cooperation are far to
be sought, although a first attempt was made by Hox et al, (2002). This is not surprising, as
survey methodologist have only recently started collecting and analyzing standardized
paradata on (non)response processes in cross-national surveys (see Blom, Jäckle, and Lynn,
2010, for a review).
We were able to draw on the cross-national contact data of the first round of the
European Social Survey (ESS) conducted in 2002/03, linked to interviewer data from a
specially designed international interviewer questionnaire (see appendix A in the annex). This
provides us with a unique data set to examine how interviewer attributes affect contact and
cooperation rate in a large standardized cross national survey, and if interviewer attributes can
partly explain the difference in response between countries in the ESS.
2

2 Design and Data Collection The European Social Survey (ESS) is an academic cross-national survey of social and
political attitudes and behavior in Europe. It follows high methodological standards, such as
strict probability sampling, careful comparative questionnaire design and translation
procedures, in-person interviewer training and cross-national fieldwork monitoring (for more
information see www.europeansocialsurvey.org). Data collection takes place through face-to-
face interviews, and in each country interviewers are carefully selected and trained for this
survey. Maximizing response in each country is a focal point of ESS survey implementation
(see Koch, Blom, Stoop, and Kappelhof, 2009); nevertheless, countries differ in the
magnitude and composition of their nonresponse (Symons et al., 2008). To monitor
nonresponse processes in each ESS country, the survey implements standardized contact
forms and conducts analyses to foster round-to-round improvement. This makes the ESS an
excellent data source to investigate nonresponse differences across countries and interviewers'
influence thereupon.
2.1 ESS Contact Forms
The ESS interviewers use standardized contact forms to collect call-level information on the
contacting and cooperation processes, as well as on the neighborhood of each sample unit.
The call-record data are measurements of key aspects of the process that leads to a fieldwork
outcome. They provide information on all sample units, (i.e., respondents and non-
respondents) and on all contact attempts. Information collected includes the date, time, mode
(phone, mail or in-person), interviewer and outcome (no contact, interview, refusal, unable,
ineligible, appointment, etc) of each contact attempt. The data are used to monitor and
optimize different stages of the data collection process. In addition to contact data, the ESS
collects information on the housing and neighborhood of the sample unit, such as the state of
the neighborhood, the presence of an intercom and security features at the house (Blom,
Jäckle, and Lynn, 2010). From these data we derived indicators of contact and cooperation at
the level of the sample unit and interviewer.
3

2.2 International Interviewer Questionnaire
Prior to the first round of the ESS, a standardized international interviewer questionnaire was
developed, based on earlier work by Hox and De Leeuw, et al. (2002). The core questionnaire
consisted of attitude questions on persuasion strategies based on Lehtonen (1996), and
questions on avowed doorstep behavior based on Campanelli et al. (1997), Groves, Cialdini,
and Couper (1992), and Morton-Williams (1993). Drawing on new theoretical and empirical
findings, several questions were added to this core questionnaire. These include questions on
verbally dealing with reluctance (Pondman, 1998) and on reported successful interviewer
strategies (Snijkers, Hox, de Leeuw, 1999). In addition, interviewer background
characteristics (age, experience, and education) were collected. An English master
questionnaire was made available to all countries participating in the first round of the ESS in
2002. For a detailed description of the interviewer questionnaire, including question texts and
psychometric properties, can be found in the annex.
Before the start of the ESS data collection all country coordinators were approached
by email and asked if they were willing and able to let their interviewers fill out an
interviewer questionnaire. This activity was entirely voluntary and eight countries
participated. The coordinators of these countries provided for a careful translation of the
master questionnaire and the subsequent data collection. Table 1 lists the participating
countries, the number of interviewers in each country, their age, sex, and average years of
experience.
Table 1. Interviewers by country: number, mean age, % male, and mean years of experience
Country Frequency Percent Mean Age % Male Mean Experience Netherlands 60 6.8 52 .40 10.4 Belgium 82 9.3 48 .41 6.8 Switzerland 46 5.2 34 .50 1.8 United Kingdom 149 16.9 56 .49 6.5 Sweden 177 20.1 - - 7.9 Poland 175 19.9 40 .40 4.9 Portugal 58 6.6 38 .29 6.4 Finland 133 15.1 52 .96 12.7 Total 880 100.0 47 .52 7.4
Due to privacy regulations, age and gender of the Swedish interviewers were not recorded.
Due to the same privacy regulations, the ESS interviewer identification for the Swedish
interviewers was not provided and the data of the Swedish interviewers could not be linked to
the ESS contact form data. For all other countries the interviewer questionnaire data could be
4

successfully linked to the contact form data. In Switzerland half of the sample was included in
an experiment, where all contacting was conducted via the telephone in a call centre. Since
this made the experimental part of the Swiss sample incomparable to the other ESS countries,
where initial contact is usually attempted in person, we only examine the non-experimental
(face-to-face) part of the Swiss sample. Our analysis thus included seven countries: the
Netherlands, Belgium, Switzerland (non-experimental sample), the United Kingdom, Poland,
Portugal, and Finland.
3 Analysis Method The dependent variables in our study are (1) contact (i.e., whether in-person contact with the
household was made or not), and (2) cooperation (i.e., whether the sample unit was
interviewed or not, after contact was made). Therefore two separate data files were created:
one to investigate the interviewers’ influence on contact, the second to investigate the
interviewers’ influence on cooperation. For the contact analyses, the sample units in the
contact form data were linked to the interviewer questionnaire data of the interviewer who
undertook the last contact attempt at these sample units. This resulted in a contact data set
with questionnaire data on 662 interviewers and contact form data for 15700 sample units, of
whom 14292 were contacted. For the cooperation analyses, the sample units in the contact
form data were linked to the interviewer questionnaire data of the last interviewer that tried to
convince the sample unit to participate in the interview; given contact was established. This
resulted in a cooperation data set with data on 660 interviewers and contact form information
for 13717 contacted sample units, of whom 10044 cooperated.
We performed separate analyses for contact and for cooperation. A three-level logistic
regression model was used with sample units nested within interviewers nested within
countries. Multi-level analysis is now standard good practice for the analysis of interviewer
effects on nonresponse (e.g., Hox, de Leeuw, and Kreft, 1991; Hox, 1994; O’Muircheartaigh
and Campanelli, 1999; Pickery and Loosveldt 2004). The models were estimated using
Supermix (Hedeker, Gibbons, duToit, and Cheng, 2008), which has the advantage of using
full numerical integration for the estimation procedure. Numerical integration is generally
more accurate than the Taylor series expansion used in other software packages, especially
when estimating the variance components (see Hox, 2010). This approach enables us to
answer the following research questions:
5

(1) Are there systematic differences between countries and between interviewers?
(2) Can these differences be explained by observable characteristics of sample units and
interviewer (contact) strategies?, and
(3) Can these be explained by differences in interviewer characteristics?
In the subsequent sections we describe the available variables on sample-unit level and
on interviewer-level, and discuss their relevance for contact and cooperation.
3.1 Sample-Unit Level Variables
All sample-unit level variables are derived from the ESS contact forms and consist of both
call record data and information on housing and neighborhood. The outcome variables were
derived from the contact forms. These are contact (i.e., was in person contact made or not)
and cooperation (i.e., did the sample unit cooperate or not, after contact was made). Two
groups of sample-unit-level predictor variables can be discerned: those describing the
interviewer’s contacting and cooperation strategy for the specific sample unit, and those based
on the interviewer’s observations of the sample unit’s environment.
The first group of variables describes the contacting and cooperation strategies
employed at a sample unit to achieve an interview. These include whether initial contact was
made by telephone, whether contact attempts were made outside office hours (i.e., after 5pm
on weekdays or at the weekend), and whether initial contact was achieved outside office
hours. Stoop (2005, p. 95) reviews the empirical evidence on the influence of telephone pre-
contact on response in face-to-face surveys and concludes that there is not much evidence
regarding the advantages and disadvantages of using the telephone before making home calls
to obtain an interview. Lipps and Benson (2005) argue that for certain respondents at certain
time points (e.g., for the elderly later in the evening) a telephone contact may be better, and
they indeed find some evidence for a curvilinear relationship with response. Timing of contact
attempts is generally seen as a major determinant of successful contact, and earlier studies of
call-record data for face-to-face interviews provide evidence that contact rates in the evenings
and on weekends are higher than during office hours (e.g., Purdon, Campanelli, and Sturgis,
1999; Stoop, 2005, p. 160). Finally, Lipps and Benson found a relationship between contact
outside office hours and cooperation; initial contacts on Saturday afternoon were most likely
to lead to a completed interview. Purdon et al (1999) and Stoop (2005, p.162) however, did
not find a clear relationship between time of first contact and willingness to cooperate.
6

The second group of variables describes the housing and neighborhood situation of the
sample unit, based on detailed interviewer observations. These include whether or not the
house had an intercom, whether there were any security features at the house, the type of
building (single-unit building or not), the state of buildings in the immediate neighborhood,
and the state of the sampled house compared to other houses in the neighborhood. Physical
impediments, such as an intercom or security features, may obstruct contact with the sample
unit (Groves and Couper, 1998, p.88); an intercom system also hampers face-to-face
interviewers to tailor and use their full battery of strategies to convince sample units (Stoop,
2005, p. 55). The type and state of housing are part of the socio-economic environment of
sample units (Groves and Couper, 1998; p. 30) and have been associated with cooperation,
with those in well-maintained dwellings and neighborhoods, and in single houses being less
likely to refuse (Stoop, 2005, p.208). Groves and Couper (1998, p. 140) also find significantly
higher nonresponse rates for multi-unit housing structures, for both non-contact and refusal,
and attribute this to social isolation.
3.2 Interviewer Level Variables
The available interviewer-level variables can be classified in five groups. The first are
interviewer background variables collected in the interviewer questionnaire: age, sex,
education, and experience. Based on the literature (Durbin and Stuart, 1951; Groves and Fulz,
1985; Couper and Groves, 1992; De Leeuw and Hox, 1996; Pickery and Loosveldt, 2002;
Singer et al, 1983) we expect experienced interviewers to perform better in achieving contact
and gaining cooperation with sample units, because they have acquired more professional,
cultural, and local knowledge relevant in this process (Groves and Couper, 1998: pp 201-205).
The second group of variables concerns work related variables. These are the ESS
workload, the urbanicity of region worked in, and the interviewer’s individual ESS contact
and cooperation rate, all derived from the contact form data. The workload of interviewers is
generally seen as a negative influence on performance (see Japec, 2008), and Bottman and
Thornberry (1992) argue that increased workload give interviewers less time to attempt
contact during the most productive times. Urbanicity is a strong correlate of nonresponse,
both for contact and for cooperation (Groves, 1989, pp 233-234; Campanelli et al, 1998;
Groves and Couper, chapters 4 and 5). Based on the findings of O'Muircheartaigh and
Campanelli (1999) who found that interviewers who are good at gaining cooperation are also
7

good at making contact, we added the interviewer’s ESS cooperation rate as predictor in the
model for contact, and the interviewer’s ESS contact rate as predictor in the model for
cooperation.
The third group of interviewer-level variables refers to contacting and cooperation
strategies. These are the percentage of cases ever attempted by phone (based on the contact
form data), and reported interviewer behavior regarding asking neighbors for information
when a sample unit could not be contacted and regarding leaving a message (e.g., a calling
card) when nobody was at home at the sampled address (both based on the interviewer
questionnaire). In a study of cross-national contact strategies from the Survey of Health,
Ageing, and Retirement (SHARE), Lipps and Benson (2005) found that although generally in-
person contact attempts were positively related to successful contact, whether an initial in-
person or telephone attempts were more successful depended on the situation; well-
performing interviewers were able to apply the most appropriate mode of initial contact.
Morton-Williams (1993) and Groves and Couper (1998) both emphasize that good
interviewers gather information about the sampled household to guide further calls leading to
successful contact. Social exchange theory (see Dillman, 1978) suggests that leaving a calling
card when nobody is at home enhances cooperation and conveys the sincerity of the survey
purpose.
The fourth group contains measures of interviewer attitudes regarding persuading
reluctant respondents, the voluntary nature of surveys, the importance of the interviewer’s
image, and the importance of tailoring interviewer approaches. These indices are based on
questions from the interviewer questionnaire and are described in detail in the annex of this
paper. A positive attitude towards persuasion indicates that an interviewer is persuasion-
oriented and is convinced that most people are willing to respond, and can and should be
persuaded when approached at the right time. Voluntariness indicates that interviewers have a
high respect for sample units’ privacy and believe in the voluntary nature of survey
cooperation. These interviewer attitudes have been first described by Lehtonen (1996).
Previous research (e.g., Lehtonen, 1996; De Leeuw, Hox, Snijkers, and De Heer, 1998; Hox
and De Leeuw et al , 2002) showed that persuasion is positively related to cooperation, while
voluntariness is negatively related to cooperation. Interviewer image, which is also positively
related to cooperation (Snijkers et al, 1999), describes the interviewer’s belief in the
importance of projecting a positive and professional image and refers to social skills and self-
presentation necessary for successful interviewers (Morton-Williams, 1993). Interviewers
who assign high importance to tailoring think that each sample unit is different and needs a
8

unique approach; tailoring is seen as an important concept in nonresponse reduction (Morton-
Williams, 1993; Groves and Couper, 1998).
The last group of interviewer-level variables describes self-reported doorstep-
behavior. This includes a competent start of the introduction, tailoring the introduction,
selling the survey, using social validation arguments, dealing with reluctance, and respondent-
oriented behavior. A competent start of introduction describes the interviewers’ repertoire
during initial contact, such as, introducing themselves, naming the survey agency they
represent, and introducing the topic. A tailored introduction refers to the strategy of adapting
to the (doorstep) situation and varying the introduction, emphasizing specific elements.
Selling the survey indicates that interviewers do a good job at explaining the importance of
the survey, using practical arguments and compliance principles, whilst linking the topic of
the survey with its usefulness for the respondent. Social validation describes interviewers that
use person-oriented arguments and social validation principles in their introduction to elicit a
positive response (examples include statements such as “most people enjoy this”, “most
people participate”). Dealing with reluctance indicates a positive way of reacting to refusals,
such as, never repeating the arguments for refusal, but giving positive, relevant information
instead. Finally, respondent-oriented behavior describes interviewer behavior and orientation
necessary for good tailoring in the introduction. Important aspects of respondent orientation
include trying to understand differences between sample units and adjusting language and
arguments to the sample unit’s characteristics and initial reactions. These six indices of self-
reported doorstep behavior all refer to important concepts discussed in the literature on
interviewer behavior and nonresponse as described by Cialdini, Braver, Wolf, and Pitts
(1992), Morton-Williams (1993), Couper and Groves (1996), Hox et al (1996), Groves and
Couper (1998), Pondman (1998), Snijkers et al (1999), Hox and De Leeuw, et al (2002), and
Stoop (2005).
4 Results Both for contact and for cooperation three models were analyzed. The first model is the
intercept-only model, containing no predictor variables. This model decomposes the variance
between the respondent, interviewer and country levels, and provides an answer to the first
question: are there systematic differences between countries and between interviewers?
9

Ideally, an interpenetrated design is employed, where interviewers are allocated at
random to sample units (Schnell and Kreuter, 2005). In an international comparative survey,
allocating interviewers across countries is impossible, and thus we rely on statistical control to
distinguish between sample unit and interviewer effects. Therefore, the sample unit and
interviewer variables are added in two separate steps. The second model adds the sample unit
variables that explain significant variation, and the third model adds the interviewer variables
that explain significant variation. Thus, the effect of the interviewer variables is analyzed
conditional on the effect of the sample unit variables. This answers the second and the third
question: Can the differences be explained by observable characteristics of sample units and
interviewer (contact) strategies? And, can they be explained by differences in interviewer
characteristics?
We analyzed the data by means of a multilevel logistic regression. In logistic
regression –multilevel or otherwise– the scale of the outcome variable changes when
predictors are added to the model. This makes it difficult to compare regression coefficients
and variance components across different models. We used McKelvey and Zavoina’s (1975)
method to rescale the second and third model to the metric of the empty model; this also
makes it possible to calculate a pseudo R-squared at all available levels (Hox, 2010).
4.1 Predictors of successful contact
The intercept-only model decomposes the variance across the three levels. The intraclass
correlations in the intercept-only model show that there are systematic differences in contact
rates between countries and between interviewers within countries. Sixty-three percent of the
variance is at the sample unit level, 27% is at the interviewer level, and 10% is at the country
level. All variance components are significant (using the deviance difference test, Hox, 2010).
Table 2 shows the results for the intercept-only model and the models with the
significant sample unit variables and the significant interviewer variables added.
The pseudo R-squared at level two and three indicates that the sample unit variables
explain 44% of the interviewer variance, and 47% of the country variance. Adding interviewer
variables increases the explained interviewer variance to 56%, and the explained country
variance to 77%.
Regarding research question two, the differences in contact rate are partly explained
by urbanicity, by the initial contact made by telephone, by the state of the buildings in the
10

immediate neighborhood, the state of the sampled house compared to other buildings in the
neighborhood, and by contact attempts made outside office hours. All associations are in the
expected direction, except for making calls outside office hours, which has a negative
regression coefficient. We come back to this in the discussion.
Table 2. Successful contact, three-level logistic regression
Model: Intercept-only Sample unit Interviewer Intercept 2.99 (.31) 3.41 (.24) 1.75 (.85) Urbanicity -0.53 (.09) -0.54 (.10) State neighborhood 0.23 (.07) 0.26 (.08) State house 0.19 (.09) 0.21 (.10) Initial contact by phone -2.96 (.11) -3.27 (.12) Outside office hours -0.69 (.05) -0.77 (.06) Int. cooperation rate 2.29 (.40) Social validation -0.26 (.09) Int. image 0.39 (.18)
21σ 3.29a 2.60 2.60 22σ 1.40 (.13) 0.79 (.08) 0.62 (.06) 23σ 0.53 (.32) 0.28 (.17) 0.12 (.08)b
Pseudo R2 level 1 0.21 0.21 Pseudo R2 level 2 0.44 0.56 Pseudo R2 level 3 0.47 0.77 a Fixed at distributional value. b Significant by deviance difference test.
Regarding research question three, using social validation arguments by the interviewer is
negatively related to successful contact. Interviewers who value a positive and professional
interviewer image achieve higher contact rates. Finally, interviewers who are good at gaining
cooperation (after contact) are also good in making contact.
4.2 Predictors of cooperation conditional on contact
The intraclass correlations in the intercept-only model show that there are systematic
differences in cooperation rates between countries between interviewers within countries.
Sixty-two percent of the variance is at the sample unit level, 8% is at the interviewer level,
and 30% is at the country level. All variance components are significant (using the deviance
difference test, Hox, 2010).
Table 3 shows the results for the intercept-only model and the models with the
significant sample unit and the interviewer variables added.
In contrast to the contact rate, interviewer variance in cooperation cannot be explained
very well by the available variables. Country variance can be explained well. As Table 3
11
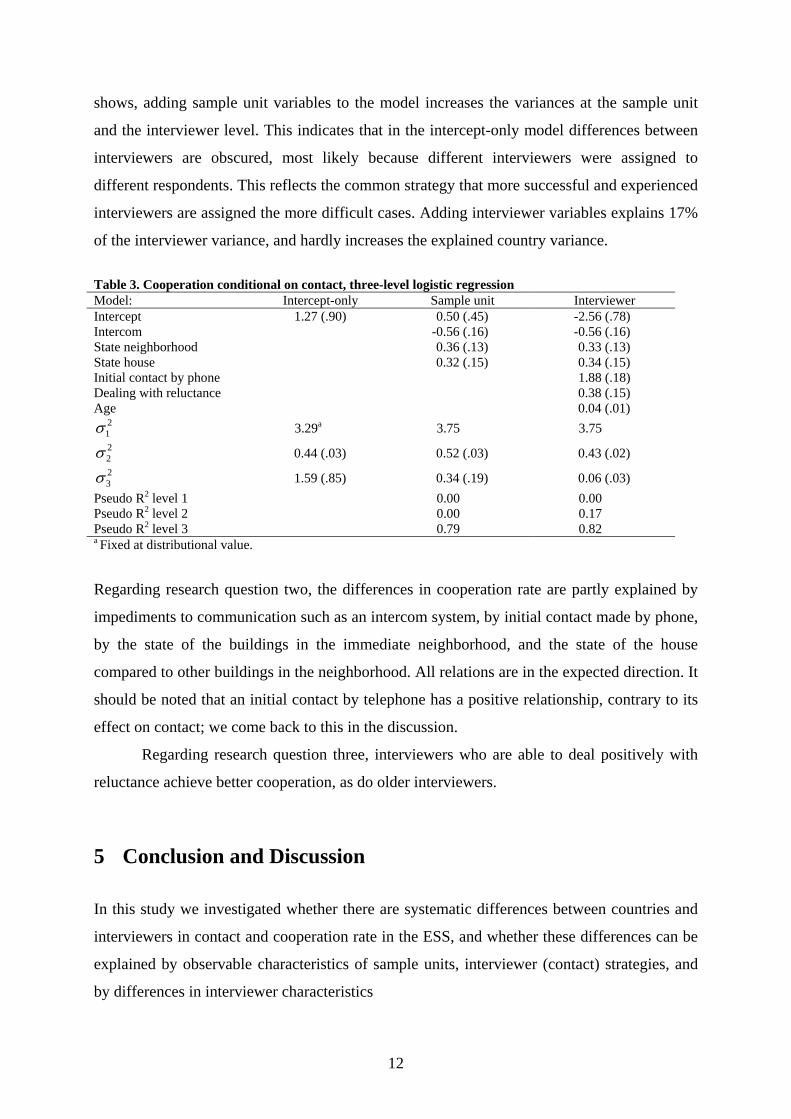
shows, adding sample unit variables to the model increases the variances at the sample unit
and the interviewer level. This indicates that in the intercept-only model differences between
interviewers are obscured, most likely because different interviewers were assigned to
different respondents. This reflects the common strategy that more successful and experienced
interviewers are assigned the more difficult cases. Adding interviewer variables explains 17%
of the interviewer variance, and hardly increases the explained country variance.
Table 3. Cooperation conditional on contact, three-level logistic regression
Model: Intercept-only Sample unit Interviewer Intercept 1.27 (.90) 0.50 (.45) -2.56 (.78) Intercom -0.56 (.16) -0.56 (.16) State neighborhood 0.36 (.13) 0.33 (.13) State house 0.32 (.15) 0.34 (.15) Initial contact by phone 1.88 (.18) Dealing with reluctance 0.38 (.15) Age 0.04 (.01)
21σ 3.29a 3.75 3.75 22σ 0.44 (.03) 0.52 (.03) 0.43 (.02) 23σ 1.59 (.85) 0.34 (.19) 0.06 (.03)
Pseudo R2 level 1 0.00 0.00 Pseudo R2 level 2 0.00 0.17 Pseudo R2 level 3 0.79 0.82 a Fixed at distributional value.
Regarding research question two, the differences in cooperation rate are partly explained by
impediments to communication such as an intercom system, by initial contact made by phone,
by the state of the buildings in the immediate neighborhood, and the state of the house
compared to other buildings in the neighborhood. All relations are in the expected direction. It
should be noted that an initial contact by telephone has a positive relationship, contrary to its
effect on contact; we come back to this in the discussion.
Regarding research question three, interviewers who are able to deal positively with
reluctance achieve better cooperation, as do older interviewers.
5 Conclusion and Discussion
In this study we investigated whether there are systematic differences between countries and
interviewers in contact and cooperation rate in the ESS, and whether these differences can be
explained by observable characteristics of sample units, interviewer (contact) strategies, and
by differences in interviewer characteristics
12

Differences in contact and cooperation rates are observed at the level of the sample
unit. This is where we find the largest variance components (over 60 percent of the variance is
at sample unit level). But we also find substantial variance at the interviewer and country
level, and we can answer our first research question in the affirmative. Yes, there are
systematic differences between countries and between interviewers within countries both in
contact and in cooperation rates. For contact we find sizeable variance at the interviewer level
(27 %) and less but still substantial variance at the country level (10%). For cooperation more
variance is found at the country level (30%), but far less at the interviewer level (8%).
Therefore, while we find stronger interviewer effects on contact, for cooperation there is
evidence for a country effect supporting theories of differential survey climates across
countries (see Lyberg and Dean, 1992).
The usefulness of paradata for analyzing and adjusting for nonresponse is currently
well-discussed amongst survey methodologists (e.g., Kreuter et al 2010). Here, paradata are
effective in partly explaining the differences we found between countries and between
interviewers within countries. For contact rate almost half of the variance on interviewer level
and country level could be explained by the paradata; for cooperation we can explain country
differences well with paradata, but not interviewer differences.
When taking interviewer and country effects into account, we find that various
indicators derived from the contact forms predict contact and cooperation. Most of these
indicators relate to interviewer observations of the house and neighborhood. The state of the
neighborhood and the state of the house compared to the rest of the neighborhood predict both
contact and cooperation. Interestingly, the presence of an intercom, which is usually regarded
an access impediment and thus as being negatively related to contact, only has a significant
effect in the cooperation model. This may well be due to the presence of an intercom being
related to socio-economic characteristics of the sample units, because intercoms are often
found at large apartment blocks. Urbanicity on the other hand is only significantly related to
contact, where we find that sample units living in urban areas are more difficult to contact;
after initial contact has been established urbanicity has no relationship with cooperation itself.
As mentioned, sample units that were attempted outside of office hours (i.e., on
weekday evening or at the weekend) were less likely to be successfully contacted. While this
is counter-intuitive and in contrast with the general literature, it corresponds to earlier findings
in the ESS. As Blom (2009, p. 24) notes “one should be careful with a causal interpretation.
While other authors looked at the probability of contact at each call conditional on the
outcome of the previous call, we examined the marginal effects of the total number of calls.
13

… Since contact attempts in the ESS were not randomly assigned, interviewers chose to
attempt contact at times and days that they felt might be most productive and that suited them.
Therefore, it is likely that only those sample units were contacted repeatedly and in the
evening / at the weekend that by their very nature were more difficult to contact.”
Interviewers develop their own calling strategies, based on their local knowledge and reacting
to the situation, thus call patterns may reflect perceived difficulties in contact (see Stoop,
2005, p.54).
We further find that sample units that were first contacted by phone were more likely
to cooperate with the survey request. This is an interesting finding; however, again one should
be careful with its interpretation, since phone attempts were not randomly allocated to sample
units, interviewers or countries. It could reflect that a first contact by phone is only successful
in specific situations (see also Lipps and Benson, 2005). Finally, the ESS interviewer
cooperation rate, which was also derived from the contact form data, is positively related to
gaining contact. Therefore, interviewers who are good at gaining cooperation are also good at
contacting, as O’Muirghertaigh and Campanelli (1999) found previously in the UK.
It is remarkable that interviewer’s workload did not have an effect in this study, as is
often hypothesized. This may be the result of the well-conducted fieldwork in the ESS;
workloads were not excessive and it is feasible that with heavier workloads interviewers have
less time to work the field and therefore achieve lower contact rates.
The interviewer questionnaire gathered rich information on the attitudes and self-
reported doorstep behavior of the ESS interviewers. These variables were especially
successful in explaining differences in contact rate between countries, reflecting differences
between countries on interviewer variables. Interviewer variables were also moderately
successful in explaining differences in cooperation between countries and between
interviewers within countries.
While most of the questions in the interviewer questionnaire concerned typical
interviewer strategies for gaining cooperation, we also find associations with contact. For
instance, interviewers who believe in the importance of projecting a positive and professional
image are also more likely to gain contact. This might be because of an association between
interviewers’ professionalism and how carefully they try to gain contact with sample units.
Thus the interviewer image scale might well reflect a more general professionalism and self-
confidence, as was also found by Durrant et al. (2010). However, in our analyses we do not
find an additional effect of interviewer image on cooperation after contact is established.
Similarly, the use of social validation arguments on the doorstep is related to achieving
14

contact; however, this factor is not related to cooperation in our analyses. Apparently, we are
picking up an underlying trait of these interviewers which is mostly related to contact rates.
The only interviewer behavior significantly related to cooperation is a positive way of reacting
to refusals. Interviewers who report that they try to avoid and convert refusals on the doorstep
by actively providing positive information do achieve higher actual cooperation rates. Finally,
interviewer age is related to cooperation, older interviewers are more likely to gain
cooperation than younger ones; this may partly reflect differences in experience.
Our results are in line with well-controlled recent studies. Interviewers’ attitudes and
avowed behavior has limited predicted power and explains only a part of the variance (e.g.,
Durrant et al, 2010; Hox and De Leeuw, 2002). Still, several interviewer level variables were
able to explain difference between countries and between interviewers within countries.
Interviewers with a professional self-image and confidence do better as do more senior
interviewers. Also, interviewers who know how to deal with reluctance, react to refusals in a
positive way, avoid repeating negatively formulated arguments and provide positively
formulated information do better. These are important elements that should be emphasized
during fieldwork, and may contribute to better interviewer-respondent interactions. The bad
news is that although the paradata could explain a relative large portion of interviewer and
country differences in nonresponse, most of these variables are beyond the control of the
researchers (e.g., urbanization, state of housing). Still, registering and investigating these
variables may still be useful, as it helps us to understand the process, and suggests adjustment
models.
15

References Billiet, J., Phillipsen, M.,Fitzgerald, R., and Stoop, I. (2007). Estimation of nonresponse bias
in the European social survey: Using Information from reluctant respondents. Journal of Official Statistics (JOS), 23 (2), 135-162.
Blom, A.G. (2009): Understanding Cross-Country Differences in Contact Rates, ISER Working Paper 2009-08, ISER, Essex University.
Blom, A. G., A. Jäckle, and P. Lynn (2010). The use of contact data in understanding cross-national differences in unit non-response. In Survey Methods in Multinational, Multiregional, and Multicultural Contexts. ed J. Harkness, M. Braun, B. Edwards, T. Johnson, L. Lyberg, and P. P. Mohler, pp. 335-354. New York: Wiley .
Bottman, S. L. and O. T. Thornberry (1992). Survey design features correlates of nonresponse. In Proceedings of the Survey Research Methods Section of the American Statistical Association, pp. 309-314. Alexandria, VA: American Statistical Association. Available at (accessed May 2010). www.amstat.org/sections/SRMS/Proceedings/papers/1992_048.pdf.
Brehm, J. (1994). The Phantom Respondents: Opinion Surveys and Political Representation. Ann Arbor: University of Michigan Press.
Campanelli, P., P. Sturgis, and S. Purdon (1997). Can You Hear Me Knocking? An Investigation into the Impact of Interviewers on Survey Response Rates. London: Social and Community Planning Research.
Cantor, D., O’Hare, B.C. and O’Connor, K. (2008). The use of monetary incentives to reduce nonresponse in random digit dial telephone surveys. In Advances in Telephone Survey Methodology, ed J.M. Lepkowski, C. Tucker, J.M. Brick, E.D. de Leeuw, L. Japec, P.J. Lavrakas, M.W. Link, and R.L. Sangster, pp.471-498. Hoboken: Wiley.
Cialdini,R.B., Braver, S.L., Wolf, W.S., and Pitts, S. (1992). Who says no to legitimate survey request? Evidence from a new method for studying the causes of survey nonresponse. Paper presented at the Third International Workshop on Household Survey Nonresponse. The Hague.
Couper, M. P. and R. M. Groves (1992). The role of the interviewer in survey participation. Survey Methodology 18 (2), 263 -277.
Couper, M.P. and De Leeuw, E.D. (2003) Nonresponse in cross-cultural and cross-national surveys. In Cross-Cultural Survey Methods, ed J.A. Harkness, F.J.R. van de Vijver, and P.P. Mohler, pp.157-177. New York: Wiley.
De Leeuw, E. and W. de Heer (2002). Trends in household survey nonresponse: A longitudinal and international comparison. In Survey Nonresponse, ed R. M. Groves, D. A. Dillman, J. L. Eltinge, and R. J. Little, pp. 41-54. New York: Wiley.
De Leeuw, E. D., Callegaro, M., Hox, J.J., Korendijk, E., and Lensvelt-Mulders, G. (2007). The influence of advance letters on response in telephone surveys: a meta-analysis. Public Opinion Quarterly, 71, 3, 1-31.
De Leeuw, E.D., Hox,J.J., Snijkers, G., and De Heer, W. (1998). Interviewer opinions, attitudes, and strategies regarding survey participation and their effect on response http://www.gesis.org/fileadmin/upload/forschung/publikationen/zeitschriften/zuma_nachrichten_spezial/znspezial4.pdf
De Heer, W. (1999). International Response Trends: Results of an International Survey. Journal of Official Statistics (JOS), 15 (2), 129-142.
Dillman, D.A. (1978). Mail and Telephone Surveys: The Total Design Method. New York: Wiley.
16

Dillman, D.A., Smyth, J., and Christian, L.M. (2009). Internet, Mail and Mixed-Mode Surveys: The Tailored Design Method, 3rd ed., Hoboken, NJ: Wiley.
Durban, J., and Stuart, A. (1951). Differences in response rates of experienced and inexperienced interviewers. Journal of the Royal Statistical Society: Series A (Statistics in Society), 114, 163-206.
Durrant, G.B., Groves, R.M., Staetsky, L., and Steele, F. (2010). Effects of interviewer attitudes and behaviors on refusal in household surveys. Public Opinion Quarterly, 74 (1), 1-36.
Goyder, J. (1987). The Silent Minority: Nonrespondents on Sample Surveys. Cambridge: Policy Press.
Groves, R.M. (1989). Survey Errors and Survey Costs. New York: Wiley. Groves, R.M. and Fultz,, N.H. (1985). Gender effects among telephone interviewers in a
survey of economic attitudes. Sociological Methods and Research, 14 (1), 31-52. Groves, R. M., R. B. Cialdini, and M. P. Couper (1992). Understanding the decision to
participate in a survey. Public Opinion Quarterly 56 (4), 475_495. Groves, R. M. and M. P. Couper (1998). Nonresponse in Household Interview Surveys. New
York: Wiley. Hedeker, D., Gibbons, R., duToit, M., and Cheng, Y. (2008). SuperMix: for Mixed Effects
Models. Lincolnwood: Scientific Software International, Inc Hox, J.J. (2010). Multilevel Analysis. Techniques and Application, second edition. New
York: Routledge. Hox, JJ. and De Leeuw, E.D et al (2002). The influence of interviewers’ attitude and behavior
on household survey nonresponse: An international comparison. In Survey Nonresponse, ed R. M. Groves, D. A. Dillman, J. L. Eltinge, and R. J. Little, pp. 103-118. New York: Wiley.
Hox, J.J. (1994). Hierarchical regression models for interviewer and respondent effect. Sociological Methods and Research, 22, 3001-318.
Hox, J.J., De Leeuw, E.D., and Vorst, H. (1996). A reasoned action explanation for survey nonresponse. In International Perspectives on Nonresponse, ed: S. Laaksonen. Proceedings of the sixth international workshop on household survey nonresponse. Statistics Finland, research report 219 (pp. 101-110). Helsinki: Statistics Finland.
Hox, J.J., and De Leeuw, E.D. (1994). A comparison of nonresponse in mail, telephone, and face to face surveys: Applying multilevel modeling to meta-analysis. Quality and Quantity, 28, 329-344. Reprinted in: David de Vaus (2002), Social Surveys, part eleven, nonresponse error. London: Sage, Benchmarks in Social Research Methods Series
Hox, J.J., De Leeuw, E.D., and Kreft, I.G.G. (1991). The effect of interviewer and respondent characteristics on the quality of survey data: a multilevel model. In Measurement Errors in Surveys, eds. P.P. Biemer, R.M. Groves, L.E. Lyberg, N.A. Mathiowetz, and S. Sudman , pp. 439-462. New York: John Wiley & Sons,
Japec, L. (2008).Interviewer error and interviewer burden. In Advances in Telephone Survey Methodology, ed J.M. Lepkowski, C. Tucker, J.M. Brick, E.D. de Leeuw, L. Japec, P.J. Lavrakas, M.W. Link, and R.L. Sangster, pp.187-211. Hoboken: Wiley.
JOS (1999). Journal of Official Statistics Special Issue on Survey Nonresponse, guest editor Edith de Leeuw, JOS, 15, 2, June 1999. Available at (accessed May 2010) http://www.jos.nu/Contents/issue.asp?vol=15&no=2
Koch, A., A. G. Blom, I. Stoop, and J. Kappelhof (2009). Data collection quality assurance in cross-national surveys at the example of the ESS. Methoden, Daten, Analysen, Zeitschrift für Empirische Sozialforschung 3 (2).
Kreuter, F., K. Olson, J.Wagner, T.Yan, T. M. Ezzati-Rice, C. Casas-Cordero and M. Lemay, A. Peytchev, R. M. Groves, and T. E. Raghunathan (2010) Using proxy measures and
17

other correlates of survey outcomes to adjust for non-response: examples from multiple surveys. Journal of the Royal Statistical Society: Series A, 173(2), 389–407.
Kreuter, F. and Kohler, U. (2009) Analyzing Contact Sequences in Call Record Data. Potential and Limitations of Sequence Indicators for Nonresponse Adjustments in the European Social Survey. Journal of Official Statistics (JOS). 25 (2), 203-226
Lehtonen, R (1996). Interviewer attitudes and unit nonresponse in two different interview schemes. In International perspectives on nonresponse: Proceedings of the sixth international workshop on household survey nonresponse., ed. S. Laaksonen. Helsinki: Statistics Finland
Lipps, O. and G. Benson (2005). Cross-national contact strategies. Proceedings of the Survey Research Methods Section of the American Statistical Association, pp. 3905-3914. Alexandria, VA: American Statistical Association. Available at (accessed May 2010) http://www.amstat.org/sections/SRMS/Proceedings/
Lyberg, L. and Dean, P. (1992). Methods for reducing nonresponse rates: a review. Paper presented at the annual meeting of the American Association for Public Opinion Research, St. Petersburg, FL. Unpublished manuscript.
McKelvey, R. and Zavoina, W. (1975). A statistical model for the analysis of ordinal dependent variables. Journal of Mathematical Sociology, 4, 103-120.
Morton-Williams, J. (1993). Interviewer Approaches. Aldershot: Dartmouth. O'Muircheartaigh, C. and Campanelli, P. (1999). A multilevel exploration of the role of
interviewers in survey non-response. Journal of the Royal Statistical Society: Series A (Statistics in Society), 162 (3), 437-446.
Pickery, J. and Loosveldt, G. (2004). A Simultaneous Analysis of Interviewer Effects on Various Data Quality Indicators with Identification of Exceptional Interviewers. Journal of Official Statistics (JOS). 20 (1), 77-89.
Pickery, J. and Loosveldt, G. (2002). A multilevel multinomial analysis of interviewer effects on various components of unit nonresponse. Quality and Quantity, 36, 427-437.
Pondman, L.M. (1998). The Influence of the Interviewer on the Refusal Rate in Telephone Surveys. Amsterdam: Vrije Universiteit/ Print Partners Ipsekamp.
Purdon, S., Campanelli, P. and Sturgis, P. (1999). Interviewers' calling strategies on face-to-face interview surveys. Journal of Official Statistics (JOS). 15 (2), 199-216.
Schnell, R. and Krauter, F. (2005). Separating interviewer and sampling-point effects. Journal of Official Statistics (JOS). 21 (3), 389-410.
Singer, E.. (2002). The Use of Incentives to Reduce Nonresponse in Households Surveys. In Survey Nonresponse, ed. Robert M. Groves, Don Dillman, John Eltinge, L. and R.J.A. Little. pp. 163-78. New York: Wiley.
Singer, E., van Hoewyk, J.V., Gebler, N., Raghunathan, T., & McGonagle, K. (1999). The Effect of Incentives on Response Rates in Interviewer-Mediated Surveys. Journal of Official Statistics (JOS), 15, 217-230.
Singer E., Frankel, M.R., & Glassman, M. B. (1983). The effect of interviewer characteristics and expectations on response. Public Opinion Quarterly, 47, 84-95.
Snijkers, G., Hox, J.J., De Leeuw, E.D. (1999). Interviewers' tactics for fighting survey nonresponse. Journal of Official Statistics (JOS), 15, 2, 185-198. Reprinted in: David de Vaus (2002), Social Surveys, part eleven, nonresponse error. London: Sage, Benchmarks in Social Research Methods Series
Stoop, I. (2005). The Hunt for the Last Respondent. The Hague: Social and Cultural Planning Office.
Symons, K., Matsuo, H., Beullens, K., and Billiet, J. (2008). Response Based Quality Assessment in the ESS - Round 3: An Update for 19 countries. London: Centre for Comparative Social Surveys, City University.
18

Annex: IQUEST Report
International Interviewer Questionnaire (IQUEST)
Development and Scale Properties
Prof. Dr. Edith D. de Leeuw Prof. Dr. Joop J. Hox
Department of Methodology and Statistics Utrecht University
June 2009
19

Content 1. Goal
2. Description of questionnaire Development Master questionnaire Available versions
3. Data Collection
4. Index Construction Method Structure and Reliability
Questions on Interviewer Approaches Questions on Interviewer Persuasion Strategies Specific Telephone / Face to Face Questions
5. Descriptive Statistics Interviewer Indices: Boxplots and Quintiles
6. References
Appendix A Text master questionnaire
Appendix B Data entry instructions SPSS template
Appendix C Syntax index instruction
20

1 Goal Nonparticipation in surveys is a rightful concern of surveys researchers all over the World and
there is considerable evidence that it is increasing in most western countries. (For an overview
see Couper & De Leeuw, 2003; Stoop, 2005). However in a longitudinal international
comparison based on existing data from national statistical offices, De Leeuw & de Heer
(2001) show that the response level and rate of decrease show strong variations between
countries.
Interviewers play a key role in contacting and convincing potential respondents and
recent research has focused on the role of interviewer experience, attitudes and behaviour on
nonresponse both in face-to-face and telephone interviews (e.g., Campanelli et al, 1997, De
Leeuw et al, 1998, Hox & De Leeuw, et al 2002, Groves & Couper, 1998; Stoop, 2005).
To facilitate research into the role of the interviewer into the survey process an
International Standardized Interviewer Questionnaire (IQUEST) was developed: a
questionnaire for bbootthh face-to-face and telephone interviewers. For a description see section 2.
For an English master version see Appendix A.
This report describes the psychometric properties of the IQUEST based on data from
eight different European countries. In the Appendices it provides data entry instructions and
an SPSS syntax for the construction of relevant interviewer scales.
We hope that making this available to the survey research community at large will
stimulate research into the role of the interviewer on response and data quality within and
between countries all over the world.
Joop Hox & Edith de Leeuw
21

2 Description of Questionnaire
2.1 Development of the IQUEST
In the past decade, several interviewer questionnaires were developed asking for interviewer
attitudes (Lehtonen, 1996), and avowed doorstep behaviour (Couper & Groves, 1992;
Campanelli, Sturgis, & Purdon 1997). Building on these two perspectives –attitude and
behaviour- De Leeuw, Hox, Snijkers & De Heer (1998) developed a Dutch interviewer
questionnaire, which was the basis for an international interviewer questionnaire. At the
international nonresponse workshop in 1996, an international research project was started to
investigate the influence of interviewers’ attitude and avowed behaviour on nonresponse, and
an international interviewer questionnaire was developed (Hox & De Leeuw, 1998) which
was used to analyze nonresponse data in nine countries (Hox, De Leeuw, et al. 2002). This
study showed that there were clear differences between countries in interviewer attitude and
avowed doorstep behaviour, and that these differences explain part of the variation in
response rates between countries.
These encouraging results led to the development of a standardized international
interviewer questionnaire to further stimulate international research: IQUEST (Hox & De
Leeuw, 2002). This questionnaire –IQUEST- was developed for both face-to-face and
telephone interviewers, and is an extension of the 1998-questionnaire and incorporates
concepts from recent theories and empirical insights on the role of the interviewer in the data
collection process. Compared to the first international interviewer questionnaire, several
questions were omitted based on the results of both psychometric analysis and substantive
analyses (Hox & De Leeuw, 2002). The resulting core questionnaire consisted of attitude
questions on persuasion strategies based on Lehtonen (1996), and questions on avowed
doorstep behaviour based on Campanelli et al. (1997), Groves, Cialdini, & Couper (1992),
and Morton-Williams (1993). Based on new theoretical and empirical findings, several
questions were added to this core questionnaire. This included questions on verbally dealing
with reluctance (Pondman, 1998) and on reported successful interviewer strategies (Snijkers,
Hox, de Leeuw, 1999; Hox, de Leeuw & Snijkers, 1998). Standard demographic questions on
age and education of the interviewers were added and a question on length of interviewer
experience.
22

2.2 Master Questionnaire
A master questionnaire was developed containing both the questionnaire text itself and
context information about the questions and the questionnaire; English was used as “lingua
franca” (Harkness et all, 2003). The master questionnaire was checked for clarity and
intercultural translatability; for the full text of the master questionnaire see Appendix A.
The first part of the questionnaire (section A1) contains questions on interviewer
behaviour while introducing the survey. These include questions on competent introductions
as emphasized in standard interviewer training, e.g. introduce myself, mention agency, survey,
show ID (Campanelli, et al, 1997; Morton-Williams (1993). These were followed by
questions on tailoring the rest of the introduction to the ‘doorstep situation, e.g., I vary my
introduction depending on the situation (Morton-Williams, 1993; Groves & Couper, 1998),
and on contact strategies, e.g., mentioning letters and leaflets, leaving a personal message
when no one can be reached (Groves & Couper, 1998; Snijkers, Hox & De Leeuw, 1999).
Section A2 also focuses on avowed interviewer behaviour and especially on
arguments for convincing potential respondents and the use of persuasion strategies. These
include questions derived from social psychology and the literature on compliance and
persuasion strategies (Cialdini, 1984; see also Groves, Cialdini, & Couper, 1992), such as,
scarcity, and social validation arguments. Questions on successful strategies for dealing with
reluctance (Pondman, 1998), such as, avoid asking why after an initial refusal, but offering
relevant information on positive features in stead. The majority of the questions focussed on
practical arguments for ‘selling’ the surveys and convincing respondents of the importance of
the survey (Snijkers, Hox, de Leeuw, 1999; Hox, de Leeuw, & Snijkers, 1998).
2.3 Available Versions The master questionnaire was subsequently translated in the following languages: Dutch,
British English (UK), French (Swiss), German (Swiss), Italian (Swiss), Finnish, Swedish,
Polish, and Portuguese.
The Dutch version was used in both the Netherlands and the Flemish part of Belgium,
and was checked both by Dutch and Belgium experts.
The French, German, and Italian versions were developed in Switzerland, which is a
multilingual country and has interviews conducted in all three languages.
23

3 Data Collection The master questionnaire was made available to all countries participating in the first round of
the European Social Survey (ESS) in 2002. As the ESS uses highly standardized
questionnaires and data collection procedures, including strongly standardized field methods
and non-response registration, this is an ideal situation to study interviewer effects cross-
nationally. For more information on the ESS and methodological rules on data collection see
www.europeansocialsurvey.org
Before the start of the first round of data collection of the ESS in 2002, all country
coordinators were approached by email and asked if they were willing and able to let their
interviewers fill out an interviewer questionnaire. This activity was entirely voluntary and
eight countries participated, resulting in completed questionnaires for 880 interviewers.
Table 1 lists the participating countries, the number of interviewers in each country,
their age, sex, and average years of experience.
Of the total 880 interviewers, a small majority was male (52.3%). There were no large
differences between countries regarding interviewer sex, except for Finland where the vast
majority (96%) of the interviewers was male, and Portugal where a large majority was female
(71%). The average interviewer age was 46.8 year with a standard deviation of 13.4 year. The
average interviewer had 7.4 years of experience working as an interviewer with a standard
deviation of 8 years.
Table 1. Interviewers per country, average age, % male, and average years experience Country Frequency Percent Mean Age % Male Mean Experience Netherlands 60 6.8 52 .40 10.4 Belgium 82 9.3 48 .41 6.8 Switzerland 46 5.2 34 .50 1.8 United Kingdom 149 16.9 56 .49 6.5 Swedena 177 20.1 - - 7.9 Poland 175 19.9 40 .40 4.9 Portugal 58 6.6 38 .29 6.4 Finland 133 15.1 52 .96 12.7 Total 880 100.0 47 .52 7.4
a Due to privacy regulations, age and gender of the Swedish interviewers were not recorded.
24

4 Index Construction
4.1 Analysis Method Since the data are based on questions followed by five-point answer categories, we could not
assume an interval type scale and the data structure was analyzed using categorical data
analysis methods. Although the total amount of missing data was small, with more than 90%
of data present for all pairwise combinations of variables, the cumulative loss of data when
listwise deletion is used was judged inacceptable, therefore the incomplete raw data likelihood
method was used. We used Mplus 5.1 Exploratory Factor Analysis (EFA) with WLSMV
(robust Weighted Least Squares) estimation and a Promax rotation (Muthén & Muthén, 2007).
To evaluate the number of factors, we used scree tests and the fit indices CFI/TLI and
RMSEA. Because less than half of the interviewers answered the telephone-specific
questions, these were removed from the analysis.
Questions were appropriately recoded so that a high score indicates a high level of the
measured characteristic. For the reliability analyses Cronbach’s coefficient alpha was
calculated.
For the final index construction, all scales (indices) were calculated using ‘item mean
score’ with imputation (by mean on other items) of at most 20% of the items. Without
imputation, the cumulative data loss would be considerable (see above).
Because the index represents the mean value on the questions defining the index, all
computed indices (scales) have a theoretical minimum of 1 and a theoretical maximum of 5,
with a high score indicating a high level of the measured characteristic.
4.2 Structure and Reliability
4.2.1 Questions on Interviewer Approaches Structure
The ‘A’ part of the questionnaire contains questions on specific approaches used by the
interviewers. It should be noted that all questions are on self-reported interviewer behaviour.
The questionnaire contains an A1 and A2 part, distinguishing between introduction of the
survey and interaction with the respondent. However, many constructs span both sections, and
a simultaneous analysis of the entire A section reveals that many factors also span both
sections. Therefore, section A is treated as a whole.
25

Variables were recoded in such a way that a high score indicated desired interviewer
behaviour (1=never,…, 5=always). This means, that in part A1 all questions except question 5
were recoded. In part A2 all questions were recoded. In this report this is indicated by adding
the letter ‘r’ to the question identifier. So, ‘A1_1r’ indicates ‘section A1, question1, recoded’.
Figure 1. Scree test for Approach Questions
The scree test in Figure 1 indicates six factors. The EFA fit measures also indicated six
factors: RMSEA is 0.05. With seven factors, estimation problems occurred and no
convergence was reached, and with eight and more factors there were many singleton factors
with only one significant loading. It was therefore decided to keep the six factor solution. The
results of this six factor solution are summarized in Table 2.
The correlations between the factors were generally low. On the basis of the factor
matrix six scales were defined, reflecting the factors in Table 2.
Index and Reliability
The questions were appropriately recoded so that a high score indicates a high level of the
measured characteristic. Six indices were defined. The first index ‘Selling the Survey”
indicates that interviewers do a good job of explaining the importance of the survey, using
practical arguments and compliance principles linking the topic of the survey with usefulness
for the respondent. This index is defined by items, such as, explaining why the survey is done
and how the results will be used, and by explaining why the study is important in general and
for the respondent. The second index “Social Validation” is based on more person oriented
26

arguments using social validation arguments in their introduction to elicit a positive response,
such as, most people enjoy this, and most people participate.
Table 2. Factor matrix for Interviewer Approaches Questions Six factor solution. Question Selling SocVal TailorIntro StartIntro Reluctance RespOrien A1_1r 0.02 -0.05 -0.02 0.78 0.06 0.00 A1_2r -0.04 0.01 -0.11 0.66 0.02 -0.05 A1_4r -0.04 0.28 0.62 0.08 -0.04 -0.26 A1_5 -0.02 0.16 -0.61 0.24 -0.02 0.04 A1_6r 0.24 0.23 -0.13 0.16 0.02 -0.06 A1_7r 0.12 -0.19 -0.07 0.65 0.12 -0.01 A1_8r 0.19 0.16 0.04 0.27 0.00 -0.02 A1_9r 0.05 -0.22 0.77 -0.06 0.06 0.23 A1_10r 0.06 -0.12 0.08 0.14 -0.01 0.48 A1_11r -0.07 0.10 0.32 -0.09 0.07 0.62 A2_1r 0.10 0.71 -0.15 -0.02 0.04 0.08 A2_2r 0.06 0.62 0.04 -0.18 0.03 -0.01 A2_3r -0.08 0.87 -0.06 0.06 -0.01 0.06 A2_4r 0.10 0.71 -0.05 -0.09 0.03 0.02 A2_5r 0.51 0.25 -0.09 0.05 -0.01 0.02 A2_6r 0.46 0.12 0.09 0.15 0.01 -0.06 A2_7r 0.61 -0.02 0.10 0.12 0.06 -0.04 A2_8r 0.79 -0.03 0.00 0.12 -0.04 -0.04 A2_9r 0.76 0.05 0.05 -0.06 0.06 -0.07 A2_10r 0.32 0.37 0.13 -0.30 0.02 -0.04 A2_11r 0.63 0.05 0.04 -0.08 -0.04 0.02 A2_12r 0.80 -0.10 -0.10 -0.01 0.04 0.05 A2_13r 0.59 -0.02 0.06 -0.06 -0.06 0.22 A2_14r -0.10 0.22 0.18 0.17 0.01 0.30 A2_15r -0.10 0.13 -0.07 0.04 -0.13 0.59 A2_16r -0.13 0.21 0.21 0.42 -0.04 -0.02 A2_17r 0.02 0.16 0.24 0.14 0.00 0.12 A2_19r 0.13 0.03 -0.28 -0.10 0.11 0.59 A2_21r -0.08 0.07 -0.03 -0.07 -0.51 0.00 A2_22r 0.01 -0.07 -0.03 -0.12 -0.81 -0.03 A2_23r 0.32 -0.24 0.01 0.26 -0.27 0.12 A2_24r 0.32 0.19 0.00 -0.01 -0.12 0.07
The third and fourth indexes describe the introduction used. “Competent Start Introduction”
describes the advised repertoire during initial contact, such as, introducing her/himself,
naming the agency on whose behalf one interviews, and introducing the topic. “Tailored
Introduction” refers to the strategy of good interviewers to adapt to the (doorstep) situation
and varying their introduction in stead of using a standard introduction in all cases. The fifth
index ‘Dealing with Reluctance’ indicates a positive way of reacting to refusals, such as,
never repeating the arguments for refusal, but giving positive, relevant information in stead.
For instance, never repeating ‘you are too old’, but reacting that this survey is of particular
interest to elder people. The sixth index “Respondent Oriented” describes interviewer
behaviour and orientation that is necessary for good tailoring in the introduction. Important
27
aspects of respondent orientation are that interviewers try to understand why respondents may
differ and adjust their language and arguments to the respondents and their initial reactions.
These six indices all refer to important concepts discussed in the literature on
interviewer behaviour and nonresponse as described by Morton -Williams (1993), Couper &
Groves (1996), Pondman (1998), Snijkers, Hox & De Leeuw, (1999), Hox & De Leeuw, et
al (2002), and Stoop (2005).
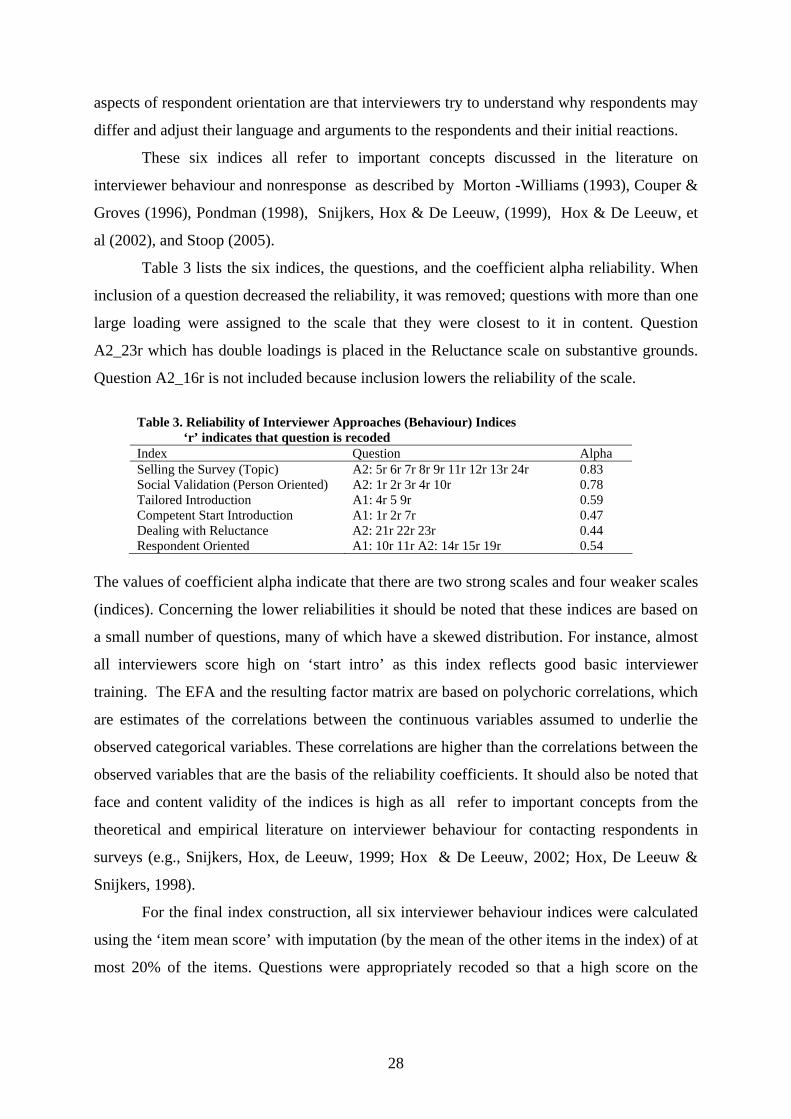
Table 3 lists the six indices, the questions, and the coefficient alpha reliability. When
inclusion of a question decreased the reliability, it was removed; questions with more than one
large loading were assigned to the scale that they were closest to it in content. Question
A2_23r which has double loadings is placed in the Reluctance scale on substantive grounds.
Question A2_16r is not included because inclusion lowers the reliability of the scale.
Table 3. Reliability of Interviewer Approaches (Behaviour) Indices ‘r’ indicates that question is recoded Index Question Alpha Selling the Survey (Topic) A2: 5r 6r 7r 8r 9r 11r 12r 13r 24r 0.83 Social Validation (Person Oriented) A2: 1r 2r 3r 4r 10r 0.78 Tailored Introduction A1: 4r 5 9r 0.59 Competent Start Introduction A1: 1r 2r 7r 0.47 Dealing with Reluctance A2: 21r 22r 23r 0.44 Respondent Oriented A1: 10r 11r A2: 14r 15r 19r 0.54
The values of coefficient alpha indicate that there are two strong scales and four weaker scales
(indices). Concerning the lower reliabilities it should be noted that these indices are based on
a small number of questions, many of which have a skewed distribution. For instance, almost
all interviewers score high on ‘start intro’ as this index reflects good basic interviewer
training. The EFA and the resulting factor matrix are based on polychoric correlations, which
are estimates of the correlations between the continuous variables assumed to underlie the
observed categorical variables. These correlations are higher than the correlations between the
observed variables that are the basis of the reliability coefficients. It should also be noted that
face and content validity of the indices is high as all refer to important concepts from the
theoretical and empirical literature on interviewer behaviour for contacting respondents in
surveys (e.g., Snijkers, Hox, de Leeuw, 1999; Hox & De Leeuw, 2002; Hox, De Leeuw &
Snijkers, 1998).
For the final index construction, all six interviewer behaviour indices were calculated
using the ‘item mean score’ with imputation (by the mean of the other items in the index) of at
most 20% of the items. Questions were appropriately recoded so that a high score on the
28
index indicates a high level of the measured characteristic. All computed indices have a
theoretical minimum of 1 and a theoretical maximum of 5.
4.2.2 Questions on Interviewer Persuasion Strategies Structure
The ‘B’ part of the questionnaire contains questions on interviewers’ attitudes and opinions
regarding contacting and persuasion strategies. Variables were recoded in such a way that a
high score indicated agreeing with positive, theoretically successful strategies (1=strongly
disagree,…,5=strongly agree). This means, that in part B all questions except question 7 were
recoded. In this report this is indicated by adding the letter ‘r’. So, ‘B1r’ indicates ‘section B,
question1, recoded’.
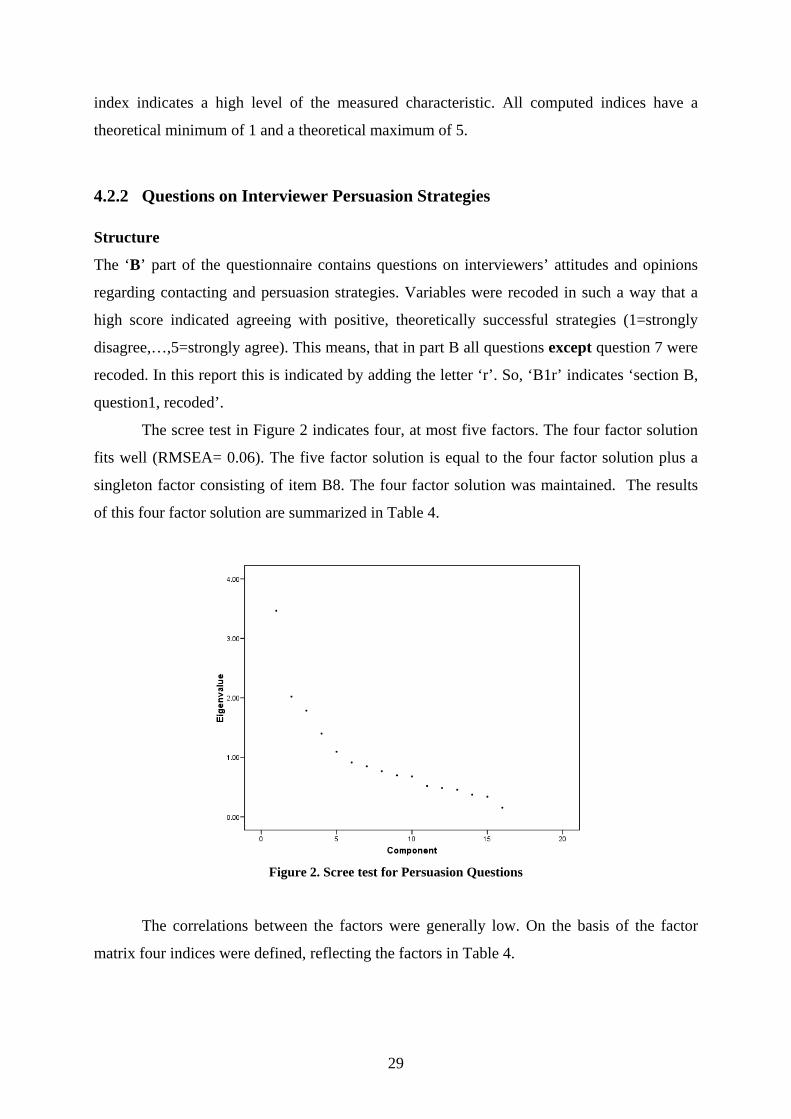
The scree test in Figure 2 indicates four, at most five factors. The four factor solution
fits well (RMSEA= 0.06). The five factor solution is equal to the four factor solution plus a
singleton factor consisting of item B8. The four factor solution was maintained. The results
of this four factor solution are summarized in Table 4.
Figure 2. Scree test for Persuasion Questions
The correlations between the factors were generally low. On the basis of the factor
matrix four indices were defined, reflecting the factors in Table 4.
29

Table 4. Factor matrix for Interviewer Persuasion Questions Four factor solution Question Itr Image Persuasion Tailoring Voluntary B1r 0.12 0.04 0.22 0.29 B2r -0.04 0.69 0.07 -0.22 B3r -0.03 0.71 0.05 0.07 B4r 0.10 -0.17 0.02 0.50 B5r -0.17 -0.14 -0.06 0.69 B6r -0.16 0.28 0.06 0.55 B7 0.06 0.20 -0.67 0.12 B8r 0.06 0.43 -0.13 0.08 B9r -0.05 0.18 0.74 0.09 B10r 0.26 0.13 0.31 0.02 B11r 0.25 -0.27 0.05 0.06 B12r 0.39 0.03 -0.11 0.13 B13r 0.74 0.09 -0.03 -0.07 B14r 0.88 0.00 -0.07 -0.13 B15r 0.92 -0.15 0.01 -0.05 B16r 0.47 0.18 0.08 0.11
Index and Reliability
The questions were appropriately recoded so that a high score indicates a high level of the
measured characteristic. Four indices were defined. The first index “Importance of
Interviewer Image” indicates the importance of projecting a positive, and professional image,
and refers to social skills and self-presentation. This index is defined by items, such as,
convey that you can be trusted, are friendly, and believe in the survey. The second index
“Positive Attitude towards Persuasion”, indicates that an interviewer is persuasion oriented
and is convinced that most people are willing to respond, and can and should be persuaded
when approached at the right time. The third index “ Importance of Tailoring” indicates the
conviction of interviewers that tailoring is important and that every respondent is special and
needs a unique approach. The fourth index “Importance of Voluntariness” indicates that
interviewers respect privacy and believe in the voluntary nature of survey cooperation.
The four indices refer to important concepts discussed in the literature on attitudes
towards interviewer persuasion and voluntariness as described by Lehtonen (1996), see also
Hox & De Leeuw et al (2002), and Tailoring and Image ( Morton -Williams, 1993), see also
Couper & Groves, 1992 and Snijkers, Hox & De Leeuw, 1999.
Table 5 lists the indices, the questions, and the coefficient alpha reliability. Question
B_12r is not included because inclusion lowers the reliability of the Interviewer Image index.
30

Table 5. Reliability of Interviewer Persuasion (Attitudes) Indices ‘r’ indicates that question is recoded Index Questions Alpha Importance Itr Image B: 13r 14r 15r 16r 0.60 Positive towards Persuasion B: 2r 3r 8r 0.57 Importance of Tailoring B: 7 9r 10r 0.49 Importance of Voluntariness B: 4r 5r 6r 0.46
The values of coefficient alpha indicate that there are two stronger and two weaker indices.
Concerning the lower reliabilities it should be noted that these four indices are based on a
small number of questions, and that for such short scales the reliability is satisfactory. It
should also be noted that face and content validity of the indices is high as all refer to
important concepts from the theoretical and empirical literature on interviewer attitudes and
its importance for reducing nonresponse (Lehtonen, 1996; Morton-Williams, 1993).
For the final index construction, all four interviewer opinion and attitude indices were
calculated using the ‘item mean score’ with imputation (by the mean of the other items in the
index) of at most 20% of the questions. Questions were appropriately recoded so that a high
score on the index indicates a high level of the measured characteristic. All computed indices
(scales) have a theoretical minimum of 1 and a theoretical maximum of 5.
4.2.3 Specific Telephone / Face-to-Face Questions The questionnaire contained several specific questions for telephone or face-to-face interview
situations. These specific questions were not included in the factor and reliability analyses
described above and were also not used for the general index construction. We calculated the
correlations of the specific telephone and face-to-face questions with the interviewer
behaviour and attitude indices. The correlations of the individual questions with the index
scores were low for all specific questions and all index scores (maximum correlation .30).
There is thus no reason to add these mode specific questions to one of the indices when face-
to-face or telephone interviewing is used.
Based on the factor and reliability analyses reported above, a few questions in part A
and B could not be included in an index. These questions are retained in the questionnaire as
individual items for further research, and to preserve the item numbering system.
31

5 Descriptive Statistics
5.1 Interviewer Indices Data were collected in eight countries in the first round of the ESS in 2002, and resulted in
completed questionnaires for 880 interviewers. Although the present data is essentially a
convenience sample of interviewers from a convenience sample of countries, it is instructive
to compare new data to the scores of the interviewers in our data set.
Table 6 lists the descriptive statistics for all ten interviewer indices based on our
sample of 880 international interviewers. Listed are the mean and median for each index, its
standard deviation, minimum and maximum value.
To facilitate the comparison of scores of new interviewers with the 2002 ESS group,
Table 6 also provides the quintile cut-off scores: the values at the 20th, the 40th, the 60th, and
the 80th percentile are listed. As illustration, if a new interviewer has a score on the index
“Selling the Survey” lower than 3.22, this means that s/he is comparable to the lowest 20
percent of the norm interviewers in the 2002 ESS round, and is not a very ‘selling’
interviewer, while a score higher than 4.22 indicates that this interviewer is among the highest
20 percent and a best seller indeed.
Table 6. Descriptive Statistics for Interviewer Index Scores, All Countries, 880 interviewers
Selfreported Behaviour Indices Opinion Indices
Selling SocVal TailInt StartInt Reluct RespOr ItrImag Persuas Tailor Volunt Mean 3.67 2.92 3.42 4.68 3.55 4.14 4.74 3.07 3.64 3.73Median 3.67 2.80 3.67 5.00 3.67 4.20 5.00 3.00 3.67 3.67Std. Dev. .60 .85 .84 .51 .80 .57 .35 .84 .75 .71Minimum 1.11 1.00 1.00 2.00 1.00 1.80 3.00 1.00 1.33 1.00Maximum 5.00 5.00 5.00 5.00 5.00 5.00 5.00 5.00 5.00 5.00
20 3.22 2.20 2.67 4.33 3.00 3.60 4.50 2.33 3.00 3.0040 3.56 2.60 3.33 4.67 3.33 4.00 4.75 2.67 3.33 3.6760 3.89 3.00 3.67 5.00 3.67 4.40 5.00 3.33 4.00 4.00
Perc
entil
es
80 4.22 3.60 4.00 5.00 4.33 4.60 5.00 3.67 4.33 4.33
Boxplots for the six behaviour indices are shown in Figure 3 below. In general, the
behavioural indices are well distributed with the exception of the index for ‘competent start of
introduction’. This index has little variance, almost all interviewers have a high score on this
index, indicating that they are well trained and report to use the basic elements of the start of
an introduction often. For a description of the behaviour indices, see section 4.2.1.
32

Figure 3: Boxplots for Behavioural Indices, N=880
Boxplots for the four opinion an attitude indices are shown in Figure 4 below. In general,
these indices are well distributed with the exception ‘Importance of Interviewer Image’. This
index has little variance, almost all interviewers view this as very important. For a more
detailed description of these indices, see 4.2.2.
Figure 4. Boxplots for Interviewer Attitude and Opinion Indices. N=880
33

34
5.2 Comparisons Between Countries The boxplots below depict the differences between the eight countries in terms of the scores
on the interviewer indices. Figure 5 shows the distribution of interviewers’ self reported
behaviour across different countries; Figure 6 shows the distribution of interviewer attitudes
and opinions across countries.
When we compare the indices for self reported interviewer behaviour over the eight
countries, we see some differences. Portugal scores relatively high on selling the survey. Both
Poland and Portugal score relatively high on the use of social validation arguments, while
Finland and Sweden scores relatively low on the use of social validation arguments. Finland
also scores relatively low on tailored introductions. Otherwise the differences are small. The
most striking result is the lack of variance in the behaviour at the start of the introduction for
all eight countries, which for Sweden and Finland does not show any variation at all. This
probably reflects the strict interviewer training on this aspect, such as telling whom you are
from, showing your identity card, naming the topic.
When we compare the indices for interviewer opinion over the eight countries, we see
again some differences. Both Poland and Portugal score relatively high on persuasion, Finland
scores relatively low on voluntariness. Otherwise the differences are small.

Selling the Survey Social Validation Arguments Use Tailored Introduction
Competent Start Introduction Dealing with Reluctance Respondent Oriented Behaviour
Figure 5. Distribution of Self-reported Interviewer Behaviour Indices Across Different Countries
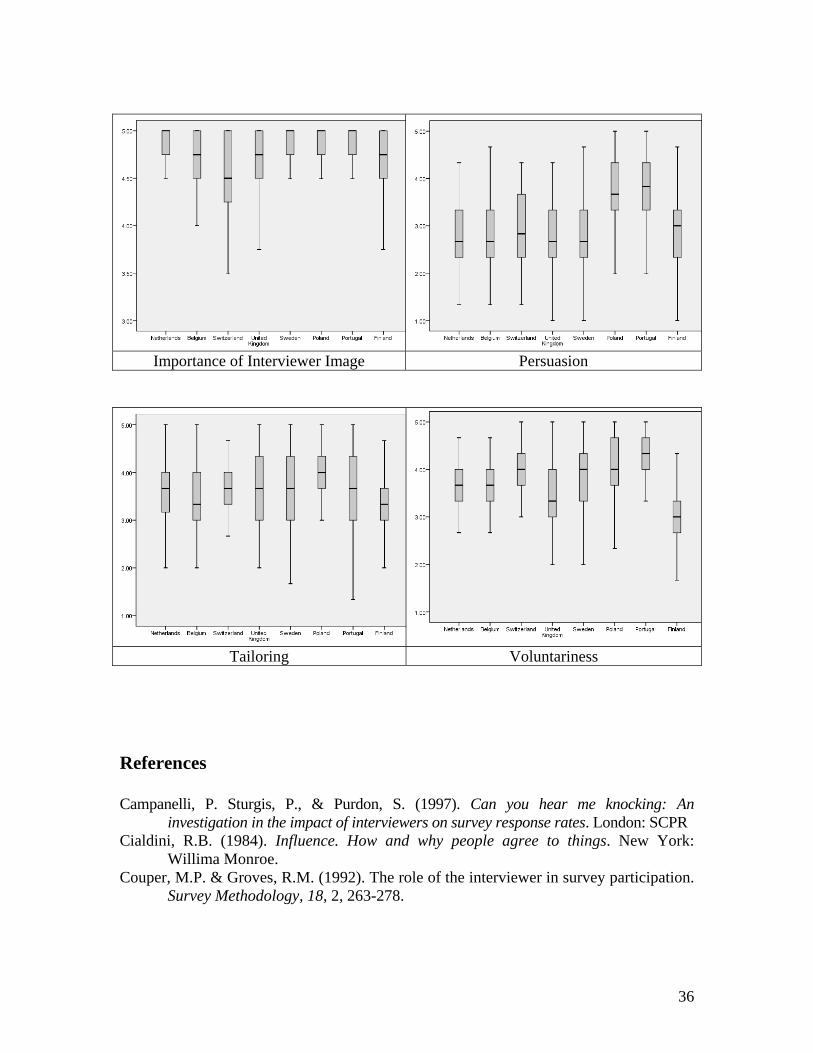
Importance of Interviewer Image Persuasion
Tailoring Voluntariness
References Campanelli, P. Sturgis, P., & Purdon, S. (1997). Can you hear me knocking: An
investigation in the impact of interviewers on survey response rates. London: SCPR Cialdini, R.B. (1984). Influence. How and why people agree to things. New York:
Willima Monroe. Couper, M.P. & Groves, R.M. (1992). The role of the interviewer in survey participation.
Survey Methodology, 18, 2, 263-278.
36
Couper, M.P. & De Leeuw, E.D. (2003). Nonresponse in cross-cultural and cross-national surveys. In: J.A. Harkness, F.J.R. van de Vijver, & P.P. Mohler (eds). Cross-cultural survey methods. New York: Wiley, 157-177.
Groves, R.M., Dillman, D.A., Eltinge, J.L., & Little R.J.A. (Eds). Survey nonresponse. New York: Wiley.
Groves, R.M., & Couper, M.P. (1998). Nonresponse in household interview surveys. New York: Wiley.
Groves, R.M., Cialdini, R.B., & Couper, M.P. (1992). Understanding the decision to participate in a survey. Public Opinion Quarterly, 56, 4, 475-495.
Hox, J.J. & De Leeuw, E.D. (1998). Proposal for an international research project on interviewer-level response. University Utrecht/University of Amsterdam. Presented at the 1997 & 1998 international workshop on household survey nonresponse
Hox, J., de Leeuw, E, and Snijkers, G. (1998). Fighting nonresponse on telephone interviews; successful interviewer tactics. In A. Koch & R. Forst (eds). Nonresponse in survey research. ZUMA Nachrichten, Spezial 4. Manheim, FRG: ZUMA
Hox, J., De Leeuw, E.D., Vorst, H. (1995). Survey participation as reasoned action: A behavioural paradigm for survey nonresponse? BMS, 47, 52-67.
Hox, J., De Leeuw, E.D., Couper, M.P., Groves, R.M., De Heer, W., Kuusela, V., Lehtonen, R., Loosveldt, G., Lundqvist, P., Japec, L., Martin, J., Beertens, R., Michaud, S., Knighton, T., Mohler, P., Sturgis, P., Campanelli, P., Vehovar, V., Zaletel, M., Belak, E. (2002). The influence of interviewers’ attitude and behaviour on household survey nonresponse: An international comparison. In: R.M. Groves, D.A. Dillman, J.L. Eltinge, & R.J.A. Little (Eds). Survey nonresponse. New York: Wiley, pp. 103-120.
Lehtonen, R (1996). Interviewer attitudes and unit nonresponse in two different interview schemes. In. S. Laaksonen (eds). International perspectives on nonresponse: Proceedings of the sixth international workshop on household survey nonresponse. Helsinki: Statistics Finland
De Leeuw, Hox, Snijkers & De Heer (1998). Interviewer opinions, attitudes, and strategies regarding survey participation and their effect on response. In: Achim Koch & Rolf Porst (eds). Nonresponse in survey research. Proceedings of the eight international workshop on household survey nonresponse. ZUMA Nachrichten Spezial # 4. ZUMA-Gesis: Mannheim
Morton-Williams, J. (1993). Interviewer approaches. Aldershot: Darthmout. Pondman, L.M. (1998). The influence of the interviewer on the refusal rate in telephone
surveys. Deventer: Print Partners Ipskamp. Snijkers, G., Hox, J. and De Leeuw, E.D. (1999). Interviewers' tactics for fighting survey
nonresponse. Journal of Official Statistics, 15, 185-198. (also at www.jos.nu) Stoop, I.A.L. (2005) The hunt for the last respondent: Nonresponse in sample surveys.
The Hague: Social and Cultural Planning Office.
37
Appendix A Text master questionnaire (IQUEST-master/2002) Note: Context information about the questions, which is not meant for the interviewer filling in the IQuest, is indicated in red. Some suggestions for additional text (which may or may not be applicable in specific cases) are given in italic. Almost all questions are general. A very few questions are specific for face-to-face or telephone modes. These are marked ‘telephone’ or ‘face-to-face’ in blue.
Name: ......................................................
Interviewer Number .............................................
Date ......... ............. ..............................
INTERVIEWER QUESTIONNAIRE
ON
NONRESPONSE AND RESPONDENT COOPERATION
IN SURVEYS
Dear interviewer, As an experienced interviewer we know that you have gained considerable experience in the course of contacting respondents. In your work in the field you have undoubtedly learned a great deal about respondents’ first reactions when contacted, the questions they ask, and the reasons respondents give when they refuse to co-operate (and when they agree to co-operate). This is very valuable experience and knowledge which is not available in text books. We would like to invite you to share your experiences with us. In this questionnaire we have put together questions that ask about your experiences as an interviewer, your feelings about different field situations and the ways that you personally approach respondents and invite them to participate in a study. The questions are about your experiences in general, not for one particular interview, or one particular survey. Needless to say, this questionnaire is not a test or an evaluation. As a result, there are no ‘right’ or ‘wrong’ answers. Good interviewers differ in the ways they contact respondents
38

and also how they deal with difficult situations; no two interviewers work the same way. We are interested in learning more about the different ways interviewers react and the various ways you and other interviewers behave during a first contact. We very much expect this will tell us more about ways to contact respondents successfully, and will enable us to support and train future interviewers better for their work in the field. [Wherever this is a realistic addition we suggest the following can be added: Please be candid. Your individual responses will not be seen by or discussed with your supervisor or your firm and is in no way related to any evaluation of your work. The results will be reported as statistical totals only.] Most questions can be answered by circling the answer that applies best to you or your situation. In some cases, you may give more than one answer, the instructions indicate clearly when this applies. We also ask some ‘open’ questions. If you need more space for your answer please use the blank ‘comments’ page. Please feel free to use this page to comment on the questionnaire and point out important aspects we have not yet asked about. Most questions are questions about survey introductions in general, some questions are specific for face-to-face or telephone interviews. If a question is really not applicable to your situation, because you have never done telephone surveys, please skip that specific question. All your answers and comments will be treated confidentially. As you can imagine we really look forward to learning more from your answers and to the prospect of having future interviewer training and fieldwork benefit from your input and experience. Thank you [Signed by researchers or interviewer supervisors] [If you have any questions, please feel free to contact Give information about whom to contact here – if applicable, if not, delete]
39

A. INTRODUCTION OF THE SURVEY (STUDY) A1 In general, how do you typically introduce yourself and the survey? This refers to what you generally say and do before the respondent has had a chance to say anything. Please indicate how often you use the following statements. Always Often Sometime Rarely Never 1. I introduce myself 1 2 3 4 5 2. Say on whose behalf I interview (mention agency)
1
2
3
4
5
3f. I immediately show my identification card (face-to-face)
1
2
3
4
5
3t. I immediately say that I am not selling anything (telephone)
1
2
3
4
5
4. I mention the advance letter if one is used
1
2
3
4
5
5. I use a standard introduction for all respondents
1
2
3
4
5
6. I tell them something about the study
1
2
3
4
5
7. I mention the survey (name of survey)
1
2
3
4
5
8. Before every new study I rehearse the introduction, so I can say my things smoothly without hesitation
1
2
3
4
5
9. I vary my introduction depending on the situation
1
2
3
4
5
10. I try to understand why respondents may differ from each other
1
2
3
4
5
11. I adjust my language and the words I use to suit the people I interview
1
2
3
4
5
12t. If I get an answering machine, I leave a message (telephone)
1
2
3
4
5
12f. If nobody is at home, I leave a message (card, letter) (face-to-face)
1
2
3
4
5
13f. If nobody is at home, I ask the neighbours for information (face-to-face)
1
2
3
4
5
40

A2 Before a respondent has made a decision about participating, how often do you say or do something along the lines of the following? (We do not mean the exact, same words given here. What we need to know is how often you say or do something like this (along these lines or with the same intention) Always Often Sometime Rarely Never 1. Say that the topic of the survey will interest them
1
2
3
4
5
2. Say that you are not a salesperson or a fundraiser, etc.
1
2
3
4
5
3. Mention that most people enjoy the interview (like it, find it interesting)
1
2
3
4
5
4. Mention that most people participate
1 2 3 4 5
5. Mention that this is THE opportunity to give their opinion
1
2
3
4
5
6. Explain how the household/person was selected
1
2
3
4
5
7. Mention that they represent other people like themselves
1
2
3
4
5
8. Explain why the study is important
1 2 3 4 5
9. (If possible) point out that the results may be useful or important for the respondent
1
2
3
4
5
10. Mention that the respondent will help YOU greatly by co-operating
1
2
3
4
5
11. Mention topics in the news or in society which can be associated with the topic of the survey
1
2
3
4
5
12. Explain why the survey is done and how the results will be used
1
2
3
4
5
13. Use very practical arguments to indicate why the survey is important
1
2
3
4
5
14. Use really simple language in introduction
1
2
3
4
5
15. Base my arguments on the initial reaction of the respondent
1
2
3
4
5
16. Tell respondent that you are willing to call back later
1
2
3
4
5
17. If interview is short, always say this
1 2 3 4 5
18t. Emphasize the duration positively. (Example: It will ONLY
1
2
3
4
5
41
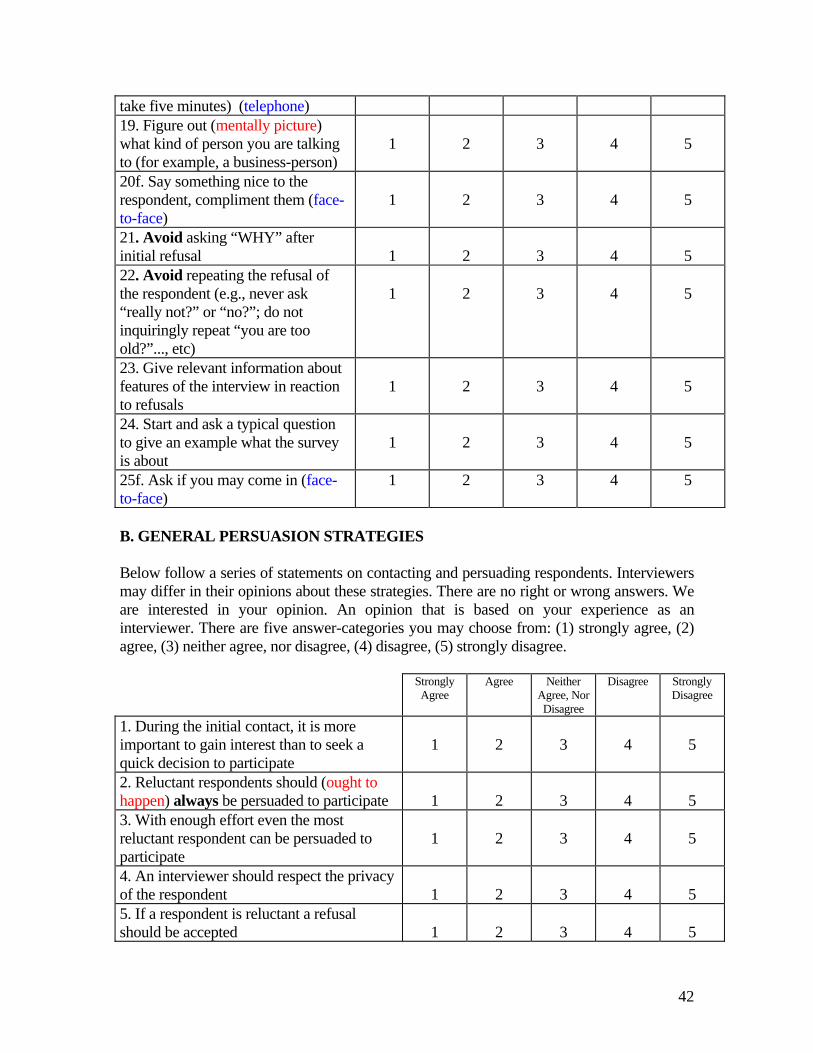
take five minutes) (telephone) 19. Figure out (mentally picture) what kind of person you are talking to (for example, a business-person)
1
2
3
4
5
20f. Say something nice to the respondent, compliment them (face-to-face)
1
2
3
4
5
21. Avoid asking “WHY” after initial refusal
1
2
3
4
5
22. Avoid repeating the refusal of the respondent (e.g., never ask “really not?” or “no?”; do not inquiringly repeat “you are too old?”..., etc)
1
2
3
4
5
23. Give relevant information about features of the interview in reaction to refusals
1
2
3
4
5
24. Start and ask a typical question to give an example what the survey is about
1
2
3
4
5
25f. Ask if you may come in (face-to-face)
1 2 3 4 5
B. GENERAL PERSUASION STRATEGIES Below follow a series of statements on contacting and persuading respondents. Interviewers may differ in their opinions about these strategies. There are no right or wrong answers. We are interested in your opinion. An opinion that is based on your experience as an interviewer. There are five answer-categories you may choose from: (1) strongly agree, (2) agree, (3) neither agree, nor disagree, (4) disagree, (5) strongly disagree. Strongly
Agree Agree Neither
Agree, Nor Disagree
Disagree Strongly Disagree
1. During the initial contact, it is more important to gain interest than to seek a quick decision to participate
1
2
3
4
5
2. Reluctant respondents should (ought to happen) always be persuaded to participate
1
2
3
4
5
3. With enough effort even the most reluctant respondent can be persuaded to participate
1
2
3
4
5
4. An interviewer should respect the privacy of the respondent
1
2
3
4
5
5. If a respondent is reluctant a refusal should be accepted
1
2
3
4
5
42

6. One should always emphasize the voluntary nature of participation
1
2
3
4
5
7. Most respondents can be approached in the same way, in the same manner
1
2
3
4
5
8. If you catch them at just the right time, most people will agree to participate
1
2
3
4
5
9. Every respondent needs an unique approach
1 2 3 4 5
10. Give everyone the feeling that they are the very first respondent, and very special
1
2
3
4
5
11. If a respondent appears likely to refuse, it is better to withdraw and try again at a later moment
1
2
3
4
5
12. An interviewer should always remain herself/himself (should not act out of his/her character)
1
2
3
4
5
13. An interviewer should project a positive image of him/her-self
1
2
3
4
5
14. An interviewer should try to project a friendly image (be audibly or visibly friendly)
1
2
3
4
5
15. Interviewers must convey to the respondents that they can be trusted (It should be clear to respondents that they can trust the interviewer)
1
2
3
4
5
16. Make clear that YOU believe in the study
1 2 3 4 5
43

C. SOME FINAL QUESTIONS C1. Most research organisations pledge to respondents that their individual reports are confidential. Based on your experience as an interviewer: How many respondents do you think believe that their answers are truly confidential? 1. None, or very few 2. A minority 3. About half 4. A majority 5. All, or almost all C2. How often do respondents think at first that you want to sell them something? 1. Never 2. Almost never 3. Rarely 4. Sometimes 5. Frequently 6. Almost always 7. Always C3. How long in total have you worked as an interviewer? (It is not important whether you are part-time or full-time. Please include your present work and work you may have done earlier.) ----------- year(s) ----------- months C4. Are you male or female? 1 Male 2 Female C5. Date of birth: .................. C6. What is your highest educational qualification (schooling): 1 Primary school 2 Secondary vocational or general school 3 Higher vocational or general college 4 University
[Please translate these categories as closely as possible into the categories of your own educational system] C7. How many years of school (full-time education) have you completed in total? ----------- year(s)
44

Thank you very much indeed! We are glad you have shared your experiences with us. We invite you to use the space below for any comments, suggestions, or ideas you want to communicate to us. COMMENTS: [Leave ample space (about one page) below for interviewers to make comments]
45

Appendix B Data Entry Appendix B1 Data entry instructions Appendix B2 contains the definition of an SPSS file for data entry of the interviewer questionnaire. It has variable and value labels in English. Data entry is strait forward. Some additional points for data entry (1) If a question is not used in your version of the questionnaire, please keep the variable IN the file and give it a missing value: for example a telephone question that is not used for face-to-face interviewers (2) Question C3 (total years worked as interviewer. There are TWO variables for this question c3_years and c3_month In c3_years the number of years noted down should be typed in, and in C3_month, the number of months noted down. (3) Question C5 (date of birth). Only the year of birth should be typed in in four digits. For example, 1962: the variable is called C5_year Finally: interviewers often write useful comments on the last page of the questionnaire. In the first stage of the project we only analyze the numerical information. We suggest that after data entry, the interviewer number will be written on the last page with comments, and that ONLY these last pages will be kept. The rest of the interviewer questionnaire with interviewer identifications can then be safely destroyed to ensure interviewer privacy.
46

Appendix B2. SPSS file definition Note an SPSS file with these definitions is available at LINK TO WEBSITE PLACE Name Type Label Values
1 itrnr Numeric interviewer number None 2 a1_1 Numeric introduce {1, always}... 3 a1_2 Numeric mention agency {1, always}... 4 a1_3f Numeric show card ftf {1, always}... 5 a1_3t Numeric not selling tel {1, always}... 6 a1_4 Numeric advance letter {1, always}... 7 a1_5 Numeric standard intro {1, always}... 8 a1_6 Numeric tell about study {1, always}... 9 a1_7 Numeric mention survey {1, always}...
10 a1_8 Numeric rehearse intro {1, always}... 11 a1_9 Numeric vary intro {1, always}... 12 a1_10 Numeric understand resp differ {1, always}... 13 a1_11 Numeric adjust language {1, always}... 14 a1_12t Numeric leave message tel {1, always}... 15 a1_12f Numeric leave message ftf {1, always}... 16 a1_13f Numeric ask neighbours ftf {1, always}... 17 a2_1 Numeric topic interesting {1, always}... 18 a2_2 Numeric not salesperson {1, always}... 19 a2_3 Numeric people enjoy {1, always}... 20 a2_4 Numeric most participate {1, always}... 21 a2_5 Numeric THE opportunity {1, always}... 22 a2_6 Numeric explain selection {1, always}... 23 a2_7 Numeric represent others {1, always}... 24 a2_8 Numeric why important {1, always}... 25 a2_9 Numeric results useful {1, always}... 26 a2_10 Numeric respondent helps YOU {1, always}...
Name Type Label Values
27 a2_11 Numeric topics in news/society {1, always}... 28 a2_12 Numeric why survey done {1, always}... 29 a2_13 Numeric practical arguments {1, always}... 30 a2_14 Numeric simple language {1, always}... 31 a2_15 Numeric base on initial reaction {1, always}... 32 a2_16 Numeric willing to call back {1, always}... 33 a2_17 Numeric say if short {1, always}... 34 a2_18 Numeric duration positively {1, always}...
47

35 a2_19 Numeric mentally picture pers {1, always}... 36 a2_20f Numeric compliment ftf {1, always}... 37 a2_21 Numeric avoid asking why {1, always}... 38 a2_22 Numeric avoid repeating refusal {1, always}... 39 a2_23 Numeric give relevant information {1, always}... 40 a2_24 Numeric start and ask question {1, always}... 41 a2_25f Numeric ask may come in ftf {1, always}... 42 b1 Numeric gain interest {1, strongly agree}... 43 b2 Numeric always persuaded {1, strongly agree}... 44 b3 Numeric enough effort persuade {1, strongly agree}... 45 b4 Numeric respect privacy {1, strongly agree}... 46 b5 Numeric accept refusal {1, strongly agree}... 47 b6 Numeric voluntary nature {1, strongly agree}... 48 b7 Numeric same way & manner {1, strongly agree}... 49 b8 Numeric catch right time {1, strongly agree}... 50 b9 Numeric unique approach {1, strongly agree}... 51 b10 Numeric very first/very special {1, strongly agree}... 52 b11 Numeric witdraw & try later {1, strongly agree}...
Name Type Label Values
53 b12 Numeric remain self {1, strongly agree}... 54 b13 Numeric project positive image {1, strongly agree}... 55 b14 Numeric project friendly image {1, strongly agree}... 56 b15 Numeric to be trusted {1, strongly agree}... 57 b16 Numeric believe in study {1, strongly agree}... 58 c1 Numeric resp believe confidential {1, none or few}... 59 c2 Numeric resp think selling {1, never}... 60 c3_years Numeric years worked None 61 c3_month Numeric additional months worked None 62 c4 Numeric sex {1, male}... 63 c5_year Numeric YEAR of birth None 64 c6 Numeric educational level {1, primary school}... 65 c7 Numeric years completed schooling None
48

Appendix B3 Data recodes & scales syntax (Variable names as in SPSS file template) COMPUTE ar1_1=a1_1. COMPUTE ar1_2=a1_2. COMPUTE ar1_3f=a1_3f. COMPUTE ar1_3t=a1_3t. COMPUTE ar1_4=a1_4. COMPUTE ar1_5=a1_5. COMPUTE ar1_6=a1_6. COMPUTE ar1_7=a1_7. COMPUTE ar1_8=a1_8. COMPUTE ar1_9=a1_9. COMPUTE ar1_10=a1_10. COMPUTE ar1_11=a1_11. COMPUTE ar1_12t=a1_12t. COMPUTE ar1_12f=a1_12f. COMPUTE ar1_13f=a1_13f. COMPUTE ar2_1=a2_1. COMPUTE ar2_2=a2_2. COMPUTE ar2_3=a2_3. COMPUTE ar2_4=a2_4. COMPUTE ar2_5=a2_5. COMPUTE ar2_6=a2_6. COMPUTE ar2_7=a2_7. COMPUTE ar2_8=a2_8. COMPUTE ar2_9=a2_9. COMPUTE ar2_10=a2_10. COMPUTE ar2_11=a2_11. COMPUTE ar2_12=a2_12. COMPUTE ar2_13=a2_13. COMPUTE ar2_14=a2_14. COMPUTE ar2_15=a2_15. COMPUTE ar2_16=a2_16. COMPUTE ar2_17=a2_17. COMPUTE ar2_18t=a2_18t. COMPUTE ar2_19=a2_19. COMPUTE ar2_20f=a2_20f. COMPUTE ar2_21=a2_21. COMPUTE ar2_22=a2_22. COMPUTE ar2_23=a2_23. COMPUTE ar2_24=a2_24. COMPUTE ar2_25f=a2_25f. COMPUTE br1=b1. COMPUTE br2=b2. COMPUTE br3=b3. COMPUTE br4=b4. COMPUTE br5=b5. COMPUTE br6=b6. COMPUTE br7=b7. COMPUTE br8=b8.
49

COMPUTE br9=b9. COMPUTE br10=b10. COMPUTE br11=b11. COMPUTE br12=b12. COMPUTE br13=b13. COMPUTE br14=b14. COMPUTE br15=b15. COMPUTE br16=b16. RECODE ar1_1 ar1_2 ar1_3f ar1_3t ar1_4 ar1_6 ar1_7 ar1_8 ar1_9 ar1_10 ar1_11 ar1_12f ar1_12t ar1_13f ar2_1 ar2_2 ar2_3 ar2_4 ar2_5 ar2_6 ar2_7 ar2_8 ar2_9 ar2_10 ar2_11 ar2_12 ar2_13 ar2_14 ar2_15 ar2_16 ar2_17 ar2_18t ar2_19 ar2_20f ar2_21 ar2_22 ar2_23 ar2_24 ar2_25f br1 br2 br3 br4 br5 br6 br8 br9 br10 br11 br12 br13 br14 br15 br16 (1=5) (2=4) (3=3) (4=2) (5=1). COMPUTE selling=mean.7(ar2_5,ar2_6,ar2_7,ar2_8,ar2_9,ar2_11,ar2_12,ar2_13,ar2_24). COMPUTE socval=mean.4(ar2_1,ar2_2,ar2_3,ar2_4,ar2_10). COMPUTE tailint=mean.3(ar1_4,ar1_5,ar1_9). COMPUTE startint=mean.3(ar1_1,ar1_2,ar1_7). COMPUTE reluct=mean.3(ar2_21,ar2_22,ar2_23). COMPUTE respor=mean.4(ar1_10,ar1_11,ar2_14,ar2_15,ar2_19). COMPUTE itrimag=mean.4(br13,br14,br15,br16). COMPUTE persuas=mean.3(br2,br3,br8). COMPUTE tailor=mean.3(br7,br9,br10). COMPUTE volunt=mean.3(br4,br5,br6). EXECUTE.
50

Discussion Paper Series
Mannheim Research Institute for the Economics of Aging, Universität Mannheim
To order copies, please direct your request to the author of the title in question. Nr. Autoren Titel Jahr 190-09 Martin Gasche Implizite Besteuerung im deutschen
Sozialversicherungssystem 09
191-09 Alexander Ludwig, Alexander Zimper
Biased Bayesian learning and the risk-free rate puzzle
09
192-09 Tabea Bucher-Koenen
Financial Literacy and Private Old-age Provision in Germany – Evidence from SAVE 2008 –
09
193-09 Axel Börsch-Supan, Martin Gasche, Michael Ziegelmeyer
Auswirkungen der Finanzkrise auf die private Altersvorsorge
09
194-09 Wolfgang Kuhle The Optimum Structure for Government Debt 09
195-09 Michela Coppola, Anette Reil-Held
Dynamik der Riester-Rente: Ergebnisse aus SAVE 2003 bis 2008
09
196-10 Alexander Ludwig, Thomas Schelkle, Edgar Vogel
Demographic Change, Human Capital and Welfare
10
197-10 Axel Börsch-Supan, Martin Gasche
Zur Sinnhaftigkeit der Riester-Rente
10
198-10 Martin Gasche, Michael Ziegelmeyer
Verbreitung der Riester-Rente – Hat die Finanz- und Wirtschaftskrise Spuren hinterlassen?
10
199-10 Martin Gasche Rentenanpassung 2010 – Wem nützt die Rentengarantie?
10
200-10 Daniel Kemptner, Hendrik Jürges, Steffen Reinhold
Changes in Compulsory Schooling and the Causal Effect of Education on Health: Evidence from Germany
10
201-10 Axel Börsch-Supan, Martin Gasche
Kann die Riester-Rente die Rentenlücke in der gesetzlichen Rente schließen?
10
202-10 Annelies G. Blom, Edith D. de Leeuw, Joop J. Hox
Interviewer Effects on Nonresponse in the European Social Survey
10