rev. 1 2009 waterbury compliance oil test report
TRANSCRIPT
Air Tox Environmental Company, Inc. 479 Tolland Turnpike ♦ P.O. Box 239 Willington, Connecticut 06279 ♦ 860-487-5606 ♦ Fax 860-487-5607
www.airtoxenviro.com ♦ email: [email protected]
September 22, 2009 Cynthia Vodopivec Environmental, Health and Safety Manager FirstLight Power Resources Services, LLC 20 Church Street Hartford, Connecticut 06103 RE: 2009 Waterbury Compliance Oil Test Results Dear Cynthia, Enclosed please find two (2) copies of the Waterbury Compliance Oil Test Report with results while firing ULSK in August 2009. Please do not hesitate to call if you have any questions or comments. Best Regards, Air Tox Environmental Company, Inc.
Bethany Thienel Project Manager Enclosures: (2)


479 Tolland Turnpike ♦ P.O. Box 239 Willington, Connecticut 06279 ♦ 860-487-5606 ♦ Fax 860-487-5607 www.airtoxenviro.com ♦ email: [email protected]
TEST REPORT GE LMS100 PA Simple Cycle Combustion Turbine Compliance Demonstration Emission Test Program (ULSK) PREPARED FOR: WATERBURY GENERATION, LLC
160 Washington Avenue Waterbury, CT 06708 c/o FirstLight Power Resources Services, LLC 20 Church Street, Hartford, CT 06103
Contact Name: Cynthia Vodopivec, Environmental Health and Safety Manager First Light Power Resources Services, LLC
Contact No. (860) 895-6961 PREPARED BY: AIR TOX ENVIRONMENTAL COMPANY, INC. 479 Tolland Turnpike Willington, Connecticut 06279 Contact Name: Bethany Thienel Project Manager Contact No. (860) 487-5606 ext. 105 Air Tox Project No. 9020 September 2009

Air Tox Environmental Company, Inc. Page No. i Project No. 9020 - Waterbury Generation, LLC Compliance ULSK Test Program
Table of Contents 1.0 INTRODUCTION ................................................................................................................... 1 2.0 SUMMARY OF RESULTS .................................................................................................... 2 2.1 Sampling Program............................................................................................................ 2 2.2 Emission Limits................................................................................................................ 3 2.3 Criteria Pollutant Sampling ............................................................................................. 4 2.3.1 NOX and CO Emission Measurements .................................................................. 4 2.3.2 VOC Emission Measurements……………………………………………………5 2.3.3 Particulate Matter and Sulfuric Acid Emission Measurements…………………..5 2.4 HAPs Sampling ................................................................................................................ 6 2.4.1 Ammonia Emission Measurements………………………………………………6 2.4.2 Formaldehyde Emission Measurements ................................................................ 6 2.4.3 Benzene and 1,3 Butadiene Emission Measurements……………………………7 2.4.4 Polynuclear Aromatic Hydrocarbon Emission Measurements…………………...8 2.4.5 Metals Emission Measurements………………………………………………....9 3.0 PROCESS AND OPERATIONS……………………………………………………………10 3.1 Facility Description…………………………………………………………………….10 3.2 Facility CEMS Description…………………………………………………………….10 4.0 REFERENCE METHOD SAMPLING & ANALYTICAL METHODOLOGY…………...12 4.1 Reference Method Sampling System…………………………………………………..12 4.2 Analyzer Calibrations…………………………………………………………………..12 4.3 Ammonia Emission Measurement by ASTM D6348…………………………………..14 4.4 Manual Emission Measurements………………………………………………………17 4.4.1 Stack Gas Molecular Weight Determination……………………………………17 4.4.2 Stack Gas Moisture Content Measurement……………………………………..17 4.4.3 Volumetric Flow Measurement…………………………………………………17 4.4.4 Particulate Matter Measurement………………………………………………...19 4.4.5 Formaldehyde Measurement…………………………………………………….22 4.4.6 PAH Measurement………………………………………………………………24 4.4.7 Sulfuric Acid Measurement……………………………………………………..27 4.4.8 Benzene and 1,3 Butadiene Measurement………………………………………29 4.4.9 Metals Measurement…………………………………………………………….29 5.0 QUALITY ASSURANCE ..................................................................................................... 30

Air Tox Environmental Company, Inc. Page No. ii Project No. 9020 - Waterbury Generation, LLC Compliance ULSK Test Program
List of Tables Table 2-1 Sampling Parameters & Methodology While Firing ULSK ......................................... 2 Table 2-2 Allowable Emissions While Firng Natural ULSK ........................................................ 3 Table 2-3 Compliance NOX, CO, VOC and NH3 Results………………………………………..4 Table 2-4 Compliance Particulate Matter and Sulfuric Acid Results…………………………….5 Table 2-5 Compliance Formaldehyde Results............................................................................... 6 Table 2-6 Compliance Benzene and 1,3 Butadiene Results .......................................................... 7 Table 2-7 Compliance Polynuclear Aromatic Hydrocarbon Results……………………………..8 Table 2-8 Compliance ULSK Fuel Sample: Metals Results…………………………………….9 Table 4-1 Reference Method Sampling System………………………………………………...12
List of Figures Figure 4-1 Gaseous Reference Method Sampling Schematic…………………………………..13 Figure 4-2 FTIR Sampling Schematic…………………………………………………………..16 Figure 4-3 RM and Manual Method Sampling Port Location Schematic ................................... 18 Figure 4-4 Particulate Matter Sampling Schematic.................................................................... .21 Figure 4-5 CARB Method 430M Formaldehyde Sampling Schematic....................................... 23 Figure 4-6 PAH Sampling Schematic.......................................................................................... 26 Figure 4-7 Sulfuric Acid Sampling Schematic………………………………………………….28
Appendix
Field Data Sheets ...........................................................................................................Appendix A Results Summary Sheets................................................................................................Appendix B Analytical Laboratory Results .......................................................................................Appendix C Equipment Calibration Data Sheets ...............................................................................Appendix D Calibration Gas Cylinder Certifications ....................................................................... Appendix E Process Data Sheets……………………………………………………………………Appendix F
Air Tox Environmental Company, Inc. Page No. 1 Project No. 9020 - Waterbury Generation, LLC Compliance ULSK Test Program
1.0 INTRODUCTION Air Tox Environmental Company, Inc. (Air Tox) of Willington, CT was retained by FirstLight Power Resources Services, LLC to perform compliance testing for the Waterbury Generation facility in Waterbury, CT. This facility is addressed in the Connecticut Department of Environmental Protection (CT DEP) Permit No. 0300 (Town No. 192, Premises No. 0005). The purpose of this compliance test program was to determine facility stack emissions while firing ultra-low sulfur kerosene (ULSK) for the recently-installed General Electric LMS 100 PA simple cycle combustion turbine. The GE LMS 100 PA turbine generates a nominal capacity of 96 megawatts (MW) of power firing ULSK and highly efficient control equipment. Below is a summary of the compliance testing parameters Air Tox performed for the facility while firing ULSK:
• Nitrogen oxide (NOX) emissions • Carbon monoxide (CO) emissions • Volatile organic compound (VOC) emissions • Particulate Matter (PM) total filterable portion only, as defined in Part
V.B.1 of the NSR permit 192-0030 • Polynuclear Aromatic Hydrocarbons (PAHs) • Sulfuric Acid emissions • Hazardous air pollutants (HAPs) as defined in Part V.B.2 of the NSR
permit 192-0030 The diagnostic test program was conducted during the week of August 7-8, 2009. The test program was performed under the supervision of Mr. Eric Dithrich, Senior Environmental Engineer of Air Tox. Field operations during the performance of this test program were completed with the assistance of Jason Ward, Environmental Engineer, Bethany Thienel, Project Manager, and Matthew Martunas, Assistant Project Manager, all of Air Tox. Also assisting were Air Tox Environmental Technicians Dominik Grzywacz, Andrew Warren, Zachary Hill and Michael Pomykala. Mr. Timothy McCandless, site manager at Waterbury Generation, LLC coordinated the process and operations prior to and throughout the test program. Mr. Mark Spiro, Air Pollution Control Engineer of the CT DEP was present both days to witness the test program. Mr. John DeGirolamo of the CT DEP was present August 7, 2009 to conduct an inspection of the facility Continuous Opacity Monitoring System. Section 2.0 of this compliance test report presents the results of the sampling program. A description of the facility process and operations is presented in Section 3.0. Sampling and analytical methodologies, including sampling trains, are presented in Section 4.0. The Air Tox Quality Assurance Plan is detailed in Section 5.0.

Air Tox Environmental Company, Inc. Page No. 2 Project No. 9020 - Waterbury Generation, LLC Compliance ULSK Test Program
2.0 SUMMARY OF RESULTS All sampling and analyses performed during this test program were carried out in accordance with the requirements of the Connecticut DEP and the United States Environmental Protection Agency (US EPA). Testing was based on the requirements outlined in the CT DEP-issued NSR permit (No. 192-0030). A detailed summary of the test methodology is presented below. 2.1 Sampling Program Emission measurements were performed at the turbine exhaust stack sampling location for the parameters listed below in Tables 2-1, in accordance with the respective test methodologies while the unit operated above 90% of base load while firing ULSK on August 7 and 8, 2009. All emissions data in this report is presented as the average of triplicate test runs for compliance comparison with the permit emission rate limits.
TABLE 2-1
SAMPLING PARAMETERS & METHODOLOGY WHILE FIRING ULSK
EMISSION PARAMETER REFERENCE METHODOLOGY Volumetric Flow Rate (SCFM) EPA Reference Methods 1 & 2 Diluent (O2 & CO2) Emissions Analysis EPA Reference Method 3A Moisture (H2O) EPA Reference Method 4 & ASTM D6348 Oxides of Nitrogen (NOX) EPA Reference Method 7E Carbon Monoxide (CO) EPA Reference Method 10 Volatile Organic Compounds (VOC) EPA Reference Method 25A Ammonia (NH3) ASTM D6348 Particulate Matter (filterable only) EPA Reference Method 5 Sulfuric Acid (H2SO4) EPA Reference Method 8 Formaldehyde (HCOH) CARB 430M Polynuclear Aromatic Hydrocarbons (PAH) SW 846-0010 1,3 Butadiene(C4H6) & Benzene (C6H6) Modified EPA Reference Method 18
Air Tox Environmental Company, Inc. Page No. 3 Project No. 9020 - Waterbury Generation, LLC Compliance ULSK Test Program
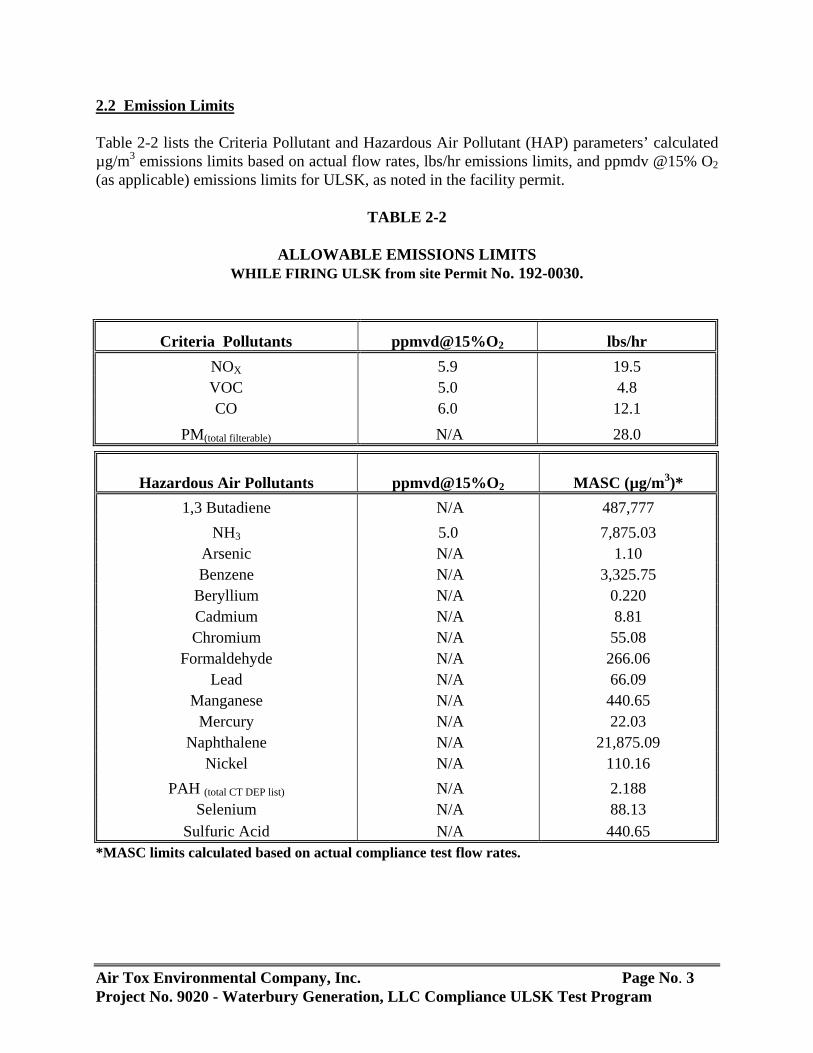
2.2 Emission Limits Table 2-2 lists the Criteria Pollutant and Hazardous Air Pollutant (HAP) parameters’ calculated µg/m3 emissions limits based on actual flow rates, lbs/hr emissions limits, and ppmdv @15% O2 (as applicable) emissions limits for ULSK, as noted in the facility permit.
TABLE 2-2
ALLOWABLE EMISSIONS LIMITS WHILE FIRING ULSK from site Permit No. 192-0030.
Criteria Pollutants ppmvd@15%O2 lbs/hr NOX 5.9 19.5 VOC 5.0 4.8 CO 6.0 12.1
PM(total filterable) N/A 28.0
*MASC limits calculated based on actual compliance test flow rates.
Hazardous Air Pollutants ppmvd@15%O2 MASC (µg/m3)*
1,3 Butadiene N/A 487,777 NH3 5.0 7,875.03
Arsenic N/A 1.10 Benzene N/A 3,325.75
Beryllium N/A 0.220 Cadmium N/A 8.81 Chromium N/A 55.08
Formaldehyde N/A 266.06 Lead N/A 66.09
Manganese N/A 440.65 Mercury N/A 22.03
Naphthalene N/A 21,875.09 Nickel N/A 110.16
PAH (total CT DEP list) N/A 2.188 Selenium N/A 88.13
Sulfuric Acid N/A 440.65

Air Tox Environmental Company, Inc. Page No. 4 Project No. 9020 - Waterbury Generation, LLC Compliance ULSK Test Program
2.3 Criteria Pollutant Emission Measurements Methods 1, 2, and 4 were utilized for the turbine sampling to calculate the NOX, CO, and VOC emission concentrations in parts per million volume dry (ppmvd) corrected to 15 percent oxygen (O2). These methods were also utilized for the turbine sampling to calculate the NOX, CO, VOC, and PM emission rates in pounds per hour (lbs/hr). ASTM Method D6348 was used to measure NH3 emissions concentrations and percent moisture to calculate NH3 emissions rates. Triplicate (3) test runs were performed to demonstrate compliance with permitted emission limits for NOX, CO, VOC, and NH3 while the turbine operated at greater than 90% load firing ULSK. Results of the August 7, 2009 testing are presented below in Table 2-3.
Table 2-3 Compliance NOx, CO, VOC and NH3 Results
Waterbury Generation, LLC Gas Turbine at 90% Load Firing ULSK
August 7, 2009
CONSTIUENT UNITS Test Run No. 1
Test Run No. 2
Test Run No. 3 Average Limit
Time - 10:00-10:59 11:07-12:06 12:15-13:14 Power Output MW 93.3 93.2 93.3 93.3
Fuel Flow Gal/hr 5976 5977 5981 5978 O2dry % 13.1 13.1 13.1 13.1
CO2dry %dv 5.9 5.9 5.9 5.9 NOx ppm@15%O2 5.2 5.2 5.2 5.2 5.9 NOx lbs/hr 17.71 18.0 17.9 17.9 19.5 NH3 ppm@15%O2 2.9 2.8 2.7 2.8 5.0 NH3 ug/m3 1419.82 1370.86 1321.91 1370.86 7875.03 NH3 lbs/hr 1.36 1.32 1.30 1.3 6.11
CO ppm@15%O2 0.2 0.1 0.2 0.2 6.0 CO lbs/hr 0.37 0.28 0.51 0.4 12.1
VOC ppm@15%O2 0.0 0.0 0.0 0.0 5.0 VOC lbs/hr 0.0 0.0 0.0 0.0 4.8
2.3.1 NOx and CO Emission Measurements Three (3) one-hour test runs were performed for NOX and CO in accordance with 40 CFR 60 Appendix A, Reference Methods 7E and 10. Sampling was performed on the turbine’s exhaust stack while firing ULSK, while the facility operated the turbine at greater than 90% load on August 7, 2009.

Air Tox Environmental Company, Inc. Page No. 5 Project No. 9020 - Waterbury Generation, LLC Compliance ULSK Test Program
2.3.2 VOC Emission Measurements Three (3) one-hour test runs were performed for VOCs in accordance with 40 CFR 60 Appendix A, Reference Method 25A. Sampling was performed on the turbine’s exhaust stack while firing ULSK, while the facility operated the turbine at greater than 90% load on August 7, 2009. 2.3.3 Particulate Matter and Sulfuric Acid Emission Measurements Three (3) one-hour test runs were performed for particulate matter and sulfuric acid in accordance with 40 CFR 60 Appendix A, Reference Methods 5 & 8 in a combined-method sampling train. Sampling was performed on the turbine’s exhaust stack while firing ULSK, as the facility operated the turbine at greater than 90% load on August 8, 2009. The three particulate matter samples were analyzed and emissions results were calculated in terms of pounds per hour (lbs/hr). The average particulate matter emission rate for the compliance testing was determined to be 6.93 lbs/hr for particulate matter, which falls within the current permit limit of 28.0 lbs/hr for the total filterable portion. The average sulfuric acid emission rate was determined to be 80.4 µg/m3; the calculated sulfuric acid MASC limit for this test program is 440.65µg/m3. These August 8, 2009 compliance test results are summarized in Table 2-4.
Table 2-4 Compliance Particulate Matter and Sulfuric Acid results
Waterbury Generation, LLC Gas Turbine at 90% Load Firing ULSK
August 8, 2009
TEST NUMBER: 1 2 3 TIME :
UNITS 08:23-09:41 10:39-11:54 12:31-13:47
AVERAGE
SAMPLE CONDITIONS Meter Volume Vmstd dscf 34.1 35.3 34.7 34.7 Isokinesis I % 94.3 95.6 96.5 95.5 Total Particulate Catch PMt mg 6.1 5.3 5.2 5.5 STACK CONDITIONS Stack Gas Flowrate Qsd dscf/min 326,420 334,360 324,870 328,550 Average Stack Temperature Ts °F 815.3 817.6 818.4 817.1 O2 in Stack Gas O2 % 13.2 13.2 13.2 13.2 CO2 in Stack Gas CO2 % 5.7 5.7 5.7 5.7 EMISSION RATES Limit Average Particulate Emission Rate 28.0 lb/hr 7.73 6.63 6.44 6.93
Sulfuric Acid Emission Rate 440.65 µg/m3 82.9 79.5 78.9 80.4
2.4 HAPs Sampling
Air Tox Environmental Company, Inc. Page No. 6 Project No. 9020 - Waterbury Generation, LLC Compliance ULSK Test Program
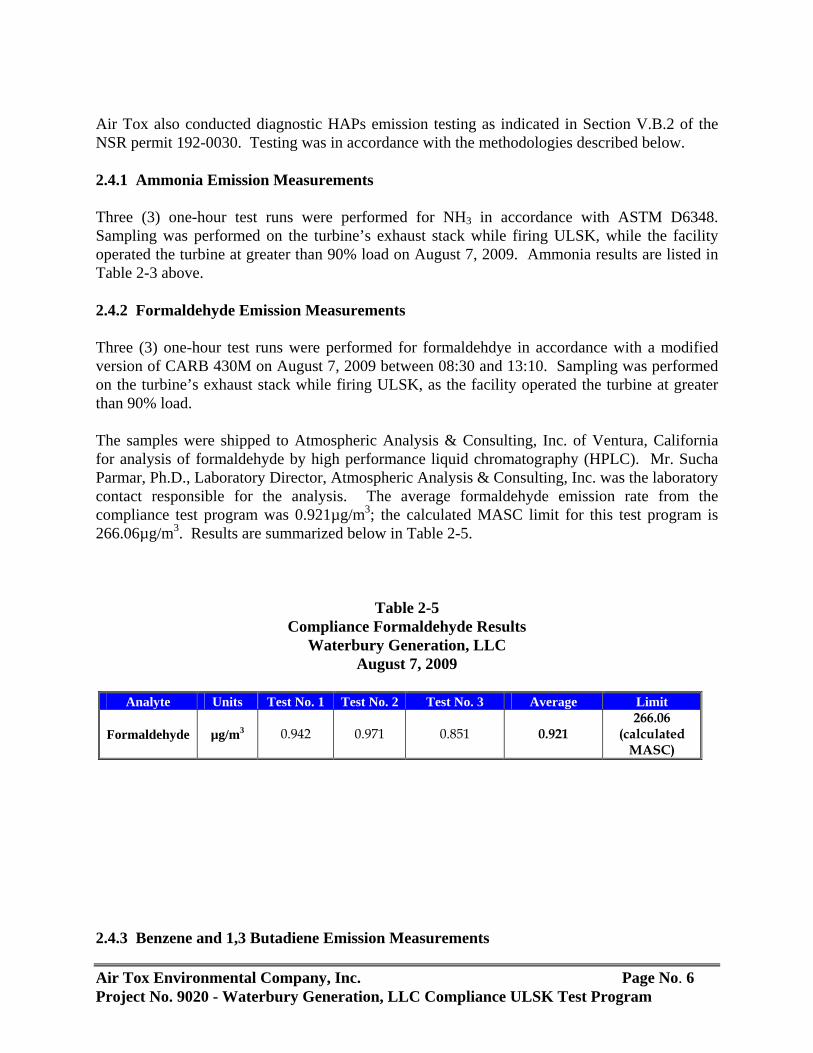
Air Tox also conducted diagnostic HAPs emission testing as indicated in Section V.B.2 of the NSR permit 192-0030. Testing was in accordance with the methodologies described below. 2.4.1 Ammonia Emission Measurements Three (3) one-hour test runs were performed for NH3 in accordance with ASTM D6348. Sampling was performed on the turbine’s exhaust stack while firing ULSK, while the facility operated the turbine at greater than 90% load on August 7, 2009. Ammonia results are listed in Table 2-3 above. 2.4.2 Formaldehyde Emission Measurements Three (3) one-hour test runs were performed for formaldehdye in accordance with a modified version of CARB 430M on August 7, 2009 between 08:30 and 13:10. Sampling was performed on the turbine’s exhaust stack while firing ULSK, as the facility operated the turbine at greater than 90% load. The samples were shipped to Atmospheric Analysis & Consulting, Inc. of Ventura, California for analysis of formaldehyde by high performance liquid chromatography (HPLC). Mr. Sucha Parmar, Ph.D., Laboratory Director, Atmospheric Analysis & Consulting, Inc. was the laboratory contact responsible for the analysis. The average formaldehyde emission rate from the compliance test program was 0.921µg/m3; the calculated MASC limit for this test program is 266.06µg/m3. Results are summarized below in Table 2-5.
Table 2-5 Compliance Formaldehyde Results
Waterbury Generation, LLC August 7, 2009
Analyte Units Test No. 1 Test No. 2 Test No. 3 Average Limit
Formaldehyde
µg/m3
0.942 0.971 0.851 0.921 266.06
(calculated MASC)
2.4.3 Benzene and 1,3 Butadiene Emission Measurements

Air Tox Environmental Company, Inc. Page No. 7 Project No. 9020 - Waterbury Generation, LLC Compliance ULSK Test Program
Three (3) one-hour test runs were performed for Benzene and 1,3 Butadiene in accordance with a modified version of modified EPA Reference Method 18 on August 7, 2009 between 08:30 and 13:10. Sampling was performed on the turbine’s exhaust stack while firing ULSK and while the facility operated the turbine at greater than 90% load. The samples were shipped to Maxxam Analytics, Inc. of Mississauga, Ontario for analysis of benzene and 1,3 butadiene by gas chromatography (GC). Clayton Johnson, Project Manager, Maxxam Analytics, Inc. was the laboratory contact responsible for the analysis. The benzene samples’ emission measurements were calculated based on the detection limits adjusted per sample and based on the required dilution for the impinger catch/condensate samples. The detection limit used for the benzene charcoal tubes was 2.0µg/sample. The detection limit used for the 1,3 butadiene condensate samples was 6 µg/L; the detection limit used for the 1,3 butadiene charcoal tubes was 0.0010 mg/sample. Calculating a benzene MASC value for this compliance testing results in a MASC limit of 3325.571µg/m3; the average emissions rate for benzene was 27.5µg/m3. Calculating a 1,3 butadiene MASC value for this compliance testing results in a MASC limit of 4.88E+05 µg/m3; the average emissions rate for 1,3 butadiene was 440µg/m3. Note than many of the results were ‘non-detect’ or fell below the analytical detection limit. Results are summarized below in Table 2-6.
Table 2-6 Compliance Benzene and 1,3 Butadiene Results
Waterbury Generation, LLC August 7, 2009
Analyte Units Test No. 1 Test No. 2 Test No. 3 Average Limit
Benzene
µg/m3
27.8 29.4 25.1 27.5 3325.75
(calculated MASC)
1,3 Butadiene
µg/m3
499 382 439 440 4.88E+05
(calculated MASC)
2.4.4 Polynuclear Aromatic Hydrocarbons (PAH) Emission Measurements

Air Tox Environmental Company, Inc. Page No. 8 Project No. 9020 - Waterbury Generation, LLC Compliance ULSK Test Program
Three (3) two-hour test runs were performed for PAHs in accordance with SW 846 method 0010. Sampling was performed on the turbine’s exhaust stack while firing ULSD and while the facility operated the turbine at greater than 90% load on August 7, 2009. The PAH samples were analyzed and calculated in terms of micrograms per cubic meter (µg/m3) for naphthalene and PAHtotal. The average naphthalene emission rate was determined to be 0.042µg/m3. The calculated naphthalene MASC for this compliance test program is 21,875.09µg/m3. The average PAHtotal emission rate was determined to be 0.262 µg/m3. The calculated PAHtotal MASC for this diagnostic test program is 2.188µg/m3. Note than the results for many of the parameters were ‘non-detect’ or fell below the analytical detection limit. Results are summarized below in Table 2-7.
Table 2-7 Compliance Polynuclear Aromatic Hydrocarbon Results
Waterbury Generation, LLC Gas Turbine at 90% Load Firing ULSK
August 7, 2009
TEST NUMBER: 1 2 3 TIME :
UNITS 8:31-10:52 11:29-13:54 14:30-16:45
AVERAGE
SAMPLE CONDITIONS Meter Volume Vmstd dscf 64.31 64.74 61.91 63.65 Isokinesis I % 97.3 96.9 99.1 97.8 Total Naphthalene µg 0.2085 0.1892 0.1986 0.1988 PAHTOTAL µg 0.9933 1.2608 1.4312 1.2284
STACK CONDITIONS Stack Gas Flowrate Qsd dscf/min 326,214 329,586 308,280 321,360 Average Stack Temperature Ts °F 821 822 822 822 O2 in Stack Gas O2 % 13.2 13.2 13.2 13.2 CO2 in Stack Gas CO2 % 5.7 5.7 5.7 5.7
EMISSION RATES Limit Average
Naphthalene Emission Rate 21,875.09 µg/m3 0.044 0.040 0.042 0.042
PAHTOTAL Emission Rate 2.188 µg/m3 0.209 0.263 0.312 0.262
2.4.4 Metals Emission Measurement

Air Tox Environmental Company, Inc. Page No. 9 Project No. 9020 - Waterbury Generation, LLC Compliance ULSK Test Program
An approximately 500 ml ULSK fuel sample was taken from the fuel oil storage tank during the ULSK compliance test program, and was sent to the Mt. Tom Generation Company, LLC Analytical Laboratory, located in West Springfield, MA. Madhu P. Shah was the laboratory contact responsible for handling the sample and reporting the results. Note than results for most metal parameters fall below the analytical detection limit. Results were reported in ppb and are converted to µg/m3 using the 10 ppb analytical detection limit (except for Be, which was analyzed separately, and reported at the lower detection limit of 5 ppb) and the actual gallons of fuel flow for a representative sampling timeframe (the 8/8/09 Particulate Matter and Sulfuric Acid sampling). Calculated MASC values are shown based on the results of the compliance test program. Results are summarized below in Table 2-8.
Table 2-8 Compliance ULSK Fuel Sample: Metals Results
Waterbury Generation, LLC
ULSK Fuel Sample:
Metals ppb (µg/m3) MASC (µg/m3)
Arsenic < 10 0.326 1.10 Beryllium < 5 0.163 0.220 Cadmium < 10 0.326 8.81 Chromium 14.4 0.469 55.08
Lead < 10 0.326 66.09 Manganese 52.7 1.716 440.65
Mercury < 10 0.326 22.03 Nickel 13.6 0.443 110.16
Selenium < 10 0.326 88.13 3.0 PROCESS AND OPERATIONS

Air Tox Environmental Company, Inc. Page No. 10 Project No. 9020 - Waterbury Generation, LLC Compliance ULSK Test Program
Waterbury Generation, LLC operates a simple cycle combustion turbine, electricity-generating unit rated at approximately 96 MW. The facility is called the Waterbury Generation Station, or WatGen, the emissions stack designation is Stack No. 4, and the emissions unit designation is Unit 10. The maximum gross heat input of the dual-fuel operating turbine is 886.5 MMBtu/hr on gas and 802.4 MMBtu/hr on ULSK fuel. 3.1 Facility Description The facility consists of a General Electric model LMS 100 PA turbine generator capable of firing either pipeline natural gas or ULSK fuel. The unit is equipped with water injection for controlling NOx emissions, as well as SCR and an oxidation catalyst. The unit is capable of burning either natural gas or ultra low sulfur kerosene (ULSK) fuel. Continuous emissions monitoring are performed for the unit utilizing test ports on the exhaust stack. NOx emissions are controlled by selective catalytic reduction (SCR) employing 19% aqueous ammonia (NH3), and carbon monoxide (CO) emissions are controlled by a CO catalyst. Water is injected at the turbine inlet to effect evaporative cooling and to increase thermal efficiency. In addition, water injected into the combustion zone also assists in the reduction of NOx emissions. Pollutant emissions from the turbine operations, including startup and shutdown, are monitored by the CEMS. Pollutant emissions to be monitored by the CEMS include opacity, NOx, CO, CO2, and NH3. 3.2 Facility CEMS Description The Waterbury Generation, LLC facility CEMS used for determining the outlet emissions is based on the sample extraction technique. The CEMS utilizes a dual-range Thermo Model 42i LS NOx analyzer for NOx emissions, a Thermo Model 42i LS NOX analyzer with a NH3 converter for NH3 emissions, a Model 48i for CO measurements, and a Model 410i for CO2 measurements; the Thermo analyzers are manufactured by Thermo Environmental Instruments (TEI) of Franklin, MA. In addition to the CEMS, the opacity is measured using a Land Instruments 4500mkII+ for the continuous opacity monitoring system (COMS). The data acquisition and system control is handled by a combination of components, including an I/O data controller, a PC with CEMView software data buffer, and a main PC located in the facility control room with the CEMView software installed. The CEMView software is a product of Nexus Solutions of London, Ontario. The main PC has Cartwright reporting software installed to generate quarterly XML emissions and QA data reports for submittal to the US EPA. As part of the sample extraction and control, an M&C model SP200-H sampling probe, NH3 converter, O’Brien heated sample line, and M&C compressor sample cooler is utilized. The CEMS sample port and RM sample ports are located on the exhaust stack platform, and are approximately 105 feet above grade. The CEMS Data Acquisition and Reporting is controlled by a Data Acquisition and Handling System (DAHS). The DAHS provides automated data monitoring and management capabilities to the CEMS using Nexus Solutions CEMView with Cartwright software for generating quarterly XML emissions and QA reports according to 40 CFR 75 on a Windows platform.
Air Tox Environmental Company, Inc. Page No. 11 Project No. 9020 - Waterbury Generation, LLC Compliance ULSK Test Program
The CEMS has a CEMView Data Buffer PC, an input/output signal data controller, and a main PC. The Nexus Data Buffer PC stores and reads data from the main PC on a 1-second interval. This PC uses the second-data to generate and store one (1)-minute data. The main PC then uses the 1-minute data to form and store 15-minute and 60-minute averages. The main PC indicates any occurrence of specification limit exceedances or CEMS operational problems. The computer polls for the data once every minute to extract the data from the input/output signal controller and stores it in the main computer. Using the CEMView and Cartwright computer software, necessary reports are generated in the required format for submittal to the applicable regulatory agencies. Each electronic report submitted to the EPA is in an XML format. All hourly data is recorded in Standard Time; thus, adjustments for daylight savings are not allowed. Each quarterly report is required to be submitted within 30 days of the end of each quarter. The EPA acknowledges receipt of all reports received electronically. All information reported to EPA Region I and the CT DEP is maintained on file for a minimum of three years (40 CFR 75 §75.54).

Air Tox Environmental Company, Inc. Page No. 12 Project No. 9020 - Waterbury Generation, LLC Compliance ULSK Test Program
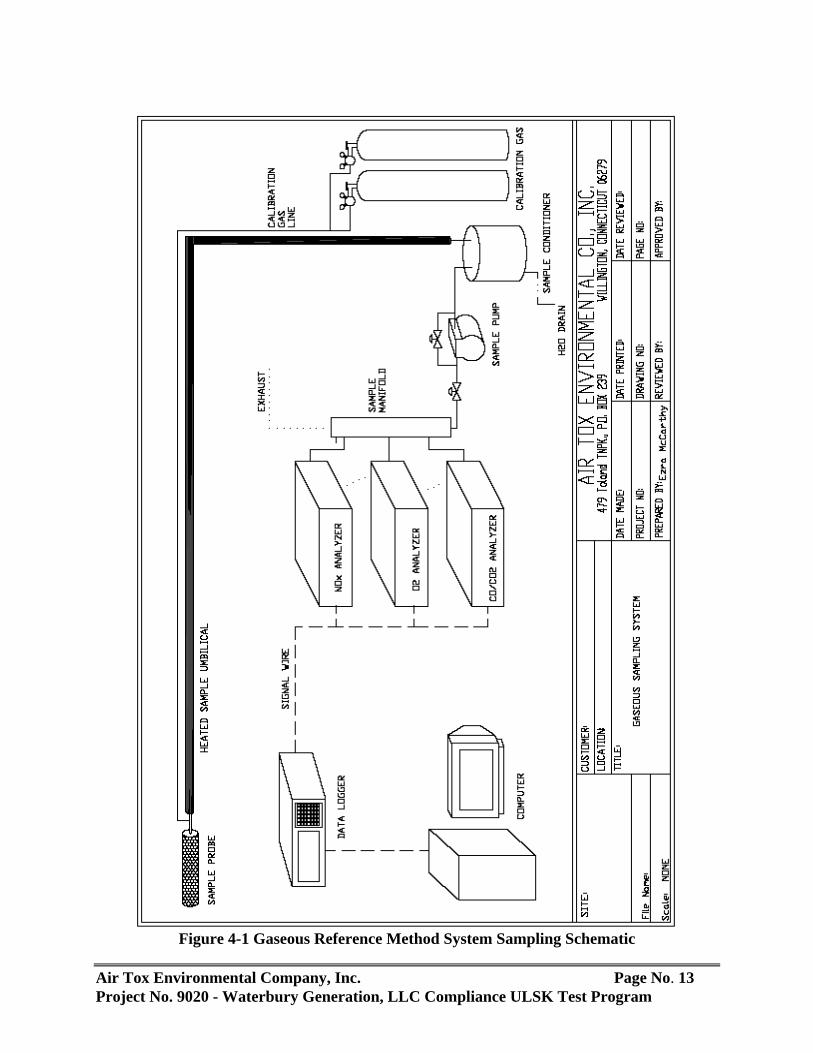
4.0 REFERENCE METHOD SAMPLING AND ANALYTICAL METHODOLOGY For the three one-hour compliance test runs, continuous emissions monitoring were performed by Air Tox at the exhaust stack to determine the concentration of O2, CO2, CO, NOX according to EPA Reference Methods 3A, 10, 7E and 19 for comparison to the facility CEMS. O2 and CO2 concentrations were recorded to calculate stack gas molecular weight necessary to determine volumetric flow rates, and to report NOx, CO, VOC and NH3 concentrations corrected to 15% O2. VOCs were measured using Reference Method 25A, while NH3 was measured using ASTM Method D6348. 4.1 Instrument Reference Method Sampling Stack gas was drawn through a heated sintered stainless steel probe, heated Teflon sample line (300°F nominal), and a stainless steel sample conditioner by a leakless Teflon diaphragm pump. The sample was then pumped through a manifold under slightly positive pressure with a bypass to the atmosphere. Samples are continuously drawn from this manifold to the instruments listed below:
TABLE 4-1
REFERENCE METHOD (RM) ANALYZERS
Analyzer Parameter Model No. Instrument Range Thermo Electron TOC (propane) 51 0 – 100 ppm
CAI O2 & CO2 ZRH 0 – 25% Thermo Electron NOx 42C 0 – 10 ppm
CAI CO ZRH 0 - 200 ppm The model 42CHL NOX analyzer is equipped with a NOX converter. The converter efficiency was checked prior to the testing program according to the procedure listed in 40 CFR 60, Appendix A, Section 7.1.4 and 8.2.4, EPA Reference Method 7E. A schematic of the gaseous reference method sampling configuration is presented in Figure 4-1.
The analyzer outputs are continuously recorded using an ESC 8816 data logger supported by ESC's software on a PC. The signals from the analyzers are "viewed" by the data logger at 1-second intervals, from which one-minute averages are formed. The ESC software was then used to generate reports for discrete test periods. Printouts of these periods were contained in the Appendix of this test report. 4.2 Analyzer Calibrations A multiple point (zero, mid, and span) calibration was performed directly on the O2/CO2, CO, and NOX analyzers (bypassing the sample transport and conditioning system) at the beginning of the test program to determine calibration error and demonstrate analyzer linearity.
Air Tox Environmental Company, Inc. Page No. 13 Project No. 9020 - Waterbury Generation, LLC Compliance ULSK Test Program
Figure 4-1 Gaseous Reference Method System Sampling Schematic
Air Tox Environmental Company, Inc. Page No. 14 Project No. 9020 - Waterbury Generation, LLC Compliance ULSK Test Program
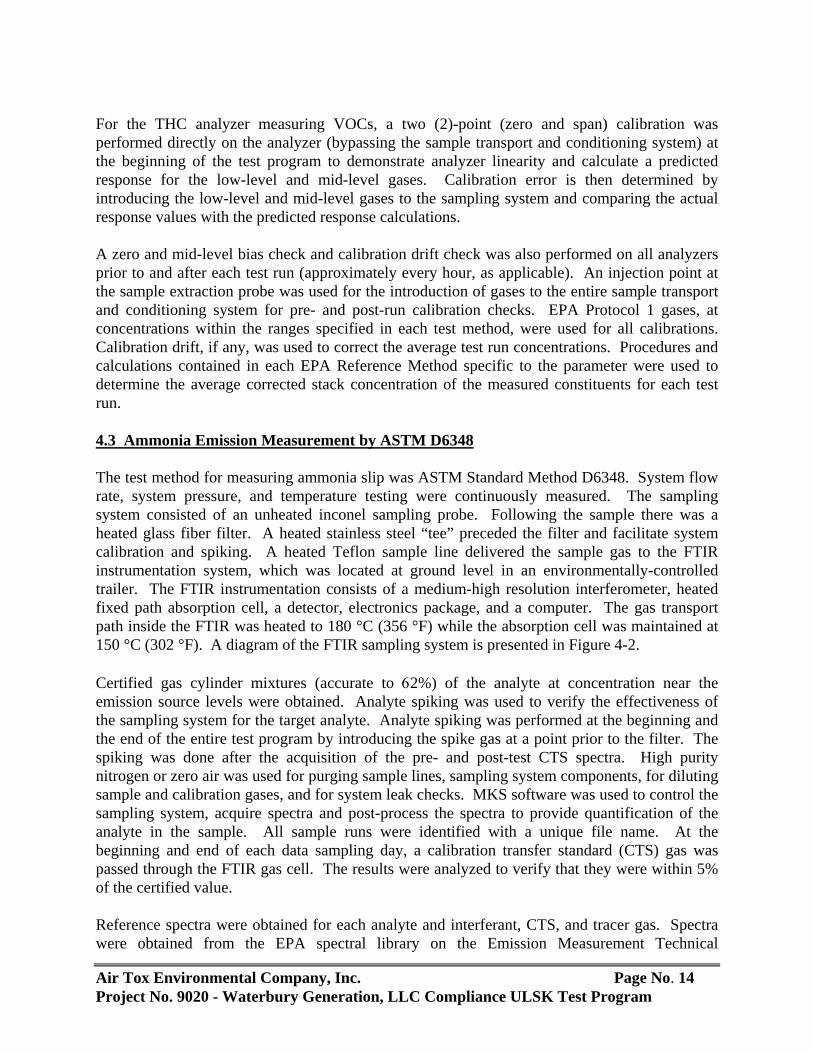
For the THC analyzer measuring VOCs, a two (2)-point (zero and span) calibration was performed directly on the analyzer (bypassing the sample transport and conditioning system) at the beginning of the test program to demonstrate analyzer linearity and calculate a predicted response for the low-level and mid-level gases. Calibration error is then determined by introducing the low-level and mid-level gases to the sampling system and comparing the actual response values with the predicted response calculations. A zero and mid-level bias check and calibration drift check was also performed on all analyzers prior to and after each test run (approximately every hour, as applicable). An injection point at the sample extraction probe was used for the introduction of gases to the entire sample transport and conditioning system for pre- and post-run calibration checks. EPA Protocol 1 gases, at concentrations within the ranges specified in each test method, were used for all calibrations. Calibration drift, if any, was used to correct the average test run concentrations. Procedures and calculations contained in each EPA Reference Method specific to the parameter were used to determine the average corrected stack concentration of the measured constituents for each test run. 4.3 Ammonia Emission Measurement by ASTM D6348 The test method for measuring ammonia slip was ASTM Standard Method D6348. System flow rate, system pressure, and temperature testing were continuously measured. The sampling system consisted of an unheated inconel sampling probe. Following the sample there was a heated glass fiber filter. A heated stainless steel “tee” preceded the filter and facilitate system calibration and spiking. A heated Teflon sample line delivered the sample gas to the FTIR instrumentation system, which was located at ground level in an environmentally-controlled trailer. The FTIR instrumentation consists of a medium-high resolution interferometer, heated fixed path absorption cell, a detector, electronics package, and a computer. The gas transport path inside the FTIR was heated to 180 °C (356 °F) while the absorption cell was maintained at 150 °C (302 °F). A diagram of the FTIR sampling system is presented in Figure 4-2. Certified gas cylinder mixtures (accurate to 62%) of the analyte at concentration near the emission source levels were obtained. Analyte spiking was used to verify the effectiveness of the sampling system for the target analyte. Analyte spiking was performed at the beginning and the end of the entire test program by introducing the spike gas at a point prior to the filter. The spiking was done after the acquisition of the pre- and post-test CTS spectra. High purity nitrogen or zero air was used for purging sample lines, sampling system components, for diluting sample and calibration gases, and for system leak checks. MKS software was used to control the sampling system, acquire spectra and post-process the spectra to provide quantification of the analyte in the sample. All sample runs were identified with a unique file name. At the beginning and end of each data sampling day, a calibration transfer standard (CTS) gas was passed through the FTIR gas cell. The results were analyzed to verify that they were within 5% of the certified value. Reference spectra were obtained for each analyte and interferant, CTS, and tracer gas. Spectra were obtained from the EPA spectral library on the Emission Measurement Technical

Air Tox Environmental Company, Inc. Page No. 15 Project No. 9020 - Waterbury Generation, LLC Compliance ULSK Test Program
Information Center (EMTIC) or were prepared by a qualified individual. The initial sample spectra were evaluated to determine if the sample matrix was consistent with the pre-test assumptions and if the instrument configurations were suitable.
Figure 4-2 FTIR Sampling Schematic
Air Tox Environmental Company, Inc. Page No. 16 Project No. 9020 - Waterbury Generation, LLC Compliance ULSK Test Program
4.4 Manual Emission Measurements Concurrent with the instrumental measurements detailed above, measurements were performed utilizing manual test methods to determine stack gas molecular weight, moisture content, and volumetric flow rate. 4.4.1 Stack Gas Molecular Weight Determination Molecular weight was determined using calculations listed in EPA Reference Method 3. As detailed above, the composition of the gas stream was continuously analyzed for carbon dioxide concentration, concurrent with each test run, in accordance with EPA Reference Method 3A. This data, together with the measured oxygen concentrations, allows the stack gas molecular weight to be calculated. 4.4.2 Stack Gas Moisture Content Measurement Stack gas moisture content was determined according to EPA Reference Method 4. Using EPA Reference Method 4, moisture runs were performed in conjunction with the EPA Reference Method 5 testing, detailed later in this report. 4.4.3 Volumetric Flow Measurement Concurrent with EPA Reference Method 5 testing, exhaust stack volumetric flow rate was determined in accordance with EPA Reference Methods 1 and 2. Velocity measurements were recorded at each of twenty-four (24) traverse points in the 138.5” I.D. stack (six points per each of four sampling ports located 90° apart from each other). Figure 4-3 shows the stack configuration and sample port locations.

Air Tox Environmental Company, Inc. Page No. 17 Project No. 9020 - Waterbury Generation, LLC Compliance ULSK Test Program
Figure 4-3 Sample Port Location Schematic
Air Tox Environmental Company, Inc. Page No. 18 Project No. 9020 - Waterbury Generation, LLC Compliance ULSK Test Program
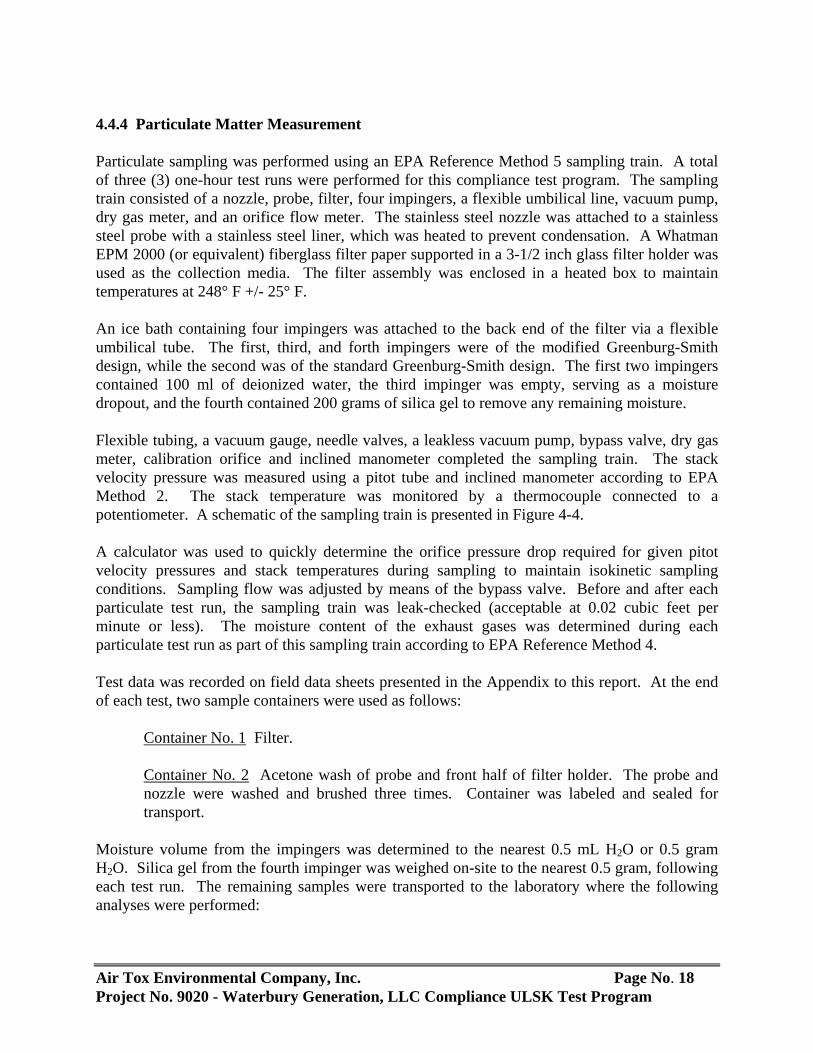
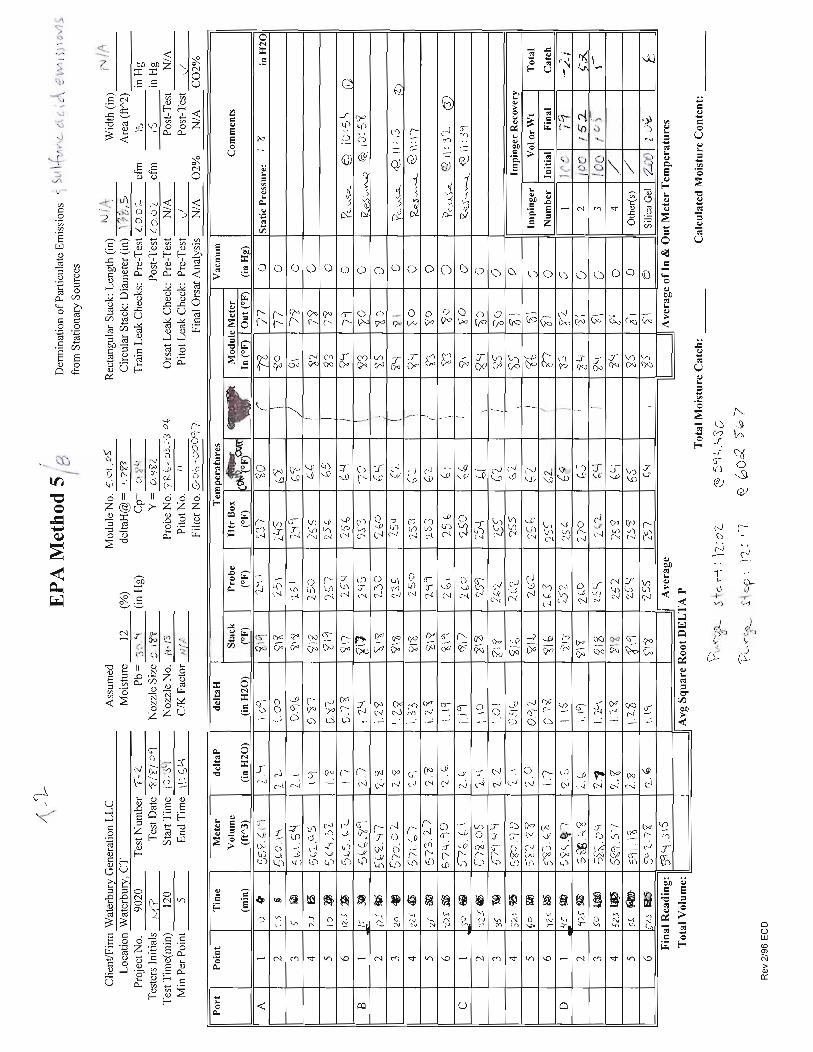
4.4.4 Particulate Matter Measurement Particulate sampling was performed using an EPA Reference Method 5 sampling train. A total of three (3) one-hour test runs were performed for this compliance test program. The sampling train consisted of a nozzle, probe, filter, four impingers, a flexible umbilical line, vacuum pump, dry gas meter, and an orifice flow meter. The stainless steel nozzle was attached to a stainless steel probe with a stainless steel liner, which was heated to prevent condensation. A Whatman EPM 2000 (or equivalent) fiberglass filter paper supported in a 3-1/2 inch glass filter holder was used as the collection media. The filter assembly was enclosed in a heated box to maintain temperatures at 248° F +/- 25° F. An ice bath containing four impingers was attached to the back end of the filter via a flexible umbilical tube. The first, third, and forth impingers were of the modified Greenburg-Smith design, while the second was of the standard Greenburg-Smith design. The first two impingers contained 100 ml of deionized water, the third impinger was empty, serving as a moisture dropout, and the fourth contained 200 grams of silica gel to remove any remaining moisture.
Flexible tubing, a vacuum gauge, needle valves, a leakless vacuum pump, bypass valve, dry gas meter, calibration orifice and inclined manometer completed the sampling train. The stack velocity pressure was measured using a pitot tube and inclined manometer according to EPA Method 2. The stack temperature was monitored by a thermocouple connected to a potentiometer. A schematic of the sampling train is presented in Figure 4-4. A calculator was used to quickly determine the orifice pressure drop required for given pitot velocity pressures and stack temperatures during sampling to maintain isokinetic sampling conditions. Sampling flow was adjusted by means of the bypass valve. Before and after each particulate test run, the sampling train was leak-checked (acceptable at 0.02 cubic feet per minute or less). The moisture content of the exhaust gases was determined during each particulate test run as part of this sampling train according to EPA Reference Method 4. Test data was recorded on field data sheets presented in the Appendix to this report. At the end of each test, two sample containers were used as follows:
Container No. 1 Filter. Container No. 2 Acetone wash of probe and front half of filter holder. The probe and nozzle were washed and brushed three times. Container was labeled and sealed for transport.
Moisture volume from the impingers was determined to the nearest 0.5 mL H2O or 0.5 gram H2O. Silica gel from the fourth impinger was weighed on-site to the nearest 0.5 gram, following each test run. The remaining samples were transported to the laboratory where the following analyses were performed:

Air Tox Environmental Company, Inc. Page No. 19 Project No. 9020 - Waterbury Generation, LLC Compliance ULSK Test Program
Container No. 1 Transferred the filter and any loose particulate matter from the sample container to a tared glass weighing dish, desiccated, dried to a constant weight. Results were reported to the nearest 0.1 mg.
Container No. 2 Transferred the acetone washing to a tared beaker and evaporated to
dryness at ambient temperature and pressure. Desiccated and dried to a constant weight. Results were reported to the nearest 0.1 mg.
An Excel® spreadsheet was used to calculate emission rates in grains per dry standard cubic foot and pounds per hour. The spreadsheet also calculated percent moisture, molecular weight of the stack gas at stack conditions, and the percent isokinesis. Copies of these test summary spreadsheets are included in the Appendix of this report. Complete sampling train calibrations were performed before and after this compliance test program. Complete pre/post test calibration forms are included in the Appendix of this final report.

Air Tox Environmental Company, Inc. Page No. 20 Project No. 9020 - Waterbury Generation, LLC Compliance ULSK Test Program
Figure 4-4 Particulate Matter Sampling Schematic

Air Tox Environmental Company, Inc. Page No. 21 Project No. 9020 - Waterbury Generation, LLC Compliance ULSK Test Program
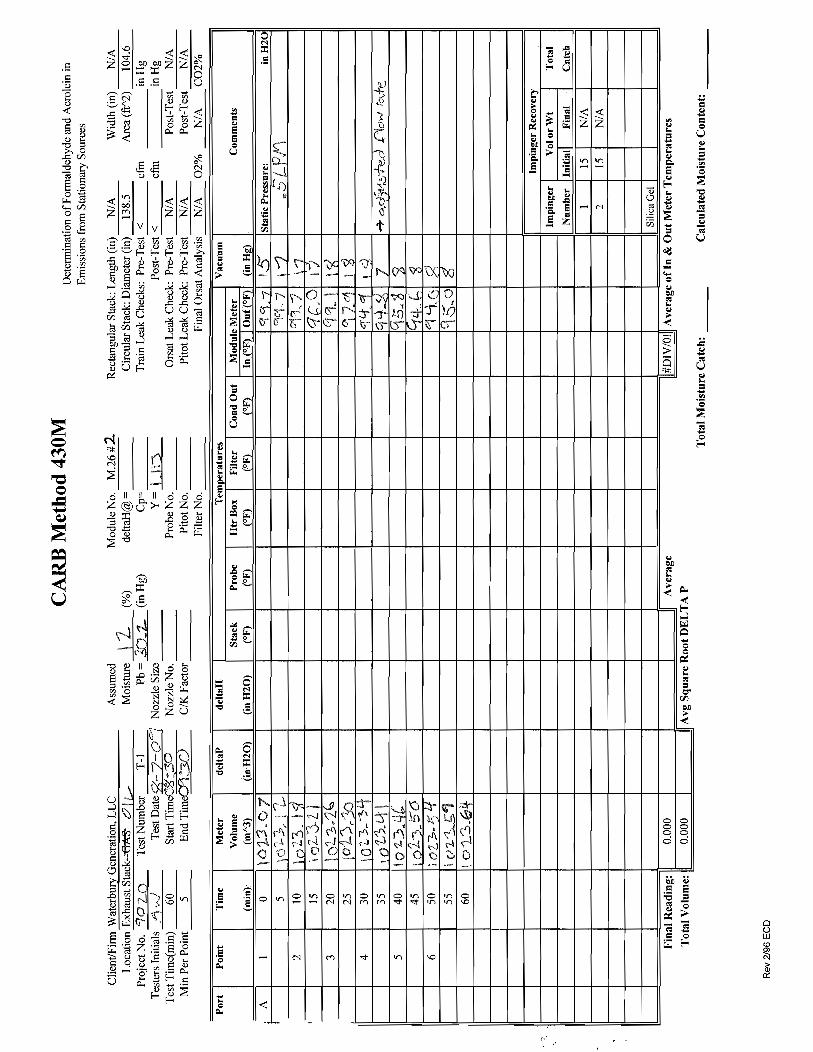
4.4.5 Formaldehyde Measurement The stack emissions concentration of formaldehyde was determined utilizing the California Air Resource Board (CARB) Method 430M. Three (3) one-hour non-isokinetic test runs were performed for this compliance test program. Emissions were expressed in micrograms per cubic meter (µg/m3), presented as the average of the three (3) one-hour test runs. A Teflon probe was attached to two mini impingers in series (each impinger containing an aqueous acidic solution of 2,4-denitrophenyl-hydrazine (DNPH)), an ice bath, flexible tubing, a vacuum gauge, needle valves, a leakless vacuum pump, a bypass valve, and a dry gas meter. The impingers each contained 15 ml DNPH, and the third impinger contained silica gel. Samples were collected at a flow rate of approximately 0.5 liters per minute (±10%). A schematic of the sampling train is presented in Figure 4-5. Upon completion of each one-hour sample run, the train components were moved to a clean area to minimize the chances of contamination during sample recovery. Samples were recovered and placed in one sample container, as follows:
Container No. 1 Contents of impingers 1 & 2. Rinsed each impinger and connecting glassware with 2 ml DNPH Solution. Deposited rinses into this container. Container was labeled and sealed for transport.
The recovered samples were transported to the laboratory where the following analysis was performed:
Container No. 1 Performed analysis by high performance liquid chromatography (HPLC) in accordance with Section 9 of CARB Method 430M.

Air Tox Environmental Company, Inc. Page No. 22 Project No. 9020 - Waterbury Generation, LLC Compliance ULSK Test Program
Figure 4-5 CARB Method 430M Formaldehyde Sampling Schematic

Air Tox Environmental Company, Inc. Page No. 23 Project No. 9020 - Waterbury Generation, LLC Compliance ULSK Test Program
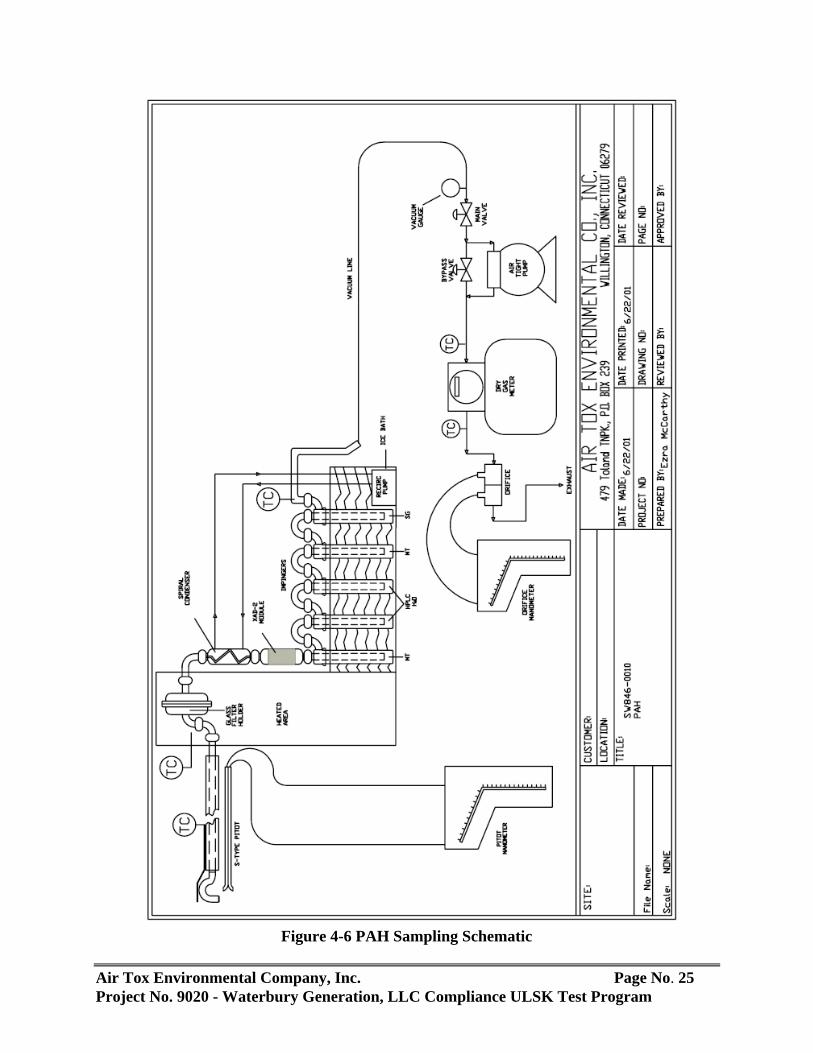
4.4.6 PAH Measurement The measurement of PAHs was performed in accordance with SW Method 846-0010. A total of three (3) two-hour isokinetic test runs were performed for this compliance test program. This method was essentially a modified version of EPA Reference Method 5. The train consisted of a calibrated glass nozzle, a heated glass-lined probe, a heated glass fiber filter encased in a glass holder with a Teflon-coated frit, a Graham spiral-type condenser, a water-jacketed sorbent module containing cleaned XAD-2 resin, and five Greenburg-Smith impingers. The sorbent module was positioned vertically and sample gas flowed downward to prevent channeling. The first impinger was modified to serve as a moisture knockout by shortening the stem. Impingers two and three were each charged with 100 ml HPLC water. The fourth impinger was empty, while the fifth contained 200 grams of indicating silica gel. Glassware connections were sealed with Teflon O-rings that eliminated leaks without the use of silicone grease. The sampling probe and filter temperatures were maintained at or below 248° F +/- 25° F. The remainder of the train consisted of flexible tubing, a vacuum gauge, a leak-free vacuum pump with by-pass and fine adjustments, a calibrated dry gas meter, a calibrated orifice and a dual inclined manometer. The stack velocity pressure was measured using a pitot tube and inclined manometer according to EPA Method 2. The stack temperature was monitored by a thermocouple connected to a potentiometer. A calculator was used to quickly determine the orifice pressure drop required for pitot velocity pressure changes and stack temperature changes in order to maintain isokinetic sampling conditions. Sampling flow was adjusted by means of the bypass valve. Before and after each test run, the sampling train was leak-checked (acceptable at less than 0.02 cubic feet per minute). The moisture content of the exhaust gases was also determined during each test run as part of this sampling train according to EPA Reference Method 4. All five impingers were weighed to the nearest 0.5 grams before and after each test. Test data was recorded on the field data sheets presented in the Appendix of this report. A schematic of the sampling train is presented in Figure 4-6. Upon completion of each two-hour sample run, the train components were moved to a relatively clean area to minimize the chances of contamination during sample recovery. The nozzle was sealed upon completion of the leak check with methylene chloride-rinsed aluminum foil to prevent loss of sample. The condenser/sorbent module was removed from the impinger train and sealed with glass caps. The sample train was then inspected for abnormal conditions and completely disassembled. Samples were recovered and placed in four sample containers, as follows:
Container No. 1 - Filter. Container No. 2 - Probe, nozzle and front half of the filter holder were
brushed and rinsed in triplicate with methanol/methylene chloride (1:1) into the same
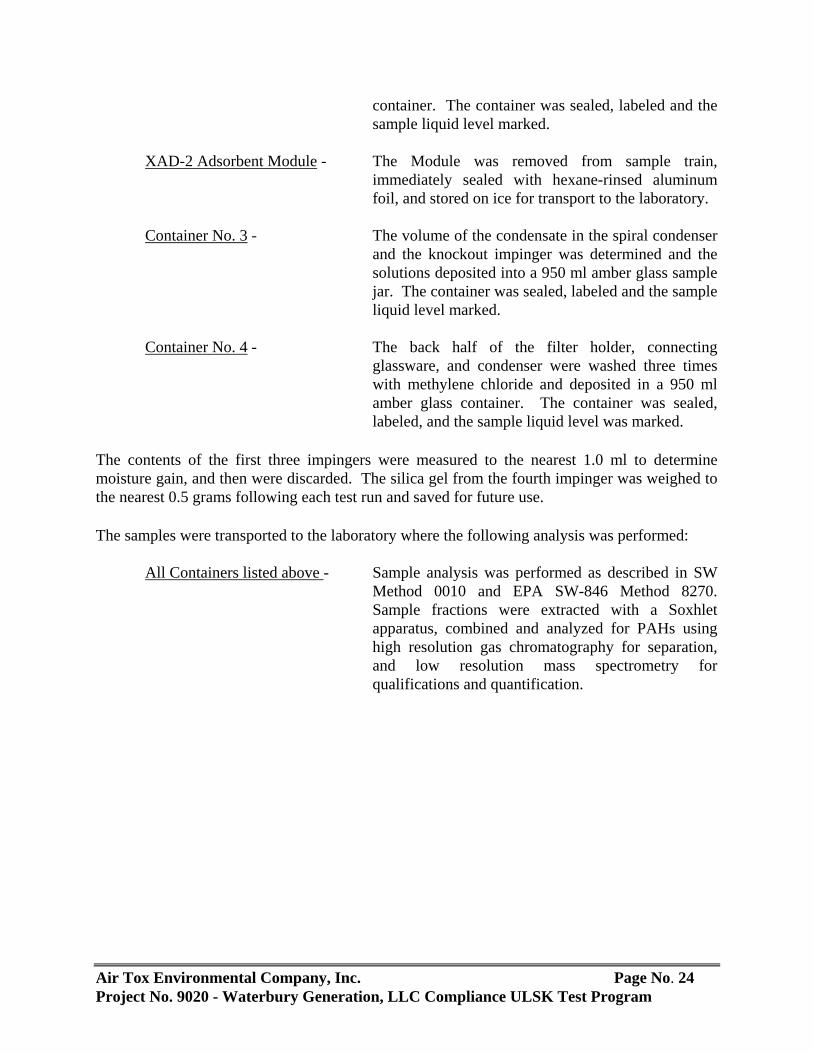
Air Tox Environmental Company, Inc. Page No. 24 Project No. 9020 - Waterbury Generation, LLC Compliance ULSK Test Program
container. The container was sealed, labeled and the sample liquid level marked.
XAD-2 Adsorbent Module - The Module was removed from sample train,
immediately sealed with hexane-rinsed aluminum foil, and stored on ice for transport to the laboratory.
Container No. 3 - The volume of the condensate in the spiral condenser
and the knockout impinger was determined and the solutions deposited into a 950 ml amber glass sample jar. The container was sealed, labeled and the sample liquid level marked.
Container No. 4 - The back half of the filter holder, connecting
glassware, and condenser were washed three times with methylene chloride and deposited in a 950 ml amber glass container. The container was sealed, labeled, and the sample liquid level was marked.
The contents of the first three impingers were measured to the nearest 1.0 ml to determine moisture gain, and then were discarded. The silica gel from the fourth impinger was weighed to the nearest 0.5 grams following each test run and saved for future use.
The samples were transported to the laboratory where the following analysis was performed:
All Containers listed above - Sample analysis was performed as described in SW
Method 0010 and EPA SW-846 Method 8270. Sample fractions were extracted with a Soxhlet apparatus, combined and analyzed for PAHs using high resolution gas chromatography for separation, and low resolution mass spectrometry for qualifications and quantification.
Air Tox Environmental Company, Inc. Page No. 25 Project No. 9020 - Waterbury Generation, LLC Compliance ULSK Test Program
Figure 4-6 PAH Sampling Schematic
Air Tox Environmental Company, Inc. Page No. 26 Project No. 9020 - Waterbury Generation, LLC Compliance ULSK Test Program
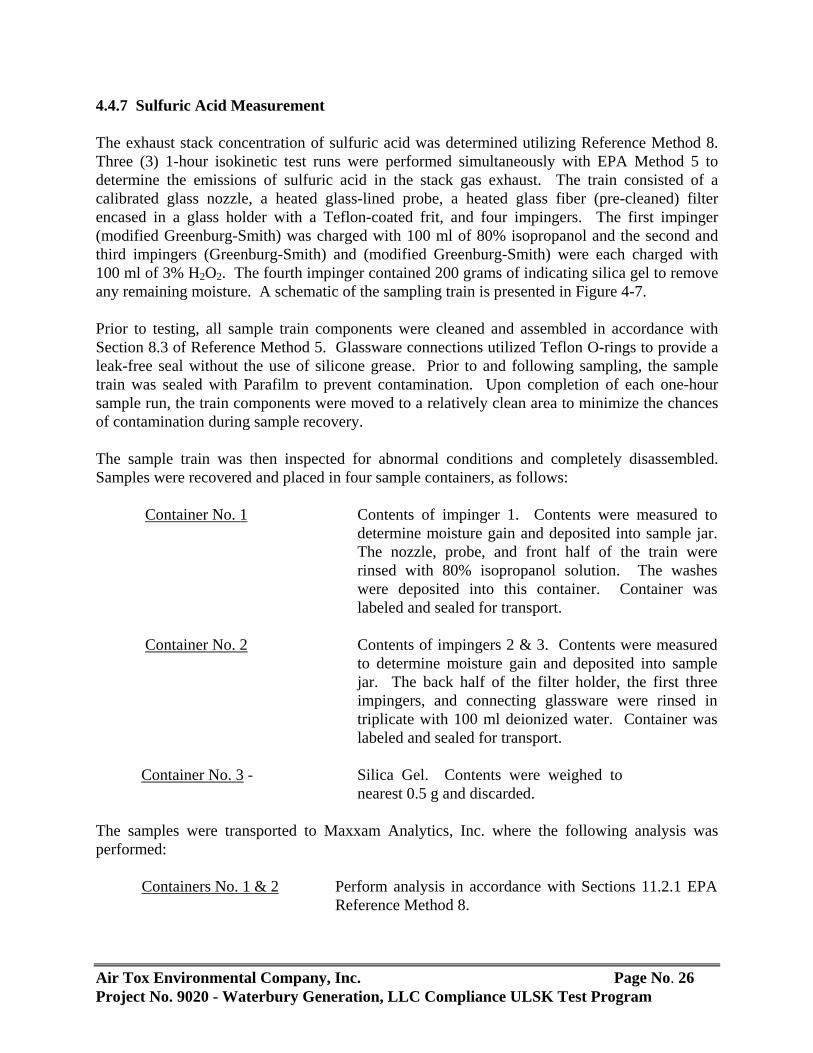
4.4.7 Sulfuric Acid Measurement The exhaust stack concentration of sulfuric acid was determined utilizing Reference Method 8. Three (3) 1-hour isokinetic test runs were performed simultaneously with EPA Method 5 to determine the emissions of sulfuric acid in the stack gas exhaust. The train consisted of a calibrated glass nozzle, a heated glass-lined probe, a heated glass fiber (pre-cleaned) filter encased in a glass holder with a Teflon-coated frit, and four impingers. The first impinger (modified Greenburg-Smith) was charged with 100 ml of 80% isopropanol and the second and third impingers (Greenburg-Smith) and (modified Greenburg-Smith) were each charged with 100 ml of 3% H2O2. The fourth impinger contained 200 grams of indicating silica gel to remove any remaining moisture. A schematic of the sampling train is presented in Figure 4-7. Prior to testing, all sample train components were cleaned and assembled in accordance with Section 8.3 of Reference Method 5. Glassware connections utilized Teflon O-rings to provide a leak-free seal without the use of silicone grease. Prior to and following sampling, the sample train was sealed with Parafilm to prevent contamination. Upon completion of each one-hour sample run, the train components were moved to a relatively clean area to minimize the chances of contamination during sample recovery. The sample train was then inspected for abnormal conditions and completely disassembled. Samples were recovered and placed in four sample containers, as follows:
Container No. 1 Contents of impinger 1. Contents were measured to determine moisture gain and deposited into sample jar. The nozzle, probe, and front half of the train were rinsed with 80% isopropanol solution. The washes were deposited into this container. Container was labeled and sealed for transport.
Container No. 2 Contents of impingers 2 & 3. Contents were measured
to determine moisture gain and deposited into sample jar. The back half of the filter holder, the first three impingers, and connecting glassware were rinsed in triplicate with 100 ml deionized water. Container was labeled and sealed for transport.
Container No. 3 - Silica Gel. Contents were weighed to
nearest 0.5 g and discarded.
The samples were transported to Maxxam Analytics, Inc. where the following analysis was performed:
Containers No. 1 & 2 Perform analysis in accordance with Sections 11.2.1 EPA
Reference Method 8.

Air Tox Environmental Company, Inc. Page No. 27 Project No. 9020 - Waterbury Generation, LLC Compliance ULSK Test Program
Figure 4-7 Sulfuric Acid Sampling Schematic

Air Tox Environmental Company, Inc. Page No. 28 Project No. 9020 - Waterbury Generation, LLC Compliance ULSK Test Program
4.4.8 Benzene and 1,3 Butadiene Measurements Sampling for benzene and 1,3 butadiene was performed in accordance with a modified version of EPA Method 18, employing charcoal tubes in series, as well as two moisture knockout impingers and an impinger with silica gel for drying the gas sample prior to passing through the low-flow sampling pump. The first charcoal tube was considered the “front-half” sample while the second was considered the “back-half” sample, and was used to collect any breakthrough sample. Identical trains were used for each sampling run; one train was dedicated to benzene sampling; the other was dedicated to 1,3 butadiene sampling. Sample analysis was performed by Maxxam Analytics, Inc. of Ontario, Canada. The sample train was designed to collect the sample through a ¼” Teflon sample line and two charcoal tubes in series, and condensing the remainder of the moisture in the stack gas sample into a chilled impinger solution (25mL HPLC water), and finally drying it with silica gel. The stack gas was then pulled off the silica gel impinger and through a low-flow sampling pump. The flow rate of the low-flow sampling pump was determined prior to each test run, with the train intact, and was adjusted to ensure a consistent sampling rate prior to each subsequent test run. Test runs were sixty (60) minutes in length, and the total gas volume sampled was calculated using the flow rate determined prior to each test run. Upon completion of each one-hour sample run, the train components were moved to a clean area to minimize the chances of contamination during sample recovery. Samples were recovered and placed in sample containers, as follows:
Container No. 1 Contents of impinger 1. Rinsed each impinger and connecting glassware and tubing with 10 ml HPLC water. Deposited rinses into this container. Container was labeled, sealed and chilled for transport.
Container No. 2 Charcoal tubes were removed, labeled and sealed for
transport. The recovered samples were transported to the laboratory where the following analysis was performed:
Container No. 1 & 2 Performed analysis by GC/FID for the impinger catch and charcoal tubes to determine the concentration of benzene or 1,3 butadiene.
4.4.9 Metals Measurement A ULSK fuel sample was take from the fuel oil storage tank during the ULSK compliance test program, and sent to the Mt. Tom Generation Company, LLC Analytical Laboratory, located in West Springfield, MA. Madhu P. Shah was the laboratory contact responsible for handling the sample and reporting the results.
Air Tox Environmental Company, Inc. Page No. 29 Project No. 9020 - Waterbury Generation, LLC Compliance ULSK Test Program
5.0 QUALITY ASSURANCE The project manager listed in Section 1.0 is responsible for implementation of the quality assurance program as applied to this project. 5.1 Sampling Quality Assurance Implementation of quality assurance procedures for source measurement programs is designed so work is done:
♦ By competent, trained individuals experienced in the methodologies being used. ♦ Using properly calibrated equipment. ♦ Using approved procedures for sample handling and documentation.
Measurement devices, pitot tubes, dry gas meters, thermocouples and portable gas analyzers are uniquely identified and calibrated with documented procedures and acceptance criteria before and after the field effort. Records of all calibration data are maintained in the files and were presented in the Appendix of this report. Data was recorded on standard forms. Field notebooks are used to record observations and miscellaneous elements affecting data, calculations, or evaluation.
Specific details of the Air Tox QA program for stationary air pollution sources may be found in “Quality Assurance Handbook for Air Pollution Measurement Systems,” Volume III (EPA-600/4-7-027b). 5.2 EPA Reference Methods Calibration gases utilized for instrumental analysis methods are prepared in accordance with EPA Protocol 1 or certified to be within ±2% of the cylinder “tag” value concentration. Analyzer linearity, bias, calibration drift, and calibration drift corrections are determined in accordance with the specific Reference Methods utilized in this test program.

APPENDIX

APPENDIX A Field Data Sheets
APPENDIX A.1 Particulate Matter and Sulfuric Acid Testing
Field Data Sheets


APPENDIX A.2
Formaldehyde Testing Field Data Sheets


APPENDIX A.3 Benzene and 1,3 Butadiene Testing
Field Data Sheets


APPENDIX A.4 Polynuclear Aromatic Hydrocarbon Testing
Field Data Sheets


APPENDIX B Results Summary Data Sheets

APPENDIX B.1 Particulate Matter and Sulfuric Acid Testing
Results Summary Data Sheets

EMISSION MEASURMENT GROUPEMISSION TEST DATA
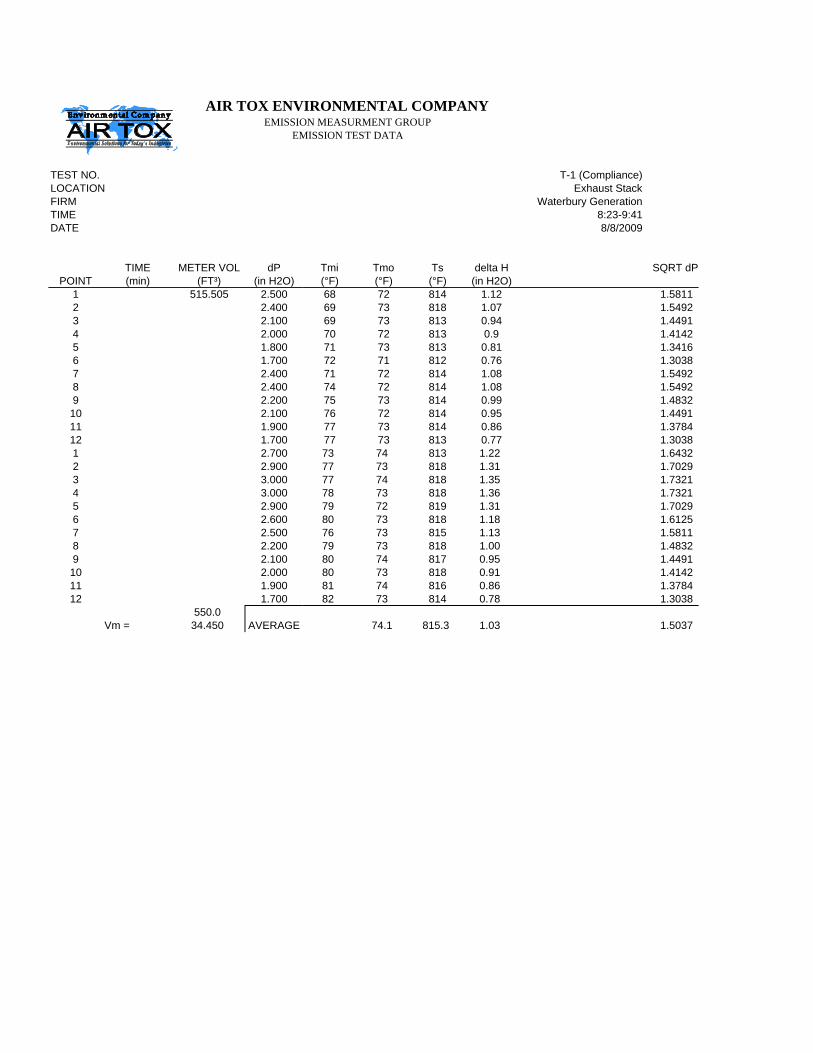
TEST NO. T-1 (Compliance)LOCATION Exhaust StackFIRM Waterbury GenerationTIME 8:23-9:41DATE 8/8/2009Proj No.
BAROMETRIC PRESSURE in. HG 30.40STACK AREA SQ. FT 104.57NOZZLE DIAMETER INCHES 0.188DRY GAS METER CAL FACTOR [Y] ******** 0.9820METER ORIFICE COEFFICIENT [dH@] ******** 1.78PITOT COEFFICIENT ******** 0.84STATIC PRESSURE IN. H2O 1.8SAMPLE DURATION MINUTES 60
***ESTIMATES TO SET-UP NOMOGRAPH***ESTIMATED MOISTURE PERCENT 12.0ESTIMATED MW STACK GAS lb/lbMole 28.8
*NOTE UPON COMPLETION OF TESTING, ENTER IMPINGER VOLUMES AND ACTUAL STACK GAS CONCENTRATIONS BELOW TO OBTAIN THE ACTUAL MOISTURES AND ISOKINETICS.
AVG SQUARE ROOT OF DELTA P IN. H2O 1.5037AVG DELTA H IN. H20 1.03AVG METER TEMPERATURE DEG. F 74.1AVG STACK TEMPERATURE DEG. F 815.3SAMPLE VOLUME CU. FT 34.450
MOISTURE PERCENT 5.2VOL. OF LIGUID - IMPINGERS GRAMS 24.0VOL. OF LIGUID - SILICA GEL GRAMS 16.0
***STACK GAS ANALYSIS***CO2 PERCENT 5.7O2 PERCENT 13.2CO PERCENT 0.0N2 PERCENT 81.11FUEL FACTOR Fo 1.353MOLECULAR WEIGHT OF STACK GAS lb/lbMole 28.84EXCESS AIR PERCENT 160.4STACK VELOCITY FPM 7797VOLUMETRIC FLOWRATE, ACTUAL ACFM 815,328 VOLUMETRIC FLOWRATE,DRY STD DSCFM 326,419
***EMISSION TEST RESULTS***
ISOKINETIC RATIO PERCENT 94.4
SAMPLE VOLUME, DRY (68F, 29.92"Hg) DSCF 34.06SAMPLE VOLUME, DRY (68F, 29.92"Hg) DSCM 0.96SAMPLE VOLUME, DRY (32F, 29.92"Hg) NM3 @ 0C 0.90
AIR TOX ENVIRONMENTAL COMPANY
EMISSION MEASURMENT GROUPEMISSION TEST DATA
TEST NO. T-1 (Compliance)LOCATION Exhaust StackFIRM Waterbury GenerationTIME 8:23-9:41DATE 8/8/2009
TIME METER VOL dP Tmi Tmo Ts delta H SQRT dPPOINT (min) (FT³) (in H2O) (°F) (°F) (°F) (in H2O)
1 515.505 2.500 68 72 814 1.12 1.58112 2.400 69 73 818 1.07 1.54923 2.100 69 73 813 0.94 1.44914 2.000 70 72 813 0.9 1.41425 1.800 71 73 813 0.81 1.34166 1.700 72 71 812 0.76 1.30387 2.400 71 72 814 1.08 1.54928 2.400 74 72 814 1.08 1.54929 2.200 75 73 814 0.99 1.483210 2.100 76 72 814 0.95 1.449111 1.900 77 73 814 0.86 1.378412 1.700 77 73 813 0.77 1.30381 2.700 73 74 813 1.22 1.64322 2.900 77 73 818 1.31 1.70293 3.000 77 74 818 1.35 1.73214 3.000 78 73 818 1.36 1.73215 2.900 79 72 819 1.31 1.70296 2.600 80 73 818 1.18 1.61257 2.500 76 73 815 1.13 1.58118 2.200 79 73 818 1.00 1.48329 2.100 80 74 817 0.95 1.449110 2.000 80 73 818 0.91 1.414211 1.900 81 74 816 0.86 1.378412 1.700 82 73 814 0.78 1.3038
550.0 Vm = 34.450 AVERAGE 74.1 815.3 1.03 1.5037
AIR TOX ENVIRONMENTAL COMPANY
EMISSION MEASURMENT GROUPEMISSION TEST DATA
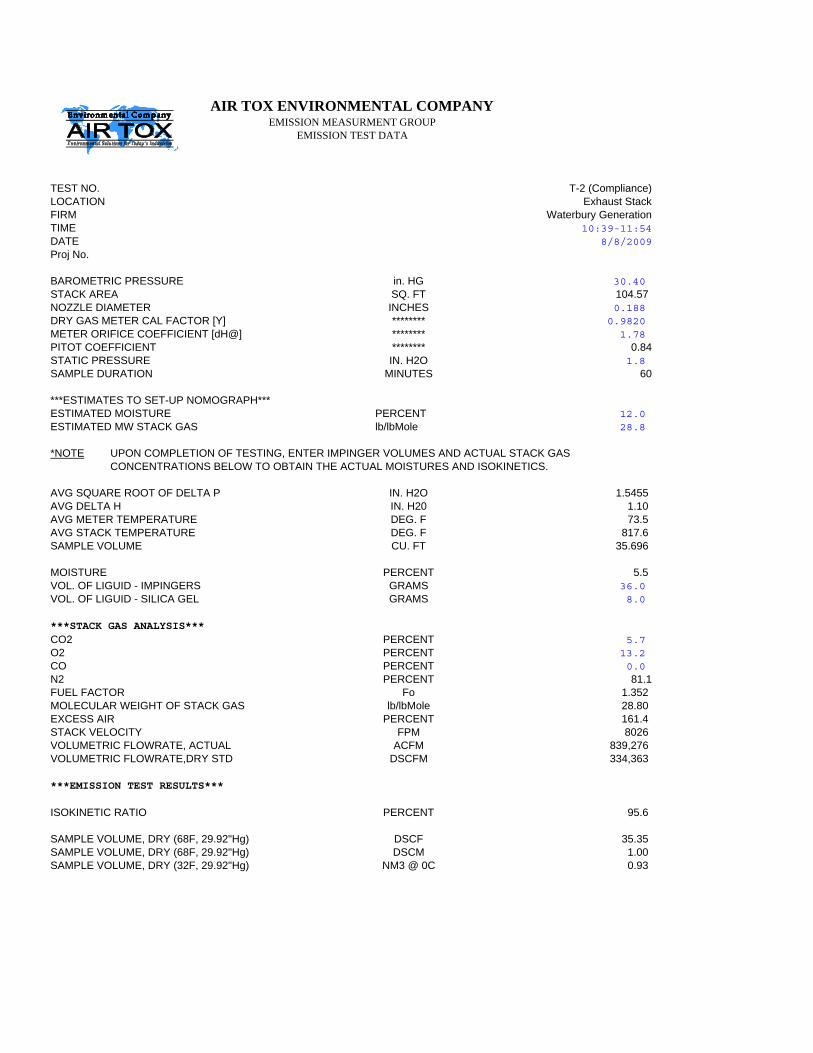
TEST NO. T-2 (Compliance)LOCATION Exhaust StackFIRM Waterbury GenerationTIME 10:39-11:54DATE 8/8/2009Proj No.
BAROMETRIC PRESSURE in. HG 30.40STACK AREA SQ. FT 104.57NOZZLE DIAMETER INCHES 0.188DRY GAS METER CAL FACTOR [Y] ******** 0.9820METER ORIFICE COEFFICIENT [dH@] ******** 1.78PITOT COEFFICIENT ******** 0.84STATIC PRESSURE IN. H2O 1.8SAMPLE DURATION MINUTES 60
***ESTIMATES TO SET-UP NOMOGRAPH***ESTIMATED MOISTURE PERCENT 12.0ESTIMATED MW STACK GAS lb/lbMole 28.8
*NOTE UPON COMPLETION OF TESTING, ENTER IMPINGER VOLUMES AND ACTUAL STACK GAS CONCENTRATIONS BELOW TO OBTAIN THE ACTUAL MOISTURES AND ISOKINETICS.
AVG SQUARE ROOT OF DELTA P IN. H2O 1.5455AVG DELTA H IN. H20 1.10AVG METER TEMPERATURE DEG. F 73.5AVG STACK TEMPERATURE DEG. F 817.6SAMPLE VOLUME CU. FT 35.696
MOISTURE PERCENT 5.5VOL. OF LIGUID - IMPINGERS GRAMS 36.0VOL. OF LIGUID - SILICA GEL GRAMS 8.0
***STACK GAS ANALYSIS***CO2 PERCENT 5.7O2 PERCENT 13.2CO PERCENT 0.0N2 PERCENT 81.1FUEL FACTOR Fo 1.352MOLECULAR WEIGHT OF STACK GAS lb/lbMole 28.80EXCESS AIR PERCENT 161.4STACK VELOCITY FPM 8026VOLUMETRIC FLOWRATE, ACTUAL ACFM 839,276 VOLUMETRIC FLOWRATE,DRY STD DSCFM 334,363
***EMISSION TEST RESULTS***
ISOKINETIC RATIO PERCENT 95.6
SAMPLE VOLUME, DRY (68F, 29.92"Hg) DSCF 35.35SAMPLE VOLUME, DRY (68F, 29.92"Hg) DSCM 1.00SAMPLE VOLUME, DRY (32F, 29.92"Hg) NM3 @ 0C 0.93
AIR TOX ENVIRONMENTAL COMPANY

EMISSION MEASURMENT GROUPEMISSION TEST DATA
TEST NO. T-2 (Compliance)LOCATION Exhaust StackFIRM Waterbury GenerationTIME 10:39-11:54DATE 8/8/2009
TIME METER VOL dP Tmi Tmo Ts delta H SQRT dPPOINT (min) (FT³) (in H2O) (°F) (°F) (°F) (in H2O)
1 558.619 2.400 74 74 819 1.09 1.54922 2.200 74 74 818 1 1.48323 2.100 75 73 818 0.96 1.44914 1.900 75 73 818 0.87 1.37845 1.800 75 73 819 0.82 1.34166 1.700 75 74 817 0.78 1.30387 2.700 75 74 817 1.24 1.64328 2.800 75 73 818 1.28 1.67339 2.800 74 72 818 1.28 1.673310 2.900 75 73 818 1.33 1.702911 2.800 74 72 818 1.28 1.673312 2.600 75 73 819 1.19 1.61251 2.600 74 72 817 1.19 1.61252 2.400 74 72 818 1.10 1.54923 2.200 73 72 818 1.01 1.48324 2.100 73 73 816 0.96 1.44915 2.000 73 72 816 0.92 1.41426 1.700 73 72 816 0.78 1.30387 2.500 73 73 813 1.15 1.58118 2.600 73 73 818 1.19 1.61259 2.700 74 73 818 1.24 1.643210 2.800 73 73 818 1.28 1.673311 2.800 74 73 819 1.28 1.673312 2.600 74 73 818 1.19 1.6125
594.3 Vm = 35.696 AVERAGE 73.5 817.6 1.10 1.5455
AIR TOX ENVIRONMENTAL COMPANY

EMISSION MEASURMENT GROUPEMISSION TEST DATA
TEST NO. 3 (Compliance)LOCATION Exhaust StackFIRM Waterbury GenerationTIME 12:31-13:47DATE 8/8/2009Proj No.
BAROMETRIC PRESSURE in. HG 30.40STACK AREA SQ. FT 104.57NOZZLE DIAMETER INCHES 0.188DRY GAS METER CAL FACTOR [Y] ******** 0.9820METER ORIFICE COEFFICIENT [dH@] ******** 1.78PITOT COEFFICIENT ******** 0.84STATIC PRESSURE IN. H2O 1.8SAMPLE DURATION MINUTES 60
***ESTIMATES TO SET-UP NOMOGRAPH***ESTIMATED MOISTURE PERCENT 12.0ESTIMATED MW STACK GAS lb/lbMole 28.0
*NOTE UPON COMPLETION OF TESTING, ENTER IMPINGER VOLUMES AND ACTUAL STACK GAS CONCENTRATIONS BELOW TO OBTAIN THE ACTUAL MOISTURES AND ISOKINETICS.
AVG SQUARE ROOT OF DELTA P IN. H2O 1.5348AVG DELTA H IN. H20 1.09AVG METER TEMPERATURE DEG. F 86.9AVG STACK TEMPERATURE DEG. F 818.4SAMPLE VOLUME CU. FT 35.892
MOISTURE PERCENT 8.0VOL. OF LIGUID - IMPINGERS GRAMS 52.0VOL. OF LIGUID - SILICA GEL GRAMS 12.0
***STACK GAS ANALYSIS***CO2 PERCENT 5.7O2 PERCENT 13.2CO PERCENT 0.0N2 PERCENT 81.1FUEL FACTOR Fo 1.353MOLECULAR WEIGHT OF STACK GAS lb/lbMole 28.52EXCESS AIR PERCENT 161.7STACK VELOCITY FPM 8012VOLUMETRIC FLOWRATE, ACTUAL ACFM 837,858 VOLUMETRIC FLOWRATE,DRY STD DSCFM 324,893
***EMISSION TEST RESULTS***
ISOKINETIC RATIO PERCENT 96.5
SAMPLE VOLUME, DRY (68F, 29.92"Hg) DSCF 34.67SAMPLE VOLUME, DRY (68F, 29.92"Hg) DSCM 0.98SAMPLE VOLUME, DRY (32F, 29.92"Hg) NM3 @ 0C 0.91
AIR TOX ENVIRONMENTAL COMPANY

EMISSION MEASURMENT GROUPEMISSION TEST DATA
TEST NO. 3 (Compliance)LOCATION Exhaust StackFIRM Waterbury GenerationTIME 12:31-13:47DATE 8/8/2009
TIME METER VOL dP Tmi Tmo Ts delta H SQRT dPPOINT (min) (FT³) (in H2O) (°F) (°F) (°F) (in H2O)
1 602.928 2.400 81 80 819 1.09 1.54922 2.500 83 81 819 1.14 1.58113 2.600 83 81 819 1.19 1.61254 2.700 84 81 819 1.24 1.64325 2.700 86 82 819 1.24 1.64326 2.500 87 82 819 1.15 1.58117 2.500 85 83 816 1.15 1.58118 2.300 89 84 819 1.06 1.51669 2.100 89 84 819 0.97 1.449110 2.000 90 84 818 0.93 1.414211 1.900 90 85 819 0.88 1.378412 1.800 91 85 816 0.83 1.34161 2.700 88 85 816 1.25 1.64322 2.900 91 86 819 1.34 1.70293 3.000 92 86 818 1.39 1.73214 3.000 93 87 819 1.39 1.73215 2.700 94 87 818 1.26 1.64326 2.400 94 88 817 1.12 1.54927 2.400 90 87 817 1.11 1.54928 2.200 92 87 820 1.02 1.48329 2.100 91 86 820 0.97 1.449110 2.000 91 87 820 0.93 1.414211 1.800 92 87 819 0.83 1.341612 1.700 92 88 818 0.79 1.3038
638.8 Vm = 35.892 AVERAGE 86.9 818.4 1.09 1.5348
AIR TOX ENVIRONMENTAL COMPANY

COMPLIANCED OIL PARTICULATE MATTER and SULFURIC ACID EMISSIONS TEST DATA
TEST NO. PM / H2SO4 T-1 PM / H2SO4 T- 2 PM / H2SO4 T-3 AVERAGELOCATION Exhaust Stack Exhaust Stack Exhaust StackFIRM Waterbury Generation Waterbury Generation Waterbury GenerationTIME 8:23-9:41 10:39-11:54 12:31-13:47DATE 8/8/2009 8/8/2009 8/8/2009BAROMETRIC PRESSURE in. Hg. 30.40 30.40 30.40STACK AREA SQ FT 104.57 104.57 104.57NOZZLE DIAMETER INCHES 0.188 0.188 0.188SAMPLING TIME MINUTES 60 60 60DRY GAS METER CAL FACTOR [Y] ******** 0.9820 0.9820 0.9820PITOT COEFFICIENT ******** 0.84 0.84 0.84AVG SQUARE ROOT OF DELTA P in. H2O 1.5037 1.5455 1.5348 1.5AVG DELTA H in. H2O 1.03 1.10 1.09 1.1AVG METER TEMP DEGREES F 74.1 73.5 86.9 78.2STATIC PRESSURE in. H2O 1.80 1.80 1.80 1.8AVG STACK TEMP DEGREES F 815.3 817.6 818.4 817.1SAMPLE VOLUME CUBIC FEET 34.450 35.696 35.892 35.3VOL. OF LIQUID - IMPINGERS MILLITERS 24.0 36.0 52.0 37.3VOL. OF LIQUID - SILICA GEL GRAMS 16.0 8.0 12.0 12.0PERCENT CO2 % 5.7 5.7 5.7 5.7PERCENT O2 % 13.2 13.2 13.2 13.2PERCENT CO % 0.0 0.0 0.0 0.0PERCENT N2 % 81.11 81.1 81.1 81.1ISOKINETIC RATIO PERCENT 94.4 95.6 96.5 95.5Vm(std), 68 deg F-29.92 in. Hg DSCF 34.1 35.3 34.7 34.7Meter Volume (acm @ stack conditions) ACM 2.41 2.52 2.54 2.49Vm(std), 68 deg F-29.92 in. Hg DSCM 0.96 1.00 0.98 1.0MOISTURE PERCENT 5.2 5.5 8.0 6.3MOLECULAR WT, DRY #/#-mole 29.44 29.44 29.44 29.4MOLECULAR WT, WET #/#-mole 28.84 28.80 28.52 28.7STACK VELOCITY FPM 7797 8026 8012 7945VOLUMETRIC FLOWRATE, ACTUAL ACFM 815330 839280 837810 830807VOLUMETRIC FLOWRATE, ACTUAL ACMH 1.370E+06 1.410E+06 1.408E+06 1.40E+06VOLUMETRIC FLOWRATE,DRY STD DSCFM 326420 334360 324870 328550PARTICULATE ANALYTICAL RESULTS LOCATION: Exhaust Stack
Milligrams 6.1 5.3 5.2 5.5gr/acf #REF! 0.001 0.001 0.001 0.001gr/dscf #REF! 0.005 0.004 0.004 0.004lbs/dscf 3.94E-07 3.30E-07 3.30E-07 3.52E-07lbs/MMBtu 0.004 0.003 0.003 0.003lbs/hr 7.73 6.63 6.44 6.93SULFURIC ACID MIST ANALYTICAL RESULTS LOCATION: Exhaust Stack
Milligrams Less than <2.00E-01 <2.00E-01 <2.00E-01 <2.00E-01gr/acf #REF! 0.000 0.000 0.000 0.000gr/dscf #REF! 0.000 0.000 0.000 0.000lbs/dscf 1.29E-08 1.25E-08 1.27E-08 1.27E-08lbs/MMBtu 0.000 0.000 0.000 0.000lbs/hr <2.53E-01 <2.50E-01 <2.48E-01 <2.50E-01µg/m3 <8.29E+01 <7.95E+01 <7.89E+01 <8.04E+01

APPENDIX B.2 Formaldehyde Testing
Results Summary Data Sheets
CARB Method 430M
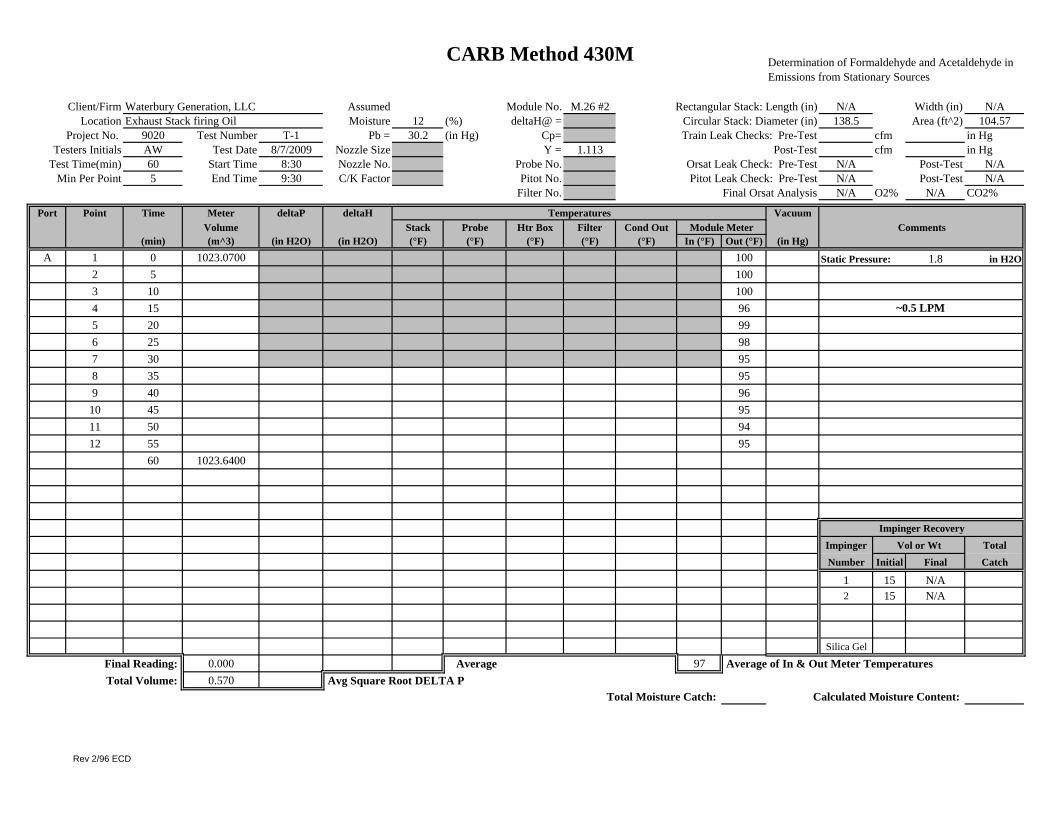
Client/Firm Waterbury Generation, LLC Assumed Module No. M.26 #2 Rectangular Stack: Length (in) N/A Width (in) N/ALocation Exhaust Stack firing Oil Moisture 12 (%) deltaH@ = Circular Stack: Diameter (in) 138.5 Area (ft^2) 104.57
Project No. 9020 Test Number T-1 Pb = 30.2 (in Hg) Cp= Train Leak Checks: Pre-Test cfm in HgTesters Initials AW Test Date 8/7/2009 Nozzle Size Y = 1.113 Post-Test cfm in Hg
Test Time(min) 60 Start Time 8:30 Nozzle No. Probe No. Orsat Leak Check: Pre-Test N/A Post-Test N/AMin Per Point 5 End Time 9:30 C/K Factor Pitot No. Pitot Leak Check: Pre-Test N/A Post-Test N/A
Filter No. Final Orsat Analysis N/A O2% N/A CO2%
Port Point Time Meter deltaP deltaH Temperatures VacuumVolume Stack Probe Htr Box Filter Cond Out Module Meter Comments
(min) (m^3) (in H2O) (in H2O) (°F) (°F) (°F) (°F) (°F) In (°F) Out (°F) (in Hg)A 1 0 1023.0700 100 Static Pressure: 1.8 in H2O
2 5 1003 10 1004 15 965 20 996 25 987 30 958 35 959 40 96
10 45 9511 50 9412 55 95
60 1023.6400
Impinger RecoveryImpinger Vol or Wt TotalNumber Initial Final Catch
1 15 N/A2 15 N/A
Silica Gel
Final Reading: 0.000 Average 97 Average of In & Out Meter TemperaturesTotal Volume: 0.570 Avg Square Root DELTA P
Total Moisture Catch: Calculated Moisture Content:
~0.5 LPM
Determination of Formaldehyde and Acetaldehyde in Emissions from Stationary Sources
Rev 2/96 ECD

CARB Method 430M
Client/Firm Waterbury Generation, LLC Assumed Module No. M.26 #2 Rectangular Stack: Length (in) N/A Width (in) N/ALocation Exhaust Stack firing Oil Moisture 12 (%) deltaH@ = Circular Stack: Diameter (in) 138.5 Area (ft^2) 104.57
Project No. 9020 Test Number T-2 Pb = 30.2 (in Hg) Cp= Train Leak Checks: Pre-Test cfm in HgTesters Initials AW Test Date 8/7/2009 Nozzle Size Y = 1.113 Post-Test cfm in Hg
Test Time(min) 60 Start Time 10:17 Nozzle No. Probe No. Orsat Leak Check: Pre-Test N/A Post-Test N/AMin Per Point 5 End Time 11:17 C/K Factor Pitot No. Pitot Leak Check: Pre-Test N/A Post-Test N/A
Filter No. Final Orsat Analysis N/A O2% N/A CO2%
Port Point Time Meter deltaP deltaH Temperatures VacuumVolume Stack Probe Htr Box Filter Cond Out Module Meter Comments
(min) (m^3) (in H2O) (in H2O) (°F) (°F) (°F) (°F) (°F) In (°F) Out (°F) (in Hg)A 1 0 1023.6600 89 Static Pressure: 1.8 in H2O
2 53 10 874 15 895 20 906 25 907 30 898 35 889 40 89
10 45 8911 50 8912 55
60 1024.0000
Impinger RecoveryImpinger Vol or Wt TotalNumber Initial Final Catch
1 15 N/A2 15 N/A
Silica Gel
Final Reading: 0.000 Average 89 Average of In & Out Meter TemperaturesTotal Volume: 0.340 Avg Square Root DELTA P
Total Moisture Catch: Calculated Moisture Content:
0.5 LPM
Determination of Formaldehyde and Acetaldehyde in Emissions from Stationary Sources
Rev 2/96 ECD

CARB Method 430M
Client/Firm Waterbury Generation, LLC Assumed Module No. M.26 #2 Rectangular Stack: Length (in) N/A Width (in) N/ALocation Exhaust Stack firing Oil Moisture 12 (%) deltaH@ = Circular Stack: Diameter (in) 138.5 Area (ft^2) 104.57
Project No. 9020 Test Number T-3 Pb = 30.2 (in Hg) Cp= Train Leak Checks: Pre-Test cfm in HgTesters Initials AW Test Date 8/7/2009 Nozzle Size Y = 1.113 Post-Test cfm in Hg
Test Time(min) 60 Start Time 12:10 Nozzle No. Probe No. Orsat Leak Check: Pre-Test N/A Post-Test N/AMin Per Point 5 End Time 13:10 C/K Factor Pitot No. Pitot Leak Check: Pre-Test N/A Post-Test N/A
Filter No. Final Orsat Analysis N/A O2% N/A CO2%
Port Point Time Meter deltaP deltaH Temperatures VacuumVolume Stack Probe Htr Box Filter Cond Out Module Meter Comments
(min) (m^3) (in H2O) (in H2O) (°F) (°F) (°F) (°F) (°F) In (°F) Out (°F) (in Hg)A 1 0 1024.0000 88 Static Pressure: 1.8 in H2O
2 5 903 10 924 155 20 946 257 30 868 35 879 40 87
10 45 8611 50 8512 55 86
60 1024.3500
Impinger RecoveryImpinger Vol or Wt TotalNumber Initial Final Catch
1 15 N/A2 15 N/A
Silica Gel
Final Reading: 0.000 Average 88 Average of In & Out Meter TemperaturesTotal Volume: 0.350 Avg Square Root DELTA P
Total Moisture Catch: Calculated Moisture Content:
0.5 LPM
Determination of Formaldehyde and Acetaldehyde in Emissions from Stationary Sources
Rev 2/96 ECD

Formaldehyde Summary WorksheetWaterbury Generation, LLCTurbine Exhaust StackConditions: >90% Load Project No. 9020 - Oil Compliance Test Program
Test No. T-1 T-2 T-3 AVERAGESDate: 8/7/2009 8/7/2009 8/7/2009Time: 08:30-09:30 10:17-11:17 12:10-13:10
TEST DATA INPUTBaro. Press. (" Hg) 30.2 30.2 30.2Stack Area (ft2) 104.57 104.57 104.57Cal Factor (Y) 1.113 1.113 1.113Time Total (min.) 60.0 60.0 60Pitot Coeff. 0.84 0.84 0.84Avg Sq Rt Delta P 1.504 1.546 1.539 1.529Avg Meter Temp. (ºF) 96.8 88.9 88Static Pres. (" WC) 1.8 1.8 1.8Stack Temp. (ºF) 815.3 817.6 818.4 817.1Meter Volume (ft3) 20.129 12.007 12.360 14.832H2O Collected (ml) 2.5 2.5 2.5 2.5CO2 in Stack (%) 5.8 5.7 5.7 5.7O2 in Stack (%) 13.1 13.2 13.19 13.1CO in Stack (ppm) 0.0 0.0 0 0.0CO in Stack (%) 0.00 0.00 0 0.00N2 in Stack (%) 81.1 81.1 81.1 81.1Mol. Weight Formaldehyde (g/g-mole) 30.0 30.0 30.0Formaldehyde (mg) 1.38E-03 8.63E-04 7.80E‐04 1.01E‐03
CALCULATED VALUES AVERAGESMeter Volume (dscf) 21.445 12.976 13.376 15.93Meter Volume (acm @ stack conditions) 1.46 0.89 0.92 1.09% H2O 0.55 0.90 0.87 0.77Mw (dry) 29.45 29.44 29.44 29.44Mw (wet) 29.38 29.34 29.34 29.35Stack Velocity (fpm) 7750 7979 7947 7892Flowrate (acfm) 810413 834328 830972 825238Flowrate (scfm) 340152 349559 347935 345882Flowrate (dscfm) 338295 346417 344901 343204Formaldehyde (lb/hr) 2.87E-03 3.05E-03 2.66E-03 2.86E-03
EMISSION CONCENTRATIONS AveragesFormaldehyde (gr/dscf) 9.90E-07 1.03E-06 9.00E-07 9.72E-07Formaldehyde (ppm) 1.81E-03 1.88E-03 1.65E-03 1.78E-03
EMISSION RATEFormaldehyde lbs/ MMBtu <1.31E-06 <1.35E-06 <1.19E-06 <1.28E-06Formaldehyde lbs/hr 2.87E-03 3.05E-03 2.66E-03 2.86E-03Rounded lbs/hr value 0.003 0.003 0.003 0.003Formaldehyde µg/m3 9.42E-01 9.71E-01 8.51E-01 9.21E-01

APPENDIX B.3 Benzene and 1,3 Butadiene Testing
Results Summary Data Sheets

8/7/2009Waterbury Generation, LLC Compliance
Low Flow Pump ID: 204732 2047171,3 Butadiene
Pump Flow Rate Averages (LPM), based on at least 3 pre-test runs:T-1 0.052T-2 0.078T-3 0.065
Low Flow Pump ID: 204726 204729Benzene
Pump Flow Rate Averages (LPM), based on at least 3 pre-test runs:T-1 0.073T-2 0.065T-3 0.090

Modified Niosh Method 18
Client/Firm Waterbury Generation, LLC Compliance Assumed Module No. N/A Rectangular Stack: Length (in) N/A Width (in) N/ALocation Exhaust Stack Moisture 12 (%) deltaH@ = Circular Stack: Diameter (in) 138.5 Area (ft^2) 104.6
Project No. 9020 Test Number T-1 Pb = 30.2 (in Hg) Cp= Train Leak Checks: Pre-Test cfm in HgTesters Initials AW Test Date 8/7/2009 Nozzle Size Y = N/A Post-Test cfm in Hg
Test Time(min) 60 Start Time 8:30 Nozzle No. Probe No. Orsat Leak Check: Pre-Test N/A Post-Test N/AMin Per Point 10 End Time 9:30 C/K Factor Pitot No. Pitot Leak Check: Pre-Test N/A Post-Test N/A
Filter No. Final Orsat Analysis N/A O2% N/A CO2%
Port Point Time Meter deltaP deltaH Temperatures VacuumVolume Stack Probe Htr Box Filter Cond Out Module Meter Comments
(min) (ft^3) (in H2O) (in H2O) (°F) (°F) (°F) (°F) (°F) In (°F) Out (°F) (in Hg)A 1 0 0.0000 Static Pressure: in H2O
2 10 BENZENE3 20 Low Flow Pump ID: 2047264 30 Avg. Measured Flow rate: 0.0735 40 LPM6 50
60 0.153
Impinger RecoveryImpinger Vol or Wt TotalNumber Initial Final Catch
1 15 N/A2 15 N/A
Silica Gel
Final Reading: Average Average of In & Out Meter TemperaturesTotal Volume: 0.153 Avg Square Root DELTA P
Total Moisture Catch: Calculated Moisture Content:
Determination of Benzene Emissions from Stationary Sources
Rev 2/96 ECD

Modified Niosh Method 18
Client/Firm Waterbury Generation, LLC Compliance Assumed Module No. N/A Rectangular Stack: Length (in) N/A Width (in) N/ALocation Stack Moisture 12 (%) deltaH@ = Circular Stack: Diameter (in) 138.5 Area (ft^2) 104.6
Project No. 9020 Test Number T-2 Pb = 30.2 (in Hg) Cp= Train Leak Checks: Pre-Test cfm in HgTesters Initials AW Test Date 8/7/2009 Nozzle Size Y = N/A Post-Test cfm in Hg
Test Time(min) 60 Start Time 10:17 Nozzle No. Probe No. Orsat Leak Check: Pre-Test N/A Post-Test N/AMin Per Point 10 End Time 11:17 C/K Factor Pitot No. Pitot Leak Check: Pre-Test N/A Post-Test N/A
Filter No. Final Orsat Analysis N/A O2% N/A CO2%
Port Point Time Meter deltaP deltaH Temperatures VacuumVolume Stack Probe Htr Box Filter Cond Out Module Meter Comments
(min) (ft^3) (in H2O) (in H2O) (°F) (°F) (°F) (°F) (°F) In (°F) Out (°F) (in Hg)A 1 0 0.000 Static Pressure: in H2O
2 10 BENZENE3 20 Low Flow Pump ID: 2047294 30 Avg. Measured Flow rate: 0.0655 40 LPM6 50
60 0.137
Impinger RecoveryImpinger Vol or Wt TotalNumber Initial Final Catch
1 15 N/A2 15 N/A
Silica Gel
Final Reading: Average Average of In & Out Meter TemperaturesTotal Volume: 0.14 Avg Square Root DELTA P
Total Moisture Catch: Calculated Moisture Content:
Determination of Benzene Emissions from Stationary Sources
Rev 2/96 ECD

Modified Niosh Method 18
Client/Firm Waterbury Generation, LLC Compliance Assumed Module No. N/A Rectangular Stack: Length (in) N/A Width (in) N/ALocation Stack Moisture 12 (%) deltaH@ = Circular Stack: Diameter (in) 138.5 Area (ft^2) 104.6
Project No. 9020 Test Number T-3 Pb = 30.2 (in Hg) Cp= Train Leak Checks: Pre-Test cfm in HgTesters Initials AW Test Date 8/7/2009 Nozzle Size Y = N/A Post-Test cfm in Hg
Test Time(min) 60 Start Time 12:10 Nozzle No. Probe No. Orsat Leak Check: Pre-Test N/A Post-Test N/AMin Per Point 10 End Time 13:10 C/K Factor Pitot No. Pitot Leak Check: Pre-Test N/A Post-Test N/A
Filter No. Final Orsat Analysis N/A O2% N/A CO2%
Port Point Time Meter deltaP deltaH Temperatures VacuumVolume Stack Probe Htr Box Filter Cond Out Module Meter Comments
(min) (ft^3) (in H2O) (in H2O) (°F) (°F) (°F) (°F) (°F) In (°F) Out (°F) (in Hg)A 1 0 0.000 Static Pressure: in H2O
2 10 BENZENE3 20 Low Flow Pump ID: 2047264 30 Avg. Measured Flow rate: 0.095 40 LPM6 50
60 0.189
Impinger RecoveryImpinger Vol or Wt TotalNumber Initial Final Catch
1 15 N/A2 15 N/A
Silica Gel
Final Reading: Average Average of In & Out Meter TemperaturesTotal Volume: 0.19 Avg Square Root DELTA P
Total Moisture Catch: Calculated Moisture Content:
Determination of Benzene Emissions from Stationary Sources
Rev 2/96 ECD

Modified Niosh Method 18
Client/Firm Waterbury Generation, LLC Compliance Assumed Module No. N/A Rectangular Stack: Length (in) N/A Width (in) N/ALocation Stack Moisture 12 (%) deltaH@ = Circular Stack: Diameter (in) 138.5 Area (ft^2) 104.6
Project No. 9020 Test Number T-1 Pb = 30.2 (in Hg) Cp= Train Leak Checks: Pre-Test cfm in HgTesters Initials AW Test Date 8/7/2009 Nozzle Size Y = N/A Post-Test cfm in Hg
Test Time(min) 60 Start Time 8:30 Nozzle No. Probe No. Orsat Leak Check: Pre-Test N/A Post-Test N/AMin Per Point 10 End Time 9:30 C/K Factor Pitot No. Pitot Leak Check: Pre-Test N/A Post-Test N/A
Filter No. Final Orsat Analysis N/A O2% N/A CO2%
Port Point Time Meter deltaP deltaH Temperatures VacuumVolume Stack Probe Htr Box Filter Cond Out Module Meter Comments
(min) (ft^3) (in H2O) (in H2O) (°F) (°F) (°F) (°F) (°F) In (°F) Out (°F) (in Hg)A 1 0 0.0000 Static Pressure: in H2O
2 103 204 30 Low Flow Pump ID: 2047325 40 Avg. Measured Flow rate: 0.0526 50 LPM
60 0.109
Impinger RecoveryImpinger Vol or Wt TotalNumber Initial Final Catch
1 15 N/A2 15 N/A
Silica Gel
Final Reading: Average Average of In & Out Meter TemperaturesTotal Volume: 0.11 Avg Square Root DELTA P
Total Moisture Catch: Calculated Moisture Content:
1,3 BUTADIENE
Determination of 1,3 Butadiene Emissions from Stationary Sources
Rev 2/96 ECD
Modified Niosh Method 18
Client/Firm Waterbury Generation, LLC Compliance Assumed Module No. N/A Rectangular Stack: Length (in) N/A Width (in) N/ALocation Stack Moisture 12 (%) deltaH@ = Circular Stack: Diameter (in) 138.5 Area (ft^2) 104.6
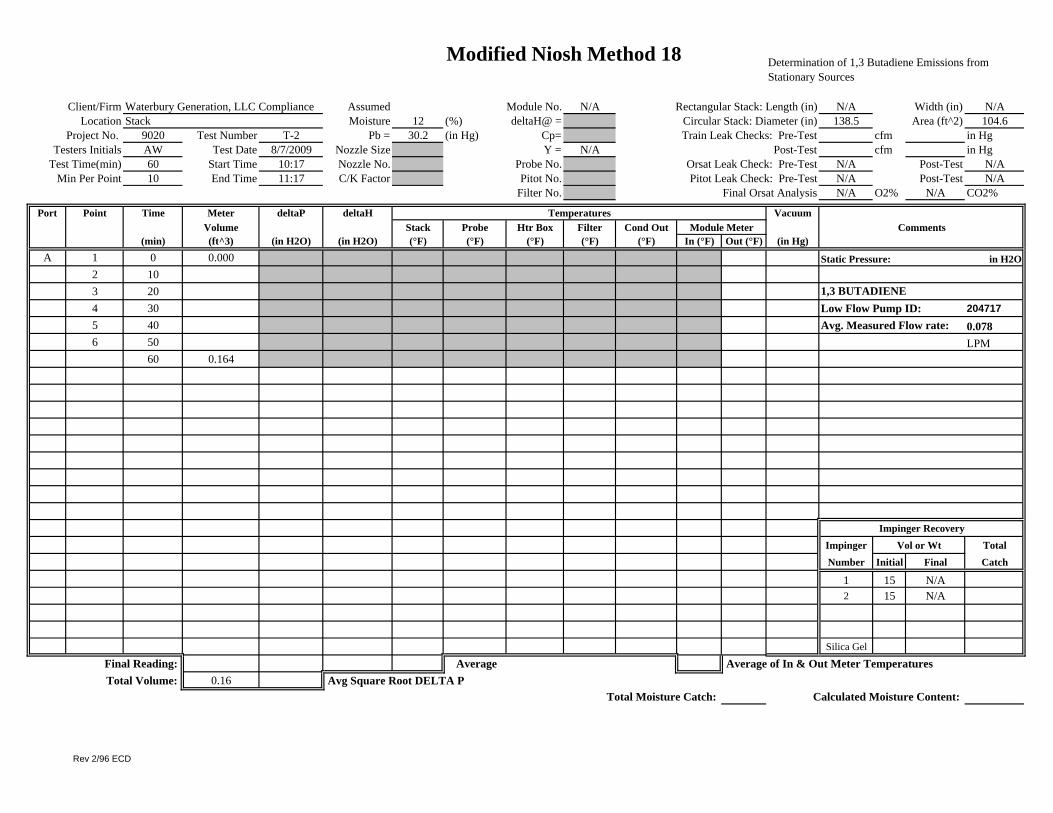
Project No. 9020 Test Number T-2 Pb = 30.2 (in Hg) Cp= Train Leak Checks: Pre-Test cfm in HgTesters Initials AW Test Date 8/7/2009 Nozzle Size Y = N/A Post-Test cfm in Hg
Test Time(min) 60 Start Time 10:17 Nozzle No. Probe No. Orsat Leak Check: Pre-Test N/A Post-Test N/AMin Per Point 10 End Time 11:17 C/K Factor Pitot No. Pitot Leak Check: Pre-Test N/A Post-Test N/A
Filter No. Final Orsat Analysis N/A O2% N/A CO2%
Port Point Time Meter deltaP deltaH Temperatures VacuumVolume Stack Probe Htr Box Filter Cond Out Module Meter Comments
(min) (ft^3) (in H2O) (in H2O) (°F) (°F) (°F) (°F) (°F) In (°F) Out (°F) (in Hg)A 1 0 0.000 Static Pressure: in H2O
2 103 204 30 Low Flow Pump ID: 2047175 40 Avg. Measured Flow rate: 0.0786 50 LPM
60 0.164
Impinger RecoveryImpinger Vol or Wt TotalNumber Initial Final Catch
1 15 N/A2 15 N/A
Silica Gel
Final Reading: Average Average of In & Out Meter TemperaturesTotal Volume: 0.16 Avg Square Root DELTA P
Total Moisture Catch: Calculated Moisture Content:
1,3 BUTADIENE
Determination of 1,3 Butadiene Emissions from Stationary Sources
Rev 2/96 ECD

Modified Niosh Method 18
Client/Firm Waterbury Generation, LLC Compliance Assumed Module No. N/A Rectangular Stack: Length (in) N/A Width (in) N/ALocation Stack Moisture 12 (%) deltaH@ = Circular Stack: Diameter (in) 138.5 Area (ft^2) 104.6
Project No. 9020 Test Number T-3 Pb = 30.2 (in Hg) Cp= Train Leak Checks: Pre-Test cfm in HgTesters Initials AW Test Date 8/7/2009 Nozzle Size Y = N/A Post-Test cfm in Hg
Test Time(min) 60 Start Time 12:10 Nozzle No. Probe No. Orsat Leak Check: Pre-Test N/A Post-Test N/AMin Per Point 10 End Time 13:10 C/K Factor Pitot No. Pitot Leak Check: Pre-Test N/A Post-Test N/A
Filter No. Final Orsat Analysis N/A O2% N/A CO2%
Port Point Time Meter deltaP deltaH Temperatures VacuumVolume Stack Probe Htr Box Filter Cond Out Module Meter Comments
(min) (ft^3) (in H2O) (in H2O) (°F) (°F) (°F) (°F) (°F) In (°F) Out (°F) (in Hg)A 1 0 0.000 Static Pressure: in H2O
2 103 204 30 Low Flow Pump ID: 2047325 40 Avg. Measured Flow rate: 0.0656 50 LPM
60 0.137
Impinger RecoveryImpinger Vol or Wt TotalNumber Initial Final Catch
1 15 N/A2 15 N/A
Silica Gel
Final Reading: Average Average of In & Out Meter TemperaturesTotal Volume: 0.14 Avg Square Root DELTA P
Total Moisture Catch: Calculated Moisture Content:
1,3 BUTADIENE
Determination of 1,3 Butadiene Emissions from Stationary Sources
Rev 2/96 ECD

Benzene Summary WorksheetWaterbury Generation, LLC ComplianceExhaust StackConditions: >90% Load
Project No. 9020 - Compliance Test Program
Test No. T-1 T-2 T‐3 AVERAGESDate: 8/7/2009 8/7/2009 8/7/2009Time: 08:30-09:30 10:17-11:17 12:10‐13:10TEST DATA INPUTBaro. Press. ("Hg) 30.2 30.2 30.2Stack Area (ft3) 104.60 104.6 104.6Cal Factor (Y) 0.982 0.982 0.982Time Total (min.) 60 60 60Pitot Coeff. 0.84 0.84 0.84Avg Sq Rt Delta P 1.504 1.546 1.5348 1.528Avg Meter Temp. (ºF) 74.1 73.5 86.9 78.2Static Pres. (" WC) 1.8 1.8 1.8 1.8Stack Temp. (ºF) 815.3 817.6 818.4 817.1
Meter Volume (ft3) 0.153 0.137 0.189 0.160H2O Collected (ml) 3.00 3.00 3.00 3.00CO2 in Stack (%) 5.8 5.7 5.7 5.7O2 in Stack (%) 13.0 13.2 13.2 13.1CO in Stack (ppm) 0.0 0.0 0.0 0.0CO in Stack (%) 0.0 0.0 0.0 0.0N2 in Stack (%) 81.2 81.1 81.1 81.1Mol. Weight Benzene (g/g-mole) 78.1 78.1 78.1 78.1Benzene (mg) <5.50E-04 <5.50E-04 <5.50E‐04 <5.50E‐04CALCULATED VALUES AveragesMeter Volume (dscf) 0.15 0.13 0.18 0.16Meter Volume (acm @ stack conditions) 0.02 0.02 0.02 0.02% H2O 48.46 51.33 43.84 47.88Mw (dry) 29.45 29.44 29.44 29.44Mw (wet) 23.90 23.57 24.42 23.96Stack Velocity (fpm) 8593 8902 8687 8727Flowrate (acfm) 898846 931170 908656 912891Flowrate (scfm) 377269 390133 380462 382621Flowrate (dscfm) 194463 189885 213651 199333EMISSION CONCENTRATION T‐1 T‐2 T‐3 AveragesBenzene (gr/dscf) <5.65E-05 <6.34E-05 <4.69E-05 <5.56E-05Benzene (ppm) <3.98E-02 <4.47E-02 <3.31E-02 <3.92E-02EMISSION RATE T-1 T-2 T‐3 AveragesBenzene µg/m3 <2.78E+01 <2.94E+01 <2.51E+01 <2.75E+01
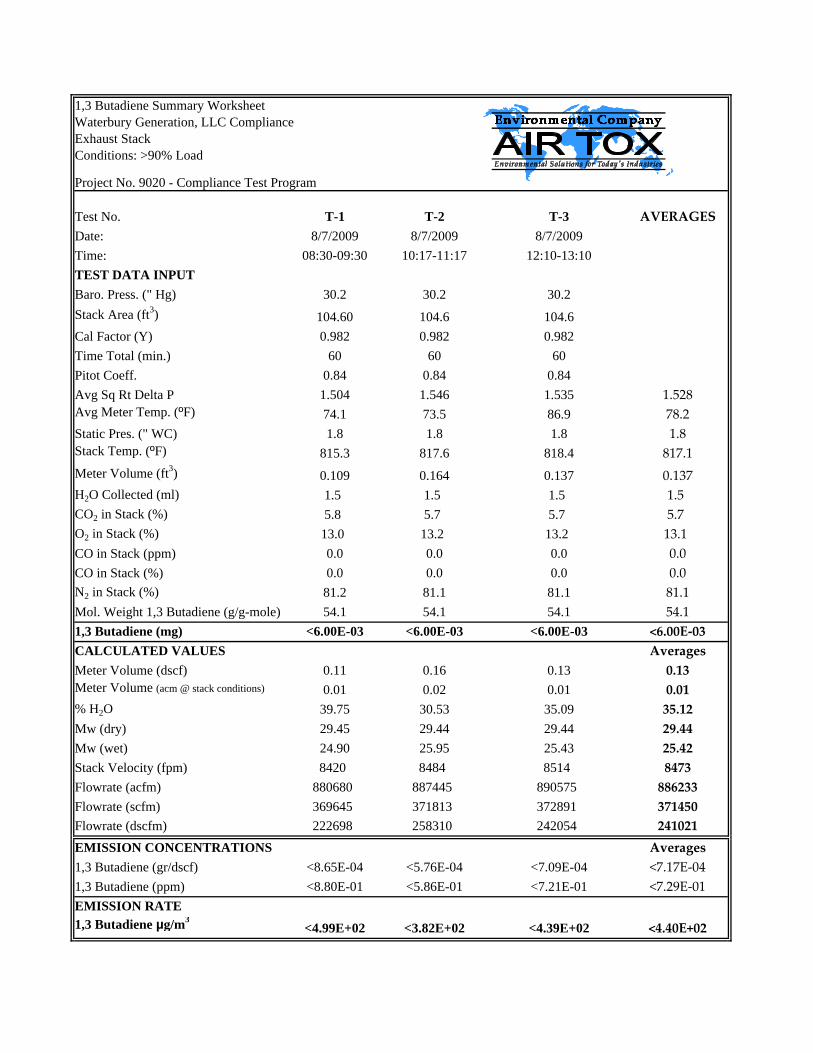
1,3 Butadiene Summary WorksheetWaterbury Generation, LLC ComplianceExhaust StackConditions: >90% Load
Project No. 9020 - Compliance Test Program
Test No. T-1 T-2 T-3 AVERAGESDate: 8/7/2009 8/7/2009 8/7/2009Time: 08:30-09:30 10:17-11:17 12:10-13:10TEST DATA INPUTBaro. Press. (" Hg) 30.2 30.2 30.2Stack Area (ft3) 104.60 104.6 104.6Cal Factor (Y) 0.982 0.982 0.982Time Total (min.) 60 60 60Pitot Coeff. 0.84 0.84 0.84Avg Sq Rt Delta P 1.504 1.546 1.535 1.528Avg Meter Temp. (ºF) 74.1 73.5 86.9 78.2Static Pres. (" WC) 1.8 1.8 1.8 1.8Stack Temp. (ºF) 815.3 817.6 818.4 817.1Meter Volume (ft3) 0.109 0.164 0.137 0.137H2O Collected (ml) 1.5 1.5 1.5 1.5CO2 in Stack (%) 5.8 5.7 5.7 5.7O2 in Stack (%) 13.0 13.2 13.2 13.1CO in Stack (ppm) 0.0 0.0 0.0 0.0CO in Stack (%) 0.0 0.0 0.0 0.0N2 in Stack (%) 81.2 81.1 81.1 81.1Mol. Weight 1,3 Butadiene (g/g-mole) 54.1 54.1 54.1 54.11,3 Butadiene (mg) <6.00E-03 <6.00E-03 <6.00E-03 <6.00E‐03CALCULATED VALUES AveragesMeter Volume (dscf) 0.11 0.16 0.13 0.13Meter Volume (acm @ stack conditions) 0.01 0.02 0.01 0.01% H2O 39.75 30.53 35.09 35.12Mw (dry) 29.45 29.44 29.44 29.44Mw (wet) 24.90 25.95 25.43 25.42Stack Velocity (fpm) 8420 8484 8514 8473Flowrate (acfm) 880680 887445 890575 886233Flowrate (scfm) 369645 371813 372891 371450Flowrate (dscfm) 222698 258310 242054 241021EMISSION CONCENTRATIONS Averages1,3 Butadiene (gr/dscf) <8.65E-04 <5.76E-04 <7.09E-04 <7.17E‐041,3 Butadiene (ppm) <8.80E-01 <5.86E-01 <7.21E-01 <7.29E‐01EMISSION RATE1,3 Butadiene µg/m3
<4.99E+02 <3.82E+02 <4.39E+02 <4.40E+02
APPENDIX B.4 Polynuclear Aromatic Hydrocarbon Testing
Results Summary Data Sheets

EMISSION MEASURMENT GROUPEMISSION TEST DATA
TEST NO. PAH T-1LOCATION Exhaust stackFIRM Waterbury GenerationTIME 8:31-10:52DATE 8/7/2009Proj No. 9020
BAROMETRIC PRESSURE in. HG 30.20STACK AREA SQ. FT 104.57NOZZLE DIAMETER INCHES 0.180DRY GAS METER CAL FACTOR [Y] ******** 0.9820METER ORIFICE COEFFICIENT [dH@] ******** 1.78PITOT COEFFICIENT ******** 0.84STATIC PRESSURE IN. H2O 1.8SAMPLE DURATION MINUTES 120
***ESTIMATES TO SET-UP NOMOGRAPH***ESTIMATED MOISTURE PERCENT 12.0ESTIMATED MW STACK GAS lb/lbMole 28.8
*NOTE UPON COMPLETION OF TESTING, ENTER IMPINGER VOLUMES AND ACTUAL STACK GAS CONCENTRATIONS BELOW TO OBTAIN THE ACTUAL MOISTURES AND ISOKINETICS.
AVG SQUARE ROOT OF DELTA P IN. H2O 1.5470AVG DELTA H IN. H20 0.93AVG METER TEMPERATURE DEG. F 78.1AVG STACK TEMPERATURE DEG. F 820.7SAMPLE VOLUME CU. FT 65.973
MOISTURE PERCENT 7.9VOL. OF LIGUID - IMPINGERS GRAMS 103.0VOL. OF LIGUID - SILICA GEL GRAMS 15.0
***STACK GAS ANALYSIS***CO2 PERCENT 5.7O2 PERCENT 13.2CO PERCENT 0.0N2 PERCENT 81.12FUEL FACTOR Fo 1.353MOLECULAR WEIGHT OF STACK GAS lb/lbMole 28.53EXCESS AIR PERCENT 159.1STACK VELOCITY FPM 8108VOLUMETRIC FLOWRATE, ACTUAL ACFM 847,883 VOLUMETRIC FLOWRATE,DRY STD DSCFM 326,214
***EMISSION TEST RESULTS***
ISOKINETIC RATIO PERCENT 97.3
SAMPLE VOLUME, DRY (68F, 29.92"Hg) DSCF 64.31SAMPLE VOLUME, DRY (68F, 29.92"Hg) DSCM 1.82SAMPLE VOLUME, DRY (32F, 29.92"Hg) NM3 @ 0C 1.70
AIR TOX ENVIRONMENTAL COMPANY

EMISSION MEASURMENT GROUPEMISSION TEST DATA
TEST NO. PAH T-1LOCATION Exhaust stackFIRM Waterbury GenerationTIME 8:31-10:52DATE 8/7/2009
TIME METER VOL dP Tmi Tmo Ts delta H SQRT dPPOINT (min) (FT³) (in H2O) (°F) (°F) (°F) (in H2O)
1 315.439 2.4 72 71 820 0.900 1.54922 2.10 72 70 821 0.790 1.44913 2 73 71 819 0.750 1.41424 2 74 71 821 0.750 1.41425 1.8 76 72 822 0.680 1.34166 1.6 76 72 819 0.610 1.26497 2.6 75 73 818 0.990 1.61258 2.7 78 74 819 1.030 1.64329 2.8 79 75 820 1.060 1.673310 3.00 80 75 820 1.140 1.732111 2.7 81 76 820 1.030 1.643212 1.8 82 76 820 0.690 1.34161 2.50 79 78 821 0.950 1.58112 2.40 82 78 821 0.920 1.54923 2.60 83 78 821 0.990 1.61254 2.70 84 79 822 1.030 1.64325 2.70 84 79 822 1.030 1.64326 2.70 84 80 821 1.040 1.64327 2.50 83 80 821 0.960 1.58118 2.60 84 80 821 0.990 1.61259 2.00 84 80 821 1.040 1.414210 2.80 85 80 822 1.070 1.673311 2.60 85 80 822 1.000 1.612512 2.20 85 80 822 0.840 1.4832
381.4 Vm = 65.973 AVERAGE 78.1 820.7 0.928 1.5470
AIR TOX ENVIRONMENTAL COMPANY

EMISSION MEASURMENT GROUPEMISSION TEST DATA
TEST NO. PAH T-2LOCATION Exhaust stackFIRM Waterbury GenerationTIME 11:29-13:54DATE 8/7/2009Proj No. 9020
BAROMETRIC PRESSURE in. HG 30.20STACK AREA SQ. FT 104.57NOZZLE DIAMETER INCHES 0.180DRY GAS METER CAL FACTOR [Y] ******** 0.9820METER ORIFICE COEFFICIENT [dH@] ******** 1.78PITOT COEFFICIENT ******** 0.84STATIC PRESSURE IN. H2O 1.8SAMPLE DURATION MINUTES 120
***ESTIMATES TO SET-UP NOMOGRAPH***ESTIMATED MOISTURE PERCENT 12.0ESTIMATED MW STACK GAS lb/lbMole 28.8
*NOTE UPON COMPLETION OF TESTING, ENTER IMPINGER VOLUMES AND ACTUAL STACK GAS CONCENTRATIONS BELOW TO OBTAIN THE ACTUAL MOISTURES AND ISOKINETICS.
AVG SQUARE ROOT OF DELTA P IN. H2O 1.5650AVG DELTA H IN. H20 0.95AVG METER TEMPERATURE DEG. F 85.5AVG STACK TEMPERATURE DEG. F 822.3SAMPLE VOLUME CU. FT 67.325
MOISTURE PERCENT 8.0VOL. OF LIGUID - IMPINGERS GRAMS 106.0VOL. OF LIGUID - SILICA GEL GRAMS 14.0
***STACK GAS ANALYSIS***CO2 PERCENT 5.7O2 PERCENT 13.2CO PERCENT 0.0N2 PERCENT 81.11FUEL FACTOR Fo 1.353MOLECULAR WEIGHT OF STACK GAS lb/lbMole 28.52EXCESS AIR PERCENT 160.4STACK VELOCITY FPM 8209VOLUMETRIC FLOWRATE, ACTUAL ACFM 858,460 VOLUMETRIC FLOWRATE,DRY STD DSCFM 329,586
***EMISSION TEST RESULTS***
ISOKINETIC RATIO PERCENT 96.9
SAMPLE VOLUME, DRY (68F, 29.92"Hg) DSCF 64.74SAMPLE VOLUME, DRY (68F, 29.92"Hg) DSCM 1.83SAMPLE VOLUME, DRY (32F, 29.92"Hg) NM3 @ 0C 1.71
AIR TOX ENVIRONMENTAL COMPANY
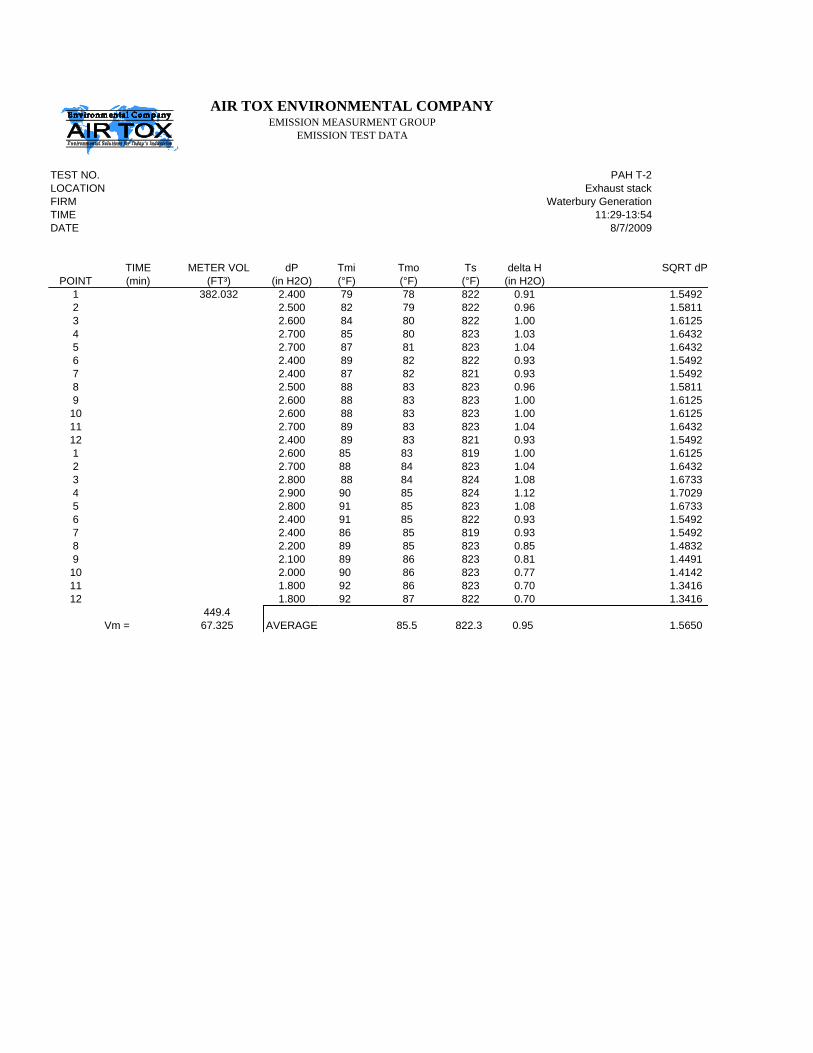
EMISSION MEASURMENT GROUPEMISSION TEST DATA
TEST NO. PAH T-2LOCATION Exhaust stackFIRM Waterbury GenerationTIME 11:29-13:54DATE 8/7/2009
TIME METER VOL dP Tmi Tmo Ts delta H SQRT dPPOINT (min) (FT³) (in H2O) (°F) (°F) (°F) (in H2O)
1 382.032 2.400 79 78 822 0.91 1.54922 2.500 82 79 822 0.96 1.58113 2.600 84 80 822 1.00 1.61254 2.700 85 80 823 1.03 1.64325 2.700 87 81 823 1.04 1.64326 2.400 89 82 822 0.93 1.54927 2.400 87 82 821 0.93 1.54928 2.500 88 83 823 0.96 1.58119 2.600 88 83 823 1.00 1.612510 2.600 88 83 823 1.00 1.612511 2.700 89 83 823 1.04 1.643212 2.400 89 83 821 0.93 1.54921 2.600 85 83 819 1.00 1.61252 2.700 88 84 823 1.04 1.64323 2.800 88 84 824 1.08 1.67334 2.900 90 85 824 1.12 1.70295 2.800 91 85 823 1.08 1.67336 2.400 91 85 822 0.93 1.54927 2.400 86 85 819 0.93 1.54928 2.200 89 85 823 0.85 1.48329 2.100 89 86 823 0.81 1.449110 2.000 90 86 823 0.77 1.414211 1.800 92 86 823 0.70 1.341612 1.800 92 87 822 0.70 1.3416
449.4 Vm = 67.325 AVERAGE 85.5 822.3 0.95 1.5650
AIR TOX ENVIRONMENTAL COMPANY
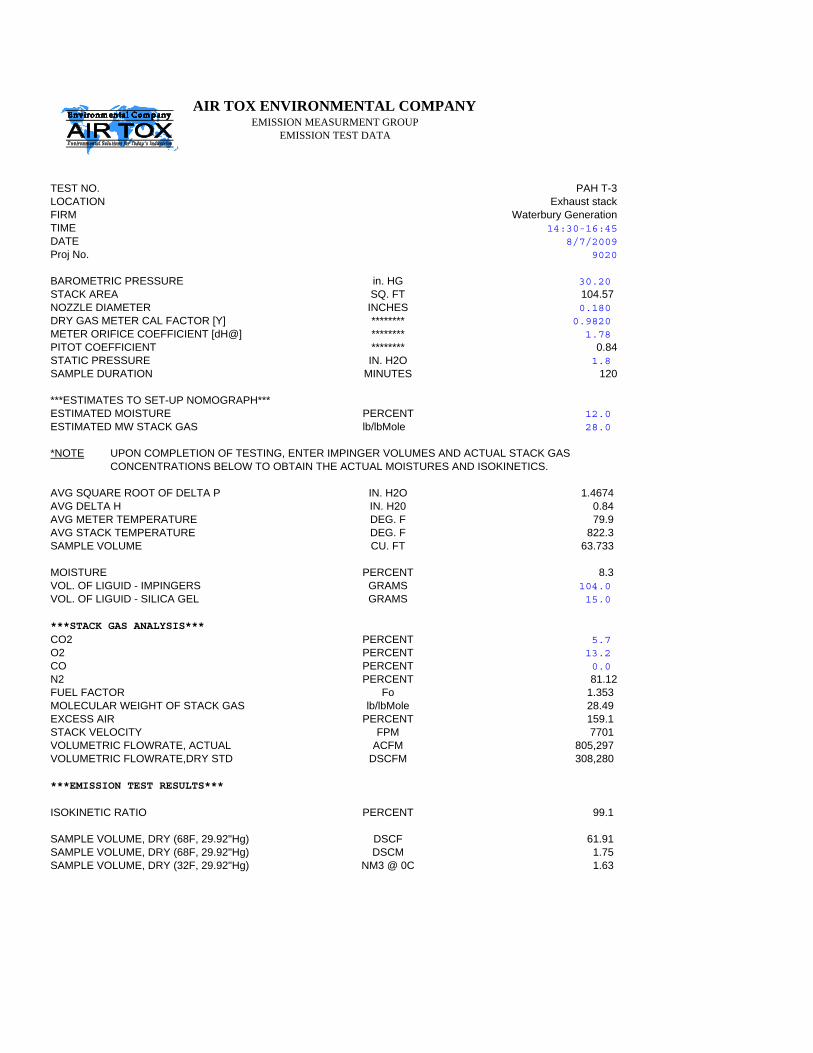
EMISSION MEASURMENT GROUPEMISSION TEST DATA
TEST NO. PAH T-3LOCATION Exhaust stackFIRM Waterbury GenerationTIME 14:30-16:45DATE 8/7/2009Proj No. 9020
BAROMETRIC PRESSURE in. HG 30.20STACK AREA SQ. FT 104.57NOZZLE DIAMETER INCHES 0.180DRY GAS METER CAL FACTOR [Y] ******** 0.9820METER ORIFICE COEFFICIENT [dH@] ******** 1.78PITOT COEFFICIENT ******** 0.84STATIC PRESSURE IN. H2O 1.8SAMPLE DURATION MINUTES 120
***ESTIMATES TO SET-UP NOMOGRAPH***ESTIMATED MOISTURE PERCENT 12.0ESTIMATED MW STACK GAS lb/lbMole 28.0
*NOTE UPON COMPLETION OF TESTING, ENTER IMPINGER VOLUMES AND ACTUAL STACK GAS CONCENTRATIONS BELOW TO OBTAIN THE ACTUAL MOISTURES AND ISOKINETICS.
AVG SQUARE ROOT OF DELTA P IN. H2O 1.4674AVG DELTA H IN. H20 0.84AVG METER TEMPERATURE DEG. F 79.9AVG STACK TEMPERATURE DEG. F 822.3SAMPLE VOLUME CU. FT 63.733
MOISTURE PERCENT 8.3VOL. OF LIGUID - IMPINGERS GRAMS 104.0VOL. OF LIGUID - SILICA GEL GRAMS 15.0
***STACK GAS ANALYSIS***CO2 PERCENT 5.7O2 PERCENT 13.2CO PERCENT 0.0N2 PERCENT 81.12FUEL FACTOR Fo 1.353MOLECULAR WEIGHT OF STACK GAS lb/lbMole 28.49EXCESS AIR PERCENT 159.1STACK VELOCITY FPM 7701VOLUMETRIC FLOWRATE, ACTUAL ACFM 805,297 VOLUMETRIC FLOWRATE,DRY STD DSCFM 308,280
***EMISSION TEST RESULTS***
ISOKINETIC RATIO PERCENT 99.1
SAMPLE VOLUME, DRY (68F, 29.92"Hg) DSCF 61.91SAMPLE VOLUME, DRY (68F, 29.92"Hg) DSCM 1.75SAMPLE VOLUME, DRY (32F, 29.92"Hg) NM3 @ 0C 1.63
AIR TOX ENVIRONMENTAL COMPANY

EMISSION MEASURMENT GROUPEMISSION TEST DATA
TEST NO. PAH T-3LOCATION Exhaust stackFIRM Waterbury GenerationTIME 14:30-16:45DATE 8/7/2009
TIME METER VOL dP Tmi Tmo Ts delta H SQRT dPPOINT (min) (FT³) (in H2O) (°F) (°F) (°F) (in H2O)
1 450.06 2.400 82 82 823 0.93 1.54922 2.200 81 80 822 0.85 1.48323 2.100 81 80 823 0.81 1.44914 1.900 82 80 823 0.73 1.37845 1.800 82 80 823 0.7 1.34166 1.600 82 80 823 0.62 1.26497 2.500 80 79 823 0.97 1.58118 2.700 82 80 822 1.05 1.64329 2.900 81 80 822 1.12 1.702910 2.900 81 79 822 1.12 1.702911 2.700 81 80 824 1.04 1.643212 2.300 81 78 823 0.89 1.51661 2.400 80 79 822 0.93 1.54922 2.200 81 79 823 0.85 1.48323 2.100 81 79 822 0.82 1.44914 2.000 82 80 822 0.78 1.41425 1.800 82 78 821 0.70 1.34166 1.600 80 79 819 0.63 1.26497 2.500 79 78 823 0.97 1.58118 2.200 80 77 822 0.86 1.48329 2.100 80 77 822 0.82 1.449110 1.900 78 77 822 0.74 1.378411 1.800 80 78 821 0.71 1.341612 1.500 79 77 822 0.59 1.2247
513.793 Vm = 63.733 AVERAGE 79.9 822.3 0.84 1.4674
AIR TOX ENVIRONMENTAL COMPANY
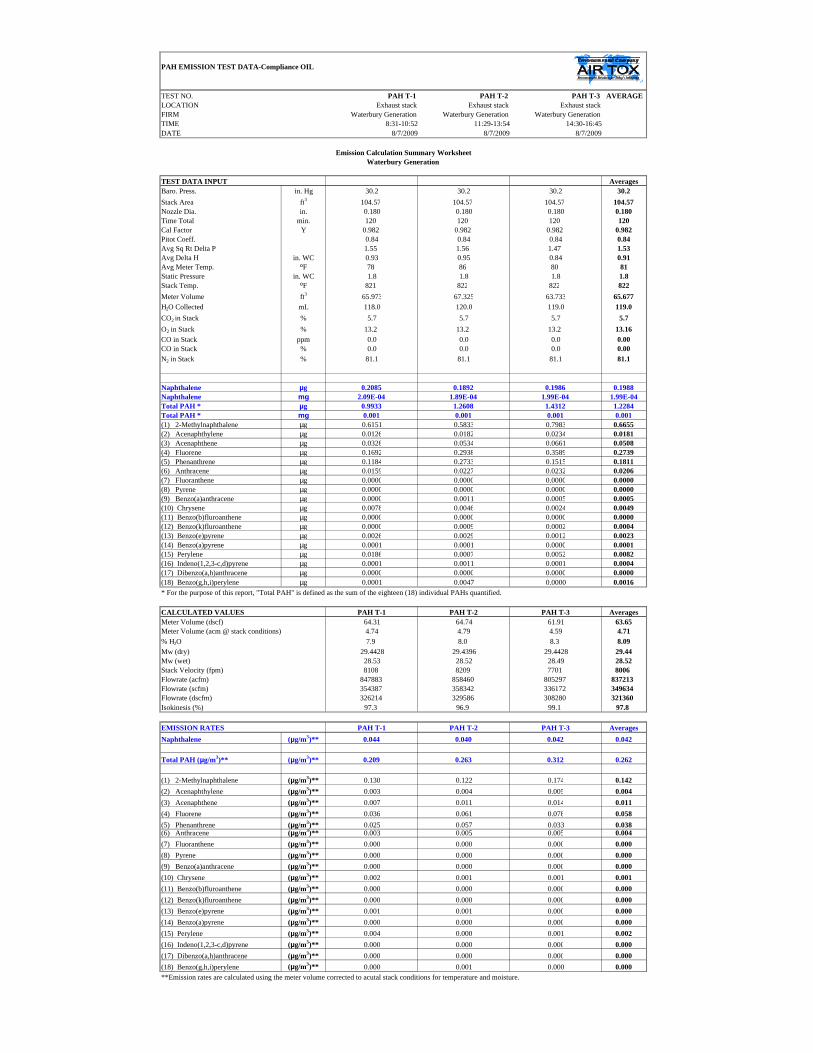
PAH EMISSION TEST DATA-Compliance OIL
TEST NO. PAH T-1 PAH T-2 PAH T-3 AVERAGELOCATION Exhaust stack Exhaust stack Exhaust stackFIRM Waterbury Generation Waterbury Generation Waterbury GenerationTIME 8:31-10:52 11:29-13:54 14:30-16:45DATE 8/7/2009 8/7/2009 8/7/2009
Emission Calculation Summary WorksheetWaterbury Generation
TEST DATA INPUT AveragesBaro. Press. in. Hg 30.2 30.2 30.2 30.2Stack Area ft3 104.57 104.57 104.57 104.57Nozzle Dia. in. 0.180 0.180 0.180 0.180Time Total min. 120 120 120 120Cal Factor Y 0.982 0.982 0.982 0.982Pitot Coeff. 0.84 0.84 0.84 0.84Avg Sq Rt Delta P 1.55 1.56 1.47 1.53Avg Delta H in. WC 0.93 0.95 0.84 0.91Avg Meter Temp. ºF 78 86 80 81Static Pressure in. WC 1.8 1.8 1.8 1.8Stack Temp. ºF 821 822 822 822Meter Volume ft3 65.973 67.325 63.733 65.677H2O Collected mL 118.0 120.0 119.0 119.0CO2 in Stack % 5.7 5.7 5.7 5.7O2 in Stack % 13.2 13.2 13.2 13.16CO in Stack ppm 0.0 0.0 0.0 0.00CO in Stack % 0.0 0.0 0.0 0.00N2 in Stack % 81.1 81.1 81.1 81.1
Naphthalene µg 0.2085 0.1892 0.1986 0.1988Naphthalene mg 2.09E-04 1.89E-04 1.99E-04 1.99E-04Total PAH * µg 0.9933 1.2608 1.4312 1.2284Total PAH * mg 0.001 0.001 0.001 0.001(1) 2-Methylnaphthalene µg 0.6151 0.5833 0.7983 0.6655(2) Acenaphthylene µg 0.0126 0.0182 0.0234 0.0181(3) Acenaphthene µg 0.0328 0.0534 0.0661 0.0508(4) Fluorene µg 0.1692 0.2938 0.3589 0.2739(5) Phenanthrene µg 0.1184 0.2733 0.1515 0.1811(6) Anthracene µg 0.0159 0.0227 0.0232 0.0206(7) Fluoranthene µg 0.0000 0.0000 0.0000 0.0000(8) Pyrene µg 0.0000 0.0000 0.0000 0.0000(9) Benzo(a)anthracene µg 0.0000 0.0011 0.0005 0.0005(10) Chrysene µg 0.0078 0.0046 0.0024 0.0049(11) Benzo(b)fluroanthene µg 0.0000 0.0000 0.0000 0.0000(12) Benzo(k)fluroanthene µg 0.0000 0.0009 0.0002 0.0004(13) Benzo(e)pyrene µg 0.0026 0.0029 0.0012 0.0023(14) Benzo(a)pyrene µg 0.0001 0.0001 0.0000 0.0001(15) Perylene µg 0.0186 0.0007 0.0052 0.0082(16) Indeno(1,2,3-c,d)pyrene µg 0.0001 0.0011 0.0001 0.0004(17) Dibenzo(a,h)anthracene µg 0.0000 0.0000 0.0000 0.0000(18) Benzo(g,h,i)perylene µg 0.0001 0.0047 0.0000 0.0016* For the purpose of this report, "Total PAH" is defined as the sum of the eighteen (18) individual PAHs quantified.
CALCULATED VALUES PAH T-1 PAH T-2 PAH T-3 AveragesMeter Volume (dscf) 64.31 64.74 61.91 63.65Meter Volume (acm @ stack conditions) 4.74 4.79 4.59 4.71% H2O 7.9 8.0 8.3 8.09Mw (dry) 29.4428 29.4396 29.4428 29.44Mw (wet) 28.53 28.52 28.49 28.52Stack Velocity (fpm) 8108 8209 7701 8006Flowrate (acfm) 847883 858460 805297 837213Flowrate (scfm) 354387 358342 336172 349634Flowrate (dscfm) 326214 329586 308280 321360Isokinesis (%) 97.3 96.9 99.1 97.8
EMISSION RATES PAH T-1 PAH T-2 PAH T-3 AveragesNaphthalene (µg/m3)** 0.044 0.040 0.042 0.042Naphthalene lbs/hr** 1.40E-04 1.27E-04 1.31E-04 1.33E-04Total PAH (µg/m3)** (µg/m3)** 0.209 0.263 0.312 0.262Total PAH (lbs/hr) lbs/hr** 6.66E-04 8.48E-04 9.42E-04 8.19E-04(1) 2-Methylnaphthalene (µg/m3)** 0.130 0.122 0.174 0.142(2) Acenaphthylene (µg/m3)** 0.003 0.004 0.005 0.004(3) Acenaphthene (µg/m3)** 0.007 0.011 0.014 0.011(4) Fluorene (µg/m3)** 0.036 0.061 0.078 0.058(5) Phenanthrene (µg/m3)** 0.025 0.057 0.033 0.038(6) Anthracene (µg/m3)** 0.003 0.005 0.005 0.004(7) Fluoranthene (µg/m3)** 0.000 0.000 0.000 0.000(8) Pyrene (µg/m3)** 0.000 0.000 0.000 0.000(9) Benzo(a)anthracene (µg/m3)** 0.000 0.000 0.000 0.000(10) Chrysene (µg/m3)** 0.002 0.001 0.001 0.001(11) Benzo(b)fluroanthene (µg/m3)** 0.000 0.000 0.000 0.000(12) Benzo(k)fluroanthene (µg/m3)** 0.000 0.000 0.000 0.000(13) Benzo(e)pyrene (µg/m3)** 0.001 0.001 0.000 0.000(14) Benzo(a)pyrene (µg/m3)** 0.000 0.000 0.000 0.000(15) Perylene (µg/m3)** 0.004 0.000 0.001 0.002(16) Indeno(1,2,3-c,d)pyrene (µg/m3)** 0.000 0.000 0.000 0.000(17) Dibenzo(a,h)anthracene (µg/m3)** 0.000 0.000 0.000 0.000(18) Benzo(g,h,i)perylene (µg/m3)** 0.000 0.001 0.000 0.000**Emission rates are calculated using the meter volume corrected to acutal stack conditions for temperature and moisture.

APPENDIX B.5 MASC Calculations
Results Summary Data Sheets

Distance from discharge point to nearest property line (greater of actual distance v. H Distance) (x) = 182.03 meters 33 feetAverage actual flow rate (v) = 830807 acfm
392.141 m3/secStack Height (H) = 38.10 meters 125.0 feet
H Distance = 4.47(H-20)^1.28 182.03
Sulfuric Acid Hazardous Limiting Value (HLV) 20 µg/m3
Sulfuric Acid CT MASC (H>20 m) 440.654 µg/m3
0.441 mg/m3
MASC Calculation Waterbury Generation, LLC
MASC For Stack Height of Greater Than 20 Meters

Distance from discharge point to nearest property line (greater of actual distance v. H Distance) (x) = 182.03 meters 33 feetAverage actual flow rate (v) = 825238 acfm
389.512 m3/secStack Height (H) = 38.10 meters 125.0 feet
H Distance = 4.47(H-20)^1.28 182.03
Formaldehyde Hazardous Limiting Value (HLV) 12 µg/m3
Formaldehyde CT MASC (H>20 m) 266.060 µg/m3
0.266 mg/m3
MASC Calculation Waterbury Generation, LLC
MASC For Stack Height of Greater Than 20 Meters

Distance from discharge point to nearest property line (greater of actual distance v. H Distance) (x) = 182.03 meters 33 feetAverage actual flow rate (v) = 825238 acfm
389.512 m3/secStack Height (H) = 38.10 meters 125.0 feet
H Distance = 4.47(H-20)^1.28 182.03
Benzene Hazardous Limiting Value (HLV) 150 µg/m3
Benzene CT MASC (H>20 m) 3325.751 µg/m3
3.326 mg/m3
MASC Calculation Waterbury Generation, LLC
MASC For Stack Height of Greater Than 20 Meters

Distance from discharge point to nearest property line (greater of actual distance v. H Distance) (x) = 182.03 meters 33 feetAverage actual flow rate (v) = 825238 acfm
389.512 m3/secStack Height (H) = 38.10 meters 125.0 feet
H Distance = 4.47(H-20)^1.28 182.03
1, 3 Butadiene Hazardous Limiting Value (HLV) 22000 µg/m3
1, 3 Butadiene CT MASC (H>20 m) 4.88E+05 µg/m3
487.777 mg/m3
MASC Calculation Waterbury Generation, LLC
MASC For Stack Height of Greater Than 20 Meters
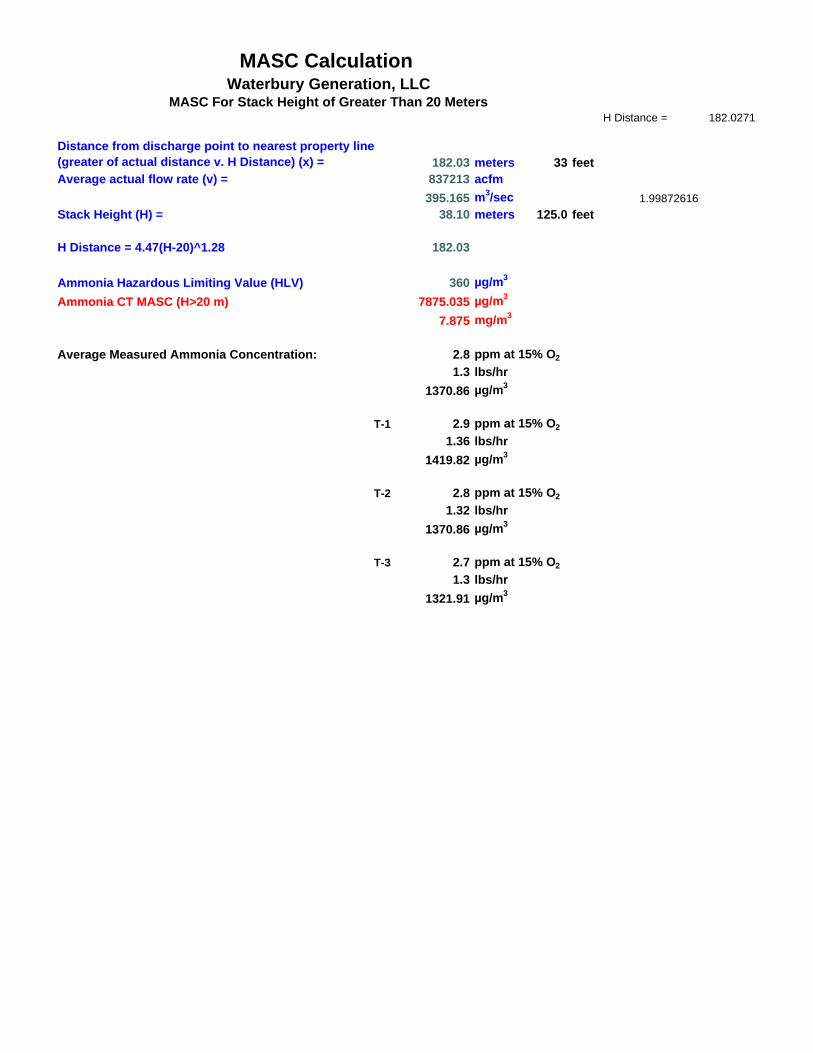
H Distance = 182.0271
Distance from discharge point to nearest property line (greater of actual distance v. H Distance) (x) = 182.03 meters 33 feetAverage actual flow rate (v) = 837213 acfm
395.165 m3/sec 1.99872616Stack Height (H) = 38.10 meters 125.0 feet
H Distance = 4.47(H-20)^1.28 182.03
Ammonia Hazardous Limiting Value (HLV) 360 µg/m3
Ammonia CT MASC (H>20 m) 7875.035 µg/m3
7.875 mg/m3
Average Measured Ammonia Concentration: 2.8 ppm at 15% O2
1.3 lbs/hr1370.86 µg/m3
T-1 2.9 ppm at 15% O2
1.36 lbs/hr1419.82 µg/m3
T-2 2.8 ppm at 15% O2
1.32 lbs/hr1370.86 µg/m3
T-3 2.7 ppm at 15% O2
1.3 lbs/hr1321.91 µg/m3
MASC Calculation Waterbury Generation, LLC
MASC For Stack Height of Greater Than 20 Meters
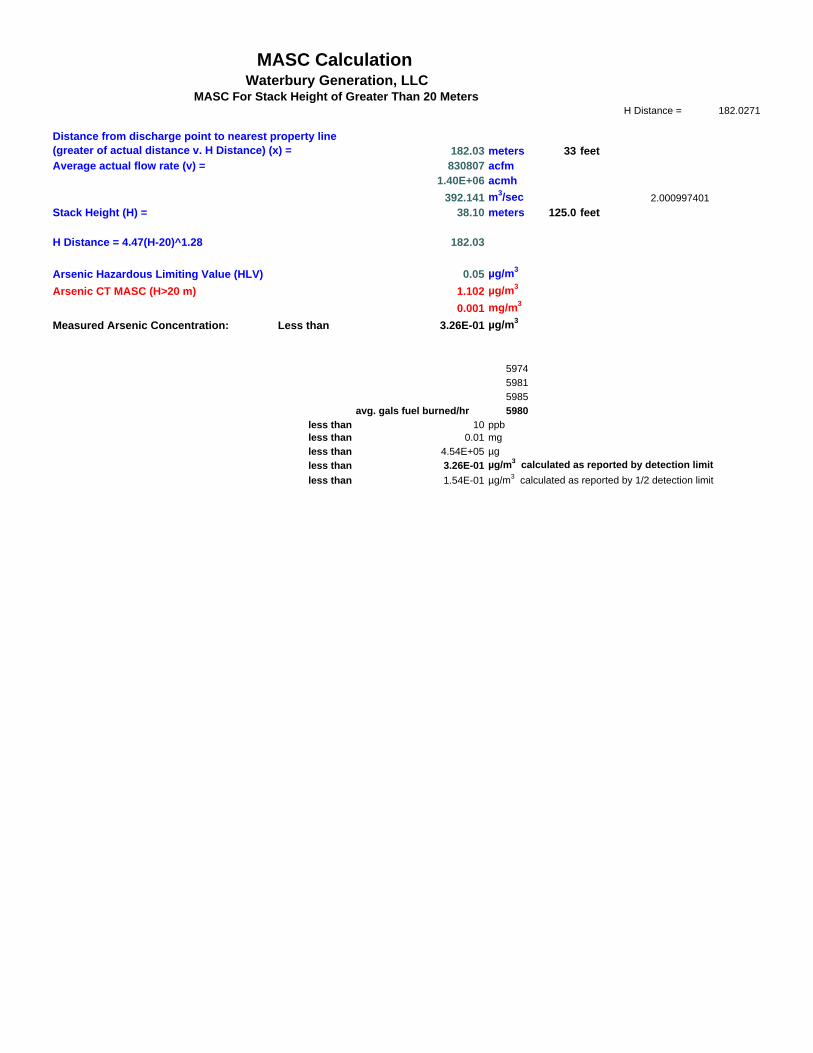
H Distance = 182.0271
Distance from discharge point to nearest property line (greater of actual distance v. H Distance) (x) = 182.03 meters 33 feetAverage actual flow rate (v) = 830807 acfm
1.40E+06 acmh392.141 m3/sec 2.000997401
Stack Height (H) = 38.10 meters 125.0 feet
H Distance = 4.47(H-20)^1.28 182.03
Arsenic Hazardous Limiting Value (HLV) 0.05 µg/m3
Arsenic CT MASC (H>20 m) 1.102 µg/m3
0.001 mg/m3
Measured Arsenic Concentration: Less than 3.26E-01 µg/m3
597459815985
avg. gals fuel burned/hr 5980less than 10 ppbless than 0.01 mgless than 4.54E+05 µgless than 3.26E-01 µg/m3 calculated as reported by detection limitless than 1.54E-01 µg/m3 calculated as reported by 1/2 detection limit
MASC Calculation Waterbury Generation, LLC
MASC For Stack Height of Greater Than 20 Meters
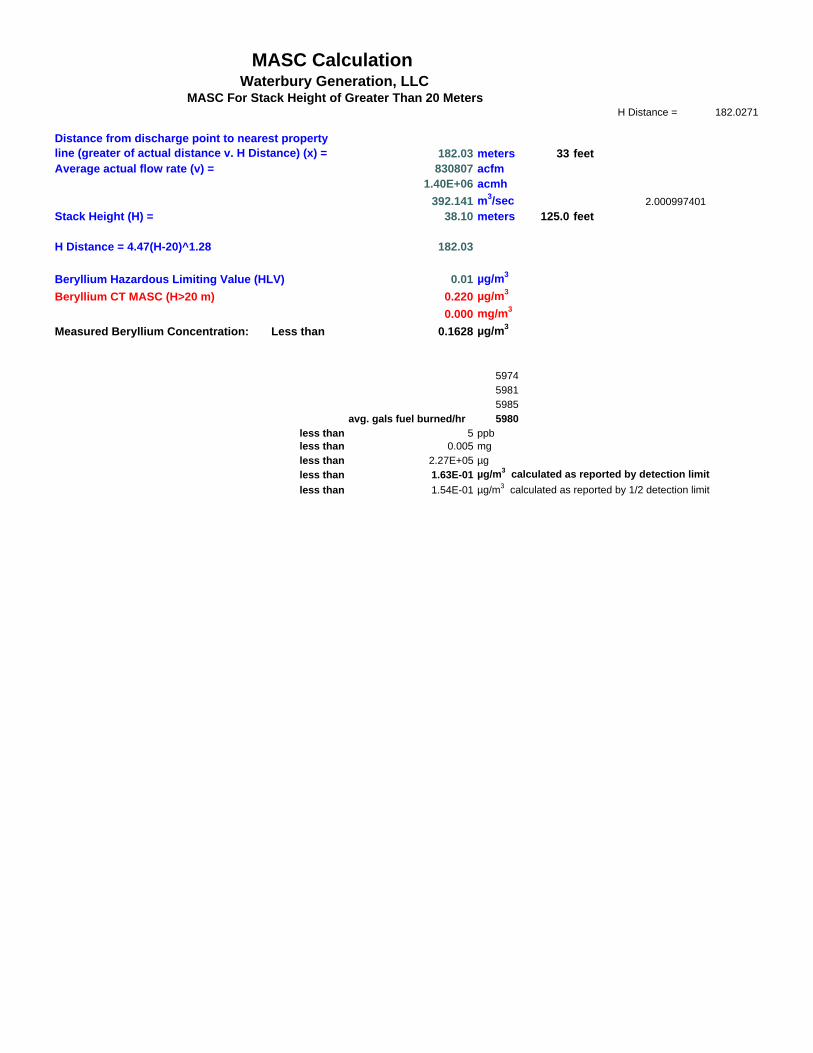
H Distance = 182.0271
Distance from discharge point to nearest property line (greater of actual distance v. H Distance) (x) = 182.03 meters 33 feetAverage actual flow rate (v) = 830807 acfm
1.40E+06 acmh392.141 m3/sec 2.000997401
Stack Height (H) = 38.10 meters 125.0 feet
H Distance = 4.47(H-20)^1.28 182.03
Beryllium Hazardous Limiting Value (HLV) 0.01 µg/m3
Beryllium CT MASC (H>20 m) 0.220 µg/m3
0.000 mg/m3
Measured Beryllium Concentration: Less than 0.1628 µg/m3
597459815985
avg. gals fuel burned/hr 5980less than 5 ppbless than 0.005 mgless than 2.27E+05 µgless than 1.63E-01 µg/m3 calculated as reported by detection limitless than 1.54E-01 µg/m3 calculated as reported by 1/2 detection limit
MASC Calculation Waterbury Generation, LLC
MASC For Stack Height of Greater Than 20 Meters
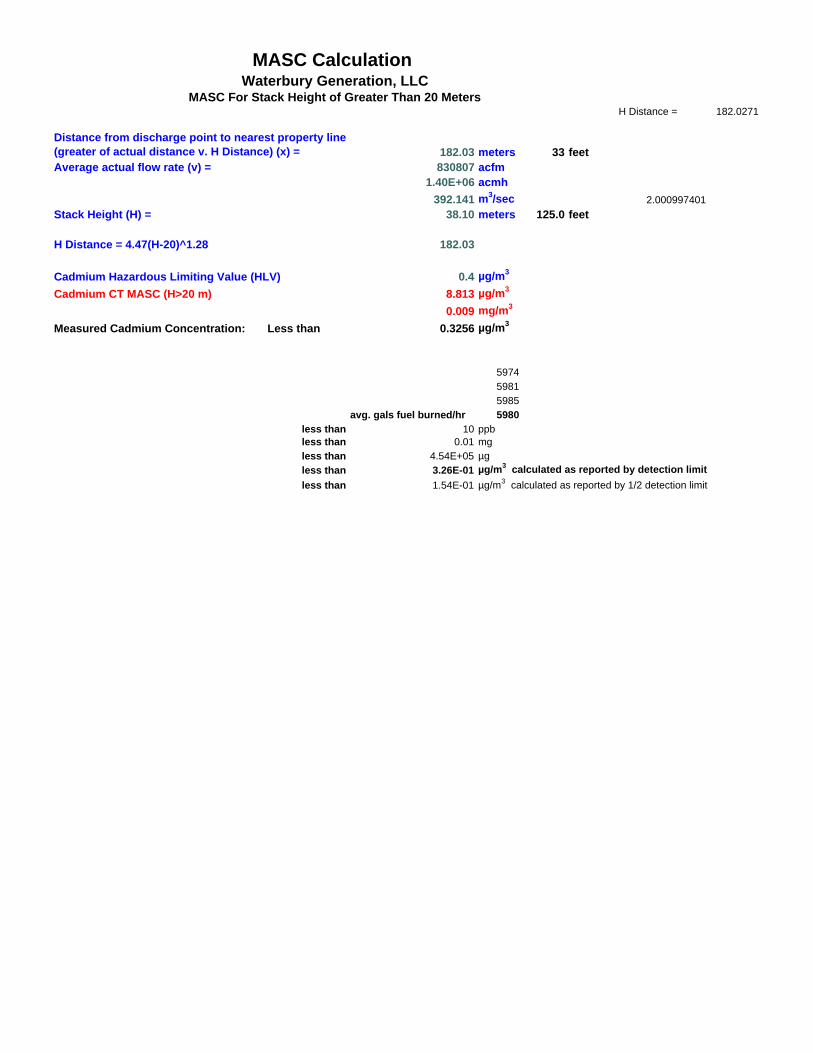
H Distance = 182.0271
Distance from discharge point to nearest property line (greater of actual distance v. H Distance) (x) = 182.03 meters 33 feetAverage actual flow rate (v) = 830807 acfm
1.40E+06 acmh392.141 m3/sec 2.000997401
Stack Height (H) = 38.10 meters 125.0 feet
H Distance = 4.47(H-20)^1.28 182.03
Cadmium Hazardous Limiting Value (HLV) 0.4 µg/m3
Cadmium CT MASC (H>20 m) 8.813 µg/m3
0.009 mg/m3
Measured Cadmium Concentration: Less than 0.3256 µg/m3
597459815985
avg. gals fuel burned/hr 5980less than 10 ppbless than 0.01 mgless than 4.54E+05 µgless than 3.26E-01 µg/m3 calculated as reported by detection limitless than 1.54E-01 µg/m3 calculated as reported by 1/2 detection limit
MASC Calculation Waterbury Generation, LLC
MASC For Stack Height of Greater Than 20 Meters

H Distance = 182.0271
Distance from discharge point to nearest property line (greater of actual distance v. H Distance) (x) = 182.03 meters 33 feetAverage actual flow rate (v) = 830807 acfm
1.40E+06 acmh392.141 m3/sec 2.000997401
Stack Height (H) = 38.10 meters 125.0 feet
H Distance = 4.47(H-20)^1.28 182.03
Chromium Hazardous Limiting Value (HLV) 2.5 µg/m3
Chromium CT MASC (H>20 m) 55.082 µg/m3
0.055 mg/m3
Measured Chromium Concentration: 0.4689 µg/m3
597459815985
avg. gals fuel burned/hr 598014.4 ppb
0.0144 mg6.54E+05 µg4.69E-01 µg/m3 calculated as reported by detection limit
MASC Calculation Waterbury Generation, LLC
MASC For Stack Height of Greater Than 20 Meters
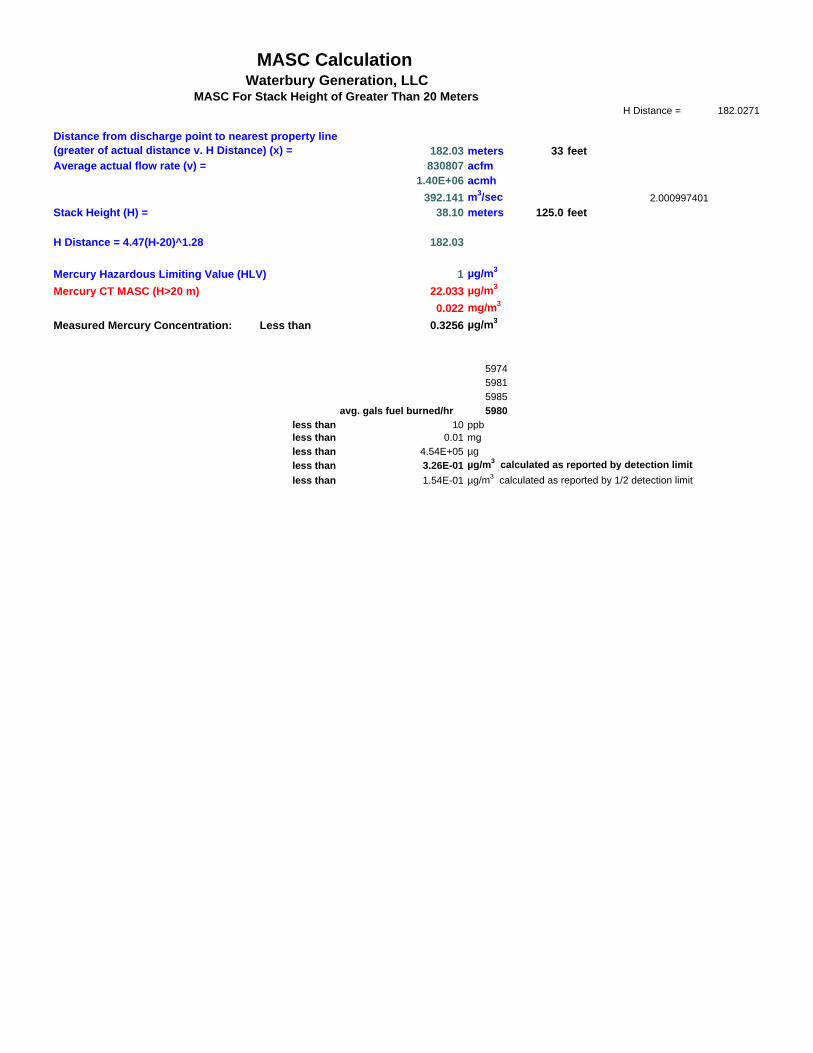
H Distance = 182.0271
Distance from discharge point to nearest property line(greater of actual distance v. H Distance) (x) = 182.03 meters 33 feetAverage actual flow rate (v) = 830807 acfm
1.40E+06 acmh392.141 m3/sec 2.000997401
Stack Height (H) = 38.10 meters 125.0 feet
H Distance = 4.47(H-20)^1.28 182.03
Mercury Hazardous Limiting Value (HLV) 1 µg/m3
Mercury CT MASC (H>20 m) 22.033 µg/m3
0.022 mg/m3
Measured Mercury Concentration: Less than 0.3256 µg/m3
597459815985
avg. gals fuel burned/hr 5980less than 10 ppbless than 0.01 mgless than 4.54E+05 µgless than 3.26E-01 µg/m3 calculated as reported by detection limitless than 1.54E-01 µg/m3 calculated as reported by 1/2 detection limit
MASC Calculation Waterbury Generation, LLC
MASC For Stack Height of Greater Than 20 Meters

H Distance = 182.0271
Distance from discharge point to nearest property line (greater of actual distance v. H Distance) (x) = 182.03 meters 33 feetAverage actual flow rate (v) = 830807 acfm
1.40E+06 acmh392.141 m3/sec 2.000997401
Stack Height (H) = 38.10 meters 125.0 feet
H Distance = 4.47(H-20)^1.28 182.03
Manganese Hazardous Limiting Value (HLV) 20 µg/m3
Manganese CT MASC (H>20 m) 440.654 µg/m3
0.441 mg/m3
Measured Manganese Concentration: 1.7160 µg/m3
597459815985
avg. gals fuel burned/hr 598052.7 ppb
0.0527 mg2.40E+06 µg1.72E+00 µg/m3 calculated as reported by detection limit1.54E-01 µg/m3 calculated as reported by 1/2 detection limit
MASC Calculation Waterbury Generation, LLC
MASC For Stack Height of Greater Than 20 Meters

H Distance = 182.0271
Distance from discharge point to nearest property line (greater of actual distance v. H Distance) (x) = 182.03 meters 33 feetAverage actual flow rate (v) = 830807 acfm
1.40E+06 acmh392.141 m3/sec 2.000997401
Stack Height (H) = 38.10 meters 125.0 feet
H Distance = 4.47(H-20)^1.28 182.03
Nickel Hazardous Limiting Value (HLV) 5 µg/m3
Nickel CT MASC (H>20 m) 110.163 µg/m3
0.110 mg/m3
Measured Nickel Concentration: 0.4428 µg/m3
597459815985
avg. gals fuel burned/hr 598013.6 ppb
0.0136 mg6.18E+05 µg4.43E-01 µg/m3 calculated as reported by detection limit
MASC Calculation Waterbury Generation, LLC
MASC For Stack Height of Greater Than 20 Meters

H Distance = 182.0271
Distance from discharge point to nearest property line (greater of actual distance v. H Distance) (x) = 182.03 meters 33 feetAverage actual flow rate (v) = 830807 acfm
1.40E+06 acmh392.141 m3/sec 2.000997401
Stack Height (H) = 38.10 meters 125.0 feet
H Distance = 4.47(H-20)^1.28 182.03
Lead Hazardous Limiting Value (HLV) 3 µg/m3
Lead CT MASC (H>20 m) 66.098 µg/m3
0.066 mg/m3
Measured Lead Concentration: Less than 0.3256 µg/m3
597459815985
avg. gals fuel burned/hr 5980less than 10 ppbless than 0.01 mgless than 4.54E+05 µgless than 3.26E-01 µg/m3 calculated as reported by detection limitless than 1.54E-01 µg/m3 calculated as reported by 1/2 detection limit
MASC Calculation Waterbury Generation, LLC
MASC For Stack Height of Greater Than 20 Meters
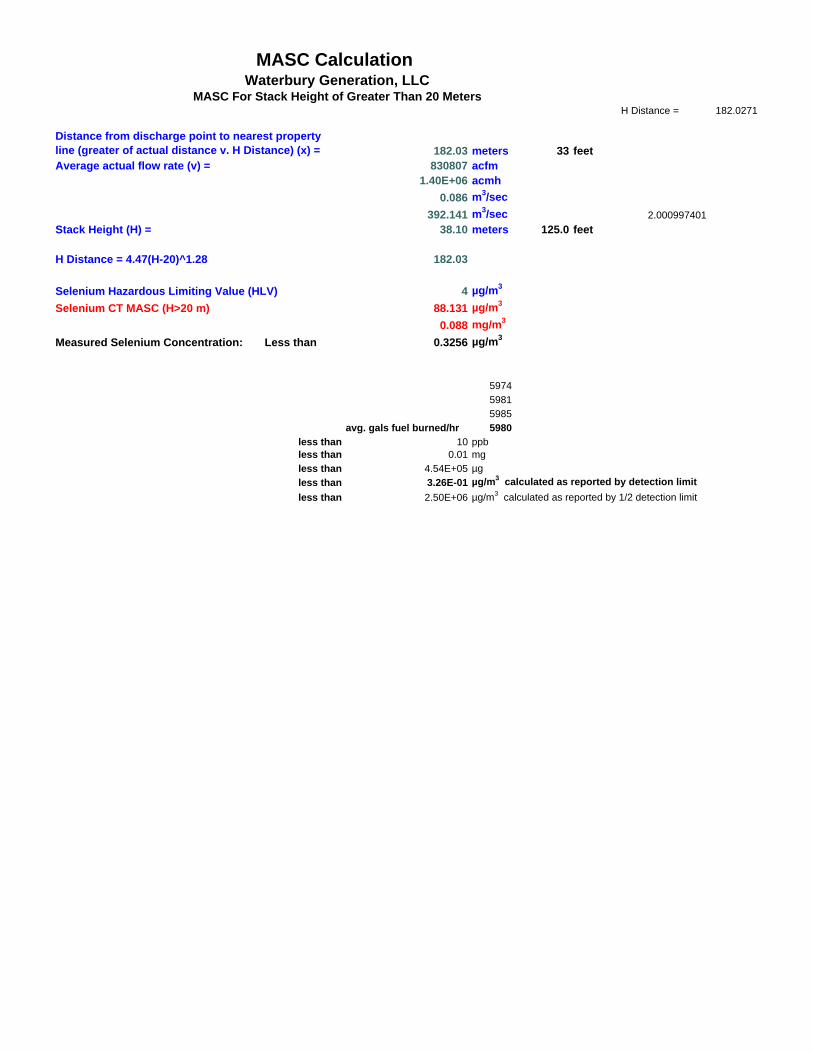
H Distance = 182.0271
Distance from discharge point to nearest property line (greater of actual distance v. H Distance) (x) = 182.03 meters 33 feetAverage actual flow rate (v) = 830807 acfm
1.40E+06 acmh0.086 m3/sec
392.141 m3/sec 2.000997401Stack Height (H) = 38.10 meters 125.0 feet
H Distance = 4.47(H-20)^1.28 182.03
Selenium Hazardous Limiting Value (HLV) 4 µg/m3
Selenium CT MASC (H>20 m) 88.131 µg/m3
0.088 mg/m3
Measured Selenium Concentration: Less than 0.3256 µg/m3
597459815985
avg. gals fuel burned/hr 5980less than 10 ppbless than 0.01 mgless than 4.54E+05 µgless than 3.26E-01 µg/m3 calculated as reported by detection limitless than 2.50E+06 µg/m3 calculated as reported by 1/2 detection limit
MASC Calculation Waterbury Generation, LLC
MASC For Stack Height of Greater Than 20 Meters

Distance from discharge point to nearest property line (greater of actual distance v. H Distance) (x) = 182.03 meters 33 feetAverage actual flow rate (v) = 837213 acfm
395.165 m3/secStack Height (H) = 38.10 meters 125.0 feet
H Distance = 4.47(H-20)^1.28 182.03
Naphthalene Hazardous Limiting Value (HLV) 1000 µg/m3
Naphthalene CT MASC (H>20 m) 21875.097 µg/m3
21.875 mg/m3
MASC Calculation Waterbury Generation, LLC
MASC For Stack Height of Greater Than 20 Meters

Distance from discharge point to nearest property line (greater of actual distance v. H Distance) (x) = 182.03 meters 33 feetAverage actual flow rate (v) = 837213 acfm
395.165 m3/secStack Height (H) = 38.10 meters 125.0 feet
H Distance = 4.47(H-20)^1.28 182.03
Total PAH Hazardous Limiting Value (HLV) 0.1 µg/m3
Total PAH CT MASC (H>20 m) 2.188 µg/m3
0.002 mg/m3
MASC Calculation Waterbury Generation, LLC
MASC For Stack Height of Greater Than 20 Meters

Distance from discharge point to nearest property line (greater of actual distance v. H Distance) (x) = 182.03 meters 33 feetAverage actual flow rate (v) = 837213 acfm
395.165 m3/secStack Height (H) = 38.10 meters 125.0 feet
H Distance = 4.47(H-20)^1.28 182.03
2-Methylnaphthalene Hazardous Limiting Value (HLV) N/A µg/m3
2-Methylnapthalene CT MASC (H>20 m) #VALUE! µg/m3
#VALUE! mg/m3
MASC Calculation Waterbury Generation, LLC
MASC For Stack Height of Greater Than 20 Meters

Distance from discharge point to nearest property line (greater of actual distance v. H Distance) (x) = 182.03 meters 33 feetAverage actual flow rate (v) = 837213 acfm
395.165 m3/secStack Height (H) = 38.10 meters 125.0 feet
H Distance = 4.47(H-20)^1.28 182.03
Acenaphthylene Hazardous Limiting Value (HLV) N/A µg/m3
Acenaphthylene CT MASC (H>20 m) #VALUE! µg/m3
#VALUE! mg/m3
MASC Calculation Waterbury Generation, LLC
MASC For Stack Height of Greater Than 20 Meters

Distance from discharge point to nearest property line (greater of actual distance v. H Distance) (x) = 182.03 meters 33 feetAverage actual flow rate (v) = 837213 acfm
395.165 m3/secStack Height (H) = 38.10 meters 125.0 feet
H Distance = 4.47(H-20)^1.28 182.03
Acenaphthene Hazardous Limiting Value (HLV) N/A µg/m3
Acenaphthene CT MASC (H>20 m) #VALUE! µg/m3
#VALUE! mg/m3
MASC Calculation Waterbury Generation, LLC
MASC For Stack Height of Greater Than 20 Meters

Distance from discharge point to nearest property line (greater of actual distance v. H Distance) (x) = 182.03 meters 33 feetAverage actual flow rate (v) = 837213 acfm
395.165 m3/secStack Height (H) = 38.10 meters 125.0 feet
H Distance = 4.47(H-20)^1.28 182.03
Fluorine Hazardous Limiting Value (HLV) 4 µg/m3
Fluorine CT MASC (H>20 m) 87.500 µg/m3
0.088 mg/m3
MASC Calculation Waterbury Generation, LLC
MASC For Stack Height of Greater Than 20 Meters

Distance from discharge point to nearest property line (greater of actual distance v. H Distance) (x) = 182.03 meters 33 feetAverage actual flow rate (v) = 837213 acfm
395.165 m3/secStack Height (H) = 38.10 meters 125.0 feet
H Distance = 4.47(H-20)^1.28 182.03
Phenanthrene Hazardous Limiting Value (HLV) N/A µg/m3
Phenanthrene CT MASC (H>20 m) #VALUE! µg/m3
#VALUE! mg/m3
MASC Calculation Waterbury Generation, LLC
MASC For Stack Height of Greater Than 20 Meters
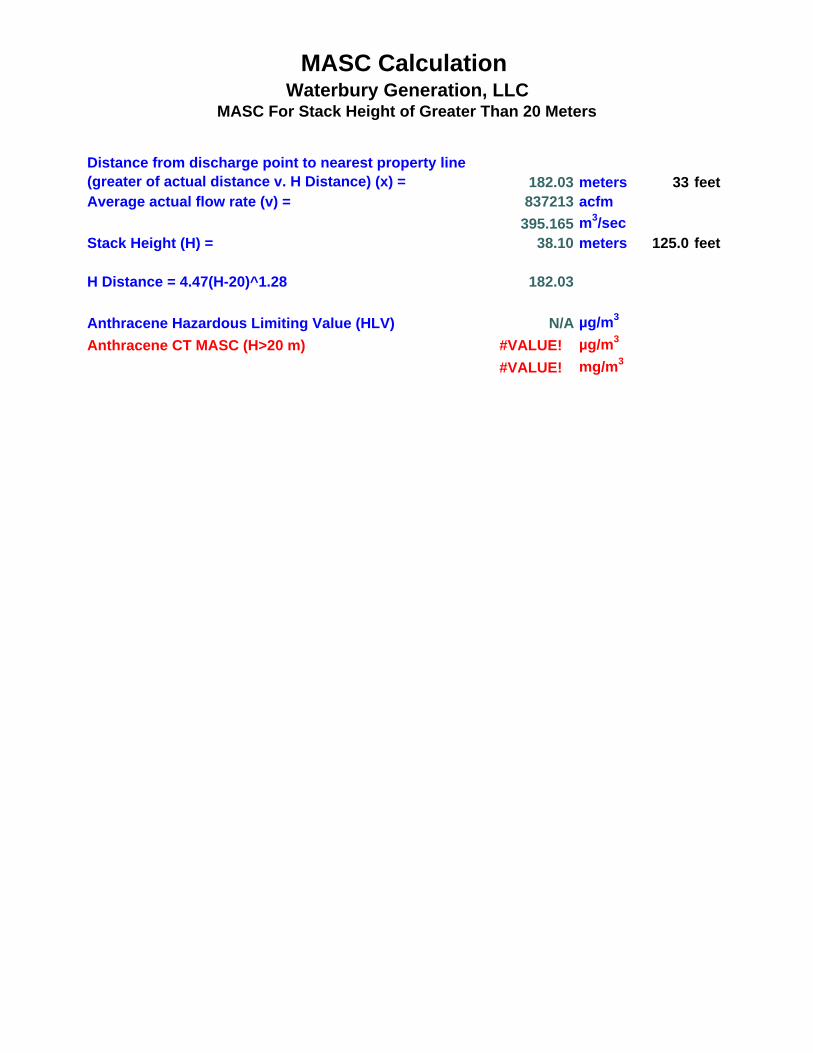
Distance from discharge point to nearest property line (greater of actual distance v. H Distance) (x) = 182.03 meters 33 feetAverage actual flow rate (v) = 837213 acfm
395.165 m3/secStack Height (H) = 38.10 meters 125.0 feet
H Distance = 4.47(H-20)^1.28 182.03
Anthracene Hazardous Limiting Value (HLV) N/A µg/m3
Anthracene CT MASC (H>20 m) #VALUE! µg/m3
#VALUE! mg/m3
MASC Calculation Waterbury Generation, LLC
MASC For Stack Height of Greater Than 20 Meters

Distance from discharge point to nearest property line (greater of actual distance v. H Distance) (x) = 182.03 meters 33 feetAverage actual flow rate (v) = 837213 acfm
395.165 m3/secStack Height (H) = 38.10 meters 125.0 feet
H Distance = 4.47(H-20)^1.28 182.03
Fluoranthene Hazardous Limiting Value (HLV) N/A µg/m3
Fluoranthene CT MASC (H>20 m) #VALUE! µg/m3
#VALUE! mg/m3
MASC Calculation Waterbury Generation, LLC
MASC For Stack Height of Greater Than 20 Meters

Distance from discharge point to nearest property line (greater of actual distance v. H Distance) (x) = 182.03 meters 33 feetAverage actual flow rate (v) = 837213 acfm
395.165 m3/secStack Height (H) = 38.10 meters 125.0 feet
H Distance = 4.47(H-20)^1.28 182.03
Pyrene Hazardous Limiting Value (HLV) N/A µg/m3
Pyrene CT MASC (H>20 m) #VALUE! µg/m3
#VALUE! mg/m3
MASC Calculation Waterbury Generation, LLC
MASC For Stack Height of Greater Than 20 Meters

Distance from discharge point to nearest property line (greater of actual distance v. H Distance) (x) = 182.03 meters 33 feetAverage actual flow rate (v) = 837213 acfm
395.165 m3/secStack Height (H) = 38.10 meters 125.0 feet
H Distance = 4.47(H-20)^1.28 182.03
Benzo(a)anthracene Hazardous Limiting Value (HLV) N/A µg/m3
Benzo(a)anthracene CT MASC (H>20 m) #VALUE! µg/m3
#VALUE! mg/m3
MASC Calculation Waterbury Generation, LLC
MASC For Stack Height of Greater Than 20 Meters

Distance from discharge point to nearest property line (greater of actual distance v. H Distance) (x) = 182.03 meters 33 feetAverage actual flow rate (v) = 837213 acfm
395.165 m3/secStack Height (H) = 38.10 meters 125.0 feet
H Distance = 4.47(H-20)^1.28 182.03
Chrysene Hazardous Limiting Value (HLV) N/A µg/m3
Chrysene CT MASC (H>20 m) #VALUE! µg/m3
#VALUE! mg/m3
MASC Calculation Waterbury Generation, LLC
MASC For Stack Height of Greater Than 20 Meters
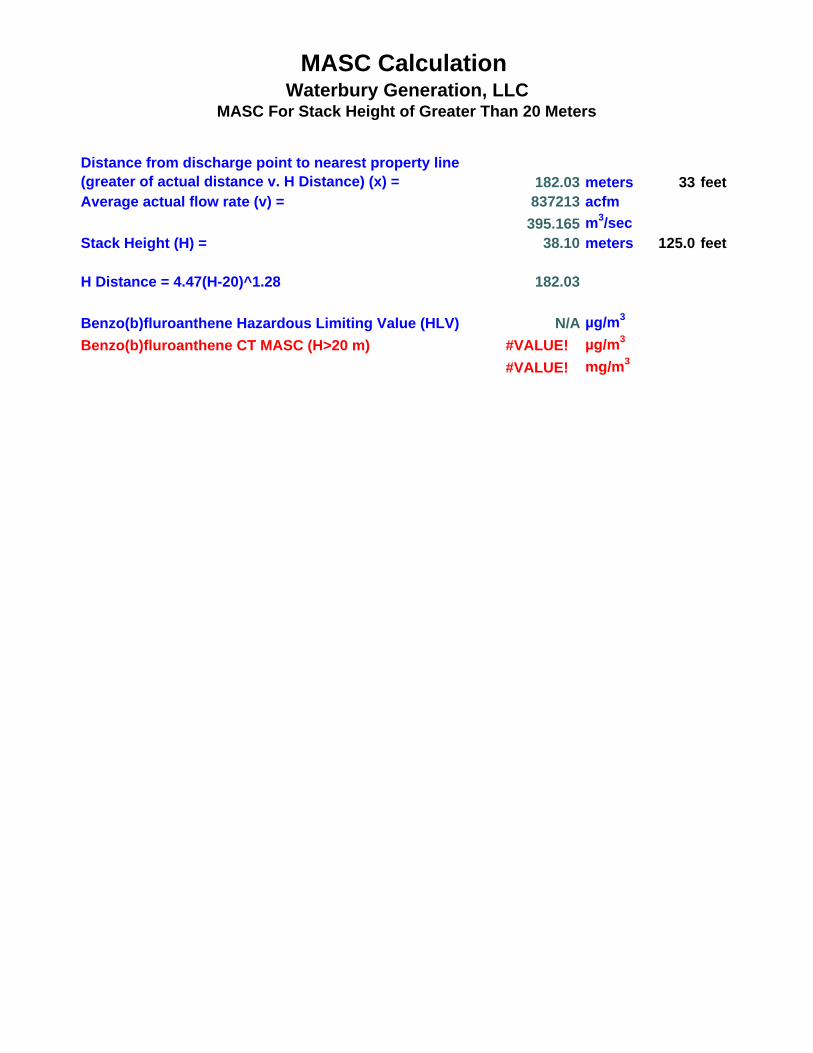
Distance from discharge point to nearest property line (greater of actual distance v. H Distance) (x) = 182.03 meters 33 feetAverage actual flow rate (v) = 837213 acfm
395.165 m3/secStack Height (H) = 38.10 meters 125.0 feet
H Distance = 4.47(H-20)^1.28 182.03
Benzo(b)fluroanthene Hazardous Limiting Value (HLV) N/A µg/m3
Benzo(b)fluroanthene CT MASC (H>20 m) #VALUE! µg/m3
#VALUE! mg/m3
MASC Calculation Waterbury Generation, LLC
MASC For Stack Height of Greater Than 20 Meters

Distance from discharge point to nearest property line (greater of actual distance v. H Distance) (x) = 182.03 meters 33 feetAverage actual flow rate (v) = 837213 acfm
395.165 m3/secStack Height (H) = 38.10 meters 125.0 feet
H Distance = 4.47(H-20)^1.28 182.03
Benzo(k)fluroanthene Hazardous Limiting Value (HLV) N/A µg/m3
Benzo(k)fluroanthene CT MASC (H>20 m) #VALUE! µg/m3
#VALUE! mg/m3
MASC Calculation Waterbury Generation, LLC
MASC For Stack Height of Greater Than 20 Meters

Distance from discharge point to nearest property line (greater of actual distance v. H Distance) (x) = 182.03 meters 33 feetAverage actual flow rate (v) = 837213 acfm
395.165 m3/secStack Height (H) = 38.10 meters 125.0 feet
H Distance = 4.47(H-20)^1.28 182.03
Benzo(e)pyrene Hazardous Limiting Value (HLV) N/A µg/m3
Benzo(e)pyrene CT MASC (H>20 m) #VALUE! µg/m3
#VALUE! mg/m3
MASC Calculation Waterbury Generation, LLC
MASC For Stack Height of Greater Than 20 Meters

Distance from discharge point to nearest property line (greater of actual distance v. H Distance) (x) = 182.03 meters 33 feetAverage actual flow rate (v) = 837213 acfm
395.165 m3/secStack Height (H) = 38.10 meters 125.0 feet
H Distance = 4.47(H-20)^1.28 182.03
Benzo(a)pyrene Hazardous Limiting Value (HLV) N/A µg/m3
Benzo(a)pyrene CT MASC (H>20 m) #VALUE! µg/m3
#VALUE! mg/m3
MASC Calculation Waterbury Generation, LLC
MASC For Stack Height of Greater Than 20 Meters

Distance from discharge point to nearest property line (greater of actual distance v. H Distance) (x) = 182.03 meters 33 feetAverage actual flow rate (v) = 837213 acfm
395.165 m3/secStack Height (H) = 38.10 meters 125.0 feet
H Distance = 4.47(H-20)^1.28 182.03
Perylene Hazardous Limiting Value (HLV) N/A µg/m3
Perylene CT MASC (H>20 m) #VALUE! µg/m3
#VALUE! mg/m3
MASC Calculation Waterbury Generation, LLC
MASC For Stack Height of Greater Than 20 Meters

Distance from discharge point to nearest property line (greater of actual distance v. H Distance) (x) = 182.03 meters 33 feetAverage actual flow rate (v) = 837213 acfm
395.165 m3/secStack Height (H) = 38.10 meters 125.0 feet
H Distance = 4.47(H-20)^1.28 182.03
Indeno(1,2,3-c,d)pyrene Hazardous Limiting Value (HLV) N/A µg/m3
Indeno(1,2,3-c,d)pyrene CT MASC (H>20 m) #VALUE! µg/m3
#VALUE! mg/m3
MASC Calculation Waterbury Generation, LLC
MASC For Stack Height of Greater Than 20 Meters

Distance from discharge point to nearest property line (greater of actual distance v. H Distance) (x) = 182.03 meters 33 feetAverage actual flow rate (v) = 837213 acfm
395.165 m3/secStack Height (H) = 38.10 meters 125.0 feet
H Distance = 4.47(H-20)^1.28 182.03
Dibenz(a,h)anthracene Hazardous Limiting Value (HLV) N/A µg/m3
Dibenz(a,h)anthracene CT MASC (H>20 m) #VALUE! µg/m3
#VALUE! mg/m3
MASC Calculation Waterbury Generation, LLC
MASC For Stack Height of Greater Than 20 Meters

Distance from discharge point to nearest property line (greater of actual distance v. H Distance) (x) = 182.03 meters 33 feetAverage actual flow rate (v) = 837213 acfm
395.165 m3/secStack Height (H) = 38.10 meters 125.0 feet
H Distance = 4.47(H-20)^1.28 182.03
Benzo(g,h,i)perylene Hazardous Limiting Value (HLV) N/A µg/m3
Benzo(g,h,i)perylene CT MASC (H>20 m) #VALUE! µg/m3
#VALUE! mg/m3
MASC Calculation Waterbury Generation, LLC
MASC For Stack Height of Greater Than 20 Meters
APPENDIX B.6 RM & FTIR NH3 Emissions Compliance
Testing Results Summary Data Sheets

ANALYZER BIAS CALIBRATION CHECKS
Current Date : 08/07/09 Current Time : 13:22 Calibration Report Air Tox Environmental Company, Inc. 08/07/09 Sequence Phase Param Start End Calibration Expected Drift Date Id Name Name Name Time Time Value Value ------------------------------------------------------------------------------- 08/07/09 01 BELD-B 1 NOX 07:37 07:40 9.1 9.1 .000 09:46 09:50 9.2 9.1 .100 11:00 11:02 9.1 9.1 .000 12:07 12:09 9.1 9.1 .000 13:15 13:17 9.2 9.1 .100 O2-2 07:37 07:40 .0 .0 .000 09:46 09:50 .0 .0 .000 11:00 11:02 .0 .0 .000 12:07 12:09 .0 .0 .000 13:15 13:17 .0 .0 .000 CO2-2 07:37 07:40 .0 .0 .000 09:46 09:50 .0 .0 .000 11:00 11:02 .0 .0 .000 12:07 12:09 .0 .0 .000 13:15 13:17 .0 .0 .000 CO-2 07:37 07:40 .6 .0 .30 09:46 09:50 .9 .0 .45 11:00 11:02 .9 .0 .45 12:07 12:09 .9 .0 .45 13:15 13:17 .6 .0 .30 2 VOC600 07:37 07:43 -.5** .0 09:46 09:54 -.3** .0 11:00 11:04 -.2** .0 12:07 12:12 -.5** .0 13:15 13:19 -1.1** .0 NOX 07:37 07:43 -.2 .0 -.200 09:46 09:54 -.1 .0 -.100 11:00 11:04 .0 .0 .000 12:07 12:12 .0 .0 .000 13:15 13:19 .0 .0 .000 O2-2 07:37 07:43 21.1 21.0 .100 09:46 09:54 20.9 21.0 -.100 11:00 11:04 20.9 21.0 -.100 12:07 12:12 20.9 21.0 -.100 13:15 13:19 20.9 21.0 -.100 CO2-2 07:37 07:43 21.2 21.0 .200 09:46 09:54 21.0 21.0 .000 11:00 11:04 21.1 21.0 .100 12:07 12:12 21.1 21.0 .100 13:15 13:19 21.1 21.0 .100 CO-2 07:37 07:43 188.7 190.0 -1.300

09:46 09:54 189.0 190.0 -1.000 11:00 11:04 190.7 190.0 .700 12:07 12:12 189.0 190.0 -1.000 08/07/09 01 BELD-B 2 CO-2 13:15 13:19 189.6 190.0 -.400 3 VOC600 07:37 07:44 49.6** 49.9 09:46 09:56 49.3** 49.9 11:00 11:05 50.7** 49.9 12:07 12:13 49.6** 49.9 13:15 13:20 49.6** 49.9 ------------------------------------------------------------------------------- * : Indicates Drift Exceeded Two Times the Limit. **: Indicates Drift Exceeded Four Times the Limit.
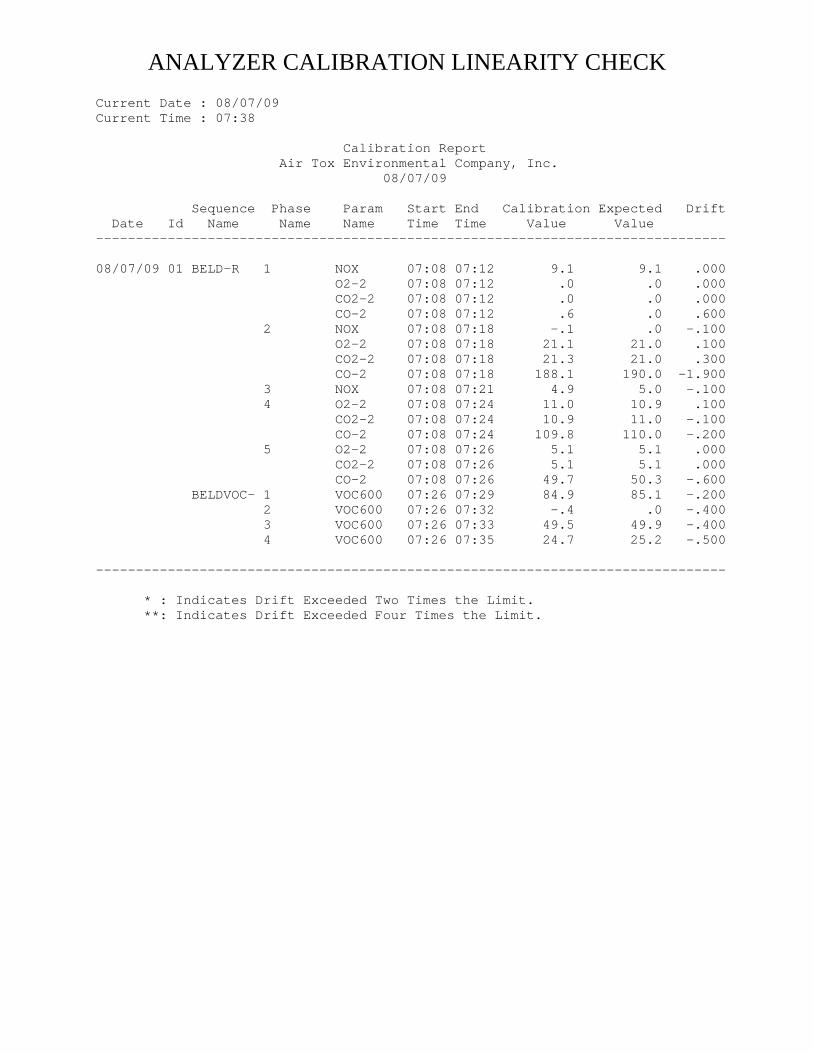
ANALYZER CALIBRATION LINEARITY CHECK Current Date : 08/07/09 Current Time : 07:38 Calibration Report Air Tox Environmental Company, Inc. 08/07/09 Sequence Phase Param Start End Calibration Expected Drift Date Id Name Name Name Time Time Value Value ------------------------------------------------------------------------------- 08/07/09 01 BELD-R 1 NOX 07:08 07:12 9.1 9.1 .000 O2-2 07:08 07:12 .0 .0 .000 CO2-2 07:08 07:12 .0 .0 .000 CO-2 07:08 07:12 .6 .0 .600 2 NOX 07:08 07:18 -.1 .0 -.100 O2-2 07:08 07:18 21.1 21.0 .100 CO2-2 07:08 07:18 21.3 21.0 .300 CO-2 07:08 07:18 188.1 190.0 -1.900 3 NOX 07:08 07:21 4.9 5.0 -.100 4 O2-2 07:08 07:24 11.0 10.9 .100 CO2-2 07:08 07:24 10.9 11.0 -.100 CO-2 07:08 07:24 109.8 110.0 -.200 5 O2-2 07:08 07:26 5.1 5.1 .000 CO2-2 07:08 07:26 5.1 5.1 .000 CO-2 07:08 07:26 49.7 50.3 -.600 BELDVOC- 1 VOC600 07:26 07:29 84.9 85.1 -.200 2 VOC600 07:26 07:32 -.4 .0 -.400 3 VOC600 07:26 07:33 49.5 49.9 -.400 4 VOC600 07:26 07:35 24.7 25.2 -.500 ------------------------------------------------------------------------------- * : Indicates Drift Exceeded Two Times the Limit. **: Indicates Drift Exceeded Four Times the Limit.

WATERBURY GENERATION NOx CONVERTER EFFICIENCY CHECK
Current Date : 08/07/09 Current Time : 06:58 Daily Parameter Report - Minute Averages with Flags Air Tox Environmental Company, Inc. Logger Name : Air Tox Environmental Stack : Logger Id : 01 Boiler/Unit : Parameter : NOX Interval : 001M Units : PPM Data Flags Status Flags Date Time Average <PDTFBCMOUA+-RHLhlJjVWXYZf I?*>=m^vEd9za Q 08/07/09 06:51 43.2 08/07/09 06:52 43.9 08/07/09 06:53 43.9 08/07/09 06:54 43.9 08/07/09 06:55 43.9 08/07/09 06:56 43.9 Max 43.9 Min 43.2 Mean 43.8 ACTUAL 46.3 SN ALM066049 Records 6 Status : '<' - Less than ##% Data, 'P' - Power Fail, 'D' - Disabled, 'T' - Out-of-Control, 'F' - Boiler Off-Line, Flags : 'B' - Bad Status, 'C' - Calibration, 'M' - Maintenance, 'O' - Analog Overrange, 'U' - Analog Underrange, 'A' - Arithmetic Error, '+' - Maximum, '-' - Minimum, 'R' - Rate of Change, 'H' - High-High Alarm, 'L' - Low-Low Alarm, 'h' - High Alarm, 'l' - Low Alarm, 'J' - High Rate of Change, 'j' - Low Rate of Change, 'V' - DIS #1 Obs, 'W' - DIS #2 Obs, 'X' - DIS #3 Obs, 'Y' - DIS #4 Obs, 'Z' - DIS #5 Obs.

Native #1 Ave NativeDay1-pre-test Spike No. 1
Day1-pre-test Spike No. 2
SF6 tank SF6
Spike+BiasDR
0.195 2.00 0.202
Adj NativeNH3
Spike+NativeNative #2
3.3
0.101
3.7 3.6 7.1 3.6
SF6 spike
NH3 Tank NH3 Spike Reported Spike
Spike Rceovery (%)
49.0 4.95 3.877 78.3
Adj Native
3.6 3.8 7.5 3.7 3.3
Native #1 Native #2 NH3
Spike+NativeAve Native
85.249.0
SF6 spike SF6 tank SF6
Spike+Bias
NH3 Tank NH3 Spike Reported Spike
DR
WATERBURY GENERATION NH3 Spiking Results
Spike Recovery Must Be
Within 70 -130%
Spike Recovery Must Be
Within 70 -130%
0.193 2.00 0.200 0.100
Spike Rceovery (%)
4.90 4.173
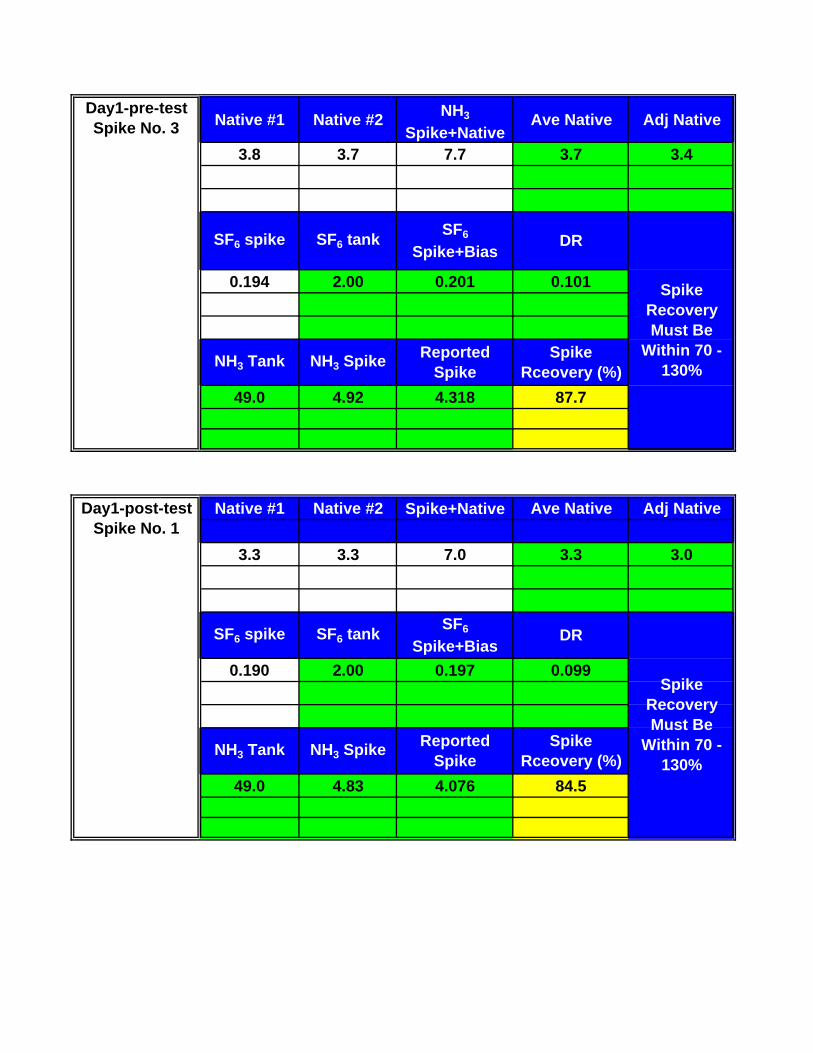
3.8 3.7 7.7 3.7 3.4
0.194 2.00 0.201 0.101
49.0 4.92 4.318 87.7
Native #1 Native #2 Spike+Native Ave Native Adj Native
3.3 3.3 7.0 3.3 3.0
0.190 2.00 0.197 0.099
49.0 4.83 4.076 84.5
NH3 Tank
Day1-pre-test Spike No. 3
Day1-post-test Spike No. 1
Spike Recovery Must Be
Within 70 -130%
Spike Recovery Must Be
Within 70 -130%
NH3 Tank NH3 Spike Reported Spike
Spike Rceovery (%)
SF6
Spike+BiasSF6 tankSF6 spike DR
Native #1 Native #2 NH3
Spike+NativeAve Native Adj Native
SF6
Spike+BiasSF6 tankSF6 spike DR
Spike Rceovery (%)
Reported Spike
NH3 Spike

Air Tox Environmental Company, Inc.
42CHL-58681-3199.1
Gas Cylinder Gas Cylinder Value Analyzer Response Absolute Difference DifferenceSerial Number (ppm) (ppm) (ppm) (% of Span)
ZERO GAS - 0.0 -0.1 0.1 -1.1%MID - RANGE GAS AAL069888 5.0 4.9 0.1 -1.5%
HIGH - RANGE GAS ALM026455 9.1 9.1 0.0 0.4%
90863565121.0
Gas Cylinder Gas Cylinder Value Analyzer Response Absolute Difference DifferenceSerial Number (%) (%) (%) (% of Span)
ZERO GAS - 0.0 0.0 0.0 0.0%MID - RANGE GAS ALM029752 10.9 11 0.1 0.5%
HIGH - RANGE GAS ALM053777 21.0 21.1 0.1 0.5%
908635651190.0
Gas Cylinder Gas Cylinder Value Analyzer Response Absolute Difference DifferenceSerial Number (ppm) (ppm) (ppm) (% of Span)
ZERO GAS - 0.0 0.6 0.6 0.3%LOW - RANGE GAS ALM063764 50.3 49.7 0.64 -0.3%MID - RANGE GAS ALM029752 110.0 109.8 0.2 -0.1%
HIGH - RANGE GAS ALM053777 190.0 188.1 1.9 -1.0%
90863565121.0
Gas Cylinder Gas Cylinder Value Analyzer Response Absolute Difference DifferenceSerial Number (ppm) (ppm) (ppm) (% of Span)
ZERO GAS - 0.0 0.0 0 0.0%MID - RANGE GAS ALM029752 11.0 10.9 0.1 -0.5%
HIGH - RANGE GAS ALM053777 21.0 21.3 0.3 1.4%
Instrument Span (%):
Must be less than ±2%
WATERBURY GENERATION, LLC./FIRSTLIGHT8/7/2009
Must be less than ±2%
CARBON DIOXIDEMust be less than ±2%
CARBON MONOXIDEInstrument Serial No.:
Analyzer Linearity Calibrations
NITROGEN OXIDES
Instrument Span (ppm):Instrument Serial No.:
OXYGEN
Instrument Span (%):
Instrument Span (%):Instrument Serial No.:
Must be less than ±2%
Instrument Serial No.:

Air Tox Environmental Company, Inc.
CO ANALYZER CALIBRATION RESPONSEZERO: 0.6 Test Time 1 10:00-10:59
UPSCALE: 109.8 2 11:07-12:06INSTRUMENT SPAN: 190 3 12:15-13:14
110
CO CO CO CO Heat Input COTEST RUN System Cal. System Cal. Bias System Cal. System Cal. Bias DRIFT AVERAGE Raw Conc. Cal Corrected
Response (%) Response (%) (%) PPM PPMZERO 0.9 0.2% 0.9 0.2% 0.0% 0.9
UPSCALE 189.0 -0.5% 190.7 0.4% 0.9% 189.9
ZERO 0.9 0.2% 0.9 0.2% 0.0% 0.9UPSCALE 190.7 0.4% 189.0 -0.5% -0.9% 189.9
ZERO 0.9 0.2% 0.6 0.0% -0.2% 0.8UPSCALE 189.0 -0.5% 189.6 -0.2% 0.3% 189.3
must be less than ±5% must be less than ±5% & ±3%
NOx ANALYZER CALIBRATION RESPONSEZERO: -0.1 Test Time 1 10:00-10:59
UPSCALE: 9.1 2 11:07-12:06INSTRUMENT SPAN: 9.1 3 12:15-13:14
9.06
NOx NOx NOx NOx Heat Input NOxTEST RUN System Cal. System Cal. Bias System Cal. System Cal. Bias DRIFT AVERAGE Raw Conc. Cal Corrected
Response (%) Response (%) (%) PPM PPMZERO -0.1 0.0% 0.0 1.1% 1.1% -0.1
UPSCALE 9.2 1.1% 9.1 0.0% -1.1% 9.2
ZERO 0.0 1.1% 0.0 1.1% 0.0% 0.0UPSCALE 9.1 0.0% 9.1 0.0% 0.0% 9.1
ZERO 0.0 -0.3% 0.0 1.1% 0.0% 0.0UPSCALE 9.1 0.0% 9.2 1.1% 1.1% 9.2
must be less than ±5% must be less than ±5% & ±3%
O2 ANALYZER CALIBRATION RESPONSEZERO: 0.0 Test Time 1 10:00-10:59
UPSCALE: 21.1 2 11:07-12:06INSTRUMENT SPAN: 21.1 3 12:15-13:14
21
O2 O2
TEST RUN System Cal. System Cal. Bias System Cal. System Cal. Bias DRIFT AVERAGE Raw Conc. Cal Corrected Response (%) Response (%) (%) % %
ZERO 0.0 0.0% 0.0 0.0% 0.0% 0.0UPSCALE 20.9 -0.9% 20.9 -0.9% 0.0% 20.9
ZERO 0.0 0.0% 0.0 0.0% 0.0% 0.0UPSCALE 20.9 -0.9% 20.9 -0.9% 0.0% 20.9
ZERO 0.0 0.0% 0.0 0.0% 0.0% 0.0UPSCALE 20.9 -0.9% 20.9 -0.9% 0.0% 20.9
must be less than ±5% must be less than ±5% & ±3%
0.2 0.4
SYSTEM CALIBRATION BIAS AND DRIFT DATA & EMISSIONS DATA WORKSHEET WATERBURY GENERATION, LLC./FIRSTLIGHT
August 7, 2009
0.1 0.0003 0.28
0.2 0.0006 0.51
PPMC lbs/MMBtu lbs/hr
0.2 0.0004 0.37
MMBtu/hr
884.5
AVERAGE
1.2 0.2
1.3 0.3
1.3 0.2
ACTUAL GAS VALUE:
FINAL VALUES
1
2
3
INITIAL VALUES
ACTUAL GAS VALUE:
INITIAL VALUES FINAL VALUES
PPMC lbs/MMBtu lbs/hr
1 6.9 6.8 5.2 0.0200 17.71884.5
0.0203 17.9
2 7.0 7.0 5.2
3 7.0 6.9 5.2
AVERAGE
13.1
13.1
13.1
18.0
3 13.0
AVERAGE
ACTUAL GAS VALUE:
INITIAL VALUES FINAL VALUES
2 13.0 13.1
17.9
1 13.0
5.2
GE LMS100 CTG - 100% load ULSK
EMISSION LIMITS 5.9 19.5
EMISSION LIMITS 6.0 12.1
0.0204
884.6
884.5
884.6
884.5
MMBtu/hr

Air Tox Environmental Company, Inc.
CO2 ANALYZER CALIBRATION RESPONSEZERO: 0.0 Test Time 1 10:00-10:59
UPSCALE: 21.3 2 11:07-12:06INSTRUMENT SPAN: 21.3 3 12:15-13:14
21
CO2 CO2
TEST RUN System Cal. System Cal. Bias System Cal. System Cal. Bias DRIFT AVERAGE Raw Conc. Cal Corrected Response (%) Response (%) (%) % %
ZERO 0.0 0.0% 0.0 0.0% 0.0% 0.0UPSCALE 21.0 -1.4% 21.1 0.0% 0.5% 21.1
ZERO 0.0 0.0% 0.0 0.0% 0.0% 0.0UPSCALE 21.1 0.0% 21.1 0.0% 0.0% 21.1
ZERO 0.0 0.0% 0.0 0.0% 0.0% 0.0UPSCALE 21.1 0.0% 21.1 0.0% 0.0% 21.1
must be less than ±5% must be less than ±5% & ±3%
VOC ANALYZER CALIBRATION RESPONSEZERO: -0.4 Test Time 1 10:00-10:59
UPSCALE: 49.5 2 11:07-12:06INSTRUMENT SPAN: 84.9 3 12:15-13:14
49.9
VOC VOC VOC VOC Heat Input VOCTEST RUN System Cal. System Cal. Bias System Cal. System Cal. Bias DRIFT AVERAGE Raw Conc. Cal Corrected
Response (%) Response (%) (%) PPM PPMZERO -0.3 0.1% -0.2 0.2% 0.1% -0.3
UPSCALE 49.3 -0.2% 50.7 1.4% 1.6% 50.0
ZERO -0.2 0.2% -0.5 -0.1% -0.4% -0.4UPSCALE 50.7 1.4% 49.2 -0.4% -1.8% 50.0
ZERO -0.5 -0.1% -1.1 -0.8% -0.3% -0.8
UPSCALE 49.2 -0.4% 49.6 0.1% 0.2% 49.4
must be less than ±5% must be less than ±5% & ±3%
NH3 NH3 NH3 NH3 Heat Input NH3
Raw Conc. H2O Corrected PPMwv PPMdv
ACTUAL GAS VALUE:
INITIAL VALUES
5.9
5.9
5.9
5.9
INITIAL VALUES FINAL VALUES
2 5.9
AVERAGE
ACTUAL GAS VALUE:
3 5.9
FINAL VALUES
1 5.9
PPMC
-0.0013 -1.17
1 -0.8 -0.8 -0.6
lbs/MMBtu lbs/hr
-0.0008 -0.72
-0.0012 -1.08
2 -1.3
3 -1.2 -1.2 -0.9
-1.3 -1.0
AVERAGE -0.8 -0.0011
EMISSION LIMITS 5.0 4.8
3.4 3.8 2.9 0.0015
3.3 3.7 2.8 0.0015
lbs/hr
1.36
-0.99
2.7 0.0015 1.30
884.6
884.5
6.1
1.3
1.32
EMISSION LIMITS 5.0
PPMC lbs/MMBtu
AVERAGE 2.8
3.3 3.6
884.5
884.5
MMBtu/hr
MMBtu/hr
884.6
884.5
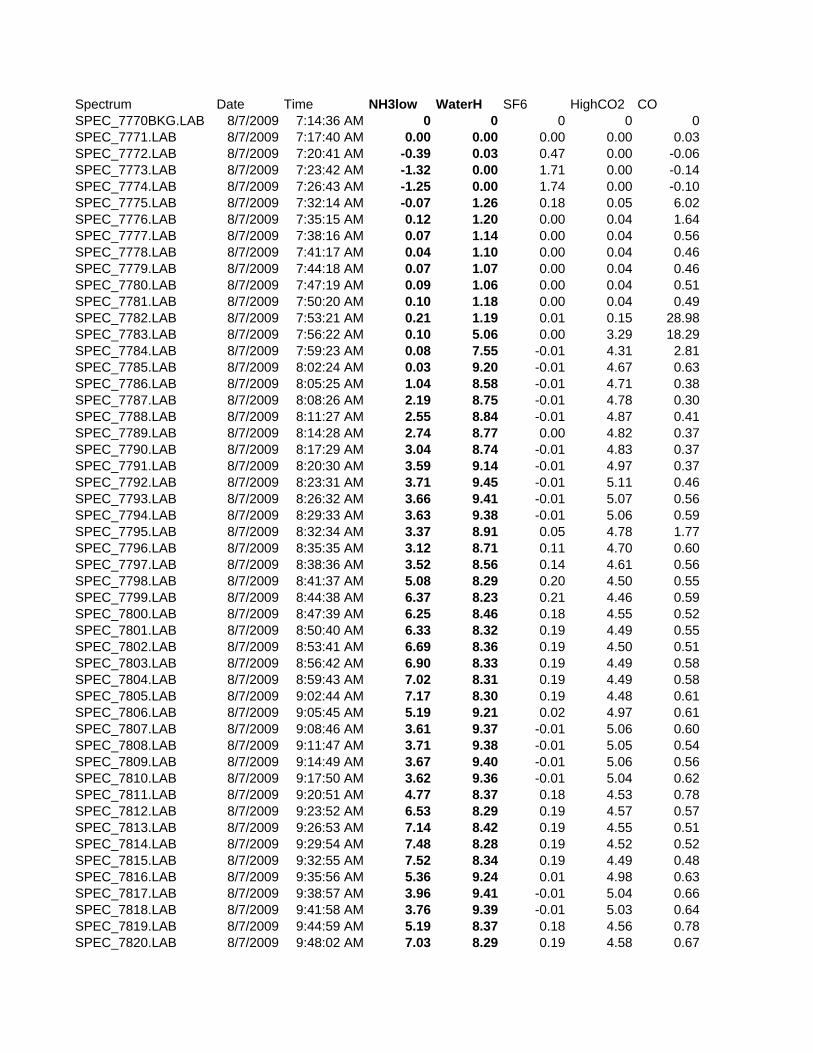
Spectrum Date Time NH3low WaterH SF6 HighCO2 COSPEC_7770BKG.LAB 8/7/2009 7:14:36 AM 0 0 0 0 0SPEC_7771.LAB 8/7/2009 7:17:40 AM 0.00 0.00 0.00 0.00 0.03SPEC_7772.LAB 8/7/2009 7:20:41 AM -0.39 0.03 0.47 0.00 -0.06SPEC_7773.LAB 8/7/2009 7:23:42 AM -1.32 0.00 1.71 0.00 -0.14SPEC_7774.LAB 8/7/2009 7:26:43 AM -1.25 0.00 1.74 0.00 -0.10SPEC_7775.LAB 8/7/2009 7:32:14 AM -0.07 1.26 0.18 0.05 6.02SPEC_7776.LAB 8/7/2009 7:35:15 AM 0.12 1.20 0.00 0.04 1.64SPEC_7777.LAB 8/7/2009 7:38:16 AM 0.07 1.14 0.00 0.04 0.56SPEC_7778.LAB 8/7/2009 7:41:17 AM 0.04 1.10 0.00 0.04 0.46SPEC_7779.LAB 8/7/2009 7:44:18 AM 0.07 1.07 0.00 0.04 0.46SPEC_7780.LAB 8/7/2009 7:47:19 AM 0.09 1.06 0.00 0.04 0.51SPEC_7781.LAB 8/7/2009 7:50:20 AM 0.10 1.18 0.00 0.04 0.49SPEC_7782.LAB 8/7/2009 7:53:21 AM 0.21 1.19 0.01 0.15 28.98SPEC_7783.LAB 8/7/2009 7:56:22 AM 0.10 5.06 0.00 3.29 18.29SPEC_7784.LAB 8/7/2009 7:59:23 AM 0.08 7.55 -0.01 4.31 2.81SPEC_7785.LAB 8/7/2009 8:02:24 AM 0.03 9.20 -0.01 4.67 0.63SPEC_7786.LAB 8/7/2009 8:05:25 AM 1.04 8.58 -0.01 4.71 0.38SPEC_7787.LAB 8/7/2009 8:08:26 AM 2.19 8.75 -0.01 4.78 0.30SPEC_7788.LAB 8/7/2009 8:11:27 AM 2.55 8.84 -0.01 4.87 0.41SPEC_7789.LAB 8/7/2009 8:14:28 AM 2.74 8.77 0.00 4.82 0.37SPEC_7790.LAB 8/7/2009 8:17:29 AM 3.04 8.74 -0.01 4.83 0.37SPEC_7791.LAB 8/7/2009 8:20:30 AM 3.59 9.14 -0.01 4.97 0.37SPEC_7792.LAB 8/7/2009 8:23:31 AM 3.71 9.45 -0.01 5.11 0.46SPEC_7793.LAB 8/7/2009 8:26:32 AM 3.66 9.41 -0.01 5.07 0.56SPEC_7794.LAB 8/7/2009 8:29:33 AM 3.63 9.38 -0.01 5.06 0.59SPEC_7795.LAB 8/7/2009 8:32:34 AM 3.37 8.91 0.05 4.78 1.77SPEC_7796.LAB 8/7/2009 8:35:35 AM 3.12 8.71 0.11 4.70 0.60SPEC_7797.LAB 8/7/2009 8:38:36 AM 3.52 8.56 0.14 4.61 0.56SPEC_7798.LAB 8/7/2009 8:41:37 AM 5.08 8.29 0.20 4.50 0.55SPEC_7799.LAB 8/7/2009 8:44:38 AM 6.37 8.23 0.21 4.46 0.59SPEC_7800.LAB 8/7/2009 8:47:39 AM 6.25 8.46 0.18 4.55 0.52SPEC_7801.LAB 8/7/2009 8:50:40 AM 6.33 8.32 0.19 4.49 0.55SPEC_7802.LAB 8/7/2009 8:53:41 AM 6.69 8.36 0.19 4.50 0.51SPEC_7803.LAB 8/7/2009 8:56:42 AM 6.90 8.33 0.19 4.49 0.58SPEC_7804.LAB 8/7/2009 8:59:43 AM 7.02 8.31 0.19 4.49 0.58SPEC_7805.LAB 8/7/2009 9:02:44 AM 7.17 8.30 0.19 4.48 0.61SPEC_7806.LAB 8/7/2009 9:05:45 AM 5.19 9.21 0.02 4.97 0.61SPEC_7807.LAB 8/7/2009 9:08:46 AM 3.61 9.37 -0.01 5.06 0.60SPEC_7808.LAB 8/7/2009 9:11:47 AM 3.71 9.38 -0.01 5.05 0.54SPEC_7809.LAB 8/7/2009 9:14:49 AM 3.67 9.40 -0.01 5.06 0.56SPEC_7810.LAB 8/7/2009 9:17:50 AM 3.62 9.36 -0.01 5.04 0.62SPEC_7811.LAB 8/7/2009 9:20:51 AM 4.77 8.37 0.18 4.53 0.78SPEC_7812.LAB 8/7/2009 9:23:52 AM 6.53 8.29 0.19 4.57 0.57SPEC_7813.LAB 8/7/2009 9:26:53 AM 7.14 8.42 0.19 4.55 0.51SPEC_7814.LAB 8/7/2009 9:29:54 AM 7.48 8.28 0.19 4.52 0.52SPEC_7815.LAB 8/7/2009 9:32:55 AM 7.52 8.34 0.19 4.49 0.48SPEC_7816.LAB 8/7/2009 9:35:56 AM 5.36 9.24 0.01 4.98 0.63SPEC_7817.LAB 8/7/2009 9:38:57 AM 3.96 9.41 -0.01 5.04 0.66SPEC_7818.LAB 8/7/2009 9:41:58 AM 3.76 9.39 -0.01 5.03 0.64SPEC_7819.LAB 8/7/2009 9:44:59 AM 5.19 8.37 0.18 4.56 0.78SPEC_7820.LAB 8/7/2009 9:48:02 AM 7.03 8.29 0.19 4.58 0.67

SPEC_7821.LAB 8/7/2009 9:51:03 AM 7.48 8.40 0.19 4.60 0.64SPEC_7822.LAB 8/7/2009 9:54:04 AM 7.71 8.26 0.19 4.53 0.66SPEC_7823.LAB 8/7/2009 9:57:05 AM 6.32 9.03 0.06 4.84 0.66SPEC_7824.LAB 8/7/2009 10:00:06 AM 3.99 9.38 -0.01 5.02 0.65SPEC_7825.LAB 8/7/2009 10:03:07 AM 3.81 9.42 -0.01 5.02 0.67SPEC_7826.LAB 8/7/2009 10:06:08 AM 3.72 9.40 -0.01 5.03 0.68SPEC_7827.LAB 8/7/2009 10:09:10 AM 3.56 9.38 -0.01 5.03 0.72SPEC_7828.LAB 8/7/2009 10:12:11 AM 3.45 9.37 -0.01 5.03 0.72SPEC_7829.LAB 8/7/2009 10:15:12 AM 3.43 9.38 -0.01 5.02 0.72SPEC_7830.LAB 8/7/2009 10:18:13 AM 3.41 9.40 -0.01 5.02 0.65SPEC_7831.LAB 8/7/2009 10:21:14 AM 3.31 9.42 -0.01 5.03 0.65SPEC_7832.LAB 8/7/2009 10:24:15 AM 3.39 9.41 -0.01 5.02 0.68SPEC_7833.LAB 8/7/2009 10:27:16 AM 3.35 9.45 -0.01 5.04 0.68SPEC_7834.LAB 8/7/2009 10:30:17 AM 3.32 9.44 -0.01 5.04 0.64SPEC_7835.LAB 8/7/2009 10:33:18 AM 3.36 9.43 -0.01 5.04 0.68SPEC_7836.LAB 8/7/2009 10:36:19 AM 3.29 9.43 -0.01 5.03 0.66SPEC_7837.LAB 8/7/2009 10:39:20 AM 3.26 9.48 -0.01 5.06 0.68SPEC_7838.LAB 8/7/2009 10:42:21 AM 3.32 9.45 -0.01 5.04 0.67SPEC_7839.LAB 8/7/2009 10:45:22 AM 3.42 9.48 -0.01 5.05 0.65SPEC_7840.LAB 8/7/2009 10:48:23 AM 3.34 9.48 -0.01 5.05 0.70SPEC_7841.LAB 8/7/2009 10:51:25 AM 3.35 9.46 -0.01 5.05 0.71SPEC_7842.LAB 8/7/2009 10:54:26 AM 3.32 9.48 -0.01 5.05 0.69SPEC_7843.LAB 8/7/2009 10:57:27 AM 3.28 9.46 -0.01 5.04 0.69SPEC_7844.LAB 8/7/2009 11:00:28 AM 3.31 9.49 -0.01 5.06 0.68SPEC_7845.LAB 8/7/2009 11:10:03 AM 3.31 9.46 -0.01 5.04 0.69SPEC_7846.LAB 8/7/2009 11:13:04 AM 3.30 9.43 -0.01 5.03 0.73SPEC_7847.LAB 8/7/2009 11:16:05 AM 3.31 9.41 -0.01 5.02 0.76SPEC_7848.LAB 8/7/2009 11:19:06 AM 3.31 9.42 -0.01 5.03 0.75SPEC_7849.LAB 8/7/2009 11:22:07 AM 3.31 9.47 -0.01 5.04 0.71SPEC_7850.LAB 8/7/2009 11:25:08 AM 3.45 9.45 -0.01 5.03 0.77SPEC_7851.LAB 8/7/2009 11:28:09 AM 3.46 9.43 -0.01 5.03 0.73SPEC_7852.LAB 8/7/2009 11:31:10 AM 3.38 9.41 -0.01 5.03 0.77SPEC_7853.LAB 8/7/2009 11:34:11 AM 3.32 9.36 -0.01 5.03 0.77SPEC_7854.LAB 8/7/2009 11:37:12 AM 3.30 9.45 -0.01 5.04 0.73SPEC_7855.LAB 8/7/2009 11:40:13 AM 3.34 9.49 -0.01 5.07 0.72SPEC_7856.LAB 8/7/2009 11:43:14 AM 3.33 9.51 -0.01 5.11 0.73SPEC_7857.LAB 8/7/2009 11:46:15 AM 3.44 9.54 -0.01 5.13 0.76SPEC_7858.LAB 8/7/2009 11:49:16 AM 3.32 9.48 -0.01 5.08 0.70SPEC_7859.LAB 8/7/2009 11:52:17 AM 3.33 9.51 -0.01 5.10 0.75SPEC_7860.LAB 8/7/2009 11:55:18 AM 3.32 9.55 -0.01 5.14 0.79SPEC_7861.LAB 8/7/2009 11:58:19 AM 3.32 9.54 -0.01 5.12 0.78SPEC_7862.LAB 8/7/2009 12:01:20 PM 3.33 9.51 -0.01 5.09 0.74SPEC_7863.LAB 8/7/2009 12:04:21 PM 3.27 9.53 -0.01 5.12 0.77SPEC_7864.LAB 8/7/2009 12:07:22 PM 3.31 9.55 -0.01 5.14 0.80SPEC_7865.LAB 8/7/2009 12:10:23 PM 3.39 9.52 -0.01 5.11 0.79SPEC_7866.LAB 8/7/2009 12:13:24 PM 3.27 9.55 -0.01 5.16 0.81SPEC_7867.LAB 8/7/2009 12:18:03 PM 3.32 9.55 -0.01 5.18 0.82SPEC_7868.LAB 8/7/2009 12:21:04 PM 3.33 9.54 -0.01 5.18 0.81SPEC_7869.LAB 8/7/2009 12:24:05 PM 3.32 9.53 -0.01 5.18 0.79SPEC_7870.LAB 8/7/2009 12:27:06 PM 3.55 9.50 -0.01 5.18 0.84SPEC_7871.LAB 8/7/2009 12:30:07 PM 3.40 9.52 -0.01 5.18 0.80
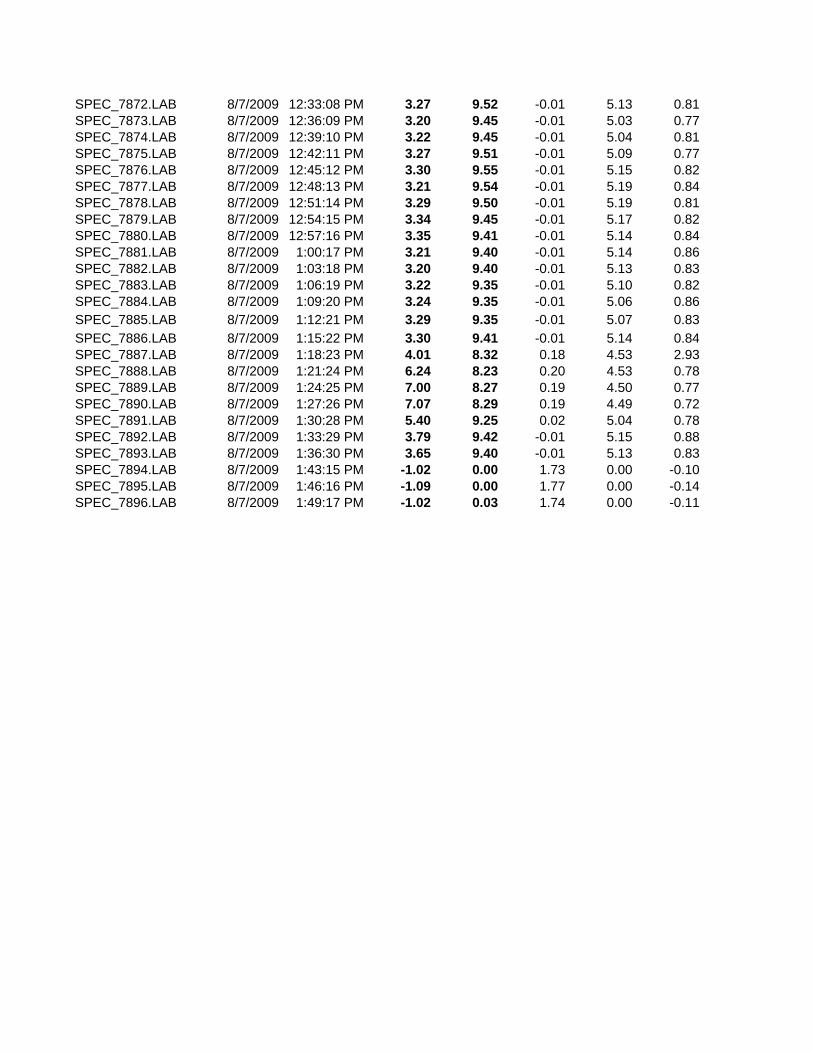
SPEC_7872.LAB 8/7/2009 12:33:08 PM 3.27 9.52 -0.01 5.13 0.81SPEC_7873.LAB 8/7/2009 12:36:09 PM 3.20 9.45 -0.01 5.03 0.77SPEC_7874.LAB 8/7/2009 12:39:10 PM 3.22 9.45 -0.01 5.04 0.81SPEC_7875.LAB 8/7/2009 12:42:11 PM 3.27 9.51 -0.01 5.09 0.77SPEC_7876.LAB 8/7/2009 12:45:12 PM 3.30 9.55 -0.01 5.15 0.82SPEC_7877.LAB 8/7/2009 12:48:13 PM 3.21 9.54 -0.01 5.19 0.84SPEC_7878.LAB 8/7/2009 12:51:14 PM 3.29 9.50 -0.01 5.19 0.81SPEC_7879.LAB 8/7/2009 12:54:15 PM 3.34 9.45 -0.01 5.17 0.82SPEC_7880.LAB 8/7/2009 12:57:16 PM 3.35 9.41 -0.01 5.14 0.84SPEC_7881.LAB 8/7/2009 1:00:17 PM 3.21 9.40 -0.01 5.14 0.86SPEC_7882.LAB 8/7/2009 1:03:18 PM 3.20 9.40 -0.01 5.13 0.83SPEC_7883.LAB 8/7/2009 1:06:19 PM 3.22 9.35 -0.01 5.10 0.82SPEC_7884.LAB 8/7/2009 1:09:20 PM 3.24 9.35 -0.01 5.06 0.86SPEC_7885.LAB 8/7/2009 1:12:21 PM 3.29 9.35 -0.01 5.07 0.83SPEC_7886.LAB 8/7/2009 1:15:22 PM 3.30 9.41 -0.01 5.14 0.84SPEC_7887.LAB 8/7/2009 1:18:23 PM 4.01 8.32 0.18 4.53 2.93SPEC_7888.LAB 8/7/2009 1:21:24 PM 6.24 8.23 0.20 4.53 0.78SPEC_7889.LAB 8/7/2009 1:24:25 PM 7.00 8.27 0.19 4.50 0.77SPEC_7890.LAB 8/7/2009 1:27:26 PM 7.07 8.29 0.19 4.49 0.72SPEC_7891.LAB 8/7/2009 1:30:28 PM 5.40 9.25 0.02 5.04 0.78SPEC_7892.LAB 8/7/2009 1:33:29 PM 3.79 9.42 -0.01 5.15 0.88SPEC_7893.LAB 8/7/2009 1:36:30 PM 3.65 9.40 -0.01 5.13 0.83SPEC_7894.LAB 8/7/2009 1:43:15 PM -1.02 0.00 1.73 0.00 -0.10SPEC_7895.LAB 8/7/2009 1:46:16 PM -1.09 0.00 1.77 0.00 -0.14SPEC_7896.LAB 8/7/2009 1:49:17 PM -1.02 0.03 1.74 0.00 -0.11

NO2 NO CH4 FORMALD Temp (C) Pressure (Atm)0 0 0 0 149.7647 1
-0.02 -0.03 0.10 -0.06 149.76 1-0.05 0.01 -0.17 -0.02 149.76 10.00 0.08 0.05 -0.06 149.76 1
-0.11 -0.02 0.00 -0.06 150.51 1-0.10 0.95 12.66 0.51 149.76 11.02 1.13 3.86 0.00 150.51 1
-0.21 1.04 2.77 -0.18 149.76 1-0.66 1.14 2.44 -0.09 149.76 1-0.04 1.07 2.36 -0.13 149.76 1-0.76 1.07 2.07 -0.08 149.76 1-1.29 1.20 2.34 -0.08 149.76 11.20 1.70 2.88 0.25 149.76 1
19.24 35.86 1.71 1.83 149.76 11.04 48.86 0.40 0.00 149.76 11.84 32.36 0.27 -0.17 149.76 1
-2.75 8.53 0.49 -0.35 149.76 1-2.78 8.79 0.02 -0.53 149.76 1-4.36 10.11 0.17 -0.24 149.76 1-4.44 11.29 0.72 -0.34 149.76 1-3.80 11.68 0.66 -0.34 149.76 1-3.65 10.21 0.26 -0.35 149.76 1-4.10 11.19 0.00 -0.32 149.76 1-4.66 10.52 0.45 -0.25 149.76 1-4.30 11.00 0.55 -0.22 149.76 1-3.41 10.47 0.77 -0.16 149.76 1-3.91 10.59 0.40 -0.33 149.76 1-3.18 10.16 0.18 -0.50 149.76 1-3.40 9.91 0.42 -0.29 149.76 1-3.46 9.98 0.59 -0.21 149.76 1-2.67 9.83 0.47 -0.41 149.76 1-2.76 9.81 0.42 -0.21 149.02 1-2.44 9.70 0.46 -0.44 149.76 1-2.78 9.40 0.41 -0.43 149.76 1-2.59 9.44 0.36 -0.32 149.76 1-3.15 9.48 0.51 -0.21 149.76 1-4.30 10.38 0.36 -0.23 149.76 1-4.01 10.26 0.45 -0.24 150.51 1-4.26 10.10 0.45 -0.22 149.76 1-3.95 10.51 0.38 -0.24 150.51 1-3.72 10.34 0.43 -0.20 149.76 1-3.10 9.30 -0.02 -0.49 150.51 1-3.43 9.19 -0.70 -0.42 149.76 1-2.86 9.31 -0.22 -0.55 150.51 1-2.90 9.08 0.17 -0.58 150.51 1-2.65 9.61 0.37 -0.49 149.76 1-3.90 10.40 0.42 -0.29 149.76 1-4.11 10.27 0.34 -0.22 149.76 1-3.62 10.28 0.34 -0.31 149.76 1-3.77 9.36 -0.15 -0.40 149.76 1-3.10 9.24 -0.30 -0.50 149.76 1
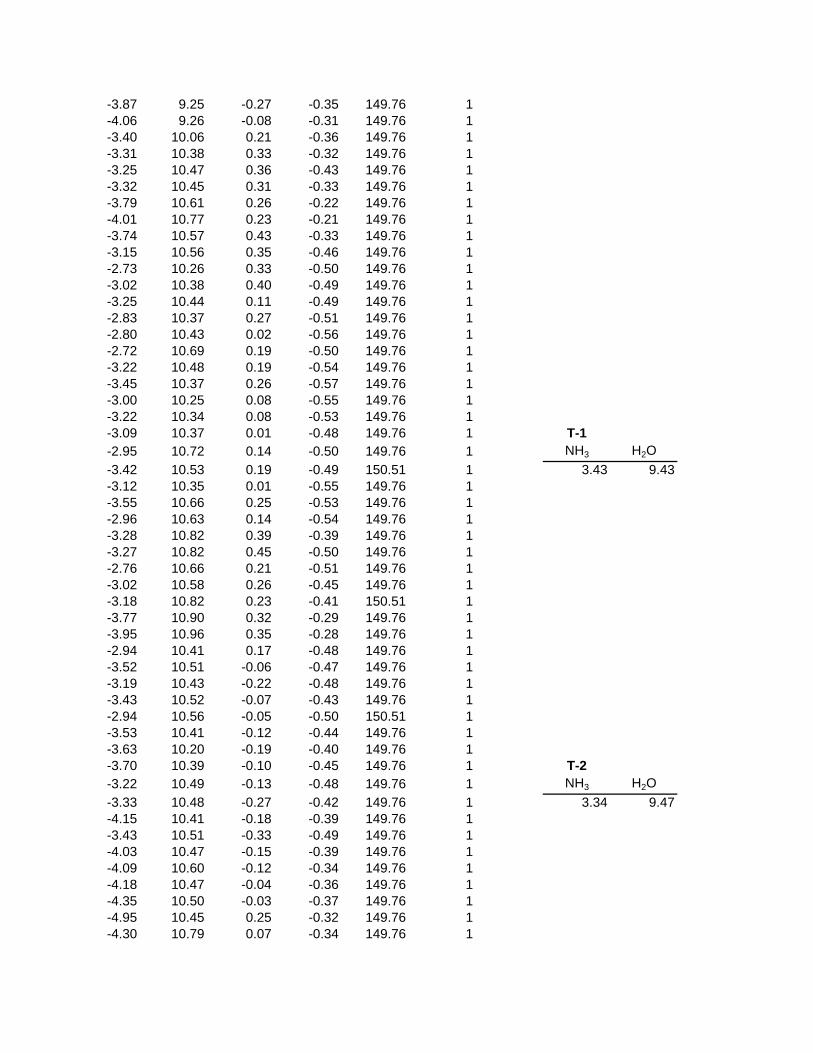
-3.87 9.25 -0.27 -0.35 149.76 1-4.06 9.26 -0.08 -0.31 149.76 1-3.40 10.06 0.21 -0.36 149.76 1-3.31 10.38 0.33 -0.32 149.76 1-3.25 10.47 0.36 -0.43 149.76 1-3.32 10.45 0.31 -0.33 149.76 1-3.79 10.61 0.26 -0.22 149.76 1-4.01 10.77 0.23 -0.21 149.76 1-3.74 10.57 0.43 -0.33 149.76 1-3.15 10.56 0.35 -0.46 149.76 1-2.73 10.26 0.33 -0.50 149.76 1-3.02 10.38 0.40 -0.49 149.76 1-3.25 10.44 0.11 -0.49 149.76 1-2.83 10.37 0.27 -0.51 149.76 1-2.80 10.43 0.02 -0.56 149.76 1-2.72 10.69 0.19 -0.50 149.76 1-3.22 10.48 0.19 -0.54 149.76 1-3.45 10.37 0.26 -0.57 149.76 1-3.00 10.25 0.08 -0.55 149.76 1-3.22 10.34 0.08 -0.53 149.76 1-3.09 10.37 0.01 -0.48 149.76 1 T-1-2.95 10.72 0.14 -0.50 149.76 1 NH3 H2O-3.42 10.53 0.19 -0.49 150.51 1 3.43 9.43-3.12 10.35 0.01 -0.55 149.76 1-3.55 10.66 0.25 -0.53 149.76 1-2.96 10.63 0.14 -0.54 149.76 1-3.28 10.82 0.39 -0.39 149.76 1-3.27 10.82 0.45 -0.50 149.76 1-2.76 10.66 0.21 -0.51 149.76 1-3.02 10.58 0.26 -0.45 149.76 1-3.18 10.82 0.23 -0.41 150.51 1-3.77 10.90 0.32 -0.29 149.76 1-3.95 10.96 0.35 -0.28 149.76 1-2.94 10.41 0.17 -0.48 149.76 1-3.52 10.51 -0.06 -0.47 149.76 1-3.19 10.43 -0.22 -0.48 149.76 1-3.43 10.52 -0.07 -0.43 149.76 1-2.94 10.56 -0.05 -0.50 150.51 1-3.53 10.41 -0.12 -0.44 149.76 1-3.63 10.20 -0.19 -0.40 149.76 1-3.70 10.39 -0.10 -0.45 149.76 1 T-2-3.22 10.49 -0.13 -0.48 149.76 1 NH3 H2O-3.33 10.48 -0.27 -0.42 149.76 1 3.34 9.47-4.15 10.41 -0.18 -0.39 149.76 1-3.43 10.51 -0.33 -0.49 149.76 1-4.03 10.47 -0.15 -0.39 149.76 1-4.09 10.60 -0.12 -0.34 149.76 1-4.18 10.47 -0.04 -0.36 149.76 1-4.35 10.50 -0.03 -0.37 149.76 1-4.95 10.45 0.25 -0.32 149.76 1-4.30 10.79 0.07 -0.34 149.76 1

-3.99 10.74 -0.08 -0.42 149.76 1-3.30 10.61 0.33 -0.43 149.76 1-2.89 10.67 0.23 -0.45 149.76 1-2.95 10.59 -0.03 -0.55 149.76 1-3.65 10.62 -0.26 -0.40 149.76 1-4.16 10.67 -0.08 -0.35 149.76 1-4.59 10.80 -0.08 -0.32 149.76 1-4.84 10.87 0.30 -0.25 149.76 1-4.61 10.81 0.39 -0.35 149.76 1-4.56 10.89 0.47 -0.31 149.76 1-5.12 10.59 0.43 -0.34 149.76 1-4.72 10.75 0.57 -0.32 149.76 1-4.31 10.85 0.48 -0.34 149.76 1 T-3-4.67 10.95 0.63 -0.35 150.51 1 NH3 H2O-4.74 10.94 0.46 -0.34 149.76 1 3.29 9.47-3.98 9.95 1.30 -0.28 149.76 1-4.21 9.85 0.79 -0.21 149.76 1-3.58 10.01 0.36 -0.33 149.76 1-3.35 9.92 0.16 -0.22 149.76 1-4.53 10.63 0.21 -0.29 149.76 1-4.69 10.64 0.41 -0.39 149.76 1-4.90 11.00 0.52 -0.32 149.76 1-0.13 0.15 -0.05 -0.03 149.76 1-0.06 0.08 -0.08 -0.05 149.76 1-0.15 0.06 0.11 -0.06 149.76 1
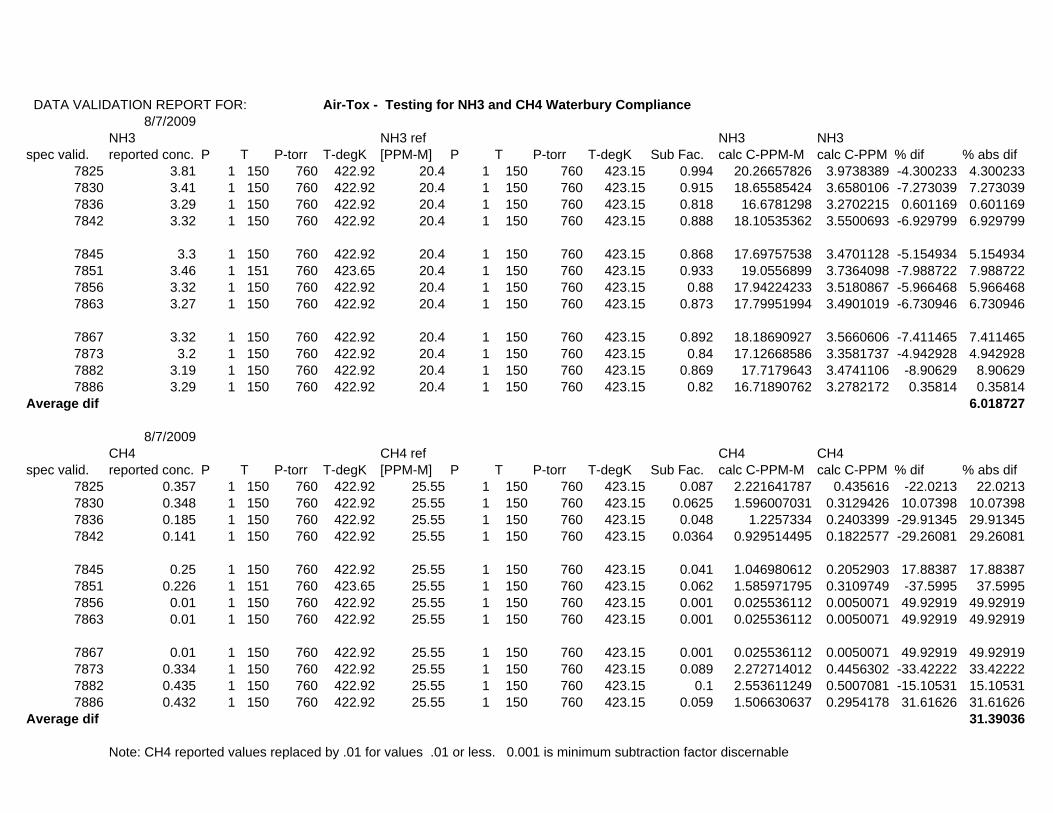
DATA VALIDATION REPORT FOR: Air-Tox - Testing for NH3 and CH4 Waterbury Compliance8/7/2009
NH3 NH3 ref NH3 NH3spec valid. reported conc. P T P-torr T-degK [PPM-M] P T P-torr T-degK Sub Fac. calc C-PPM-M calc C-PPM % dif % abs dif
7825 3.81 1 150 760 422.92 20.4 1 150 760 423.15 0.994 20.26657826 3.9738389 -4.300233 4.3002337830 3.41 1 150 760 422.92 20.4 1 150 760 423.15 0.915 18.65585424 3.6580106 -7.273039 7.2730397836 3.29 1 150 760 422.92 20.4 1 150 760 423.15 0.818 16.6781298 3.2702215 0.601169 0.6011697842 3.32 1 150 760 422.92 20.4 1 150 760 423.15 0.888 18.10535362 3.5500693 -6.929799 6.929799
7845 3.3 1 150 760 422.92 20.4 1 150 760 423.15 0.868 17.69757538 3.4701128 -5.154934 5.1549347851 3.46 1 151 760 423.65 20.4 1 150 760 423.15 0.933 19.0556899 3.7364098 -7.988722 7.9887227856 3.32 1 150 760 422.92 20.4 1 150 760 423.15 0.88 17.94224233 3.5180867 -5.966468 5.9664687863 3.27 1 150 760 422.92 20.4 1 150 760 423.15 0.873 17.79951994 3.4901019 -6.730946 6.730946
7867 3.32 1 150 760 422.92 20.4 1 150 760 423.15 0.892 18.18690927 3.5660606 -7.411465 7.4114657873 3.2 1 150 760 422.92 20.4 1 150 760 423.15 0.84 17.12668586 3.3581737 -4.942928 4.9429287882 3.19 1 150 760 422.92 20.4 1 150 760 423.15 0.869 17.7179643 3.4741106 -8.90629 8.906297886 3.29 1 150 760 422.92 20.4 1 150 760 423.15 0.82 16.71890762 3.2782172 0.35814 0.35814
Average dif 6.018727
8/7/2009CH4 CH4 ref CH4 CH4
spec valid. reported conc. P T P-torr T-degK [PPM-M] P T P-torr T-degK Sub Fac. calc C-PPM-M calc C-PPM % dif % abs dif7825 0.357 1 150 760 422.92 25.55 1 150 760 423.15 0.087 2.221641787 0.435616 -22.0213 22.02137830 0.348 1 150 760 422.92 25.55 1 150 760 423.15 0.0625 1.596007031 0.3129426 10.07398 10.073987836 0.185 1 150 760 422.92 25.55 1 150 760 423.15 0.048 1.2257334 0.2403399 -29.91345 29.913457842 0.141 1 150 760 422.92 25.55 1 150 760 423.15 0.0364 0.929514495 0.1822577 -29.26081 29.26081
7845 0.25 1 150 760 422.92 25.55 1 150 760 423.15 0.041 1.046980612 0.2052903 17.88387 17.883877851 0.226 1 151 760 423.65 25.55 1 150 760 423.15 0.062 1.585971795 0.3109749 -37.5995 37.59957856 0.01 1 150 760 422.92 25.55 1 150 760 423.15 0.001 0.025536112 0.0050071 49.92919 49.929197863 0.01 1 150 760 422.92 25.55 1 150 760 423.15 0.001 0.025536112 0.0050071 49.92919 49.92919
7867 0.01 1 150 760 422.92 25.55 1 150 760 423.15 0.001 0.025536112 0.0050071 49.92919 49.929197873 0.334 1 150 760 422.92 25.55 1 150 760 423.15 0.089 2.272714012 0.4456302 -33.42222 33.422227882 0.435 1 150 760 422.92 25.55 1 150 760 423.15 0.1 2.553611249 0.5007081 -15.10531 15.105317886 0.432 1 150 760 422.92 25.55 1 150 760 423.15 0.059 1.506630637 0.2954178 31.61626 31.61626
Average dif 31.39036
Note: CH4 reported values replaced by .01 for values .01 or less. 0.001 is minimum subtraction factor discernable
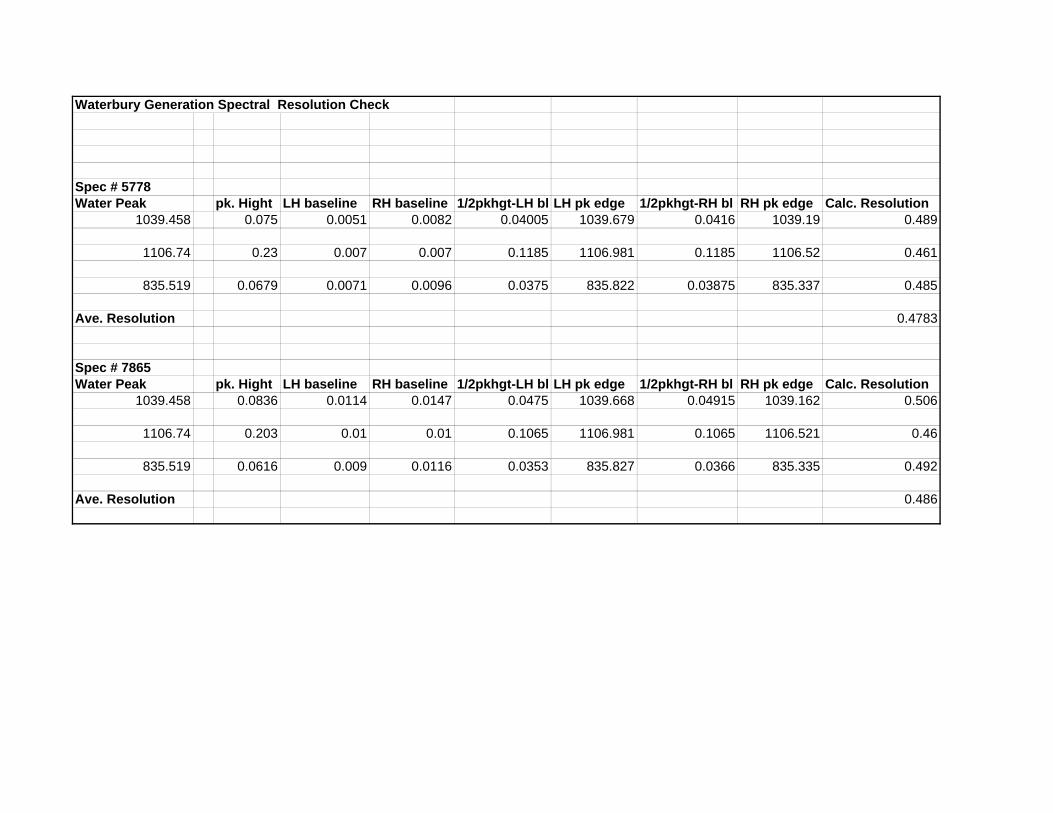
Waterbury Generation Spectral Resolution Check
Spec # 5778Water Peak pk. Hight LH baseline RH baseline 1/2pkhgt-LH bl LH pk edge 1/2pkhgt-RH bl RH pk edge Calc. Resolution
1039.458 0.075 0.0051 0.0082 0.04005 1039.679 0.0416 1039.19 0.489
1106.74 0.23 0.007 0.007 0.1185 1106.981 0.1185 1106.52 0.461
835.519 0.0679 0.0071 0.0096 0.0375 835.822 0.03875 835.337 0.485
Ave. Resolution 0.4783
Spec # 7865Water Peak pk. Hight LH baseline RH baseline 1/2pkhgt-LH bl LH pk edge 1/2pkhgt-RH bl RH pk edge Calc. Resolution
1039.458 0.0836 0.0114 0.0147 0.0475 1039.668 0.04915 1039.162 0.506
1106.74 0.203 0.01 0.01 0.1065 1106.981 0.1065 1106.521 0.46
835.519 0.0616 0.009 0.0116 0.0353 835.827 0.0366 835.335 0.492
Ave. Resolution 0.486
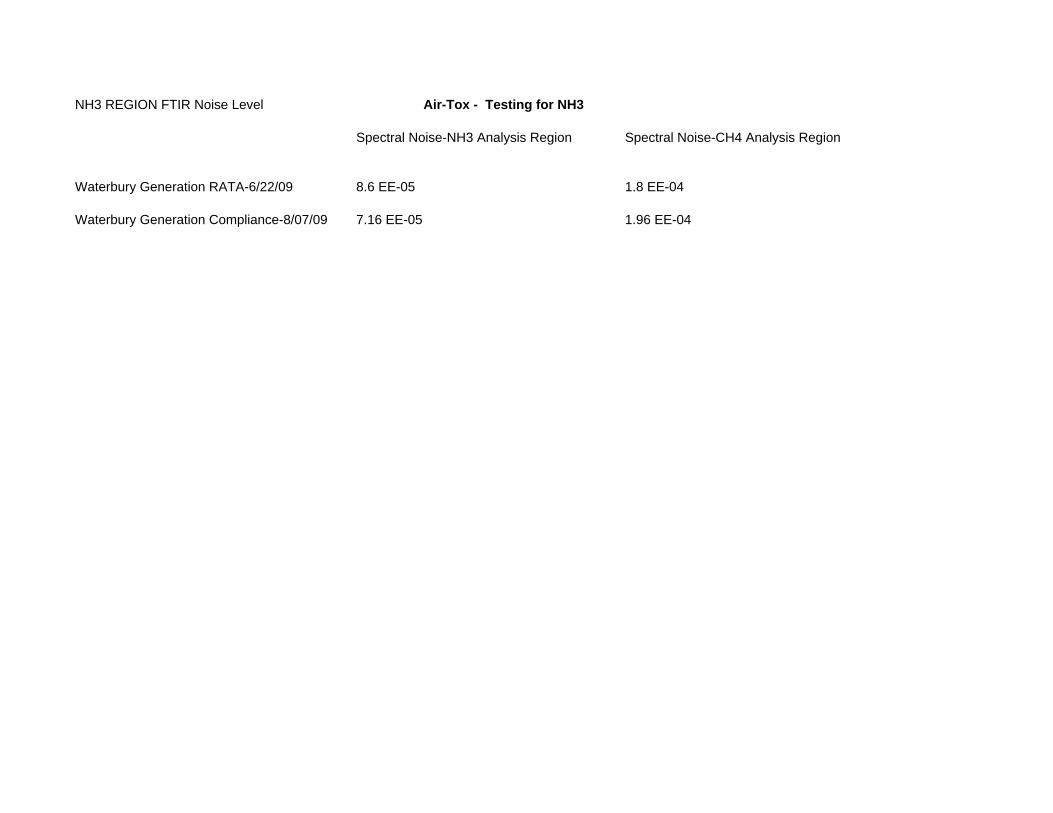
NH3 REGION FTIR Noise Level Air-Tox - Testing for NH3
Spectral Noise-NH3 Analysis Region Spectral Noise-CH4 Analysis Region
Waterbury Generation RATA-6/22/09 8.6 EE-05 1.8 EE-04
Waterbury Generation Compliance-8/07/09 7.16 EE-05 1.96 EE-04

ASTM D6348 MDC2 Test data---[note: CLS software reports error in PPM units]
Spectrum Date Time NH3low NH3 EB WaterH HighCO2 SF6 CO NO NO2 CH4 Temp (C) Pressure (Atm)LAB_5760. 6/22/2009 11:37:35 5.17888 0.168 11.62221 3.798789 -0.000586 4.241034 7.086098 -4.182318 10.18201 149.7647 1LAB_5761. 6/22/2009 11:40:36 5.141429 0.168 11.60206 3.800356 -0.000637 4.130925 6.975164 -4.243679 9.881664 149.7647 1LAB_5762. 6/22/2009 11:43:36 5.152934 0.168 11.67342 3.825339 -0.000835 4.231701 6.907011 -4.17779 10.40401 150.5098 1LAB_5763. 6/22/2009 11:46:37 5.17791 0.168 11.68392 3.833386 0.000038 4.189331 6.87126 -4.267041 10.06013 150.5098 1LAB_5764. 6/22/2009 11:49:37 5.152696 0.168 11.6447 3.832769 -0.000031 4.041754 6.782115 -4.602862 9.617047 149.7647 1LAB_5765. 6/22/2009 11:52:38 5.185042 0.169 11.68612 3.849559 -0.000408 4.070444 6.823457 -4.995335 9.291069 150.5098 1LAB_5766. 6/22/2009 11:55:38 5.156478 0.168 11.67937 3.841748 -0.000458 3.983166 6.682778 -4.901768 8.885998 149.7647 1LAB_5767. 6/22/2009 11:58:38 5.12667 0.168 11.6424 3.831289 -0.000316 3.660563 6.879694 -4.738441 7.843264 149.7647 1LAB_5768. 6/22/2009 12:01:38 5.156043 0.169 11.65779 3.832228 -0.000379 3.783123 6.645358 -4.876176 8.208041 149.7647 1LAB_5769. 6/22/2009 12:04:39 5.178834 0.168 11.6755 3.841489 -0.000742 3.756641 6.828431 -5.038983 8.056727 149.7647 1MDC 2 0.5046
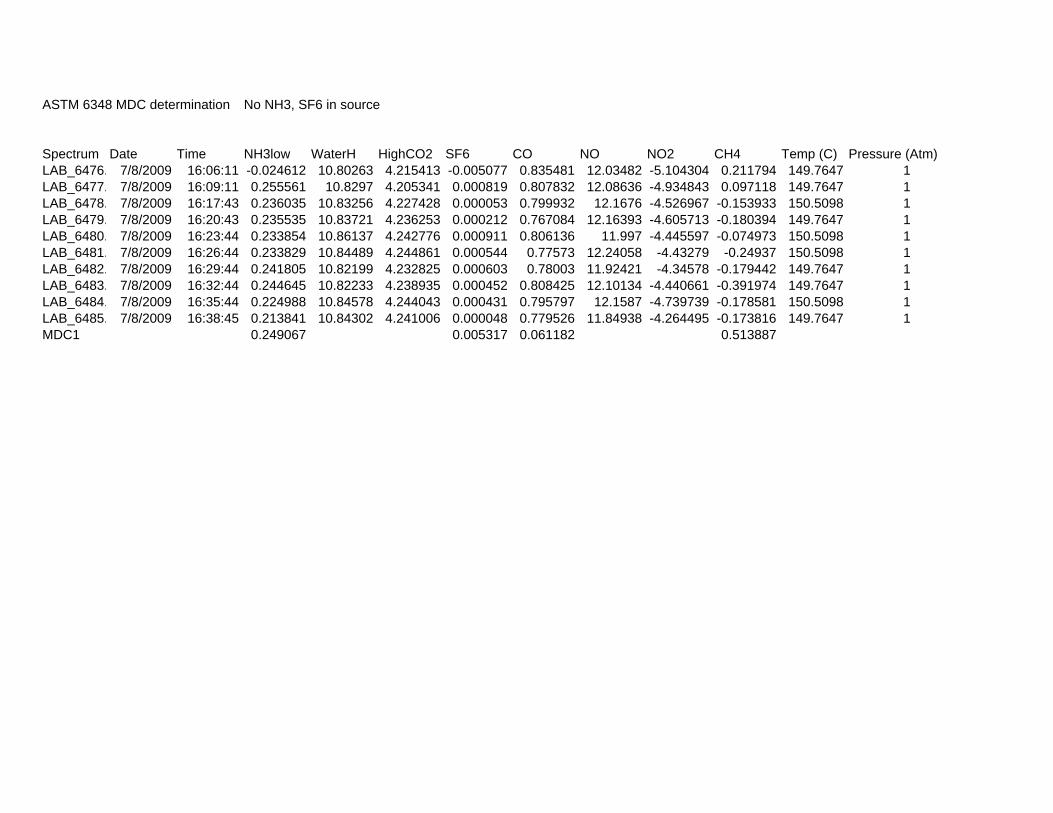
ASTM 6348 MDC determination No NH3, SF6 in source
Spectrum Date Time NH3low WaterH HighCO2 SF6 CO NO NO2 CH4 Temp (C) Pressure (Atm)LAB_6476. 7/8/2009 16:06:11 -0.024612 10.80263 4.215413 -0.005077 0.835481 12.03482 -5.104304 0.211794 149.7647 1LAB_6477. 7/8/2009 16:09:11 0.255561 10.8297 4.205341 0.000819 0.807832 12.08636 -4.934843 0.097118 149.7647 1LAB_6478. 7/8/2009 16:17:43 0.236035 10.83256 4.227428 0.000053 0.799932 12.1676 -4.526967 -0.153933 150.5098 1LAB_6479. 7/8/2009 16:20:43 0.235535 10.83721 4.236253 0.000212 0.767084 12.16393 -4.605713 -0.180394 149.7647 1LAB_6480. 7/8/2009 16:23:44 0.233854 10.86137 4.242776 0.000911 0.806136 11.997 -4.445597 -0.074973 150.5098 1LAB_6481. 7/8/2009 16:26:44 0.233829 10.84489 4.244861 0.000544 0.77573 12.24058 -4.43279 -0.24937 150.5098 1LAB_6482. 7/8/2009 16:29:44 0.241805 10.82199 4.232825 0.000603 0.78003 11.92421 -4.34578 -0.179442 149.7647 1LAB_6483. 7/8/2009 16:32:44 0.244645 10.82233 4.238935 0.000452 0.808425 12.10134 -4.440661 -0.391974 149.7647 1LAB_6484. 7/8/2009 16:35:44 0.224988 10.84578 4.244043 0.000431 0.795797 12.1587 -4.739739 -0.178581 150.5098 1LAB_6485. 7/8/2009 16:38:45 0.213841 10.84302 4.241006 0.000048 0.779526 11.84938 -4.264495 -0.173816 149.7647 1MDC1 0.249067 0.005317 0.061182 0.513887

PathLength Verification Spread Sheet
Air-Tox MKS FTIR System #1test gas information reference information
date F116 conc F116 press F116 temp. pk area F116 conc F116 press F116 temp. pk areaPPM mm deg C 1080-1160 PPM-M mm deg C 1080-1160
test 35 680 150 5.9 206.9 761 185 7.09
5/9/2007 35 781.28 149.7 6.557 206.9 761 185 7.09
SF6conc SF6 pres SF6 temp pk area SF6 conc SF6 press SF6 temp. pk areaPPM atm deg C 960-910 PPM-M atm deg C 960-910
7/7/2008 2.05 1.0209 149.76 1.508 56.1 1 152 7.787
F116 conc F116 press F116 temp. pk area F116 conc F116 press F116 temp. pk areaPPM atm deg C 1080-1160 PPM-M atm deg C 1080-1160
7/13/2009 10.7 1 149.95 1.9588 335.6 1.023 151.15 12.399
calculated path length[meters] expected % dif Acceptable
[<+/-5%]
5.0846448 5.11
4.9148242 5.11 -3.8194871 YES
[meters] expected % dif
5.1637206 5.11 1.0512835 YES
[meters] expected % dif
5.0546052 5.11 -1.0840476 YES
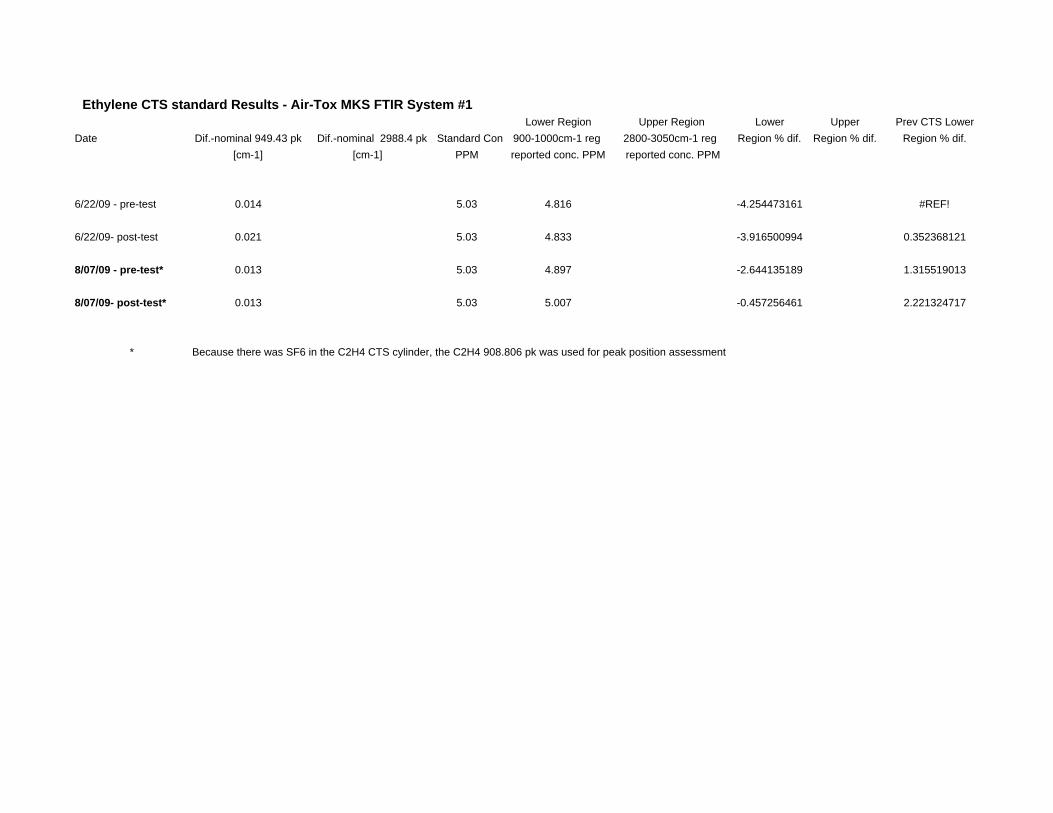
Ethylene CTS standard Results - Air-Tox MKS FTIR System #1Lower Region Upper Region Lower Upper Prev CTS Lower
Date Dif.-nominal 949.43 pk Dif.-nominal 2988.4 pk Standard Con 900-1000cm-1 reg 2800-3050cm-1 reg Region % dif. Region % dif. Region % dif.[cm-1] [cm-1] PPM reported conc. PPM reported conc. PPM
6/22/09 - pre-test 0.014 5.03 4.816 -4.254473161 #REF!
6/22/09- post-test 0.021 5.03 4.833 -3.916500994 0.352368121
8/07/09 - pre-test* 0.013 5.03 4.897 -2.644135189 1.315519013
8/07/09- post-test* 0.013 5.03 5.007 -0.457256461 2.221324717
* Because there was SF6 in the C2H4 CTS cylinder, the C2H4 908.806 pk was used for peak position assessment
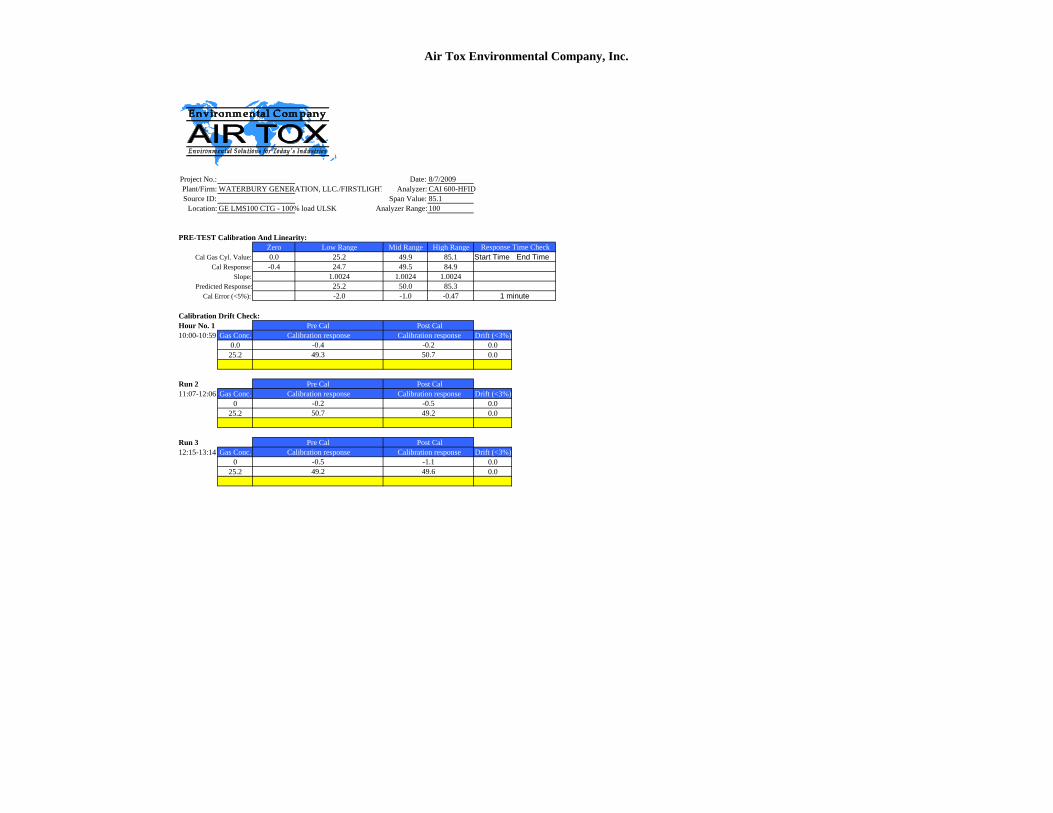
Air Tox Environmental Company, Inc.
Project No.: Date: 8/7/2009Plant/Firm: WATERBURY GENERATION, LLC./FIRSTLIGHT Analyzer: CAI 600-HFIDSource ID: Span Value: 85.1
Location: GE LMS100 CTG - 100% load ULSK Analyzer Range: 100
PRE-TEST Calibration And Linearity:Zero Low Range Mid Range High Range
Cal Gas Cyl. Value: 0.0 25.2 49.9 85.1 Start Time End Time Cal Response: -0.4 24.7 49.5 84.9
Slope: 1.0024 1.0024 1.0024Predicted Response: 25.2 50.0 85.3
Cal Error (<5%): -2.0 -1.0 -0.47
Calibration Drift Check:Hour No. 1 Pre Cal Post Cal10:00-10:59 Gas Conc. Calibration response Calibration response Drift (<3%)
0.0 0.025.2 0.0
Run 2 Pre Cal Post Cal11:07-12:06 Gas Conc. Calibration response Calibration response Drift (<3%)
0 0.025.2 0.0
Run 3 Pre Cal Post Cal12:15-13:14 Gas Conc. Calibration response Calibration response Drift (<3%)
0 0.025.2 0.0
Response Time Check
1 minute
-0.449.3
-0.250.7
-0.250.7
-0.549.2
-0.549.2
-1.149.6

WATERBURY GENERATION OIL COMPLIANCE TEST RUN NO.1
Current Date : 08/07/09 Current Time : 11:00 Daily Parameter Report - Minute Averages with Flags Air Tox Environmental Company, Inc. Logger Name : Air Tox Environmental Stack : Logger Id : 01 Boiler/Unit : Parameter : VOC600 Interval : 001M Units : PPM Data Flags Status Flags Date Time Average <PDTFBCMOUA+-RHLhlJjVWXYZf I?*>=m^vEd9za Q 08/07/09 10:00 -.5 08/07/09 10:01 -.3 08/07/09 10:02 .3 08/07/09 10:03 .4 08/07/09 10:04 .6 08/07/09 10:05 .6 08/07/09 10:06 .4 08/07/09 10:07 .3 08/07/09 10:08 .1 08/07/09 10:09 .0 08/07/09 10:10 -.2 08/07/09 10:11 -.3 08/07/09 10:12 -.5 08/07/09 10:13 -.9 08/07/09 10:14 -.7 08/07/09 10:15 -.5 08/07/09 10:16 -.8 08/07/09 10:17 -1.1 08/07/09 10:18 -1.2 08/07/09 10:19 -1.1 08/07/09 10:20 -1.3 08/07/09 10:21 -1.6 08/07/09 10:22 -1.5 08/07/09 10:23 -1.3 08/07/09 10:24 -1.3 08/07/09 10:25 -1.5 08/07/09 10:26 -1.4 08/07/09 10:27 -1.2 08/07/09 10:28 -1.4 08/07/09 10:29 -1.4 08/07/09 10:30 -1.5 08/07/09 10:31 -1.5 08/07/09 10:32 -1.1 08/07/09 10:33 -.8 08/07/09 10:34 -1.1 08/07/09 10:35 -1.2 08/07/09 10:36 -1.0 08/07/09 10:37 -1.1 08/07/09 10:38 -1.1 08/07/09 10:39 -1.1 08/07/09 10:40 -.9

WATERBURY GENERATION OIL COMPLIANCE TEST RUN NO.1
08/07/09 10:41 -.9 08/07/09 10:42 -.6 08/07/09 10:43 -.1 08/07/09 10:44 -.1 08/07/09 10:45 -.5 08/07/09 10:46 -.5 08/07/09 10:47 -.4 08/07/09 10:48 -.8 08/07/09 10:49 -1.2 08/07/09 10:50 -1.2 08/07/09 10:51 -1.5 08/07/09 10:52 -1.5 08/07/09 10:53 -1.6 08/07/09 10:54 -1.5 08/07/09 10:55 -1.0 08/07/09 10:56 -1.0 08/07/09 10:57 -1.0 08/07/09 10:58 -.9 08/07/09 10:59 -1.1 Max .6 Min -1.6 Mean -.8 Records 60 Status : '<' - Less than ##% Data, 'P' - Power Fail, 'D' - Disabled, 'T' - Out-of-Control, 'F' - Boiler Off-Line, Flags : 'B' - Bad Status, 'C' - Calibration, 'M' - Maintenance, 'O' - Analog Overrange, 'U' - Analog Underrange, 'A' - Arithmetic Error, '+' - Maximum, '-' - Minimum, 'R' - Rate of Change, 'H' - High-High Alarm, 'L' - Low-Low Alarm, 'h' - High Alarm, 'l' - Low Alarm, 'J' - High Rate of Change, 'j' - Low Rate of Change, 'V' - DIS #1 Obs, 'W' - DIS #2 Obs, 'X' - DIS #3 Obs, 'Y' - DIS #4 Obs, 'Z' - DIS #5 Obs.

WATERBURY GENERATION OIL COMPLIANCE TEST RUN NO.1
Current Date : 08/07/09 Current Time : 11:00 Daily Parameter Report - Minute Averages with Flags Air Tox Environmental Company, Inc. Logger Name : Air Tox Environmental Stack : Logger Id : 01 Boiler/Unit : Parameter : NOX Interval : 001M Units : PPM Data Flags Status Flags Date Time Average <PDTFBCMOUA+-RHLhlJjVWXYZf I?*>=m^vEd9za Q 08/07/09 10:00 6.8 08/07/09 10:01 6.8 08/07/09 10:02 6.6 08/07/09 10:03 6.9 08/07/09 10:04 6.6 08/07/09 10:05 6.6 08/07/09 10:06 6.7 08/07/09 10:07 6.9 08/07/09 10:08 6.9 08/07/09 10:09 7.1 08/07/09 10:10 7.0 08/07/09 10:11 7.1 08/07/09 10:12 6.8 08/07/09 10:13 6.7 08/07/09 10:14 6.9 08/07/09 10:15 6.9 08/07/09 10:16 6.8 08/07/09 10:17 7.2 08/07/09 10:18 6.9 08/07/09 10:19 6.5 08/07/09 10:20 7.0 08/07/09 10:21 6.7 08/07/09 10:22 6.8 08/07/09 10:23 6.9 08/07/09 10:24 6.9 08/07/09 10:25 6.8 08/07/09 10:26 6.8 08/07/09 10:27 6.9 08/07/09 10:28 6.9 08/07/09 10:29 7.0 08/07/09 10:30 7.0 08/07/09 10:31 7.1 08/07/09 10:32 6.9 08/07/09 10:33 6.9 08/07/09 10:34 7.0 08/07/09 10:35 7.0 08/07/09 10:36 6.8 08/07/09 10:37 7.1 08/07/09 10:38 7.0 08/07/09 10:39 7.2 08/07/09 10:40 6.8

WATERBURY GENERATION OIL COMPLIANCE TEST RUN NO.1
08/07/09 10:41 6.9 08/07/09 10:42 6.6 08/07/09 10:43 6.7 08/07/09 10:44 7.1 08/07/09 10:45 6.8 08/07/09 10:46 6.7 08/07/09 10:47 7.0 08/07/09 10:48 6.6 08/07/09 10:49 6.8 08/07/09 10:50 7.1 08/07/09 10:51 6.9 08/07/09 10:52 7.1 08/07/09 10:53 7.3 08/07/09 10:54 7.3 08/07/09 10:55 7.0 08/07/09 10:56 6.9 08/07/09 10:57 6.9 08/07/09 10:58 6.9 08/07/09 10:59 7.1 Max 7.3 Min 6.5 Mean 6.9 Records 60 Status : '<' - Less than ##% Data, 'P' - Power Fail, 'D' - Disabled, 'T' - Out-of-Control, 'F' - Boiler Off-Line, Flags : 'B' - Bad Status, 'C' - Calibration, 'M' - Maintenance, 'O' - Analog Overrange, 'U' - Analog Underrange, 'A' - Arithmetic Error, '+' - Maximum, '-' - Minimum, 'R' - Rate of Change, 'H' - High-High Alarm, 'L' - Low-Low Alarm, 'h' - High Alarm, 'l' - Low Alarm, 'J' - High Rate of Change, 'j' - Low Rate of Change, 'V' - DIS #1 Obs, 'W' - DIS #2 Obs, 'X' - DIS #3 Obs, 'Y' - DIS #4 Obs, 'Z' - DIS #5 Obs.

WATERBURY GENERATION OIL COMPLIANCE TEST RUN NO.1
Current Date : 08/07/09 Current Time : 11:00 Daily Parameter Report - Minute Averages with Flags Air Tox Environmental Company, Inc. Logger Name : Air Tox Environmental Stack : Logger Id : 01 Boiler/Unit : Parameter : O2-2 Interval : 001M Units : % Data Flags Status Flags Date Time Average <PDTFBCMOUA+-RHLhlJjVWXYZf I?*>=m^vEd9za Q 08/07/09 10:00 13.0 08/07/09 10:01 13.0 08/07/09 10:02 13.0 08/07/09 10:03 13.0 08/07/09 10:04 13.0 08/07/09 10:05 13.0 08/07/09 10:06 13.0 08/07/09 10:07 13.0 08/07/09 10:08 13.0 08/07/09 10:09 13.0 08/07/09 10:10 13.0 08/07/09 10:11 13.0 08/07/09 10:12 13.0 08/07/09 10:13 13.0 08/07/09 10:14 13.0 08/07/09 10:15 13.0 08/07/09 10:16 13.0 08/07/09 10:17 13.0 08/07/09 10:18 13.0 08/07/09 10:19 13.0 08/07/09 10:20 13.0 08/07/09 10:21 13.0 08/07/09 10:22 13.0 08/07/09 10:23 13.0 08/07/09 10:24 13.0 08/07/09 10:25 13.0 08/07/09 10:26 13.0 08/07/09 10:27 13.0 08/07/09 10:28 13.0 08/07/09 10:29 13.0 08/07/09 10:30 13.0 08/07/09 10:31 13.0 08/07/09 10:32 13.0 08/07/09 10:33 13.0 08/07/09 10:34 13.0 08/07/09 10:35 13.0 08/07/09 10:36 13.0 08/07/09 10:37 13.0 08/07/09 10:38 13.0 08/07/09 10:39 13.0 08/07/09 10:40 13.0

WATERBURY GENERATION OIL COMPLIANCE TEST RUN NO.1
08/07/09 10:41 13.0 08/07/09 10:42 13.0 08/07/09 10:43 13.0 08/07/09 10:44 13.0 08/07/09 10:45 13.0 08/07/09 10:46 13.0 08/07/09 10:47 13.0 08/07/09 10:48 13.0 08/07/09 10:49 13.0 08/07/09 10:50 13.0 08/07/09 10:51 13.0 08/07/09 10:52 13.0 08/07/09 10:53 13.0 08/07/09 10:54 13.0 08/07/09 10:55 13.0 08/07/09 10:56 13.0 08/07/09 10:57 13.0 08/07/09 10:58 13.0 08/07/09 10:59 13.0 Max 13.0 Min 13.0 Mean 13.0 Records 60 Status : '<' - Less than ##% Data, 'P' - Power Fail, 'D' - Disabled, 'T' - Out-of-Control, 'F' - Boiler Off-Line, Flags : 'B' - Bad Status, 'C' - Calibration, 'M' - Maintenance, 'O' - Analog Overrange, 'U' - Analog Underrange, 'A' - Arithmetic Error, '+' - Maximum, '-' - Minimum, 'R' - Rate of Change, 'H' - High-High Alarm, 'L' - Low-Low Alarm, 'h' - High Alarm, 'l' - Low Alarm, 'J' - High Rate of Change, 'j' - Low Rate of Change, 'V' - DIS #1 Obs, 'W' - DIS #2 Obs, 'X' - DIS #3 Obs, 'Y' - DIS #4 Obs, 'Z' - DIS #5 Obs.

WATERBURY GENERATION OIL COMPLIANCE TEST RUN NO.1
Current Date : 08/07/09 Current Time : 11:00 Daily Parameter Report - Minute Averages with Flags Air Tox Environmental Company, Inc. Logger Name : Air Tox Environmental Stack : Logger Id : 01 Boiler/Unit : Parameter : CO2-2 Interval : 001M Units : % Data Flags Status Flags Date Time Average <PDTFBCMOUA+-RHLhlJjVWXYZf I?*>=m^vEd9za Q 08/07/09 10:00 5.9 08/07/09 10:01 5.9 08/07/09 10:02 5.9 08/07/09 10:03 5.9 08/07/09 10:04 5.9 08/07/09 10:05 5.8 08/07/09 10:06 5.9 08/07/09 10:07 5.8 08/07/09 10:08 5.9 08/07/09 10:09 5.8 08/07/09 10:10 5.8 08/07/09 10:11 5.8 08/07/09 10:12 5.9 08/07/09 10:13 5.9 08/07/09 10:14 5.9 08/07/09 10:15 5.9 08/07/09 10:16 5.9 08/07/09 10:17 5.8 08/07/09 10:18 5.8 08/07/09 10:19 5.9 08/07/09 10:20 5.8 08/07/09 10:21 5.8 08/07/09 10:22 5.9 08/07/09 10:23 5.9 08/07/09 10:24 5.9 08/07/09 10:25 5.8 08/07/09 10:26 5.9 08/07/09 10:27 5.9 08/07/09 10:28 5.9 08/07/09 10:29 5.8 08/07/09 10:30 5.9 08/07/09 10:31 5.9 08/07/09 10:32 5.9 08/07/09 10:33 5.9 08/07/09 10:34 5.8 08/07/09 10:35 5.9 08/07/09 10:36 5.9 08/07/09 10:37 5.9 08/07/09 10:38 5.9 08/07/09 10:39 5.9 08/07/09 10:40 5.9
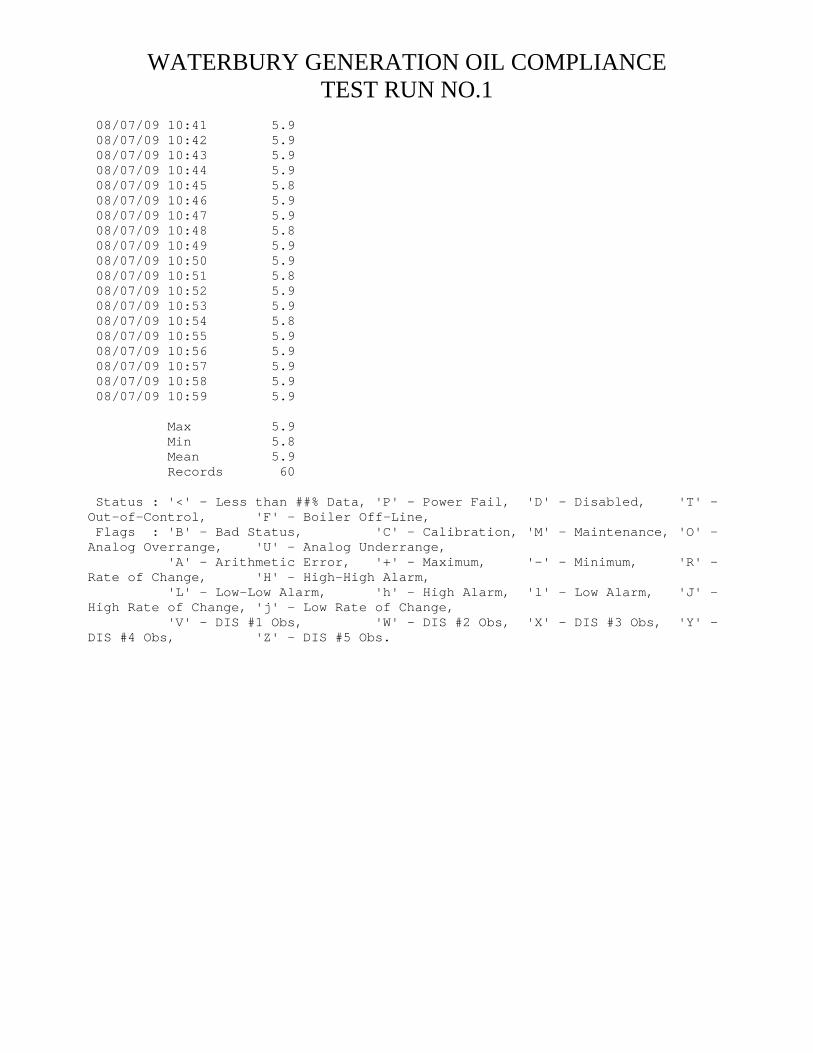
WATERBURY GENERATION OIL COMPLIANCE TEST RUN NO.1
08/07/09 10:41 5.9 08/07/09 10:42 5.9 08/07/09 10:43 5.9 08/07/09 10:44 5.9 08/07/09 10:45 5.8 08/07/09 10:46 5.9 08/07/09 10:47 5.9 08/07/09 10:48 5.8 08/07/09 10:49 5.9 08/07/09 10:50 5.9 08/07/09 10:51 5.8 08/07/09 10:52 5.9 08/07/09 10:53 5.9 08/07/09 10:54 5.8 08/07/09 10:55 5.9 08/07/09 10:56 5.9 08/07/09 10:57 5.9 08/07/09 10:58 5.9 08/07/09 10:59 5.9 Max 5.9 Min 5.8 Mean 5.9 Records 60 Status : '<' - Less than ##% Data, 'P' - Power Fail, 'D' - Disabled, 'T' - Out-of-Control, 'F' - Boiler Off-Line, Flags : 'B' - Bad Status, 'C' - Calibration, 'M' - Maintenance, 'O' - Analog Overrange, 'U' - Analog Underrange, 'A' - Arithmetic Error, '+' - Maximum, '-' - Minimum, 'R' - Rate of Change, 'H' - High-High Alarm, 'L' - Low-Low Alarm, 'h' - High Alarm, 'l' - Low Alarm, 'J' - High Rate of Change, 'j' - Low Rate of Change, 'V' - DIS #1 Obs, 'W' - DIS #2 Obs, 'X' - DIS #3 Obs, 'Y' - DIS #4 Obs, 'Z' - DIS #5 Obs.

WATERBURY GENERATION OIL COMPLIANCE TEST RUN NO.1
Current Date : 08/07/09 Current Time : 11:00 Daily Parameter Report - Minute Averages with Flags Air Tox Environmental Company, Inc. Logger Name : Air Tox Environmental Stack : Logger Id : 01 Boiler/Unit : Parameter : CO-2 Interval : 001M Units : PPM Data Flags Status Flags Date Time Average <PDTFBCMOUA+-RHLhlJjVWXYZf I?*>=m^vEd9za Q 08/07/09 10:00 1.3 08/07/09 10:01 1.0 08/07/09 10:02 1.3 08/07/09 10:03 1.3 08/07/09 10:04 1.3 08/07/09 10:05 1.2 08/07/09 10:06 1.1 08/07/09 10:07 1.6 08/07/09 10:08 1.3 08/07/09 10:09 1.2 08/07/09 10:10 1.3 08/07/09 10:11 1.1 08/07/09 10:12 1.4 08/07/09 10:13 1.2 08/07/09 10:14 1.4 08/07/09 10:15 1.3 08/07/09 10:16 1.3 08/07/09 10:17 1.4 08/07/09 10:18 1.2 08/07/09 10:19 1.4 08/07/09 10:20 1.5 08/07/09 10:21 1.2 08/07/09 10:22 1.3 08/07/09 10:23 1.3 08/07/09 10:24 1.3 08/07/09 10:25 1.5 08/07/09 10:26 1.2 08/07/09 10:27 1.3 08/07/09 10:28 1.2 08/07/09 10:29 1.2 08/07/09 10:30 1.2 08/07/09 10:31 1.0 08/07/09 10:32 1.2 08/07/09 10:33 1.2 08/07/09 10:34 1.5 08/07/09 10:35 1.3 08/07/09 10:36 1.2 08/07/09 10:37 1.0 08/07/09 10:38 1.5 08/07/09 10:39 1.1 08/07/09 10:40 1.1

WATERBURY GENERATION OIL COMPLIANCE TEST RUN NO.1
08/07/09 10:41 1.3 08/07/09 10:42 1.1 08/07/09 10:43 1.4 08/07/09 10:44 1.2 08/07/09 10:45 1.3 08/07/09 10:46 1.2 08/07/09 10:47 1.3 08/07/09 10:48 1.2 08/07/09 10:49 1.3 08/07/09 10:50 1.2 08/07/09 10:51 1.3 08/07/09 10:52 1.4 08/07/09 10:53 1.3 08/07/09 10:54 1.3 08/07/09 10:55 1.2 08/07/09 10:56 1.4 08/07/09 10:57 1.3 08/07/09 10:58 1.2 08/07/09 10:59 1.4 Max 1.6 Min 1.0 Mean 1.3 Records 60 Status : '<' - Less than ##% Data, 'P' - Power Fail, 'D' - Disabled, 'T' - Out-of-Control, 'F' - Boiler Off-Line, Flags : 'B' - Bad Status, 'C' - Calibration, 'M' - Maintenance, 'O' - Analog Overrange, 'U' - Analog Underrange, 'A' - Arithmetic Error, '+' - Maximum, '-' - Minimum, 'R' - Rate of Change, 'H' - High-High Alarm, 'L' - Low-Low Alarm, 'h' - High Alarm, 'l' - Low Alarm, 'J' - High Rate of Change, 'j' - Low Rate of Change, 'V' - DIS #1 Obs, 'W' - DIS #2 Obs, 'X' - DIS #3 Obs, 'Y' - DIS #4 Obs, 'Z' - DIS #5 Obs.

WATERBURY GENERATION OIL COMPLIANCE TEST RUN NO.2
Current Date : 08/07/09 Current Time : 12:08 Daily Parameter Report - Minute Averages with Flags Air Tox Environmental Company, Inc. Logger Name : Air Tox Environmental Stack : Logger Id : 01 Boiler/Unit : Parameter : VOC600 Interval : 001M Units : PPM Data Flags Status Flags Date Time Average <PDTFBCMOUA+-RHLhlJjVWXYZf I?*>=m^vEd9za Q 08/07/09 11:07 -1.0 08/07/09 11:08 -.8 08/07/09 11:09 -.6 08/07/09 11:10 -.5 08/07/09 11:11 -.5 08/07/09 11:12 -.5 08/07/09 11:13 -.6 08/07/09 11:14 -1.0 08/07/09 11:15 -1.0 08/07/09 11:16 -1.0 08/07/09 11:17 -1.5 08/07/09 11:18 -1.5 08/07/09 11:19 -1.4 08/07/09 11:20 -1.2 08/07/09 11:21 -1.3 08/07/09 11:22 -1.4 08/07/09 11:23 -1.5 08/07/09 11:24 -1.2 08/07/09 11:25 -1.4 08/07/09 11:26 -1.4 08/07/09 11:27 -1.2 08/07/09 11:28 -.8 08/07/09 11:29 -.9 08/07/09 11:30 -1.0 08/07/09 11:31 -1.0 08/07/09 11:32 -.9 08/07/09 11:33 -.9 08/07/09 11:34 -1.1 08/07/09 11:35 -1.3 08/07/09 11:36 -1.4 08/07/09 11:37 -1.3 08/07/09 11:38 -1.3 08/07/09 11:39 -1.4 08/07/09 11:40 -1.7 08/07/09 11:41 -1.5 08/07/09 11:42 -1.5 08/07/09 11:43 -1.6 08/07/09 11:44 -1.7 08/07/09 11:45 -1.9 08/07/09 11:46 -2.1 08/07/09 11:47 -2.3

WATERBURY GENERATION OIL COMPLIANCE TEST RUN NO.2
08/07/09 11:48 -2.6 08/07/09 11:49 -2.1 08/07/09 11:50 -1.6 08/07/09 11:51 -1.7 08/07/09 11:52 -1.8 08/07/09 11:53 -1.8 08/07/09 11:54 -1.7 08/07/09 11:55 -1.7 08/07/09 11:56 -1.6 08/07/09 11:57 -1.7 08/07/09 11:58 -1.7 08/07/09 11:59 -1.6 08/07/09 12:00 -1.6 08/07/09 12:01 -1.5 08/07/09 12:02 -1.3 08/07/09 12:03 -1.1 08/07/09 12:04 -1.2 08/07/09 12:05 -1.3 08/07/09 12:06 -1.2 Max -.5 Min -2.6 Mean -1.3 Records 60 Status : '<' - Less than ##% Data, 'P' - Power Fail, 'D' - Disabled, 'T' - Out-of-Control, 'F' - Boiler Off-Line, Flags : 'B' - Bad Status, 'C' - Calibration, 'M' - Maintenance, 'O' - Analog Overrange, 'U' - Analog Underrange, 'A' - Arithmetic Error, '+' - Maximum, '-' - Minimum, 'R' - Rate of Change, 'H' - High-High Alarm, 'L' - Low-Low Alarm, 'h' - High Alarm, 'l' - Low Alarm, 'J' - High Rate of Change, 'j' - Low Rate of Change, 'V' - DIS #1 Obs, 'W' - DIS #2 Obs, 'X' - DIS #3 Obs, 'Y' - DIS #4 Obs, 'Z' - DIS #5 Obs.

WATERBURY GENERATION OIL COMPLIANCE TEST RUN NO.2
Current Date : 08/07/09 Current Time : 12:08 Daily Parameter Report - Minute Averages with Flags Air Tox Environmental Company, Inc. Logger Name : Air Tox Environmental Stack : Logger Id : 01 Boiler/Unit : Parameter : NOX Interval : 001M Units : PPM Data Flags Status Flags Date Time Average <PDTFBCMOUA+-RHLhlJjVWXYZf I?*>=m^vEd9za Q 08/07/09 11:07 6.7 08/07/09 11:08 7.3 08/07/09 11:09 7.1 08/07/09 11:10 6.7 08/07/09 11:11 6.9 08/07/09 11:12 7.1 08/07/09 11:13 7.2 08/07/09 11:14 7.1 08/07/09 11:15 7.1 08/07/09 11:16 7.2 08/07/09 11:17 7.1 08/07/09 11:18 7.2 08/07/09 11:19 7.4 08/07/09 11:20 7.2 08/07/09 11:21 7.5 08/07/09 11:22 6.9 08/07/09 11:23 7.0 08/07/09 11:24 7.0 08/07/09 11:25 7.1 08/07/09 11:26 6.9 08/07/09 11:27 7.1 08/07/09 11:28 7.2 08/07/09 11:29 6.9 08/07/09 11:30 7.2 08/07/09 11:31 7.1 08/07/09 11:32 7.0 08/07/09 11:33 7.0 08/07/09 11:34 7.1 08/07/09 11:35 6.9 08/07/09 11:36 6.6 08/07/09 11:37 6.8 08/07/09 11:38 7.1 08/07/09 11:39 7.2 08/07/09 11:40 6.8 08/07/09 11:41 7.0 08/07/09 11:42 6.9 08/07/09 11:43 7.0 08/07/09 11:44 7.0 08/07/09 11:45 7.1 08/07/09 11:46 7.0 08/07/09 11:47 7.1

WATERBURY GENERATION OIL COMPLIANCE TEST RUN NO.2
08/07/09 11:48 7.0 08/07/09 11:49 7.1 08/07/09 11:50 7.2 08/07/09 11:51 6.7 08/07/09 11:52 6.9 08/07/09 11:53 6.7 08/07/09 11:54 6.8 08/07/09 11:55 7.2 08/07/09 11:56 6.8 08/07/09 11:57 7.0 08/07/09 11:58 7.0 08/07/09 11:59 7.2 08/07/09 12:00 6.9 08/07/09 12:01 6.9 08/07/09 12:02 7.3 08/07/09 12:03 6.7 08/07/09 12:04 6.7 08/07/09 12:05 7.0 08/07/09 12:06 6.9 Max 7.5 Min 6.6 Mean 7.0 Records 60 Status : '<' - Less than ##% Data, 'P' - Power Fail, 'D' - Disabled, 'T' - Out-of-Control, 'F' - Boiler Off-Line, Flags : 'B' - Bad Status, 'C' - Calibration, 'M' - Maintenance, 'O' - Analog Overrange, 'U' - Analog Underrange, 'A' - Arithmetic Error, '+' - Maximum, '-' - Minimum, 'R' - Rate of Change, 'H' - High-High Alarm, 'L' - Low-Low Alarm, 'h' - High Alarm, 'l' - Low Alarm, 'J' - High Rate of Change, 'j' - Low Rate of Change, 'V' - DIS #1 Obs, 'W' - DIS #2 Obs, 'X' - DIS #3 Obs, 'Y' - DIS #4 Obs, 'Z' - DIS #5 Obs.

WATERBURY GENERATION OIL COMPLIANCE TEST RUN NO.2
Current Date : 08/07/09 Current Time : 12:08 Daily Parameter Report - Minute Averages with Flags Air Tox Environmental Company, Inc. Logger Name : Air Tox Environmental Stack : Logger Id : 01 Boiler/Unit : Parameter : O2-2 Interval : 001M Units : % Data Flags Status Flags Date Time Average <PDTFBCMOUA+-RHLhlJjVWXYZf I?*>=m^vEd9za Q 08/07/09 11:07 12.9 08/07/09 11:08 13.0 08/07/09 11:09 12.9 08/07/09 11:10 12.9 08/07/09 11:11 13.0 08/07/09 11:12 13.0 08/07/09 11:13 13.0 08/07/09 11:14 13.0 08/07/09 11:15 13.0 08/07/09 11:16 13.0 08/07/09 11:17 13.0 08/07/09 11:18 12.9 08/07/09 11:19 13.0 08/07/09 11:20 12.9 08/07/09 11:21 12.9 08/07/09 11:22 12.9 08/07/09 11:23 12.9 08/07/09 11:24 13.0 08/07/09 11:25 13.0 08/07/09 11:26 13.0 08/07/09 11:27 13.0 08/07/09 11:28 12.9 08/07/09 11:29 12.9 08/07/09 11:30 12.9 08/07/09 11:31 13.0 08/07/09 11:32 13.0 08/07/09 11:33 13.0 08/07/09 11:34 13.0 08/07/09 11:35 13.0 08/07/09 11:36 13.0 08/07/09 11:37 12.9 08/07/09 11:38 13.0 08/07/09 11:39 13.0 08/07/09 11:40 12.9 08/07/09 11:41 12.9 08/07/09 11:42 13.0 08/07/09 11:43 12.9 08/07/09 11:44 12.9 08/07/09 11:45 12.9 08/07/09 11:46 12.9 08/07/09 11:47 12.9

WATERBURY GENERATION OIL COMPLIANCE TEST RUN NO.2
08/07/09 11:48 13.0 08/07/09 11:49 13.0 08/07/09 11:50 13.0 08/07/09 11:51 12.9 08/07/09 11:52 12.9 08/07/09 11:53 13.0 08/07/09 11:54 13.0 08/07/09 11:55 12.9 08/07/09 11:56 12.9 08/07/09 11:57 12.9 08/07/09 11:58 13.0 08/07/09 11:59 13.0 08/07/09 12:00 13.0 08/07/09 12:01 13.0 08/07/09 12:02 12.9 08/07/09 12:03 12.9 08/07/09 12:04 13.0 08/07/09 12:05 13.0 08/07/09 12:06 12.9 Max 13.0 Min 12.9 Mean 13.0 Records 60 Status : '<' - Less than ##% Data, 'P' - Power Fail, 'D' - Disabled, 'T' - Out-of-Control, 'F' - Boiler Off-Line, Flags : 'B' - Bad Status, 'C' - Calibration, 'M' - Maintenance, 'O' - Analog Overrange, 'U' - Analog Underrange, 'A' - Arithmetic Error, '+' - Maximum, '-' - Minimum, 'R' - Rate of Change, 'H' - High-High Alarm, 'L' - Low-Low Alarm, 'h' - High Alarm, 'l' - Low Alarm, 'J' - High Rate of Change, 'j' - Low Rate of Change, 'V' - DIS #1 Obs, 'W' - DIS #2 Obs, 'X' - DIS #3 Obs, 'Y' - DIS #4 Obs, 'Z' - DIS #5 Obs.

WATERBURY GENERATION OIL COMPLIANCE TEST RUN NO.2
Current Date : 08/07/09 Current Time : 12:08 Daily Parameter Report - Minute Averages with Flags Air Tox Environmental Company, Inc. Logger Name : Air Tox Environmental Stack : Logger Id : 01 Boiler/Unit : Parameter : CO2-2 Interval : 001M Units : % Data Flags Status Flags Date Time Average <PDTFBCMOUA+-RHLhlJjVWXYZf I?*>=m^vEd9za Q 08/07/09 11:07 5.9 08/07/09 11:08 5.9 08/07/09 11:09 5.9 08/07/09 11:10 5.9 08/07/09 11:11 5.9 08/07/09 11:12 5.9 08/07/09 11:13 5.9 08/07/09 11:14 5.9 08/07/09 11:15 5.9 08/07/09 11:16 5.9 08/07/09 11:17 5.9 08/07/09 11:18 5.9 08/07/09 11:19 5.9 08/07/09 11:20 5.9 08/07/09 11:21 5.9 08/07/09 11:22 5.9 08/07/09 11:23 5.9 08/07/09 11:24 5.9 08/07/09 11:25 5.9 08/07/09 11:26 5.9 08/07/09 11:27 5.9 08/07/09 11:28 5.9 08/07/09 11:29 5.9 08/07/09 11:30 5.9 08/07/09 11:31 5.9 08/07/09 11:32 5.9 08/07/09 11:33 5.9 08/07/09 11:34 5.9 08/07/09 11:35 5.9 08/07/09 11:36 5.9 08/07/09 11:37 5.9 08/07/09 11:38 5.9 08/07/09 11:39 5.9 08/07/09 11:40 5.9 08/07/09 11:41 5.9 08/07/09 11:42 5.9 08/07/09 11:43 5.9 08/07/09 11:44 5.9 08/07/09 11:45 5.9 08/07/09 11:46 5.9 08/07/09 11:47 5.9

WATERBURY GENERATION OIL COMPLIANCE TEST RUN NO.2
08/07/09 11:48 5.9 08/07/09 11:49 5.9 08/07/09 11:50 5.9 08/07/09 11:51 5.9 08/07/09 11:52 5.9 08/07/09 11:53 5.9 08/07/09 11:54 5.9 08/07/09 11:55 5.9 08/07/09 11:56 5.9 08/07/09 11:57 5.9 08/07/09 11:58 5.9 08/07/09 11:59 5.9 08/07/09 12:00 5.9 08/07/09 12:01 5.9 08/07/09 12:02 5.9 08/07/09 12:03 5.9 08/07/09 12:04 5.9 08/07/09 12:05 5.9 08/07/09 12:06 5.9 Max 5.9 Min 5.9 Mean 5.9 Records 60 Status : '<' - Less than ##% Data, 'P' - Power Fail, 'D' - Disabled, 'T' - Out-of-Control, 'F' - Boiler Off-Line, Flags : 'B' - Bad Status, 'C' - Calibration, 'M' - Maintenance, 'O' - Analog Overrange, 'U' - Analog Underrange, 'A' - Arithmetic Error, '+' - Maximum, '-' - Minimum, 'R' - Rate of Change, 'H' - High-High Alarm, 'L' - Low-Low Alarm, 'h' - High Alarm, 'l' - Low Alarm, 'J' - High Rate of Change, 'j' - Low Rate of Change, 'V' - DIS #1 Obs, 'W' - DIS #2 Obs, 'X' - DIS #3 Obs, 'Y' - DIS #4 Obs, 'Z' - DIS #5 Obs.
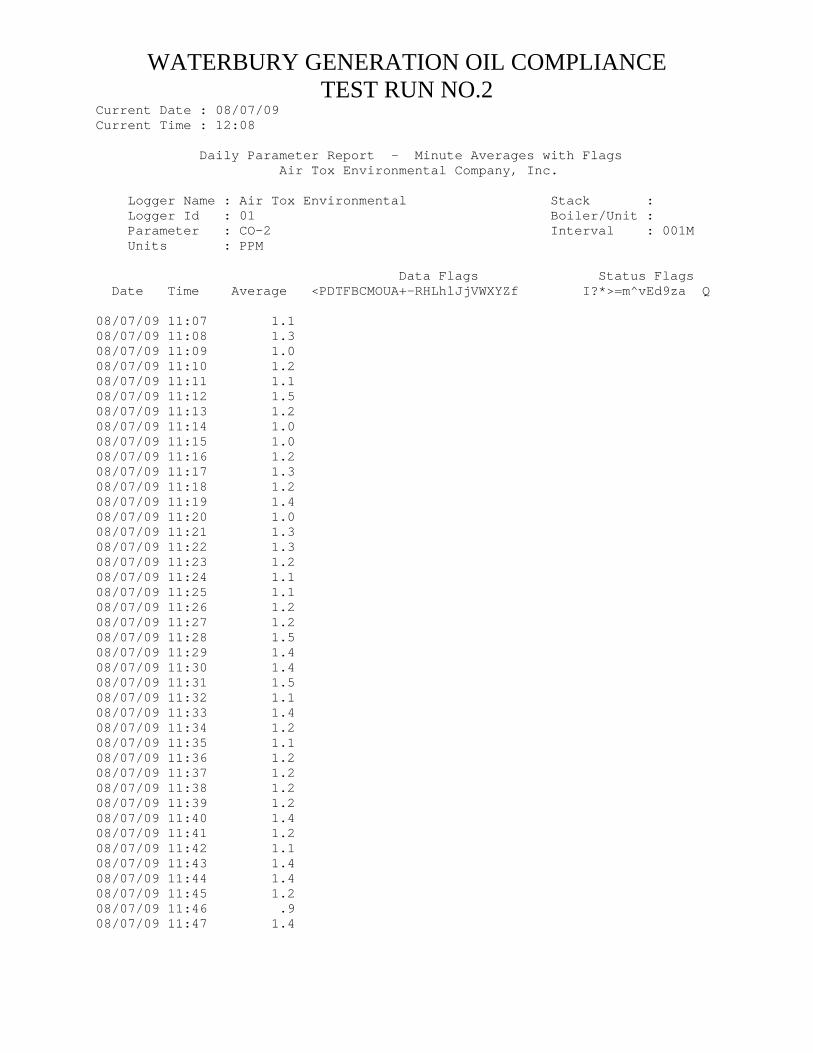
WATERBURY GENERATION OIL COMPLIANCE TEST RUN NO.2
Current Date : 08/07/09 Current Time : 12:08 Daily Parameter Report - Minute Averages with Flags Air Tox Environmental Company, Inc. Logger Name : Air Tox Environmental Stack : Logger Id : 01 Boiler/Unit : Parameter : CO-2 Interval : 001M Units : PPM Data Flags Status Flags Date Time Average <PDTFBCMOUA+-RHLhlJjVWXYZf I?*>=m^vEd9za Q 08/07/09 11:07 1.1 08/07/09 11:08 1.3 08/07/09 11:09 1.0 08/07/09 11:10 1.2 08/07/09 11:11 1.1 08/07/09 11:12 1.5 08/07/09 11:13 1.2 08/07/09 11:14 1.0 08/07/09 11:15 1.0 08/07/09 11:16 1.2 08/07/09 11:17 1.3 08/07/09 11:18 1.2 08/07/09 11:19 1.4 08/07/09 11:20 1.0 08/07/09 11:21 1.3 08/07/09 11:22 1.3 08/07/09 11:23 1.2 08/07/09 11:24 1.1 08/07/09 11:25 1.1 08/07/09 11:26 1.2 08/07/09 11:27 1.2 08/07/09 11:28 1.5 08/07/09 11:29 1.4 08/07/09 11:30 1.4 08/07/09 11:31 1.5 08/07/09 11:32 1.1 08/07/09 11:33 1.4 08/07/09 11:34 1.2 08/07/09 11:35 1.1 08/07/09 11:36 1.2 08/07/09 11:37 1.2 08/07/09 11:38 1.2 08/07/09 11:39 1.2 08/07/09 11:40 1.4 08/07/09 11:41 1.2 08/07/09 11:42 1.1 08/07/09 11:43 1.4 08/07/09 11:44 1.4 08/07/09 11:45 1.2 08/07/09 11:46 .9 08/07/09 11:47 1.4

WATERBURY GENERATION OIL COMPLIANCE TEST RUN NO.2
08/07/09 11:48 1.1 08/07/09 11:49 1.2 08/07/09 11:50 1.2 08/07/09 11:51 1.3 08/07/09 11:52 1.3 08/07/09 11:53 1.2 08/07/09 11:54 1.2 08/07/09 11:55 1.3 08/07/09 11:56 1.2 08/07/09 11:57 1.1 08/07/09 11:58 1.3 08/07/09 11:59 1.3 08/07/09 12:00 1.0 08/07/09 12:01 1.0 08/07/09 12:02 1.2 08/07/09 12:03 1.3 08/07/09 12:04 1.0 08/07/09 12:05 1.5 08/07/09 12:06 1.2 Max 1.5 Min .9 Mean 1.2 Records 60 Status : '<' - Less than ##% Data, 'P' - Power Fail, 'D' - Disabled, 'T' - Out-of-Control, 'F' - Boiler Off-Line, Flags : 'B' - Bad Status, 'C' - Calibration, 'M' - Maintenance, 'O' - Analog Overrange, 'U' - Analog Underrange, 'A' - Arithmetic Error, '+' - Maximum, '-' - Minimum, 'R' - Rate of Change, 'H' - High-High Alarm, 'L' - Low-Low Alarm, 'h' - High Alarm, 'l' - Low Alarm, 'J' - High Rate of Change, 'j' - Low Rate of Change, 'V' - DIS #1 Obs, 'W' - DIS #2 Obs, 'X' - DIS #3 Obs, 'Y' - DIS #4 Obs, 'Z' - DIS #5 Obs.

WATERBURY GENERATION OIL COMPLIANCE TEST RUN NO.3
Current Date : 08/07/09 Current Time : 13:15 Daily Parameter Report - Minute Averages with Flags Air Tox Environmental Company, Inc. Logger Name : Air Tox Environmental Stack : Logger Id : 01 Boiler/Unit : Parameter : VOC600 Interval : 001M Units : PPM Data Flags Status Flags Date Time Average <PDTFBCMOUA+-RHLhlJjVWXYZf I?*>=m^vEd9za Q 08/07/09 12:15 -1.2 08/07/09 12:16 -1.4 08/07/09 12:17 -1.2 08/07/09 12:18 -.8 08/07/09 12:19 -.7 08/07/09 12:20 -.7 08/07/09 12:21 -.9 08/07/09 12:22 -.9 08/07/09 12:23 -.8 08/07/09 12:24 -.5 08/07/09 12:25 -.5 08/07/09 12:26 -.5 08/07/09 12:27 -.3 08/07/09 12:28 -.3 08/07/09 12:29 -.5 08/07/09 12:30 -.3 08/07/09 12:31 .2 08/07/09 12:32 .5 08/07/09 12:33 .6 08/07/09 12:34 .4 08/07/09 12:35 .4 08/07/09 12:36 .2 08/07/09 12:37 -.2 08/07/09 12:38 -.5 08/07/09 12:39 -1.1 08/07/09 12:40 -1.3 08/07/09 12:41 -1.2 08/07/09 12:42 -1.1 08/07/09 12:43 -1.1 08/07/09 12:44 -1.4 08/07/09 12:45 -1.7 08/07/09 12:46 -1.9 08/07/09 12:47 -2.1 08/07/09 12:48 -2.0 08/07/09 12:49 -1.8 08/07/09 12:50 -1.5 08/07/09 12:51 -1.4 08/07/09 12:52 -1.0 08/07/09 12:53 -.9 08/07/09 12:54 -1.0 08/07/09 12:55 -1.3

WATERBURY GENERATION OIL COMPLIANCE TEST RUN NO.3
08/07/09 12:56 -1.5 08/07/09 12:57 -1.7 08/07/09 12:58 -1.7 08/07/09 12:59 -1.8 08/07/09 13:00 -2.0 08/07/09 13:01 -2.0 08/07/09 13:02 -1.9 08/07/09 13:03 -1.9 08/07/09 13:04 -1.9 08/07/09 13:05 -1.9 08/07/09 13:06 -1.8 08/07/09 13:07 -1.9 08/07/09 13:08 -1.9 08/07/09 13:09 -2.0 08/07/09 13:10 -2.1 08/07/09 13:11 -2.4 08/07/09 13:12 -2.3 08/07/09 13:13 -2.1 08/07/09 13:14 -1.5 Max .6 Min -2.4 Mean -1.2 Records 60 Status : '<' - Less than ##% Data, 'P' - Power Fail, 'D' - Disabled, 'T' - Out-of-Control, 'F' - Boiler Off-Line, Flags : 'B' - Bad Status, 'C' - Calibration, 'M' - Maintenance, 'O' - Analog Overrange, 'U' - Analog Underrange, 'A' - Arithmetic Error, '+' - Maximum, '-' - Minimum, 'R' - Rate of Change, 'H' - High-High Alarm, 'L' - Low-Low Alarm, 'h' - High Alarm, 'l' - Low Alarm, 'J' - High Rate of Change, 'j' - Low Rate of Change, 'V' - DIS #1 Obs, 'W' - DIS #2 Obs, 'X' - DIS #3 Obs, 'Y' - DIS #4 Obs, 'Z' - DIS #5 Obs.

WATERBURY GENERATION OIL COMPLIANCE TEST RUN NO.3
Current Date : 08/07/09 Current Time : 13:15 Daily Parameter Report - Minute Averages with Flags Air Tox Environmental Company, Inc. Logger Name : Air Tox Environmental Stack : Logger Id : 01 Boiler/Unit : Parameter : NOX Interval : 001M Units : PPM Data Flags Status Flags Date Time Average <PDTFBCMOUA+-RHLhlJjVWXYZf I?*>=m^vEd9za Q 08/07/09 12:15 6.8 08/07/09 12:16 7.0 08/07/09 12:17 6.9 08/07/09 12:18 6.7 08/07/09 12:19 7.1 08/07/09 12:20 7.1 08/07/09 12:21 6.9 08/07/09 12:22 6.8 08/07/09 12:23 7.1 08/07/09 12:24 6.8 08/07/09 12:25 6.8 08/07/09 12:26 6.9 08/07/09 12:27 7.2 08/07/09 12:28 7.1 08/07/09 12:29 7.3 08/07/09 12:30 7.0 08/07/09 12:31 7.3 08/07/09 12:32 7.2 08/07/09 12:33 6.9 08/07/09 12:34 6.7 08/07/09 12:35 6.9 08/07/09 12:36 6.9 08/07/09 12:37 7.1 08/07/09 12:38 6.9 08/07/09 12:39 6.8 08/07/09 12:40 7.0 08/07/09 12:41 7.2 08/07/09 12:42 7.1 08/07/09 12:43 7.2 08/07/09 12:44 7.0 08/07/09 12:45 7.3 08/07/09 12:46 7.0 08/07/09 12:47 6.9 08/07/09 12:48 7.2 08/07/09 12:49 7.3 08/07/09 12:50 7.3 08/07/09 12:51 7.0 08/07/09 12:52 7.1 08/07/09 12:53 7.0 08/07/09 12:54 7.1 08/07/09 12:55 6.9

WATERBURY GENERATION OIL COMPLIANCE TEST RUN NO.3
08/07/09 12:56 6.7 08/07/09 12:57 7.3 08/07/09 12:58 7.3 08/07/09 12:59 7.1 08/07/09 13:00 6.9 08/07/09 13:01 6.8 08/07/09 13:02 6.7 08/07/09 13:03 6.5 08/07/09 13:04 7.0 08/07/09 13:05 7.0 08/07/09 13:06 7.2 08/07/09 13:07 7.2 08/07/09 13:08 7.1 08/07/09 13:09 7.2 08/07/09 13:10 7.1 08/07/09 13:11 7.0 08/07/09 13:12 6.9 08/07/09 13:13 7.2 08/07/09 13:14 7.2 Max 7.3 Min 6.5 Mean 7.0 Records 60 Status : '<' - Less than ##% Data, 'P' - Power Fail, 'D' - Disabled, 'T' - Out-of-Control, 'F' - Boiler Off-Line, Flags : 'B' - Bad Status, 'C' - Calibration, 'M' - Maintenance, 'O' - Analog Overrange, 'U' - Analog Underrange, 'A' - Arithmetic Error, '+' - Maximum, '-' - Minimum, 'R' - Rate of Change, 'H' - High-High Alarm, 'L' - Low-Low Alarm, 'h' - High Alarm, 'l' - Low Alarm, 'J' - High Rate of Change, 'j' - Low Rate of Change, 'V' - DIS #1 Obs, 'W' - DIS #2 Obs, 'X' - DIS #3 Obs, 'Y' - DIS #4 Obs, 'Z' - DIS #5 Obs.

WATERBURY GENERATION OIL COMPLIANCE TEST RUN NO.3
Current Date : 08/07/09 Current Time : 13:15 Daily Parameter Report - Minute Averages with Flags Air Tox Environmental Company, Inc. Logger Name : Air Tox Environmental Stack : Logger Id : 01 Boiler/Unit : Parameter : O2-2 Interval : 001M Units : % Data Flags Status Flags Date Time Average <PDTFBCMOUA+-RHLhlJjVWXYZf I?*>=m^vEd9za Q 08/07/09 12:15 12.9 08/07/09 12:16 12.9 08/07/09 12:17 13.0 08/07/09 12:18 12.9 08/07/09 12:19 12.9 08/07/09 12:20 12.9 08/07/09 12:21 12.9 08/07/09 12:22 12.9 08/07/09 12:23 12.9 08/07/09 12:24 12.9 08/07/09 12:25 12.9 08/07/09 12:26 12.9 08/07/09 12:27 12.9 08/07/09 12:28 12.9 08/07/09 12:29 12.9 08/07/09 12:30 12.9 08/07/09 12:31 12.9 08/07/09 12:32 12.9 08/07/09 12:33 12.9 08/07/09 12:34 13.0 08/07/09 12:35 13.0 08/07/09 12:36 13.0 08/07/09 12:37 12.9 08/07/09 12:38 13.0 08/07/09 12:39 12.9 08/07/09 12:40 13.0 08/07/09 12:41 12.9 08/07/09 12:42 12.9 08/07/09 12:43 12.9 08/07/09 12:44 13.0 08/07/09 12:45 13.0 08/07/09 12:46 13.0 08/07/09 12:47 12.9 08/07/09 12:48 13.0 08/07/09 12:49 13.0 08/07/09 12:50 13.0 08/07/09 12:51 13.0 08/07/09 12:52 12.9 08/07/09 12:53 12.9 08/07/09 12:54 13.0 08/07/09 12:55 13.0

WATERBURY GENERATION OIL COMPLIANCE TEST RUN NO.3
08/07/09 12:56 13.0 08/07/09 12:57 13.0 08/07/09 12:58 13.0 08/07/09 12:59 13.0 08/07/09 13:00 13.0 08/07/09 13:01 13.0 08/07/09 13:02 13.0 08/07/09 13:03 13.0 08/07/09 13:04 13.0 08/07/09 13:05 13.0 08/07/09 13:06 13.0 08/07/09 13:07 13.0 08/07/09 13:08 13.0 08/07/09 13:09 13.0 08/07/09 13:10 13.0 08/07/09 13:11 13.0 08/07/09 13:12 13.0 08/07/09 13:13 13.0 08/07/09 13:14 13.0 Max 13.0 Min 12.9 Mean 13.0 Records 60 Status : '<' - Less than ##% Data, 'P' - Power Fail, 'D' - Disabled, 'T' - Out-of-Control, 'F' - Boiler Off-Line, Flags : 'B' - Bad Status, 'C' - Calibration, 'M' - Maintenance, 'O' - Analog Overrange, 'U' - Analog Underrange, 'A' - Arithmetic Error, '+' - Maximum, '-' - Minimum, 'R' - Rate of Change, 'H' - High-High Alarm, 'L' - Low-Low Alarm, 'h' - High Alarm, 'l' - Low Alarm, 'J' - High Rate of Change, 'j' - Low Rate of Change, 'V' - DIS #1 Obs, 'W' - DIS #2 Obs, 'X' - DIS #3 Obs, 'Y' - DIS #4 Obs, 'Z' - DIS #5 Obs.

WATERBURY GENERATION OIL COMPLIANCE TEST RUN NO.3
Current Date : 08/07/09 Current Time : 13:15 Daily Parameter Report - Minute Averages with Flags Air Tox Environmental Company, Inc. Logger Name : Air Tox Environmental Stack : Logger Id : 01 Boiler/Unit : Parameter : CO2-2 Interval : 001M Units : % Data Flags Status Flags Date Time Average <PDTFBCMOUA+-RHLhlJjVWXYZf I?*>=m^vEd9za Q 08/07/09 12:15 5.9 08/07/09 12:16 5.9 08/07/09 12:17 5.9 08/07/09 12:18 6.0 08/07/09 12:19 5.9 08/07/09 12:20 5.9 08/07/09 12:21 5.9 08/07/09 12:22 6.0 08/07/09 12:23 5.9 08/07/09 12:24 5.9 08/07/09 12:25 5.9 08/07/09 12:26 6.0 08/07/09 12:27 5.9 08/07/09 12:28 5.9 08/07/09 12:29 5.9 08/07/09 12:30 5.9 08/07/09 12:31 5.9 08/07/09 12:32 5.9 08/07/09 12:33 5.9 08/07/09 12:34 5.9 08/07/09 12:35 5.9 08/07/09 12:36 5.9 08/07/09 12:37 5.9 08/07/09 12:38 5.9 08/07/09 12:39 5.9 08/07/09 12:40 5.9 08/07/09 12:41 5.9 08/07/09 12:42 6.0 08/07/09 12:43 5.9 08/07/09 12:44 5.9 08/07/09 12:45 5.9 08/07/09 12:46 5.9 08/07/09 12:47 5.9 08/07/09 12:48 5.9 08/07/09 12:49 6.0 08/07/09 12:50 5.9 08/07/09 12:51 5.9 08/07/09 12:52 5.9 08/07/09 12:53 5.9 08/07/09 12:54 5.9 08/07/09 12:55 5.9

WATERBURY GENERATION OIL COMPLIANCE TEST RUN NO.3
08/07/09 12:56 5.9 08/07/09 12:57 5.9 08/07/09 12:58 5.9 08/07/09 12:59 5.9 08/07/09 13:00 5.9 08/07/09 13:01 5.9 08/07/09 13:02 5.9 08/07/09 13:03 5.9 08/07/09 13:04 5.9 08/07/09 13:05 5.9 08/07/09 13:06 5.9 08/07/09 13:07 6.0 08/07/09 13:08 5.9 08/07/09 13:09 5.9 08/07/09 13:10 5.9 08/07/09 13:11 5.9 08/07/09 13:12 5.9 08/07/09 13:13 5.9 08/07/09 13:14 5.9 Max 6.0 Min 5.9 Mean 5.9 Records 60 Status : '<' - Less than ##% Data, 'P' - Power Fail, 'D' - Disabled, 'T' - Out-of-Control, 'F' - Boiler Off-Line, Flags : 'B' - Bad Status, 'C' - Calibration, 'M' - Maintenance, 'O' - Analog Overrange, 'U' - Analog Underrange, 'A' - Arithmetic Error, '+' - Maximum, '-' - Minimum, 'R' - Rate of Change, 'H' - High-High Alarm, 'L' - Low-Low Alarm, 'h' - High Alarm, 'l' - Low Alarm, 'J' - High Rate of Change, 'j' - Low Rate of Change, 'V' - DIS #1 Obs, 'W' - DIS #2 Obs, 'X' - DIS #3 Obs, 'Y' - DIS #4 Obs, 'Z' - DIS #5 Obs.

WATERBURY GENERATION OIL COMPLIANCE TEST RUN NO.3
Current Date : 08/07/09 Current Time : 13:15 Daily Parameter Report - Minute Averages with Flags Air Tox Environmental Company, Inc. Logger Name : Air Tox Environmental Stack : Logger Id : 01 Boiler/Unit : Parameter : CO-2 Interval : 001M Units : PPM Data Flags Status Flags Date Time Average <PDTFBCMOUA+-RHLhlJjVWXYZf I?*>=m^vEd9za Q 08/07/09 12:15 1.5 08/07/09 12:16 1.4 08/07/09 12:17 1.4 08/07/09 12:18 1.4 08/07/09 12:19 1.1 08/07/09 12:20 1.1 08/07/09 12:21 1.1 08/07/09 12:22 1.3 08/07/09 12:23 1.3 08/07/09 12:24 1.3 08/07/09 12:25 1.2 08/07/09 12:26 1.3 08/07/09 12:27 1.3 08/07/09 12:28 1.4 08/07/09 12:29 1.2 08/07/09 12:30 1.4 08/07/09 12:31 1.4 08/07/09 12:32 1.5 08/07/09 12:33 1.4 08/07/09 12:34 1.4 08/07/09 12:35 1.3 08/07/09 12:36 1.4 08/07/09 12:37 1.2 08/07/09 12:38 1.2 08/07/09 12:39 1.2 08/07/09 12:40 1.2 08/07/09 12:41 1.4 08/07/09 12:42 1.2 08/07/09 12:43 1.2 08/07/09 12:44 1.4 08/07/09 12:45 1.2 08/07/09 12:46 1.3 08/07/09 12:47 1.6 08/07/09 12:48 1.3 08/07/09 12:49 1.3 08/07/09 12:50 1.4 08/07/09 12:51 1.4 08/07/09 12:52 1.4 08/07/09 12:53 1.2 08/07/09 12:54 1.4 08/07/09 12:55 1.4

WATERBURY GENERATION OIL COMPLIANCE TEST RUN NO.3
08/07/09 12:56 1.5 08/07/09 12:57 1.3 08/07/09 12:58 1.4 08/07/09 12:59 1.2 08/07/09 13:00 1.3 08/07/09 13:01 1.0 08/07/09 13:02 1.2 08/07/09 13:03 1.2 08/07/09 13:04 1.3 08/07/09 13:05 1.3 08/07/09 13:06 1.2 08/07/09 13:07 1.2 08/07/09 13:08 1.4 08/07/09 13:09 1.3 08/07/09 13:10 1.2 08/07/09 13:11 1.4 08/07/09 13:12 1.3 08/07/09 13:13 1.4 08/07/09 13:14 1.0 Max 1.6 Min 1.0 Mean 1.3 Records 60 Status : '<' - Less than ##% Data, 'P' - Power Fail, 'D' - Disabled, 'T' - Out-of-Control, 'F' - Boiler Off-Line, Flags : 'B' - Bad Status, 'C' - Calibration, 'M' - Maintenance, 'O' - Analog Overrange, 'U' - Analog Underrange, 'A' - Arithmetic Error, '+' - Maximum, '-' - Minimum, 'R' - Rate of Change, 'H' - High-High Alarm, 'L' - Low-Low Alarm, 'h' - High Alarm, 'l' - Low Alarm, 'J' - High Rate of Change, 'j' - Low Rate of Change, 'V' - DIS #1 Obs, 'W' - DIS #2 Obs, 'X' - DIS #3 Obs, 'Y' - DIS #4 Obs, 'Z' - DIS #5 Obs.

APPENDIX C
Analytical Laboratory Results
APPENDIX C.1 Particulate Matter Testing
Analytical Laboratory Results
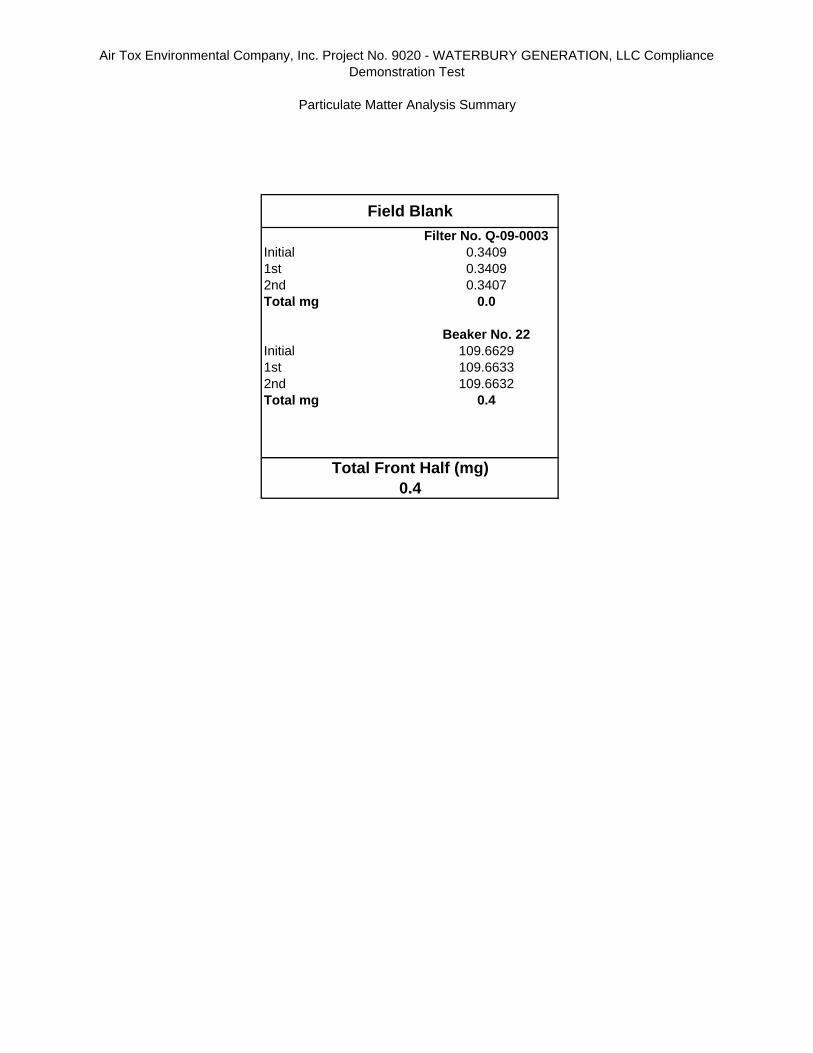
Air Tox Environmental Company, Inc. Project No. 9020 - WATERBURY GENERATION, LLC Compliance Demonstration Test
Particulate Matter Analysis Summary
Filter No. Q-09-0003Initial 0.34091st 0.34092nd 0.3407Total mg 0.0
Beaker No. 22Initial 109.66291st 109.66332nd 109.6632Total mg 0.4
Field Blank
Total Front Half (mg)0.4

Air Tox Environmental Company, Inc. Project No. 9020 - WATERBURY GENERATION, LLC Compliance Demonstration Test
Particulate Matter Analysis Summary
Filter No. Q-06-00096Initial 0.46531st 0.46972nd 0.4697Total mg 4.5
Beaker No. 24Initial 102.08771st 102.08972nd 102.0897Total mg 2.0
Filter No. Q-06-00097Initial 0.46251st 0.46692nd 0.4668Total mg 4.3
Beaker No. 26Initial 104.68971st 104.69062nd 104.6911Total mg 1.4
Filter No. Q-06-00098Initial 0.46281st 0.46712nd 0.4671Total mg 4.4
Beaker No. 3Initial 110.19501st 110.19632nd 110.1960Total mg 1.3
5.2
Total Front Half (mg)5.3
Test #3 8/8/2009
Total Front Half (mg)
Test #1 8/8/2009
Total Front Half (mg)6.1
Test #2 8/8/2009
APPENDIX C.2 Sulfuric Acid Testing
Analytical Laboratory Results
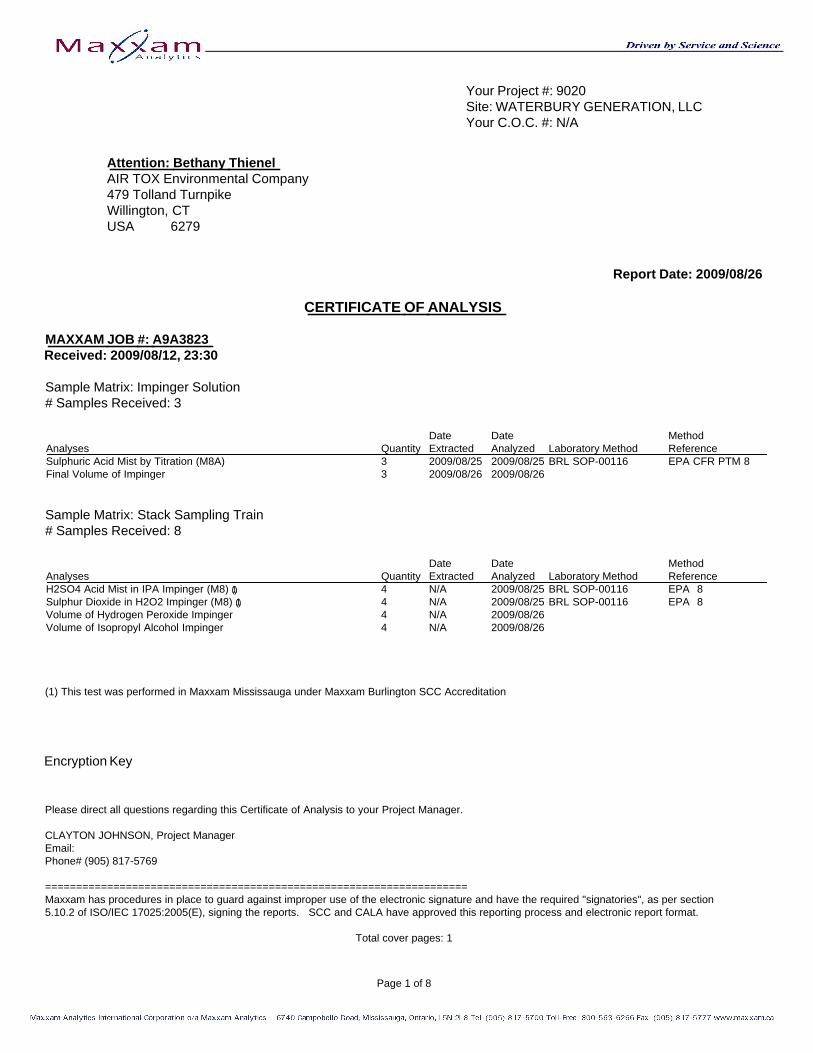
Your Project #: 9020 Site: WATERBURY GENERATION, LLC Your C.O.C. #: N/A
Attention: Bethany ThienelAIR TOX Environmental Company479 Tolland TurnpikeWillington, CTUSA 6279
Report Date: 2009/08/26
CERTIFICATE OF ANALYSIS
MAXXAM JOB #: A9A3823Received: 2009/08/12, 23:30
Sample Matrix: Impinger Solution# Samples Received: 3
Date Date MethodAnalyses Quantity Extracted Analyzed Laboratory Method ReferenceSulphuric Acid Mist by Titration (M8A) 3 2009/08/25 2009/08/25 BRL SOP-00116 EPA CFR PTM 8 Final Volume of Impinger 3 2009/08/26 2009/08/26
Sample Matrix: Stack Sampling Train# Samples Received: 8
Date Date MethodAnalyses Quantity Extracted Analyzed Laboratory Method ReferenceH2SO4 Acid Mist in IPA Impinger (M8) ( 1 ) 4 N/A 2009/08/25 BRL SOP-00116 EPA 8 Sulphur Dioxide in H2O2 Impinger (M8) ( 1 ) 4 N/A 2009/08/25 BRL SOP-00116 EPA 8 Volume of Hydrogen Peroxide Impinger 4 N/A 2009/08/26 Volume of Isopropyl Alcohol Impinger 4 N/A 2009/08/26
(1) This test was performed in Maxxam Mississauga under Maxxam Burlington SCC Accreditation
Encryption Key
Please direct all questions regarding this Certificate of Analysis to your Project Manager.
CLAYTON JOHNSON, Project ManagerEmail:Phone# (905) 817-5769
====================================================================Maxxam has procedures in place to guard against improper use of the electronic signature and have the required "signatories", as per section5.10.2 of ISO/IEC 17025:2005(E), signing the reports. SCC and CALA have approved this reporting process and electronic report format.
Total cover pages: 1
Page 1 of 8
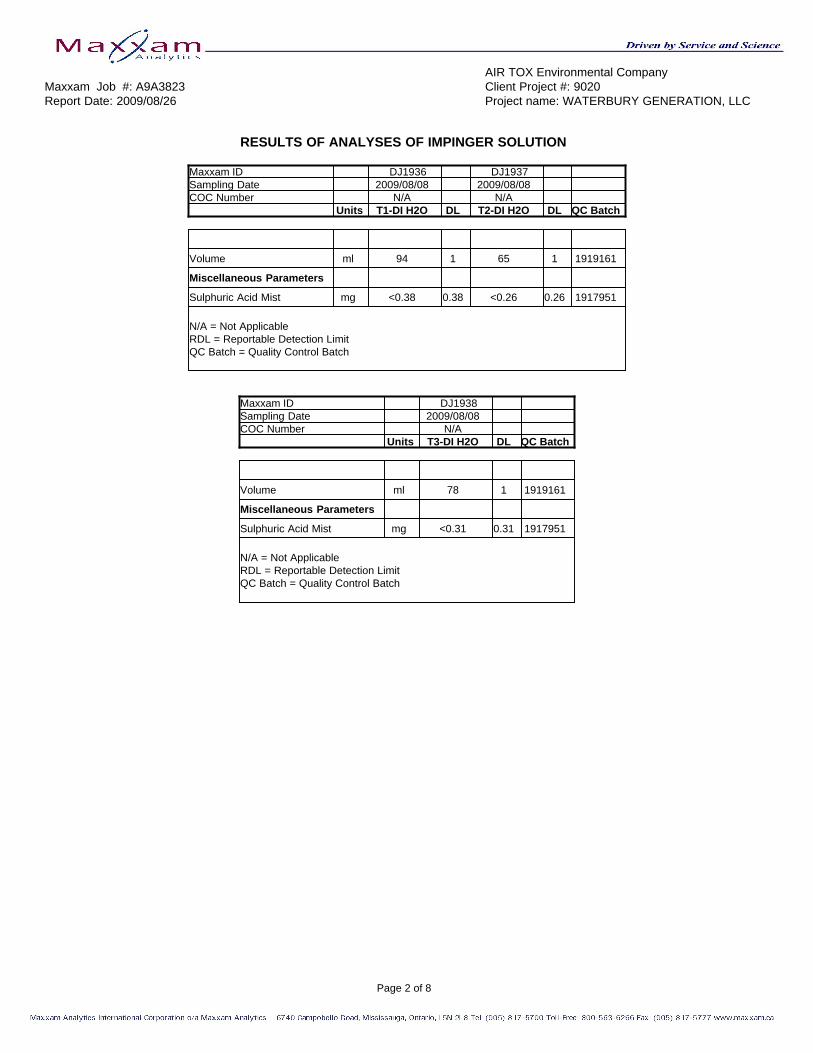
AIR TOX Environmental CompanyMaxxam Job #: A9A3823 Client Project #: 9020Report Date: 2009/08/26 Project name: WATERBURY GENERATION, LLC
RESULTS OF ANALYSES OF IMPINGER SOLUTION
Maxxam ID D J 1 9 3 6 D J 1 9 3 7Sampling Date 2009/08/08 2009/08/08COC Number N/A N/A U n i t s T1-DI H2O DL T2-DI H2O DL QC Batch
Volume ml 94 1 65 1 1919161
Miscellaneous Parameters
Sulphuric Acid Mist mg <0.38 0.38 <0.26 0.26 1917951
N/A = Not ApplicableRDL = Reportable Detection LimitQC Batch = Quality Control Batch
Maxxam ID D J 1 9 3 8Sampling Date 2009/08/08COC Number N/A U n i t s T3-DI H2O DL QC Batch
Volume ml 78 1 1919161
Miscellaneous Parameters
Sulphuric Acid Mist mg <0.31 0.31 1917951
N/A = Not ApplicableRDL = Reportable Detection LimitQC Batch = Quality Control Batch
Page 2 of 8
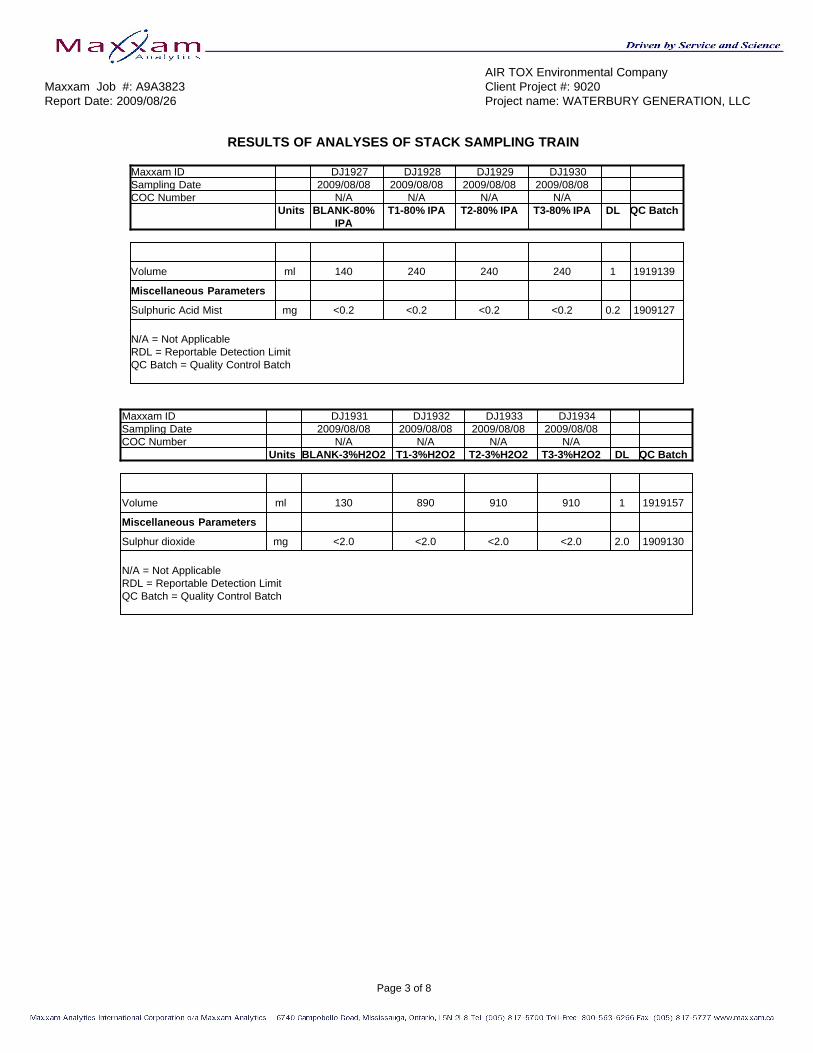
AIR TOX Environmental CompanyMaxxam Job #: A9A3823 Client Project #: 9020Report Date: 2009/08/26 Project name: WATERBURY GENERATION, LLC
RESULTS OF ANALYSES OF STACK SAMPLING TRAIN
Maxxam ID D J 1 9 2 7 D J 1 9 2 8 D J 1 9 2 9 D J 1 9 3 0Sampling Date 2009/08/08 2009/08/08 2009/08/08 2009/08/08COC Number N/A N/A N/A N/A U n i t s BLANK-80% T1-80% IPA T2-80% IPA T3-80% IPA DL QC Batch
IPA
Volume ml 140 240 240 240 1 1919139
Miscellaneous Parameters
Sulphuric Acid Mist mg <0.2 <0.2 <0.2 <0.2 0.2 1909127
N/A = Not ApplicableRDL = Reportable Detection LimitQC Batch = Quality Control Batch
Maxxam ID D J 1 9 3 1 D J 1 9 3 2 D J 1 9 3 3 D J 1 9 3 4Sampling Date 2009/08/08 2009/08/08 2009/08/08 2009/08/08COC Number N/A N/A N/A N/A U n i t s BLANK-3%H2O2 T1-3%H2O2 T2-3%H2O2 T3-3%H2O2 DL QC Batch
Volume ml 130 890 910 910 1 1919157
Miscellaneous Parameters
Sulphur dioxide mg <2.0 <2.0 <2.0 <2.0 2.0 1909130
N/A = Not ApplicableRDL = Reportable Detection LimitQC Batch = Quality Control Batch
Page 3 of 8

AIR TOX Environmental CompanyMaxxam Job #: A9A3823 Client Project #: 9020Report Date: 2009/08/26 Project name: WATERBURY GENERATION, LLC
Test Summary
Maxxam ID DJ1927 Collected 2009/08/08Sample ID BLANK-80% IPA Shipped
Matrix Stack Sampling Train Received 2009/08/12
Test Description Instrumentation Batch Extracted Analyzed AnalystH2SO4 Acid Mist in IPA Impinger (M8) 1909127 N/A 2009/08/25 LLEVolume of Isopropyl Alcohol Impinger 1919139 N/A 2009/08/26 LLE
Maxxam ID DJ1928 Collected 2009/08/08Sample ID T1-80% IPA Shipped
Matrix Stack Sampling Train Received 2009/08/12
Test Description Instrumentation Batch Extracted Analyzed AnalystH2SO4 Acid Mist in IPA Impinger (M8) 1909127 N/A 2009/08/25 LLEVolume of Isopropyl Alcohol Impinger 1919139 N/A 2009/08/26 LLE
Maxxam ID DJ1928 D u p Collected 2009/08/08Sample ID T1-80% IPA Shipped
Matrix Stack Sampling Train Received 2009/08/12
Test Description Instrumentation Batch Extracted Analyzed AnalystH2SO4 Acid Mist in IPA Impinger (M8) 1909127 N/A 2009/08/25 LLE
Maxxam ID DJ1929 Collected 2009/08/08Sample ID T2-80% IPA Shipped
Matrix Stack Sampling Train Received 2009/08/12
Test Description Instrumentation Batch Extracted Analyzed AnalystH2SO4 Acid Mist in IPA Impinger (M8) 1909127 N/A 2009/08/25 LLEVolume of Isopropyl Alcohol Impinger 1919139 N/A 2009/08/26 LLE
Maxxam ID DJ1930 Collected 2009/08/08Sample ID T3-80% IPA Shipped
Matrix Stack Sampling Train Received 2009/08/12
Test Description Instrumentation Batch Extracted Analyzed AnalystH2SO4 Acid Mist in IPA Impinger (M8) 1909127 N/A 2009/08/25 LLEVolume of Isopropyl Alcohol Impinger 1919139 N/A 2009/08/26 LLE
Maxxam ID DJ1931 Collected 2009/08/08Sample ID BLANK-3%H2O2 Shipped
Matrix Stack Sampling Train Received 2009/08/12
Test Description Instrumentation Batch Extracted Analyzed AnalystSulphur Dioxide in H2O2 Impinger (M8) 1909130 N/A 2009/08/25 LLEVolume of Hydrogen Peroxide Impinger 1919157 N/A 2009/08/26 FMO
Page 4 of 8

AIR TOX Environmental CompanyMaxxam Job #: A9A3823 Client Project #: 9020Report Date: 2009/08/26 Project name: WATERBURY GENERATION, LLC
Test Summary
Maxxam ID DJ1932 Collected 2009/08/08Sample ID T1-3%H2O2 Shipped
Matrix Stack Sampling Train Received 2009/08/12
Test Description Instrumentation Batch Extracted Analyzed AnalystSulphur Dioxide in H2O2 Impinger (M8) 1909130 N/A 2009/08/25 LLEVolume of Hydrogen Peroxide Impinger 1919157 N/A 2009/08/26 FMO
Maxxam ID DJ1932 D u p Collected 2009/08/08Sample ID T1-3%H2O2 Shipped
Matrix Stack Sampling Train Received 2009/08/12
Test Description Instrumentation Batch Extracted Analyzed AnalystSulphur Dioxide in H2O2 Impinger (M8) 1909130 N/A 2009/08/25 LLE
Maxxam ID DJ1933 Collected 2009/08/08Sample ID T2-3%H2O2 Shipped
Matrix Stack Sampling Train Received 2009/08/12
Test Description Instrumentation Batch Extracted Analyzed AnalystSulphur Dioxide in H2O2 Impinger (M8) 1909130 N/A 2009/08/25 LLEVolume of Hydrogen Peroxide Impinger 1919157 N/A 2009/08/26 FMO
Maxxam ID DJ1934 Collected 2009/08/08Sample ID T3-3%H2O2 Shipped
Matrix Stack Sampling Train Received 2009/08/12
Test Description Instrumentation Batch Extracted Analyzed AnalystSulphur Dioxide in H2O2 Impinger (M8) 1909130 N/A 2009/08/25 LLEVolume of Hydrogen Peroxide Impinger 1919157 N/A 2009/08/26 FMO
Maxxam ID DJ1936 Collected 2009/08/08Sample ID T1-DI H2O Shipped
Matrix Impinger Solution Received 2009/08/12
Test Description Instrumentation Batch Extracted Analyzed AnalystSulphuric Acid Mist by Titration (M8A) 1917951 2009/08/25 2009/08/25 LLEFinal Volume of Impinger 1919161 2009/08/26 2009/08/26 LLE
Maxxam ID DJ1937 Collected 2009/08/08Sample ID T2-DI H2O Shipped
Matrix Impinger Solution Received 2009/08/12
Test Description Instrumentation Batch Extracted Analyzed AnalystSulphuric Acid Mist by Titration (M8A) 1917951 2009/08/25 2009/08/25 LLEFinal Volume of Impinger 1919161 2009/08/26 2009/08/26 LLE
Page 5 of 8
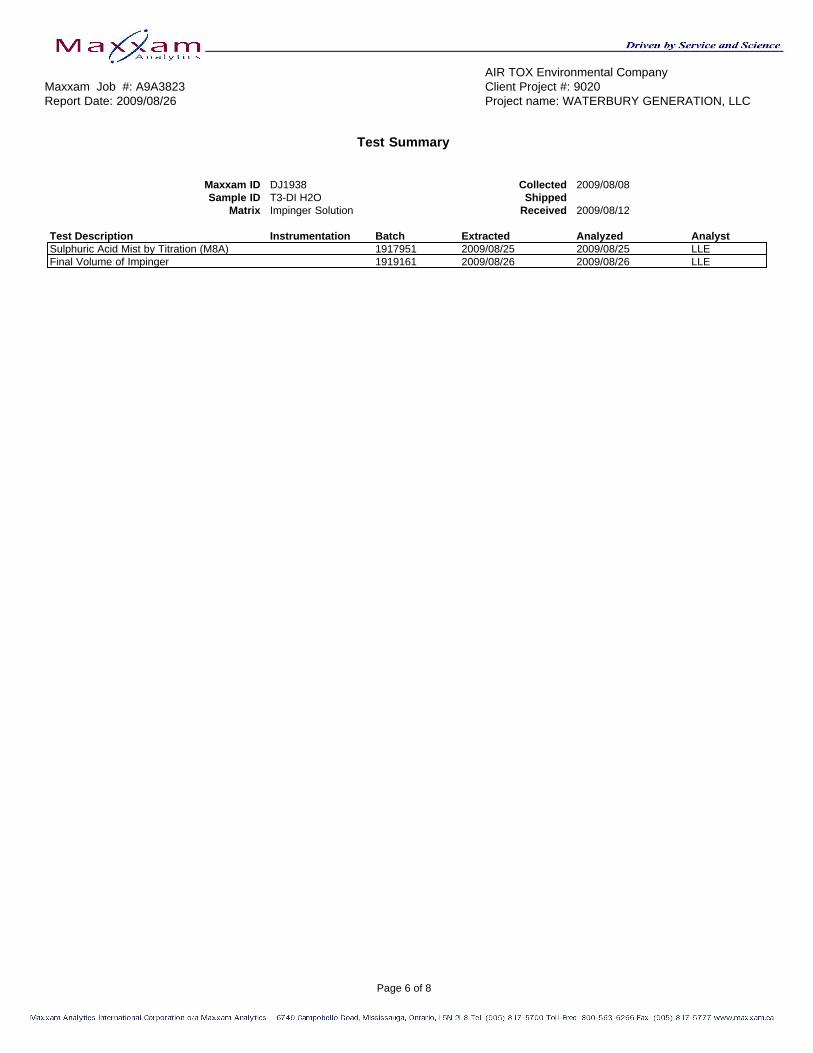
AIR TOX Environmental CompanyMaxxam Job #: A9A3823 Client Project #: 9020Report Date: 2009/08/26 Project name: WATERBURY GENERATION, LLC
Test Summary
Maxxam ID DJ1938 Collected 2009/08/08Sample ID T3-DI H2O Shipped
Matrix Impinger Solution Received 2009/08/12
Test Description Instrumentation Batch Extracted Analyzed AnalystSulphuric Acid Mist by Titration (M8A) 1917951 2009/08/25 2009/08/25 LLEFinal Volume of Impinger 1919161 2009/08/26 2009/08/26 LLE
Page 6 of 8
AIR TOX Environmental CompanyMaxxam Job #: A9A3823 Client Project #: 9020Report Date: 2009/08/26 Project name: WATERBURY GENERATION, LLC
GENERAL COMMENTS
Results relate only to the items tested.
Page 7 of 8

AIR TOX Environmental CompanyAttention: Bethany Thienel Client Project #: 9020P.O. #: Project name: WATERBURY GENERATION, LLC
Quality Assurance ReportMaxxam Job Number: GA9A3823
QA/QC DateBatch AnalyzedNum Init QC Type Parameter yyyy/mm/dd Value %Recovery Units QC Limits
1909127 LLE Matrix Spike(DJ1928) Sulphuric Acid Mist 2009/08/25 107 % 80 - 120Spiked Blank Sulphuric Acid Mist 2009/08/25 100 % 90 - 110Method Blank Sulphuric Acid Mist 2009/08/25 ND, RDL=0.2 mgRPD -Sample/SampleDup Sulphuric Acid Mist 2009/08/25 NC % 20
1909130 LLE Matrix Spike(DJ1932) Sulphur dioxide 2009/08/25 99 % 80 - 120Spiked Blank Sulphur dioxide 2009/08/25 100 % 90 - 110Method Blank Sulphur dioxide 2009/08/25 ND, RDL=2.0 mgRPD -Sample/SampleDup Sulphur dioxide 2009/08/25 NC % 20
1917951 LLE Spiked Blank Sulphuric Acid Mist 2009/08/25 100 % 90 - 110Method Blank Sulphuric Acid Mist 2009/08/25 ND, RDL=0.2 mg
Matrix Spike: A sample to which a known amount of the analyte of interest has been added. Used to evaluate sample matrix interference.Spiked Blank: A blank matrix to which a known amount of the analyte has been added. Used to evaluate analyte recovery.Method Blank: A blank matrix containing all reagents used in the analytical procedure. Used to identify laboratory contamination.NC (RPD): The RPD was not calculated. The level of analyte detected in the parent sample and its duplicate was not sufficiently significant to permit areliable calculation.
Page 8 of 8
APPENDIX C.3 Formaldehyde Testing
Analytical Laboratory Results

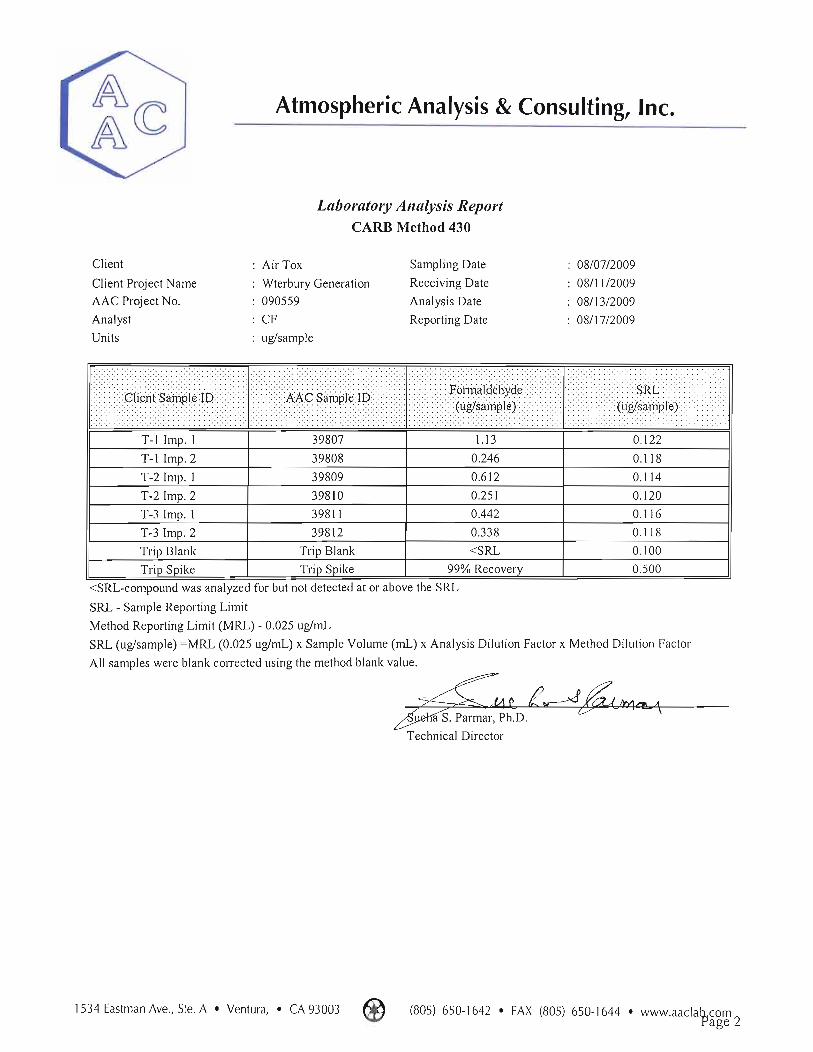
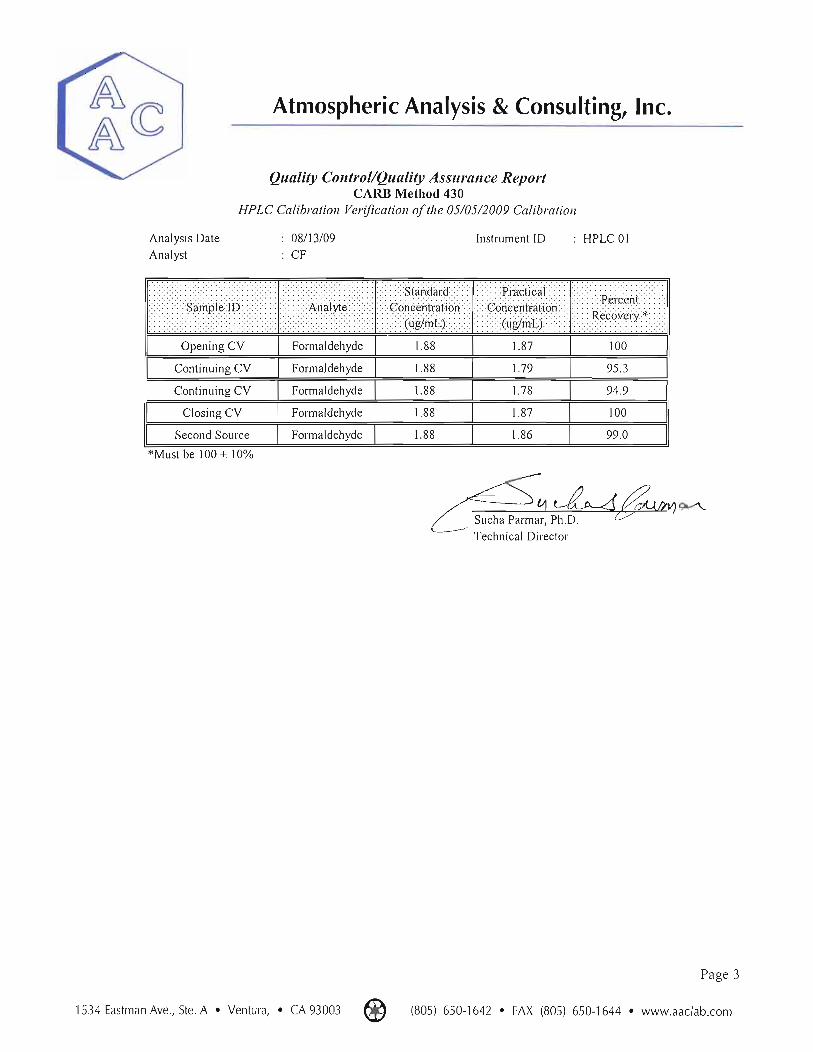


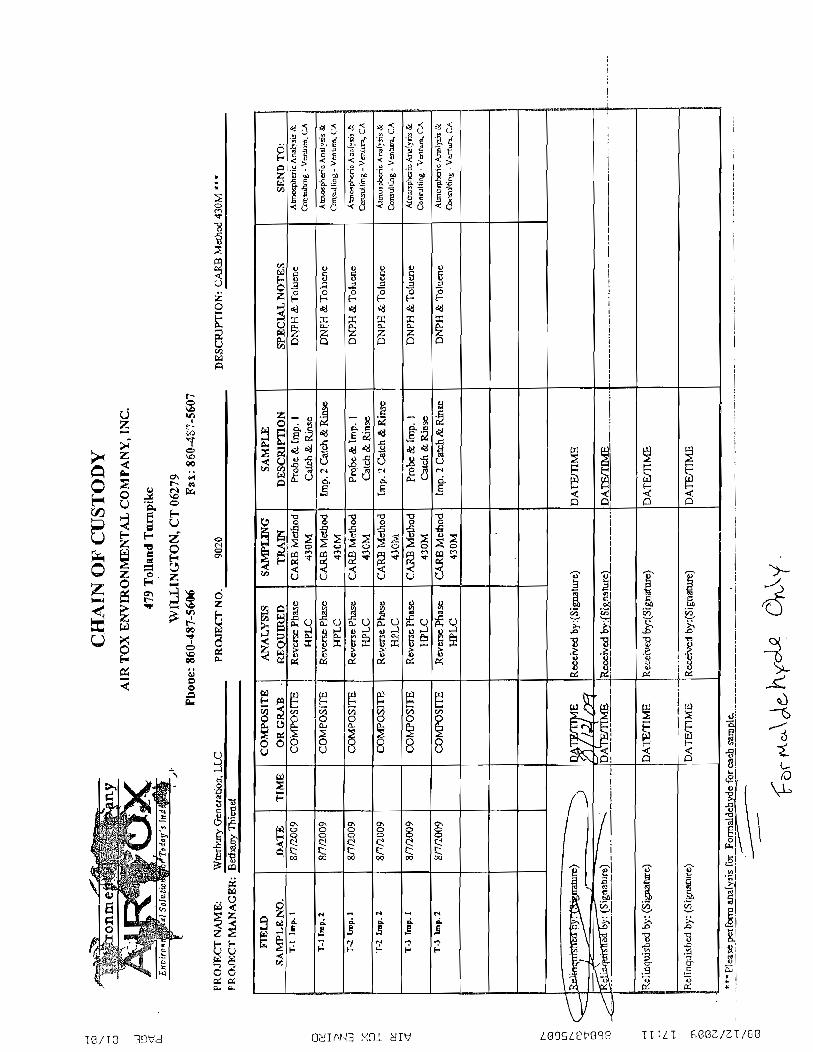
APPENDIX C.4 Benzene and 1,3 Butadiene Testing
Analytical Laboratory Results

Your Project #: 9020 Site: WATERBURY GENERATION, LLC
Attention: Bethany ThienelAIR TOX Environmental Company479 Tolland TurnpikeWillington, CTUSA 6279
Report Date: 2009/09/15
CERTIFICATE OF ANALYSIS
MAXXAM JOB #: A9A3667Received: 2009/08/13, 23:30
Sample Matrix: AIR# Samples Received: 7
Date Date MethodAnalyses Quantity Extracted Analyzed Laboratory Method ReferenceOrganic Compound Analysis 7 2009/08/18 2009/08/19 NIOSH/OSHA methods G C / F I D
Sample Matrix: Water# Samples Received: 7
Date Date MethodAnalyses Quantity Extracted Analyzed Laboratory Method ReferenceVOST Condensate (8260Cmod) 7 N/A 2009/08/18 BRL SOP-00305 EPA 8260Cmod(M0030)
* RPDs calculated using raw data. The rounding of final results may result in the apparent difference.
MAXXAM ANALYTICS
CLAYTON JOHNSONProject Manager
CJO/cjoencl.
Total cover pages: 1
Page 1 of 9

AIR TOX Environmental CompanyMaxxam Job #: A9A3667 Client Project #: 9020Report Date: 2009/09/15 Project name: WATERBURY GENERATION, LLC
RESULTS OF ANALYSES OF AIR
Maxxam ID D J 1 1 2 7 D J 1 1 3 3 D J 1 1 3 4 D J 1 1 3 5Sampling Date 2009/08/07 2009/08/07 2009/08/07 2009/08/07 U n i t s BENZENE T-1-BENZENE-FH T-1-BENZENE-BH T-2-BENZENE-FH R D L QC Batch MDL
BLANK
Benzene ug ND ND ND ND 2.0 1910239 1.0
ND = Not detectedRDL = Reportable Detection LimitQC Batch = Quality Control Batch
Maxxam ID D J 1 1 3 6 D J 1 1 6 0 D J 1 1 6 1Sampling Date 2009/08/07 2009/08/07 2009/08/07 U n i t s T-2-BENZENE-BH T-3-BENZENE-FH T-3-BENZENE-BH R D L QC Batch MDL
Benzene ug ND ND ND 2.0 1910239 1.0
ND = Not detectedRDL = Reportable Detection LimitQC Batch = Quality Control Batch
Page 2 of 9

AIR TOX Environmental CompanyMaxxam Job #: A9A3667 Client Project #: 9020Report Date: 2009/09/15 Project name: WATERBURY GENERATION, LLC
VOLATILE ORGANICS BY GC/MS (WATER)
Maxxam ID D J 1 1 4 3 D J 1 1 4 4Sampling Date 2009/08/07 2009/08/07 U n i t s BENZENE-BLANK-IMP. R D L T-1-BENZENE-IMP.1 R D L QC Batch MDL
CATCH CATCH
Benzene ug/L ND 0.60 ND 0.65 1913258 0.50
Surrogate Recovery (%)
4-Bromofluorobenzene % 93 N/A 94 N/A 1913258 N/A
D4-1,2-Dichloroethane % 96 N/A 101 N/A 1913258 N/A
D8-Toluene % 103 N/A 103 N/A 1913258 N/A
ND = Not detectedN/A = Not ApplicableRDL = Reportable Detection LimitQC Batch = Quality Control Batch
Maxxam ID D J 1 1 4 5 D J 1 1 4 6Sampling Date 2009/08/07 2009/08/07 U n i t s T-1-BENZENE-IMP.2 R D L T-2-BENZENE-IMP.1 R D L QC Batch MDL
CATCH CATCH
Benzene ug/L ND 0.80 ND 0.55 1913258 0.50
Surrogate Recovery (%)
4-Bromofluorobenzene % 94 N/A 94 N/A 1913258 N/A
D4-1,2-Dichloroethane % 104 N/A 103 N/A 1913258 N/A
D8-Toluene % 101 N/A 102 N/A 1913258 N/A
ND = Not detectedN/A = Not ApplicableRDL = Reportable Detection LimitQC Batch = Quality Control Batch
Page 3 of 9
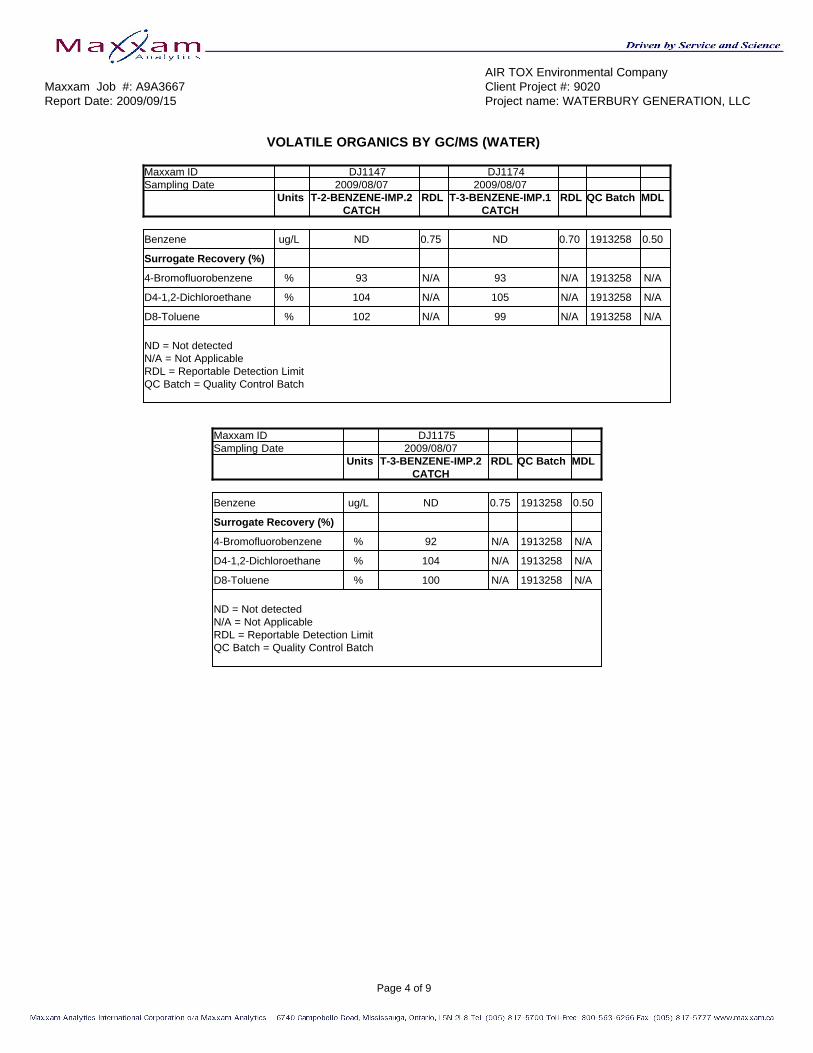
AIR TOX Environmental CompanyMaxxam Job #: A9A3667 Client Project #: 9020Report Date: 2009/09/15 Project name: WATERBURY GENERATION, LLC
VOLATILE ORGANICS BY GC/MS (WATER)
Maxxam ID D J 1 1 4 7 D J 1 1 7 4Sampling Date 2009/08/07 2009/08/07 U n i t s T-2-BENZENE-IMP.2 R D L T-3-BENZENE-IMP.1 R D L QC Batch MDL
CATCH CATCH
Benzene ug/L ND 0.75 ND 0.70 1913258 0.50
Surrogate Recovery (%)
4-Bromofluorobenzene % 93 N/A 93 N/A 1913258 N/A
D4-1,2-Dichloroethane % 104 N/A 105 N/A 1913258 N/A
D8-Toluene % 102 N/A 99 N/A 1913258 N/A
ND = Not detectedN/A = Not ApplicableRDL = Reportable Detection LimitQC Batch = Quality Control Batch
Maxxam ID D J 1 1 7 5Sampling Date 2009/08/07 U n i t s T-3-BENZENE-IMP.2 R D L QC Batch MDL
CATCH
Benzene ug/L ND 0.75 1913258 0.50
Surrogate Recovery (%)
4-Bromofluorobenzene % 92 N/A 1913258 N/A
D4-1,2-Dichloroethane % 104 N/A 1913258 N/A
D8-Toluene % 100 N/A 1913258 N/A
ND = Not detectedN/A = Not ApplicableRDL = Reportable Detection LimitQC Batch = Quality Control Batch
Page 4 of 9

AIR TOX Environmental CompanyMaxxam Job #: A9A3667 Client Project #: 9020Report Date: 2009/09/15 Project name: WATERBURY GENERATION, LLC
Test Summary
Maxxam ID DJ1127 Collected 2009/08/07Sample ID BENZENE BLANK Shipped
Matrix AIR Received 2009/08/13
Test Description Instrumentation Batch Extracted Analyzed AnalystOrganic Compound Analysis GC/FID 1910239 2009/08/18 2009/08/19 LTO
Maxxam ID DJ1133 Collected 2009/08/07Sample ID T-1-BENZENE-FH Shipped
Matrix AIR Received 2009/08/13
Test Description Instrumentation Batch Extracted Analyzed AnalystOrganic Compound Analysis GC/FID 1910239 2009/08/18 2009/08/19 LTO
Maxxam ID DJ1134 Collected 2009/08/07Sample ID T-1-BENZENE-BH Shipped
Matrix AIR Received 2009/08/13
Test Description Instrumentation Batch Extracted Analyzed AnalystOrganic Compound Analysis GC/FID 1910239 2009/08/18 2009/08/19 LTO
Maxxam ID DJ1135 Collected 2009/08/07Sample ID T-2-BENZENE-FH Shipped
Matrix AIR Received 2009/08/13
Test Description Instrumentation Batch Extracted Analyzed AnalystOrganic Compound Analysis GC/FID 1910239 2009/08/18 2009/08/19 LTO
Maxxam ID DJ1136 Collected 2009/08/07Sample ID T-2-BENZENE-BH Shipped
Matrix AIR Received 2009/08/13
Test Description Instrumentation Batch Extracted Analyzed AnalystOrganic Compound Analysis GC/FID 1910239 2009/08/18 2009/08/19 LTO
Maxxam ID DJ1143 Collected 2009/08/07Sample ID BENZENE-BLANK-IMP. CATCH Shipped
Matrix Water Received 2009/08/13
Test Description Instrumentation Batch Extracted Analyzed AnalystVOST Condensate (8260Cmod) P&T/MS 1913258 N/A 2009/08/18 DBJ
Maxxam ID DJ1144 Collected 2009/08/07Sample ID T-1-BENZENE-IMP.1 CATCH Shipped
Matrix Water Received 2009/08/13
Test Description Instrumentation Batch Extracted Analyzed AnalystVOST Condensate (8260Cmod) P&T/MS 1913258 N/A 2009/08/18 DBJ
Page 5 of 9

AIR TOX Environmental CompanyMaxxam Job #: A9A3667 Client Project #: 9020Report Date: 2009/09/15 Project name: WATERBURY GENERATION, LLC
Test Summary
Maxxam ID DJ1145 Collected 2009/08/07Sample ID T-1-BENZENE-IMP.2 CATCH Shipped
Matrix Water Received 2009/08/13
Test Description Instrumentation Batch Extracted Analyzed AnalystVOST Condensate (8260Cmod) P&T/MS 1913258 N/A 2009/08/18 DBJ
Maxxam ID DJ1146 Collected 2009/08/07Sample ID T-2-BENZENE-IMP.1 CATCH Shipped
Matrix Water Received 2009/08/13
Test Description Instrumentation Batch Extracted Analyzed AnalystVOST Condensate (8260Cmod) P&T/MS 1913258 N/A 2009/08/18 DBJ
Maxxam ID DJ1147 Collected 2009/08/07Sample ID T-2-BENZENE-IMP.2 CATCH Shipped
Matrix Water Received 2009/08/13
Test Description Instrumentation Batch Extracted Analyzed AnalystVOST Condensate (8260Cmod) P&T/MS 1913258 N/A 2009/08/18 DBJ
Maxxam ID DJ1160 Collected 2009/08/07Sample ID T-3-BENZENE-FH Shipped
Matrix AIR Received 2009/08/13
Test Description Instrumentation Batch Extracted Analyzed AnalystOrganic Compound Analysis GC/FID 1910239 2009/08/18 2009/08/19 LTO
Maxxam ID DJ1161 Collected 2009/08/07Sample ID T-3-BENZENE-BH Shipped
Matrix AIR Received 2009/08/13
Test Description Instrumentation Batch Extracted Analyzed AnalystOrganic Compound Analysis GC/FID 1910239 2009/08/18 2009/08/19 LTO
Maxxam ID DJ1174 Collected 2009/08/07Sample ID T-3-BENZENE-IMP.1 CATCH Shipped
Matrix Water Received 2009/08/13
Test Description Instrumentation Batch Extracted Analyzed AnalystVOST Condensate (8260Cmod) P&T/MS 1913258 N/A 2009/08/18 DBJ
Maxxam ID DJ1175 Collected 2009/08/07Sample ID T-3-BENZENE-IMP.2 CATCH Shipped
Matrix Water Received 2009/08/13
Test Description Instrumentation Batch Extracted Analyzed AnalystVOST Condensate (8260Cmod) P&T/MS 1913258 N/A 2009/08/18 DBJ
Page 6 of 9

AIR TOX Environmental CompanyMaxxam Job #: A9A3667 Client Project #: 9020Report Date: 2009/09/15 Project name: WATERBURY GENERATION, LLC
GENERAL COMMENTS
VOCCOND-W: All condensate samples were received in 43mL VOC vials with varying amounts of headspace in vial.VOCCHAR-W: Sample DJ1199, for 1,3-butadiene, was analyzed 4 minutes beyond 12 hour BFB tune window.
TUBE-FID: The data reported for benzene is the average from triplicate injections as per Method 18.
Sample DJ1143-01: VOCCOND-W: Sample volume received = 37 mL. Used 1.2X dilution due to insufficient sample size. Detection limits havebeen adjusted accordingly.
Sample DJ1144-01: VOCCOND-W: Sample volume received = 33 mL. Used 1.3X dilution due to insufficient sample size. Detection limits havebeen adjusted accordingly.
Sample DJ1145-01: VOCCOND-W: Sample volume received = 27.4 mL. Used 1.6X dilution due to insufficient sample size. Detection limits havebeen adjusted accordingly.
Sample DJ1146-01: VOCCOND-W: Sample volume received = 39 mL. Used 1.1X dilution due to insufficient sample size. Detection limits havebeen adjusted accordingly.
Sample DJ1147-01: VOCCOND-W: Sample volume received = 29.6 mL. Used 1.5X dilution due to insufficient sample size. Detection limits havebeen adjusted accordingly.
Sample DJ1174-01: VOCCOND-W: Sample volume received = 30.5 mL. Used 1.4X dilution due to insufficient sample size. Detection limits havebeen adjusted accordingly.
Sample DJ1175-01: VOCCOND-W: Sample volume received = 28 mL. Used 1.5X dilution due to insufficient sample size. Detection limits havebeen adjusted accordingly.
Samples have been corrected for desorption efficiencies if average percent recoveries are less than 80% (does not apply to gravimetric andinorganic analysis).
Results relate only to the items tested.
Page 7 of 9
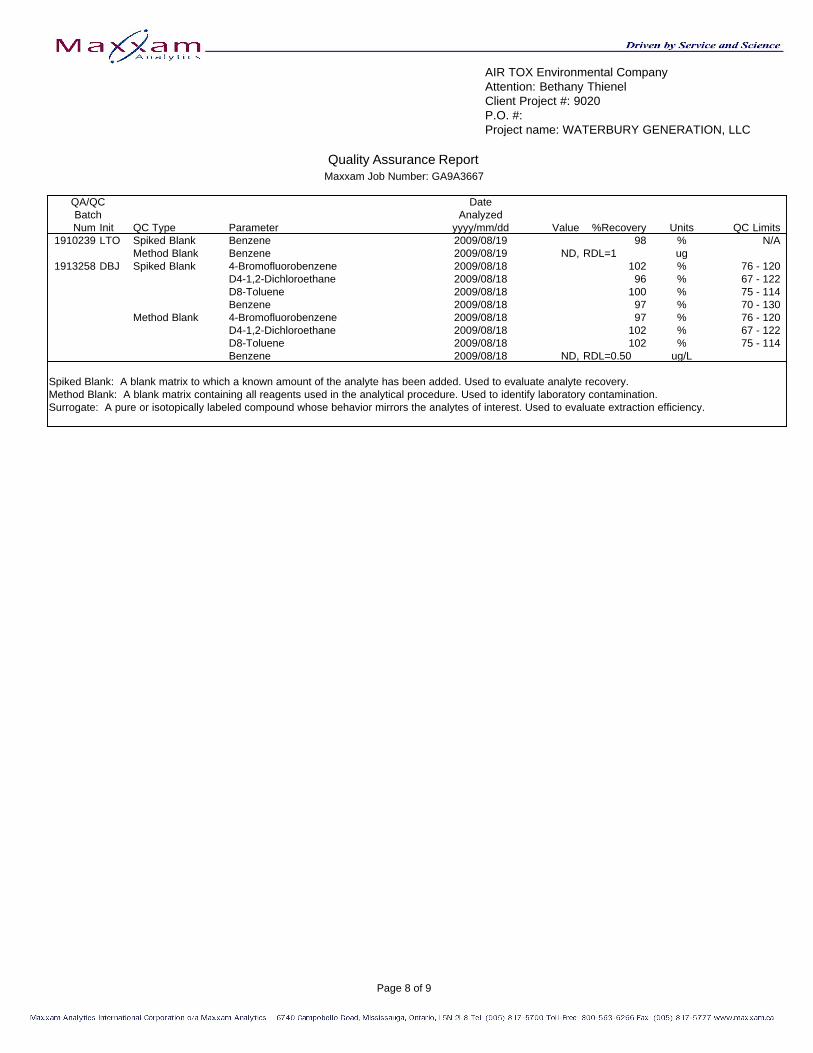
AIR TOX Environmental CompanyAttention: Bethany Thienel Client Project #: 9020P.O. #: Project name: WATERBURY GENERATION, LLC
Quality Assurance ReportMaxxam Job Number: GA9A3667
QA/QC DateBatch AnalyzedNum Init QC Type Parameter yyyy/mm/dd Value %Recovery Units QC Limits
1910239 LTO Spiked Blank Benzene 2009/08/19 98 % N/AMethod Blank Benzene 2009/08/19 ND, RDL=1 ug
1913258 DBJ Spiked Blank 4-Bromofluorobenzene 2009/08/18 102 % 76 - 120D4-1,2-Dichloroethane 2009/08/18 96 % 67 - 122D8-Toluene 2009/08/18 100 % 75 - 114Benzene 2009/08/18 97 % 70 - 130
Method Blank 4-Bromofluorobenzene 2009/08/18 97 % 76 - 120D4-1,2-Dichloroethane 2009/08/18 102 % 67 - 122D8-Toluene 2009/08/18 102 % 75 - 114Benzene 2009/08/18 ND, RDL=0.50 ug/L
Spiked Blank: A blank matrix to which a known amount of the analyte has been added. Used to evaluate analyte recovery.Method Blank: A blank matrix containing all reagents used in the analytical procedure. Used to identify laboratory contamination.Surrogate: A pure or isotopically labeled compound whose behavior mirrors the analytes of interest. Used to evaluate extraction efficiency.
Page 8 of 9
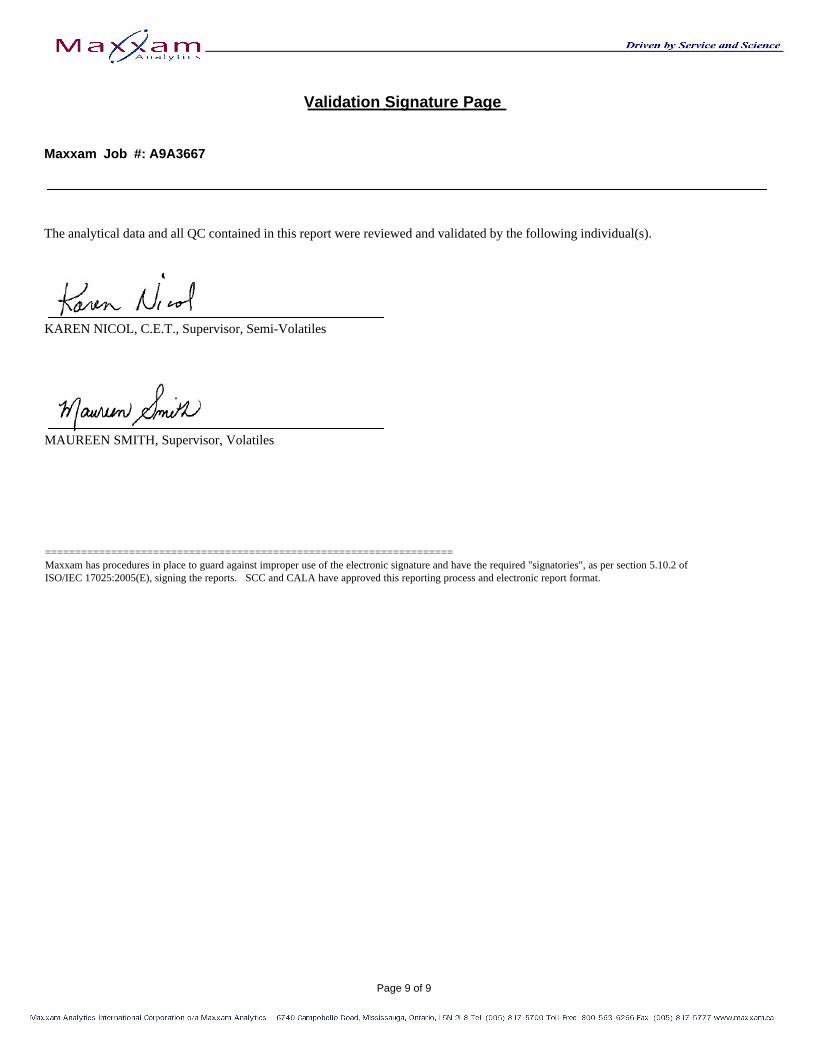
Validation Signature Page
Maxxam Job #: A9A3667
The analytical data and all QC contained in this report were reviewed and validated by the following individual(s).
KAREN NICOL, C.E.T., Supervisor, Semi-Volatiles
MAUREEN SMITH, Supervisor, Volatiles
====================================================================Maxxam has procedures in place to guard against improper use of the electronic signature and have the required "signatories", as per section 5.10.2 ofISO/IEC 17025:2005(E), signing the reports. SCC and CALA have approved this reporting process and electronic report format.
Page 9 of 9
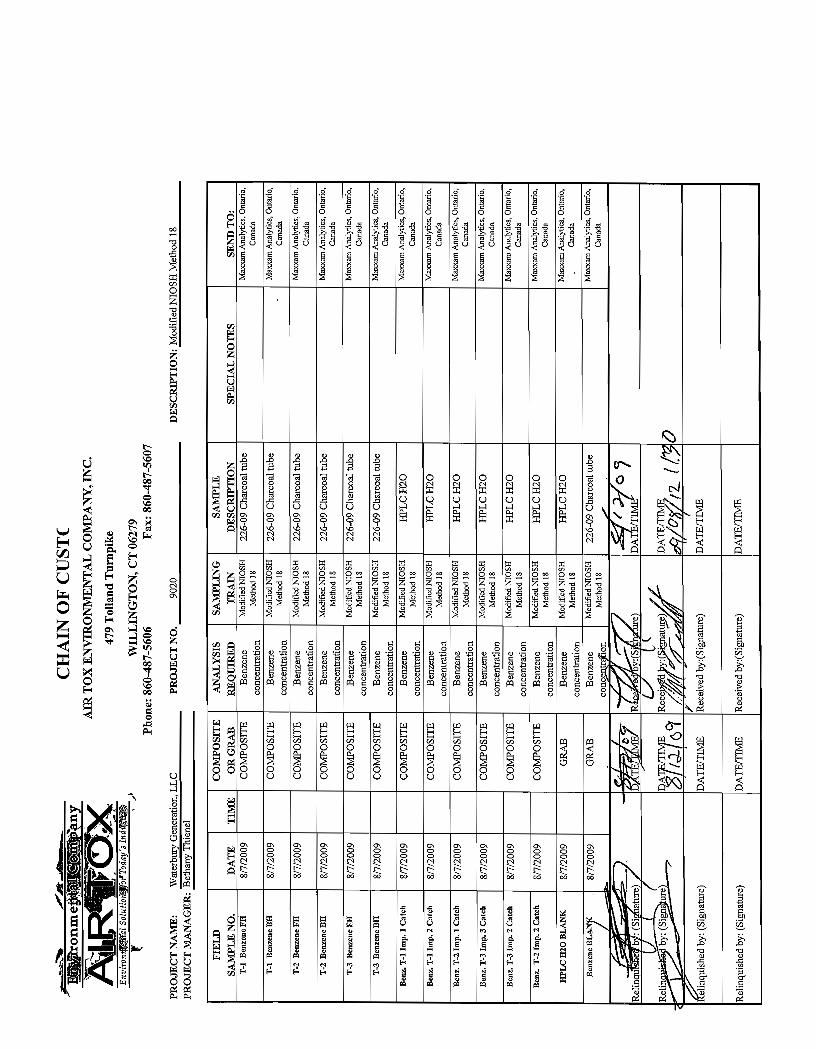
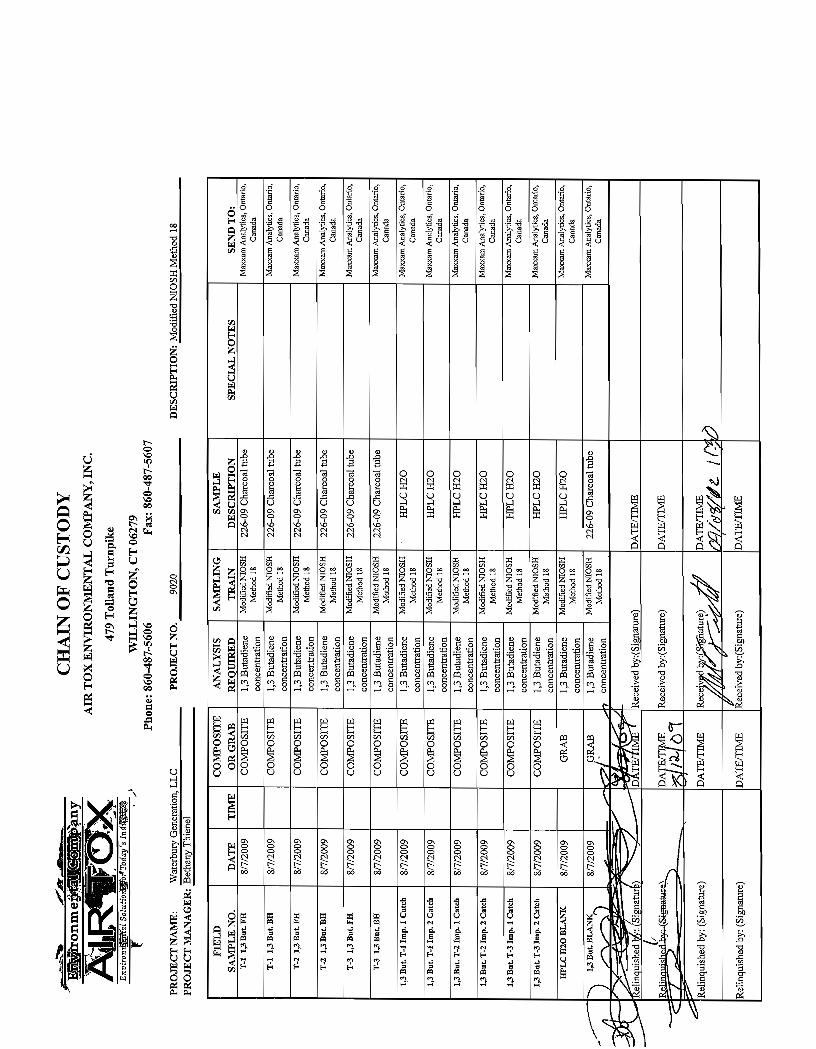

Volatile Organics Analysis Data SheetsTentatively Identified Compounds
SAMPLE#: DJ1149
Field ID#: 1,3-BUT-BLANK-IMP. CATCH
Concentration UnitsNumber of TICs found:__________ ug/L
CAS # Compound Name RT Est. Conc. Match %
1. 1,3-butadiene < 7 ug/L2.3.4.5.6.7.8.9.
10.
Maxxam Analytics

Volatile Organics Analysis Data SheetsTentatively Identified Compounds
SAMPLE#: DJ1150
Field ID#: T-1 1,3-BUT-IMP.1 CATCH
Concentration UnitsNumber of TICs found:__________ ug/L
CAS # Compound Name RT Est. Conc. Match %
1. 1,3-butadiene < 8 ug/L2.3.4.5.6.7.8.9.
10.
Maxxam Analytics

Volatile Organics Analysis Data SheetsTentatively Identified Compounds
SAMPLE#: DJ1152
Field ID#: T-1 1,3-BUT-IMP.2 CATCH
Concentration UnitsNumber of TICs found:__________ ug/L
CAS # Compound Name RT Est. Conc. Match %
1. 1,3-butadiene < 7 ug/L2.3.4.5.6.7.8.9.
10.
Maxxam Analytics

Volatile Organics Analysis Data SheetsTentatively Identified Compounds
SAMPLE#: DJ1154
Field ID#: T-2 1,3-BUT-IMP.1 CATCH
Concentration UnitsNumber of TICs found:__________ ug/L
CAS # Compound Name RT Est. Conc. Match %
1. 1,3-butadiene < 6 ug/L2.3.4.5.6.7.8.9.
10.
Maxxam Analytics
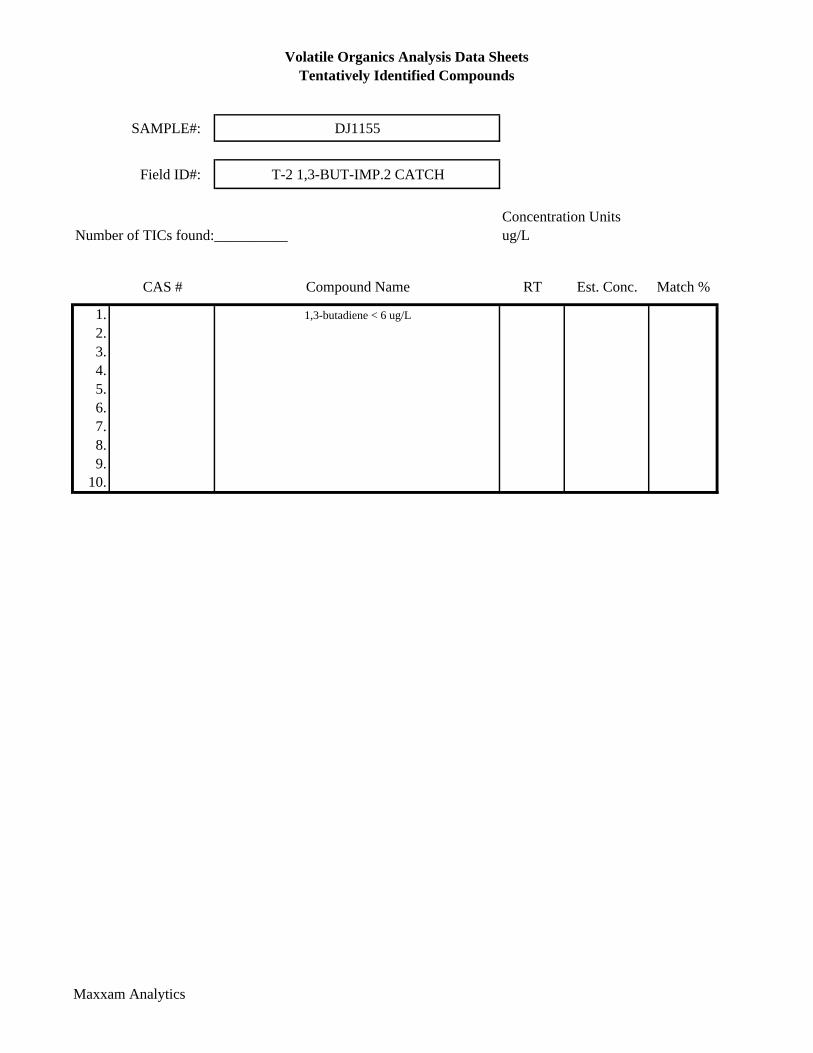
Volatile Organics Analysis Data SheetsTentatively Identified Compounds
SAMPLE#: DJ1155
Field ID#: T-2 1,3-BUT-IMP.2 CATCH
Concentration UnitsNumber of TICs found:__________ ug/L
CAS # Compound Name RT Est. Conc. Match %
1. 1,3-butadiene < 6 ug/L2. 3. 4. 5. 6. 7. 8. 9.
10.
Maxxam Analytics

Volatile Organics Analysis Data SheetsTentatively Identified Compounds
SAMPLE#: DJ1198
Field ID#: T-3 1,3-BUT-IMP.1 CATCH
Concentration UnitsNumber of TICs found:__________ ug/L
CAS # Compound Name RT Est. Conc. Match %
1. 1,3-butadiene < 8 ug/L 2. 3. 4. 5. 6. 7. 8. 9.
10.
Maxxam Analytics

Volatile Organics Analysis Data SheetsTentatively Identified Compounds
SAMPLE#: DJ1199
Field ID#: T-3 1,3-BUT-IMP.2 CATCH
Concentration UnitsNumber of TICs found:__________ ug/L
CAS # Compound Name RT Est. Conc. Match %
1. 1,3-butadiene < 7 ug/L 2. 3. 4. 5. 6. 7. 8. 9.
10.
Maxxam Analytics

Page 1 of 3Tue, 08/25/09 3:56 PM
ANALYTICAL REPORT
Clayton JohnsonMaxxam Analytics6740 Campobello Rd.Mississauga, ON, L5N 2L8CANADA
Phone:Fax:
E-mail:
(800) 668-0639(905) 817-5777
Report Date August 25, 2009
Project Manager Rand PotterWorkorder: 9232035
Purchase Order:Client Project ID: Maxxam Analytics 082009
A9A3667/Clayton John
Analytical Results8/7/20098/19/2009
9232035001
Sample ID:
Lab ID:
Media: Collected:Received:
SKC 226-09, Charcoal Tube400/200mg
DJ1137-01R
Sampling Location: A9A3667
Method:
Analyte mg/sample mg/m³ ppm
NIOSH 1024 Analyzed: 8/25/2009
RL (mg/sample)
0.0010NA<0.0010 NA1,3-Butadiene
8/7/20098/19/2009
9232035002
Sample ID:
Lab ID:
Media: Collected:Received:
SKC 226-09, Charcoal Tube400/200mg
DJ1138-01R
Sampling Location: A9A3667
Method:
Analyte mg/sample mg/m³ ppm
NIOSH 1024 Analyzed: 8/25/2009
RL (mg/sample)
0.0010NA<0.0010 NA1,3-Butadiene
8/7/20098/19/2009
9232035003
Sample ID:
Lab ID:
Media: Collected:Received:
SKC 226-09, Charcoal Tube400/200mg
DJ1139-01R
Sampling Location: A9A3667
Method:
Analyte mg/sample mg/m³ ppm
NIOSH 1024 Analyzed: 8/25/2009
RL (mg/sample)
0.0010NA<0.0010 NA1,3-Butadiene
8/7/20098/19/2009
9232035004
Sample ID:
Lab ID:
Media: Collected:Received:
SKC 226-09, Charcoal Tube400/200mg
DJ1141-01R
Sampling Location: A9A3667
Method:
Analyte mg/sample mg/m³ ppm
NIOSH 1024 Analyzed: 8/25/2009
RL (mg/sample)
0.0010NA<0.0010 NA1,3-Butadiene
IHREP-V9.7

Page 2 of 3Tue, 08/25/09 3:56 PM
ANALYTICAL REPORT
Project Manager Rand PotterWorkorder: 9232035
Purchase Order:Client Project ID: Maxxam Analytics 082009
A9A3667/Clayton John
Analytical Results8/7/20098/19/2009
9232035005
Sample ID:
Lab ID:
Media: Collected:Received:
SKC 226-09, Charcoal Tube400/200mg
DJ1142-01R
Sampling Location: A9A3667
Method:
Analyte mg/sample mg/m³ ppm
NIOSH 1024 Analyzed: 8/25/2009
RL (mg/sample)
0.0010NA<0.0010 NA1,3-Butadiene
8/7/20098/19/2009
9232035006
Sample ID:
Lab ID:
Media: Collected:Received:
SKC 226-09, Charcoal Tube400/200mg
DJ1172-01R
Sampling Location: A9A3667
Method:
Analyte mg/sample mg/m³ ppm
NIOSH 1024 Analyzed: 8/25/2009
RL (mg/sample)
0.0010NA<0.0010 NA1,3-Butadiene
8/7/20098/19/2009
9232035007
Sample ID:
Lab ID:
Media: Collected:Received:
SKC 226-09, Charcoal Tube400/200mg
DJ1173-01R
Sampling Location: A9A3667
Method:
Analyte mg/sample mg/m³ ppm
NIOSH 1024 Analyzed: 8/25/2009
RL (mg/sample)
0.0010NA<0.0010 NA1,3-Butadiene
Workorder Comments
9232035 "Total Petroleum Hydrocarbons" is the sum of all peaks in the chromatogram minus the solventand requested analyte peaks and was quantitated against n-hexane.
Report Authorization
Method: NIOSH 1024
Fred Rejali Thomas J. Masoian
Analyst Peer Review
IHREP-V9.7
Page 3 of 3Tue, 08/25/09 3:56 PM
ANALYTICAL REPORT
Project Manager Rand PotterWorkorder: 9232035
Purchase Order:Client Project ID: Maxxam Analytics 082009
A9A3667/Clayton John
LOD = Limit of Detection = MDL = Method Detection Limit, A statistical estimate of method/media/instrument sensitivity.LOQ = Limit of Quantitation = RL = Reporting Limit, A verified value of method/media/instrument sensitivity.ND = Not Detected, Testing result not detected above the LOD or LOQ.** No result could be reported, see sample comments for details.< This testing result is less than the numerical value.( ) This testing result is between the LOD and LOQ and has higher analytical uncertainty than values at or above the LOQ.
Definitions
The results provided in this report relate only to the items tested.Samples were received in acceptable condition unless otherwise noted.Samples have not been blank corrected unless otherwise noted.This test report shall not be reproduced, except in full, without written approval of ALS Laboratory Group.
General Lab Comments
ALS Laboratory Group is accredited by AIHA for specific fields of testing as documented in its current scope of accreditation(ID#101574) which is available on request by contacting your project manager or view on the internet at http://www.aiha.org. Thequality systems implemented in the laboratory apply to all methods performed by ALS Laboratory Group regardless of this currentscope of accreditation which does not include performance based methods, modified methods, and methods applied to matricesnot listed in the methods.
ALS DataChem provides professional analytical services for all samples submitted. ALS Laboratory Group is not in a position tointerpret the data and assumes no responsibility for the quality of the samples submitted.
Phone: (801) 266-7700Email: [email protected]: www.datachem.com
Laboratory Contact InformationALS Laboratory Group (formerly DataChem Laboratories, Inc.)960 W Levoy DriveSalt Lake City, Utah 84123
IHREP-V9.7

APPENDIX C.5 Polynuclear Aromatic Hydrocarbon Testing
Analytical Laboratory Results
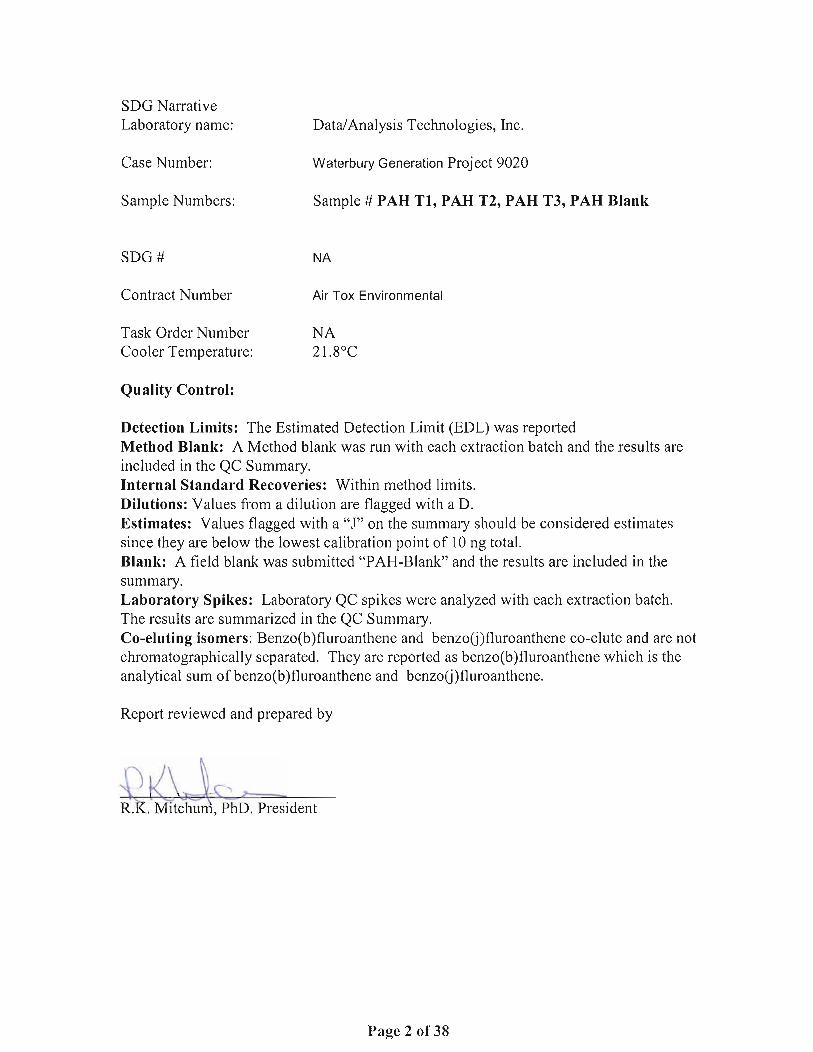
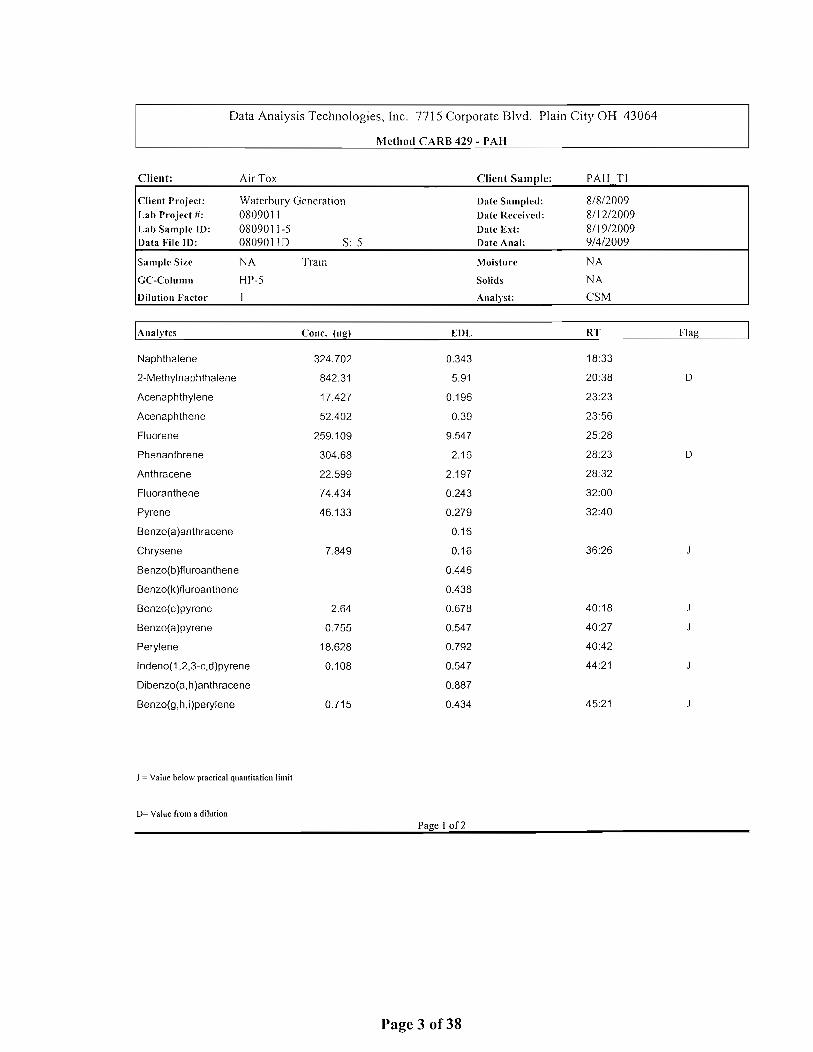


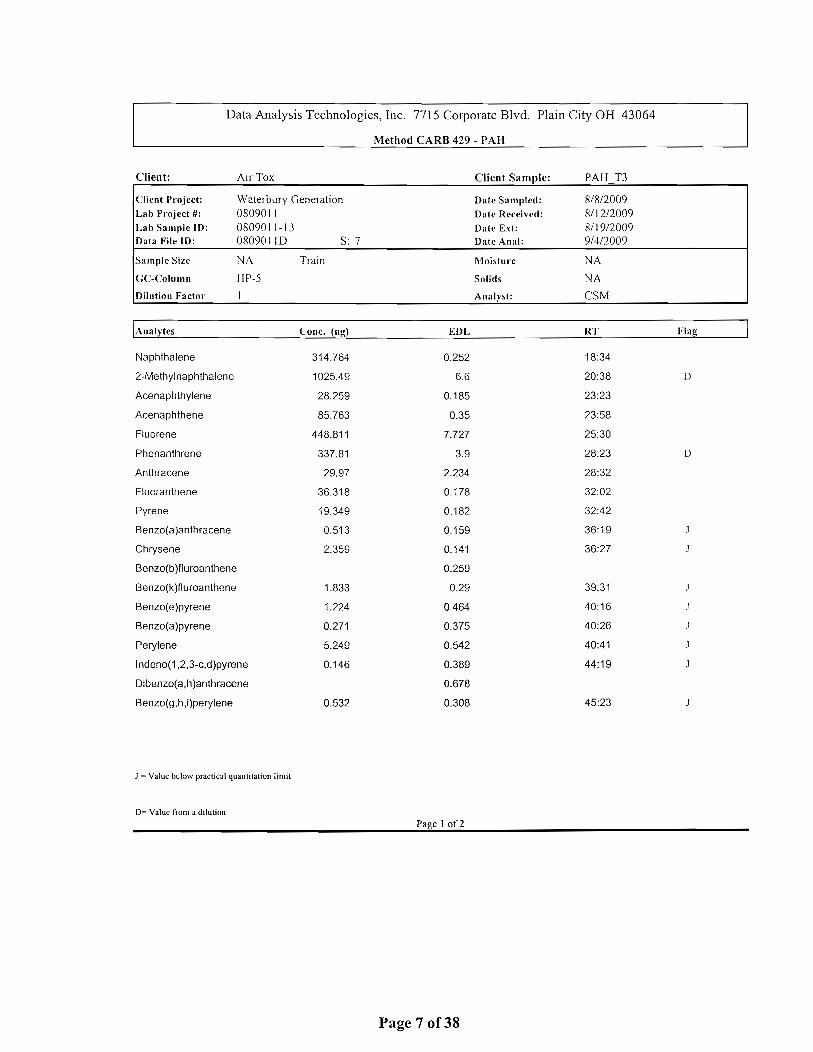
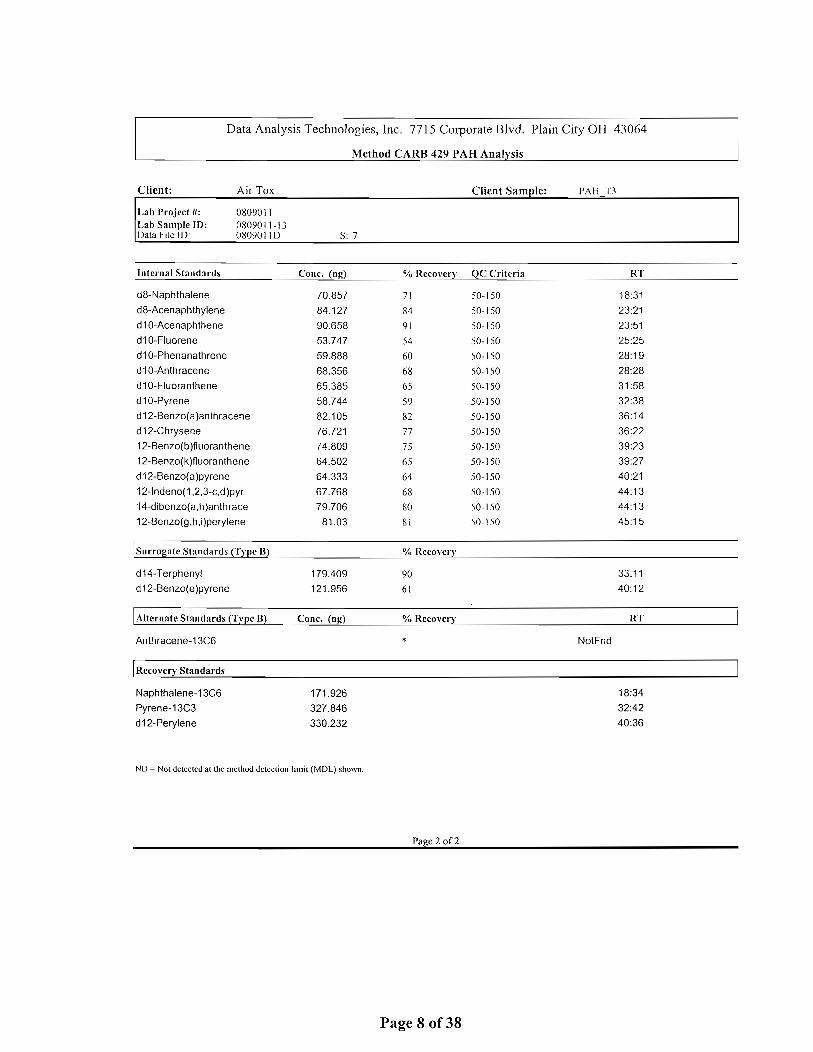

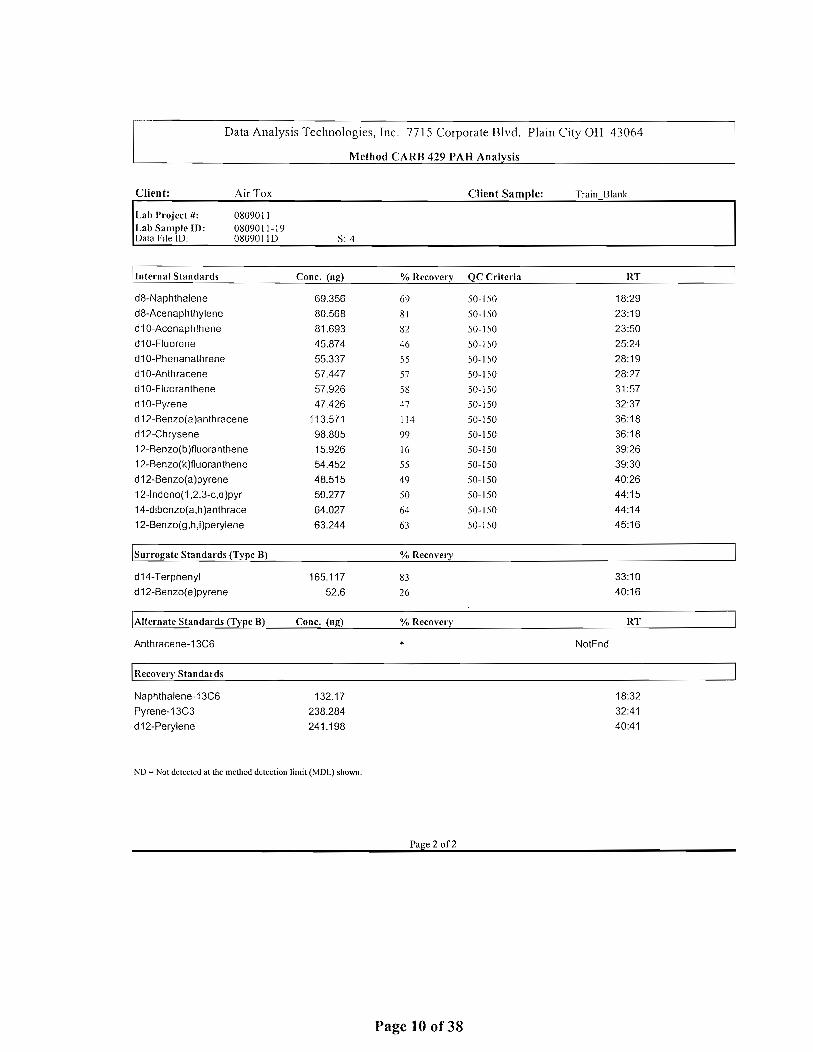


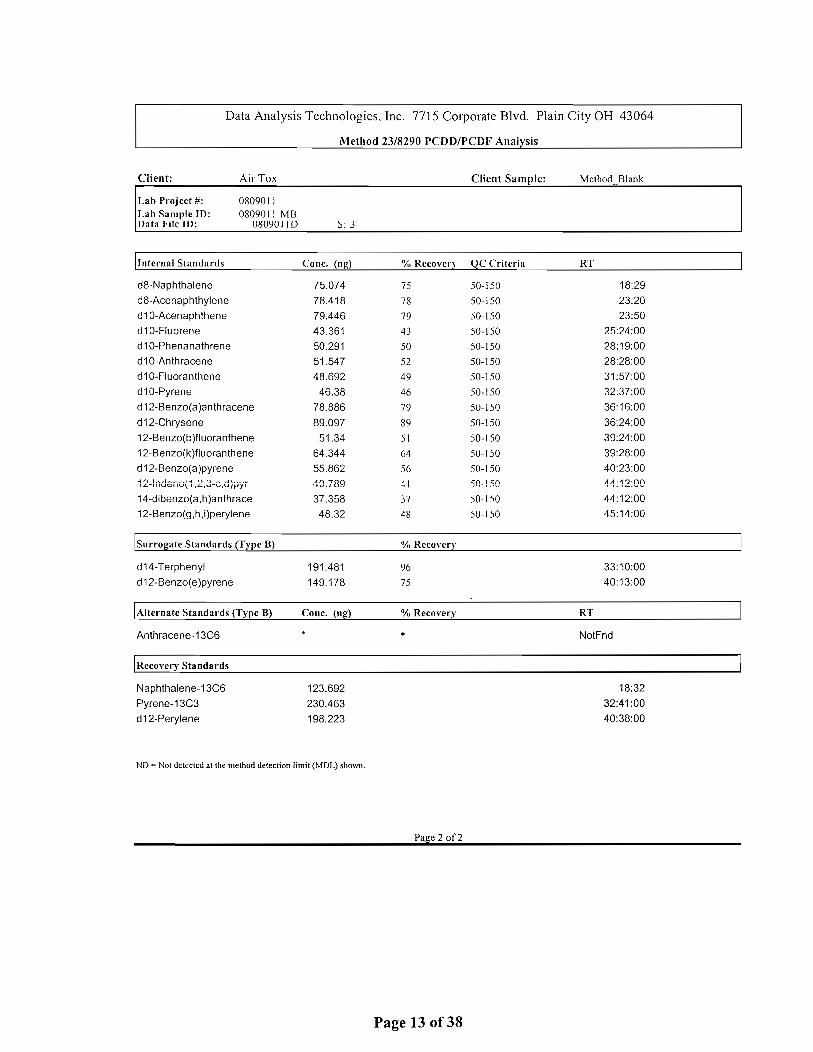


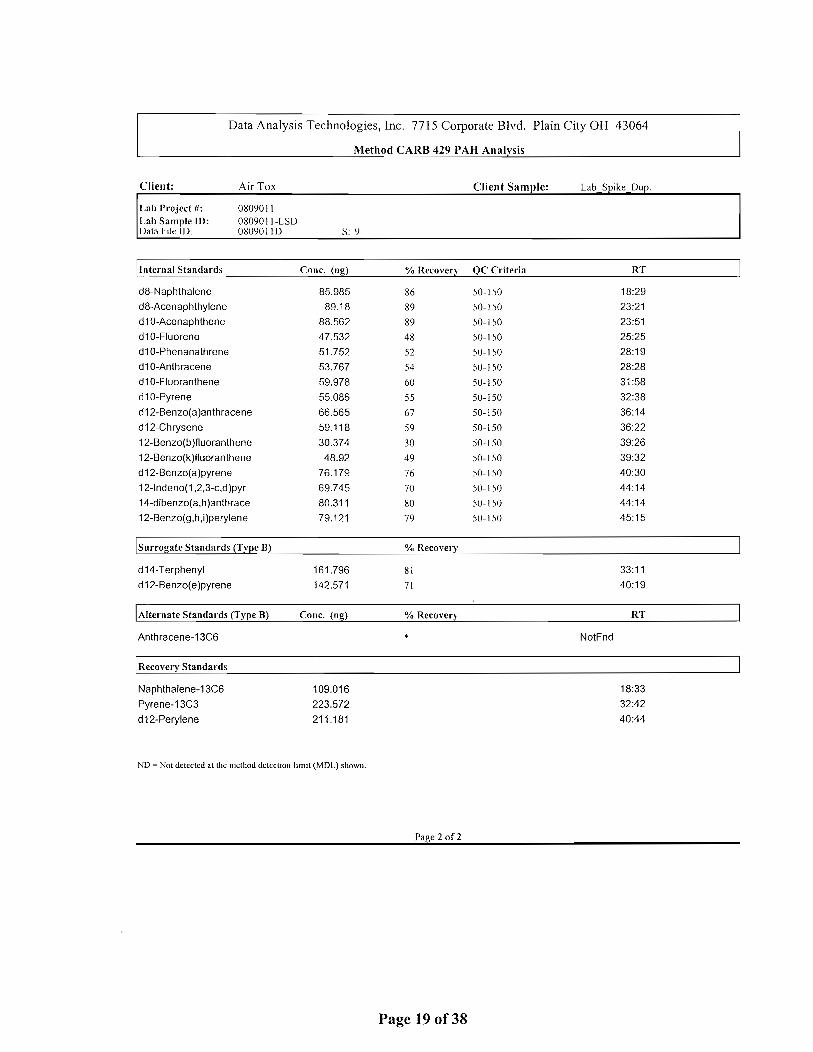

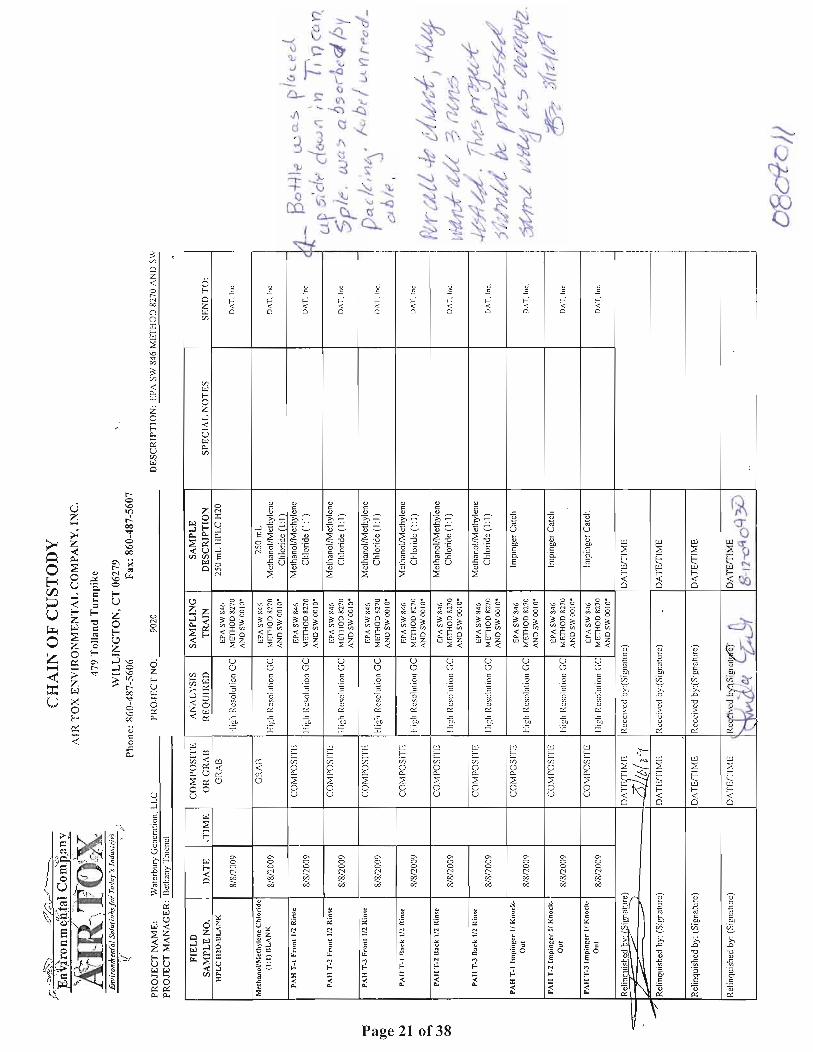

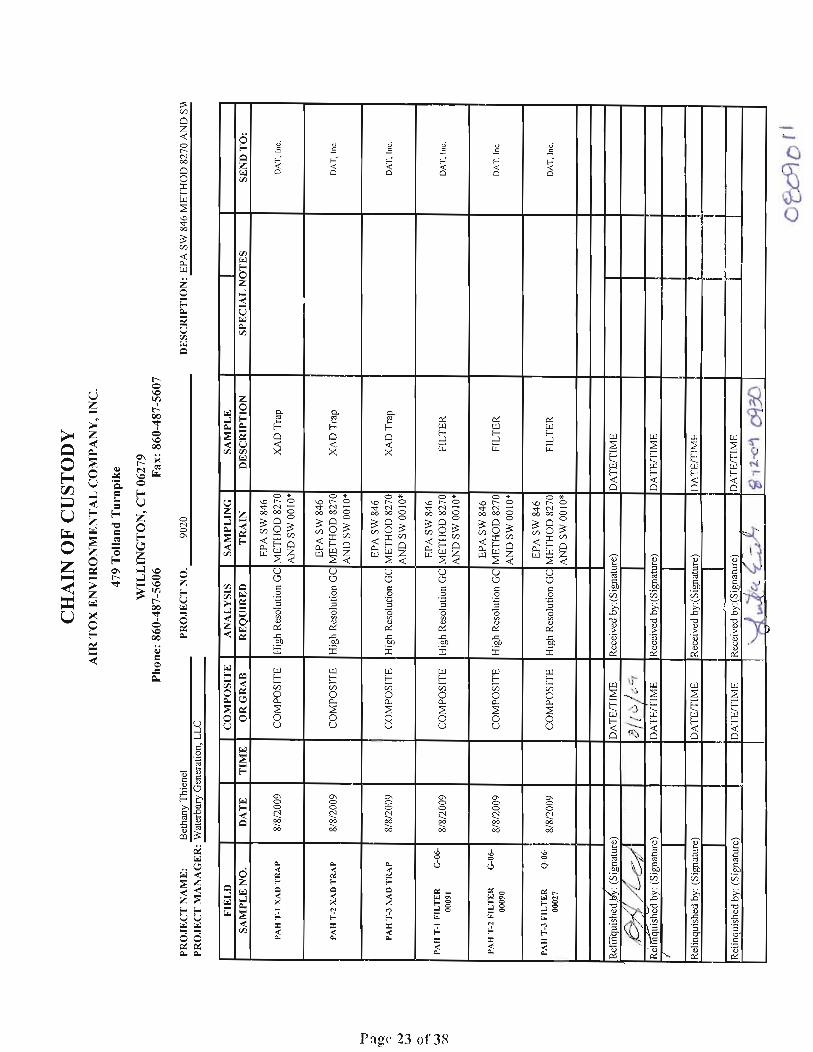
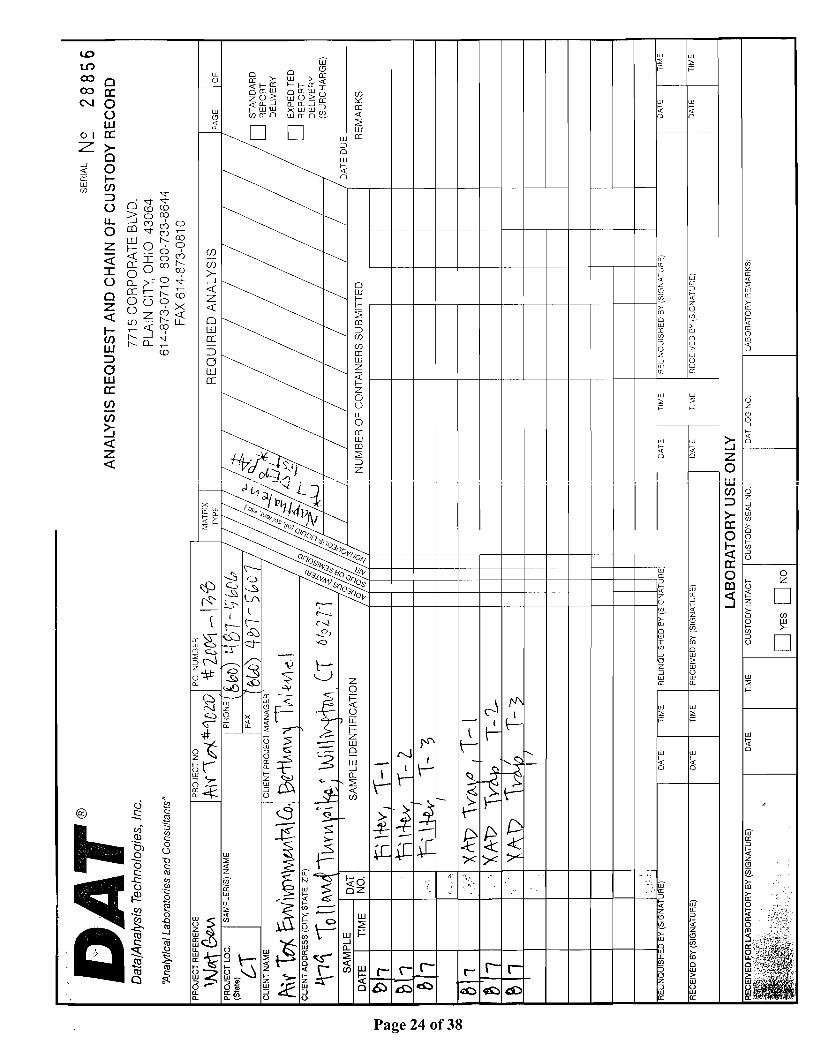

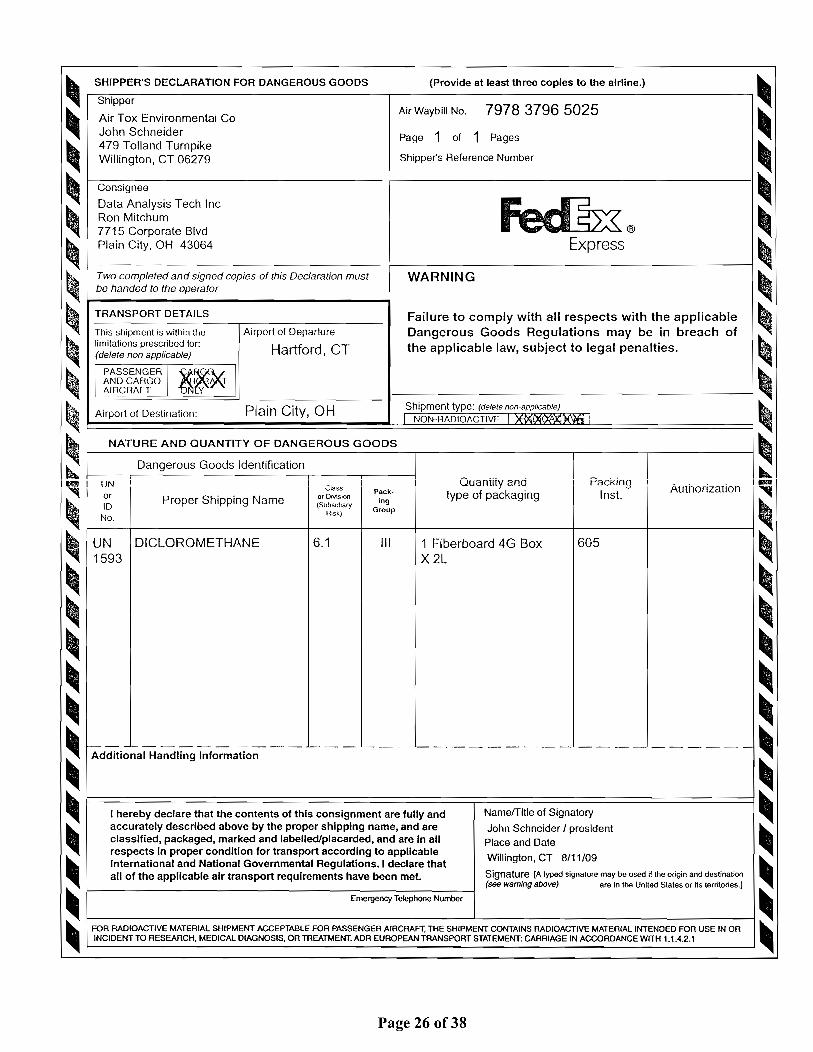


APPENDIX C.6
ULSD Fuel Sample Analytical Laboratory Results

Mass Certification - MA-00071Conn Certification - PH-0520
Mt.Tom Generating Co. LLC Analytical Laboratory15 Agawam AvenueWest Springfield, MA 01089Phone (413) 214-6541 Fax (413) [email protected]
August 26, 2009
B. Thienel
Analysis of Miscellaneous Samples
Enclosed are Report No(s): 17598
Samples Analyzed
Customer
Sample Description
Laboratory Supervisor
Madhu Shah [email protected]
Report Date
Thank you for your business
Madhu Shah, Laboratory Supervisor Date
AIR TOX - Waterbry
Contact
ALL the information contained in this report has been reviewed for accuracy and checked against all quality control requirementsoutlined in each applicable method.This report may not be reproduced, except in full, without written approval from Mt.Tom Generating Co.LLC Analytical Laboratory.
1Page of 2

09-1258Work OrderSample Analysis
10As-Arsenic Total Less Than ppb EPA 200.910.00 08/26/09 dfp10Cd-Cadmium Total Less Than ppb EPA 200.710.00 08/26/09 dfp
14.4Cr-Chromium Total ppb EPA 200.710.00 08/26/09 dfp10.0Hg-Mercury Total Less Than ppb EPA 245.110.00 08/26/09 dfp52.7Mn-Manganese Total ppb EPA 200.710.00 08/26/09 dfp13.6Ni-Nickel Total ppb EPA 200.710.00 08/26/09 dfp
10Pb-Lead Total Less Than ppb EPA 200.710.00 08/26/09 dfp10Se-Selenium Total Less Than ppb EPA 200.910.00 08/26/09 dfp
Parameter Results MethodMDL Analyzed/Time
17598 8/7/09#2 Oil - Waterbury Generation AIR TOX - Waterbry Generation 8/25/09Source Taken/Time ReceivedSample Description
Tech
2Page of 2

09-1396Work OrderSample Analysis
Be-Beryllium Total Less Than ppb EPA 200.75.00 5.00 09/17/09 dfpParameter Results MethodMDL Analyzed/Time
18212 8/7/09#2 Oil - Waterbury Generation AIR TOX - Waterbry Generation 8/25/09Source Taken/Time ReceivedSample Description
Tech
2Page of 2

APPENDIX D
Equipment Calibration Data Sheets
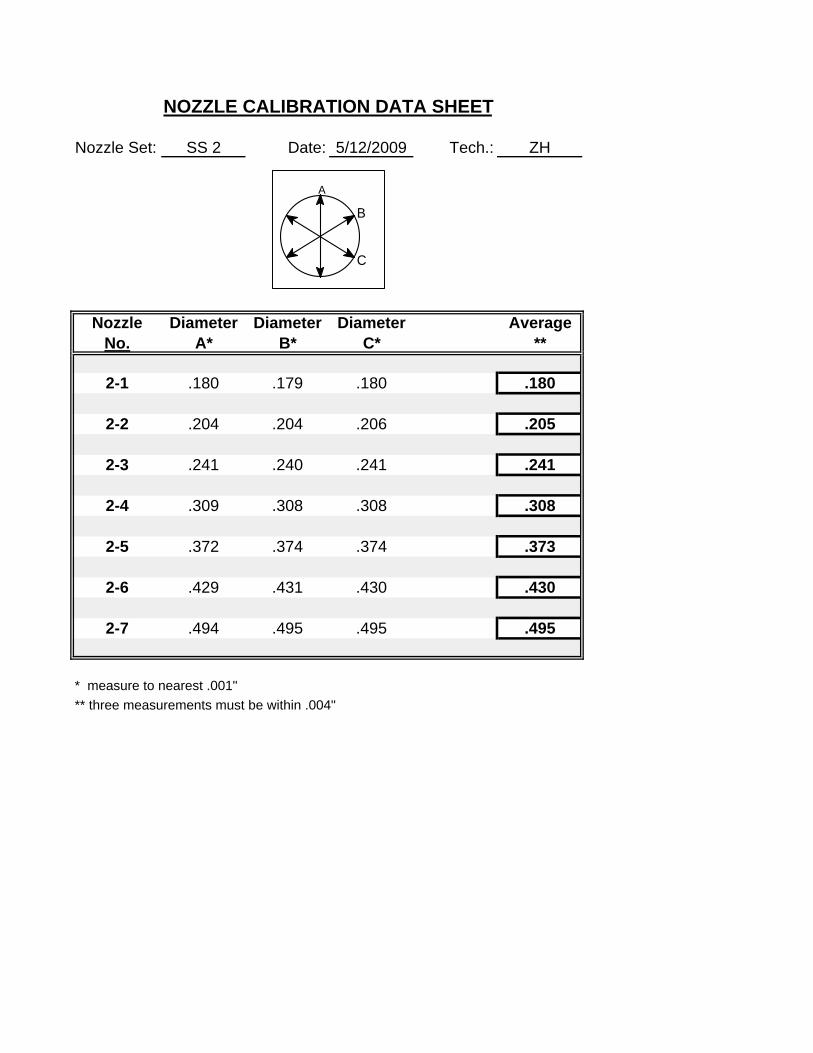
Nozzle Set: SS 2 Date: 5/12/2009 Tech.: ZH
Nozzle Diameter Diameter Diameter AverageNo. A* B* C* **
2-1 .180 .179 .180 .180
2-2 .204 .204 .206 .205
2-3 .241 .240 .241 .241
2-4 .309 .308 .308 .308
2-5 .372 .374 .374 .373
2-6 .429 .431 .430 .430
2-7 .494 .495 .495 .495
* measure to nearest .001"** three measurements must be within .004"
NOZZLE CALIBRATION DATA SHEET
C
B
A

Nozzle Set: Hook Qtz. Date: 8/5/2009 Tech.: DG
Nozzle Diameter Diameter Diameter AverageNo. A* B* C* **
H-1 #DIV/0!
H-2 #DIV/0!
H-3 #DIV/0!
H-4 #DIV/0!
H-5 #DIV/0!
H-6 #DIV/0!
H-7 #DIV/0!
H-8 #DIV/0!
H-9 #DIV/0!
H-10 #DIV/0!
H-11 #DIV/0!
H-12 .183 .185 .187 .185
H-13 .188 .188 .187 .188
H-14 .188 .191 .192 .190
NOZZLE CALIBRATION DATA SHEET
C
B
A

S-TYPE PITOT GEOMETRIC CALIBRATIONPART 2 - PITOT ALIGNMENT
Probe Identification PR 6-01.08.04 Pitot Identification S-Type PitotTechnician ZHDate
a 0.891 a^2 + b^2 - c^2 = cos(ø)b 0.384 2abc 0.956d 0.385 a^2 + d^2 - e^2 = cos(ø')e 0.968 2ad
ø 87.7 ( 80° < ø < 100° )ø' 89.6 ( 80° < ø' < 100° )
a 0.908 a^2 + b^2 - c^2 = cos(ø)b 0.623 2abc 1.07d 0.62 a^2 + d^2 - e^2 = cos(ø')e 1.08 2ad
ø 86.0 ( 85° < ø < 95° )ø' 87.7 ( 85° < ø' < 95° )
gf 0.000 g 0.000
NOTE: Values in parentheses are EPA Method 2 specifications.
Technician Signature Date
5/11/2009
D. g
( g < 1/32" ) 1/32" = 0.03125"
d
e
c
ø
ø'
a
b
a
b
d
e
cø
ø'
f( f < 1 /8" ) 1/8" = 0 .125"
A.
Transverse Tube Axis
B.
Longitudinal Tube Axis
C.
Air Tox Environmental Company inc.

S-TYPE PITOT GEOMETRIC CALIBRATIONPART 2 - PITOT ALIGNMENT
Probe Identification PR 6-03.03.06 Pitot Identification S-Type PitotTechnician ZHDate
a 0.883 a^2 + b^2 - c^2 = cos(ø)b 0.381 2abc 0.943d 0.381 a^2 + d^2 - e^2 = cos(ø')e 0.960 2ad
ø 87.0 ( 80° < ø < 100° )ø' 89.7 ( 80° < ø' < 100° )
a 0.883 a^2 + b^2 - c^2 = cos(ø)b 0.636 2abc 1.098d 0.603 a^2 + d^2 - e^2 = cos(ø')e 1.054 2ad
ø 91.1 ( 85° < ø < 95° )ø' 88.3 ( 85° < ø' < 95° )
gf 0.050 g 0.000
NOTE: Values in parentheses are EPA Method 2 specifications.
Technician Signature Date
5/11/2009
D. g
( g < 1/32" ) 1/32" = 0.03125"
d
e
c
ø
ø'
a
b
a
b
d
e
cø
ø'
f( f < 1 /8" ) 1/8" = 0 .125"
A.
Transverse Tube Axis
B.
Longitudinal Tube Axis
C.
Air Tox Environmental Company inc.

Date: 5/11/2009 Thermocouple: PR 6-03.03.06
Amb Temp: 17 °C Barometric Pressure: 30.02
Reference: Organic-Filled (Kerosene) ASTM Glass Thermometer
Reference Point Temperature Test Reference Thermocouple Temperature Number Source Run Thermometer Potentiometer Difference
Number Temperature Temperature Percent0°C Ice Bath 1 -0.5 3 -1.28%
2 0 2 -0.73%3 0 2 -0.73%
100°C Boiling Water 1 99.8 103 -0.86%2 99.5 103 -0.94%3 99.5 103 -0.94%
The absolute values of the test themometers and the thermocouple must agree within ±1.5% Enter all temperatures in degrees Centigrade (°C).

Date: 5/11/2009 Thermocouple: PR 6-01.08.04
Amb Temp: 17 °C Barometric Pressure: 30.02
Reference: Organic-Filled (Kerosene) ASTM Glass Thermometer
Reference Point Temperature Test Reference Thermocouple Temperature Number Source Run Thermometer Potentiometer Difference
Number Temperature Temperature Percent0°C Ice Bath 1 -0.5 2 -0.92%
2 -0.5 2 -0.92%3 1 2 -0.36%
100°C Boiling Water 1 100 104 -1.07%2 99 103 -1.08%3 99.5 103 -0.94%
The absolute values of the test themometers and the thermocouple must agree within ±1.5% Enter all temperatures in degrees Centigrade (°C).

Method 26 Module Pre-Calibration
Method 26 Module #: M26 - 2 Standard Meter #: 5.01.05
Barometric Pressure: 29.46 Standard Meter Y: 0.982
Ambient Temperature: 73.00 Date: 7/18/2009
Volume (ft3)
Temp. (°F)Pressure (in. H2O)
Volume (ft3)
Standard Meter Y
Temp. In (°F)
Temp. Out (°F)
1 3.01 74 6.0 3.411 0.982 74 74 33.00 1.113
2 3.13 74 6.0 3.528 0.982 74 74 34.00 1.1073 3.01 75 5.0 3.433 0.982 75 75 33.00 1.120
Y= Vs(Pb+Ps/13.6)(Tm+460)Ys Vm(Pb +∆H/13.6)(Ts + 460)
Average Y: 1.113
Note: Standard Meter usually refers to a calibrated Method 5 module used as a reference
Acceptance criteria:Each Y must be + 0.02 from the average
Cubic Feet per Run WorkSheet Cubic Feet per Run WorkSheet for M-26 Meter: for Standard Meter:
Meter Reading
(ft3)
Volume (ft3)
Meter Reading
(ft3)
Volume (ft3)
Initial 990.76 990.76 Initial 443.543 443.543
1 993.77 3.01 1 446.954 3.4112 996.90 3.13 2 450.482 3.5283 999.91 3.01 3 453.915 3.433
Run
Method 26 Module
Run Method 26 Meter Y
Method 26 Module Standard MeterTime (min.)
Run
Standard Meter
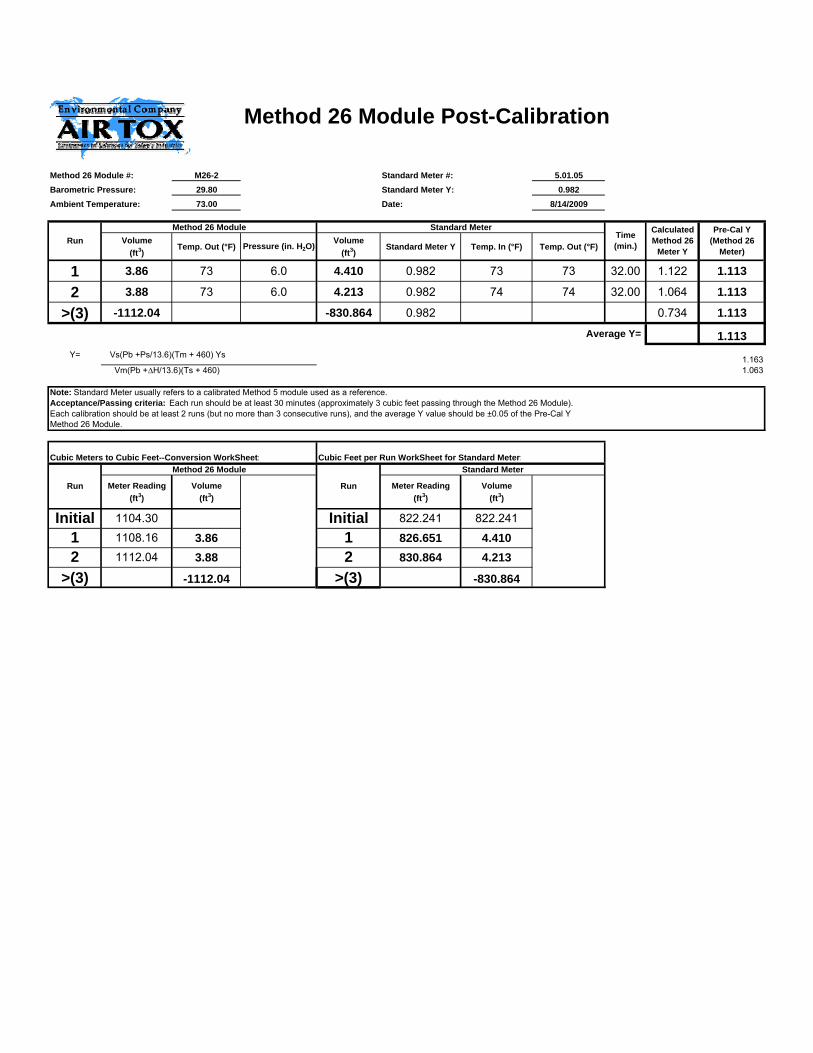
Method 26 Module Post-Calibration
Method 26 Module #: M26-2 Standard Meter #: 5.01.05Barometric Pressure: 29.80 Standard Meter Y: 0.982Ambient Temperature: 73.00 Date: 8/14/2009
Volume (ft3)
Temp. Out (°F) Pressure (in. H2O) Volume (ft3)
Standard Meter Y Temp. In (°F) Temp. Out (°F)
1 3.86 73 6.0 4.410 0.982 73 73 32.00 1.122 1.113
2 3.88 73 6.0 4.213 0.982 74 74 32.00 1.064 1.113
>(3) -1112.04 -830.864 0.982 0.734 1.113Average Y= 1.113
Y= Vs(Pb +Ps/13.6)(Tm + 460) Ys 1.163 Vm(Pb +∆H/13.6)(Ts + 460) 1.063
Note: Standard Meter usually refers to a calibrated Method 5 module used as a reference.Acceptance/Passing criteria: Each run should be at least 30 minutes (approximately 3 cubic feet passing through the Method 26 Module). Each calibration should be at least 2 runs (but no more than 3 consecutive runs), and the average Y value should be ±0.05 of the Pre-Cal Y Method 26 Module.
Cubic Meters to Cubic Feet--Conversion WorkSheet: Cubic Feet per Run WorkSheet for Standard Meter:
Meter Reading(ft3)
Volume (ft3)
Meter Reading(ft3)
Volume (ft3)
Initial 1104.30 Initial 822.241 822.241
1 1108.16 3.86 1 826.651 4.4102 1112.04 3.88 2 830.864 4.213
>(3) -1112.04 >(3) -830.864
Pre-Cal Y (Method 26
Meter)Run
Calculated Method 26
Meter Y
Method 26 Module Standard MeterTime (min.)
Run
Method 26 Module
Run
Standard Meter

Method 5 Module Calibration WorksheetPre-Test Calibration - Five Point
Module # 5.01.05 Run NumberDate 5/11/2009 1 2 3 4 5
Calibration Orifice # 1 2 3 4 5Orifice Coefficient (K') 0.447 0.520 0.655 0.923 0.975Final Vm (ft3) 583.923 601.855 621.156 636.993 647.315Initial Vm (ft3) 560.804 583.923 601.855 621.156 636.993Difference Vm (ft3) 23.119 17.932 19.301 15.837 10.322Inlet Temp. Initial (0F) 65 68 70 73 75 Final (0F) 68 70 73 76 79 Inlet Average (0F) 67 69 72 75 77Outlet Temp. Initial (0F) 65 67 67 69 70 Final (0F) 67 67 69 70 71 Outlet Average (0F) 66 67 68 70 71Average Meter Temp. (0F) 66 68 70 72 74Time (0.00 min) 39.00 26.00 22.00 13.00 8.00ΔH ("WC) 1.00 1.50 2.35 4.60 5.20Barometric Pressure ("Hg) 30.04 30.04 30.04 30.04 30.04Ambient Temp. (0F) 62 62 65 65 66Pump Vacuum ("Hg) 21.0 20.0 18.0 15.0 15.0Vm(std) cu. ft. 23.337 18.063 19.418 15.952 10.378Vcr(std) cu. ft. 22.921 17.776 18.892 15.731 10.216
Cal Factor (Y) - 0.982 0.984 0.973 0.986 0.984ΔH@ 1.648 1.826 1.814 1.801 1.827
(Yi) Difference ±0.02 0.000 -0.002 0.009 -0.004 -0.002ΔH@ Difference ±0.20 0.135 -0.042 -0.031 -0.017 -0.044
Averages
Cal Factor (Y) 0.982ΔH@ 1.783
Pre-Test Calibration: Perform one >10 cf run with each orifice.
Post-Test Calibration: Perform three >10 cf runs with orifice corresponding to average Delta H from test program.
Each Y must be within ±0.02 of average. Final Y must be greater than 0.97 and less than 1.03.
Individual ΔH@s must be ±0.20 from average.
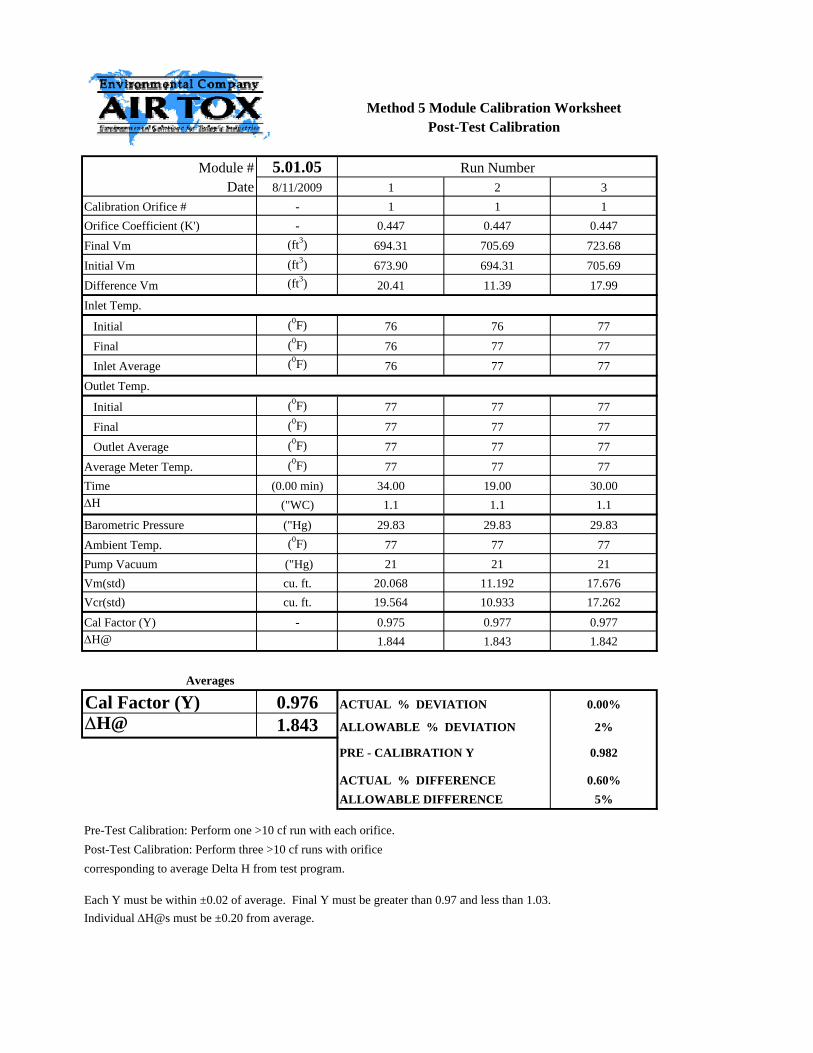
Method 5 Module Calibration WorksheetPost-Test Calibration
Module # 5.01.05 Run NumberDate 8/11/2009 1 2 3
Calibration Orifice # - 1 1 1Orifice Coefficient (K') - 0.447 0.447 0.447Final Vm (ft3) 694.31 705.69 723.68Initial Vm (ft3) 673.90 694.31 705.69Difference Vm (ft3) 20.41 11.39 17.99Inlet Temp.
Initial (0F) 76 76 77 Final (0F) 76 77 77 Inlet Average (0F) 76 77 77Outlet Temp.
Initial (0F) 77 77 77 Final (0F) 77 77 77 Outlet Average (0F) 77 77 77Average Meter Temp. (0F) 77 77 77Time (0.00 min) 34.00 19.00 30.00ΔH ("WC) 1.1 1.1 1.1Barometric Pressure ("Hg) 29.83 29.83 29.83Ambient Temp. (0F) 77 77 77Pump Vacuum ("Hg) 21 21 21Vm(std) cu. ft. 20.068 11.192 17.676Vcr(std) cu. ft. 19.564 10.933 17.262Cal Factor (Y) - 0.975 0.977 0.977ΔH@ 1.844 1.843 1.842
Averages
Cal Factor (Y) 0.976 ACTUAL % DEVIATION 0.00%
ΔH@ 1.843 ALLOWABLE % DEVIATION 2%
PRE - CALIBRATION Y 0.982
ACTUAL % DIFFERENCE 0.60%ALLOWABLE DIFFERENCE 5%
Pre-Test Calibration: Perform one >10 cf run with each orifice.Post-Test Calibration: Perform three >10 cf runs with orifice corresponding to average Delta H from test program.
Each Y must be within ±0.02 of average. Final Y must be greater than 0.97 and less than 1.03.Individual ΔH@s must be ±0.20 from average.
APPENDIX E Calibration Gas Cylinder Certifications

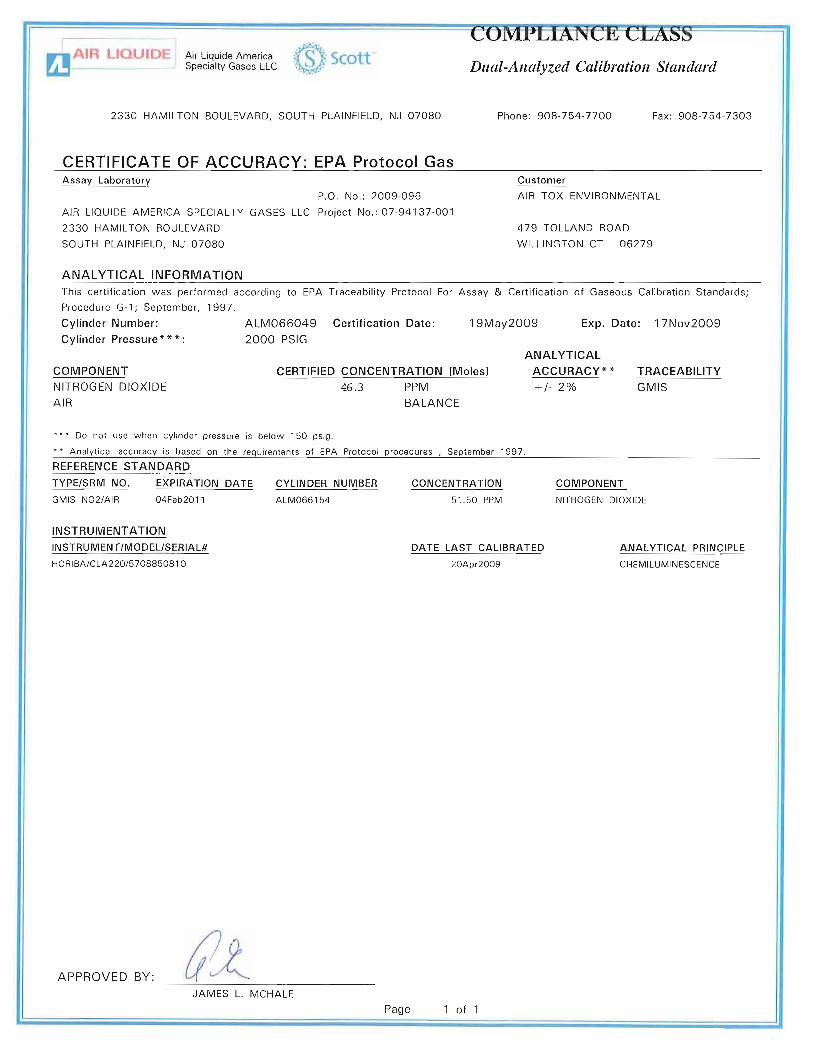

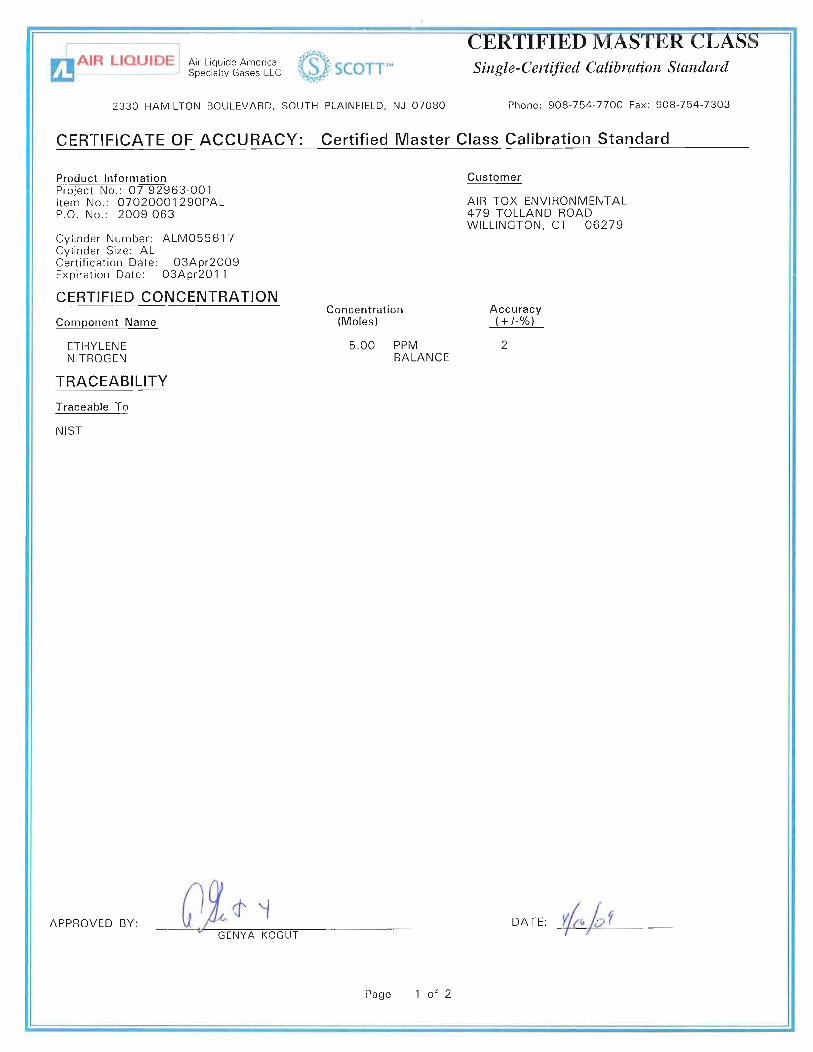


APPENDIX F
Process Data Sheets

APPENDIX F.1 Particulate Matter and Sulfuric Acid Testing
Process Data Sheets
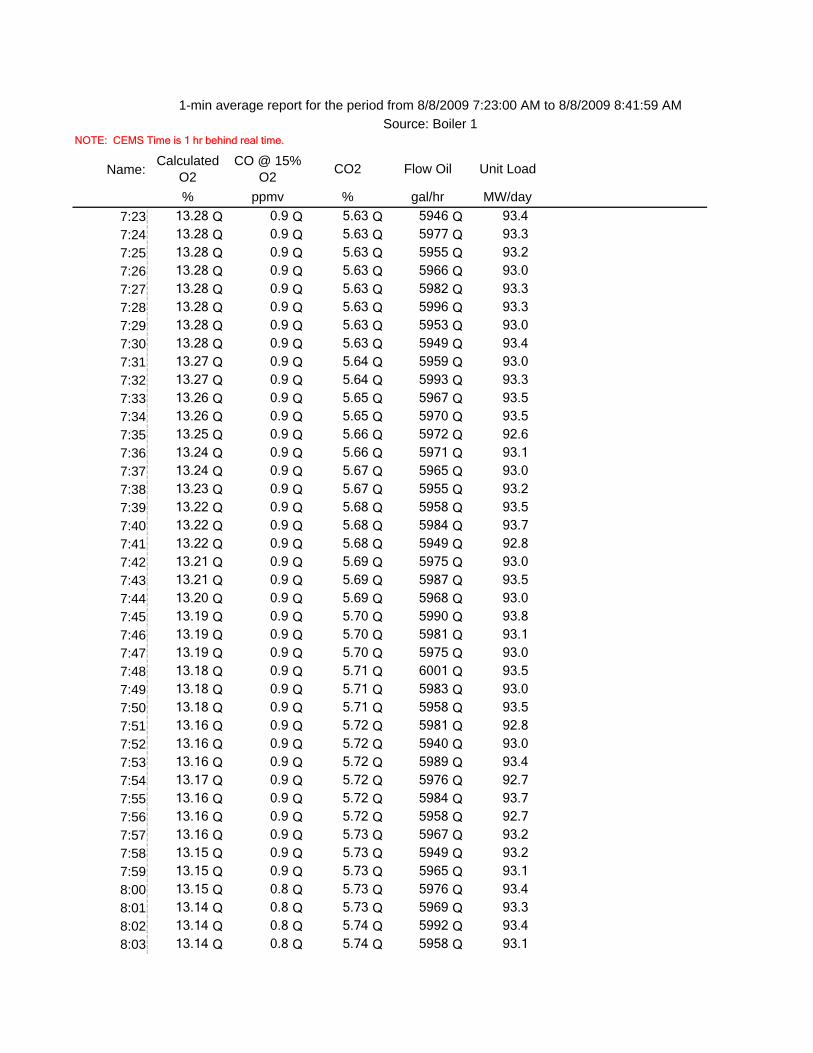
Name:
7:23 13.28 Q 0.9 Q 5.63 Q 5946 Q 93.4
7:24 13.28 Q 0.9 Q 5.63 Q 5977 Q 93.3
7:25 13.28 Q 0.9 Q 5.63 Q 5955 Q 93.2
7:26 13.28 Q 0.9 Q 5.63 Q 5966 Q 93.0
7:27 13.28 Q 0.9 Q 5.63 Q 5982 Q 93.3
7:28 13.28 Q 0.9 Q 5.63 Q 5996 Q 93.3
7:29 13.28 Q 0.9 Q 5.63 Q 5953 Q 93.0
7:30 13.28 Q 0.9 Q 5.63 Q 5949 Q 93.4
7:31 13.27 Q 0.9 Q 5.64 Q 5959 Q 93.0
7:32 13.27 Q 0.9 Q 5.64 Q 5993 Q 93.3
7:33 13.26 Q 0.9 Q 5.65 Q 5967 Q 93.5
7:34 13.26 Q 0.9 Q 5.65 Q 5970 Q 93.5
7:35 13.25 Q 0.9 Q 5.66 Q 5972 Q 92.6
7:36 13.24 Q 0.9 Q 5.66 Q 5971 Q 93.1
7:37 13.24 Q 0.9 Q 5.67 Q 5965 Q 93.0
7:38 13.23 Q 0.9 Q 5.67 Q 5955 Q 93.2
7:39 13.22 Q 0.9 Q 5.68 Q 5958 Q 93.5
7:40 13.22 Q 0.9 Q 5.68 Q 5984 Q 93.7
7:41 13.22 Q 0.9 Q 5.68 Q 5949 Q 92.8
7:42 13.21 Q 0.9 Q 5.69 Q 5975 Q 93.0
7:43 13.21 Q 0.9 Q 5.69 Q 5987 Q 93.5
7:44 13.20 Q 0.9 Q 5.69 Q 5968 Q 93.0
7:45 13.19 Q 0.9 Q 5.70 Q 5990 Q 93.8
7:46 13.19 Q 0.9 Q 5.70 Q 5981 Q 93.1
7:47 13.19 Q 0.9 Q 5.70 Q 5975 Q 93.0
7:48 13.18 Q 0.9 Q 5.71 Q 6001 Q 93.5
7:49 13.18 Q 0.9 Q 5.71 Q 5983 Q 93.0
7:50 13.18 Q 0.9 Q 5.71 Q 5958 Q 93.5
7:51 13.16 Q 0.9 Q 5.72 Q 5981 Q 92.8
7:52 13.16 Q 0.9 Q 5.72 Q 5940 Q 93.0
7:53 13.16 Q 0.9 Q 5.72 Q 5989 Q 93.4
7:54 13.17 Q 0.9 Q 5.72 Q 5976 Q 92.7
7:55 13.16 Q 0.9 Q 5.72 Q 5984 Q 93.7
7:56 13.16 Q 0.9 Q 5.72 Q 5958 Q 92.7
7:57 13.16 Q 0.9 Q 5.73 Q 5967 Q 93.2
7:58 13.15 Q 0.9 Q 5.73 Q 5949 Q 93.2
7:59 13.15 Q 0.9 Q 5.73 Q 5965 Q 93.1
8:00 13.15 Q 0.8 Q 5.73 Q 5976 Q 93.4
8:01 13.14 Q 0.8 Q 5.73 Q 5969 Q 93.3
8:02 13.14 Q 0.8 Q 5.74 Q 5992 Q 93.4
8:03 13.14 Q 0.8 Q 5.74 Q 5958 Q 93.1
NOTE: CEMS Time is 1 hr behind real time.
MW/day% ppmv % gal/hr
1-min average report for the period from 8/8/2009 7:23:00 AM to 8/8/2009 8:41:59 AMSource: Boiler 1
Calculated O2
CO @ 15% O2 CO2 Flow Oil Unit Load
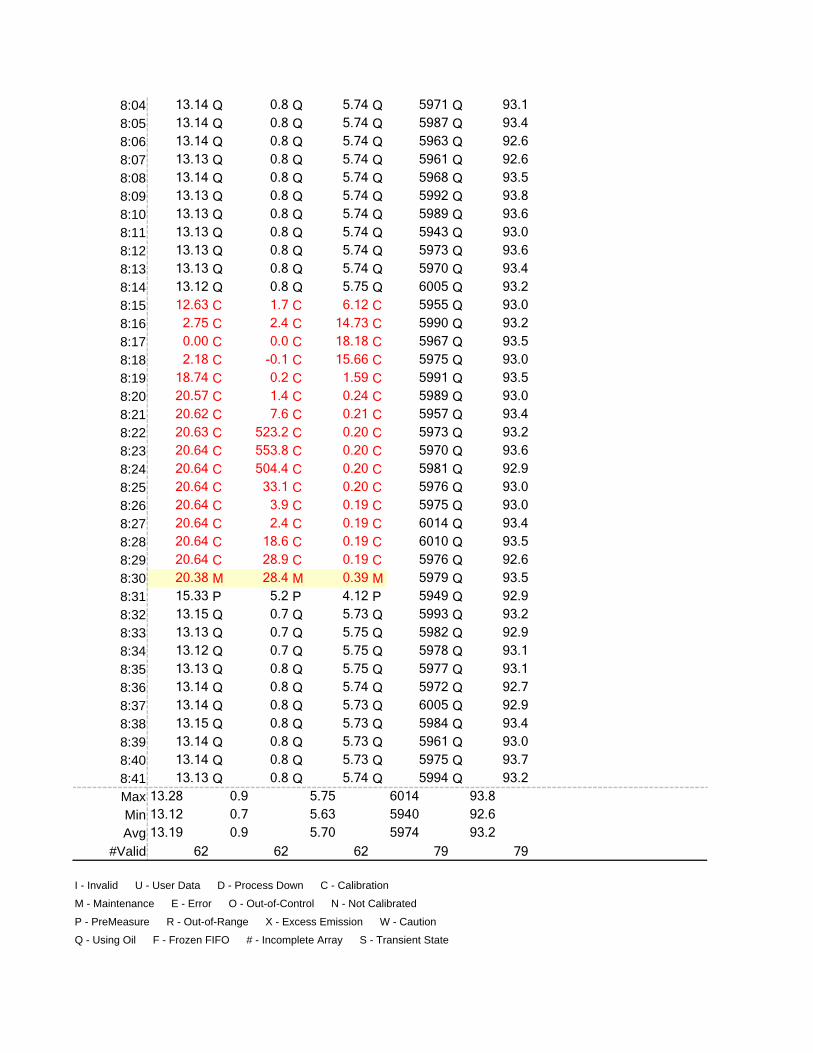
8:04 13.14 Q 0.8 Q 5.74 Q 5971 Q 93.1
8:05 13.14 Q 0.8 Q 5.74 Q 5987 Q 93.4
8:06 13.14 Q 0.8 Q 5.74 Q 5963 Q 92.6
8:07 13.13 Q 0.8 Q 5.74 Q 5961 Q 92.6
8:08 13.14 Q 0.8 Q 5.74 Q 5968 Q 93.5
8:09 13.13 Q 0.8 Q 5.74 Q 5992 Q 93.8
8:10 13.13 Q 0.8 Q 5.74 Q 5989 Q 93.6
8:11 13.13 Q 0.8 Q 5.74 Q 5943 Q 93.0
8:12 13.13 Q 0.8 Q 5.74 Q 5973 Q 93.6
8:13 13.13 Q 0.8 Q 5.74 Q 5970 Q 93.4
8:14 13.12 Q 0.8 Q 5.75 Q 6005 Q 93.2
8:15 12.63 C 1.7 C 6.12 C 5955 Q 93.0
8:16 2.75 C 2.4 C 14.73 C 5990 Q 93.2
8:17 0.00 C 0.0 C 18.18 C 5967 Q 93.5
8:18 2.18 C -0.1 C 15.66 C 5975 Q 93.0
8:19 18.74 C 0.2 C 1.59 C 5991 Q 93.5
8:20 20.57 C 1.4 C 0.24 C 5989 Q 93.0
8:21 20.62 C 7.6 C 0.21 C 5957 Q 93.4
8:22 20.63 C 523.2 C 0.20 C 5973 Q 93.2
8:23 20.64 C 553.8 C 0.20 C 5970 Q 93.6
8:24 20.64 C 504.4 C 0.20 C 5981 Q 92.9
8:25 20.64 C 33.1 C 0.20 C 5976 Q 93.0
8:26 20.64 C 3.9 C 0.19 C 5975 Q 93.0
8:27 20.64 C 2.4 C 0.19 C 6014 Q 93.4
8:28 20.64 C 18.6 C 0.19 C 6010 Q 93.5
8:29 20.64 C 28.9 C 0.19 C 5976 Q 92.6
8:30 20.38 M 28.4 M 0.39 M 5979 Q 93.5
8:31 15.33 P 5.2 P 4.12 P 5949 Q 92.9
8:32 13.15 Q 0.7 Q 5.73 Q 5993 Q 93.2
8:33 13.13 Q 0.7 Q 5.75 Q 5982 Q 92.9
8:34 13.12 Q 0.7 Q 5.75 Q 5978 Q 93.1
8:35 13.13 Q 0.8 Q 5.75 Q 5977 Q 93.1
8:36 13.14 Q 0.8 Q 5.74 Q 5972 Q 92.7
8:37 13.14 Q 0.8 Q 5.73 Q 6005 Q 92.9
8:38 13.15 Q 0.8 Q 5.73 Q 5984 Q 93.4
8:39 13.14 Q 0.8 Q 5.73 Q 5961 Q 93.0
8:40 13.14 Q 0.8 Q 5.73 Q 5975 Q 93.7
8:41 13.13 Q 0.8 Q 5.74 Q 5994 Q 93.2
Max 13.28 0.9 5.75 6014 93.8
Min 13.12 0.7 5.63 5940 92.6
Avg 13.19 0.9 5.70 5974 93.2
#Valid 62 62 62 79 79
Q - Using Oil �F - Frozen FIFO �# - Incomplete Array �S - Transient State
I - Invalid �U - User Data �D - Process Down �C - Calibration
M - Maintenance �E - Error �O - Out-of-Control �N - Not Calibrated
P - PreMeasure �R - Out-of-Range �X - Excess Emission �W - Caution
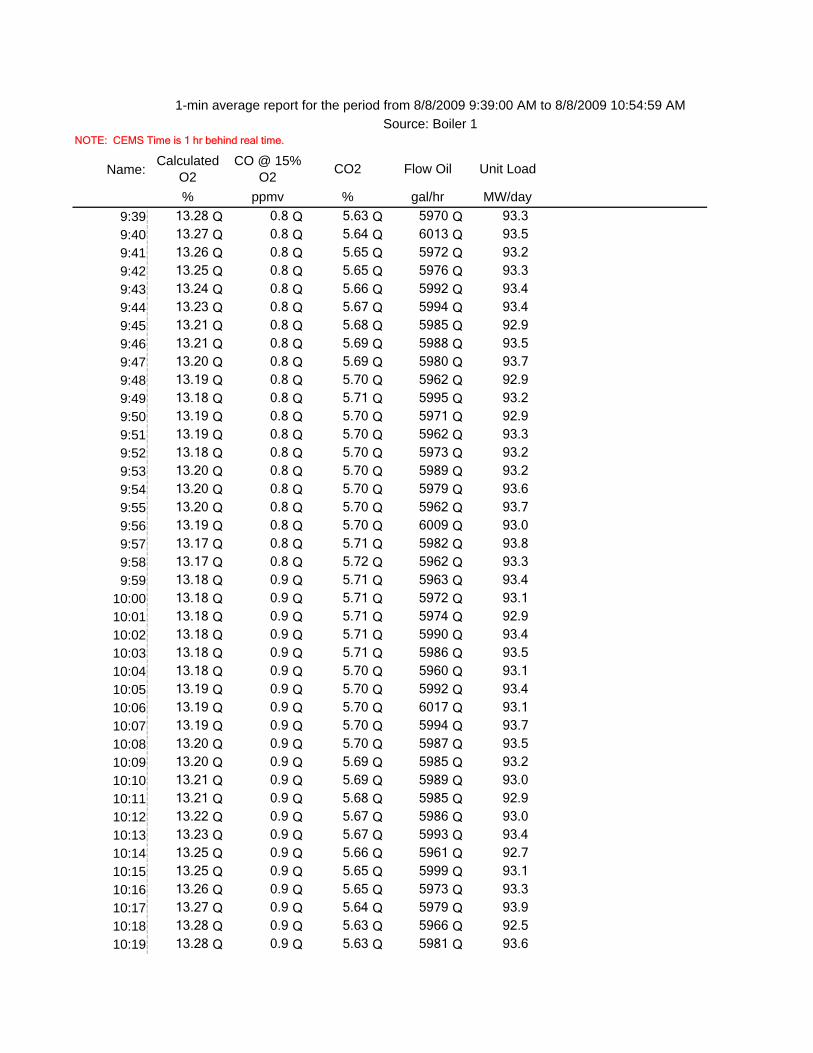
Name:
9:39 13.28 Q 0.8 Q 5.63 Q 5970 Q 93.3
9:40 13.27 Q 0.8 Q 5.64 Q 6013 Q 93.5
9:41 13.26 Q 0.8 Q 5.65 Q 5972 Q 93.2
9:42 13.25 Q 0.8 Q 5.65 Q 5976 Q 93.3
9:43 13.24 Q 0.8 Q 5.66 Q 5992 Q 93.4
9:44 13.23 Q 0.8 Q 5.67 Q 5994 Q 93.4
9:45 13.21 Q 0.8 Q 5.68 Q 5985 Q 92.9
9:46 13.21 Q 0.8 Q 5.69 Q 5988 Q 93.5
9:47 13.20 Q 0.8 Q 5.69 Q 5980 Q 93.7
9:48 13.19 Q 0.8 Q 5.70 Q 5962 Q 92.9
9:49 13.18 Q 0.8 Q 5.71 Q 5995 Q 93.2
9:50 13.19 Q 0.8 Q 5.70 Q 5971 Q 92.9
9:51 13.19 Q 0.8 Q 5.70 Q 5962 Q 93.3
9:52 13.18 Q 0.8 Q 5.70 Q 5973 Q 93.2
9:53 13.20 Q 0.8 Q 5.70 Q 5989 Q 93.2
9:54 13.20 Q 0.8 Q 5.70 Q 5979 Q 93.6
9:55 13.20 Q 0.8 Q 5.70 Q 5962 Q 93.7
9:56 13.19 Q 0.8 Q 5.70 Q 6009 Q 93.0
9:57 13.17 Q 0.8 Q 5.71 Q 5982 Q 93.8
9:58 13.17 Q 0.8 Q 5.72 Q 5962 Q 93.3
9:59 13.18 Q 0.9 Q 5.71 Q 5963 Q 93.4
10:00 13.18 Q 0.9 Q 5.71 Q 5972 Q 93.1
10:01 13.18 Q 0.9 Q 5.71 Q 5974 Q 92.9
10:02 13.18 Q 0.9 Q 5.71 Q 5990 Q 93.4
10:03 13.18 Q 0.9 Q 5.71 Q 5986 Q 93.5
10:04 13.18 Q 0.9 Q 5.70 Q 5960 Q 93.1
10:05 13.19 Q 0.9 Q 5.70 Q 5992 Q 93.4
10:06 13.19 Q 0.9 Q 5.70 Q 6017 Q 93.1
10:07 13.19 Q 0.9 Q 5.70 Q 5994 Q 93.7
10:08 13.20 Q 0.9 Q 5.70 Q 5987 Q 93.5
10:09 13.20 Q 0.9 Q 5.69 Q 5985 Q 93.2
10:10 13.21 Q 0.9 Q 5.69 Q 5989 Q 93.0
10:11 13.21 Q 0.9 Q 5.68 Q 5985 Q 92.9
10:12 13.22 Q 0.9 Q 5.67 Q 5986 Q 93.0
10:13 13.23 Q 0.9 Q 5.67 Q 5993 Q 93.4
10:14 13.25 Q 0.9 Q 5.66 Q 5961 Q 92.7
10:15 13.25 Q 0.9 Q 5.65 Q 5999 Q 93.1
10:16 13.26 Q 0.9 Q 5.65 Q 5973 Q 93.3
10:17 13.27 Q 0.9 Q 5.64 Q 5979 Q 93.9
10:18 13.28 Q 0.9 Q 5.63 Q 5966 Q 92.5
10:19 13.28 Q 0.9 Q 5.63 Q 5981 Q 93.6
NOTE: CEMS Time is 1 hr behind real time.
MW/day% ppmv % gal/hr
1-min average report for the period from 8/8/2009 9:39:00 AM to 8/8/2009 10:54:59 AMSource: Boiler 1
Calculated O2
CO @ 15% O2 CO2 Flow Oil Unit Load

10:20 13.29 Q 0.9 Q 5.62 Q 5986 Q 93.2
10:21 13.29 Q 1.0 Q 5.62 Q 5976 Q 93.0
10:22 13.30 Q 1.0 Q 5.62 Q 5995 Q 93.6
10:23 13.30 Q 0.9 Q 5.62 Q 5973 Q 93.5
10:24 13.31 Q 0.9 Q 5.61 Q 6002 Q 93.8
10:25 13.31 Q 1.0 Q 5.61 Q 5975 Q 93.2
10:26 13.31 Q 0.9 Q 5.61 Q 5990 Q 93.2
10:27 13.32 Q 1.0 Q 5.60 Q 5995 Q 93.2
10:28 13.32 Q 1.0 Q 5.61 Q 5979 Q 93.2
10:29 13.31 Q 1.0 Q 5.61 Q 5987 Q 93.8
10:30 13.31 Q 1.0 Q 5.61 Q 5991 Q 93.2
10:31 13.30 Q 1.0 Q 5.62 Q 6007 Q 93.1
10:32 13.30 Q 1.0 Q 5.62 Q 5972 Q 92.9
10:33 13.28 Q 1.0 Q 5.63 Q 5965 Q 92.8
10:34 13.28 Q 1.0 Q 5.64 Q 5983 Q 93.2
10:35 13.27 Q 0.9 Q 5.64 Q 5977 Q 93.0
10:36 13.26 Q 0.9 Q 5.65 Q 6000 Q 93.8
10:37 13.24 Q 0.9 Q 5.66 Q 5947 Q 92.9
10:38 13.23 Q 0.9 Q 5.67 Q 5989 Q 93.0
10:39 13.22 Q 0.9 Q 5.68 Q 5989 Q 93.2
10:40 13.20 Q 0.9 Q 5.69 Q 5974 Q 93.1
10:41 13.20 Q 0.9 Q 5.69 Q 5960 Q 93.2
10:42 13.19 Q 0.9 Q 5.70 Q 5998 Q 93.2
10:43 13.18 Q 0.9 Q 5.71 Q 5973 Q 93.1
10:44 13.17 Q 0.9 Q 5.71 Q 5965 Q 93.4
10:45 13.16 Q 0.9 Q 5.72 Q 5983 Q 93.2
10:46 13.16 Q 0.9 Q 5.72 Q 5995 Q 93.2
10:47 13.15 Q 0.9 Q 5.73 Q 5970 Q 93.5
10:48 13.15 Q 0.9 Q 5.73 Q 5986 Q 93.2
10:49 13.15 Q 0.9 Q 5.73 Q 5988 Q 93.5
10:50 13.15 Q 0.9 Q 5.73 Q 5963 Q 92.7
10:51 13.15 Q 0.9 Q 5.73 Q 5986 Q 92.9
10:52 13.15 Q 0.9 Q 5.73 Q 5976 Q 93.6
10:53 13.15 Q 0.9 Q 5.73 Q 5964 Q 93.4
10:54 13.15 Q 0.9 Q 5.73 Q 5957 Q 93.0
Max 13.32 1.0 5.73 6017 93.9
Min 13.15 0.8 5.60 5947 92.5
Avg 13.22 0.9 5.68 5981 93.2
#Valid 76 76 76 76 76
Q - Using Oil �F - Frozen FIFO �# - Incomplete Array �S - Transient State
I - Invalid �U - User Data �D - Process Down �C - Calibration
M - Maintenance �E - Error �O - Out-of-Control �N - Not Calibrated
P - PreMeasure �R - Out-of-Range �X - Excess Emission �W - Caution
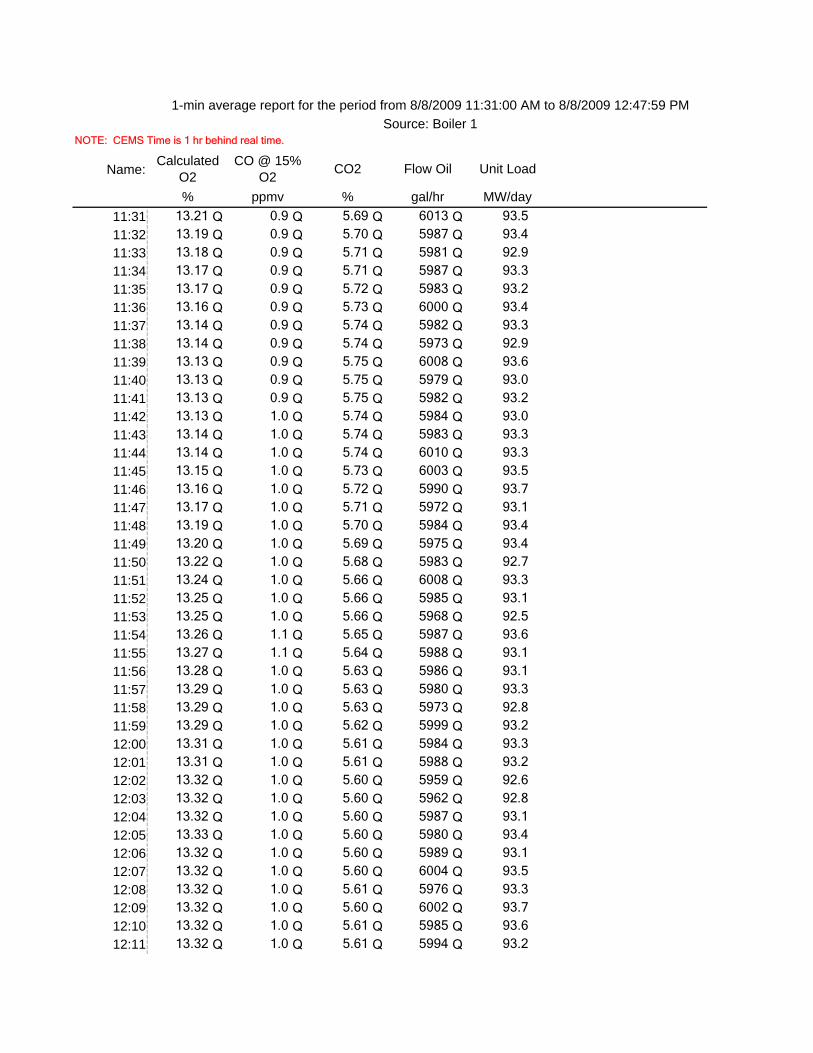
Name:
11:31 13.21 Q 0.9 Q 5.69 Q 6013 Q 93.5
11:32 13.19 Q 0.9 Q 5.70 Q 5987 Q 93.4
11:33 13.18 Q 0.9 Q 5.71 Q 5981 Q 92.9
11:34 13.17 Q 0.9 Q 5.71 Q 5987 Q 93.3
11:35 13.17 Q 0.9 Q 5.72 Q 5983 Q 93.2
11:36 13.16 Q 0.9 Q 5.73 Q 6000 Q 93.4
11:37 13.14 Q 0.9 Q 5.74 Q 5982 Q 93.3
11:38 13.14 Q 0.9 Q 5.74 Q 5973 Q 92.9
11:39 13.13 Q 0.9 Q 5.75 Q 6008 Q 93.6
11:40 13.13 Q 0.9 Q 5.75 Q 5979 Q 93.0
11:41 13.13 Q 0.9 Q 5.75 Q 5982 Q 93.2
11:42 13.13 Q 1.0 Q 5.74 Q 5984 Q 93.0
11:43 13.14 Q 1.0 Q 5.74 Q 5983 Q 93.3
11:44 13.14 Q 1.0 Q 5.74 Q 6010 Q 93.3
11:45 13.15 Q 1.0 Q 5.73 Q 6003 Q 93.5
11:46 13.16 Q 1.0 Q 5.72 Q 5990 Q 93.7
11:47 13.17 Q 1.0 Q 5.71 Q 5972 Q 93.1
11:48 13.19 Q 1.0 Q 5.70 Q 5984 Q 93.4
11:49 13.20 Q 1.0 Q 5.69 Q 5975 Q 93.4
11:50 13.22 Q 1.0 Q 5.68 Q 5983 Q 92.7
11:51 13.24 Q 1.0 Q 5.66 Q 6008 Q 93.3
11:52 13.25 Q 1.0 Q 5.66 Q 5985 Q 93.1
11:53 13.25 Q 1.0 Q 5.66 Q 5968 Q 92.5
11:54 13.26 Q 1.1 Q 5.65 Q 5987 Q 93.6
11:55 13.27 Q 1.1 Q 5.64 Q 5988 Q 93.1
11:56 13.28 Q 1.0 Q 5.63 Q 5986 Q 93.1
11:57 13.29 Q 1.0 Q 5.63 Q 5980 Q 93.3
11:58 13.29 Q 1.0 Q 5.63 Q 5973 Q 92.8
11:59 13.29 Q 1.0 Q 5.62 Q 5999 Q 93.2
12:00 13.31 Q 1.0 Q 5.61 Q 5984 Q 93.3
12:01 13.31 Q 1.0 Q 5.61 Q 5988 Q 93.2
12:02 13.32 Q 1.0 Q 5.60 Q 5959 Q 92.6
12:03 13.32 Q 1.0 Q 5.60 Q 5962 Q 92.8
12:04 13.32 Q 1.0 Q 5.60 Q 5987 Q 93.1
12:05 13.33 Q 1.0 Q 5.60 Q 5980 Q 93.4
12:06 13.32 Q 1.0 Q 5.60 Q 5989 Q 93.1
12:07 13.32 Q 1.0 Q 5.60 Q 6004 Q 93.5
12:08 13.32 Q 1.0 Q 5.61 Q 5976 Q 93.3
12:09 13.32 Q 1.0 Q 5.60 Q 6002 Q 93.7
12:10 13.32 Q 1.0 Q 5.61 Q 5985 Q 93.6
12:11 13.32 Q 1.0 Q 5.61 Q 5994 Q 93.2
NOTE: CEMS Time is 1 hr behind real time.
MW/day% ppmv % gal/hr
1-min average report for the period from 8/8/2009 11:31:00 AM to 8/8/2009 12:47:59 PMSource: Boiler 1
Calculated O2
CO @ 15% O2 CO2 Flow Oil Unit Load
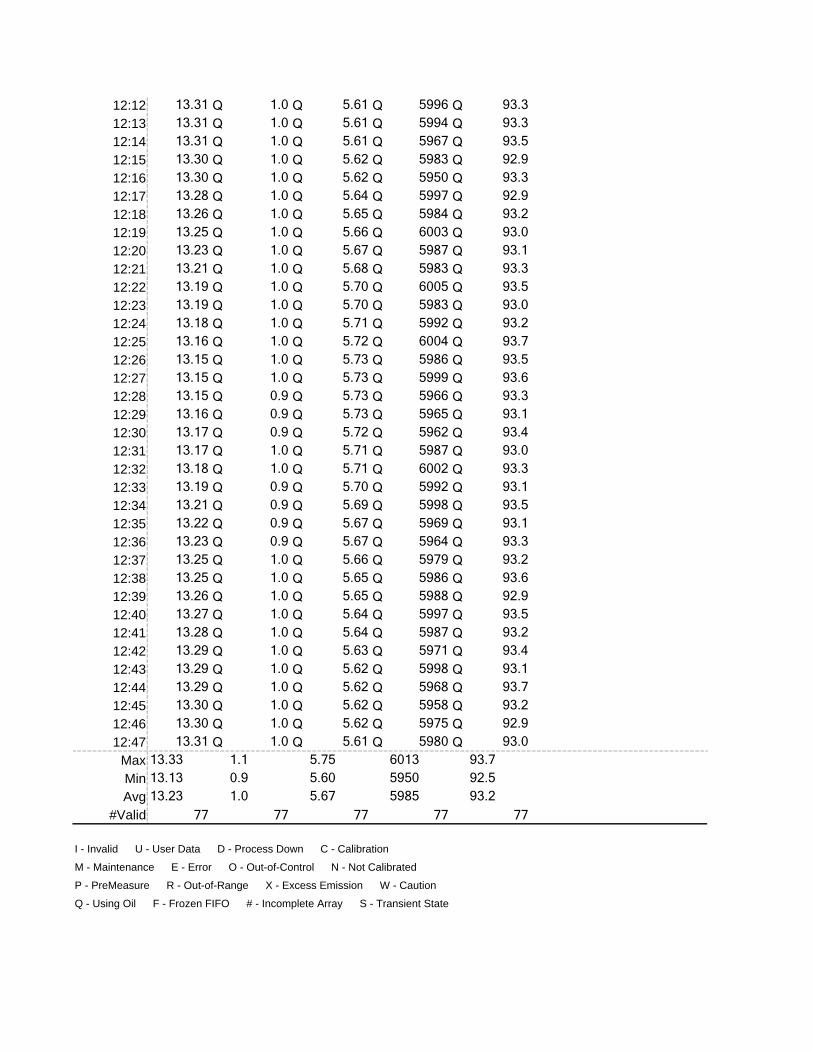
12:12 13.31 Q 1.0 Q 5.61 Q 5996 Q 93.3
12:13 13.31 Q 1.0 Q 5.61 Q 5994 Q 93.3
12:14 13.31 Q 1.0 Q 5.61 Q 5967 Q 93.5
12:15 13.30 Q 1.0 Q 5.62 Q 5983 Q 92.9
12:16 13.30 Q 1.0 Q 5.62 Q 5950 Q 93.3
12:17 13.28 Q 1.0 Q 5.64 Q 5997 Q 92.9
12:18 13.26 Q 1.0 Q 5.65 Q 5984 Q 93.2
12:19 13.25 Q 1.0 Q 5.66 Q 6003 Q 93.0
12:20 13.23 Q 1.0 Q 5.67 Q 5987 Q 93.1
12:21 13.21 Q 1.0 Q 5.68 Q 5983 Q 93.3
12:22 13.19 Q 1.0 Q 5.70 Q 6005 Q 93.5
12:23 13.19 Q 1.0 Q 5.70 Q 5983 Q 93.0
12:24 13.18 Q 1.0 Q 5.71 Q 5992 Q 93.2
12:25 13.16 Q 1.0 Q 5.72 Q 6004 Q 93.7
12:26 13.15 Q 1.0 Q 5.73 Q 5986 Q 93.5
12:27 13.15 Q 1.0 Q 5.73 Q 5999 Q 93.6
12:28 13.15 Q 0.9 Q 5.73 Q 5966 Q 93.3
12:29 13.16 Q 0.9 Q 5.73 Q 5965 Q 93.1
12:30 13.17 Q 0.9 Q 5.72 Q 5962 Q 93.4
12:31 13.17 Q 1.0 Q 5.71 Q 5987 Q 93.0
12:32 13.18 Q 1.0 Q 5.71 Q 6002 Q 93.3
12:33 13.19 Q 0.9 Q 5.70 Q 5992 Q 93.1
12:34 13.21 Q 0.9 Q 5.69 Q 5998 Q 93.5
12:35 13.22 Q 0.9 Q 5.67 Q 5969 Q 93.1
12:36 13.23 Q 0.9 Q 5.67 Q 5964 Q 93.3
12:37 13.25 Q 1.0 Q 5.66 Q 5979 Q 93.2
12:38 13.25 Q 1.0 Q 5.65 Q 5986 Q 93.6
12:39 13.26 Q 1.0 Q 5.65 Q 5988 Q 92.9
12:40 13.27 Q 1.0 Q 5.64 Q 5997 Q 93.5
12:41 13.28 Q 1.0 Q 5.64 Q 5987 Q 93.2
12:42 13.29 Q 1.0 Q 5.63 Q 5971 Q 93.4
12:43 13.29 Q 1.0 Q 5.62 Q 5998 Q 93.1
12:44 13.29 Q 1.0 Q 5.62 Q 5968 Q 93.7
12:45 13.30 Q 1.0 Q 5.62 Q 5958 Q 93.2
12:46 13.30 Q 1.0 Q 5.62 Q 5975 Q 92.9
12:47 13.31 Q 1.0 Q 5.61 Q 5980 Q 93.0
Max 13.33 1.1 5.75 6013 93.7
Min 13.13 0.9 5.60 5950 92.5
Avg 13.23 1.0 5.67 5985 93.2
#Valid 77 77 77 77 77
Q - Using Oil �F - Frozen FIFO �# - Incomplete Array �S - Transient State
I - Invalid �U - User Data �D - Process Down �C - Calibration
M - Maintenance �E - Error �O - Out-of-Control �N - Not Calibrated
P - PreMeasure �R - Out-of-Range �X - Excess Emission �W - Caution
APPENDIX F.2 HAP Testing
(Formaldehyde, Benzene, 1, 3 Butadiene) Process Data Sheets

Name:
7:30 13.18 Q 0.7 Q 5.71 Q 5988 Q 93.3
7:31 13.17 Q 0.7 Q 5.71 Q 5950 Q 92.7
7:32 13.16 Q 0.7 Q 5.72 Q 5963 Q 93.4
7:33 13.15 Q 0.7 Q 5.73 Q 5953 Q 92.8
7:34 13.14 Q 0.7 Q 5.73 Q 5950 Q 92.8
7:35 13.14 Q 0.7 Q 5.74 Q 5963 Q 93.3
7:36 13.14 Q 0.7 Q 5.74 Q 5975 Q 93.2
7:37 13.13 Q 0.7 Q 5.75 Q 5945 Q 92.8
7:38 13.13 Q 0.7 Q 5.75 Q 6010 Q 93.5
7:39 13.12 Q 0.7 Q 5.75 Q 5950 Q 93.1
7:40 13.12 Q 0.7 Q 5.75 Q 5955 Q 92.7
7:41 13.12 Q 0.7 Q 5.75 Q 5954 Q 93.5
7:42 13.11 Q 0.7 Q 5.76 Q 5988 Q 93.4
7:43 13.10 Q 0.7 Q 5.77 Q 5967 Q 92.8
7:44 13.10 Q 0.7 Q 5.77 Q 5967 Q 93.2
7:45 13.09 Q 0.7 Q 5.78 Q 5974 Q 92.6
7:46 13.08 Q 0.7 Q 5.78 Q 5973 Q 93.2
7:47 13.08 Q 0.7 Q 5.78 Q 5968 Q 92.9
7:48 13.08 Q 0.7 Q 5.78 Q 5971 Q 93.2
7:49 13.08 Q 0.7 Q 5.78 Q 6000 Q 93.1
7:50 13.07 Q 0.7 Q 5.79 Q 5965 Q 93.2
7:51 13.07 Q 0.7 Q 5.79 Q 5967 Q 93.7
7:52 13.07 Q 0.7 Q 5.79 Q 5940 Q 92.5
7:53 13.08 Q 0.7 Q 5.78 Q 5975 Q 93.5
7:54 13.09 Q 0.7 Q 5.77 Q 5959 Q 93.1
7:55 13.10 Q 0.7 Q 5.77 Q 5978 Q 93.3
7:56 13.10 Q 0.7 Q 5.77 Q 5969 Q 93.2
7:57 13.09 Q 0.7 Q 5.77 Q 5996 Q 93.7
7:58 13.10 Q 0.7 Q 5.77 Q 5968 Q 93.3
7:59 13.10 Q 0.7 Q 5.77 Q 5975 Q 93.2
8:00 13.08 Q 0.7 Q 5.78 Q 5966 Q 93.4
8:01 13.09 Q 0.7 Q 5.78 Q 5973 Q 93.7
8:02 13.08 Q 0.7 Q 5.78 Q 5950 Q 93.0
8:03 13.08 Q 0.7 Q 5.78 Q 5966 Q 92.9
8:04 13.09 Q 0.7 Q 5.78 Q 5997 Q 93.5
8:05 13.08 Q 0.7 Q 5.78 Q 5951 Q 93.0
8:06 13.08 Q 0.7 Q 5.78 Q 5917 Q 93.2
8:07 13.08 Q 0.7 Q 5.78 Q 5968 Q 93.5
8:08 13.09 Q 0.7 Q 5.78 Q 5940 Q 92.8
8:09 13.08 Q 0.7 Q 5.78 Q 5942 Q 93.4
8:10 13.08 Q 0.7 Q 5.78 Q 5934 Q 92.4
*NOTE: CEMS Time is 1 hr behind real time.
MW/day% ppmv % gal/hr
1-min average report for the period from 8/7/2009 7:30:00 AM to 8/7/2009 8:30:59 AMSource: Boiler 1
Calculated O2
CO @ 15% O2 CO2 Flow Oil Unit Load
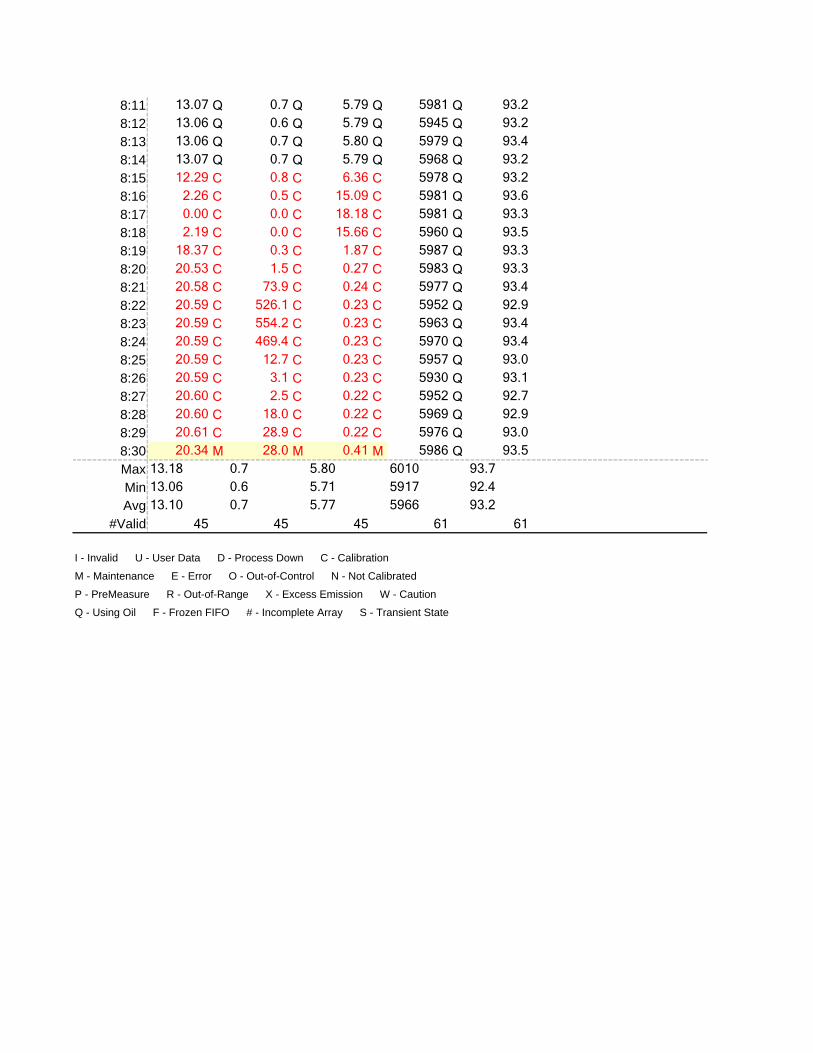
8:11 13.07 Q 0.7 Q 5.79 Q 5981 Q 93.2
8:12 13.06 Q 0.6 Q 5.79 Q 5945 Q 93.2
8:13 13.06 Q 0.7 Q 5.80 Q 5979 Q 93.4
8:14 13.07 Q 0.7 Q 5.79 Q 5968 Q 93.2
8:15 12.29 C 0.8 C 6.36 C 5978 Q 93.2
8:16 2.26 C 0.5 C 15.09 C 5981 Q 93.6
8:17 0.00 C 0.0 C 18.18 C 5981 Q 93.3
8:18 2.19 C 0.0 C 15.66 C 5960 Q 93.5
8:19 18.37 C 0.3 C 1.87 C 5987 Q 93.3
8:20 20.53 C 1.5 C 0.27 C 5983 Q 93.3
8:21 20.58 C 73.9 C 0.24 C 5977 Q 93.4
8:22 20.59 C 526.1 C 0.23 C 5952 Q 92.9
8:23 20.59 C 554.2 C 0.23 C 5963 Q 93.4
8:24 20.59 C 469.4 C 0.23 C 5970 Q 93.4
8:25 20.59 C 12.7 C 0.23 C 5957 Q 93.0
8:26 20.59 C 3.1 C 0.23 C 5930 Q 93.1
8:27 20.60 C 2.5 C 0.22 C 5952 Q 92.7
8:28 20.60 C 18.0 C 0.22 C 5969 Q 92.9
8:29 20.61 C 28.9 C 0.22 C 5976 Q 93.0
8:30 20.34 M 28.0 M 0.41 M 5986 Q 93.5
Max 13.18 0.7 5.80 6010 93.7
Min 13.06 0.6 5.71 5917 92.4
Avg 13.10 0.7 5.77 5966 93.2
#Valid 45 45 45 61 61
Q - Using Oil �F - Frozen FIFO �# - Incomplete Array �S - Transient State
I - Invalid �U - User Data �D - Process Down �C - Calibration
M - Maintenance �E - Error �O - Out-of-Control �N - Not Calibrated
P - PreMeasure �R - Out-of-Range �X - Excess Emission �W - Caution

Name:
9:17 13.16 Q 0.7 Q 5.72 Q 5993 Q 93.5
9:18 13.17 Q 0.7 Q 5.72 Q 5976 Q 93.1
9:19 13.16 Q 0.7 Q 5.72 Q 5994 Q 92.9
9:20 13.16 Q 0.7 Q 5.72 Q 5960 Q 93.3
9:21 13.17 Q 0.7 Q 5.72 Q 5977 Q 92.8
9:22 13.16 Q 0.7 Q 5.72 Q 5951 Q 92.6
9:23 13.16 Q 0.7 Q 5.72 Q 5949 Q 93.3
9:24 13.16 Q 0.7 Q 5.72 Q 5981 Q 94.3
9:25 13.15 Q 0.7 Q 5.73 Q 6002 Q 94.1
9:26 13.15 Q 0.7 Q 5.73 Q 5973 Q 93.0
9:27 13.15 Q 0.7 Q 5.73 Q 5982 Q 93.3
9:28 13.14 Q 0.7 Q 5.74 Q 5965 Q 93.2
9:29 13.15 Q 0.7 Q 5.73 Q 5974 Q 93.6
9:30 13.15 Q 0.7 Q 5.73 Q 5988 Q 93.2
9:31 13.14 Q 0.7 Q 5.74 Q 5976 Q 93.0
9:32 13.14 Q 0.7 Q 5.74 Q 5965 Q 93.2
9:33 13.14 Q 0.7 Q 5.74 Q 5961 Q 93.1
9:34 13.14 Q 0.7 Q 5.74 Q 5950 Q 92.9
9:35 13.14 Q 0.7 Q 5.74 Q 5981 Q 93.0
9:36 13.13 Q 0.7 Q 5.74 Q 5986 Q 93.6
9:37 13.13 Q 0.7 Q 5.75 Q 5962 Q 93.1
9:38 13.12 Q 0.7 Q 5.75 Q 5971 Q 93.1
9:39 13.12 Q 0.7 Q 5.75 Q 5980 Q 93.1
9:40 13.12 Q 0.7 Q 5.75 Q 5978 Q 93.7
9:41 13.13 Q 0.7 Q 5.75 Q 5954 Q 93.1
9:42 13.13 Q 0.7 Q 5.75 Q 5979 Q 93.0
9:43 13.12 Q 0.7 Q 5.75 Q 5970 Q 92.9
9:44 13.12 Q 0.7 Q 5.75 Q 5991 Q 93.4
9:45 13.12 Q 0.7 Q 5.76 Q 5957 Q 92.8
9:46 13.12 Q 0.7 Q 5.75 Q 5965 Q 93.4
9:47 13.12 Q 0.7 Q 5.75 Q 5965 Q 93.0
9:48 13.12 Q 0.7 Q 5.75 Q 6014 Q 93.8
9:49 13.11 Q 0.7 Q 5.76 Q 5953 Q 92.9
9:50 13.12 Q 0.7 Q 5.75 Q 5981 Q 93.2
9:51 13.12 Q 0.7 Q 5.75 Q 5994 Q 93.4
9:52 13.12 Q 0.7 Q 5.75 Q 5984 Q 93.4
9:53 13.10 Q 0.7 Q 5.77 Q 5993 Q 93.3
9:54 13.10 Q 0.7 Q 5.76 Q 5973 Q 93.6
9:55 13.11 Q 0.7 Q 5.76 Q 5975 Q 93.3
9:56 13.12 Q 0.7 Q 5.75 Q 5975 Q 93.4
9:57 13.12 Q 0.7 Q 5.75 Q 5972 Q 92.9
NOTE: CEMS Time is 1 hr behind real time.
MW/day% ppmv % gal/hr
1-min average report for the period from 8/7/2009 9:17:00 AM to 8/7/2009 10:17:59 AMSource: Boiler 1
Calculated O2
CO @ 15% O2 CO2 Flow Oil Unit Load

9:58 13.11 Q 0.7 Q 5.76 Q 5967 Q 93.3
9:59 13.11 Q 0.7 Q 5.76 Q 5985 Q 93.3
10:00 13.12 Q 0.7 Q 5.75 Q 5991 Q 93.7
10:01 13.13 Q 0.7 Q 5.74 Q 5983 Q 93.5
10:02 13.14 Q 0.7 Q 5.74 Q 5989 Q 94.0
10:03 13.14 Q 0.7 Q 5.73 Q 5986 Q 93.4
10:04 13.16 Q 0.7 Q 5.72 Q 5975 Q 93.1
10:05 13.16 Q 0.7 Q 5.72 Q 5974 Q 94.1
10:06 13.17 Q 0.7 Q 5.72 Q 5971 Q 93.8
10:07 13.18 Q 0.7 Q 5.71 Q 5984 Q 93.4
10:08 13.20 Q 0.7 Q 5.69 Q 5954 Q 93.3
10:09 13.21 Q 0.7 Q 5.69 Q 5961 Q 92.9
10:10 13.21 Q 0.7 Q 5.69 Q 5992 Q 93.6
10:11 13.22 Q 0.7 Q 5.68 Q 6006 Q 93.3
10:12 13.22 Q 0.7 Q 5.67 Q 5999 Q 93.4
10:13 13.23 Q 0.7 Q 5.67 Q 5974 Q 93.0
10:14 13.24 Q 0.7 Q 5.66 Q 5976 Q 93.4
10:15 13.24 Q 0.7 Q 5.66 Q 5975 Q 93.7
10:16 13.25 Q 0.7 Q 5.66 Q 5971 Q 93.2
10:17 13.25 Q 0.7 Q 5.66 Q 5974 Q 92.6
Max 13.25 0.7 5.77 6014 94.3
Min 13.10 0.7 5.66 5949 92.6
Avg 13.15 0.7 5.73 5976 93.3
#Valid 61 61 61 61 61
Q - Using Oil �F - Frozen FIFO �# - Incomplete Array �S - Transient State
I - Invalid �U - User Data �D - Process Down �C - Calibration
M - Maintenance �E - Error �O - Out-of-Control �N - Not Calibrated
P - PreMeasure �R - Out-of-Range �X - Excess Emission �W - Caution

Name:
11:10 13.27 Q 0.7 Q 5.64 Q 5988 Q 93.0
11:11 13.27 Q 0.7 Q 5.64 Q 5993 Q 93.4
11:12 13.27 Q 0.7 Q 5.64 Q 5971 Q 92.9
11:13 13.26 Q 0.7 Q 5.65 Q 5954 Q 93.2
11:14 13.27 Q 0.7 Q 5.64 Q 6008 Q 93.8
11:15 13.25 Q 0.7 Q 5.65 Q 5993 Q 93.5
11:16 13.24 Q 0.7 Q 5.66 Q 5989 Q 93.2
11:17 13.23 Q 0.7 Q 5.67 Q 6018 Q 93.7
11:18 13.22 Q 0.7 Q 5.68 Q 5983 Q 93.3
11:19 13.19 Q 0.7 Q 5.70 Q 5963 Q 92.9
11:20 13.19 Q 0.7 Q 5.70 Q 5965 Q 93.6
11:21 13.17 Q 0.7 Q 5.71 Q 5960 Q 93.1
11:22 13.16 Q 0.7 Q 5.72 Q 5988 Q 93.1
11:23 13.14 Q 0.7 Q 5.74 Q 6017 Q 93.0
11:24 13.11 Q 0.7 Q 5.76 Q 6002 Q 93.0
11:25 13.10 Q 0.7 Q 5.77 Q 6013 Q 93.5
11:26 13.08 Q 0.7 Q 5.78 Q 5965 Q 93.9
11:27 13.07 Q 0.7 Q 5.79 Q 5971 Q 93.6
11:28 13.06 Q 0.7 Q 5.79 Q 5985 Q 93.2
11:29 13.06 Q 0.7 Q 5.79 Q 5973 Q 93.1
11:30 13.06 Q 0.7 Q 5.80 Q 5965 Q 93.4
11:31 13.05 Q 0.7 Q 5.81 Q 5988 Q 93.4
11:32 13.05 Q 0.7 Q 5.81 Q 5995 Q 93.2
11:33 13.04 Q 0.7 Q 5.81 Q 5945 Q 92.8
11:34 13.05 Q 0.7 Q 5.80 Q 5962 Q 92.9
11:35 13.06 Q 0.7 Q 5.79 Q 5984 Q 93.3
11:36 13.08 Q 0.7 Q 5.78 Q 5971 Q 93.0
11:37 13.07 Q 0.7 Q 5.79 Q 5975 Q 93.4
11:38 13.07 Q 0.7 Q 5.79 Q 5976 Q 93.5
11:39 13.08 Q 0.7 Q 5.78 Q 6006 Q 94.2
11:40 13.10 Q 0.7 Q 5.77 Q 5997 Q 93.4
11:41 13.12 Q 0.7 Q 5.76 Q 5973 Q 93.5
11:42 13.13 Q 0.8 Q 5.74 Q 5965 Q 92.9
11:43 13.15 Q 0.7 Q 5.73 Q 5968 Q 92.6
11:44 13.16 Q 0.7 Q 5.72 Q 5994 Q 93.2
11:45 13.18 Q 0.8 Q 5.71 Q 5975 Q 93.3
11:46 13.19 Q 0.8 Q 5.70 Q 5986 Q 93.8
11:47 13.21 Q 0.8 Q 5.69 Q 5994 Q 93.6
11:48 13.21 Q 0.8 Q 5.69 Q 5987 Q 93.2
11:49 13.22 Q 0.8 Q 5.68 Q 5989 Q 93.0
11:50 13.23 Q 0.8 Q 5.67 Q 5982 Q 93.0
NOTE: CEMS Time is 1 hr behind real time.
MW/day% ppmv % gal/hr
1-min average report for the period from 8/7/2009 11:10:00 AM to 8/7/2009 12:10:59 PMSource: Boiler 1
Calculated O2
CO @ 15% O2 CO2 Flow Oil Unit Load

11:51 13.24 Q 0.8 Q 5.67 Q 5975 Q 93.2
11:52 13.23 Q 0.8 Q 5.67 Q 6014 Q 93.8
11:53 13.24 Q 0.8 Q 5.66 Q 5983 Q 93.4
11:54 13.25 Q 0.8 Q 5.66 Q 5980 Q 93.5
11:55 13.25 Q 0.8 Q 5.66 Q 5968 Q 92.9
11:56 13.26 Q 0.8 Q 5.65 Q 5996 Q 93.3
11:57 13.27 Q 0.8 Q 5.64 Q 5980 Q 93.1
11:58 13.28 Q 0.8 Q 5.63 Q 5968 Q 93.4
11:59 13.28 Q 0.8 Q 5.63 Q 5970 Q 93.2
12:00 13.29 Q 0.8 Q 5.63 Q 6011 Q 93.4
12:01 13.29 Q 0.8 Q 5.63 Q 5975 Q 93.6
12:02 13.29 Q 0.8 Q 5.63 Q 5975 Q 92.7
12:03 13.29 Q 0.8 Q 5.63 Q 5974 Q 93.5
12:04 13.29 Q 0.8 Q 5.62 Q 5956 Q 93.1
12:05 13.30 Q 0.8 Q 5.62 Q 5998 Q 93.6
12:06 13.29 Q 0.8 Q 5.62 Q 5986 Q 93.5
12:07 13.29 Q 0.8 Q 5.63 Q 6001 Q 93.2
12:08 13.28 Q 0.8 Q 5.63 Q 5989 Q 93.5
12:09 13.28 Q 0.8 Q 5.63 Q 5999 Q 93.8
12:10 13.28 Q 0.8 Q 5.63 Q 5958 Q 92.9
Max 13.30 0.8 5.81 6018 94.2
Min 13.04 0.7 5.62 5945 92.6
Avg 13.19 0.7 5.70 5982 93.3
#Valid 61 61 61 61 61
Q - Using Oil �F - Frozen FIFO �# - Incomplete Array �S - Transient State
I - Invalid �U - User Data �D - Process Down �C - Calibration
M - Maintenance �E - Error �O - Out-of-Control �N - Not Calibrated
P - PreMeasure �R - Out-of-Range �X - Excess Emission �W - Caution

APPENDIX F.3 Polynuclear Aromatic Hydrocarbon Testing
Process Data Sheets

Name:
7:31 13.17 Q 0.7 Q 5.71 Q 5950 Q 92.7
7:32 13.16 Q 0.7 Q 5.72 Q 5963 Q 93.4
7:33 13.15 Q 0.7 Q 5.73 Q 5953 Q 92.8
7:34 13.14 Q 0.7 Q 5.73 Q 5950 Q 92.8
7:35 13.14 Q 0.7 Q 5.74 Q 5963 Q 93.3
7:36 13.14 Q 0.7 Q 5.74 Q 5975 Q 93.2
7:37 13.13 Q 0.7 Q 5.75 Q 5945 Q 92.8
7:38 13.13 Q 0.7 Q 5.75 Q 6010 Q 93.5
7:39 13.12 Q 0.7 Q 5.75 Q 5950 Q 93.1
7:40 13.12 Q 0.7 Q 5.75 Q 5955 Q 92.7
7:41 13.12 Q 0.7 Q 5.75 Q 5954 Q 93.5
7:42 13.11 Q 0.7 Q 5.76 Q 5988 Q 93.4
7:43 13.10 Q 0.7 Q 5.77 Q 5967 Q 92.8
7:44 13.10 Q 0.7 Q 5.77 Q 5967 Q 93.2
7:45 13.09 Q 0.7 Q 5.78 Q 5974 Q 92.6
7:46 13.08 Q 0.7 Q 5.78 Q 5973 Q 93.2
7:47 13.08 Q 0.7 Q 5.78 Q 5968 Q 92.9
7:48 13.08 Q 0.7 Q 5.78 Q 5971 Q 93.2
7:49 13.08 Q 0.7 Q 5.78 Q 6000 Q 93.1
7:50 13.07 Q 0.7 Q 5.79 Q 5965 Q 93.2
7:51 13.07 Q 0.7 Q 5.79 Q 5967 Q 93.7
7:52 13.07 Q 0.7 Q 5.79 Q 5940 Q 92.5
7:53 13.08 Q 0.7 Q 5.78 Q 5975 Q 93.5
7:54 13.09 Q 0.7 Q 5.77 Q 5959 Q 93.1
7:55 13.10 Q 0.7 Q 5.77 Q 5978 Q 93.3
7:56 13.10 Q 0.7 Q 5.77 Q 5969 Q 93.2
7:57 13.09 Q 0.7 Q 5.77 Q 5996 Q 93.7
7:58 13.10 Q 0.7 Q 5.77 Q 5968 Q 93.3
7:59 13.10 Q 0.7 Q 5.77 Q 5975 Q 93.2
8:00 13.08 Q 0.7 Q 5.78 Q 5966 Q 93.4
8:01 13.09 Q 0.7 Q 5.78 Q 5973 Q 93.7
8:02 13.08 Q 0.7 Q 5.78 Q 5950 Q 93.0
8:03 13.08 Q 0.7 Q 5.78 Q 5966 Q 92.9
8:04 13.09 Q 0.7 Q 5.78 Q 5997 Q 93.5
8:05 13.08 Q 0.7 Q 5.78 Q 5951 Q 93.0
8:06 13.08 Q 0.7 Q 5.78 Q 5917 Q 93.2
8:07 13.08 Q 0.7 Q 5.78 Q 5968 Q 93.5
8:08 13.09 Q 0.7 Q 5.78 Q 5940 Q 92.8
8:09 13.08 Q 0.7 Q 5.78 Q 5942 Q 93.4
8:10 13.08 Q 0.7 Q 5.78 Q 5934 Q 92.4
8:11 13.07 Q 0.7 Q 5.79 Q 5981 Q 93.2
NOTE: CEMS Time is 1 hr behind real time.
MW/day% ppmv % gal/hr
1-min average report for the period from 8/7/2009 7:31:00 AM to 8/7/2009 9:52:59 AMSource: Boiler 1
Calculated O2
CO @ 15% O2 CO2 Flow Oil Unit Load
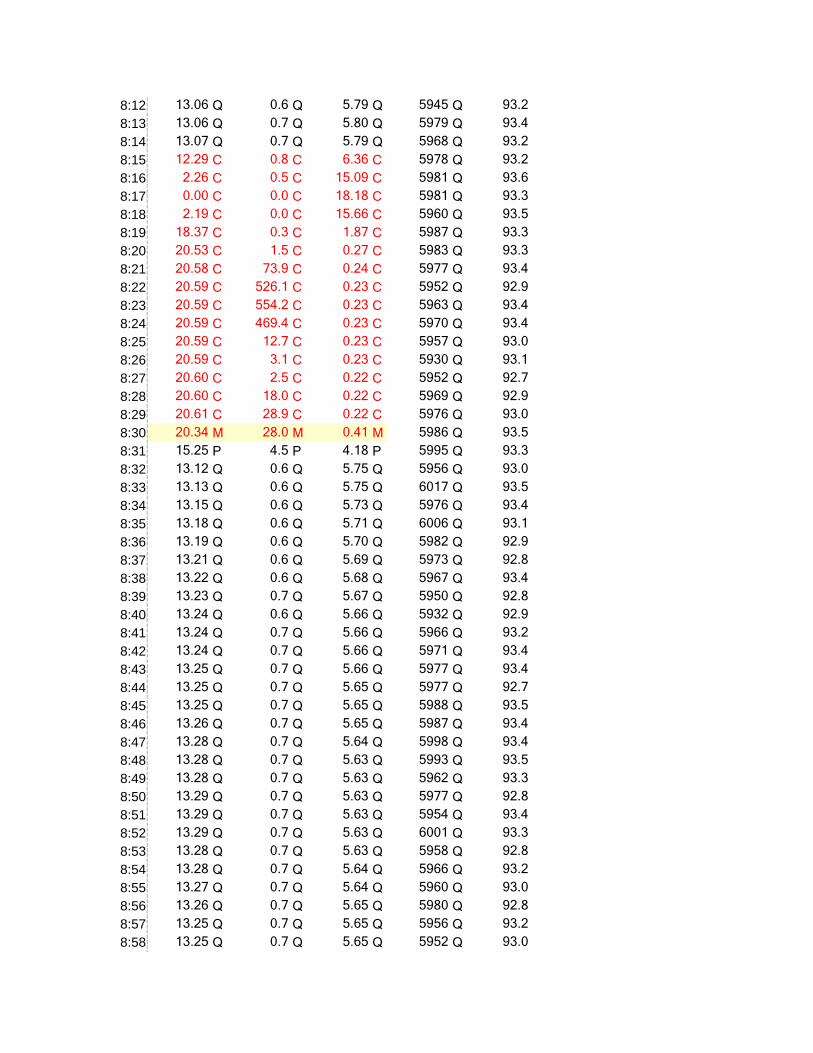
8:12 13.06 Q 0.6 Q 5.79 Q 5945 Q 93.2
8:13 13.06 Q 0.7 Q 5.80 Q 5979 Q 93.4
8:14 13.07 Q 0.7 Q 5.79 Q 5968 Q 93.2
8:15 12.29 C 0.8 C 6.36 C 5978 Q 93.2
8:16 2.26 C 0.5 C 15.09 C 5981 Q 93.6
8:17 0.00 C 0.0 C 18.18 C 5981 Q 93.3
8:18 2.19 C 0.0 C 15.66 C 5960 Q 93.5
8:19 18.37 C 0.3 C 1.87 C 5987 Q 93.3
8:20 20.53 C 1.5 C 0.27 C 5983 Q 93.3
8:21 20.58 C 73.9 C 0.24 C 5977 Q 93.4
8:22 20.59 C 526.1 C 0.23 C 5952 Q 92.9
8:23 20.59 C 554.2 C 0.23 C 5963 Q 93.4
8:24 20.59 C 469.4 C 0.23 C 5970 Q 93.4
8:25 20.59 C 12.7 C 0.23 C 5957 Q 93.0
8:26 20.59 C 3.1 C 0.23 C 5930 Q 93.1
8:27 20.60 C 2.5 C 0.22 C 5952 Q 92.7
8:28 20.60 C 18.0 C 0.22 C 5969 Q 92.9
8:29 20.61 C 28.9 C 0.22 C 5976 Q 93.0
8:30 20.34 M 28.0 M 0.41 M 5986 Q 93.5
8:31 15.25 P 4.5 P 4.18 P 5995 Q 93.3
8:32 13.12 Q 0.6 Q 5.75 Q 5956 Q 93.0
8:33 13.13 Q 0.6 Q 5.75 Q 6017 Q 93.5
8:34 13.15 Q 0.6 Q 5.73 Q 5976 Q 93.4
8:35 13.18 Q 0.6 Q 5.71 Q 6006 Q 93.1
8:36 13.19 Q 0.6 Q 5.70 Q 5982 Q 92.9
8:37 13.21 Q 0.6 Q 5.69 Q 5973 Q 92.8
8:38 13.22 Q 0.6 Q 5.68 Q 5967 Q 93.4
8:39 13.23 Q 0.7 Q 5.67 Q 5950 Q 92.8
8:40 13.24 Q 0.6 Q 5.66 Q 5932 Q 92.9
8:41 13.24 Q 0.7 Q 5.66 Q 5966 Q 93.2
8:42 13.24 Q 0.7 Q 5.66 Q 5971 Q 93.4
8:43 13.25 Q 0.7 Q 5.66 Q 5977 Q 93.4
8:44 13.25 Q 0.7 Q 5.65 Q 5977 Q 92.7
8:45 13.25 Q 0.7 Q 5.65 Q 5988 Q 93.5
8:46 13.26 Q 0.7 Q 5.65 Q 5987 Q 93.4
8:47 13.28 Q 0.7 Q 5.64 Q 5998 Q 93.4
8:48 13.28 Q 0.7 Q 5.63 Q 5993 Q 93.5
8:49 13.28 Q 0.7 Q 5.63 Q 5962 Q 93.3
8:50 13.29 Q 0.7 Q 5.63 Q 5977 Q 92.8
8:51 13.29 Q 0.7 Q 5.63 Q 5954 Q 93.4
8:52 13.29 Q 0.7 Q 5.63 Q 6001 Q 93.3
8:53 13.28 Q 0.7 Q 5.63 Q 5958 Q 92.8
8:54 13.28 Q 0.7 Q 5.64 Q 5966 Q 93.2
8:55 13.27 Q 0.7 Q 5.64 Q 5960 Q 93.0
8:56 13.26 Q 0.7 Q 5.65 Q 5980 Q 92.8
8:57 13.25 Q 0.7 Q 5.65 Q 5956 Q 93.2
8:58 13.25 Q 0.7 Q 5.65 Q 5952 Q 93.0

8:59 13.24 Q 0.7 Q 5.67 Q 5979 Q 92.8
9:00 13.23 Q 0.7 Q 5.67 Q 5983 Q 93.3
9:01 13.22 Q 0.7 Q 5.68 Q 5974 Q 93.7
9:02 13.21 Q 0.7 Q 5.69 Q 5965 Q 93.1
9:03 13.20 Q 0.7 Q 5.69 Q 6003 Q 93.3
9:04 13.19 Q 0.7 Q 5.70 Q 5992 Q 93.3
9:05 13.18 Q 0.7 Q 5.71 Q 5997 Q 93.8
9:06 13.18 Q 0.7 Q 5.70 Q 6008 Q 93.5
9:07 13.18 Q 0.7 Q 5.71 Q 5934 Q 92.9
9:08 13.18 Q 0.7 Q 5.71 Q 5992 Q 94.2
9:09 13.18 Q 0.7 Q 5.71 Q 5956 Q 93.2
9:10 13.17 Q 0.7 Q 5.72 Q 5975 Q 93.4
9:11 13.17 Q 0.7 Q 5.72 Q 5990 Q 93.4
9:12 13.17 Q 0.7 Q 5.72 Q 5991 Q 93.0
9:13 13.17 Q 0.7 Q 5.71 Q 5990 Q 93.5
9:14 13.17 Q 0.7 Q 5.71 Q 5957 Q 92.8
9:15 13.17 Q 0.7 Q 5.71 Q 5988 Q 93.0
9:16 13.17 Q 0.7 Q 5.72 Q 5952 Q 93.1
9:17 13.16 Q 0.7 Q 5.72 Q 5993 Q 93.5
9:18 13.17 Q 0.7 Q 5.72 Q 5976 Q 93.1
9:19 13.16 Q 0.7 Q 5.72 Q 5994 Q 92.9
9:20 13.16 Q 0.7 Q 5.72 Q 5960 Q 93.3
9:21 13.17 Q 0.7 Q 5.72 Q 5977 Q 92.8
9:22 13.16 Q 0.7 Q 5.72 Q 5951 Q 92.6
9:23 13.16 Q 0.7 Q 5.72 Q 5949 Q 93.3
9:24 13.16 Q 0.7 Q 5.72 Q 5981 Q 94.3
9:25 13.15 Q 0.7 Q 5.73 Q 6002 Q 94.1
9:26 13.15 Q 0.7 Q 5.73 Q 5973 Q 93.0
9:27 13.15 Q 0.7 Q 5.73 Q 5982 Q 93.3
9:28 13.14 Q 0.7 Q 5.74 Q 5965 Q 93.2
9:29 13.15 Q 0.7 Q 5.73 Q 5974 Q 93.6
9:30 13.15 Q 0.7 Q 5.73 Q 5988 Q 93.2
9:31 13.14 Q 0.7 Q 5.74 Q 5976 Q 93.0
9:32 13.14 Q 0.7 Q 5.74 Q 5965 Q 93.2
9:33 13.14 Q 0.7 Q 5.74 Q 5961 Q 93.1
9:34 13.14 Q 0.7 Q 5.74 Q 5950 Q 92.9
9:35 13.14 Q 0.7 Q 5.74 Q 5981 Q 93.0
9:36 13.13 Q 0.7 Q 5.74 Q 5986 Q 93.6
9:37 13.13 Q 0.7 Q 5.75 Q 5962 Q 93.1
9:38 13.12 Q 0.7 Q 5.75 Q 5971 Q 93.1
9:39 13.12 Q 0.7 Q 5.75 Q 5980 Q 93.1
9:40 13.12 Q 0.7 Q 5.75 Q 5978 Q 93.7
9:41 13.13 Q 0.7 Q 5.75 Q 5954 Q 93.1
9:42 13.13 Q 0.7 Q 5.75 Q 5979 Q 93.0
9:43 13.12 Q 0.7 Q 5.75 Q 5970 Q 92.9
9:44 13.12 Q 0.7 Q 5.75 Q 5991 Q 93.4
9:45 13.12 Q 0.7 Q 5.76 Q 5957 Q 92.8
9:46 13.12 Q 0.7 Q 5.75 Q 5965 Q 93.4
9:47 13.12 Q 0.7 Q 5.75 Q 5965 Q 93.0
9:48 13.12 Q 0.7 Q 5.75 Q 6014 Q 93.8
9:49 13.11 Q 0.7 Q 5.76 Q 5953 Q 92.9
9:50 13.12 Q 0.7 Q 5.75 Q 5981 Q 93.2
9:51 13.12 Q 0.7 Q 5.75 Q 5994 Q 93.4
9:52 13.12 Q 0.7 Q 5.75 Q 5984 Q 93.4
Max 13.29 0.7 5.80 6017 94.3
Min 13.06 0.6 5.63 5917 92.4
Avg 13.15 0.7 5.73 5971 93.2
#Valid 125 125 125 142 142
Q - Using Oil �F - Frozen FIFO �# - Incomplete Array �S - Transient State
I - Invalid �U - User Data �D - Process Down �C - Calibration
M - Maintenance �E - Error �O - Out-of-Control �N - Not Calibrated
P - PreMeasure �R - Out-of-Range �X - Excess Emission �W - Caution
Name:
10:29 13.22 Q 0.7 Q 5.68 Q 5912 Q 92.5
10:30 13.22 Q 0.7 Q 5.68 Q 5969 Q 93.5
10:31 13.20 Q 0.7 Q 5.69 Q 5953 Q 93.3
10:32 13.18 Q 0.7 Q 5.70 Q 5991 Q 93.3
10:33 13.18 Q 0.7 Q 5.71 Q 5984 Q 93.2
10:34 13.17 Q 0.7 Q 5.72 Q 5956 Q 93.6
10:35 13.15 Q 0.7 Q 5.73 Q 5985 Q 93.6
10:36 13.13 Q 0.7 Q 5.74 Q 6033 Q 93.8
10:37 13.12 Q 0.7 Q 5.75 Q 5967 Q 93.4
10:38 13.12 Q 0.7 Q 5.75 Q 5964 Q 93.0
10:39 13.11 Q 0.7 Q 5.76 Q 6019 Q 93.6
10:40 13.10 Q 0.7 Q 5.77 Q 5984 Q 93.4
10:41 13.09 Q 0.7 Q 5.77 Q 5988 Q 93.5
10:42 13.09 Q 0.7 Q 5.77 Q 5985 Q 93.6
10:43 13.09 Q 0.7 Q 5.77 Q 5979 Q 93.6
10:44 13.09 Q 0.7 Q 5.78 Q 5996 Q 93.1
10:45 13.09 Q 0.7 Q 5.77 Q 5971 Q 92.9
10:46 13.10 Q 0.7 Q 5.77 Q 6001 Q 93.5
10:47 13.11 Q 0.7 Q 5.76 Q 5969 Q 93.0
10:48 13.12 Q 0.7 Q 5.75 Q 5995 Q 93.5
10:49 13.13 Q 0.7 Q 5.74 Q 5936 Q 92.8
10:50 13.16 Q 0.7 Q 5.73 Q 5987 Q 92.8
10:51 13.17 Q 0.7 Q 5.72 Q 5962 Q 93.3
10:52 13.17 Q 0.8 Q 5.72 Q 5972 Q 93.4
10:53 13.18 Q 0.8 Q 5.70 Q 6027 Q 93.6
10:54 13.19 Q 0.8 Q 5.70 Q 5959 Q 93.0
10:55 13.21 Q 0.8 Q 5.69 Q 5944 Q 93.2
10:56 13.22 Q 0.8 Q 5.68 Q 5951 Q 93.6
10:57 13.22 Q 0.8 Q 5.68 Q 5956 Q 93.4
10:58 13.23 Q 0.8 Q 5.67 Q 5949 Q 92.9
10:59 13.24 Q 0.8 Q 5.66 Q 5977 Q 93.1
11:00 13.24 Q 0.8 Q 5.66 Q 5998 Q 93.3
11:01 13.24 Q 0.8 Q 5.66 Q 5980 Q 93.8
11:02 13.25 Q 0.8 Q 5.66 Q 5974 Q 93.0
11:03 13.25 Q 0.8 Q 5.66 Q 5990 Q 92.8
11:04 13.26 Q 0.8 Q 5.65 Q 5998 Q 93.4
11:05 13.26 Q 0.8 Q 5.65 Q 6018 Q 92.8
11:06 13.26 Q 0.7 Q 5.65 Q 5965 Q 93.0
11:07 13.27 Q 0.7 Q 5.64 Q 5969 Q 93.1
11:08 13.27 Q 0.7 Q 5.64 Q 5980 Q 92.7
11:09 13.27 Q 0.7 Q 5.64 Q 5985 Q 93.4
NOTE: CEMS Time is 1 hr behind renal time.
MW/day% ppmv % gal/hr
1-min average report for the period from 8/7/2009 10:29:00 AM to 8/7/2009 12:54:59 PMSource: Boiler 1
Calculated O2
CO @ 15% O2 CO2 Flow Oil Unit Load
11:10 13.27 Q 0.7 Q 5.64 Q 5988 Q 93.0
11:11 13.27 Q 0.7 Q 5.64 Q 5993 Q 93.4
11:12 13.27 Q 0.7 Q 5.64 Q 5971 Q 92.9
11:13 13.26 Q 0.7 Q 5.65 Q 5954 Q 93.2
11:14 13.27 Q 0.7 Q 5.64 Q 6008 Q 93.8
11:15 13.25 Q 0.7 Q 5.65 Q 5993 Q 93.5
11:16 13.24 Q 0.7 Q 5.66 Q 5989 Q 93.2
11:17 13.23 Q 0.7 Q 5.67 Q 6018 Q 93.7
11:18 13.22 Q 0.7 Q 5.68 Q 5983 Q 93.3
11:19 13.19 Q 0.7 Q 5.70 Q 5963 Q 92.9
11:20 13.19 Q 0.7 Q 5.70 Q 5965 Q 93.6
11:21 13.17 Q 0.7 Q 5.71 Q 5960 Q 93.1
11:22 13.16 Q 0.7 Q 5.72 Q 5988 Q 93.1
11:23 13.14 Q 0.7 Q 5.74 Q 6017 Q 93.0
11:24 13.11 Q 0.7 Q 5.76 Q 6002 Q 93.0
11:25 13.10 Q 0.7 Q 5.77 Q 6013 Q 93.5
11:26 13.08 Q 0.7 Q 5.78 Q 5965 Q 93.9
11:27 13.07 Q 0.7 Q 5.79 Q 5971 Q 93.6
11:28 13.06 Q 0.7 Q 5.79 Q 5985 Q 93.2
11:29 13.06 Q 0.7 Q 5.79 Q 5973 Q 93.1
11:30 13.06 Q 0.7 Q 5.80 Q 5965 Q 93.4
11:31 13.05 Q 0.7 Q 5.81 Q 5988 Q 93.4
11:32 13.05 Q 0.7 Q 5.81 Q 5995 Q 93.2
11:33 13.04 Q 0.7 Q 5.81 Q 5945 Q 92.8
11:34 13.05 Q 0.7 Q 5.80 Q 5962 Q 92.9
11:35 13.06 Q 0.7 Q 5.79 Q 5984 Q 93.3
11:36 13.08 Q 0.7 Q 5.78 Q 5971 Q 93.0
11:37 13.07 Q 0.7 Q 5.79 Q 5975 Q 93.4
11:38 13.07 Q 0.7 Q 5.79 Q 5976 Q 93.5
11:39 13.08 Q 0.7 Q 5.78 Q 6006 Q 94.2
11:40 13.10 Q 0.7 Q 5.77 Q 5997 Q 93.4
11:41 13.12 Q 0.7 Q 5.76 Q 5973 Q 93.5
11:42 13.13 Q 0.8 Q 5.74 Q 5965 Q 92.9
11:43 13.15 Q 0.7 Q 5.73 Q 5968 Q 92.6
11:44 13.16 Q 0.7 Q 5.72 Q 5994 Q 93.2
11:45 13.18 Q 0.8 Q 5.71 Q 5975 Q 93.3
11:46 13.19 Q 0.8 Q 5.70 Q 5986 Q 93.8
11:47 13.21 Q 0.8 Q 5.69 Q 5994 Q 93.6
11:48 13.21 Q 0.8 Q 5.69 Q 5987 Q 93.2
11:49 13.22 Q 0.8 Q 5.68 Q 5989 Q 93.0
11:50 13.23 Q 0.8 Q 5.67 Q 5982 Q 93.0
11:51 13.24 Q 0.8 Q 5.67 Q 5975 Q 93.2
11:52 13.23 Q 0.8 Q 5.67 Q 6014 Q 93.8
11:53 13.24 Q 0.8 Q 5.66 Q 5983 Q 93.4
11:54 13.25 Q 0.8 Q 5.66 Q 5980 Q 93.5
11:55 13.25 Q 0.8 Q 5.66 Q 5968 Q 92.9
11:56 13.26 Q 0.8 Q 5.65 Q 5996 Q 93.3
11:57 13.27 Q 0.8 Q 5.64 Q 5980 Q 93.1
11:58 13.28 Q 0.8 Q 5.63 Q 5968 Q 93.4
11:59 13.28 Q 0.8 Q 5.63 Q 5970 Q 93.2
12:00 13.29 Q 0.8 Q 5.63 Q 6011 Q 93.4
12:01 13.29 Q 0.8 Q 5.63 Q 5975 Q 93.6
12:02 13.29 Q 0.8 Q 5.63 Q 5975 Q 92.7
12:03 13.29 Q 0.8 Q 5.63 Q 5974 Q 93.5
12:04 13.29 Q 0.8 Q 5.62 Q 5956 Q 93.1
12:05 13.30 Q 0.8 Q 5.62 Q 5998 Q 93.6
12:06 13.29 Q 0.8 Q 5.62 Q 5986 Q 93.5
12:07 13.29 Q 0.8 Q 5.63 Q 6001 Q 93.2
12:08 13.28 Q 0.8 Q 5.63 Q 5989 Q 93.5
12:09 13.28 Q 0.8 Q 5.63 Q 5999 Q 93.8
12:10 13.28 Q 0.8 Q 5.63 Q 5958 Q 92.9
12:11 13.28 Q 0.8 Q 5.64 Q 5976 Q 93.5
12:12 13.27 Q 0.8 Q 5.64 Q 5963 Q 93.1
12:13 13.26 Q 0.8 Q 5.65 Q 5975 Q 93.5
12:14 13.25 Q 0.8 Q 5.65 Q 5953 Q 93.4
12:15 13.24 Q 0.8 Q 5.66 Q 5973 Q 93.3
12:16 13.23 Q 0.8 Q 5.67 Q 5968 Q 93.3
12:17 13.22 Q 0.8 Q 5.68 Q 5964 Q 92.7
12:18 13.20 Q 0.8 Q 5.70 Q 5968 Q 93.5
12:19 13.17 Q 0.7 Q 5.72 Q 6001 Q 93.5
12:20 13.15 Q 0.8 Q 5.73 Q 6001 Q 93.4
12:21 13.14 Q 0.8 Q 5.74 Q 5992 Q 93.1
12:22 13.13 Q 0.8 Q 5.74 Q 6017 Q 93.1
12:23 13.12 Q 0.8 Q 5.75 Q 5985 Q 93.3
12:24 13.11 Q 0.8 Q 5.76 Q 5973 Q 93.4
12:25 13.10 Q 0.7 Q 5.77 Q 5966 Q 93.1
12:26 13.09 Q 0.8 Q 5.77 Q 5992 Q 93.4
12:27 13.09 Q 0.8 Q 5.77 Q 5975 Q 92.8
12:28 13.09 Q 0.8 Q 5.77 Q 5966 Q 93.0
12:29 13.10 Q 0.8 Q 5.77 Q 5977 Q 93.2
12:30 13.11 Q 0.8 Q 5.76 Q 5976 Q 93.4
12:31 13.12 Q 0.8 Q 5.75 Q 6001 Q 93.5
12:32 13.13 Q 0.8 Q 5.74 Q 5979 Q 93.2
12:33 13.14 Q 0.8 Q 5.74 Q 5984 Q 92.9
12:34 13.16 Q 0.8 Q 5.72 Q 5973 Q 93.7
12:35 13.18 Q 0.8 Q 5.71 Q 5984 Q 93.0
12:36 13.19 Q 0.8 Q 5.70 Q 5966 Q 93.5
12:37 13.21 Q 0.8 Q 5.69 Q 5979 Q 93.3
12:38 13.22 Q 0.8 Q 5.68 Q 5963 Q 92.6
12:39 13.22 Q 0.8 Q 5.68 Q 6006 Q 93.4
12:40 13.22 Q 0.8 Q 5.68 Q 5971 Q 93.0
12:41 13.23 Q 0.8 Q 5.67 Q 5992 Q 93.6
12:42 13.24 Q 0.8 Q 5.66 Q 6012 Q 93.6
12:43 13.24 Q 0.8 Q 5.66 Q 5987 Q 93.0
12:44 13.25 Q 0.8 Q 5.66 Q 5970 Q 92.5
12:45 13.24 Q 0.8 Q 5.66 Q 5955 Q 92.6
12:46 13.25 Q 0.8 Q 5.65 Q 5972 Q 93.3
12:47 13.26 Q 0.8 Q 5.65 Q 5980 Q 93.4
12:48 13.28 Q 0.8 Q 5.64 Q 5956 Q 93.6
12:49 13.29 Q 0.8 Q 5.63 Q 5951 Q 93.2
12:50 13.29 Q 0.8 Q 5.63 Q 6002 Q 93.2
12:51 13.29 Q 0.8 Q 5.63 Q 5960 Q 92.8
12:52 13.29 Q 0.8 Q 5.63 Q 5976 Q 92.9
12:53 13.30 Q 0.8 Q 5.62 Q 5972 Q 93.3
12:54 13.30 Q 0.8 Q 5.62 Q 5945 Q 93.2
Max 13.30 0.8 5.81 6033 94.2
Min 13.04 0.7 5.62 5912 92.5
Avg 13.19 0.8 5.70 5980 93.3
#Valid 146 146 146 146 146
Q - Using Oil �F - Frozen FIFO �# - Incomplete Array �S - Transient State
I - Invalid �U - User Data �D - Process Down �C - Calibration
M - Maintenance �E - Error �O - Out-of-Control �N - Not Calibrated
P - PreMeasure �R - Out-of-Range �X - Excess Emission �W - Caution

Name:
13:30 13.25 Q 0.8 Q 5.66 Q 5976 Q 93.4
13:31 13.25 Q 0.8 Q 5.66 Q 5992 Q 93.4
13:32 13.25 Q 0.8 Q 5.65 Q 5978 Q 93.3
13:33 13.26 Q 0.8 Q 5.65 Q 5998 Q 93.4
13:34 13.26 Q 0.8 Q 5.65 Q 5999 Q 93.1
13:35 13.27 Q 0.8 Q 5.64 Q 6010 Q 93.8
13:36 13.26 Q 0.8 Q 5.65 Q 5982 Q 93.1
13:37 13.27 Q 0.8 Q 5.64 Q 5985 Q 93.4
13:38 13.28 Q 0.8 Q 5.63 Q 5977 Q 93.2
13:39 13.29 Q 0.8 Q 5.63 Q 5982 Q 93.4
13:40 13.29 Q 0.8 Q 5.63 Q 6000 Q 93.7
13:41 13.29 Q 0.7 Q 5.63 Q 5946 Q 92.8
13:42 13.28 Q 0.8 Q 5.63 Q 5977 Q 93.1
13:43 13.28 Q 0.8 Q 5.64 Q 5977 Q 93.3
13:44 13.28 Q 0.8 Q 5.63 Q 5985 Q 93.2
13:45 13.29 Q 0.8 Q 5.63 Q 5992 Q 93.4
13:46 13.29 Q 0.8 Q 5.62 Q 6037 Q 93.8
13:47 13.30 Q 0.8 Q 5.62 Q 5983 Q 93.0
13:48 13.29 Q 0.8 Q 5.62 Q 5986 Q 93.4
13:49 13.30 Q 0.8 Q 5.62 Q 5989 Q 93.6
13:50 13.30 Q 0.8 Q 5.62 Q 5999 Q 93.2
13:51 13.29 Q 0.8 Q 5.62 Q 5968 Q 93.4
13:52 13.28 Q 0.8 Q 5.63 Q 5999 Q 93.5
13:53 13.28 Q 0.8 Q 5.64 Q 6013 Q 93.2
13:54 13.27 Q 0.8 Q 5.64 Q 5987 Q 93.5
13:55 13.26 Q 0.8 Q 5.65 Q 5956 Q 92.6
13:56 13.24 Q 0.8 Q 5.66 Q 5979 Q 93.3
13:57 13.24 Q 0.8 Q 5.67 Q 5975 Q 93.1
13:58 13.22 Q 0.8 Q 5.68 Q 6003 Q 93.6
13:59 13.20 Q 0.8 Q 5.69 Q 6010 Q 93.3
14:00 13.18 Q 0.8 Q 5.71 Q 5986 Q 93.3
14:01 13.17 Q 0.8 Q 5.72 Q 5936 Q 92.6
14:02 13.15 Q 0.8 Q 5.73 Q 5943 Q 92.6
14:03 13.15 Q 0.8 Q 5.73 Q 5999 Q 93.1
14:04 13.13 Q 0.8 Q 5.74 Q 5997 Q 93.2
14:05 13.12 Q 0.8 Q 5.75 Q 5976 Q 93.3
14:06 13.12 Q 0.8 Q 5.76 Q 5990 Q 93.3
14:07 13.11 Q 0.8 Q 5.76 Q 5997 Q 93.4
14:08 13.12 Q 0.8 Q 5.75 Q 5974 Q 93.2
14:09 13.14 Q 0.8 Q 5.74 Q 5983 Q 93.4
14:10 13.16 Q 0.8 Q 5.72 Q 5973 Q 93.2
NOTE: CEMS Time is 1 hr behind real time.
MW/day% ppmv % gal/hr
1-min average report for the period from 8/7/2009 1:30:00 PM to 8/7/2009 3:45:59 PMSource: Boiler 1
Calculated O2
CO @ 15% O2 CO2 Flow Oil Unit Load

14:11 13.17 Q 0.8 Q 5.71 Q 5998 Q 93.6
14:12 13.19 Q 0.8 Q 5.70 Q 6000 Q 93.9
14:13 13.20 Q 0.8 Q 5.69 Q 5975 Q 93.0
14:14 13.22 Q 0.8 Q 5.68 Q 5954 Q 93.1
14:15 13.23 Q 0.8 Q 5.67 Q 5995 Q 93.5
14:16 13.24 Q 0.8 Q 5.66 Q 5973 Q 93.1
14:17 13.25 Q 0.8 Q 5.66 Q 5976 Q 93.3
14:18 13.26 Q 0.8 Q 5.65 Q 5961 Q 93.1
14:19 13.27 Q 0.8 Q 5.64 Q 5998 Q 93.2
14:20 13.26 Q 0.8 Q 5.65 Q 5968 Q 93.5
14:21 13.27 Q 0.8 Q 5.64 Q 5987 Q 93.4
14:22 13.27 Q 0.8 Q 5.64 Q 5992 Q 93.5
14:23 13.28 Q 0.8 Q 5.64 Q 5977 Q 93.4
14:24 13.28 Q 0.8 Q 5.63 Q 5980 Q 93.2
14:25 13.28 Q 0.8 Q 5.64 Q 5971 Q 93.4
14:26 13.27 Q 0.8 Q 5.64 Q 5988 Q 93.0
14:27 13.27 Q 0.8 Q 5.64 Q 5997 Q 93.5
14:28 13.27 Q 0.8 Q 5.64 Q 6015 Q 93.4
14:29 13.28 Q 0.8 Q 5.63 Q 5985 Q 93.8
14:30 13.29 Q 0.8 Q 5.63 Q 5980 Q 92.9
14:31 13.29 Q 0.8 Q 5.63 Q 5977 Q 93.3
14:32 13.29 Q 0.8 Q 5.63 Q 5980 Q 92.9
14:33 13.29 Q 0.8 Q 5.63 Q 5972 Q 93.1
14:34 13.29 Q 0.8 Q 5.62 Q 5998 Q 93.4
14:35 13.29 Q 0.8 Q 5.62 Q 5979 Q 93.2
14:36 13.30 Q 0.8 Q 5.62 Q 5979 Q 93.3
14:37 13.30 Q 0.8 Q 5.62 Q 5979 Q 93.6
14:38 13.30 Q 0.8 Q 5.62 Q 5993 Q 93.6
14:39 13.30 Q 0.8 Q 5.62 Q 5976 Q 93.1
14:40 13.30 Q 0.8 Q 5.62 Q 5998 Q 93.1
14:41 13.29 Q 0.8 Q 5.63 Q 5994 Q 92.8
14:42 13.29 Q 0.8 Q 5.63 Q 5991 Q 93.2
14:43 13.28 Q 0.8 Q 5.63 Q 5992 Q 93.2
14:44 13.28 Q 0.8 Q 5.63 Q 5980 Q 93.2
14:45 13.27 Q 0.8 Q 5.64 Q 6023 Q 93.7
14:46 13.26 Q 0.8 Q 5.65 Q 5999 Q 93.4
14:47 13.25 Q 0.8 Q 5.65 Q 5987 Q 93.1
14:48 13.23 Q 0.8 Q 5.67 Q 5987 Q 93.2
14:49 13.22 Q 0.8 Q 5.68 Q 5969 Q 93.1
14:50 13.20 Q 0.8 Q 5.69 Q 6009 Q 93.3
14:51 13.18 Q 0.8 Q 5.70 Q 5981 Q 93.2
14:52 13.17 Q 0.8 Q 5.71 Q 5974 Q 93.3
14:53 13.15 Q 0.9 Q 5.73 Q 6005 Q 93.1
14:54 13.13 Q 0.9 Q 5.74 Q 5977 Q 93.3
14:55 13.12 Q 0.9 Q 5.75 Q 5984 Q 93.4
14:56 13.11 Q 0.8 Q 5.76 Q 5957 Q 93.3
14:57 13.09 Q 0.8 Q 5.77 Q 6012 Q 93.5

14:58 13.09 Q 0.9 Q 5.78 Q 5984 Q 93.0
14:59 13.08 Q 0.9 Q 5.78 Q 5966 Q 92.7
15:00 13.08 Q 0.9 Q 5.78 Q 6007 Q 93.2
15:01 13.08 Q 0.9 Q 5.78 Q 6005 Q 93.3
15:02 13.09 Q 0.9 Q 5.77 Q 5986 Q 93.2
15:03 13.10 Q 0.9 Q 5.77 Q 5995 Q 93.6
15:04 13.11 Q 0.9 Q 5.76 Q 6003 Q 93.5
15:05 13.13 Q 0.9 Q 5.74 Q 5977 Q 92.9
15:06 13.15 Q 0.9 Q 5.73 Q 5983 Q 93.1
15:07 13.16 Q 0.9 Q 5.72 Q 6013 Q 93.2
15:08 13.18 Q 0.9 Q 5.71 Q 5977 Q 92.7
15:09 13.19 Q 0.9 Q 5.70 Q 6010 Q 93.1
15:10 13.21 Q 0.9 Q 5.69 Q 5994 Q 93.4
15:11 13.22 Q 0.9 Q 5.68 Q 5975 Q 92.8
15:12 13.22 Q 0.9 Q 5.68 Q 5999 Q 93.1
15:13 13.23 Q 0.9 Q 5.67 Q 5968 Q 92.9
15:14 13.24 Q 0.9 Q 5.66 Q 5982 Q 92.9
15:15 13.24 Q 0.9 Q 5.66 Q 5997 Q 93.1
15:16 13.25 Q 0.9 Q 5.65 Q 6002 Q 93.3
15:17 13.27 Q 0.9 Q 5.64 Q 5995 Q 93.8
15:18 13.27 Q 1.0 Q 5.64 Q 6023 Q 93.6
15:19 13.28 Q 1.0 Q 5.64 Q 5949 Q 92.7
15:20 13.27 Q 1.0 Q 5.64 Q 5972 Q 93.4
15:21 13.28 Q 0.9 Q 5.63 Q 5990 Q 93.2
15:22 13.28 Q 1.0 Q 5.63 Q 6026 Q 93.2
15:23 13.27 Q 1.0 Q 5.64 Q 5979 Q 92.8
15:24 13.27 Q 1.0 Q 5.64 Q 6012 Q 93.2
15:25 13.27 Q 0.9 Q 5.64 Q 6015 Q 93.4
15:26 13.27 Q 0.9 Q 5.64 Q 5981 Q 93.2
15:27 13.28 Q 0.9 Q 5.63 Q 6001 Q 93.4
15:28 13.29 Q 0.9 Q 5.63 Q 5994 Q 93.2
15:29 13.29 Q 0.9 Q 5.62 Q 5999 Q 93.4
15:30 13.29 Q 0.9 Q 5.62 Q 5968 Q 92.9
15:31 13.29 Q 0.9 Q 5.62 Q 5960 Q 93.2
15:32 13.29 Q 0.9 Q 5.62 Q 5982 Q 93.2
15:33 13.29 Q 0.9 Q 5.62 Q 5963 Q 93.0
15:34 13.29 Q 0.9 Q 5.63 Q 5977 Q 93.4
15:35 13.29 Q 0.9 Q 5.63 Q 5960 Q 93.0
15:36 13.29 Q 0.9 Q 5.62 Q 5985 Q 93.2
15:37 13.29 Q 0.9 Q 5.63 Q 5972 Q 92.8
15:38 13.29 Q 0.9 Q 5.63 Q 5982 Q 93.2
15:39 13.29 Q 0.9 Q 5.63 Q 5992 Q 93.3
15:40 13.28 Q 1.0 Q 5.63 Q 5978 Q 92.7
15:41 13.27 Q 1.0 Q 5.64 Q 5969 Q 92.9
15:42 13.26 Q 1.0 Q 5.65 Q 6002 Q 93.5
15:43 13.25 Q 1.0 Q 5.66 Q 6015 Q 93.8
15:44 13.23 Q 1.0 Q 5.67 Q 6001 Q 93.1
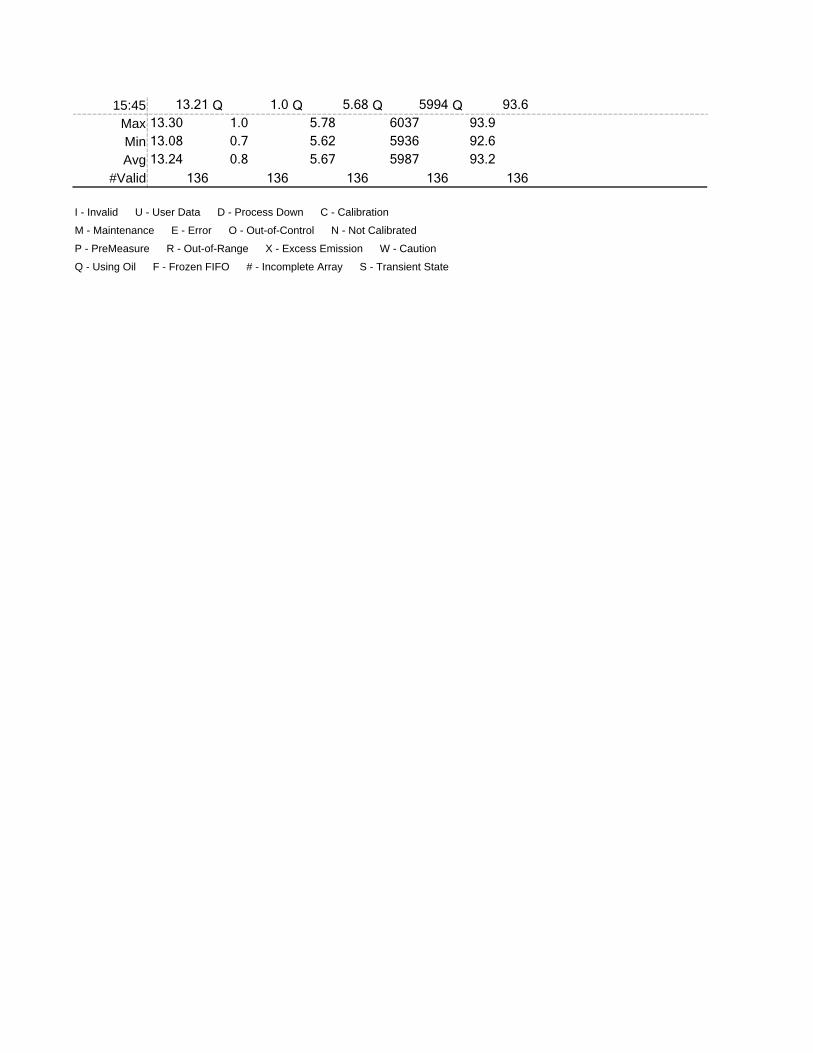
15:45 13.21 Q 1.0 Q 5.68 Q 5994 Q 93.6
Max 13.30 1.0 5.78 6037 93.9
Min 13.08 0.7 5.62 5936 92.6
Avg 13.24 0.8 5.67 5987 93.2
#Valid 136 136 136 136 136
Q - Using Oil �F - Frozen FIFO �# - Incomplete Array �S - Transient State
I - Invalid �U - User Data �D - Process Down �C - Calibration
M - Maintenance �E - Error �O - Out-of-Control �N - Not Calibrated
P - PreMeasure �R - Out-of-Range �X - Excess Emission �W - Caution
APPENDIX F.4 Reference Method Compliance Testing
Process Data Sheets

Name:
9:00 5983 Q 93.3
9:01 5974 Q 93.7
9:02 5965 Q 93.1
9:03 6003 Q 93.3
9:04 5992 Q 93.3
9:05 5997 Q 93.8
9:06 6008 Q 93.5
9:07 5934 Q 92.9
9:08 5992 Q 94.2
9:09 5956 Q 93.2
9:10 5975 Q 93.4
9:11 5990 Q 93.4
9:12 5991 Q 93.0
9:13 5990 Q 93.5
9:14 5957 Q 92.8
9:15 5988 Q 93.0
9:16 5952 Q 93.1
9:17 5993 Q 93.5
9:18 5976 Q 93.1
9:19 5994 Q 92.9
9:20 5960 Q 93.3
9:21 5977 Q 92.8
9:22 5951 Q 92.6
9:23 5949 Q 93.3
9:24 5981 Q 94.3
9:25 6002 Q 94.1
9:26 5973 Q 93.0
9:27 5982 Q 93.3
9:28 5965 Q 93.2
9:29 5974 Q 93.6
9:30 5988 Q 93.2
9:31 5976 Q 93.0
9:32 5965 Q 93.2
9:33 5961 Q 93.1
9:34 5950 Q 92.9
9:35 5981 Q 93.0
9:36 5986 Q 93.6
9:37 5962 Q 93.1
9:38 5971 Q 93.1
9:39 5980 Q 93.1
9:40 5978 Q 93.7
9:41 5954 Q 93.1
NOTE: CEMS Time is 1 hr behind real time.
gal/hr MW/day
1-min average report for the period from 8/7/2009 9:00:00 AM to 8/7/2009 9:59:59 AMSource: Boiler 1
Flow Oil Unit Load
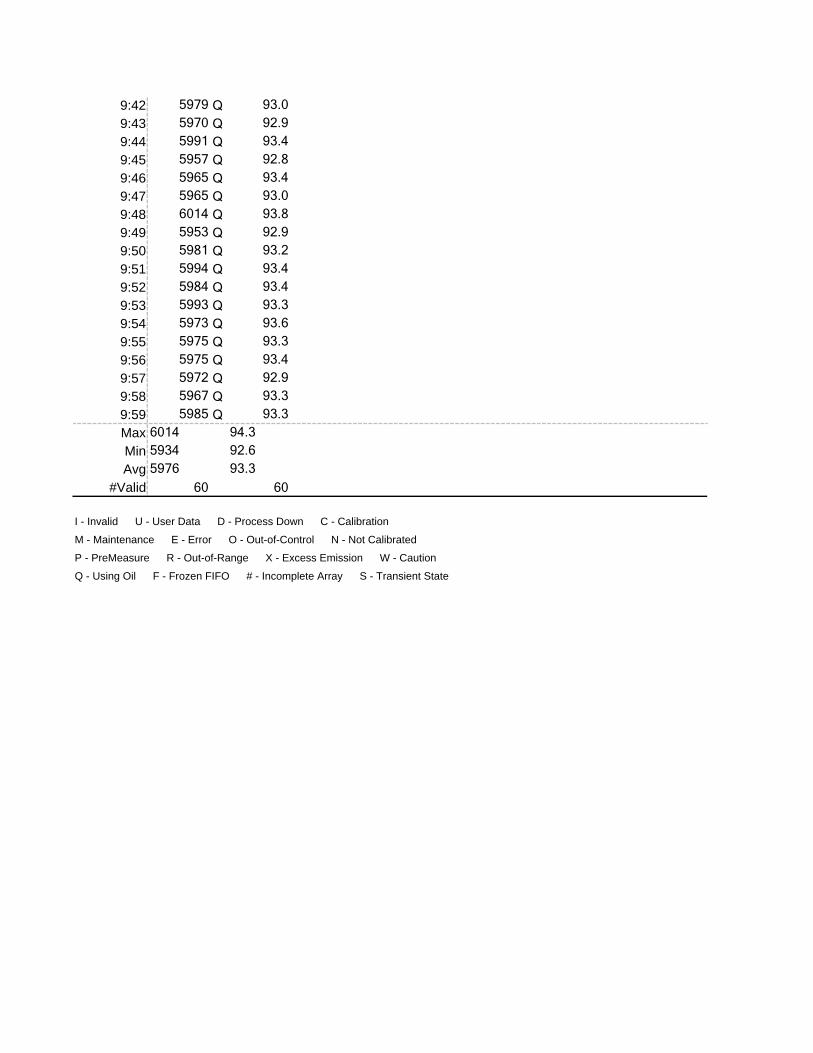
9:42 5979 Q 93.0
9:43 5970 Q 92.9
9:44 5991 Q 93.4
9:45 5957 Q 92.8
9:46 5965 Q 93.4
9:47 5965 Q 93.0
9:48 6014 Q 93.8
9:49 5953 Q 92.9
9:50 5981 Q 93.2
9:51 5994 Q 93.4
9:52 5984 Q 93.4
9:53 5993 Q 93.3
9:54 5973 Q 93.6
9:55 5975 Q 93.3
9:56 5975 Q 93.4
9:57 5972 Q 92.9
9:58 5967 Q 93.3
9:59 5985 Q 93.3
Max 6014 94.3
Min 5934 92.6
Avg 5976 93.3
#Valid 60 60
P - PreMeasure �R - Out-of-Range �X - Excess Emission �W - Caution
Q - Using Oil �F - Frozen FIFO �# - Incomplete Array �S - Transient State
I - Invalid �U - User Data �D - Process Down �C - Calibration
M - Maintenance �E - Error �O - Out-of-Control �N - Not Calibrated

Name:
10:07 5984 Q 93.4
10:08 5954 Q 93.3
10:09 5961 Q 92.9
10:10 5992 Q 93.6
10:11 6006 Q 93.3
10:12 5999 Q 93.4
10:13 5974 Q 93.0
10:14 5976 Q 93.4
10:15 5975 Q 93.7
10:16 5971 Q 93.2
10:17 5974 Q 92.6
10:18 5960 Q 93.2
10:19 5992 Q 93.5
10:20 5968 Q 93.7
10:21 5968 Q 93.5
10:22 5983 Q 92.8
10:23 5979 Q 93.0
10:24 5926 Q 92.4
10:25 5984 Q 93.2
10:26 6008 Q 93.1
10:27 5940 Q 92.5
10:28 5983 Q 93.1
10:29 5912 Q 92.5
10:30 5969 Q 93.5
10:31 5953 Q 93.3
10:32 5991 Q 93.3
10:33 5984 Q 93.2
10:34 5956 Q 93.6
10:35 5985 Q 93.6
10:36 6033 Q 93.8
10:37 5967 Q 93.4
10:38 5964 Q 93.0
10:39 6019 Q 93.6
10:40 5984 Q 93.4
10:41 5988 Q 93.5
10:42 5985 Q 93.6
10:43 5979 Q 93.6
10:44 5996 Q 93.1
10:45 5971 Q 92.9
10:46 6001 Q 93.5
10:47 5969 Q 93.0
10:48 5995 Q 93.5
NOTE: CEMS time is 1 hr behind real time.
gal/hr MW/day
1-min average report for the period from 8/7/2009 10:07:00 AM to 8/7/2009 11:06:59 AMSource: Boiler 1
Flow Oil Unit Load

10:49 5936 Q 92.8
10:50 5987 Q 92.8
10:51 5962 Q 93.3
10:52 5972 Q 93.4
10:53 6027 Q 93.6
10:54 5959 Q 93.0
10:55 5944 Q 93.2
10:56 5951 Q 93.6
10:57 5956 Q 93.4
10:58 5949 Q 92.9
10:59 5977 Q 93.1
11:00 5998 Q 93.3
11:01 5980 Q 93.8
11:02 5974 Q 93.0
11:03 5990 Q 92.8
11:04 5998 Q 93.4
11:05 6018 Q 92.8
11:06 5965 Q 93.0
Max 6033 93.8
Min 5912 92.4
Avg 5977 93.2
#Valid 60 60
P - PreMeasure �R - Out-of-Range �X - Excess Emission �W - Caution
Q - Using Oil �F - Frozen FIFO �# - Incomplete Array �S - Transient State
I - Invalid �U - User Data �D - Process Down �C - Calibration
M - Maintenance �E - Error �O - Out-of-Control �N - Not Calibrated

Name:
11:15 5993 Q 93.5
11:16 5989 Q 93.2
11:17 6018 Q 93.7
11:18 5983 Q 93.3
11:19 5963 Q 92.9
11:20 5965 Q 93.6
11:21 5960 Q 93.1
11:22 5988 Q 93.1
11:23 6017 Q 93.0
11:24 6002 Q 93.0
11:25 6013 Q 93.5
11:26 5965 Q 93.9
11:27 5971 Q 93.6
11:28 5985 Q 93.2
11:29 5973 Q 93.1
11:30 5965 Q 93.4
11:31 5988 Q 93.4
11:32 5995 Q 93.2
11:33 5945 Q 92.8
11:34 5962 Q 92.9
11:35 5984 Q 93.3
11:36 5971 Q 93.0
11:37 5975 Q 93.4
11:38 5976 Q 93.5
11:39 6006 Q 94.2
11:40 5997 Q 93.4
11:41 5973 Q 93.5
11:42 5965 Q 92.9
11:43 5968 Q 92.6
11:44 5994 Q 93.2
11:45 5975 Q 93.3
11:46 5986 Q 93.8
11:47 5994 Q 93.6
11:48 5987 Q 93.2
11:49 5989 Q 93.0
11:50 5982 Q 93.0
11:51 5975 Q 93.2
11:52 6014 Q 93.8
11:53 5983 Q 93.4
11:54 5980 Q 93.5
11:55 5968 Q 92.9
11:56 5996 Q 93.3
NOTE: CEMS Time is 1 hr behind real time.
gal/hr MW/day
1-min average report for the period from 8/7/2009 11:15:00 AM to 8/7/2009 12:14:59 PMSource: Boiler 1
Flow Oil Unit Load
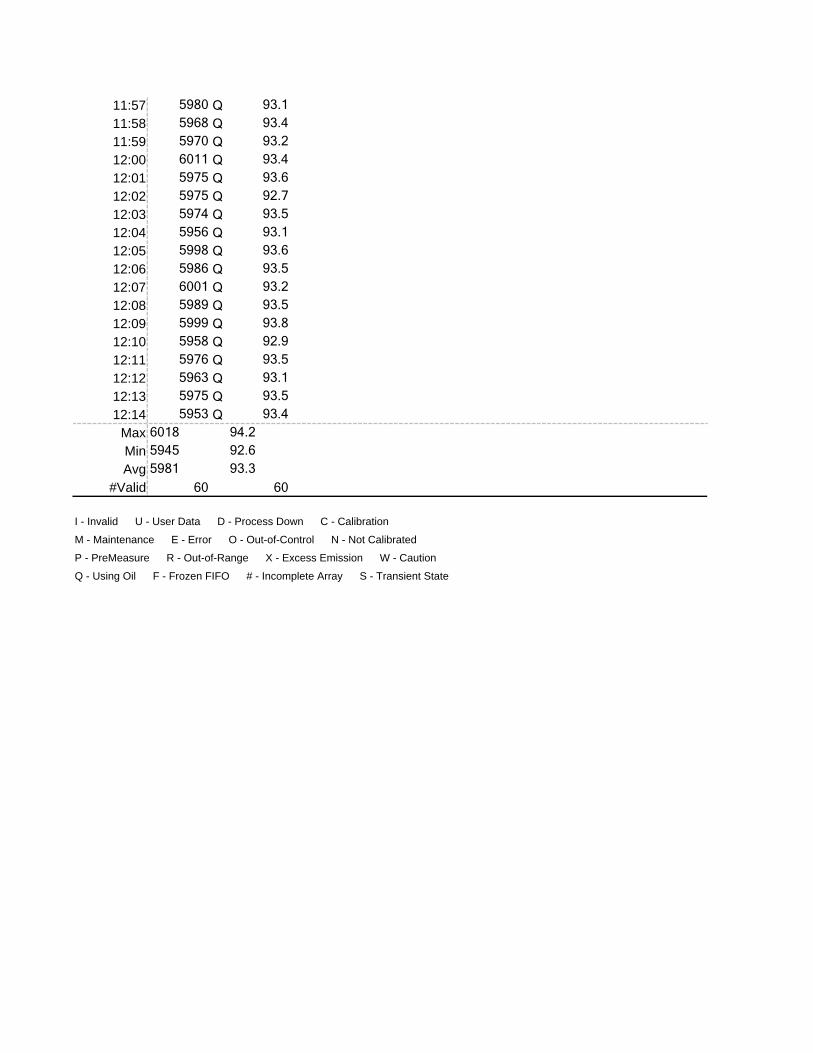
11:57 5980 Q 93.1
11:58 5968 Q 93.4
11:59 5970 Q 93.2
12:00 6011 Q 93.4
12:01 5975 Q 93.6
12:02 5975 Q 92.7
12:03 5974 Q 93.5
12:04 5956 Q 93.1
12:05 5998 Q 93.6
12:06 5986 Q 93.5
12:07 6001 Q 93.2
12:08 5989 Q 93.5
12:09 5999 Q 93.8
12:10 5958 Q 92.9
12:11 5976 Q 93.5
12:12 5963 Q 93.1
12:13 5975 Q 93.5
12:14 5953 Q 93.4
Max 6018 94.2
Min 5945 92.6
Avg 5981 93.3
#Valid 60 60
P - PreMeasure �R - Out-of-Range �X - Excess Emission �W - Caution
Q - Using Oil �F - Frozen FIFO �# - Incomplete Array �S - Transient State
I - Invalid �U - User Data �D - Process Down �C - Calibration
M - Maintenance �E - Error �O - Out-of-Control �N - Not Calibrated