revascularization first !! jeffrey w. moses, md professor of medicine columbia university medical...
TRANSCRIPT
Revascularization First !!
Jeffrey W. Moses, MDProfessor of Medicine
Columbia University Medical Center

Disclosure Statement of Financial Interest
I, Jeffrey Moses, have a financial interest/arrangement or affiliation with one or more organizations that could be perceived as a real or apparent conflict of interest in the context of the subject of this presentation.
Consultant: BSC (minor)

CASE 1
CCS Class IIStress test: Exercise ECG: 6:50 Minutes of Bruce Protocol, 2mm ST Depression, Stopped Because of Chest PainDuke Treadmill Score: -11Echo: EF: 55-60%, No Significant Valvular Disease
Clinical Presentation
New York, NY
Patient DemographicsAge: 60Gender: Male
Family History↑ LipidsHypertension
RiskFactors
NephrolithiasisPast Medical History
Treatment:Med Rx, No Further Investigation


CASE 2
• 81 y/o man with colon ca s/p chemo and resection 15 y/a, now presents with 3 months progressive L shoulder pain with exertion
• ASA 81 mg daily, doxazosin 1 mg daily
• Nuclear Stress test: small, mild, reversible inferolateral perfusion defect, LVEF 60%

Symptoms and QOL
56 57 59 59
4750
5356
21
42
53
42
33
23
0
10
20
30
40
50
60
Baseline 1 3 6 12 24 36
Months
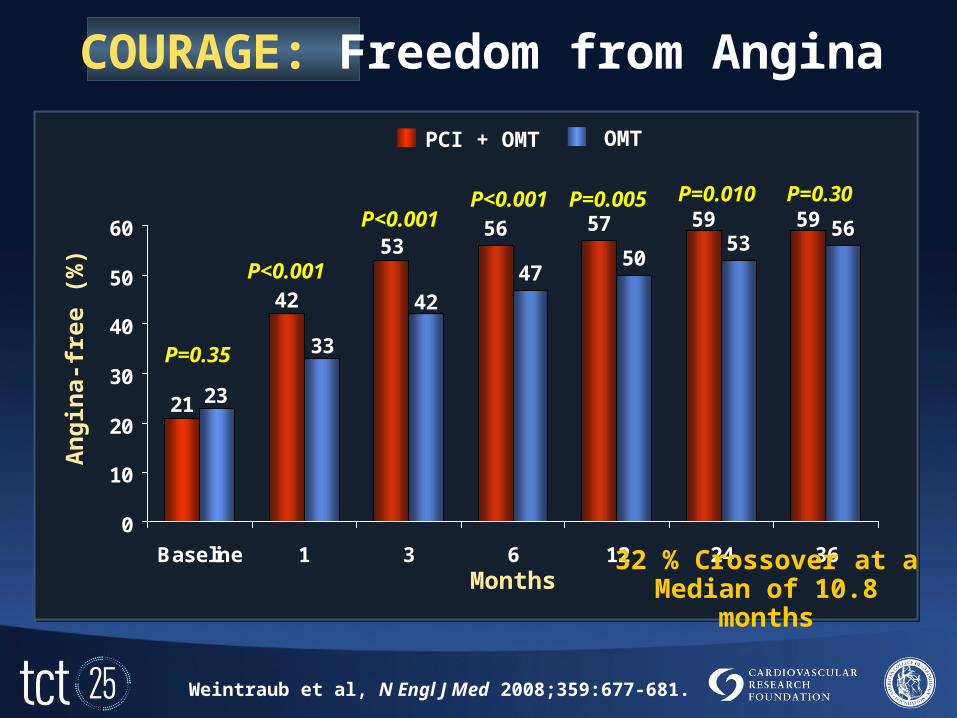
COURAGE: Freedom from Angina
Weintraub et al, N Engl J Med 2008;359:677-681.
PCI + OMT OMT
An
gin
a-fr
ee (
%)
P=0.35
P<0.001
P<0.001P<0.001 P=0.005 P=0.010 P=0.30
32 % Crossover at a Median of 10.8 months

Top Tercile (weekly)
COURAGE: Angina Frequency
PCI plus OMT OMT P Value
First
Baseline 35 + 14 35 + 14 0.75
1 month 68 + 27 58 + 25 <0.001
3 months 74 + 27 65 + 26 <0.001
6 months 78 + 25 72 + 25 0.02
12 months 79 + 25 75 + 23 0.09
24 months 84 + 21 79 + 23 0.03
36 months 83 + 21 82 + 22 0.94
Weintraub et al, N Engl J Med 2008;359:677-681.

PCI plus OMT OMT P Value
Second
Baseline 71 + 8 71 + 8 0.18
1 month 81 + 19 76 + 20 0.002
3 months 86 + 18 79 + 22 <0.001
6 months 87 + 18 82 + 21 0.002
12 months 88 + 17 85 + 20 0.02
24 months 90 + 16 85 + 19 0.001
36 months 89 + 18 87 + 17 0.28
Middle Tercile (monthly)
COURAGE: Angina Frequency
Weintraub et al, N Engl J Med 2008;359:677-681.

COURAGE: QOL
PCI + OMT
OMT
0
Months from Baseline
6 12 24 360
50
60
70
80
90
100
Mea
n S
core
* * **
Weintraub et al, N Engl J Med 2008;359:677-681.
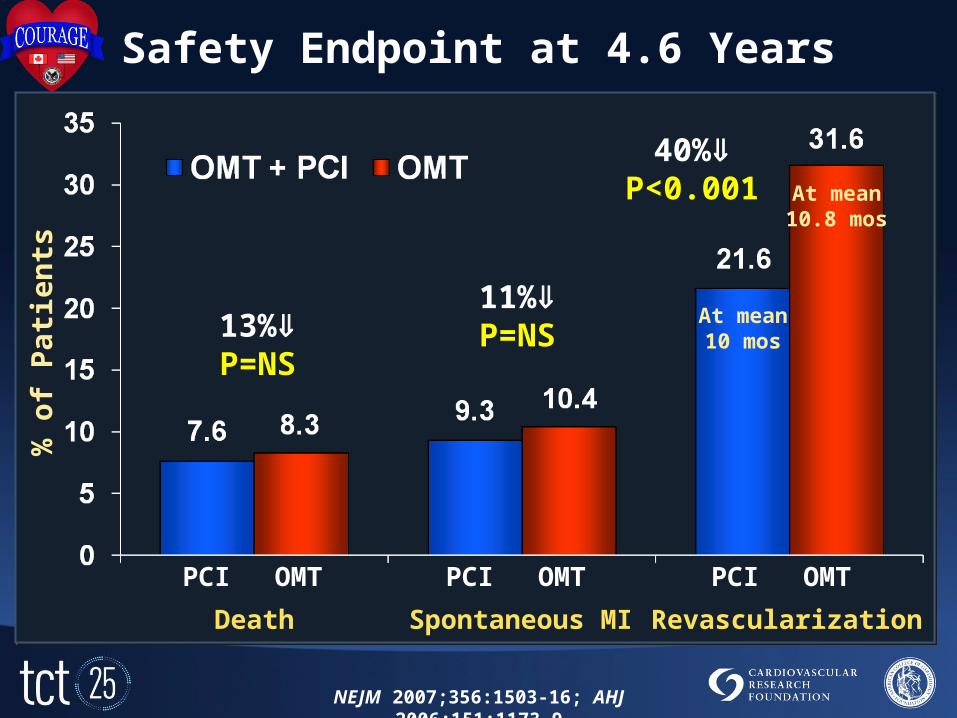
Safety Endpoint at 4.6 Years%
of
Pat
ien
ts
PCI OMT PCI OMT PCI OMT
Death Spontaneous MI Revascularization
At mean10 mos
At mean10.8 mos
40%P<0.001
13%P=NS
11%P=NS
NEJM 2007;356:1503-16; AHJ 2006;151:1173-9
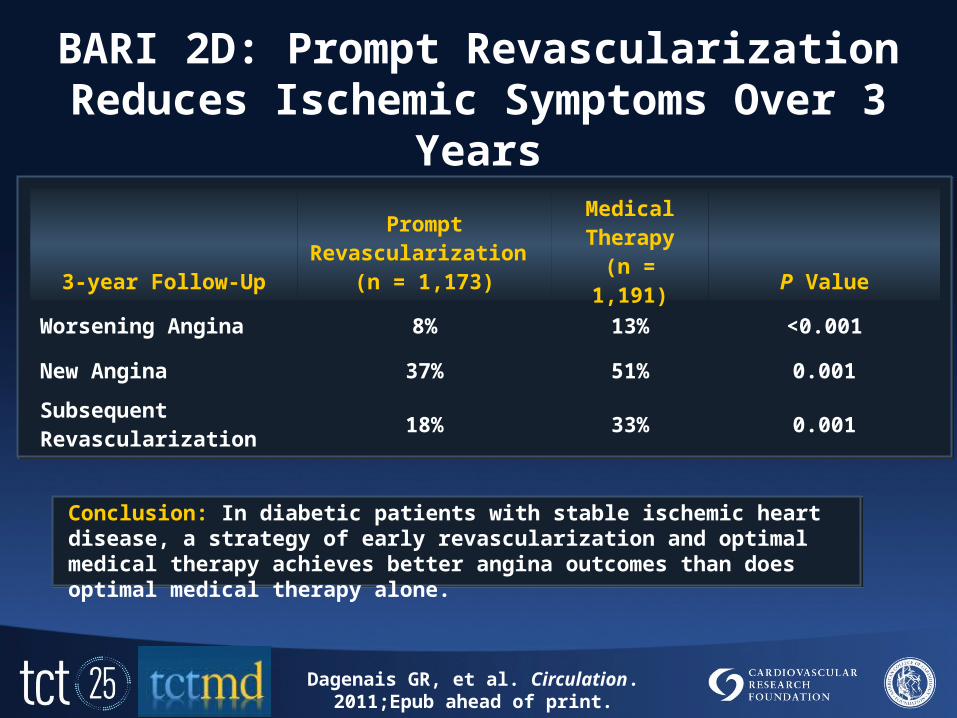
BARI 2D: Prompt Revascularization Reduces Ischemic Symptoms Over 3 Years
Analysis of the BARI 2D trial
Conclusion: In diabetic patients with stable ischemic heart disease, a strategy of early revascularization and optimal medical therapy achieves better angina outcomes than does optimal medical therapy alone.
Dagenais GR, et al. Circulation.2011;Epub ahead of print.
3-year Follow-Up
PromptRevascularization
(n = 1,173)
Medical Therapy
(n = 1,191) P Value
Worsening Angina 8% 13% <0.001
New Angina 37% 51% 0.001
SubsequentRevascularization 18% 33% 0.001

BARI 2D: QOL by Revasc. Status
DASI Self-rated Health
Rev vs Med:Delta = 1.34, p = 0.002
Delta = 1.70, p = 0.017
DA
SI
Sel
f-ra
ted
Hea
lth
Courtesy of Frederick Feit, MDTCT: September 23, 2010
MedMed
RevRev
Baseline Year 1 Year 2 Year 3 Year 4
35
37
39
41
43
45
47
49
51
53
55
Baseline Year 1 Year 2 Year 3 Year 4
16
24
23
22
21
20
19
18
17

OAT
Costs of OMT
Mark et al NEJM 2009;360:774
PCI MED
Hospital $22,800 $12,700
Year 1 $3400 $5300
Year 2 $1500 $2700
BARI 2D: Lifetime costs PCI vs OMT $200 less
Dagenais GR, et al. Circulation.2011; Epub ahead of print.
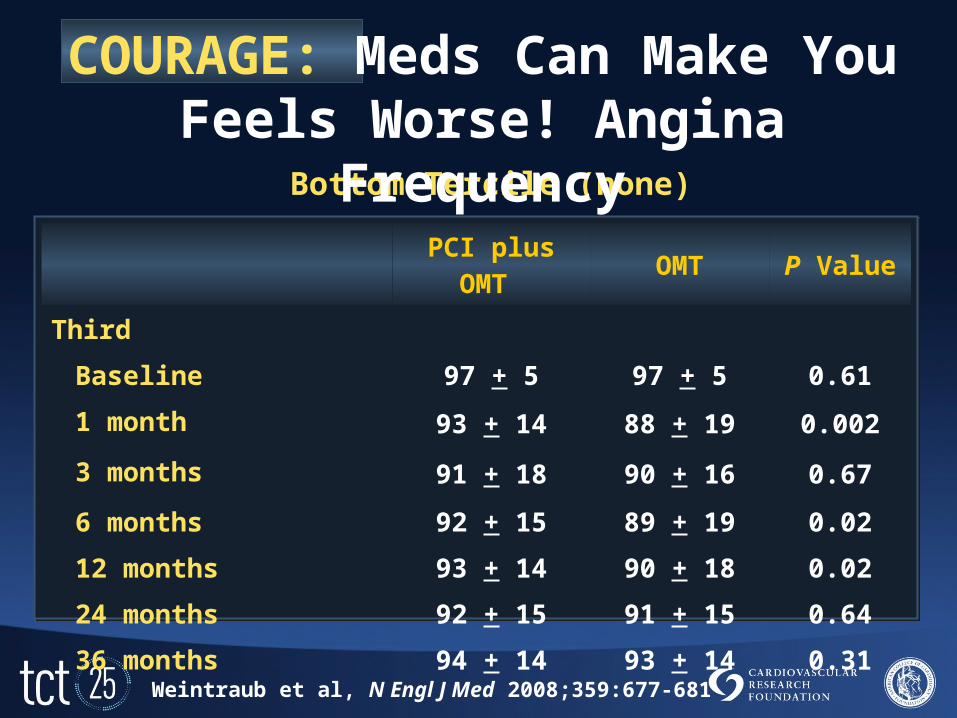
PCI plus OMT OMT P Value
Third
Baseline 97 + 5 97 + 5 0.61
1 month 93 + 14 88 + 19 0.002
3 months 91 + 18 90 + 16 0.67
6 months 92 + 15 89 + 19 0.02
12 months 93 + 14 90 + 18 0.02
24 months 92 + 15 91 + 15 0.64
36 months 94 + 14 93 + 14 0.31
Bottom Tercile (none)
Weintraub et al, N Engl J Med 2008;359:677-681
COURAGE: Meds Can Make You Feels Worse! Angina Frequency
>5 Years
0.85 (0.67, 1.07)
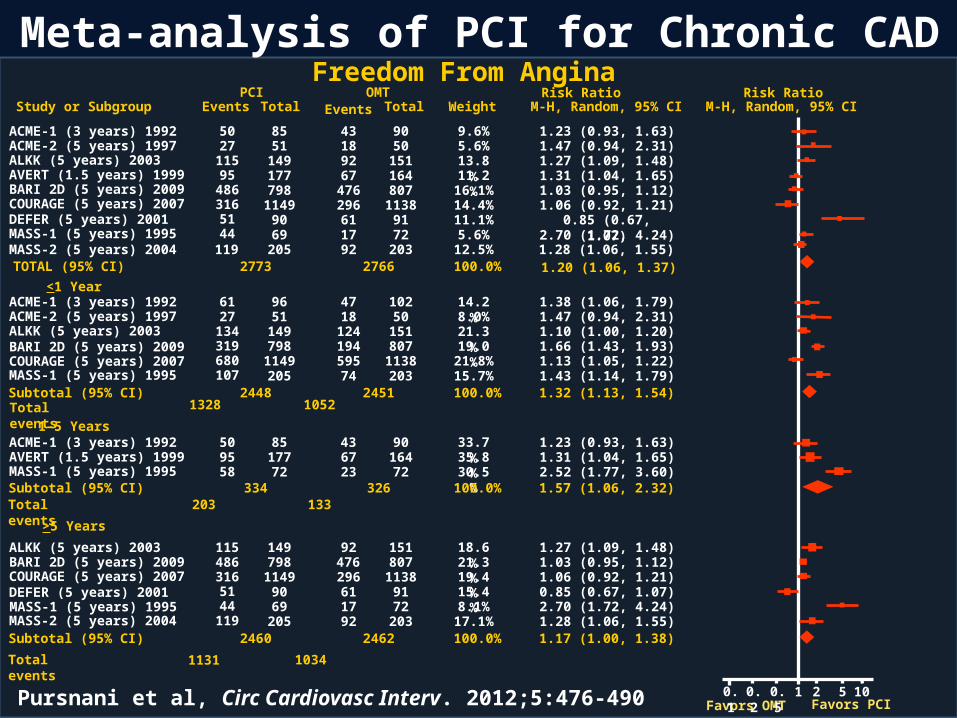
Pursnani et al, Circ Cardiovasc Interv. 2012;5:476-490
Meta-analysis of PCI for Chronic CADFreedom From Angina
Study or Subgroup EventsOMT
M-H, Random, 95% CI M-H, Random, 95% CI
ACME-1 (3 years) 1992 50 85 1.23 (0.93, 1.63)
PCITotal Events Total Weight
Risk Ratio
43 90
Risk Ratio
9.6%ACME-2 (5 years) 1997 27 51 1.47 (0.94, 2.31)18 50 5.6%ALKK (5 years) 2003 115 149 1.27 (1.09, 1.48)92 151 13.8%AVERT (1.5 years) 1999 95 177 1.31 (1.04, 1.65)67 164 11.2%BARI 2D (5 years) 2009 486 798 1.03 (0.95, 1.12)476 807 16.1%COURAGE (5 years) 2007 316 1149 1.06 (0.92, 1.21)296 1138 14.4%DEFER (5 years) 2001 51 61 91 11.1%MASS-1 (5 years) 1995
90
MASS-2 (5 years) 200444 69 2.70 (1.72, 4.24)17 72 5.6%
119 205 1.28 (1.06, 1.55)92 203 12.5%TOTAL (95% CI) 2773 2766 100.0%
<1 Year
Favors OMT Favors PCI0.1 0.2 0.5 1 2 5 10
1.20 (1.06, 1.37)
ACME-1 (3 years) 1992 61 96 1.38 (1.06, 1.79)47 102 14.2%ACME-2 (5 years) 1997 27 51 1.47 (0.94, 2.31)18 50 8.0%ALKK (5 years) 2003 134 149 1.10 (1.00, 1.20)124 151 21.3%
319 798 1.66 (1.43, 1.93)194 807 19.0%BARI 2D (5 years) 2009680 1149 1.13 (1.05, 1.22)595 1138 21.8%COURAGE (5 years) 2007107 205 1.43 (1.14, 1.79)74 203 15.7%MASS-1 (5 years) 1995
Subtotal (95% CI) 2448 2451 100.0% 1.32 (1.13, 1.54)10521328Total events
ACME-1 (3 years) 1992 50 85 1.23 (0.93, 1.63)43 90 33.7%AVERT (1.5 years) 1999 95 177 1.31 (1.04, 1.65)67 164 35.8%MASS-1 (5 years) 1995 58 72 2.52 (1.77, 3.60)23 72 30.5%Subtotal (95% CI) 334 326 100.0% 1.57 (1.06, 2.32)
133203Total events
1-5 Years
ALKK (5 years) 2003 115 149 1.27 (1.09, 1.48)92 151 18.6%BARI 2D (5 years) 2009 486 798 1.03 (0.95, 1.12)476 807 21.3%COURAGE (5 years) 2007 316 1149 1.06 (0.92, 1.21)296 1138 19.4%
51 90 0.85 (0.67, 1.07)61 91 15.4%DEFER (5 years) 200144 69 2.70 (1.72, 4.24)17 72 8.1%MASS-1 (5 years) 1995119 205 1.28 (1.06, 1.55)92 203 17.1%MASS-2 (5 years) 2004
Subtotal (95% CI) 2460 2462 100.0% 1.17 (1.00, 1.38)
10341131Total events

Does PCI reduce Death and MI?
Probably YES! (in the right pt)

MASS II 10-year Follow-up
MED203
CABG205
PCI203
CD/MI/CVA 48% 30% 33%
D/MI/CVA 58.5% 43.8% 43.8%
Angina Free 43% 64% 59%
Hueb et al, Circ 2010 August
58% 3VD

0
5
10
15
20
25
30
Cu
mu
lati
ve i
nci
den
ce (
%)
166 156 145 133 117 106 93 74 64 52 41 25 13Registry447 414 388 351 308 277 243 212 175 155 117 92 53PCI+MT441 414 370 322 283 253 220 192 162 127 100 70 37MT
No. at risk
0 1 2 3 4 5 6 7 8 9 10 11 12
FAME 2: Primary Outcomes
MT vs. Registry: HR 4.32 (1.75-10.7); p<0.001
PCI+MT vs. Registry: HR 1.29 (0.49-3.39); p=0.61
PCI+MT vs. MT: HR 0.32 (0.19-0.53); p<0.001
Months after randomization
De Bruyne B et al. NEJM 2012:on-line
0
5
10
15
20
25
30
Cu
mu
lati
ve i
nci
den
ce (
%)
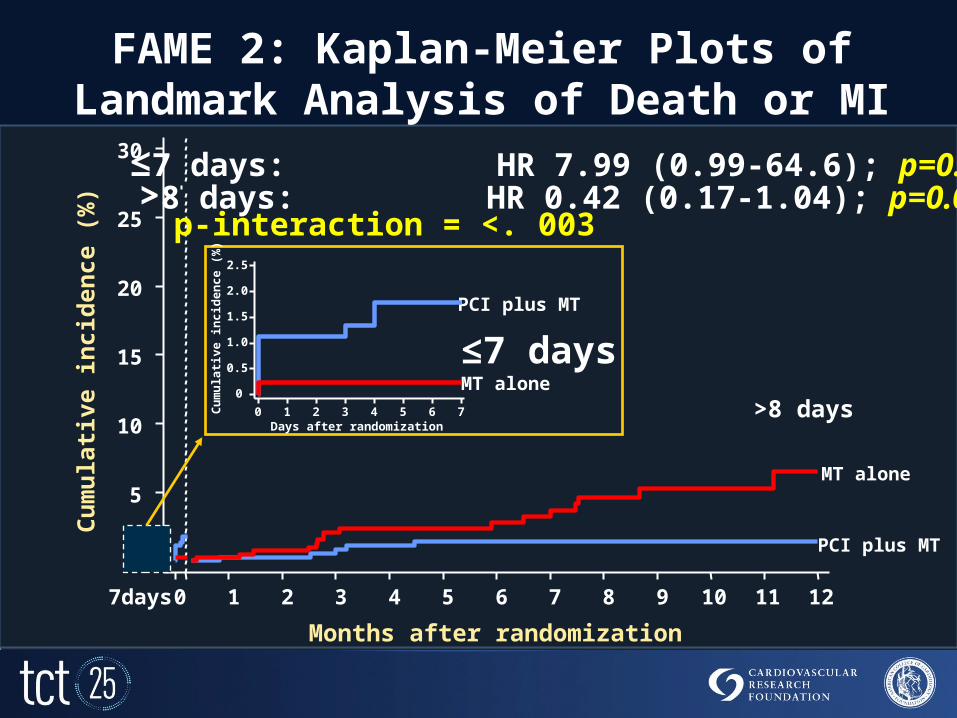
0 7days 1 2 3 4 5 6 7 8 9 10 11 12
Months after randomization
p-interaction = <. 003
>8 days: HR 0.42 (0.17-1.04); p=0.053
≤7 days: HR 7.99 (0.99-64.6); p=0.038
MT alone
PCI plus MT
MT alone
PCI plus MT
≤7 days
>8 days
FAME 2: Kaplan-Meier Plots of Landmark Analysis of Death or MI
0
0.5
1.0
1.5
2.0
2.5
Cu
mu
lati
ve
in
cid
en
ce
(%
)
0 1 2 3 4 5 6 7Days after randomization

JSAP:PCI In Stable Angina365 Patients Randomized PCI vs OMT
Kazuhiko N et al, J. AM. Coll. Cardiol. Intv. 2008;1;469-479
1.0
0 1 2 3 4 5
0.7
0.8
1.0
0
Years
0.9
Hazard ratio, 0.541; 95% CI (0.287-0.983)P=0.045
0 1 2 3 4 50
0.7
0.8
Years
0.9
Hazard ratio, 0.664; 95% CI (0.446-0.981)P=0.040
0.6
PCI plus medical therapy
Initial medical therapy only
PCI plus medical therapy
Initial medical therapy only
Initial-Medical* 176 166 146 97 14 PCI+Medical* 176 169 154 106 9
Initial-Medical* 182 177 166 115 18 PCI+Medical* 183 179 170 123 15
Death+ACS+CVA Death+ACS+CVA+hospitalization

Rates of Spontaneous MI: 12 RCTs 37,000 Patient-years
Test for interaction P=0.53
Bangalore et al. Circ 2013;on-line
.1 1Favors PCI
10
TrialPCI MT
Event IRR (95% CI) % Weight
ACME-1ACME-2ALKK-1AVERTDEFERMASS-1RITA-2SWISS-2
65
12403
2340
Favors Medical Therapy
NNo Stents
IRR (95% CI)Event N
D+L Subtotal (I-squared = 46.3%, P=0.071)I-V Subtotal
Random Effects Poisson Regression
10750
1511649172
514105
10551
1491779072
50496
359423
259
0.51 (0.13, 2.04)0.98 (0.28, 3.39)0.76 (0.32, 1.80)0.92 (0.23, 3.70)5.06 (0.24, 105.30)1.00 (0.20, 4.95)1.11 (0.63, 1.95)0.25 (0.12, 0.51)0.72 (0.43, 1.22)0.71 (0.50, 1.00)
3.003.666.743.000.672.30
12.308.84
40.52
0.76 (0.58, 0.99)
I-V OverallD+L Overall (I-squared = 31.6%, P=0.138) 0.77 (0.60, 0.99)
0.82 (0.69, 0.97)100.00
Stents
D+L Subtotal (I-squared = 0.0%, P=0.556)I-V Subtotal
BARI 2DCOURAGEJSAPMASS-2
621197
31
8071138192203
7981149192205
57108
321
0.93 (0.65, 1.33)0.90 (0.69, 1.17)0.43 (0.11, 1.66)0.67 (0.39, 1.17)0.86 (0.71, 1.05)0.86 (0.71, 1.05)
19.5624.143.13
12.6459.48

Cardiac Mortality
Test for interaction P=0.03
Bangalore et al. Circ 2013;on-line
.1 1Favors PCI
10
TrialPCI MT
Event % Weight
ALKK-1AVERTDEFERMASS-1RITA-2SWISS-2
14132
2222
Favors Medical Therapy
NNo Stents
IRR (95% CI)Event N
D+L Subtotal (I-squared = 36.6%, P=0.162)I-V Subtotal
Random Effects Poisson Regression
1511649172
514105
1491779072
50496
4124
133
I-V OverallD+L Overall (I-squared = 49.7%, P=0.036)
Stents
D+L Subtotal (I-squared = 0.0%, P=0.625)I-V Subtotal
BARI 2DCOURAGEJSAPMASS-2
33253
25
8071138192203
7981149192205
44232
24
0.29 (0.10, 0.88)0.92 (0.06, 14.79)0.67 (0.11, 4.03)2.00 (0.37, 10.92)0.60 (0.30, 1.20)0.15 (0.04, 0.50)
0.47 (0.24, 0.93)0.48 (0.30, 0.77)
8.872.044.394.79
14.697.96
42.74
0.70 (0.44, 1.09)
0.74 (0.49, 1.11)0.86 (0.67, 1.11)
100.00
1.35 (0.86, 2.12)0.91 (0.52, 1.61)0.67 (0.11, 3.99)0.95 (0.54, 1.66)1.08 (0.80, 1.45)1.08 (0.80, 1.45)
19.0516.854.39
16.9757.26
IRR (95% CI)
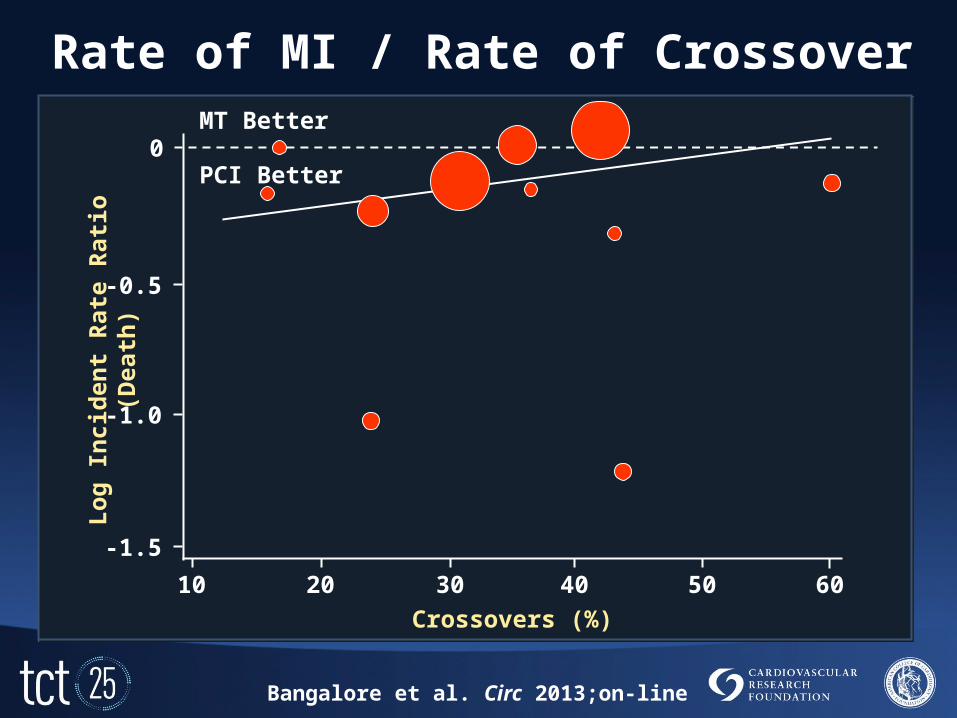
Rate of MI / Rate of Crossover
Bangalore et al. Circ 2013;on-line
Crossovers (%)
Lo
g I
nci
den
t R
ate
Rat
io (
Dea
th)
MT Better
PCI Better
40
-1.5
0
50 60302010
-1.0
-0.5
Odds Ratio (95% Confidence Interval)
Overall
Trial
Sievers et al.
Dakik et al.ACIP
ACME-1
TIME
ALKK
AVERT
Bech et al.MASS
ACME-2
RITA-2
Year of Publication
1993
19981997
1997
2004
2003
1999
20011999
1997
2003
271/3675
PCI
0/44
1/212/192
16/115
45/153
6/149
1/177
2/906/72
9/51
43/504
335/3838
Medical
1/44
1/2320/366
15/112
40/148
17/151
1/164
4/916/72
10/50
43/514
Deaths/Total
SWISSI II
DANAMI
COURAGE
INSPIRE
Hambrecht et al.
MASS II2007
2006
2007
2006
2004
20066/96
19/503
85/1149
2/10428/205
22/105
24/505
95/1138
1/10135/203
0/50 0/51
1.1 10
Random effects modelFixed effects model
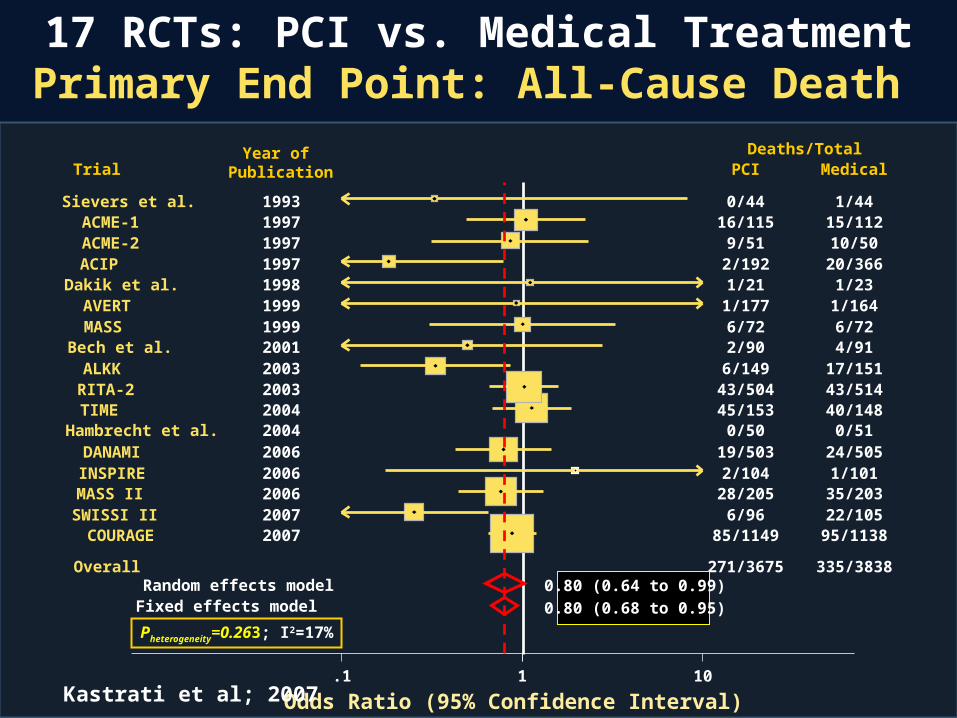
Pheterogeneity=0.263; I2=17%
17 RCTs: PCI vs. Medical TreatmentPrimary End Point: All-Cause Death
Kastrati et al; 2007
0.80 (0.64 to 0.99)
0.80 (0.68 to 0.95)

PCI vs. Med Rx-21Trials: Mortality
Jeremias et al, Am Jour Med 2009;122:152-161.
ACME-1 1.11 0.52 2.37TOPS 0.14 0.00 7.31Sievers et al 0.14 0.00 6.82MASS I (PCI) 1.00 0.31 3.25ACIP 0.31 0.13 0.76RITA-2 1.02 0.66 1.59ACME-2 0.86 0.32 2.32DANAMI 0.82 0.43 1.53Dakik et al 1.16 0.07 19.41Horie et al 0.21 0.04 1.11AVERT 0.93 0.06 14.90TOAT 2.12 0.21 21.13Bech et al 0.51 0.10 2.58TIME 1.12 0.68 1.86ALKK 0.36 0.15 0.84MASS Il (PCI) 0.95 0.56 1.62DECOPI 0.83 0.31 2.23OAT 1.04 0.76 1.42INSPIRE 1.90 0.20 18.51SWISS II 0.30 0.13 0.66COURAGE 0.90 0.64 1.27
0.67 1.00
Study ORLowerLimit
UpperLimit Odds Ratio and 95%
Combined 0.82Favors Revasc. Favors Med.
0.01 0.1 1 10 100

Safety Endpoint at 4.6 Years%
of
Pat
ien
ts
PCI OMT PCI OMT PCI OMT
Death Spontaneous MI Revascularization
At mean10 mos
At mean10.8 mos
40%P<0.001
13%P=NS
11%P=NS
NEJM 2007;356:1503-16; AHJ 2006;151:1173-9
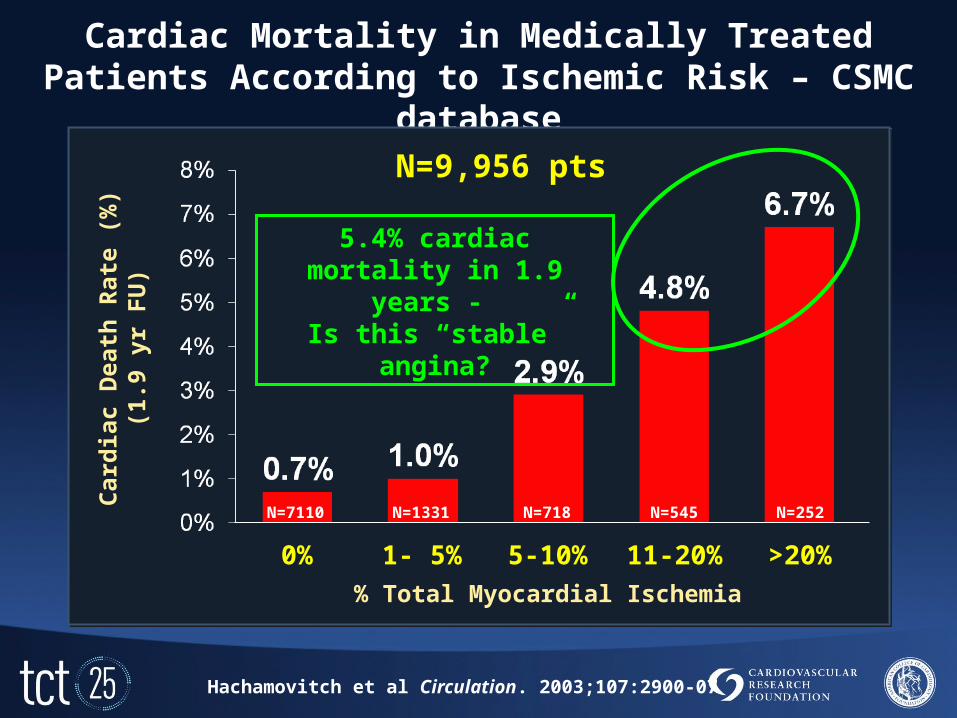
Cardiac Mortality in Medically Treated Patients According to Ischemic Risk – CSMC database
Hachamovitch et al Circulation. 2003;107:2900-07
% Total Myocardial Ischemia
0% 1- 5% 5-10% 11-20% >20%
Car
dia
c D
eath
Rat
e (%
)(1
.9 y
r F
U)
N=7110 N=1331 N=718 N=545 N=252
N=9,956 pts
5.4% cardiac mortality in 1.9 years -
Is this “stable” angina?
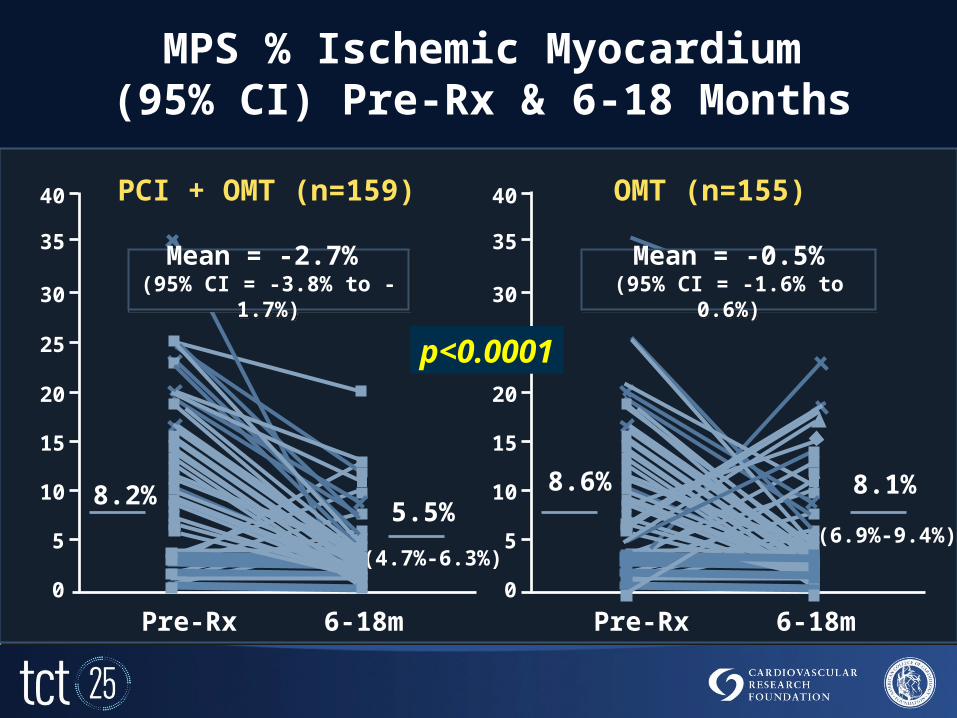
MPS % Ischemic Myocardium(95% CI) Pre-Rx & 6-18 Months
0
40
5
10
15
20
25
35
30
Pre-Rx 6-18m
8.2%5.5%
(4.7%-6.3%)
PCI + OMT (n=159) OMT (n=155)
0
40
5
10
15
20
25
35
30
Pre-Rx 6-18m
(6.9%-9.4%)
8.6% 8.1%
Mean = -2.7% (95% CI = -3.8% to -1.7%)
Mean = -2.7% (95% CI = -3.8% to -1.7%)
Mean = -0.5%(95% CI = -1.6% to 0.6%)
Mean = -0.5%(95% CI = -1.6% to 0.6%)
p<0.0001
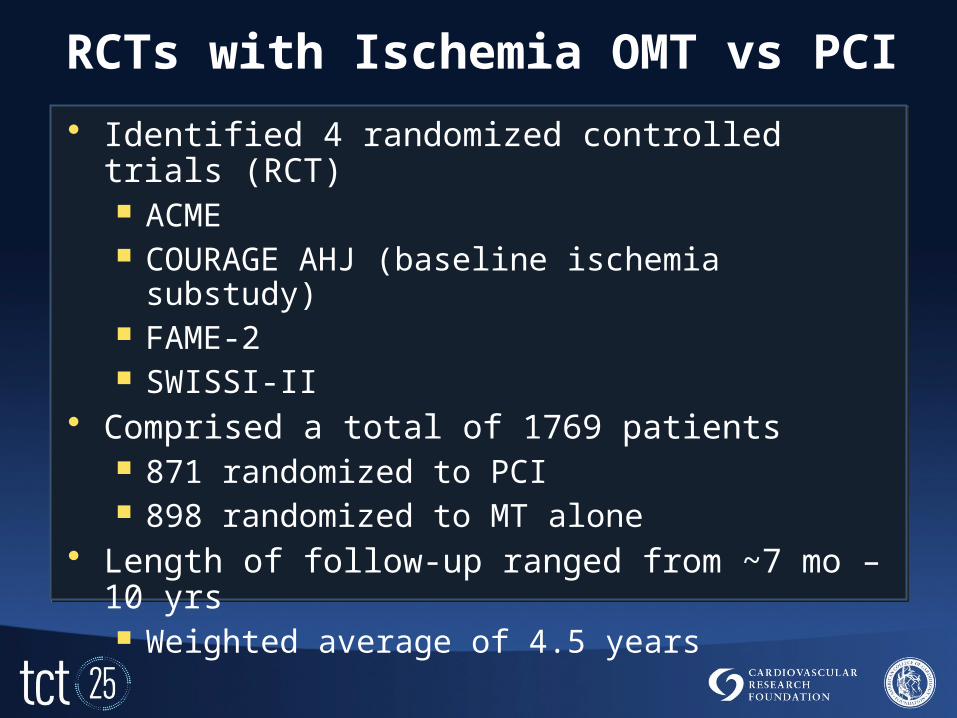
RCTs with Ischemia OMT vs PCI
• Identified 4 randomized controlled trials (RCT) ACME COURAGE AHJ (baseline ischemia substudy) FAME-2 SWISSI-II
• Comprised a total of 1769 patients 871 randomized to PCI 898 randomized to MT alone
• Length of follow-up ranged from ~7 mo – 10 yrs Weighted average of 4.5 years
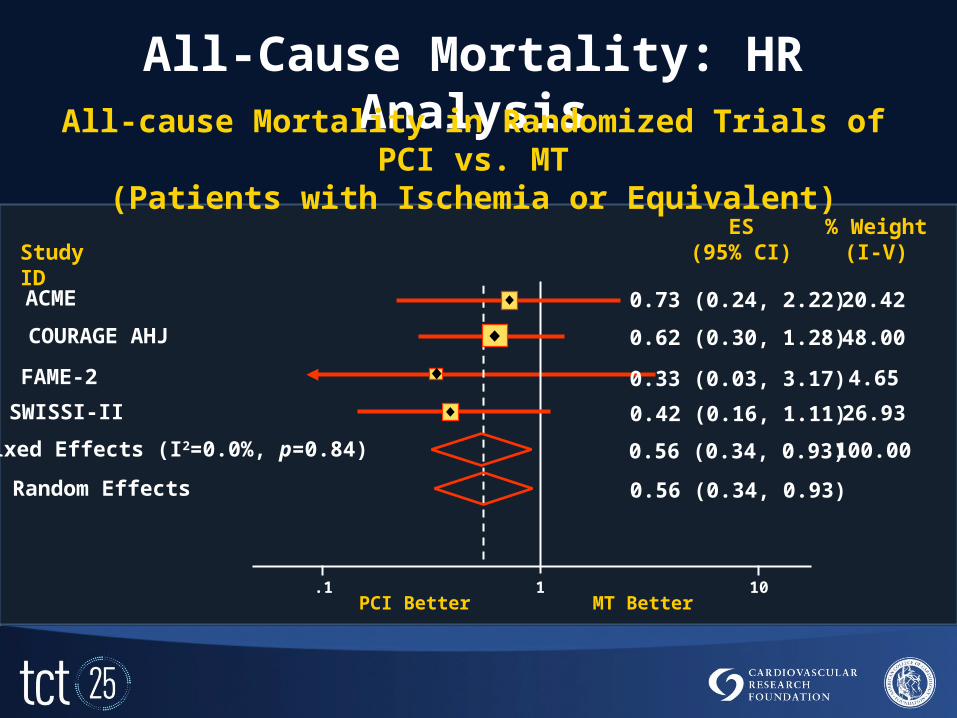
All-Cause Mortality: HR Analysis
PCI Better
Study ID
ACME
1
All-cause Mortality in Randomized Trials of PCI vs. MT(Patients with Ischemia or Equivalent)
ES(95% CI)
% Weight(I-V)
.1 10MT Better
0.73 (0.24, 2.22) 20.42
COURAGE AHJ 0.62 (0.30, 1.28) 48.00
FAME-2 0.33 (0.03, 3.17) 4.65
SWISSI-II 0.42 (0.16, 1.11) 26.93
Fixed Effects (I2=0.0%, p=0.84) 0.56 (0.34, 0.93) 100.00
Random Effects 0.56 (0.34, 0.93)

Summary of Results: Mortality• Significant 44% reduction in all-cause
mortality was observed with PCI vs. MT HR 0.56; 95% CI [0.34-0.93], p=0.02
• Point estimate of the HR for mortality favoring PCI vs. MT varied from 0.33-0.73; I2=0% Baseline ischemia cohort of the COURAGE
trial comprised 48% weight of the studies
• Analysis Using Count Data: 28/871 (3.2%) deaths with PCI 54/898 (6.0%) deaths with MT RR 0.56; 95% CI [0.36-0.87], p=0.01
PCI Better
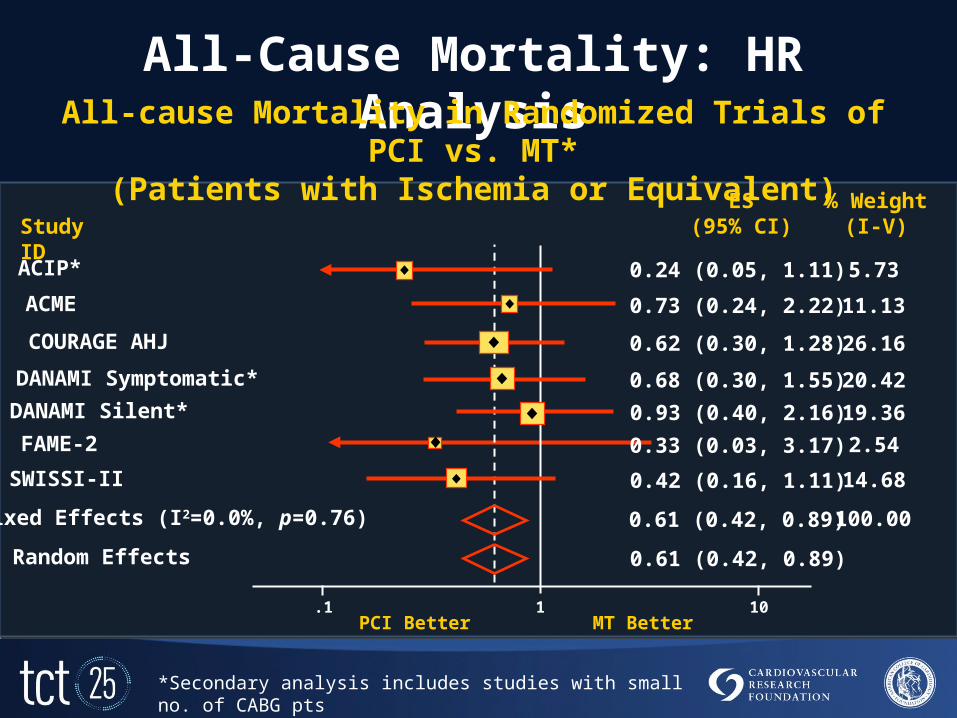
Study ID
ACME
1
ES(95% CI)
% Weight(I-V)
.1 10MT Better
0.73 (0.24, 2.22) 11.13
COURAGE AHJ 0.62 (0.30, 1.28) 26.16
FAME-2 0.33 (0.03, 3.17) 2.54
SWISSI-II 0.42 (0.16, 1.11) 14.68
Fixed Effects (I2=0.0%, p=0.76) 0.61 (0.42, 0.89) 100.00
Random Effects 0.61 (0.42, 0.89)
ACIP* 0.24 (0.05, 1.11) 5.73
DANAMI Symptomatic* 0.68 (0.30, 1.55) 20.42
DANAMI Silent* 0.93 (0.40, 2.16) 19.36
All-Cause Mortality: HR AnalysisAll-cause Mortality in Randomized Trials of PCI vs. MT*
(Patients with Ischemia or Equivalent)
*Secondary analysis includes studies with small no. of CABG pts

0
10
20
30
40
50
60
70
80
Inappropriate Uncertain Appropriate
ACC Appropriateness Categories
Underuse and Adverse Outcomes
Ko et al, JACC 2012; in press
CABG
Pro
po
rtio
n o
f C
ard
iac
Cat
her
izat
ion
(%
)
HR: 0.99
HR: 0.57(p=0.12)
n=311 n=326 n=991
PCI
HR: 0.61(p=0.009)
Medical
1625 pts with Chronic CAD and Cath: 3 year risk : Death /ACS
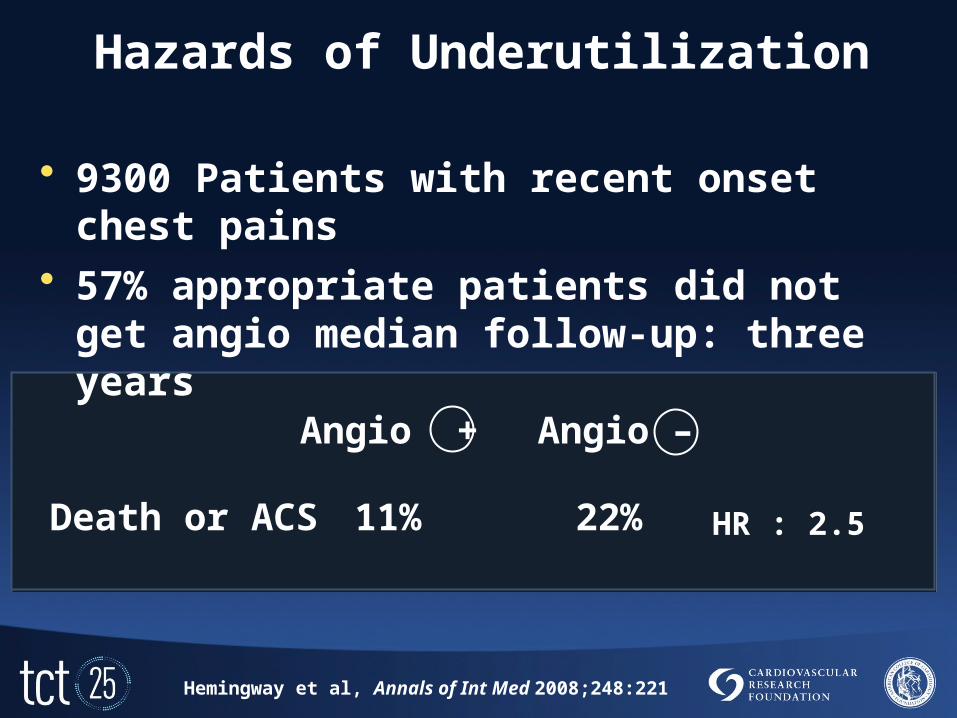
Hazards of Underutilization
• 9300 Patients with recent onset chest pains
• 57% appropriate patients did not get angio median follow-up: three years
Hemingway et al, Annals of Int Med 2008;248:221
Angio + Angio –
11% 22%Death or ACS HR : 2.5

Symptoms Med. Rx
Class llI or lV Max Rx U A A A AClass I or lI Max Rx U U A A AAsympto-matic Max Rx
I I U U UClass llI or lV No/min Rx
I U A A AClass I or lI No/min Rx
I I U U UAsympto-matic No/min Rx
I I U U UCoronary Anatomy
CTO of 1 vz.
no other disease
1-2 vz. disease
no prox. LAD
1 vz. disease of prox.
LAD
2 vz. disease
with prox. LAD
3 vz. disease no Left Main
Low-Risk Findings on Non-invasive Study
Patel et al JACC 2009 53 (February): 530-553
Asymptomatic
Stress Test Med. Rx
High Risk Max Rx U A A A AHigh Risk No/min Rx
U U A A AInt. Risk Max Rx U U U U AInt. Risk No/min Rx
I I U U ALow Risk Max Rx I I U U ULow Risk No/min Rx
I I U U UCoronary Anatomy CTO of 1
vz.no other disease
1-2 vz. disease
no prox. LAD
1 vz. disease of prox.
LAD
2 vz. disease
with prox. LAD
3 vz. disease no Left Main
Appropriateness Ratings by Low-Risk Findings on Noninvasive Imaging Study and Asymptomatic
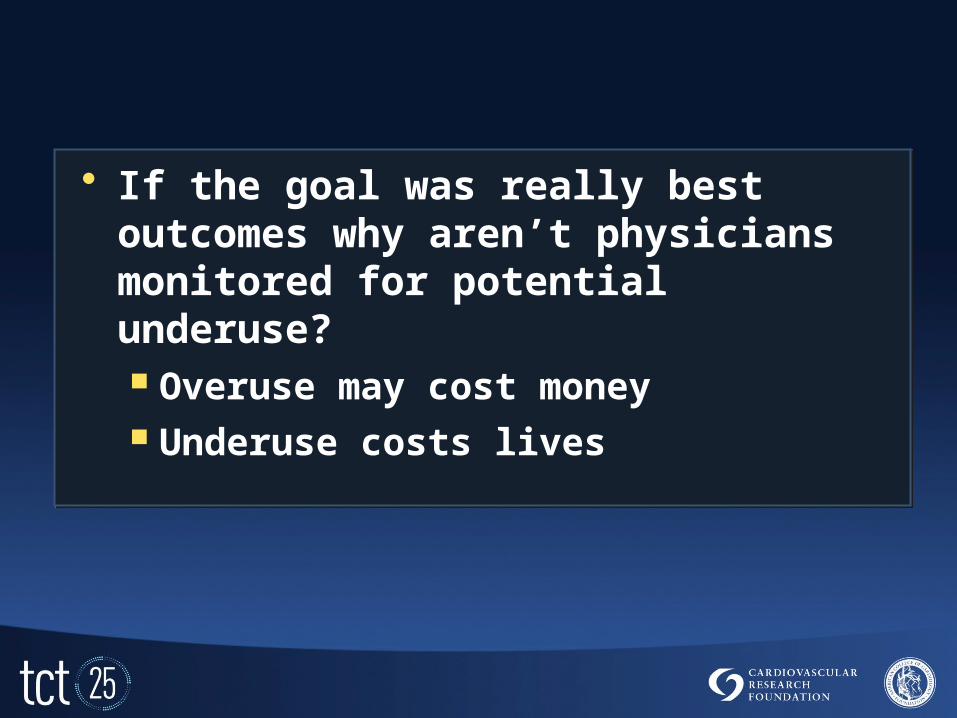
• If the goal was really best outcomes why aren’t physicians monitored for potential underuse? Overuse may cost money Underuse costs lives

• We have hoodwinked the patients into denying themselves treatment If you have a treatment that may help
and doesn’t harm you take it We have convinced the patient to do
the opposite

Conclusions • In cases of moderate symptoms PCI
provides immediate and superior symptomatic relief vs “OMT” (i.e., crossovers are Rx failure) with no cost of MI, death or CABG
• In cases of demonstrated ischemia or critical anatomy the overwhelming evidence favors revascularization to reduce death and MI
• “OMT” alone is safe for mild symptoms, little or no ischemia and noncritical anatomy …..Period
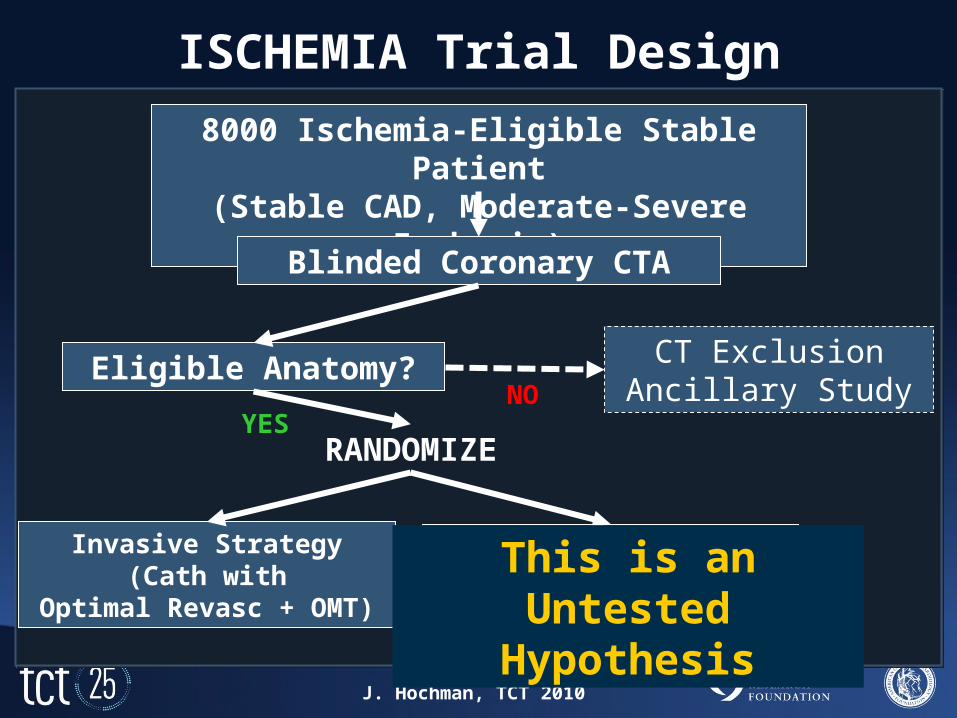
8000 Ischemia-Eligible Stable Patient(Stable CAD, Moderate-Severe Ischemia)
Blinded Coronary CTA
Eligible Anatomy?
RANDOMIZE
Invasive Strategy(Cath with
Optimal Revasc + OMT)
CT ExclusionAncillary Study
OMT Strategy(OMT Alone)
YESNO
ISCHEMIA Trial Design
J. Hochman, TCT 2010
This is an Untested Hypothesis