revelstoke financial performance report 2013
TRANSCRIPT
7/28/2019 Revelstoke Financial Performance Report 2013
http://slidepdf.com/reader/full/revelstoke-financial-performance-report-2013 1/36
Page 1 of 2
City of Revelstoke Council Report
Date: May 14, 2013 File Ref: None
To: Mayor and Council
From: Director of Finance
Subject: Revelstoke's Financial Performance Report 2013
1. ISSUE:
Each year the Director of Finance produces a report that compares Revelstoke's
financial and other statistical data with certain other municipalities, the provincial
average (excluding Vancouver) and the average of all municipalities with a population
between 5,000 and 10,000.
2. RECOMMENDATION:
THAT Revelstoke's Financial Performance Report 2013 be received for
information.
3. CAO COMMENTS:
Agree with recommendation. TP
4. BACKGROUND
4.1. This report has been provided to Council on an annual basis for many years and,
hopefully, provides further insight into how Revelstoke compares to its peers on a
purely financial basis.
4.2. The report does not take into account the goals and objectives of municipalities which
guide the decision making process in each community and has a direct effect on their
individual financial results.
4.3. The data collection deadline is May 15 of the year following the calendar year to which
the data refers. The province takes many months to collate and analyse the data which
is typically published early in the year following collection. Property tax statistics for the
current year are not usually available until much later the same year.
5. FINANCIAL IMPLICATIONS
5.1. See attached report.
6. DISCUSSION
6.1. See attached report.
7. RELEVANT LEGISLATION
7.1. None
7/28/2019 Revelstoke Financial Performance Report 2013
http://slidepdf.com/reader/full/revelstoke-financial-performance-report-2013 2/36
Page 2 of 2
8. RECOMMENDATION AND OPTIONS
8.1. THAT Revelstoke's Financial Performance Report 2013 be received for
information.
8.2. Option 1: None.
7/28/2019 Revelstoke Financial Performance Report 2013
http://slidepdf.com/reader/full/revelstoke-financial-performance-report-2013 3/36
Revelstoke’s Financial Performance Report2013
April 2013
7/28/2019 Revelstoke Financial Performance Report 2013
http://slidepdf.com/reader/full/revelstoke-financial-performance-report-2013 4/36
Revelstoke’s Financial Performance Report - 2013
1
Contents
Introduction 2 Financial Assets 3 Financial Liabilities 4 Non-financial Assets 7 Equity in Tangible Capital Assets 8 Debt 9 Development Cost Charges 11 Accumulated Surplus 12 Consolidated Revenues 13 Sales of services 16 Specific Cost Centres 20 Property Taxes 32 Conclusion 33
7/28/2019 Revelstoke Financial Performance Report 2013
http://slidepdf.com/reader/full/revelstoke-financial-performance-report-2013 5/36
Revelstoke’s Financial Performance Report - 2013
2
Introduction
This report refers to financial data for the 2011 calendar year which are the latestavailable to date1.
The charts in this report dealing with financial analysis (Charts 1 - 19) containconsolidated data. In other words, the financial results across all functions of theorganization, including utilities and investments in subsidiary operations
2. They compare
data between Revelstoke and other members of the comparison group3 as well as theaverage of all municipalities (excluding Vancouver)4, referred to simply as “Average”. Afurther statistic shows the average of all municipalities having a population between5,000 and 10,000 so Revelstoke’s performance can be measured directly with its peer group5. This statistic is referred to as “Ave 5-10k”. Where per capita information isshown the census results for 2006 have been used.
Consolidation is not relevant to the charts that refer to specific cost centres (Charts 20 – 29).
The figures used in this report are derived from the provincial database that is updated annually from information collected from each municipality. Due to data collection and reporting anomalies by the province the figures shown in the following report may not beexactly as shown in the City’s financial statements. Where errors in the provincialnumbers have been identified they have been corrected.
1
The province takes many months to compile the data from all the municipalities in BC. The numbers for each year are therefore not available until at least a year or more following the year end.2 Revelstoke Community Forest Corporation (RCFC), Revelstoke Community Energy Corporation (RCEC)and Revelstoke Community Housing Society (RCHS).3 The comparison group consists of Castlegar, Nelson, Golden, Kimberley, Merritt, Quesnel and SalmonArm. This was the comparison group chosen by the Strategic Financial Management Plan CitizensAdvisory Committee in 1998 which developed the 10 Year Capital Plan 1999-2008.4 Vancouver is excluded throughout this report because the numbers for this municipality would skew theresults of the average.5 There are 19 municipalities in this group including Revelstoke.
7/28/2019 Revelstoke Financial Performance Report 2013
http://slidepdf.com/reader/full/revelstoke-financial-performance-report-2013 6/36
Revelstoke’s Financial Performance Report - 2013
3
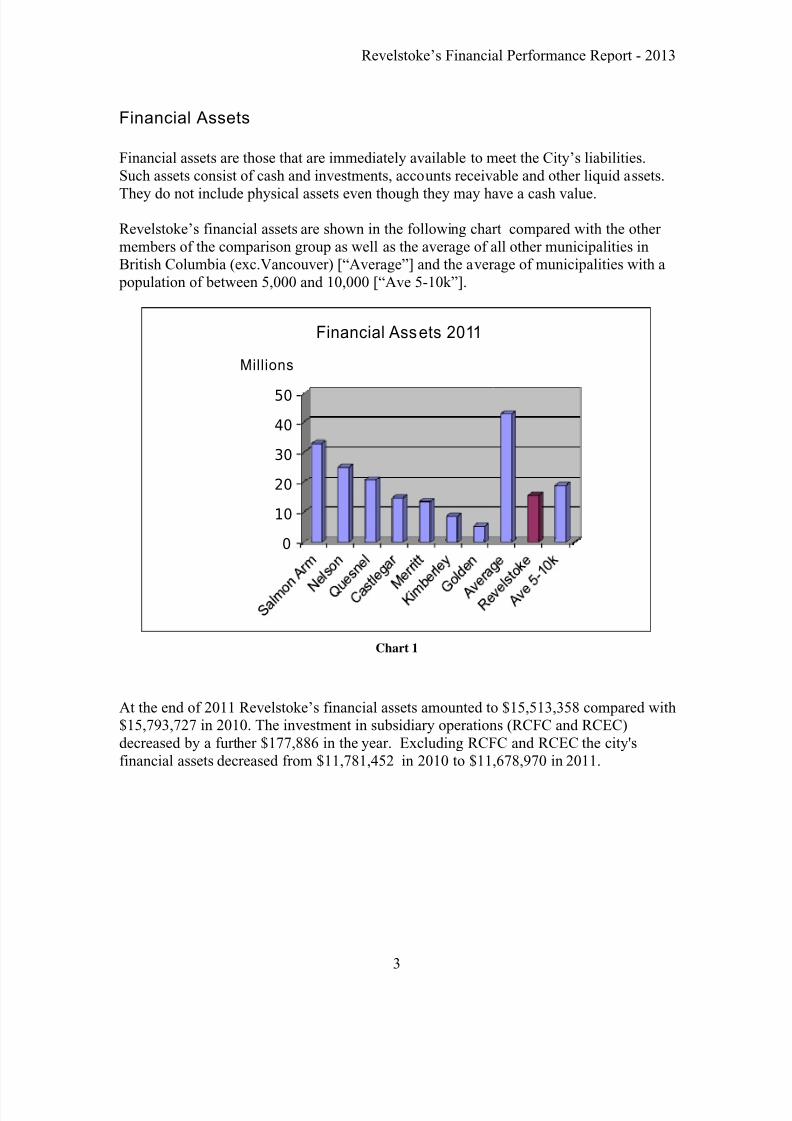
Financial Assets
Financial assets are those that are immediately available to meet the City’s liabilities.Such assets consist of cash and investments, accounts receivable and other liquid assets.
They do not include physical assets even though they may have a cash value.
Revelstoke’s financial assets are shown in the following chart compared with the other members of the comparison group as well as the average of all other municipalities inBritish Columbia (exc.Vancouver) [“Average”] and the average of municipalities with a population of between 5,000 and 10,000 [“Ave 5-10k”].
0
10
20
30
40
50
Millions
Financial Assets 2011
Chart 1
At the end of 2011 Revelstoke’s financial assets amounted to $15,513,358 compared with$15,793,727 in 2010. The investment in subsidiary operations (RCFC and RCEC)decreased by a further $177,886 in the year. Excluding RCFC and RCEC the city'sfinancial assets decreased from $11,781,452 in 2010 to $11,678,970 in 2011.
7/28/2019 Revelstoke Financial Performance Report 2013
http://slidepdf.com/reader/full/revelstoke-financial-performance-report-2013 7/36
Revelstoke’s Financial Performance Report - 2013
4
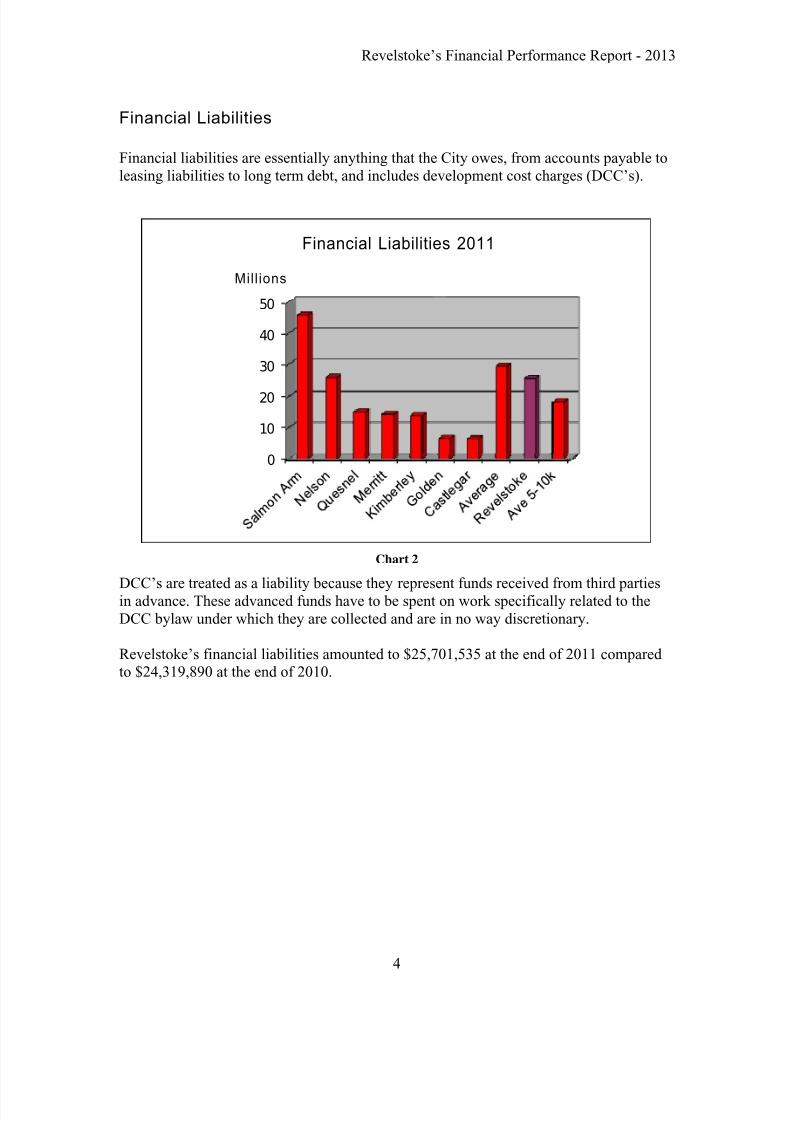
Financial Liabilities
Financial liabilities are essentially anything that the City owes, from accounts payable toleasing liabilities to long term debt, and includes development cost charges (DCC’s).
0
10
20
30
40
50
Mill ions
Financial Liabilities 2011
Chart 2
DCC’s are treated as a liability because they represent funds received from third partiesin advance. These advanced funds have to be spent on work specifically related to theDCC bylaw under which they are collected and are in no way discretionary.
Revelstoke’s financial liabilities amounted to $25,701,535 at the end of 2011 compared to $24,319,890 at the end of 2010.
7/28/2019 Revelstoke Financial Performance Report 2013
http://slidepdf.com/reader/full/revelstoke-financial-performance-report-2013 8/36
Revelstoke’s Financial Performance Report - 2013
5
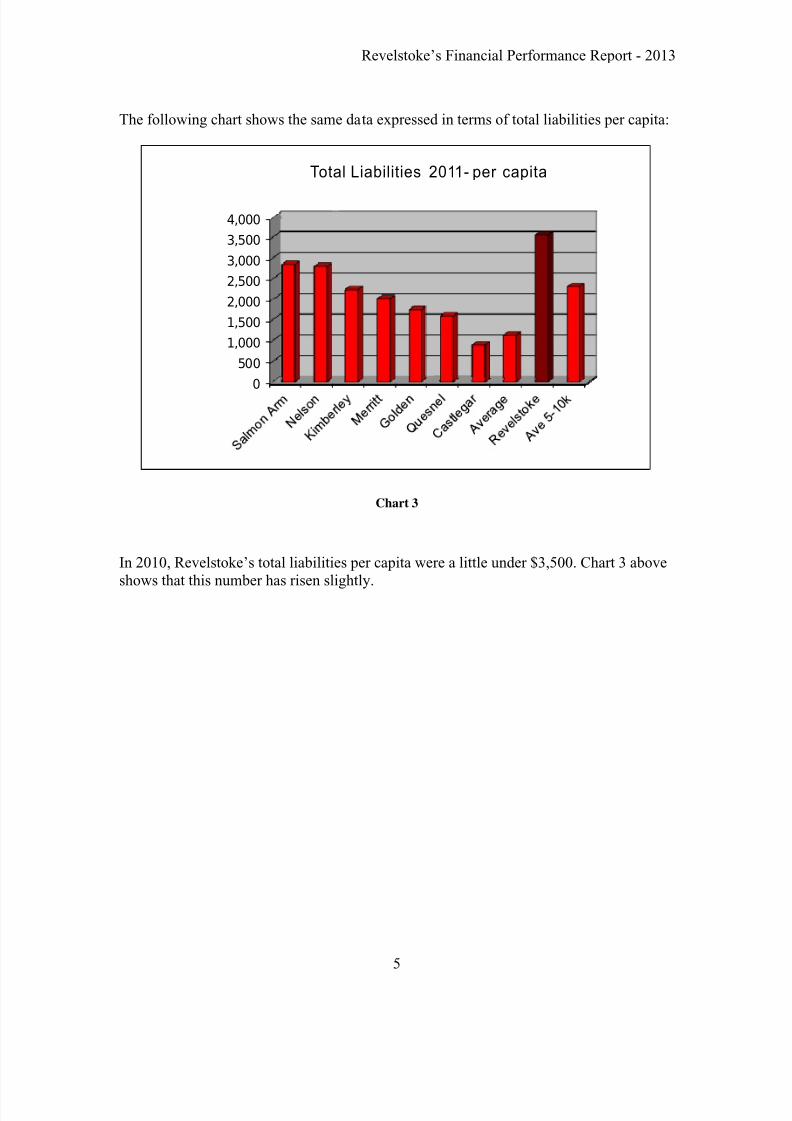
The following chart shows the same data expressed in terms of total liabilities per capita:
0
500
1,000
1,500
2,000
2,500
3,000
3,500
4,000
Total Liabilities 2011- per capita
Chart 3
In 2010, Revelstoke’s total liabilities per capita were a little under $3,500. Chart 3 aboveshows that this number has risen slightly.
7/28/2019 Revelstoke Financial Performance Report 2013
http://slidepdf.com/reader/full/revelstoke-financial-performance-report-2013 9/36
Revelstoke’s Financial Performance Report - 2013
6
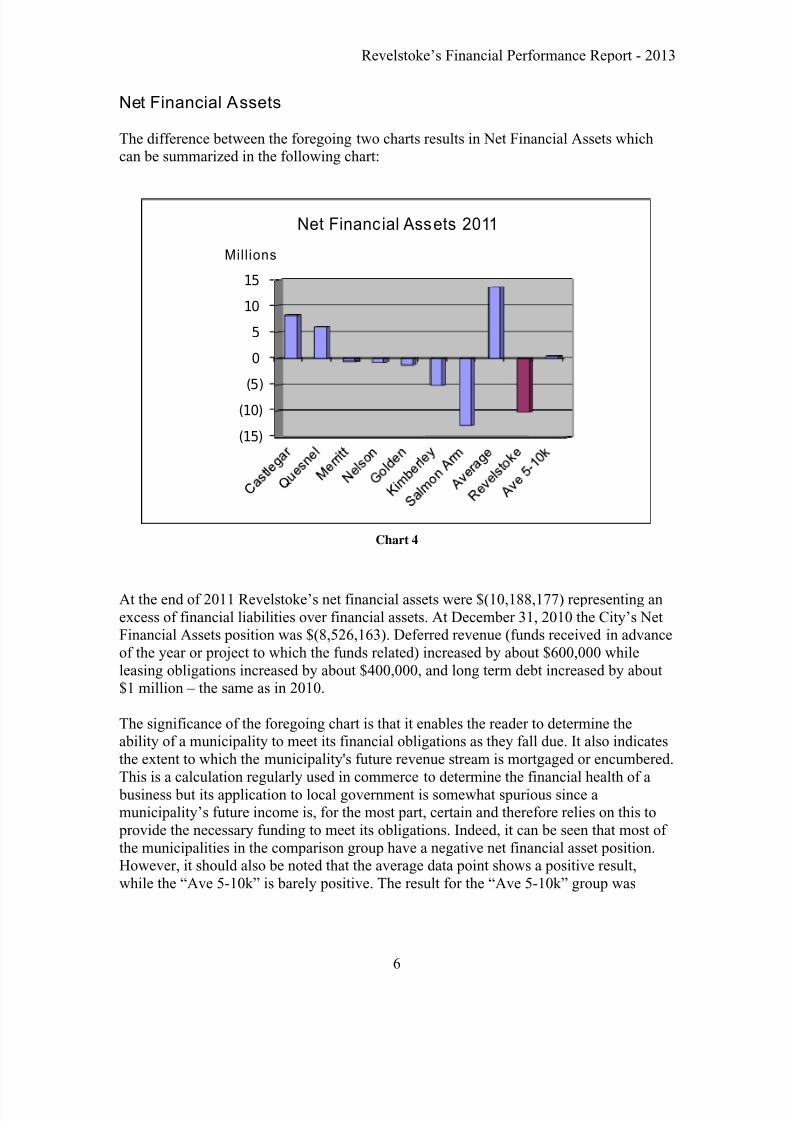
Net Financial Assets
The difference between the foregoing two charts results in Net Financial Assets whichcan be summarized in the following chart:
(15)
(10)
(5)
0
5
10
15
Mill ions
Net Financial Assets 2011
Chart 4
At the end of 2011 Revelstoke’s net financial assets were $(10,188,177) representing anexcess of financial liabilities over financial assets. At December 31, 2010 the City’s NetFinancial Assets position was $(8,526,163). Deferred revenue (funds received in advanceof the year or project to which the funds related) increased by about $600,000 whileleasing obligations increased by about $400,000, and long term debt increased by about$1 million – the same as in 2010.
The significance of the foregoing chart is that it enables the reader to determine theability of a municipality to meet its financial obligations as they fall due. It also indicatesthe extent to which the municipality's future revenue stream is mortgaged or encumbered.This is a calculation regularly used in commerce to determine the financial health of a business but its application to local government is somewhat spurious since amunicipality’s future income is, for the most part, certain and therefore relies on this to provide the necessary funding to meet its obligations. Indeed, it can be seen that most of the municipalities in the comparison group have a negative net financial asset position.However, it should also be noted that the average data point shows a positive result,while the “Ave 5-10k” is barely positive. The result for the “Ave 5-10k” group was
7/28/2019 Revelstoke Financial Performance Report 2013
http://slidepdf.com/reader/full/revelstoke-financial-performance-report-2013 10/36
Revelstoke’s Financial Performance Report - 2013
7
barely negative in 2010 so that the position for this group has improved slightly over theyear.
If the investments in RCFC/RCEC are excluded the City’s net financial assets become$(14,224,195) at the end of 2011 - $(12,538,437) at the end of 2010.
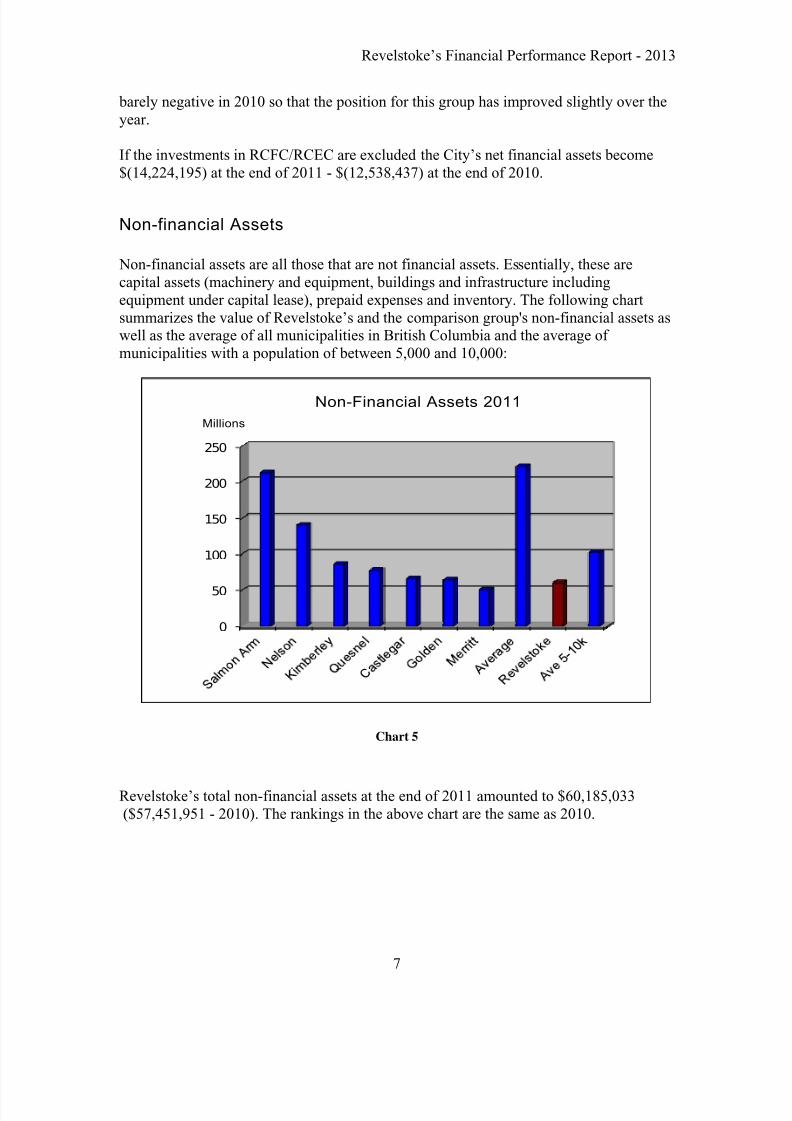
Non-financial Assets
Non-financial assets are all those that are not financial assets. Essentially, these arecapital assets (machinery and equipment, buildings and infrastructure includingequipment under capital lease), prepaid expenses and inventory. The following chartsummarizes the value of Revelstoke’s and the comparison group's non-financial assets aswell as the average of all municipalities in British Columbia and the average of municipalities with a population of between 5,000 and 10,000:
0
50
100
150
200
250
Millions
Non-Financial Assets 2011
Chart 5
Revelstoke’s total non-financial assets at the end of 2011 amounted to $60,185,033($57,451,951 - 2010). The rankings in the above chart are the same as 2010.
7/28/2019 Revelstoke Financial Performance Report 2013
http://slidepdf.com/reader/full/revelstoke-financial-performance-report-2013 11/36
Revelstoke’s Financial Performance Report - 2013
8
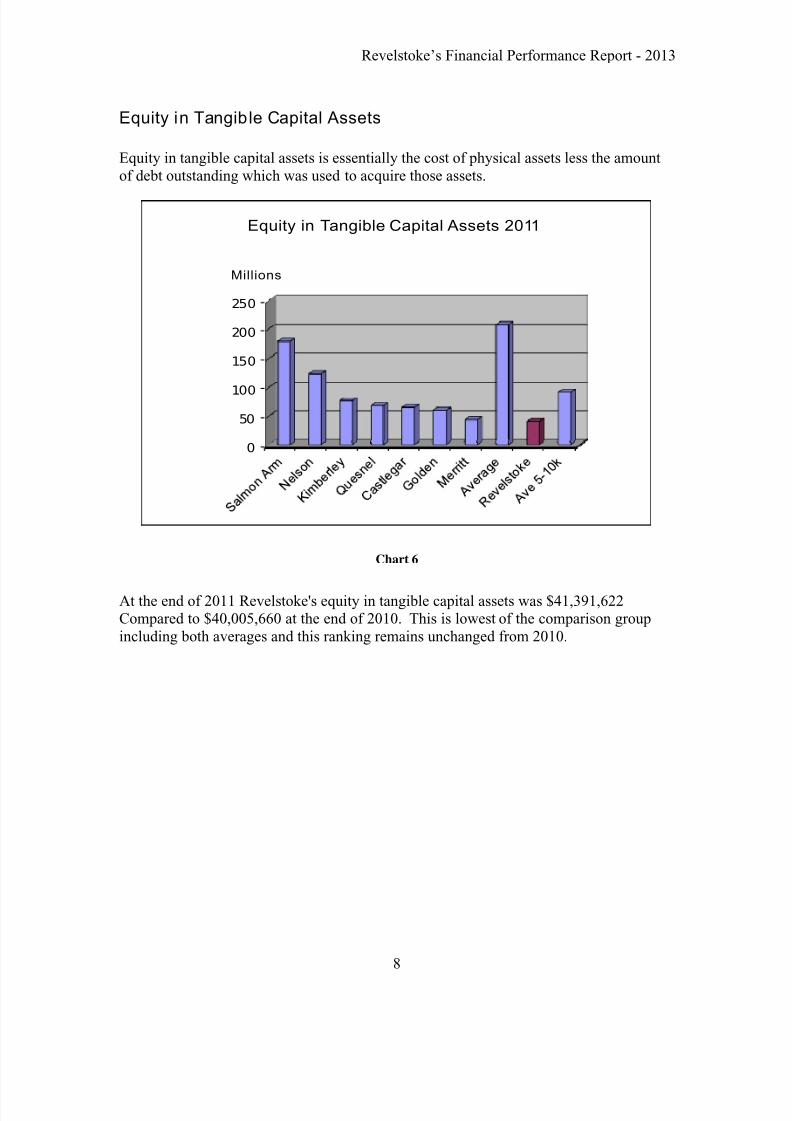
Equity in Tangible Capital Assets
Equity in tangible capital assets is essentially the cost of physical assets less the amountof debt outstanding which was used to acquire those assets.
0
50
100
150
200
250
Millions
Equity in Tangible Capital Assets 2011
Chart 6
At the end of 2011 Revelstoke's equity in tangible capital assets was $41,391,622 Compared to $40,005,660 at the end of 2010. This is lowest of the comparison groupincluding both averages and this ranking remains unchanged from 2010.

7/28/2019 Revelstoke Financial Performance Report 2013
http://slidepdf.com/reader/full/revelstoke-financial-performance-report-2013 12/36
Revelstoke’s Financial Performance Report - 2013
9
Debt
The following chart shows the total amount of long term debt6 and obligations under capital lease7 owed by Revelstoke at the end of 2011 compared to other communities in
the comparison group:
0
5
1015
20
25
30
35
Millions
Total Debt 2011
Chart 7
The total amount of debt outstanding at the end of 2011 for Revelstoke was $18,228,846($16,650,055 – 2010). This is almost double the average of all municipalities in BC aswell as municipalities with populations of between 5,000 and 10,000. It is significantlyless than Salmon Arm’s only and more than any of the other municipalities in the group.It is indicative of Revelstoke's continuing reliance on borrowing as a method of fundingits capital expenditure programme, in the absence of sufficient reserve funds or DCC's. Itis also indicative of the city's commitment to investing in its infrastructure.
6 Debt that is repayable over a period that exceeds 5 years. Revelstoke's long term debt typically isrepayable over 20 to 25 years.7 Leases are for 5 years.
7/28/2019 Revelstoke Financial Performance Report 2013
http://slidepdf.com/reader/full/revelstoke-financial-performance-report-2013 13/36
Revelstoke’s Financial Performance Report - 2013
10
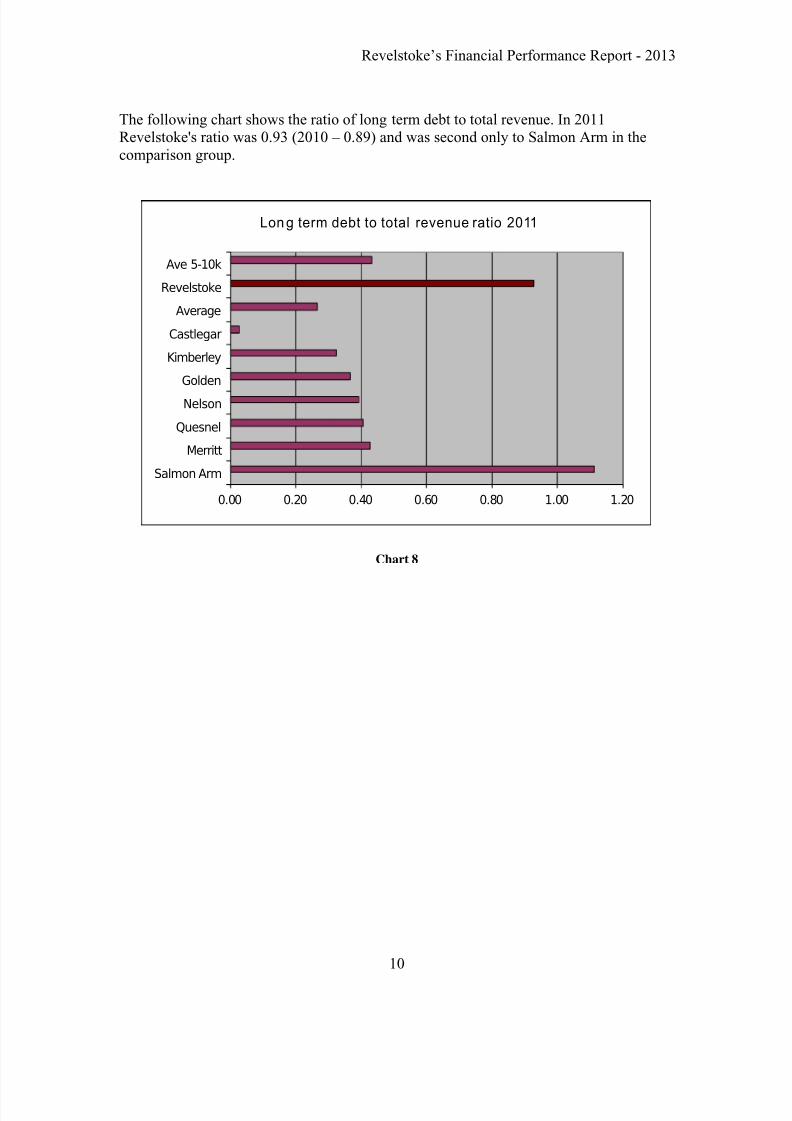
The following chart shows the ratio of long term debt to total revenue. In 2011Revelstoke's ratio was 0.93 (2010 – 0.89) and was second only to Salmon Arm in thecomparison group.
0.00 0.20 0.40 0.60 0.80 1.00 1.20
Salmon Arm
Merritt
Quesnel
Nelson
Golden
Kimberley
Castlegar
Average
Revelstoke
Ave 5-10k
Lon g term debt to total revenue ratio 2011
Chart 8
7/28/2019 Revelstoke Financial Performance Report 2013
http://slidepdf.com/reader/full/revelstoke-financial-performance-report-2013 14/36
Revelstoke’s Financial Performance Report - 2013
11
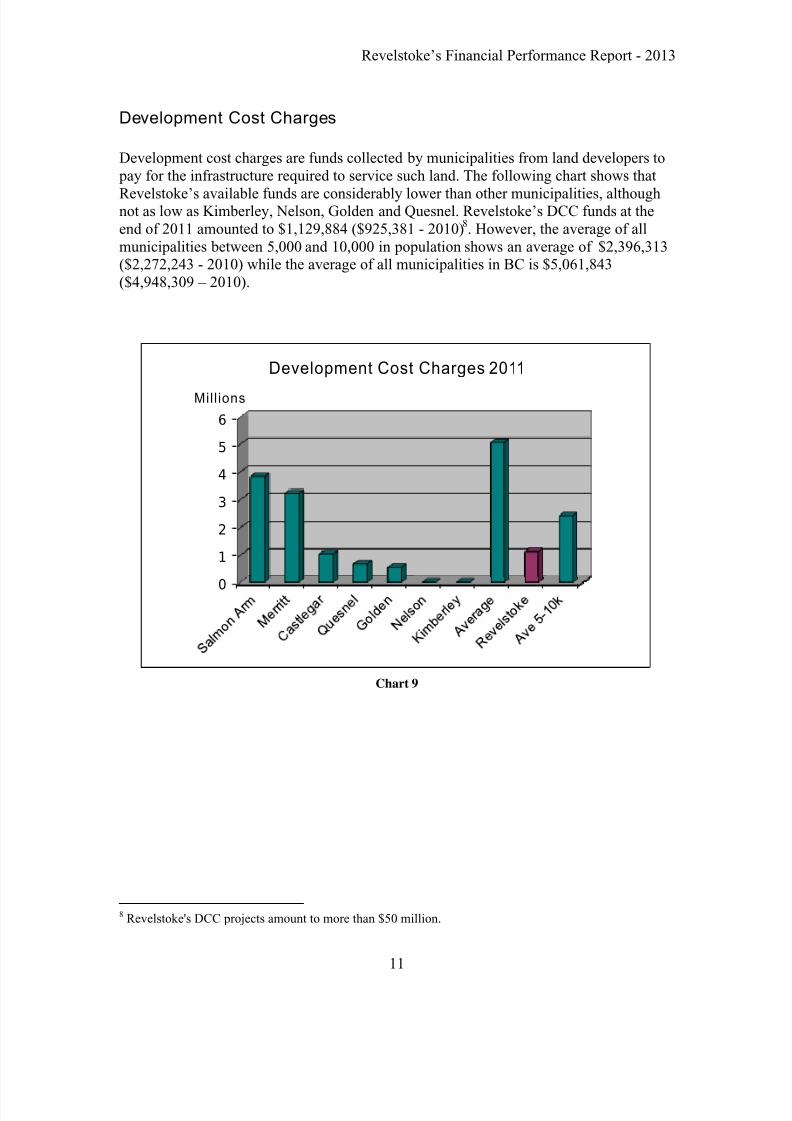
Development Cost Charges
Development cost charges are funds collected by municipalities from land developers to pay for the infrastructure required to service such land. The following chart shows that
Revelstoke’s available funds are considerably lower than other municipalities, althoughnot as low as Kimberley, Nelson, Golden and Quesnel. Revelstoke’s DCC funds at theend of 2011 amounted to $1,129,884 ($925,381 - 2010)8. However, the average of allmunicipalities between 5,000 and 10,000 in population shows an average of $2,396,313($2,272,243 - 2010) while the average of all municipalities in BC is $5,061,843($4,948,309 – 2010).
0
1
2
3
4
5
6
Mill ions
Development Cost Charges 2011
Chart 9
8 Revelstoke's DCC projects amount to more than $50 million.
7/28/2019 Revelstoke Financial Performance Report 2013
http://slidepdf.com/reader/full/revelstoke-financial-performance-report-2013 15/36
Revelstoke’s Financial Performance Report - 2013
12
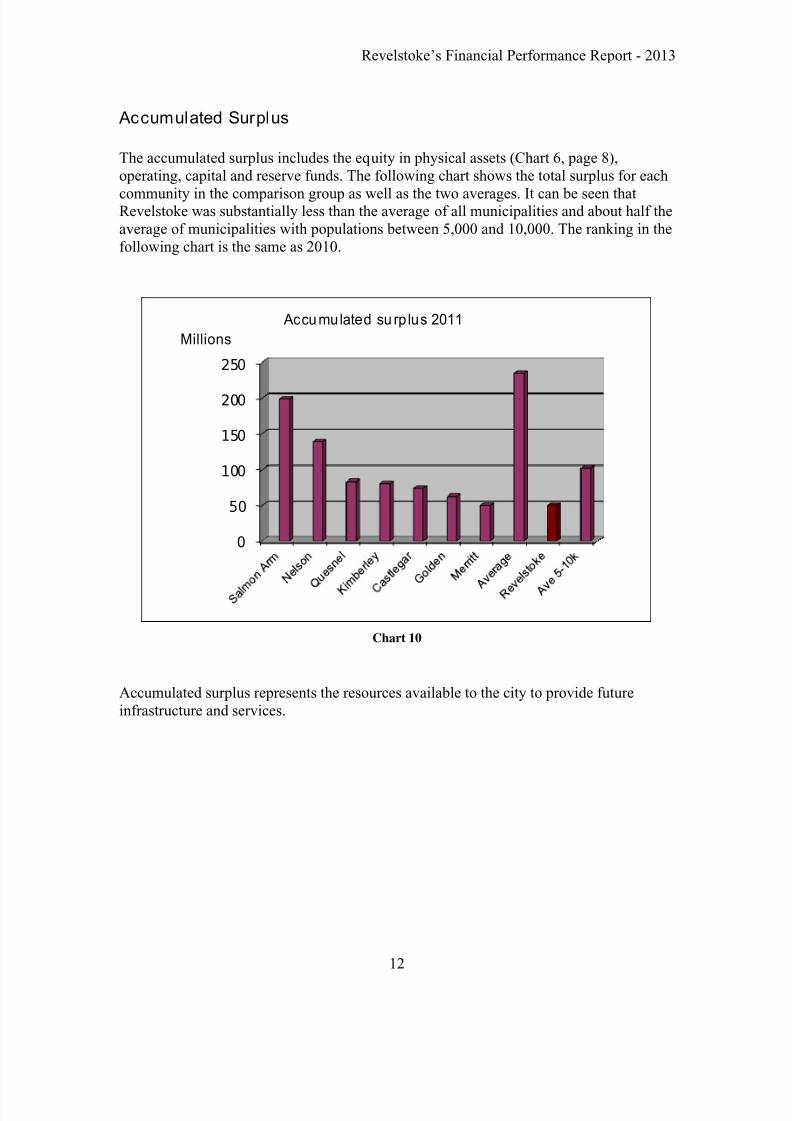
Accumulated Surplus
The accumulated surplus includes the equity in physical assets (Chart 6, page 8),operating, capital and reserve funds. The following chart shows the total surplus for each
community in the comparison group as well as the two averages. It can be seen thatRevelstoke was substantially less than the average of all municipalities and about half theaverage of municipalities with populations between 5,000 and 10,000. The ranking in thefollowing chart is the same as 2010.
0
50
100
150
200
250
Millions
Accumulated su rp lus 2011
Chart 10
Accumulated surplus represents the resources available to the city to provide futureinfrastructure and services.
7/28/2019 Revelstoke Financial Performance Report 2013
http://slidepdf.com/reader/full/revelstoke-financial-performance-report-2013 16/36
Revelstoke’s Financial Performance Report - 2013
13
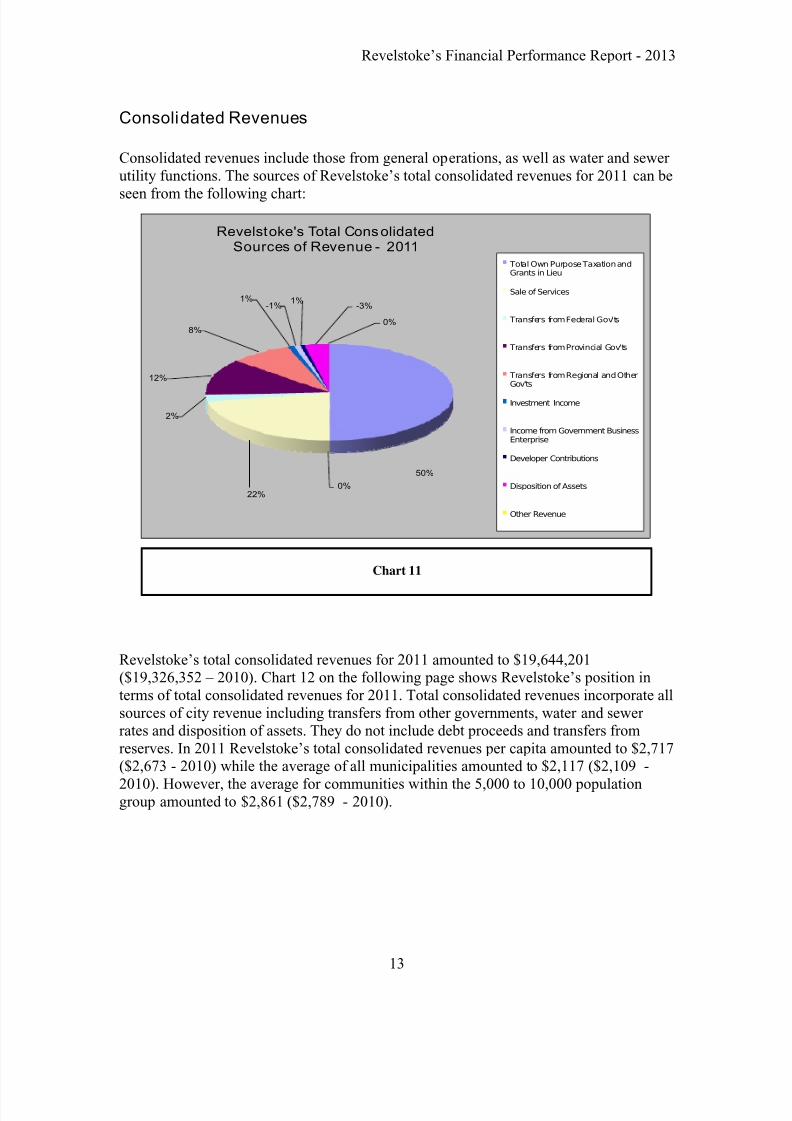
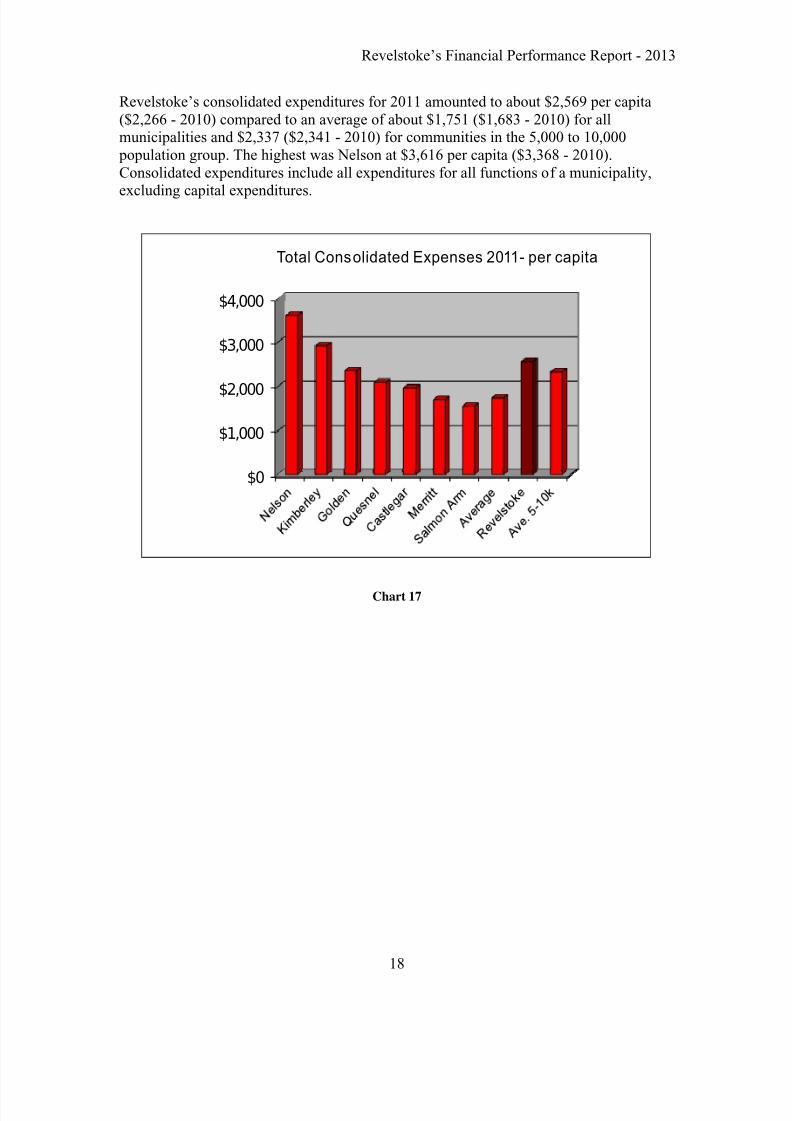
Consolidated Revenues
Consolidated revenues include those from general operations, as well as water and sewer utility functions. The sources of Revelstoke’s total consolidated revenues for 2011 can be
seen from the following chart:
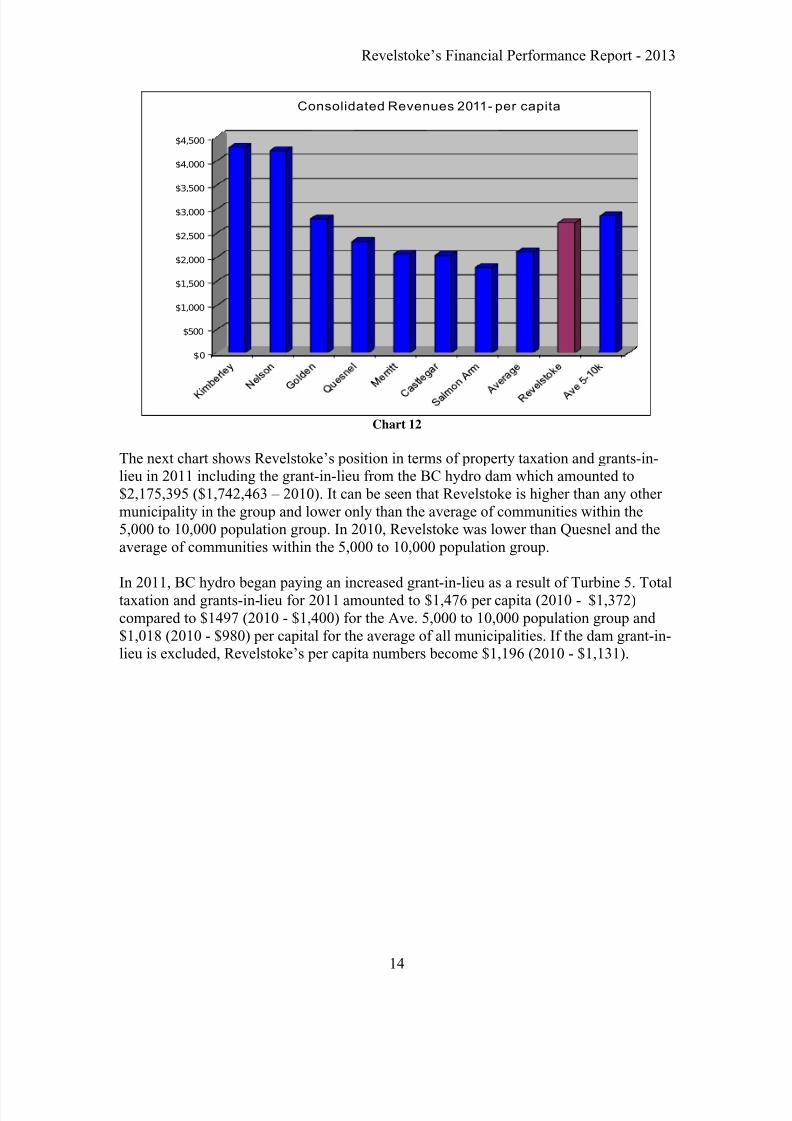
Revelstoke’s total consolidated revenues for 2011 amounted to $19,644,201($19,326,352 – 2010). Chart 12 on the following page shows Revelstoke’s position interms of total consolidated revenues for 2011. Total consolidated revenues incorporate allsources of city revenue including transfers from other governments, water and sewer rates and disposition of assets. They do not include debt proceeds and transfers fromreserves. In 2011 Revelstoke’s total consolidated revenues per capita amounted to $2,717($2,673 - 2010) while the average of all municipalities amounted to $2,117 ($2,109 -
2010). However, the average for communities within the 5,000 to 10,000 populationgroup amounted to $2,861 ($2,789 - 2010).
Chart 11
50%
0%22%
2%
12%
8%
1%-1%
1%-3%
0%
Revelstoke's Total ConsolidatedSources of Revenue - 2011
Total Own Purpose Taxation andGrants in Lieu
Sale of Services
Transfers from Federal Gov'ts
Transfers from Provincial Gov'ts
Transfers from Regional and OtherGov'ts
Investment Income
Income from Government BusinessEnterprise
Developer Contributions
Disposition of Assets
Other Revenue
7/28/2019 Revelstoke Financial Performance Report 2013
http://slidepdf.com/reader/full/revelstoke-financial-performance-report-2013 17/36
Revelstoke’s Financial Performance Report - 2013
14
$0
$500
$1,000
$1,500
$2,000
$2,500
$3,000
$3,500
$4,000
$4,500
Consolidated Revenues 2011- per capita
Chart 12
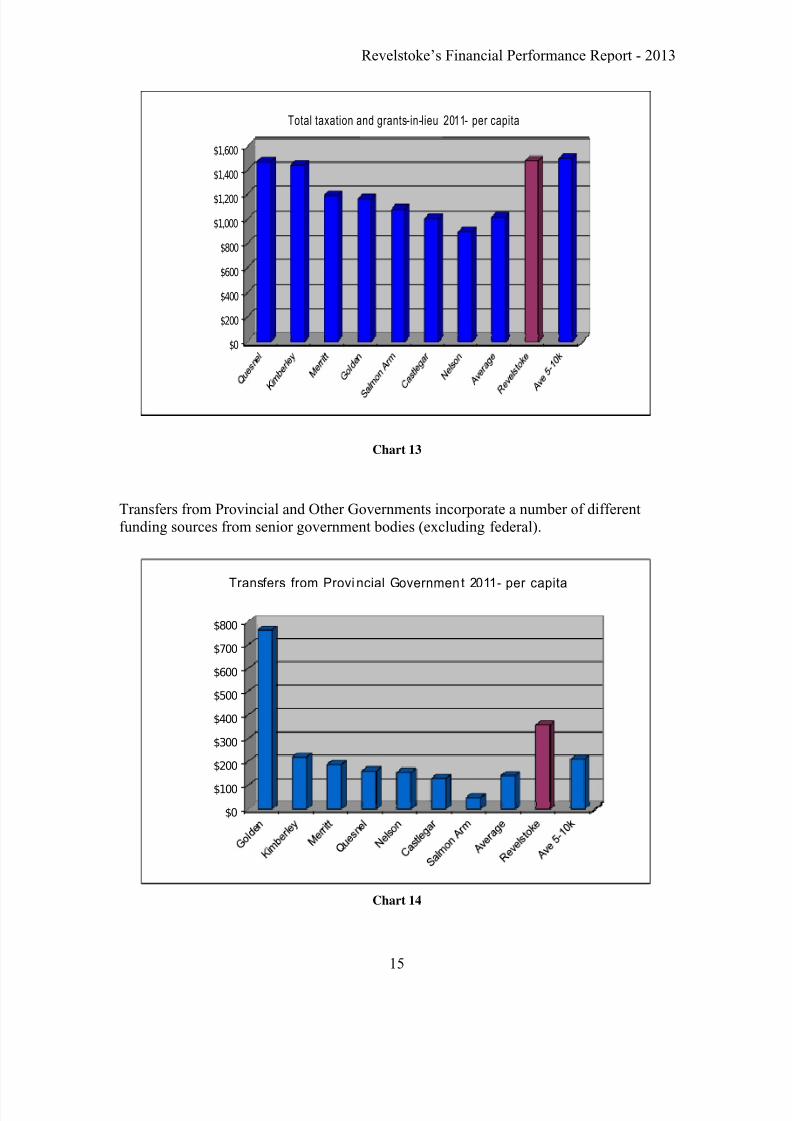
The next chart shows Revelstoke’s position in terms of property taxation and grants-in-lieu in 2011 including the grant-in-lieu from the BC hydro dam which amounted to$2,175,395 ($1,742,463 – 2010). It can be seen that Revelstoke is higher than any other municipality in the group and lower only than the average of communities within the5,000 to 10,000 population group. In 2010, Revelstoke was lower than Quesnel and theaverage of communities within the 5,000 to 10,000 population group.
In 2011, BC hydro began paying an increased grant-in-lieu as a result of Turbine 5. Totaltaxation and grants-in-lieu for 2011 amounted to $1,476 per capita (2010 - $1,372)compared to $1497 (2010 - $1,400) for the Ave. 5,000 to 10,000 population group and $1,018 (2010 - $980) per capital for the average of all municipalities. If the dam grant-in-lieu is excluded, Revelstoke’s per capita numbers become $1,196 (2010 - $1,131).
7/28/2019 Revelstoke Financial Performance Report 2013
http://slidepdf.com/reader/full/revelstoke-financial-performance-report-2013 18/36
7/28/2019 Revelstoke Financial Performance Report 2013
http://slidepdf.com/reader/full/revelstoke-financial-performance-report-2013 19/36
Revelstoke’s Financial Performance Report - 2013
16
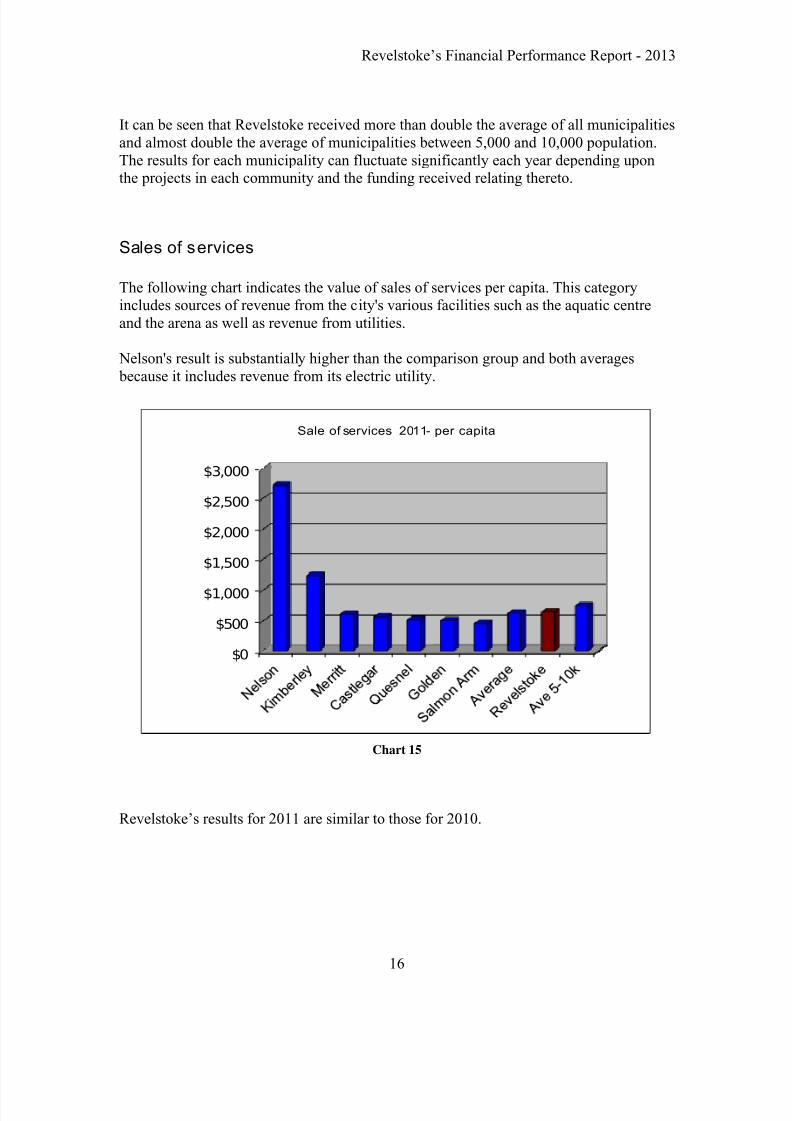
It can be seen that Revelstoke received more than double the average of all municipalitiesand almost double the average of municipalities between 5,000 and 10,000 population.The results for each municipality can fluctuate significantly each year depending uponthe projects in each community and the funding received relating thereto.
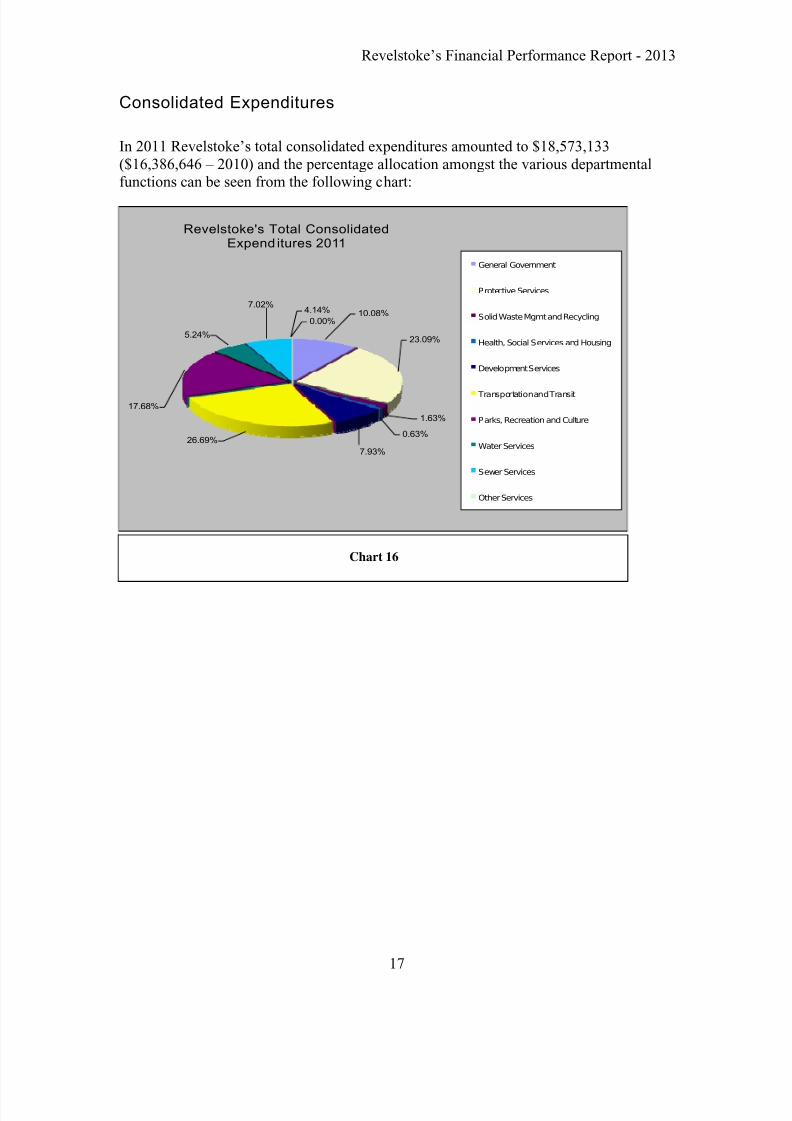
Sales of services
The following chart indicates the value of sales of services per capita. This categoryincludes sources of revenue from the city's various facilities such as the aquatic centreand the arena as well as revenue from utilities.
Nelson's result is substantially higher than the comparison group and both averages because it includes revenue from its electric utility.
$0
$500
$1,000
$1,500
$2,000
$2,500
$3,000
Sale of services 2011- per capita
Chart 15
Revelstoke’s results for 2011 are similar to those for 2010.
7/28/2019 Revelstoke Financial Performance Report 2013
http://slidepdf.com/reader/full/revelstoke-financial-performance-report-2013 20/36
7/28/2019 Revelstoke Financial Performance Report 2013
http://slidepdf.com/reader/full/revelstoke-financial-performance-report-2013 21/36
Revelstoke’s Financial Performance Report - 2013
18
Revelstoke’s consolidated expenditures for 2011 amounted to about $2,569 per capita($2,266 - 2010) compared to an average of about $1,751 ($1,683 - 2010) for allmunicipalities and $2,337 ($2,341 - 2010) for communities in the 5,000 to 10,000 population group. The highest was Nelson at $3,616 per capita ($3,368 - 2010).Consolidated expenditures include all expenditures for all functions of a municipality,
excluding capital expenditures.
$0
$1,000
$2,000
$3,000
$4,000
Total Consolidated Expenses 2011- per capita
Chart 17

7/28/2019 Revelstoke Financial Performance Report 2013
http://slidepdf.com/reader/full/revelstoke-financial-performance-report-2013 22/36
Revelstoke’s Financial Performance Report - 2013
19
Expenditure on tangible capital assets per capita can be seen from the following chart and these are in addition to the total consolidated expenses above.
0
500
1,000
1,500
2,000
Acquis ition of Tangib le Capital Assets 2011
Chart 18
Consolidated capital expenditures include such expenditures for all aspects of the city’sfunctions, including utilities. Revelstoke’s consolidated capital expenditures for 2011amounted to $687 per capita ($828 – 2010). This was more than the average of allmunicipalities but less than the average of municipalities within the 5,000 to 10,000 population group – a similar result to 2010.

7/28/2019 Revelstoke Financial Performance Report 2013
http://slidepdf.com/reader/full/revelstoke-financial-performance-report-2013 23/36
Revelstoke’s Financial Performance Report - 2013
20
Specif ic Cost Centres
General government expenditures include all those relating to the administration of CityHall – Mayor and Council, Administration, Finance and Information Technology.
Revelstoke’s General Government expenditures in 2011 were a little more than theaverage of all municipalities at $234 per capita ($212 - 2010). They were about two thirdsof the average of all municipalities with a population of between 5,000 and 10,000
$0
$100
$200
$300
$400
$500
General Government 2011- per capita
Chart 19
and less than all other members of the comparison group except Salmon Arm.
7/28/2019 Revelstoke Financial Performance Report 2013
http://slidepdf.com/reader/full/revelstoke-financial-performance-report-2013 24/36
Revelstoke’s Financial Performance Report - 2013
21
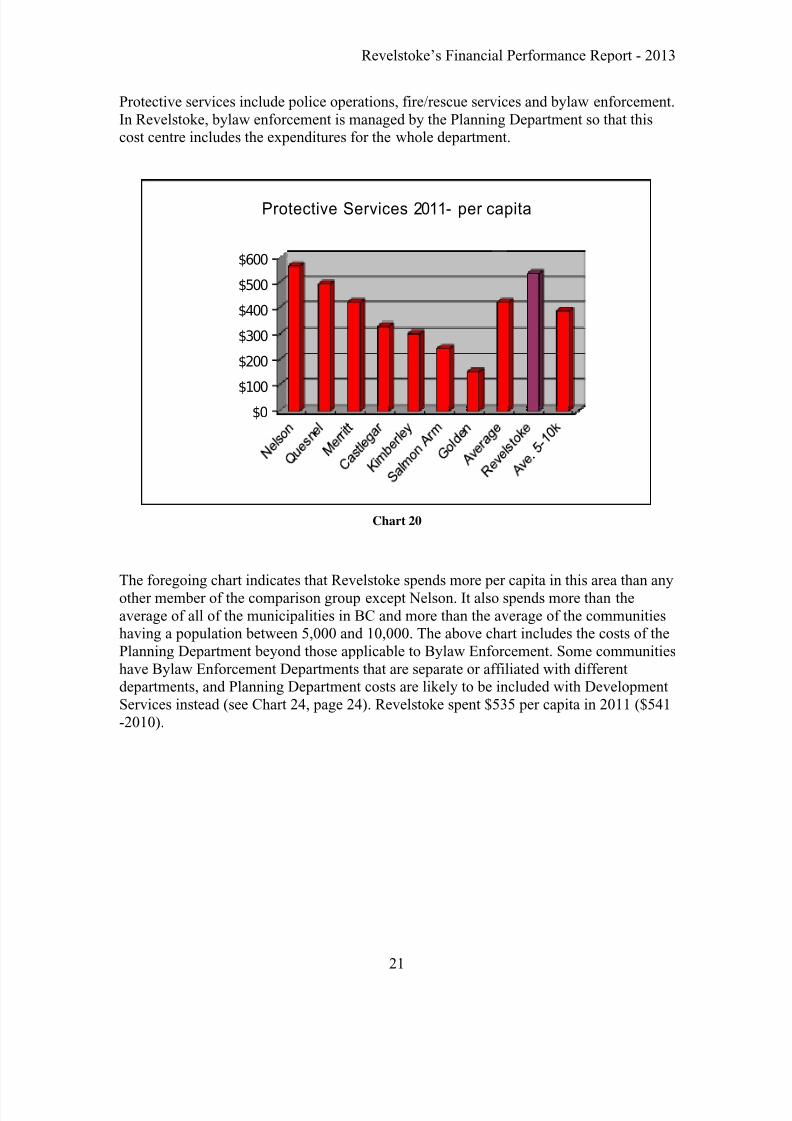
Protective services include police operations, fire/rescue services and bylaw enforcement.In Revelstoke, bylaw enforcement is managed by the Planning Department so that thiscost centre includes the expenditures for the whole department.
$0$100
$200
$300
$400
$500
$600
Protective Services 2011- per capita
Chart 20
The foregoing chart indicates that Revelstoke spends more per capita in this area than anyother member of the comparison group except Nelson. It also spends more than theaverage of all of the municipalities in BC and more than the average of the communitieshaving a population between 5,000 and 10,000. The above chart includes the costs of thePlanning Department beyond those applicable to Bylaw Enforcement. Some communitieshave Bylaw Enforcement Departments that are separate or affiliated with differentdepartments, and Planning Department costs are likely to be included with DevelopmentServices instead (see Chart 24, page 24). Revelstoke spent $535 per capita in 2011 ($541-2010).
7/28/2019 Revelstoke Financial Performance Report 2013
http://slidepdf.com/reader/full/revelstoke-financial-performance-report-2013 25/36
Revelstoke’s Financial Performance Report - 2013
22
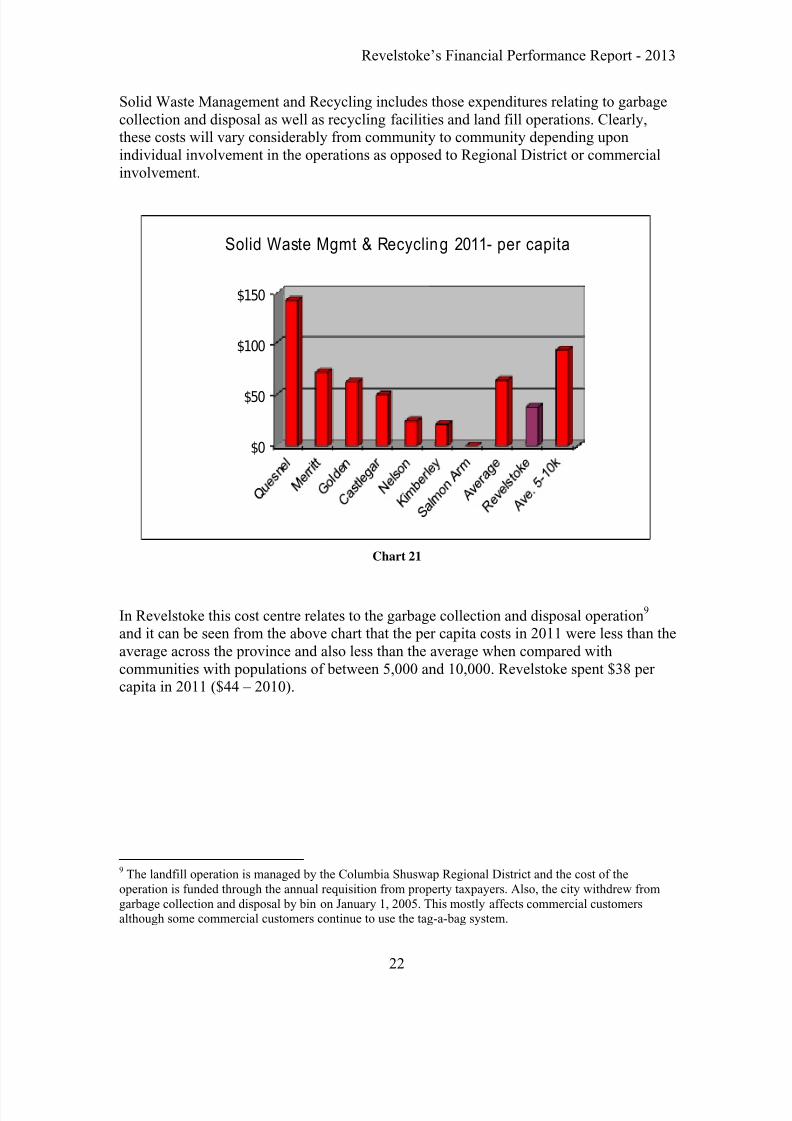
Solid Waste Management and Recycling includes those expenditures relating to garbagecollection and disposal as well as recycling facilities and land fill operations. Clearly,these costs will vary considerably from community to community depending uponindividual involvement in the operations as opposed to Regional District or commercialinvolvement.
$0
$50
$100
$150
Solid Waste Mgmt & Recycling 2011- per capita
Chart 21
In Revelstoke this cost centre relates to the garbage collection and disposal operation9
and it can be seen from the above chart that the per capita costs in 2011 were less than theaverage across the province and also less than the average when compared withcommunities with populations of between 5,000 and 10,000. Revelstoke spent $38 per capita in 2011 ($44 – 2010).
9 The landfill operation is managed by the Columbia Shuswap Regional District and the cost of theoperation is funded through the annual requisition from property taxpayers. Also, the city withdrew fromgarbage collection and disposal by bin on January 1, 2005. This mostly affects commercial customersalthough some commercial customers continue to use the tag-a-bag system.

7/28/2019 Revelstoke Financial Performance Report 2013
http://slidepdf.com/reader/full/revelstoke-financial-performance-report-2013 26/36
Revelstoke’s Financial Performance Report - 2013
23
Health, Social Services and Housing incorporates a number of different costs and inRevelstoke relates to the operation of the cemetery.
$0
$20
$40
$60
Heal th, Social Services and Housing 2011 - per capita
Chart 22
Since most of the costs for Revelstoke relate to the cemetery operations, which arefunded through the regional district requisition, it is not clear what real value can begained from attempting to interpret the foregoing chart, especially as it can involve avariety of different services depending upon the municipality.
7/28/2019 Revelstoke Financial Performance Report 2013
http://slidepdf.com/reader/full/revelstoke-financial-performance-report-2013 27/36
Revelstoke’s Financial Performance Report - 2013
24
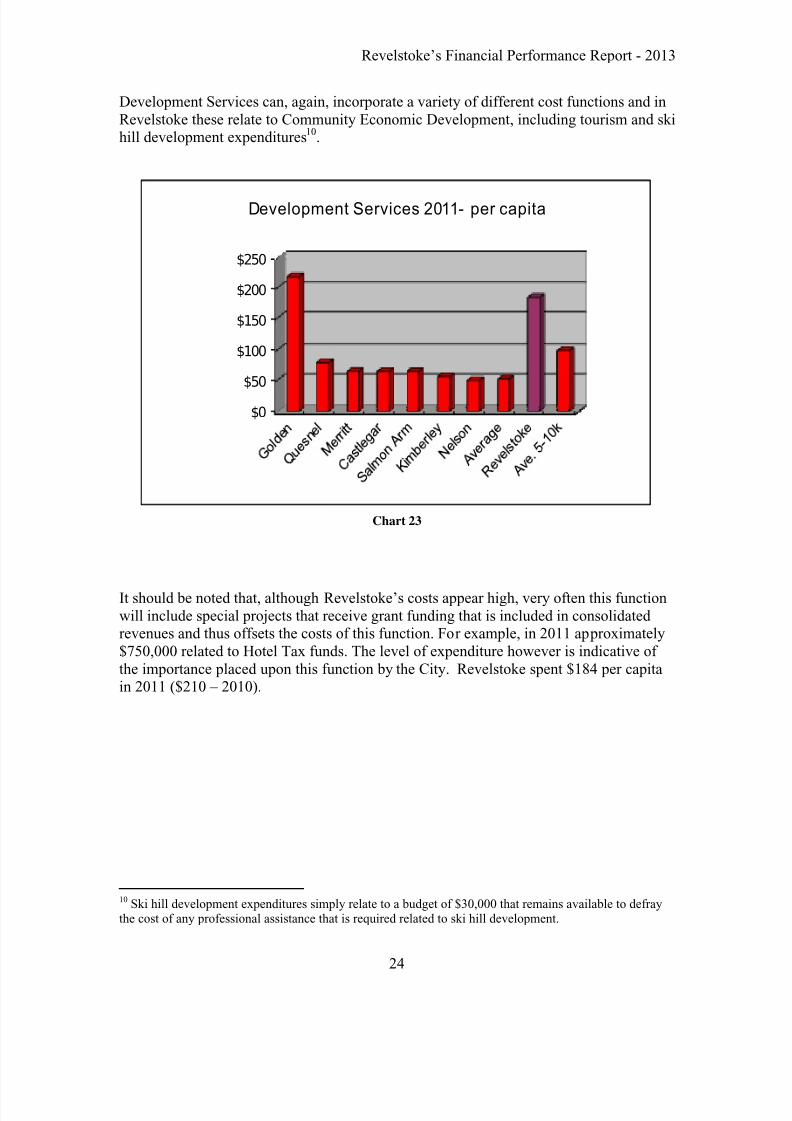
Development Services can, again, incorporate a variety of different cost functions and inRevelstoke these relate to Community Economic Development, including tourism and skihill development expenditures10.
$0
$50
$100
$150
$200
$250
Development Services 2011- per capita
Chart 23
It should be noted that, although Revelstoke’s costs appear high, very often this functionwill include special projects that receive grant funding that is included in consolidated revenues and thus offsets the costs of this function. For example, in 2011 approximately$750,000 related to Hotel Tax funds. The level of expenditure however is indicative of the importance placed upon this function by the City. Revelstoke spent $184 per capitain 2011 ($210 – 2010).
10 Ski hill development expenditures simply relate to a budget of $30,000 that remains available to defraythe cost of any professional assistance that is required related to ski hill development.

7/28/2019 Revelstoke Financial Performance Report 2013
http://slidepdf.com/reader/full/revelstoke-financial-performance-report-2013 28/36
Revelstoke’s Financial Performance Report - 2013
25
Transportation and Transit costs relate to all those expenditures by Public Works(excluding parks and utilities) and include transit.
$0
$100
$200
$300
$400
$500
$600
$700
Transportation and Transit 2011- per capita
Chart 24
The foregoing chart shows that Revelstoke’s expenditures per capita are higher than allthe members of the comparison group and significantly higher than both averages. This isindicative of the substantial funding directed towards snow removal. Revelstoke spent$619 per capita in 2011 ($437 - 2010). The main reasons for the significant increase per capita are snow removal costs ($491,500 more in 2011) and non-TCA expenditures($394,000 more in 2011).

7/28/2019 Revelstoke Financial Performance Report 2013
http://slidepdf.com/reader/full/revelstoke-financial-performance-report-2013 29/36
7/28/2019 Revelstoke Financial Performance Report 2013
http://slidepdf.com/reader/full/revelstoke-financial-performance-report-2013 30/36
Revelstoke’s Financial Performance Report - 2013
27
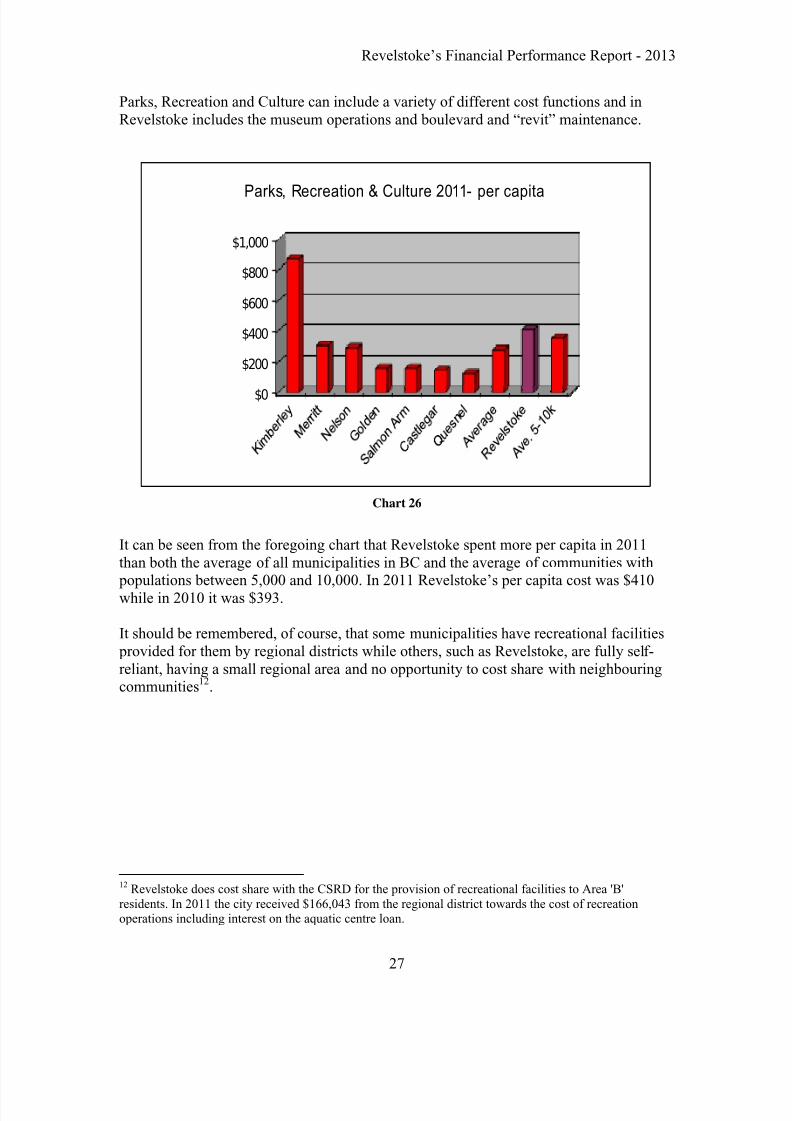
Parks, Recreation and Culture can include a variety of different cost functions and inRevelstoke includes the museum operations and boulevard and “revit” maintenance.
$0
$200
$400
$600
$800
$1,000
Parks, Recreation & Culture 2011- per capita
Chart 26
It can be seen from the foregoing chart that Revelstoke spent more per capita in 2011than both the average of all municipalities in BC and the average of communities with populations between 5,000 and 10,000. In 2011 Revelstoke’s per capita cost was $410while in 2010 it was $393.
It should be remembered, of course, that some municipalities have recreational facilities provided for them by regional districts while others, such as Revelstoke, are fully self-reliant, having a small regional area and no opportunity to cost share with neighbouringcommunities12.
12 Revelstoke does cost share with the CSRD for the provision of recreational facilities to Area 'B'residents. In 2011 the city received $166,043 from the regional district towards the cost of recreationoperations including interest on the aquatic centre loan.
7/28/2019 Revelstoke Financial Performance Report 2013
http://slidepdf.com/reader/full/revelstoke-financial-performance-report-2013 31/36
Revelstoke’s Financial Performance Report - 2013
28
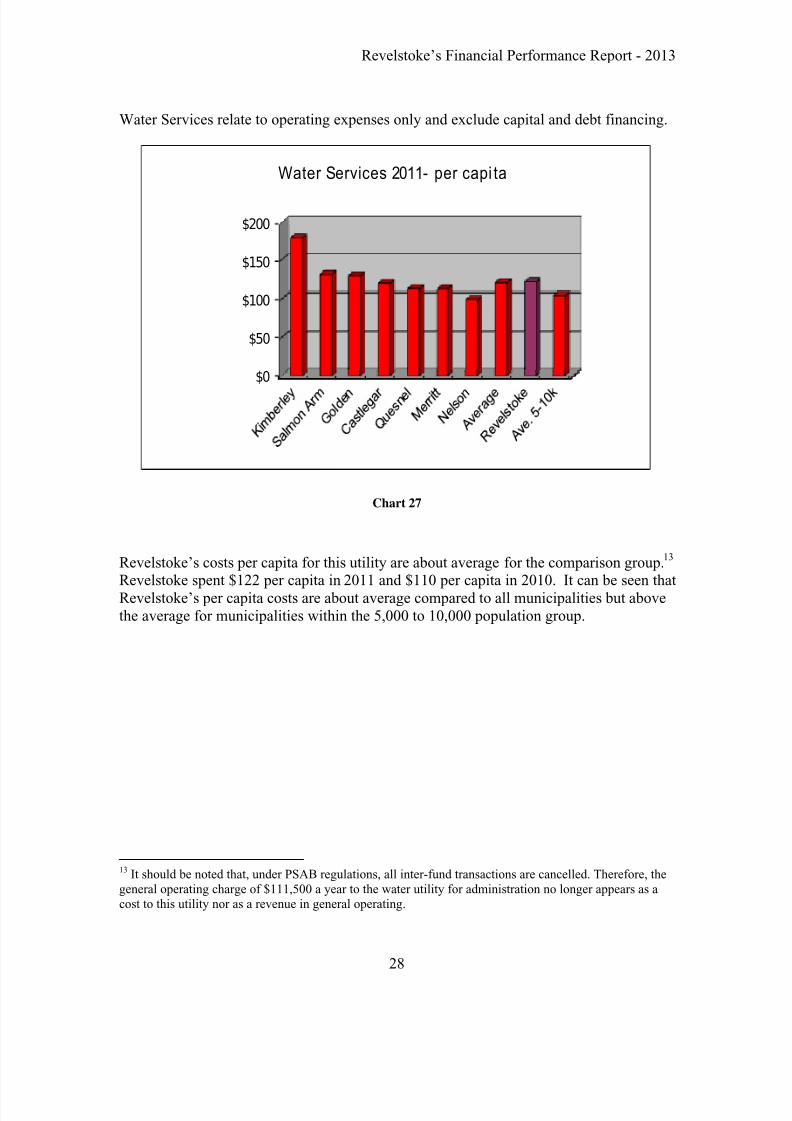
Water Services relate to operating expenses only and exclude capital and debt financing.
$0
$50
$100
$150
$200
Water Services 2011- per capi ta
Chart 27
Revelstoke’s costs per capita for this utility are about average for the comparison group.13
Revelstoke spent $122 per capita in 2011 and $110 per capita in 2010. It can be seen thatRevelstoke’s per capita costs are about average compared to all municipalities but abovethe average for municipalities within the 5,000 to 10,000 population group.
13 It should be noted that, under PSAB regulations, all inter-fund transactions are cancelled. Therefore, thegeneral operating charge of $111,500 a year to the water utility for administration no longer appears as acost to this utility nor as a revenue in general operating.

7/28/2019 Revelstoke Financial Performance Report 2013
http://slidepdf.com/reader/full/revelstoke-financial-performance-report-2013 32/36
Revelstoke’s Financial Performance Report - 2013
29
It should be noted also that while per capita costs are calculated on the total populationnot all households receive water service. Therefore, the following chart provides the sameinformation but this time expressed per kilometer 14 of water line:
$0
$2,000
$4,000
$6,000
$8,000
$10,000
$12,000
$14,000
Water Services 2011- per km
Chart 28
It can be seen that Revelstoke's costs per kilometre are lower than all members of thecomparison group, except Castlegar. as well as both averages, indicating the operation of an efficient service.
14 Revelstoke reported 108 kilometres of water pipe to the province for the 2011 statistics. However, itshould be noted that in the 2011 Annual Water Report a number of 98 kms is used.
7/28/2019 Revelstoke Financial Performance Report 2013
http://slidepdf.com/reader/full/revelstoke-financial-performance-report-2013 33/36
Revelstoke’s Financial Performance Report - 2013
30
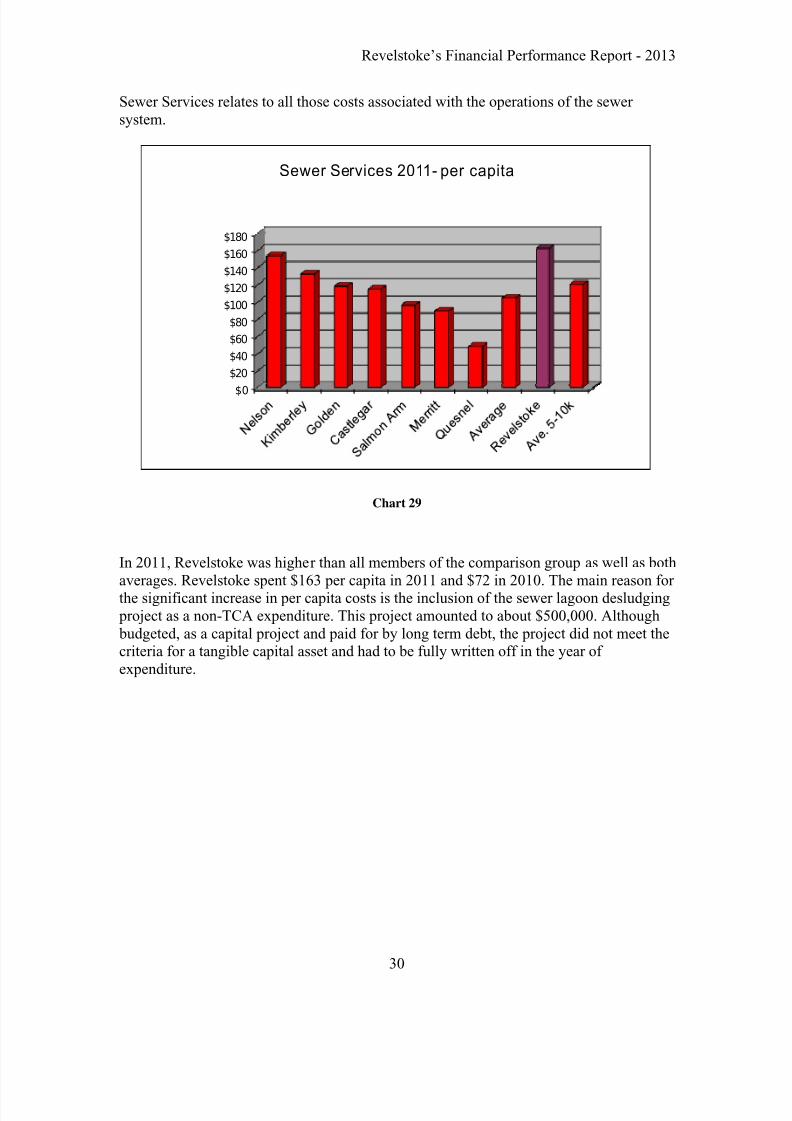
Sewer Services relates to all those costs associated with the operations of the sewer system.
$0
$20
$40
$60
$80
$100
$120
$140
$160
$180
Sewer Services 2011- per capita
Chart 29
In 2011, Revelstoke was higher than all members of the comparison group as well as bothaverages. Revelstoke spent $163 per capita in 2011 and $72 in 2010. The main reason for the significant increase in per capita costs is the inclusion of the sewer lagoon desludging project as a non-TCA expenditure. This project amounted to about $500,000. Although budgeted, as a capital project and paid for by long term debt, the project did not meet thecriteria for a tangible capital asset and had to be fully written off in the year of expenditure.
7/28/2019 Revelstoke Financial Performance Report 2013
http://slidepdf.com/reader/full/revelstoke-financial-performance-report-2013 34/36
Revelstoke’s Financial Performance Report - 2013
31
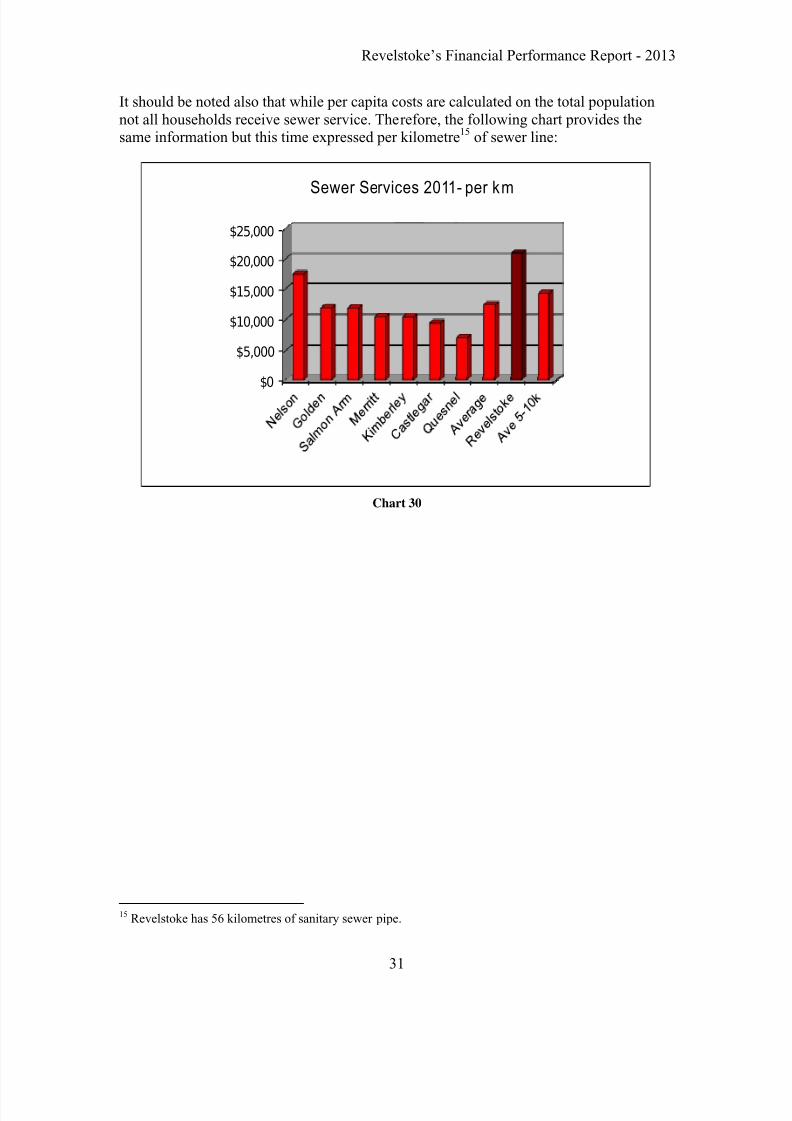
It should be noted also that while per capita costs are calculated on the total populationnot all households receive sewer service. Therefore, the following chart provides thesame information but this time expressed per kilometre15 of sewer line:
$0
$5,000
$10,000
$15,000
$20,000
$25,000
Sewer Services 2011- per km
Chart 30
15 Revelstoke has 56 kilometres of sanitary sewer pipe.
7/28/2019 Revelstoke Financial Performance Report 2013
http://slidepdf.com/reader/full/revelstoke-financial-performance-report-2013 35/36
Revelstoke’s Financial Performance Report - 2013
32
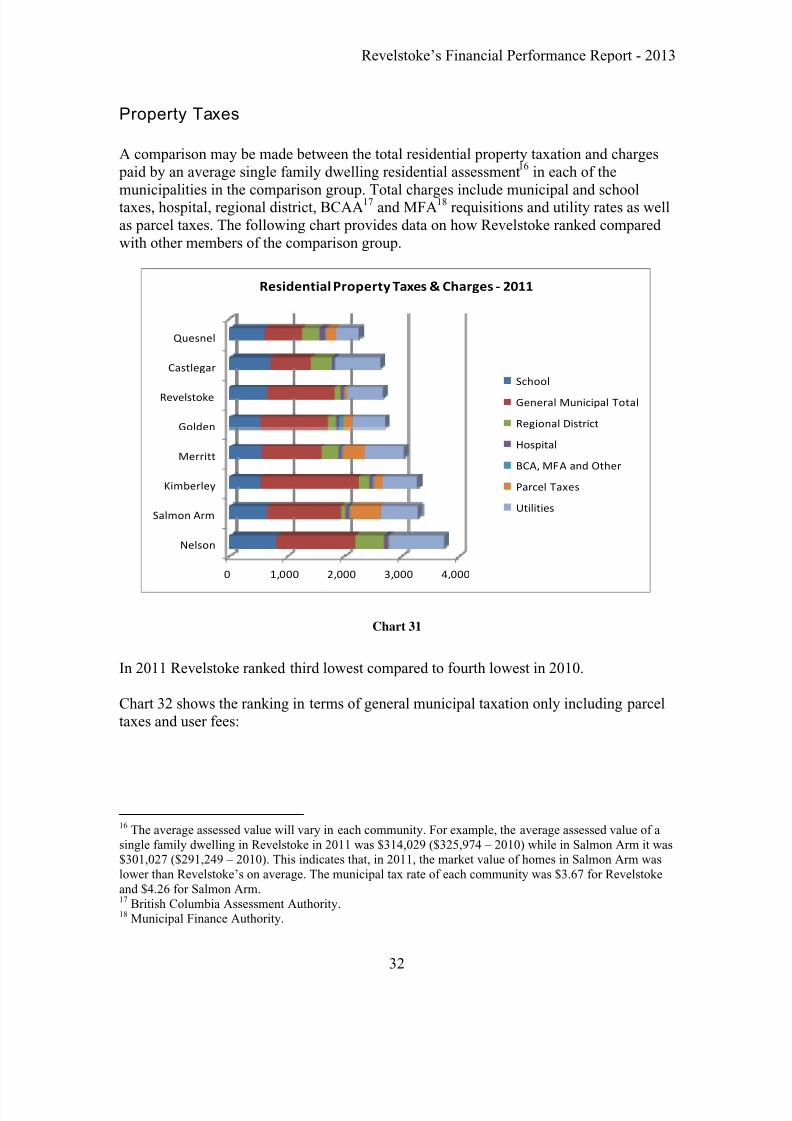
Property Taxes
A comparison may be made between the total residential property taxation and charges paid by an average single family dwelling residential assessment
16in each of the
municipalities in the comparison group. Total charges include municipal and schooltaxes, hospital, regional district, BCAA17 and MFA18 requisitions and utility rates as wellas parcel taxes. The following chart provides data on how Revelstoke ranked compared with other members of the comparison group.
0 1,000 2,000 3,000 4,000
Nelson
Salmon Arm
Kimberley
Merritt
Golden
Revelstoke
Castlegar
Quesnel
Residential Property Taxes & Charges ‐ 2011
School
General Municipal Total
Regional District
Hospital
BCA, MF A and Other
Parcel Taxes
Utilities
Chart 31
In 2011 Revelstoke ranked third lowest compared to fourth lowest in 2010.
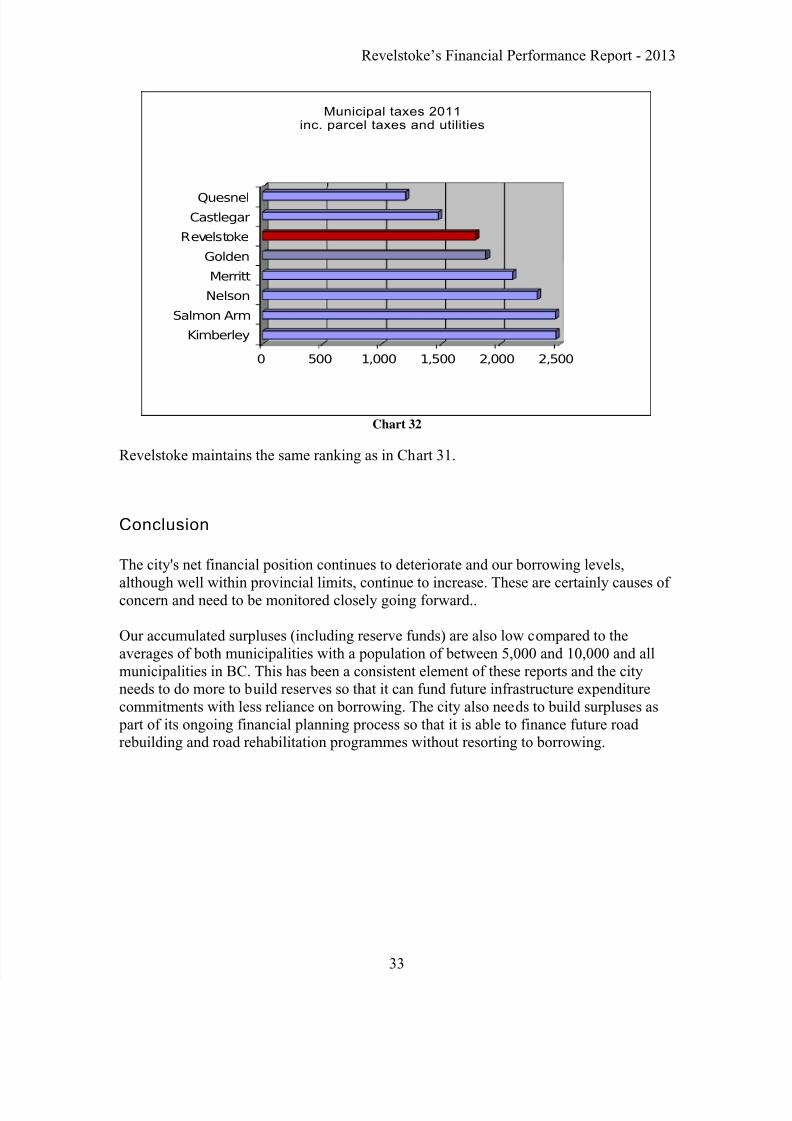
Chart 32 shows the ranking in terms of general municipal taxation only including parceltaxes and user fees:
16 The average assessed value will vary in each community. For example, the average assessed value of asingle family dwelling in Revelstoke in 2011 was $314,029 ($325,974 – 2010) while in Salmon Arm it was$301,027 ($291,249 – 2010). This indicates that, in 2011, the market value of homes in Salmon Arm waslower than Revelstoke’s on average. The municipal tax rate of each community was $3.67 for Revelstokeand $4.26 for Salmon Arm.17 British Columbia Assessment Authority.18 Municipal Finance Authority.
7/28/2019 Revelstoke Financial Performance Report 2013
http://slidepdf.com/reader/full/revelstoke-financial-performance-report-2013 36/36
Revelstoke’s Financial Performance Report - 2013
0 500 1,000 1,500 2,000 2,500
Kimberley
Salmon Arm
Nelson
Merritt
Golden
Revelstoke
Castlegar
Quesnel
Municipal taxes 2011inc. parcel taxes and utilities
Chart 32
Revelstoke maintains the same ranking as in Chart 31.
Conclusion
The city's net financial position continues to deteriorate and our borrowing levels,
although well within provincial limits, continue to increase. These are certainly causes of concern and need to be monitored closely going forward..
Our accumulated surpluses (including reserve funds) are also low compared to theaverages of both municipalities with a population of between 5,000 and 10,000 and allmunicipalities in BC. This has been a consistent element of these reports and the cityneeds to do more to build reserves so that it can fund future infrastructure expenditurecommitments with less reliance on borrowing. The city also needs to build surpluses as part of its ongoing financial planning process so that it is able to finance future road rebuilding and road rehabilitation programmes without resorting to borrowing.