revenue estimating conference tax issue:...
TRANSCRIPT
REVENUE ESTIMATING CONFERENCE Tax: Issue: Special Alcoholic Beverage Licenses for Caterers Bill Number(s): Section 3, CS/CS/CS/HB 689 Entire Bill Partial Bill: Section 3, CS/CS/CS/HB 689 Sponsor(s): Commerce Committee; Ways & Means Committee; Careers & Competition Subcommittee; Burton Month/Year Impact Begins: July 2017 Date of Analysis: 06/02/17 Section 1: Narrative a. Current Law:
Section 561.20(2)(a)5, Florida Statutes, provides that there is no limit on the number of special alcoholic beverage licenses that may be issued to a caterer that is licensed by the Division of Hotels and Restaurants and that derives at least 51 percent of its gross revenue from the sale of food and nonalcoholic beverages. The statute requires caterers holding the special alcoholic beverage license authorized pursuant to this subsection to maintain for a period of 3 years all records to demonstrate compliance with the license requirements, including vendor receipts for purchases of alcoholic beverages, customer names, catered event dates and locations, and other records as may be required by the department by rule.
b. Proposed Change: Section 3 of CS/CS/CS/HB 689 amends paragraph (a) of subsection (2) of section 561.20, Florida Statutes, effectively clarifying the scope and application of the minimum revenue requirement pertaining to special alcoholic beverage licenses issued to qualifying caterers licensed by the Division of Hotels and Restaurants. The bill specifies that the minimum 51% of revenue that must be derived from the sale of food and non-alcoholic beverages is calculated based on the caterer’s gross food and beverage revenue. The bill further provides that this minimum revenue percentage applies to each catered event in which the special alcoholic beverage license is utilized.
The bill also clarifies the types of records which must be maintained for a period of 3 years by a caterer holding a special alcoholic beverage license pursuant to this statute.
Section 2: Description of Data and Sources
The Division of Alcoholic Beverages and Tobacco conducts compliance audits on special license types such as caterer licenses for purposes of determining compliance with the minimum revenue requirements specific to these license types. The compliance audits of caterer licenses are assigned at random and undertaken as auditor resources and capacity allows in consideration of other primary tax and revenue audits conducted on other licenses by the Division. Data for this impact analysis is based on license populations for this special license type and compliance audits conducted on a subset of these licenses in calendar year 2016.
Section 3: Methodology (Include Assumptions and Attach Details) The Division identified 472 current and active caterer alcoholic beverage licenses on record in calendar year 2016. The special alcoholic beverage license issued to caterers is subject to an annual license tax of $1,820 each. Based on the 2016 license population, at least $862,680 in license fee revenue was derived from issuance or renewal of this license type during the year.
In calendar year 2016, the Division completed audits of license compliance on the special caterer license type as follows:
Summary of Audits Completed Total License Population of Special Caterer Licenses: 472
Audits Completed: 132 Percent of License Population Audited: 28%
Summary of Audit Findings Audits Passed: 79 Audits Failed: 53 Compliance Rate Based on Licenses Audited: 60%
X
634
REVENUE ESTIMATING CONFERENCE Tax: Issue: Special Alcoholic Beverage Licenses for Caterers Bill Number(s): Section 3, CS/CS/CS/HB 689
The Division is unable to predict whether the amended revenue requirement based on gross food and beverage revenue only will result in any change in the license population in future years or any change in compliance rates and associated administrative actions on these licenses. Therefore, impacts on annual license fee and administrative penalty revenue associated with these licenses are unknown.
Section 4: Proposed Fiscal Impact
High Middle Low
Cash Recurring Cash Recurring Cash Recurring
2017-18 Indeterminate (non-directional)
+/-**
Indeterminate (non-directional)
+/-**
Indeterminate (non-directional)
+/-**
Indeterminate (non-directional)
+/-**
Indeterminate (non-directional)
+/-**
Indeterminate (non-directional)
+/-**
2018-19 Indeterminate (non-directional)
+/-**
Indeterminate (non-directional)
+/-**
Indeterminate (non-directional)
+/-**
Indeterminate (non-directional)
+/-**
Indeterminate (non-directional)
+/-**
Indeterminate (non-directional)
+/-**
2019-20 Indeterminate (non-directional)
+/-**
Indeterminate (non-directional)
+/-**
Indeterminate (non-directional)
+/-**
Indeterminate (non-directional)
+/-**
Indeterminate (non-directional)
+/-**
Indeterminate (non-directional)
+/-**
2020-21 Indeterminate (non-directional)
+/-**
Indeterminate (non-directional)
+/-**
Indeterminate (non-directional)
+/-**
Indeterminate (non-directional)
+/-**
Indeterminate (non-directional)
+/-**
Indeterminate (non-directional)
+/-**
2021-22 Indeterminate (non-directional)
+/-**
Indeterminate (non-directional)
+/-**
Indeterminate (non-directional)
+/-**
Indeterminate (non-directional)
+/-**
Indeterminate (non-directional)
+/-**
Indeterminate (non-directional)
+/-**
List of affected Trust Funds: Alcohol Beverages and Tobacco Trust Fund Section 5: Consensus Estimate (Adopted: 06/09/2017): The Conference adopted a +/- Indeterminate impact.
GR Trust Local/Other Total
Cash Recurring Cash Recurring Cash Recurring Cash Recurring
2017-18 (+/-) (+/-) (+/-) (+/-) 0.0 0.0 (+/-) (+/-)
2018-19 (+/-) (+/-) (+/-) (+/-) 0.0 0.0 (+/-) (+/-)
2019-20 (+/-) (+/-) (+/-) (+/-) 0.0 0.0 (+/-) (+/-)
2020-21 (+/-) (+/-) (+/-) (+/-) 0.0 0.0 (+/-) (+/-)
2021-22 (+/-) (+/-) (+/-) (+/-) 0.0 0.0 (+/-) (+/-)
635
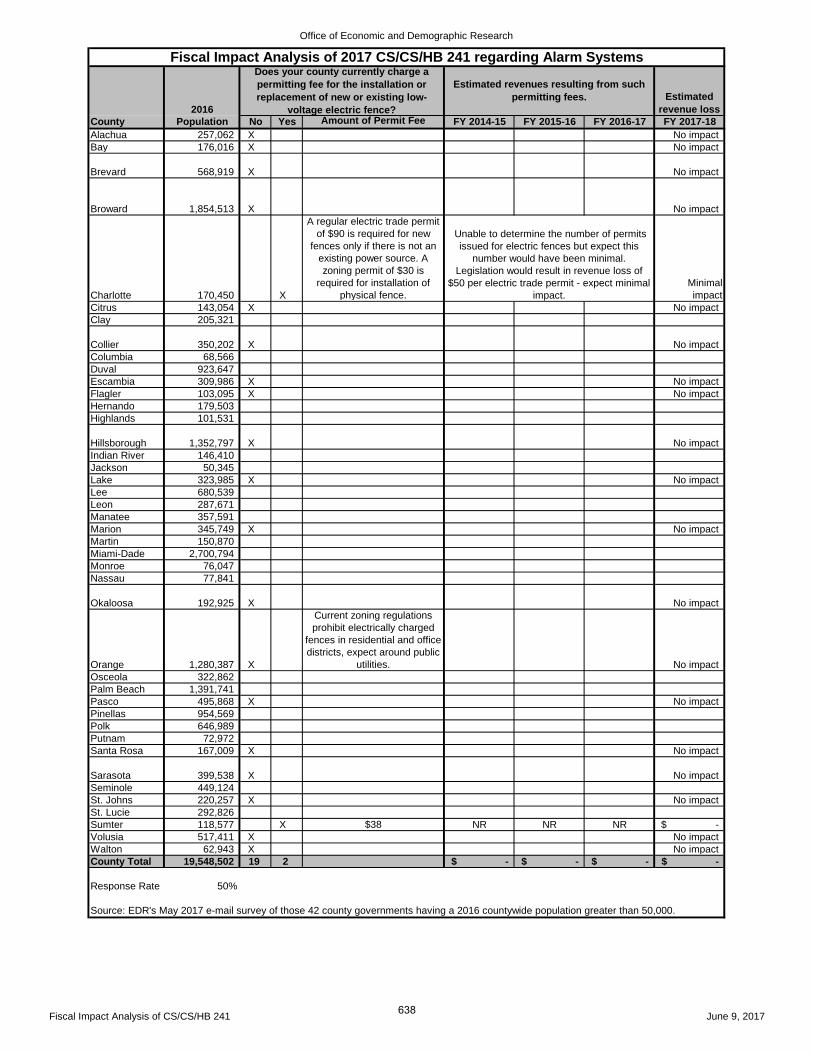
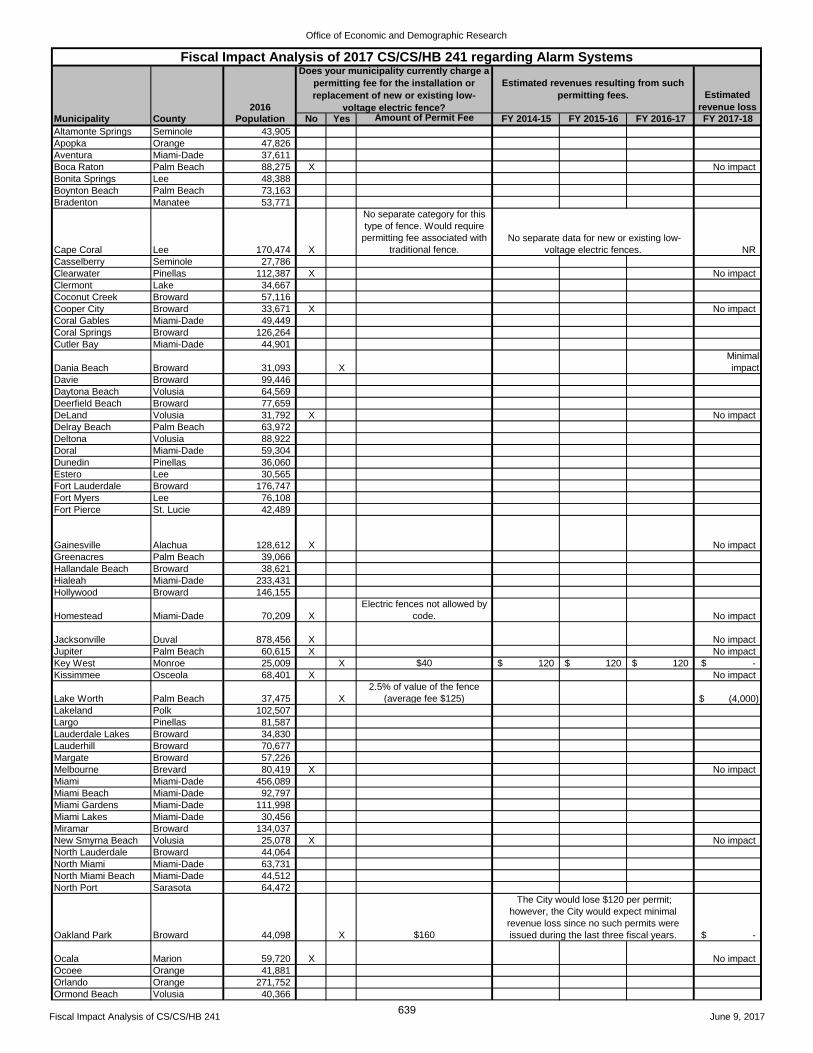
REVENUE ESTIMATING CONFERENCE Tax: Local Taxes and Fees Issue: Expands the streamlined installation permitting of low-voltage alarm systems to include low-voltage electric fences. Prohibits a local government agency from charging more than a $40 permitting fee for the installation or replacement of a new or existing low-voltage electric fence, when permitting is required. Bill Number(s): CS/CS/HB 241 (codified as Chapter 2017-52, Laws of Florida) Entire Bill Partial Bill: Sponsor(s): Local, Federal & Veterans Subcommittee and Agriculture & Property Rights Subcommittee and Representative Williamson Month/Year Impact Begins: Upon becoming law – June 2, 2017 Date of Analysis: June 9, 2017 Section 1: Narrative a. Current Law: Section 553.793, F.S., streamlines the permitting process for the installation of low-voltage alarm system projects.
A low-voltage alarm system project is defined as a project related to the installation, maintenance, inspection, replacement, or service of a new or existing alarm system, and attached ancillary components, that is hardwired and operating at low voltage. Generally, the law authorizes licensed electrical and alarm system contractors to purchase uniform basic permit labels (permits) from the local enforcement agencies without requiring detailed information about the project and exempts the contractor from having to notify the local enforcement agency of the details of a job prior to installation. Contractors have 14 days after completion of a project to submit a Uniform Notice of a Low Voltage Alarm System Project to the local enforcement agency. The local enforcement agency is then authorized to coordinate directly with the property owner or customer for inspection. A municipality, county, district, or other entity of local government may not adopt or maintain in effect an ordinance or rule regarding a low-voltage alarm system that is inconsistent with the streamlined low-voltage alarm system installation permitting of s. 553.793, F.S.
b. Proposed Change: Section 1 of the bill expands s. 553.793, F.S., regarding the streamlined installation permitting of low-voltage alarm systems to include low-voltage electric fence as a type of low-voltage alarm system project. The bill: 1. Adds new or existing low-voltage electric fence to the types of projects that constitute a low-voltage alarm system project; 2. Adds “closed-circuit television systems,” “access controls,” and “battery recharging devices” to the types of ancillary components or equipment attached to a low-voltage alarm system; 3. Defines “low-voltage electric fence” as an alarm system, as defined in s. 489.505, F.S., which consists of a fence structure and an energizer powered by a commercial storage battery not exceeding 12 volts which produces an electric charge upon contact with the fence structure. 4. Requires that a low-voltage electric fence meet specified requirements to be permitted as a low-voltage alarm system project and prohibits any further permitting for the low-voltage alarm system project other than as provided in s. 553.793, F.S. Since current law prohibits a local enforcement agency from charging more than $40 for a permit, the agency would be prohibited under this law change from charging more than a $40 permitting fee for the installation or replacement of a new or existing low-voltage electric fence, when permitting is required.
Section 2: Description of Data and Sources House Agriculture & Property Rights Subcommittee staff provided EDR staff with a list of local “inconsistencies”, with respect to local government electric fence permitting, that was provided to Committee staff during the bill initial analysis phase. However, this document is not specify amounts for any such permitting fees or local revenues collected. In a number of instances, local codes currently prohibit electric fences or permits are not required. Due to the relative lack of information, EDR staff surveyed select county and municipal governments. Section 3: Methodology (Include Assumptions and Attach Details) EDR surveyed select local governments to ask if the local government currently charges a permitting fee for the installation or replacement of new or existing low-voltage electric fence. The initial survey was sent on May 15, 2017, and a follow-up survey, in an effort to boost the low response rate, was sent on May 24, 2017. If a permitting fee was indicated, the local government was asked to report estimated revenues resulting from such permitting fees in the last three fiscal years (i.e., FY 2014-15 through FY 2016-17) and to estimate the revenue loss in FY 2017-18 as the result of the new legislation.
X
636
REVENUE ESTIMATING CONFERENCE Tax: Local Taxes and Fees Issue: Expands the streamlined installation permitting of low-voltage alarm systems to include low-voltage electric fences. Prohibits a local government agency from charging more than a $40 permitting fee for the installation or replacement of a new or existing low-voltage electric fence, when permitting is required. Bill Number(s): CS/CS/HB 241 (codified as Chapter 2017-52, Laws of Florida) EDR staff surveyed the 42 county governments having a 2016 population greater than 50,000 and the 95 municipal governments having a 2016 municipal governments having a 2016 population greater than 25,000 (total of 137 local governments). Twenty-one of 42 county governments (i.e., 50%) and 29 of 95 municipal governments (i.e., 31%) responded to the EDR survey (see attached summary). Nineteen of the 21 county governments (i.e., 90%) and 20 of the 29 municipal governments (i.e., 69%) responding to the EDR survey indicated that no permitting fee is currently charged for the installation or replacement of new or existing low-voltage electric fences. In some cases, current local codes prohibit electric fences. For those local governments that indicated current permitting fees, all indicated the expected fiscal impact of the new legislation as negative insignificant due primarily to the small number of such electric fence permits requested in recent years. In those cases where a local government does not currently charge such a permitting fee, some local governments indicated that the new legislation might encourage them to begin charging a permitting fee, up to the statutory cap of $40, as a new source of revenue. Based on the data gathered from the EDR survey and the expectation that similar results would extend to those survey non-responders and those local governments not surveyed, EDR staff is recommending a proposed fiscal impact of insignificant negative. Section 4: Proposed Fiscal Impact (Millions $)
High Middle Low
Cash Recurring Cash Recurring Cash Recurring
2017-18 (*) (*)
2018-19 (*) (*)
2019-20 (*) (*)
2020-21 (*) (*)
2021-22 (*) (*)
List of Affected Trust Funds: Local funds only. Section 5: Consensus Estimate (Adopted: 06/09/2017): The Conference adopted the low estimate.
GR Trust Local/Other Total
Cash Recurring Cash Recurring Cash Recurring Cash Recurring
2017-18 0.0 0.0 0.0 0.0 (Insignificant) (Insignificant) (Insignificant) (Insignificant)
2018-19 0.0 0.0 0.0 0.0 (Insignificant) (Insignificant) (Insignificant) (Insignificant)
2019-20 0.0 0.0 0.0 0.0 (Insignificant) (Insignificant) (Insignificant) (Insignificant)
2020-21 0.0 0.0 0.0 0.0 (Insignificant) (Insignificant) (Insignificant) (Insignificant)
2021-22 0.0 0.0 0.0 0.0 (Insignificant) (Insignificant) (Insignificant) (Insignificant)
637
Office of Economic and Demographic Research
2016
Estimated
revenue loss
County Population No Yes Amount of Permit Fee FY 2014-15 FY 2015-16 FY 2016-17 FY 2017-18
Alachua 257,062 X No impact
Bay 176,016 X No impact
Brevard 568,919 X No impact
Broward 1,854,513 X No impact
Charlotte 170,450 X
A regular electric trade permit
of $90 is required for new
fences only if there is not an
existing power source. A
zoning permit of $30 is
required for installation of
physical fence.
Minimal
impact
Citrus 143,054 X No impact
Clay 205,321
Collier 350,202 X No impact
Columbia 68,566
Duval 923,647
Escambia 309,986 X No impact
Flagler 103,095 X No impact
Hernando 179,503
Highlands 101,531
Hillsborough 1,352,797 X No impact
Indian River 146,410
Jackson 50,345
Lake 323,985 X No impact
Lee 680,539
Leon 287,671
Manatee 357,591
Marion 345,749 X No impact
Martin 150,870
Miami-Dade 2,700,794
Monroe 76,047
Nassau 77,841
Okaloosa 192,925 X No impact
Orange 1,280,387 X
Current zoning regulations
prohibit electrically charged
fences in residential and office
districts, expect around public
utilities. No impact
Osceola 322,862
Palm Beach 1,391,741
Pasco 495,868 X No impact
Pinellas 954,569
Polk 646,989
Putnam 72,972
Santa Rosa 167,009 X No impact
Sarasota 399,538 X No impact
Seminole 449,124
St. Johns 220,257 X No impact
St. Lucie 292,826
Sumter 118,577 X $38 NR NR NR -$
Volusia 517,411 X No impact
Walton 62,943 X No impact
County Total 19,548,502 19 2 -$ -$ -$ -$
Response Rate 50%
Source: EDR's May 2017 e-mail survey of those 42 county governments having a 2016 countywide population greater than 50,000.
Fiscal Impact Analysis of 2017 CS/CS/HB 241 regarding Alarm SystemsDoes your county currently charge a
permitting fee for the installation or
replacement of new or existing low-
voltage electric fence?
Estimated revenues resulting from such
permitting fees.
Unable to determine the number of permits
issued for electric fences but expect this
number would have been minimal.
Legislation would result in revenue loss of
$50 per electric trade permit - expect minimal
impact.
Fiscal Impact Analysis of CS/CS/HB 241 June 9, 2017638
Office of Economic and Demographic Research
2016
Estimated
revenue loss
Municipality County Population No Yes Amount of Permit Fee FY 2014-15 FY 2015-16 FY 2016-17 FY 2017-18
Altamonte Springs Seminole 43,905
Apopka Orange 47,826
Aventura Miami-Dade 37,611
Boca Raton Palm Beach 88,275 X No impact
Bonita Springs Lee 48,388
Boynton Beach Palm Beach 73,163
Bradenton Manatee 53,771
Cape Coral Lee 170,474 X
No separate category for this
type of fence. Would require
permitting fee associated with
traditional fence. NR
Casselberry Seminole 27,786
Clearwater Pinellas 112,387 X No impact
Clermont Lake 34,667
Coconut Creek Broward 57,116
Cooper City Broward 33,671 X No impact
Coral Gables Miami-Dade 49,449
Coral Springs Broward 126,264
Cutler Bay Miami-Dade 44,901
Dania Beach Broward 31,093 X
Minimal
impact
Davie Broward 99,446
Daytona Beach Volusia 64,569
Deerfield Beach Broward 77,659
DeLand Volusia 31,792 X No impact
Delray Beach Palm Beach 63,972
Deltona Volusia 88,922
Doral Miami-Dade 59,304
Dunedin Pinellas 36,060
Estero Lee 30,565
Fort Lauderdale Broward 176,747
Fort Myers Lee 76,108
Fort Pierce St. Lucie 42,489
Gainesville Alachua 128,612 X No impact
Greenacres Palm Beach 39,066
Hallandale Beach Broward 38,621
Hialeah Miami-Dade 233,431
Hollywood Broward 146,155
Homestead Miami-Dade 70,209 X
Electric fences not allowed by
code. No impact
Jacksonville Duval 878,456 X No impact
Jupiter Palm Beach 60,615 X No impact
Key West Monroe 25,009 X $40 120$ 120$ 120$ -$
Kissimmee Osceola 68,401 X No impact
Lake Worth Palm Beach 37,475 X
2.5% of value of the fence
(average fee $125) (4,000)$
Lakeland Polk 102,507
Largo Pinellas 81,587
Lauderdale Lakes Broward 34,830
Lauderhill Broward 70,677
Margate Broward 57,226
Melbourne Brevard 80,419 X No impact
Miami Miami-Dade 456,089
Miami Beach Miami-Dade 92,797
Miami Gardens Miami-Dade 111,998
Miami Lakes Miami-Dade 30,456
Miramar Broward 134,037
New Smyrna Beach Volusia 25,078 X No impact
North Lauderdale Broward 44,064
North Miami Miami-Dade 63,731
North Miami Beach Miami-Dade 44,512
North Port Sarasota 64,472
Oakland Park Broward 44,098 X $160 -$
Ocala Marion 59,720 X No impact
Ocoee Orange 41,881
Orlando Orange 271,752
Ormond Beach Volusia 40,366
Fiscal Impact Analysis of 2017 CS/CS/HB 241 regarding Alarm SystemsDoes your municipality currently charge a
permitting fee for the installation or
replacement of new or existing low-
voltage electric fence?
Estimated revenues resulting from such
permitting fees.
The City would lose $120 per permit;
however, the City would expect minimal
revenue loss since no such permits were
issued during the last three fiscal years.
No separate data for new or existing low-
voltage electric fences.
Fiscal Impact Analysis of CS/CS/HB 241 June 9, 2017639

Office of Economic and Demographic Research
2016
Estimated
revenue loss
Municipality County Population No Yes Amount of Permit Fee FY 2014-15 FY 2015-16 FY 2016-17 FY 2017-18
Fiscal Impact Analysis of 2017 CS/CS/HB 241 regarding Alarm SystemsDoes your municipality currently charge a
permitting fee for the installation or
replacement of new or existing low-
voltage electric fence?
Estimated revenues resulting from such
permitting fees.
Oviedo Seminole 37,128
Palm Bay Brevard 109,162
Palm Beach Gardens Palm Beach 51,532
Palm Coast Flagler 81,184
Panama City Bay 36,909 X No impact
Parkland Broward 29,586 X
Permit and inspection fee of
$200 -$
Pembroke Pines Broward 161,799
Pensacola Escambia 53,690 X
City code (i.e., Sec. 12-2-40.-
Fences) prohibits permitting of
electrical fences. No impact
Pinellas Park Pinellas 52,497 X
Fee amount based on
valuation; $60-$70 for a typical
fence on a residential lot. -$
Plant City Hillsborough 37,840
Plantation Broward 88,328 X No impact
Pompano Beach Broward 107,425 X $40 -$
Port Orange Volusia 59,315
Port St. Lucie St. Lucie 178,091 X No impact
Riviera Beach Palm Beach 33,957
Rockledge Brevard 26,303 X
Permit fee averages
approximately $45 900$ 900$ 900$ (100)$
Royal Palm Beach Palm Beach 37,138
Sanford Seminole 57,248 X No impact
Sarasota Sarasota 53,865
St. Cloud Osceola 42,998
St. Petersburg Pinellas 259,906
Sunrise Broward 90,714
Tallahassee Leon 189,675
Tamarac Broward 63,309
Tampa Hillsborough 365,124
Temple Terrace Hillsborough 25,820
Titusville Brevard 46,022
Wellington Palm Beach 60,308
West Palm Beach Palm Beach 108,896
Weston Broward 66,526 X
A miscellaneous electrical
base permit fee of $86.34 per
structure per trade is charged.
Escalating fees based on
construction costs. -$
Winter Garden Orange 41,606
Winter Haven Polk 39,524 X No impact
Winter Park Orange 29,308 X No impact
Winter Springs Seminole 36,156
Municipal Total 8,365,616 20 9 1,020$ 1,020$ 1,020$ (4,100)$
Response Rate 31%
Source: EDR's May 2017 e-mail survey of those 95 municipal governments having a 2016 population greater than 25,000.
No permits for low-voltage electric fences
have been issued in the last three years.
No significant impact expected as City does
not grant many permits for this purpose.
No permit applications received so no
revenue to report. The City would lose $160
per permit; however, there have been no
applications in recent years.
No permits for low-voltage electric fences
have been issued in the last three years.
Fiscal Impact Analysis of CS/CS/HB 241 June 9, 2017640

REVENUE ESTIMATING CONFERENCE Tax: Local Taxes and Fees Issue: Provides that an authority (i.e., a county or municipality) may not prohibit, regulate, or charge for the collocation of small wireless facilities in the public rights-of-way, except as specified, and caps the rate for collocation on an authority utility pole at $150 annually. Bill Number(s): CS/CS/HB 687 Entire Bill Partial Bill: Sponsor(s): Commerce Committee and Energy & Utilities Subcommittee and Representative La Rosa Month/Year Impact Begins: July 1, 2017 Date of Analysis: June 9, 2017 Section 1: Narrative a. Current Law: Pursuant to s. 337.401, F.S., the Department of Transportation (DOT) and each local governmental entity that has
jurisdiction and control of public roads or publicly owned rail corridors are authorized to prescribe and enforce reasonable rules or regulations with regard to the placement and maintenance of utility facilities across, on, or within the right-of-way limits of any road or publicly owned rail corridors under its jurisdiction. These entities are referred to individually as the authority. The authority may authorize any person who is a resident of this state, or any corporation which is organized under the laws of this state or licensed to do business within this state, to use a right-of-way for a utility in accordance with the authority’s rules or regulations. A utility may not be installed, located, or relocated within a right-of-way unless authorized by a written permit. The permit must require the permit holder to be responsible for any damage resulting from the permitted use of the right-of-way. Municipalities and counties must treat providers of communications services in a nondiscriminatory and competitively neutral manner when imposing such rules or regulations. The rules and regulations must be generally applicable to all such providers and may not require such providers to apply for or enter into an individual license, franchise, or other agreement as a condition of using the right-of-way. Pursuant to s. 202.24(1), F.S., the authority of a public body to require taxes, fees, charges, or other impositions from dealers of communications services for occupying its roads and rights-of-way is specifically preempted by the state, with certain exceptions. However, s. 202.24(2)(c), F.S., the following are among the taxes, fees, and charges not preempted. 1. Pole attachment fees charged by a local government for attachments to its utility poles. 2. Amounts charged for the rental or other use of property owned by a public body which is not in the public rights-of-way to
a dealer of communications services for any purpose, including, but not limited to, the placement or attachment of equipment used in the provision of communications services.
3. Permit fees related to placing or maintaining facilities in or on public roads or rights-of-way pursuant to s. 337.401, F.S.
b. Proposed Change: The bill amends s. 337.401, F.S., to create the Advanced Wireless Infrastructure Deployment Act, which establishes a process by which wireless providers may place certain small wireless facilities on, under, within, or adjacent to certain utility poles or wireless support structures within public rights-of-way that are under the jurisdiction and control of an authority (i.e., a county or municipality). The bill provides that an authority may not prohibit, regulate, or charge for the collocation of small wireless facilities in the public rights-of-way, except as specified in the bill, and caps the rate for collocation on an authority utility pole at $150 per pole annually. Small wireless facilities are defined in the bill as wireless facilities that meet the following size limitations: 1. Each antenna associated with the facility is located inside an enclosure of no more than 6 cubic feet in volume or, if the
antenna has exposed elements, the antenna and all of its exposed elements would fit within an enclosure of the same volume.
2. All associated wireless equipment is cumulatively no more than 28 cubic feet in volume. Under the bill, a utility pole includes any pole or similar structure that is used in whole or in part to provide communication services or for electric distribution, lighting, traffic control, signage, or a similar function, but does not include any horizontal support structures to which signal lights or other traffic control devices are attached or any pole or similar structure 15 feet in height or less. The bill excludes utility poles that are:
X
641

REVENUE ESTIMATING CONFERENCE Tax: Local Taxes and Fees Issue: Provides that an authority (i.e., a county or municipality) may not prohibit, regulate, or charge for the collocation of small wireless facilities in the public rights-of-way, except as specified, and caps the rate for collocation on an authority utility pole at $150 annually. Bill Number(s): CS/CS/HB 687
1. Owned by a municipal electric utility or used to support electric distribution facilities owned or operated by a municipality; 2. Located in the right-of-way within a retirement community that is deed-restricted as housing for older persons as defined in
s. 760.29(4)(b), F.S., has more than 5,000 residents, and has underground utilities for electric transmission or distribution; or
3. Located in the right-of-way within a municipality that is located on a coastal barrier island as defined in s. 161.053(b)(3), F.S., has a land area of less than 5 square miles, has less than 10,000 residents, and, prior to July 1, 2017, has received referendum approval to issue debt to finance municipal-wide undergrounding of its utilities for electric transmission or distribution.
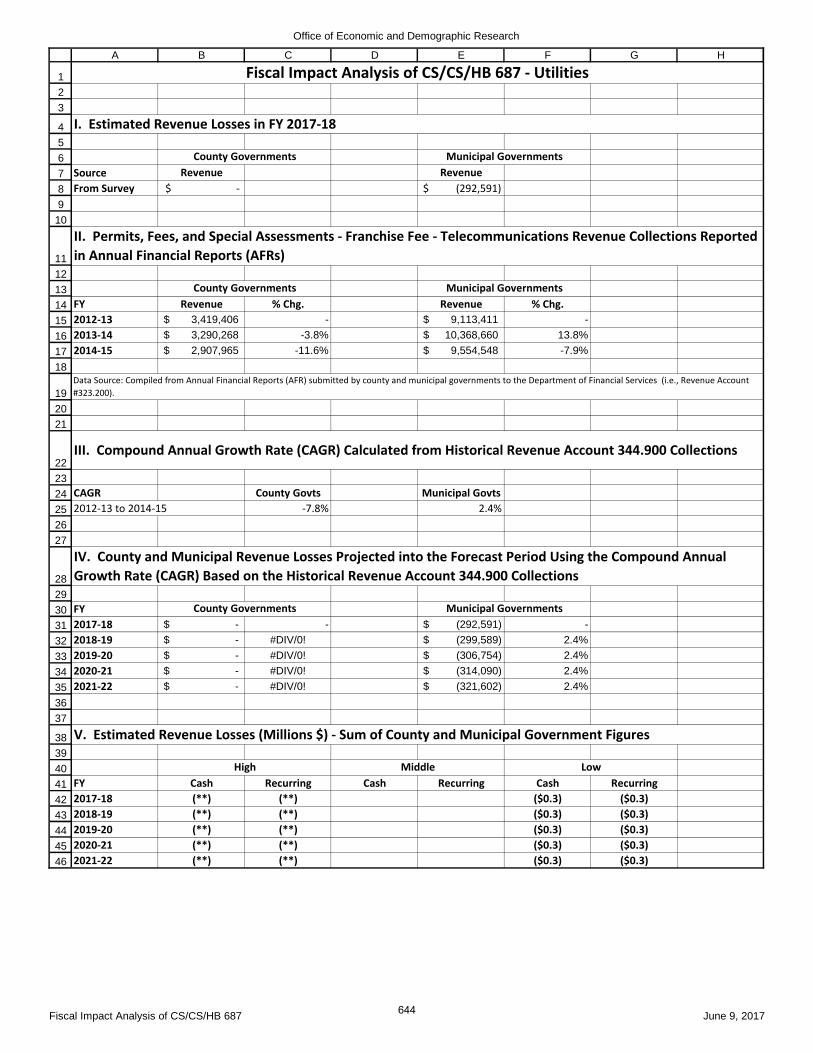
Section 2: Description of Data and Sources House Energy and Utilities Subcommittee staff provided written response indicating fees for two municipalities: City of Jacksonville: Ordinance Code Title XXI, Chapter 711, Part 4A – Site Leases for Small Cell Antennas on City Improvements Section 711.421: $250 application fee Section 711.426: $1,200 annual site lease fee with 3% annual escalator Fort Walton Beach: Small Cell Master Lease Agreement with Verizon Section 3: Annual site lease fee of $2,000 per site Section 4: Annual electrical service fee of $200 Section 3: Methodology (Include Assumptions and Attach Details) EDR surveyed select local governments to ask if the local government currently charges a fee on wireless providers for the collocation of small wireless facilities in the public rights-of-way. The initial survey was sent on May 15, 2017, and a follow-up survey, in an effort to boost the low response rate, was sent on May 24, 2017. If a fee was indicated, the local government was asked to specify the fee(s) and report estimated revenues resulting from such fees in the last three fiscal years (i.e., FY 2014-15 through FY 2016-17) and to estimate the revenue loss in FY 2017-18 resulting from the legislation. EDR staff surveyed the 42 county governments having a 2016 population greater than 50,000 and the 95 municipal governments having a 2016 municipal governments having a 2016 population greater than 25,000 (total of 137 local governments). Eight of 42 county governments (i.e., 19%) and 14 of 95 municipal governments (i.e., 15%) responded to the EDR survey (see attached summary). Seven of the 8 county governments (i.e., 88%) and 10 of the 14 municipal governments (i.e., 71%) responding to the EDR survey indicated that no fee(s) were currently being charged on wireless providers for the collocation of small wireless facilities in the public rights-of-way. For the 1 county government that indicated a current fee, the single county (i.e., Orange) did not quantify the estimated revenue loss but suggested the loss would be great. For the 4 municipal governments that indicated current fees, one municipality (i.e., Cooper City) quantified the estimated revenue loss; however, the other 3 municipalities (i.e., Dania Beach, Homestead, and Jacksonville) did not quantify the estimated revenue loss. Dania Beach and Homestead suggested the losses would be minimal; however, Jacksonville suggested the loss would be significant. In written responses, a number of local governments indicated that more study of the potential impacts would need to be undertaken if the bill became law. This analysis uses a compound annual growth rate calculated from historical Revenue Account 323.200 – Permits, Fees, and Special Assessments – Franchise Fee – Telecommunications collections to project the estimated revenue losses into the forecast period. In those cases where a local government does not currently charge such a collocation fee, some local governments indicated that the new legislation, if it becomes law, might encourage them to charge a fee, up to the annual amount of $150 per pole, as a new source of revenue. In written responses to the EDR survey, some local governments suggested that the estimated revenue losses might be significant given the potentially large number of future applicants; however, county or municipal government staff would need to study and evaluate the bill language in greater detail, if the bill becomes law. Based on comments by some local governments as to the
642

REVENUE ESTIMATING CONFERENCE Tax: Local Taxes and Fees Issue: Provides that an authority (i.e., a county or municipality) may not prohibit, regulate, or charge for the collocation of small wireless facilities in the public rights-of-way, except as specified, and caps the rate for collocation on an authority utility pole at $150 annually. Bill Number(s): CS/CS/HB 687 uncertainty of the bill’s fiscal impact and the very limited data gathered from the low number of survey respondents, EDR staff is suggesting that the proposed High impact of indeterminate negative is more appropriate than the Low impact. Section 4: Proposed Fiscal Impact (Millions $)
High Middle Low
Cash Recurring Cash Recurring Cash Recurring
2017-18 (**) (**) (0.3) (0.3)
2018-19 (**) (**) (0.3) (0.3)
2019-20 (**) (**) (0.3) (0.3)
2020-21 (**) (**) (0.3) (0.3)
2021-22 (**) (**) (0.3) (0.3)
List of Affected Trust Funds: Local funds only. Section 5: Consensus Estimate (Adopted: 06/09/2017): The Conference adopted the high estimate.
GR Trust Local/Other Total
Cash Recurring Cash Recurring Cash Recurring Cash Recurring
2017-18 0.0 0.0 0.0 0.0 (**) (**) (**) (**)
2018-19 0.0 0.0 0.0 0.0 (**) (**) (**) (**)
2019-20 0.0 0.0 0.0 0.0 (**) (**) (**) (**)
2020-21 0.0 0.0 0.0 0.0 (**) (**) (**) (**)
2021-22 0.0 0.0 0.0 0.0 (**) (**) (**) (**)
643
Office of Economic and Demographic Research
1
2
3
4
5
6
7
8
9
10
11
12
13
14
15
16
17
18
19
20
21
22
23
24
25
26
27
28
29
30
31
32
33
34
35
36
37
38
39
40
41
42
43
44
45
46
A B C D E F G H
Source Revenue Revenue
From Survey $ - $ (292,591)
FY Revenue % Chg. Revenue % Chg.
2012-13 3,419,406$ - 9,113,411$ -
2013-14 3,290,268$ -3.8% 10,368,660$ 13.8%
2014-15 2,907,965$ -11.6% 9,554,548$ -7.9%
CAGR County Govts Municipal Govts
2012-13 to 2014-15 -7.8% 2.4%
FY
2017-18 -$ - (292,591)$ -
2018-19 -$ #DIV/0! (299,589)$ 2.4%
2019-20 -$ #DIV/0! (306,754)$ 2.4%
2020-21 -$ #DIV/0! (314,090)$ 2.4%
2021-22 -$ #DIV/0! (321,602)$ 2.4%
FY Cash Recurring Cash Recurring Cash Recurring
2017-18 (**) (**) ($0.3) ($0.3)
2018-19 (**) (**) ($0.3) ($0.3)
2019-20 (**) (**) ($0.3) ($0.3)
2020-21 (**) (**) ($0.3) ($0.3)
2021-22 (**) (**) ($0.3) ($0.3)
County Governments Municipal Governments
Fiscal Impact Analysis of CS/CS/HB 687 - Utilities
I. Estimated Revenue Losses in FY 2017-18
County Governments Municipal Governments
II. Permits, Fees, and Special Assessments - Franchise Fee - Telecommunications Revenue Collections Reported
in Annual Financial Reports (AFRs)
High Middle Low
Data Source: Compiled from Annual Financial Reports (AFR) submitted by county and municipal governments to the Department of Financial Services (i.e., Revenue Account
#323.200).
III. Compound Annual Growth Rate (CAGR) Calculated from Historical Revenue Account 344.900 Collections
IV. County and Municipal Revenue Losses Projected into the Forecast Period Using the Compound Annual
Growth Rate (CAGR) Based on the Historical Revenue Account 344.900 Collections
County Governments Municipal Governments
V. Estimated Revenue Losses (Millions $) - Sum of County and Municipal Government Figures
Fiscal Impact Analysis of CS/CS/HB 687 June 9, 2017644

Office of Economic and Demographic Research
2016
Estimated
revenue loss
County Population No Yes Amount of Fee FY 2014-15 FY 2015-16 FY 2016-17 FY 2017-18
Alachua 257,062 X No impact
Bay 176,016 X No impact
Brevard 568,919
Broward 1,854,513
Charlotte 170,450
Citrus 143,054
Clay 205,321
Collier 350,202
Columbia 68,566
Duval 923,647
Escambia 309,986
Flagler 103,095
Hernando 179,503
Highlands 101,531
Hillsborough 1,352,797 X No impact
Indian River 146,410
Jackson 50,345
Lake 323,985
Lee 680,539
Leon 287,671
Manatee 357,591
Marion 345,749
Martin 150,870
Miami-Dade 2,700,794 X
Staff will need to consider
impact on operations if
collocation requests are
received. No impact
Monroe 76,047
Nassau 77,841
Okaloosa 192,925 X No impact
Orange 1,280,387 X
$100 right-of-way permit fee
per each individual application -
not specific to collocation of
small wireless facilities
Unspecified
but great due
to up to 30
requests per
application
Osceola 322,862
Palm Beach 1,391,741
Pasco 495,868
Pinellas 954,569
Polk 646,989
Putnam 72,972
Santa Rosa 167,009 X No impact
Sarasota 399,538
Seminole 449,124
St. Johns 220,257 X No impact
St. Lucie 292,826
Sumter 118,577
Volusia 517,411
Walton 62,943
County Total 19,548,502 7 1 -$ -$ -$ -$
Response Rate 19%
Source: EDR's May 2017 e-mail survey of those 42 county governments having a 2016 countywide population greater than 50,000.
Fiscal Impact Analysis of 2017 CS/CS/HB 687 regarding UtilitiesDoes your county currently charge a fee
on wireless providers for the collocation
of small wireless facilties in the public
rights-of-way?
Estimated revenues resulting from such
fees.
Fiscal Impact Analysis of CS/CS/HB 687 June 9, 2017645

Office of Economic and Demographic Research
2016
Estimated
revenue loss
Municipality County Population No Yes Amount of Fee FY 2014-15 FY 2015-16 FY 2016-17 FY 2017-18
Altamonte Springs Seminole 43,905
Apopka Orange 47,826
Aventura Miami-Dade 37,611
Boca Raton Palm Beach 88,275
Bonita Springs Lee 48,388 X No impact
Boynton Beach Palm Beach 73,163
Bradenton Manatee 53,771
Cape Coral Lee 170,474 X No impact
Casselberry Seminole 27,786
Clearwater Pinellas 112,387 X No impact
Clermont Lake 34,667
Coconut Creek Broward 57,116
Cooper City Broward 33,671 X
The City has several cell tower
lease agreements with annual
escalator -$ -$ 294,241$ (292,591)$
Coral Gables Miami-Dade 49,449
Coral Springs Broward 126,264
Cutler Bay Miami-Dade 44,901
Dania Beach Broward 31,093 X
Minimal
impact
Davie Broward 99,446
Daytona Beach Volusia 64,569
Deerfield Beach Broward 77,659
DeLand Volusia 31,792 X No impact
Delray Beach Palm Beach 63,972
Deltona Volusia 88,922
Doral Miami-Dade 59,304
Dunedin Pinellas 36,060
Estero Lee 30,565
Fort Lauderdale Broward 176,747
Fort Myers Lee 76,108
Fort Pierce St. Lucie 42,489
Gainesville Alachua 128,612
Greenacres Palm Beach 39,066
Hallandale Beach Broward 38,621
Hialeah Miami-Dade 233,431
Hollywood Broward 146,155
Homestead Miami-Dade 70,209 X
$100 annual fee per pole.
Additional Make Ready fees
for new installations and
Maintenance fees for city-
completed work. 131,213$ 51,669$ 132,000$ Minimal
Jacksonville Duval 878,456 X
$250 application fee and an
annual $1,200 site lease fee
per tower with an annual 3%
escalator
Significant
revenue loss
Jupiter Palm Beach 60,615
Key West Monroe 25,009 X No impact
Kissimmee Osceola 68,401
Lake Worth Palm Beach 37,475 X No impact
Lakeland Polk 102,507
Largo Pinellas 81,587
Lauderdale Lakes Broward 34,830
Lauderhill Broward 70,677
Margate Broward 57,226
Melbourne Brevard 80,419
Miami Miami-Dade 456,089
Miami Beach Miami-Dade 92,797
Miami Gardens Miami-Dade 111,998
Miami Lakes Miami-Dade 30,456
Miramar Broward 134,037
New Smyrna Beach Volusia 25,078
North Lauderdale Broward 44,064
North Miami Miami-Dade 63,731
North Miami Beach Miami-Dade 44,512
North Port Sarasota 64,472
Oakland Park Broward 44,098
Ocala Marion 59,720 X No impact
Fiscal Impact Analysis of 2017 CS/CS/HB 687 regarding UtilitiesDoes your county currently charge a fee
on wireless providers for the collocation
of small wireless facilties in the public
rights-of-way?
Estimated revenues resulting from such
fees.
Fiscal Impact Analysis of CS/CS/HB 687 June 9, 2017646

Office of Economic and Demographic Research
2016
Estimated
revenue loss
Municipality County Population No Yes Amount of Fee FY 2014-15 FY 2015-16 FY 2016-17 FY 2017-18
Fiscal Impact Analysis of 2017 CS/CS/HB 687 regarding UtilitiesDoes your county currently charge a fee
on wireless providers for the collocation
of small wireless facilties in the public
rights-of-way?
Estimated revenues resulting from such
fees.
Ocoee Orange 41,881
Orlando Orange 271,752
Ormond Beach Volusia 40,366
Oviedo Seminole 37,128
Palm Bay Brevard 109,162
Palm Beach Gardens Palm Beach 51,532
Palm Coast Flagler 81,184
Panama City Bay 36,909 X No impact
Parkland Broward 29,586
Pembroke Pines Broward 161,799
Pensacola Escambia 53,690
Pinellas Park Pinellas 52,497
Plant City Hillsborough 37,840
Plantation Broward 88,328 X No impact
Pompano Beach Broward 107,425
Port Orange Volusia 59,315
Port St. Lucie St. Lucie 178,091
Riviera Beach Palm Beach 33,957
Rockledge Brevard 26,303
Royal Palm Beach Palm Beach 37,138
Sanford Seminole 57,248
Sarasota Sarasota 53,865
St. Cloud Osceola 42,998
St. Petersburg Pinellas 259,906
Sunrise Broward 90,714
Tallahassee Leon 189,675
Tamarac Broward 63,309
Tampa Hillsborough 365,124
Temple Terrace Hillsborough 25,820
Titusville Brevard 46,022
Wellington Palm Beach 60,308
West Palm Beach Palm Beach 108,896
Weston Broward 66,526
Winter Garden Orange 41,606
Winter Haven Polk 39,524
Winter Park Orange 29,308 X No impact
Winter Springs Seminole 36,156
Municipal Total 8,365,616 10 4 131,213$ 51,669$ 426,241$ (292,591)$
Response Rate 15%
Source: EDR's May 2017 e-mail survey of those 95 municipal governments having a 2016 population greater than 25,000.
The City was in discussions with carriers
about possible monthly rents and other cities
about comparable rents.
Fiscal Impact Analysis of CS/CS/HB 687 June 9, 2017647

REVENUE ESTIMATING CONFERENCE Tax: Local Taxes and Fees Issue: Preempts to the state the regulation of Transportation Network Companies (TNCs), TNC drivers, and TNC vehicles and prohibits a local governmental entity or subdivision from requiring a license or imposing a tax on such TNCs. TNC drivers, and TNC vehicles. Bill Number(s): CS/HB 221 (codified as Chapter 2017-12, Laws of Florida) Entire Bill Partial Bill: Sponsor(s): Government Accountability Committee and Representatives Sprowls and J. Grant Month/Year Impact Begins: July 1, 2017 Date of Analysis: June 9, 2017 Section 1: Narrative a. Current Law: Florida law provides for certain regulations regarding taxis, limousines, and other for-hire transportation services,
including minimum insurance requirement in s. 324.032, F.S.; an exception to workers’ compensation insurance requirements under certain circumstances in s. 440.02(15)(c)10., F.S.; and an exception to child restraint requirements in s. 316.613, F.S. Any additional regulations of these transportation services is established at the local level. Pursuant to s. 125.01(1)(n). F.S., county governing bodies, to the extent not inconsistent with general or special law, have the power to license and regulate taxis, jitneys (i.e., a bus or other vehicle carrying passengers for a low fare), limousines for hire, rental cars, and for-hire vehicles that operate in the county’s unincorporated area. Pursuant to s. 166.021(3)(c), F.S., municipal governing bodies have the power to enact legislation concerning any subject matter upon which the state legislature may act, except any subject expressly preempted to the state or county governments by the constitution or general law. Since the regulation of taxis, limousines, and other for-hire vehicles has not been expressly preempted to the state or county government, municipalities may regulate these vehicles under their broad home rule powers.
b. Proposed Change: The legislation creates Section 627.748, F.S., in Part XI (i.e., Motor Vehicle and Casualty Insurance Contracts) of Chapter 627, F.S., (i.e., Insurance Rates and Contracts) and expresses the Legislature’s intent to provide for uniformity of laws governing a Transportation Network Company (TNC), TNC drivers, and TNC vehicles throughout the state. The bill provides that TNCs, TNC drivers, and TNC vehicles will be governed exclusively by state law, including in any locality or other jurisdiction that enacted a law or created rules governing such TNCs, TNC drivers, and TNC vehicles before July 1, 2017. Subsection 15 of s. 627.748, F.S., provides that a county, municipality, special district, airport authority, port authority, or other local governmental entity or subdivision may not:
1) Impose a tax on, or require a license for a TNC, TNC driver, or TNC vehicle if such tax or license relates to providing
prearranged rides; 2) Subject a TNC, a TNC driver, or a TNC vehicle to any rate, entry, operation, or other requirement of the county,
municipality, special district, airport authority, port authority, or other local governmental entity or subdivision; or 3) Require a TNC or TNC driver to obtain a business license or any other type of similar authorization to operate within
the local governmental entity’s jurisdiction.
This subsection does not prohibit an airport or seaport from charging reasonable pickup fees consistent with any pickup fees charged to taxicab companies at that airport or seaport for their use of the airport’s or seaport’s facilities or prohibit the airport or seaport from designating locations for staging, pickup, and other similar operations at the airport or seaport.
Section 2: Description of Data and Sources House Government Accountability Committee staff Florida Association of Special Districts (FASD) Florida Ports Council Lyft “Florida Driver Information” webpage: https://help.lyft.com/hc/en-us/articles/213707938-Florida-Driver-Information Uber representative Section 3: Methodology (Include Assumptions and Attach Details) EDR surveyed select local governments to ask if the local government has enacted any ordinance or rule regulating TNCs, TNC drivers, or TNC vehicles that would be preempted by this bill. The initial survey was sent on May 15, 2017, and a follow-up survey, in
X
648
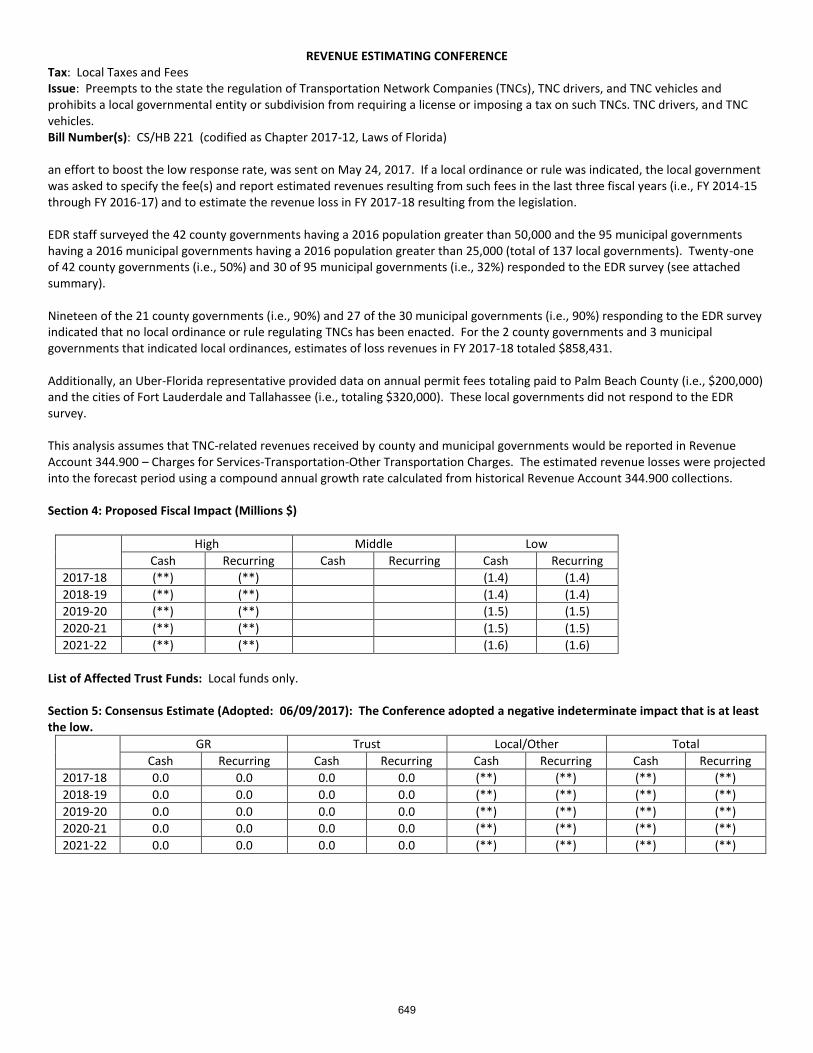
REVENUE ESTIMATING CONFERENCE Tax: Local Taxes and Fees Issue: Preempts to the state the regulation of Transportation Network Companies (TNCs), TNC drivers, and TNC vehicles and prohibits a local governmental entity or subdivision from requiring a license or imposing a tax on such TNCs. TNC drivers, and TNC vehicles. Bill Number(s): CS/HB 221 (codified as Chapter 2017-12, Laws of Florida) an effort to boost the low response rate, was sent on May 24, 2017. If a local ordinance or rule was indicated, the local government was asked to specify the fee(s) and report estimated revenues resulting from such fees in the last three fiscal years (i.e., FY 2014-15 through FY 2016-17) and to estimate the revenue loss in FY 2017-18 resulting from the legislation. EDR staff surveyed the 42 county governments having a 2016 population greater than 50,000 and the 95 municipal governments having a 2016 municipal governments having a 2016 population greater than 25,000 (total of 137 local governments). Twenty-one of 42 county governments (i.e., 50%) and 30 of 95 municipal governments (i.e., 32%) responded to the EDR survey (see attached summary). Nineteen of the 21 county governments (i.e., 90%) and 27 of the 30 municipal governments (i.e., 90%) responding to the EDR survey indicated that no local ordinance or rule regulating TNCs has been enacted. For the 2 county governments and 3 municipal governments that indicated local ordinances, estimates of loss revenues in FY 2017-18 totaled $858,431. Additionally, an Uber-Florida representative provided data on annual permit fees totaling paid to Palm Beach County (i.e., $200,000) and the cities of Fort Lauderdale and Tallahassee (i.e., totaling $320,000). These local governments did not respond to the EDR survey. This analysis assumes that TNC-related revenues received by county and municipal governments would be reported in Revenue Account 344.900 – Charges for Services-Transportation-Other Transportation Charges. The estimated revenue losses were projected into the forecast period using a compound annual growth rate calculated from historical Revenue Account 344.900 collections. Section 4: Proposed Fiscal Impact (Millions $)
High Middle Low
Cash Recurring Cash Recurring Cash Recurring
2017-18 (**) (**) (1.4) (1.4)
2018-19 (**) (**) (1.4) (1.4)
2019-20 (**) (**) (1.5) (1.5)
2020-21 (**) (**) (1.5) (1.5)
2021-22 (**) (**) (1.6) (1.6)
List of Affected Trust Funds: Local funds only. Section 5: Consensus Estimate (Adopted: 06/09/2017): The Conference adopted a negative indeterminate impact that is at least the low.
GR Trust Local/Other Total
Cash Recurring Cash Recurring Cash Recurring Cash Recurring
2017-18 0.0 0.0 0.0 0.0 (**) (**) (**) (**)
2018-19 0.0 0.0 0.0 0.0 (**) (**) (**) (**)
2019-20 0.0 0.0 0.0 0.0 (**) (**) (**) (**)
2020-21 0.0 0.0 0.0 0.0 (**) (**) (**) (**)
2021-22 0.0 0.0 0.0 0.0 (**) (**) (**) (**)
649

Office of Economic and Demographic Research
1
2
3
4
5
6
7
8
9
10
11
12
13
14
15
16
17
18
19
20
21
22
23
24
25
26
27
28
29
30
31
32
33
34
35
36
37
38
39
40
41
42
43
44
45
46
47
48
49
50
A B C D E F G H
Source Revenue Revenue
From Survey $ (779,331) $ (79,100)
From Uber $ (200,000) $ (320,000)
Total $ (979,331) $ (399,100)
FY Revenue % Chg. Revenue % Chg.
2010-11 34,909,747$ - 24,186,797$ -
2011-12 31,176,390$ -10.7% 22,525,013$ -6.9%
2012-13 45,321,109$ 45.4% 21,435,036$ -4.8%
2013-14 47,785,280$ 5.4% 23,064,996$ 7.6%
2014-15 40,263,133$ -15.7% 26,099,775$ 13.2%
CAGR County Govts Municipal Govts
2010-11 to 2014-15 3.6% 1.9%
FY
2017-18 (979,331)$ - (399,100)$ -
2018-19 (1,014,892)$ 3.6% (406,768)$ 1.9%
2019-20 (1,051,744)$ 3.6% (414,582)$ 1.9%
2020-21 (1,089,934)$ 3.6% (422,547)$ 1.9%
2021-22 (1,129,511)$ 3.6% (430,666)$ 1.9%
FY Cash Recurring Cash Recurring Cash Recurring
2017-18 (**) (**) ($1.4) ($1.4)
2018-19 (**) (**) ($1.4) ($1.4)
2019-20 (**) (**) ($1.5) ($1.5)
2020-21 (**) (**) ($1.5) ($1.5)
2021-22 (**) (**) ($1.6) ($1.6)
High Middle Low
County Governments Municipal Governments
III. Compound Annual Growth Rate (CAGR) Calculated from Historical Revenue Account 344.900 Collections
County Governments Municipal Governments
V. Estimated Revenue Losses (Millions $) - Sum of County and Municipal Government Figures
Data Source: Compiled from Annual Financial Reports (AFR) submitted by county and municipal governments to the Department of Financial Services (i.e., Revenue Account
#344.900).
IV. County and Municipal Revenue Losses Projected into the Forecast Period Using the Compound Annual
Growth Rate (CAGR) Based on the Historical Revenue Account 344.900 Collections
Fiscal Impact Analysis of CS/HB 221 - Transportation Network Companies
II. Charges for Services - Transportation - Other Transportation Charges Revenue Collections Reported in
Annual Financial Reports (AFRs)
County Governments Municipal Governments
I. Estimated Revenue Losses in FY 2017-18
Fiscal Impact Analysis of CS/HB 221 June 9, 2017650

Office of Economic and Demographic Research
2016
Estimated
revenue loss
County Population No Yes If Yes, identify Specify fee FY 2014-15 FY 2015-16 FY 2016-17 FY 2017-18
Alachua 257,062 X No impact
Bay 176,016 X No impact
Brevard 568,919 X No impact
Broward 1,854,513 X
Chapter 22 1/2,
Broward County Code of
Ordinances, and
Chapter 40.50(i),
Broward County
Administrative Code
Initial application fee of
$250; increasing annual
licensing fee, from
$2,000 to $300,000,
depending on total # of
vehicles 8,000$ 468,000$ 608,000$ (608,000)$
Charlotte 170,450 X No impact
Citrus 143,054 X No impact
Clay 205,321
Collier 350,202 X No impact
Columbia 68,566
Duval 923,647
Escambia 309,986 X No impact
Flagler 103,095 X No impact
Hernando 179,503
Highlands 101,531
Hillsborough 1,352,797 X
On a temporary basis
only. Adoption of
permanent rules was
abated in light of this
legislation.
Tiered fee structure
based on the # of
permits issued for TNC
vehicles, ranging from
$80 each to $160 each. NR NR NR (171,331)$
Indian River 146,410
Jackson 50,345
Lake 323,985 X No impact
Lee 680,539
Leon 287,671
Manatee 357,591
Marion 345,749 X No impact
Martin 150,870
Miami-Dade 2,700,794
Monroe 76,047
Nassau 77,841
Okaloosa 192,925 X No impact
Orange 1,280,387 X No impact
Osceola 322,862
Palm Beach 1,391,741
Pasco 495,868 X No impact
Pinellas 954,569
Polk 646,989
Putnam 72,972
Santa Rosa 167,009 X No impact
Sarasota 399,538 X No impact
Seminole 449,124
St. Johns 220,257 X No impact
St. Lucie 292,826
Sumter 118,577 X No impact
Volusia 517,411 X No impact
Walton 62,943 X No impact
County Total 19,548,502 19 2 8,000$ 468,000$ 608,000$ (779,331)$
Response Rate 50%
Source: EDR's May 2017 e-mail survey of those 42 county governments having a 2016 countywide population greater than 50,000.
Fiscal Impact Analysis of 2017 CS/HB 221 regarding Transportation Network CompaniesHas your county enacted any ordinance or rule regulating
TNCs, TNC drivers, or TNC vehicles that would be
preempted by this law?
Estimated revenues resulting from an
applicable tax, fee, or charge.
Fiscal Impact Analysis of CS/HB 221 June 9, 2017651

Office of Economic and Demographic Research
2016
Estimated
revenue loss
Municipality County Population No Yes If Yes, identify Specify fee FY 2014-15 FY 2015-16 FY 2016-17 FY 2017-18
Altamonte Springs Seminole 43,905
Apopka Orange 47,826
Aventura Miami-Dade 37,611
Boca Raton Palm Beach 88,275
Bonita Springs Lee 48,388 X No impact
Boynton Beach Palm Beach 73,163
Bradenton Manatee 53,771
Cape Coral Lee 170,474 X No impact
Casselberry Seminole 27,786
Clearwater Pinellas 112,387 X No impact
Clermont Lake 34,667
Coconut Creek Broward 57,116
Cooper City Broward 33,671 X No impact
Coral Gables Miami-Dade 49,449
Coral Springs Broward 126,264 X No impact
Cutler Bay Miami-Dade 44,901
Dania Beach Broward 31,093 X No impact
Davie Broward 99,446
Daytona Beach Volusia 64,569
Deerfield Beach Broward 77,659
DeLand Volusia 31,792 X No impact
Delray Beach Palm Beach 63,972
Deltona Volusia 88,922
Doral Miami-Dade 59,304
Dunedin Pinellas 36,060
Estero Lee 30,565
Fort Lauderdale Broward 176,747
Fort Myers Lee 76,108
Fort Pierce St. Lucie 42,489
Gainesville Alachua 128,612 X
$9,500 annual licensing fee for
Uber and Lyft NR NR 19,000$ (19,000)$
Greenacres Palm Beach 39,066
Hallandale Beach Broward 38,621
Hialeah Miami-Dade 233,431
Hollywood Broward 146,155
Homestead Miami-Dade 70,209 X No impact
Jacksonville Duval 878,456 X No impact
Jupiter Palm Beach 60,615 X No impact
Key West Monroe 25,009 X No impact
Kissimmee Osceola 68,401 X No impact
Lake Worth Palm Beach 37,475 X No impact
Lakeland Polk 102,507
Largo Pinellas 81,587
Lauderdale Lakes Broward 34,830
Lauderhill Broward 70,677
Margate Broward 57,226
Melbourne Brevard 80,419 X No impact
Miami Miami-Dade 456,089
Miami Beach Miami-Dade 92,797
Miami Gardens Miami-Dade 111,998
Miami Lakes Miami-Dade 30,456
Miramar Broward 134,037
New Smyrna Beach Volusia 25,078 X No impact
North Lauderdale Broward 44,064
North Miami Miami-Dade 63,731
North Miami Beach Miami-Dade 44,512
North Port Sarasota 64,472
Oakland Park Broward 44,098 X No impact
Ocala Marion 59,720 X No impact
Ocoee Orange 41,881
Orlando Orange 271,752
Ormond Beach Volusia 40,366
Oviedo Seminole 37,128
Palm Bay Brevard 109,162
Palm Beach Gardens Palm Beach 51,532
Palm Coast Flagler 81,184
Panama City Bay 36,909 X Ordinance 2602 Each TNC is charged $25. NR NR NR (100)$
Parkland Broward 29,586 X No impact
Pembroke Pines Broward 161,799
Pensacola Escambia 53,690 X
City Code Sections 10-
2-4 and 10-2-5
TNC's are charged a pickup
fee of $2.50 per pickup at
Pensacola International Airport
while taxicabs are assessed
an annual permit fee. City
would be concerned that
pickup fees would be
disallowed. 60,000$ 60,000$ 60,000$ (60,000)$
Pinellas Park Pinellas 52,497 X No impact
Plant City Hillsborough 37,840
Plantation Broward 88,328 X No impact
Pompano Beach Broward 107,425 X No impact
Fiscal Impact Analysis of 2017 CS/HB 221 regarding Transportation Network CompaniesHas your county enacted any ordinance or rule regulating TNCs,
TNC drivers, or TNC vehicles that would be preempted by this
law?
Estimated revenues resulting from an
applicable tax, fee, or charge.
Fiscal Impact Analysis of CS/HB 221 June 9, 2017652

Office of Economic and Demographic Research
2016
Estimated
revenue loss
Municipality County Population No Yes If Yes, identify Specify fee FY 2014-15 FY 2015-16 FY 2016-17 FY 2017-18
Fiscal Impact Analysis of 2017 CS/HB 221 regarding Transportation Network CompaniesHas your county enacted any ordinance or rule regulating TNCs,
TNC drivers, or TNC vehicles that would be preempted by this
law?
Estimated revenues resulting from an
applicable tax, fee, or charge.
Port Orange Volusia 59,315
Port St. Lucie St. Lucie 178,091 X No impact
Riviera Beach Palm Beach 33,957
Rockledge Brevard 26,303 X No impact
Royal Palm Beach Palm Beach 37,138
Sanford Seminole 57,248 X No impact
Sarasota Sarasota 53,865
St. Cloud Osceola 42,998
St. Petersburg Pinellas 259,906
Sunrise Broward 90,714
Tallahassee Leon 189,675
Tamarac Broward 63,309
Tampa Hillsborough 365,124
Temple Terrace Hillsborough 25,820
Titusville Brevard 46,022
Wellington Palm Beach 60,308
West Palm Beach Palm Beach 108,896
Weston Broward 66,526 X No impact
Winter Garden Orange 41,606
Winter Haven Polk 39,524 X No impact
Winter Park Orange 29,308 X No impact
Winter Springs Seminole 36,156
Municipal Total 8,365,616 27 3 60,000$ 60,000$ 79,000$ (79,100)$
Response Rate 32%
Source: EDR's May 2017 e-mail survey of those 95 municipal governments having a 2016 population greater than 25,000.
Fiscal Impact Analysis of CS/HB 221 June 9, 2017653

REVENUE ESTIMATING CONFERENCE Tax: Other Taxes and Fees Issue: DOH – Medical Faculty Certification Bill Number(s): CS/CS/HB 209, Ch. 2017-50, L.O.F.
Entire Bill Partial Bill: Sponsor(s): Health & Human Services Committee, Health Quality Subcommittee, Miller, A., and others Month/Year Impact Begins: July 1, 2017 Date of Analysis: June 7, 2017 Section 1: Narrative a. Current Law:
Medical Faculty Certificates The Department of Health (DOH) may issue medical faculty certificates (certificates) to certain physicians allowing them to practice medicine in Florida without passing a licensing exam. These physicians may only practice in conjunction with a full-time faculty position at one of Florida’s 8 medical schools/teaching hospitals. To be eligible to receive the certificate, the physician must, among other requirements, remit a nonrefundable $500 application fee and, upon approval of the application, an initial certificate fee of $424. The certificate must be renewed every 2 years and the physician must pay a renewal fee of $360. There is no limit on the number of initial certificates a medical school may receive. However, the number of medical faculty certificates that may be renewed by each medical school is statutorily limited to 30 per school, except the Mayo Clinic is limited to 10 renewed medical faculty certificates. Temporary Registration of Physicians for Educational Purposes Upon the request of a dean of a medical school or a director of a teaching hospital, the DOH may authorize a physician, via a temporary registration with DOH, to provide medical care or treatment for educational purposes for a single period of time, not to exceed 180 consecutive days. Such physician must pay a $100 registration fee. No more than 3 physicians per year, per institution may be registered to provide such services.
b. Proposed Change:
Medical Faculty Certificates The bill expands the list of eligible medical schools/teaching hospitals that may issue medical faculty certificates to include the Johns Hopkins All Children’s Hospital in St. Petersburg, FL, up to 30 active certificates. Temporary Registration of Physicians for Educational Purposes The bill authorizes the medical director of a specialty-licensed children’s hospital licensed under ch. 395, F.S., that is affiliated with an accredited medical school and its affiliated clinics, to request temporary registration to authorize a physician who is not licensed in Florida to provide medical care or treatment for educational purposes.
Section 2: Description of Data and Sources Sources
s. 458.3145, F.S.
Rule 64B-3.002, F.A.C.
Department of Health, Agency Analysis of 2017 House Bill 209 (Jan. 11, 2017).
Email correspondence with DOH staff, June 1-8, 2017
Email correspondence with AHCA staff, June 6, 2017
Phone conversation with DOH staff, June 1, 2017 (confirmed no change to fiscal in agency analysis from bill amendments subsequent to date of agency analysis).
Data Medical Faculty Certificates
According to DOH, currently there are 54 active medical faculty certificates: o University of Florida - 15
X
654
REVENUE ESTIMATING CONFERENCE Tax: Other Taxes and Fees Issue: DOH – Medical Faculty Certification Bill Number(s): CS/CS/HB 209, Ch. 2017-50, L.O.F.
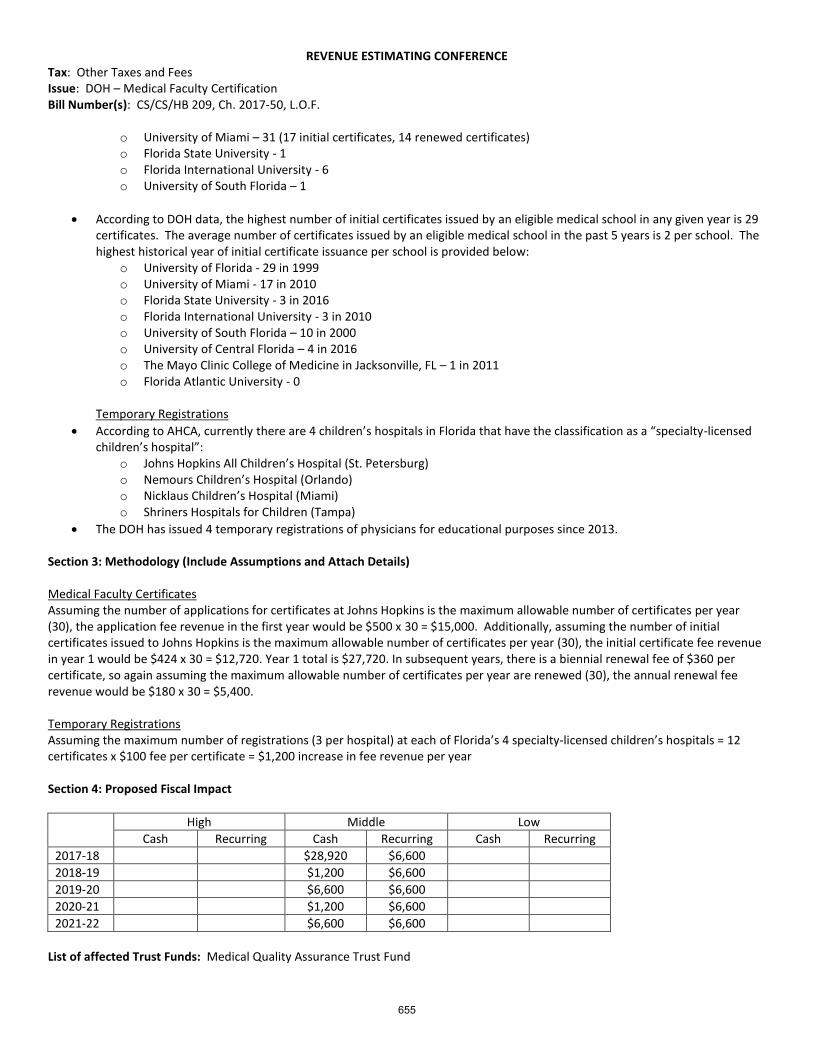
o University of Miami – 31 (17 initial certificates, 14 renewed certificates) o Florida State University - 1 o Florida International University - 6 o University of South Florida – 1
According to DOH data, the highest number of initial certificates issued by an eligible medical school in any given year is 29 certificates. The average number of certificates issued by an eligible medical school in the past 5 years is 2 per school. The highest historical year of initial certificate issuance per school is provided below:
o University of Florida - 29 in 1999 o University of Miami - 17 in 2010 o Florida State University - 3 in 2016 o Florida International University - 3 in 2010 o University of South Florida – 10 in 2000 o University of Central Florida – 4 in 2016 o The Mayo Clinic College of Medicine in Jacksonville, FL – 1 in 2011 o Florida Atlantic University - 0
Temporary Registrations
According to AHCA, currently there are 4 children’s hospitals in Florida that have the classification as a “specialty-licensed children’s hospital”:
o Johns Hopkins All Children’s Hospital (St. Petersburg) o Nemours Children’s Hospital (Orlando) o Nicklaus Children’s Hospital (Miami) o Shriners Hospitals for Children (Tampa)
The DOH has issued 4 temporary registrations of physicians for educational purposes since 2013.
Section 3: Methodology (Include Assumptions and Attach Details) Medical Faculty Certificates Assuming the number of applications for certificates at Johns Hopkins is the maximum allowable number of certificates per year (30), the application fee revenue in the first year would be $500 x 30 = $15,000. Additionally, assuming the number of initial certificates issued to Johns Hopkins is the maximum allowable number of certificates per year (30), the initial certificate fee revenue in year 1 would be $424 x 30 = $12,720. Year 1 total is $27,720. In subsequent years, there is a biennial renewal fee of $360 per certificate, so again assuming the maximum allowable number of certificates per year are renewed (30), the annual renewal fee revenue would be $180 x 30 = $5,400. Temporary Registrations Assuming the maximum number of registrations (3 per hospital) at each of Florida’s 4 specialty-licensed children’s hospitals = 12 certificates x $100 fee per certificate = $1,200 increase in fee revenue per year
Section 4: Proposed Fiscal Impact
High Middle Low
Cash Recurring Cash Recurring Cash Recurring
2017-18 $28,920 $6,600
2018-19 $1,200 $6,600
2019-20 $6,600 $6,600
2020-21 $1,200 $6,600
2021-22 $6,600 $6,600
List of affected Trust Funds: Medical Quality Assurance Trust Fund
655
REVENUE ESTIMATING CONFERENCE Tax: Other Taxes and Fees Issue: DOH – Medical Faculty Certification Bill Number(s): CS/CS/HB 209, Ch. 2017-50, L.O.F.
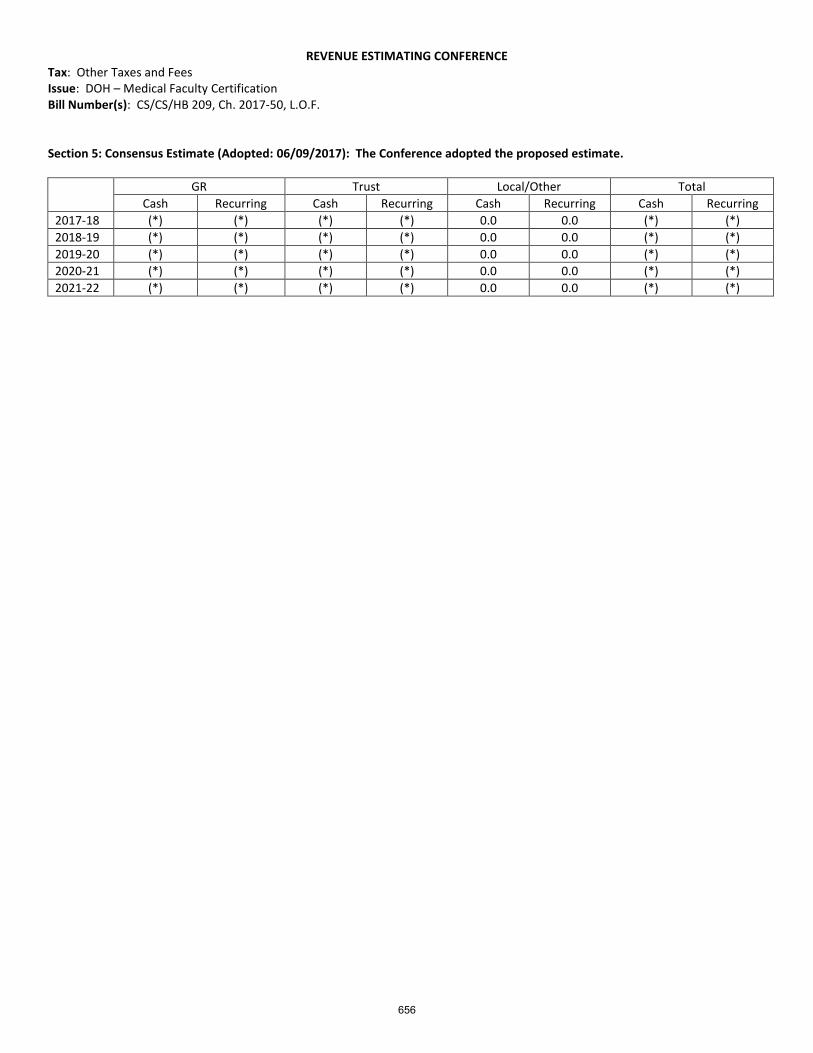
Section 5: Consensus Estimate (Adopted: 06/09/2017): The Conference adopted the proposed estimate.
GR Trust Local/Other Total
Cash Recurring Cash Recurring Cash Recurring Cash Recurring
2017-18 (*) (*) (*) (*) 0.0 0.0 (*) (*)
2018-19 (*) (*) (*) (*) 0.0 0.0 (*) (*)
2019-20 (*) (*) (*) (*) 0.0 0.0 (*) (*)
2020-21 (*) (*) (*) (*) 0.0 0.0 (*) (*)
2021-22 (*) (*) (*) (*) 0.0 0.0 (*) (*)
656
REVENUE ESTIMATING CONFERENCE Tax: Various Fees Issue: Department of Agriculture and Consumer Services Bill Number(s): CS/CS/HB 467
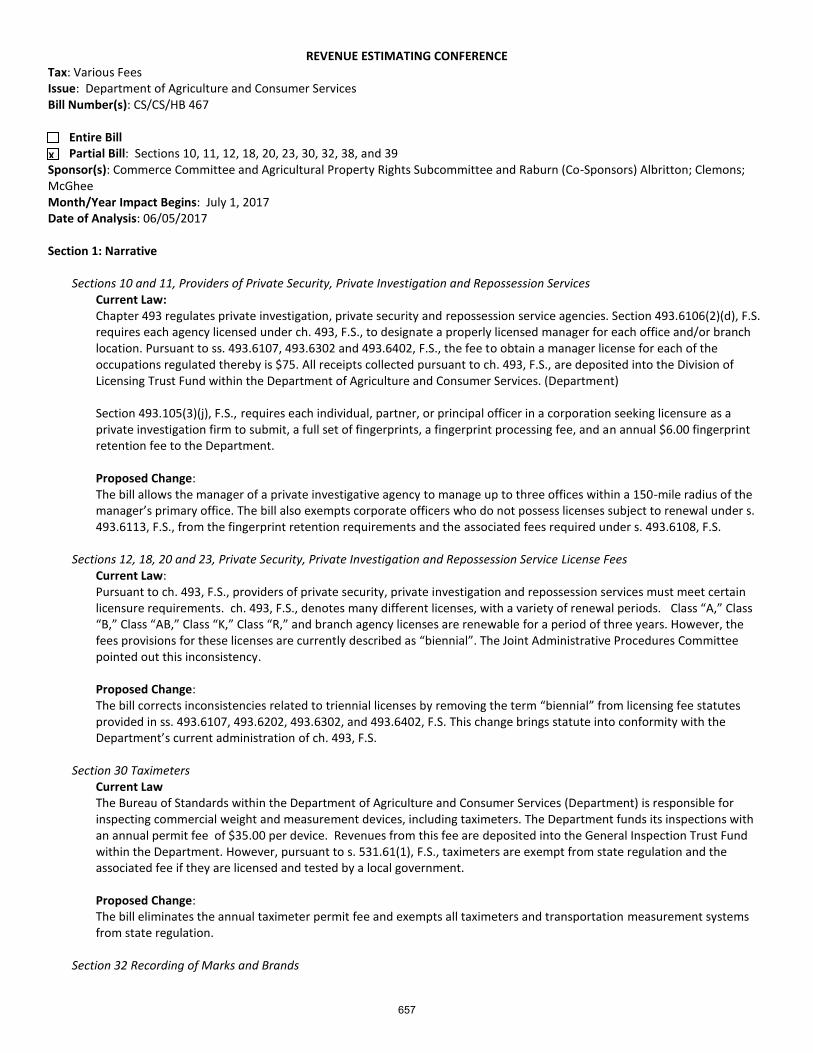
Entire Bill Partial Bill: Sections 10, 11, 12, 18, 20, 23, 30, 32, 38, and 39 Sponsor(s): Commerce Committee and Agricultural Property Rights Subcommittee and Raburn (Co-Sponsors) Albritton; Clemons; McGhee Month/Year Impact Begins: July 1, 2017 Date of Analysis: 06/05/2017 Section 1: Narrative
Sections 10 and 11, Providers of Private Security, Private Investigation and Repossession Services Current Law: Chapter 493 regulates private investigation, private security and repossession service agencies. Section 493.6106(2)(d), F.S. requires each agency licensed under ch. 493, F.S., to designate a properly licensed manager for each office and/or branch location. Pursuant to ss. 493.6107, 493.6302 and 493.6402, F.S., the fee to obtain a manager license for each of the occupations regulated thereby is $75. All receipts collected pursuant to ch. 493, F.S., are deposited into the Division of Licensing Trust Fund within the Department of Agriculture and Consumer Services. (Department) Section 493.105(3)(j), F.S., requires each individual, partner, or principal officer in a corporation seeking licensure as a private investigation firm to submit, a full set of fingerprints, a fingerprint processing fee, and an annual $6.00 fingerprint retention fee to the Department.
Proposed Change: The bill allows the manager of a private investigative agency to manage up to three offices within a 150-mile radius of the manager’s primary office. The bill also exempts corporate officers who do not possess licenses subject to renewal under s. 493.6113, F.S., from the fingerprint retention requirements and the associated fees required under s. 493.6108, F.S.
Sections 12, 18, 20 and 23, Private Security, Private Investigation and Repossession Service License Fees
Current Law: Pursuant to ch. 493, F.S., providers of private security, private investigation and repossession services must meet certain licensure requirements. ch. 493, F.S., denotes many different licenses, with a variety of renewal periods. Class “A,” Class “B,” Class “AB,” Class “K,” Class “R,” and branch agency licenses are renewable for a period of three years. However, the fees provisions for these licenses are currently described as “biennial”. The Joint Administrative Procedures Committee pointed out this inconsistency.
Proposed Change: The bill corrects inconsistencies related to triennial licenses by removing the term “biennial” from licensing fee statutes provided in ss. 493.6107, 493.6202, 493.6302, and 493.6402, F.S. This change brings statute into conformity with the Department’s current administration of ch. 493, F.S.
Section 30 Taximeters
Current Law The Bureau of Standards within the Department of Agriculture and Consumer Services (Department) is responsible for inspecting commercial weight and measurement devices, including taximeters. The Department funds its inspections with an annual permit fee of $35.00 per device. Revenues from this fee are deposited into the General Inspection Trust Fund within the Department. However, pursuant to s. 531.61(1), F.S., taximeters are exempt from state regulation and the associated fee if they are licensed and tested by a local government.
Proposed Change: The bill eliminates the annual taximeter permit fee and exempts all taximeters and transportation measurement systems from state regulation.
Section 32 Recording of Marks and Brands
X
657
REVENUE ESTIMATING CONFERENCE Tax: Various Fees Issue: Department of Agriculture and Consumer Services Bill Number(s): CS/CS/HB 467
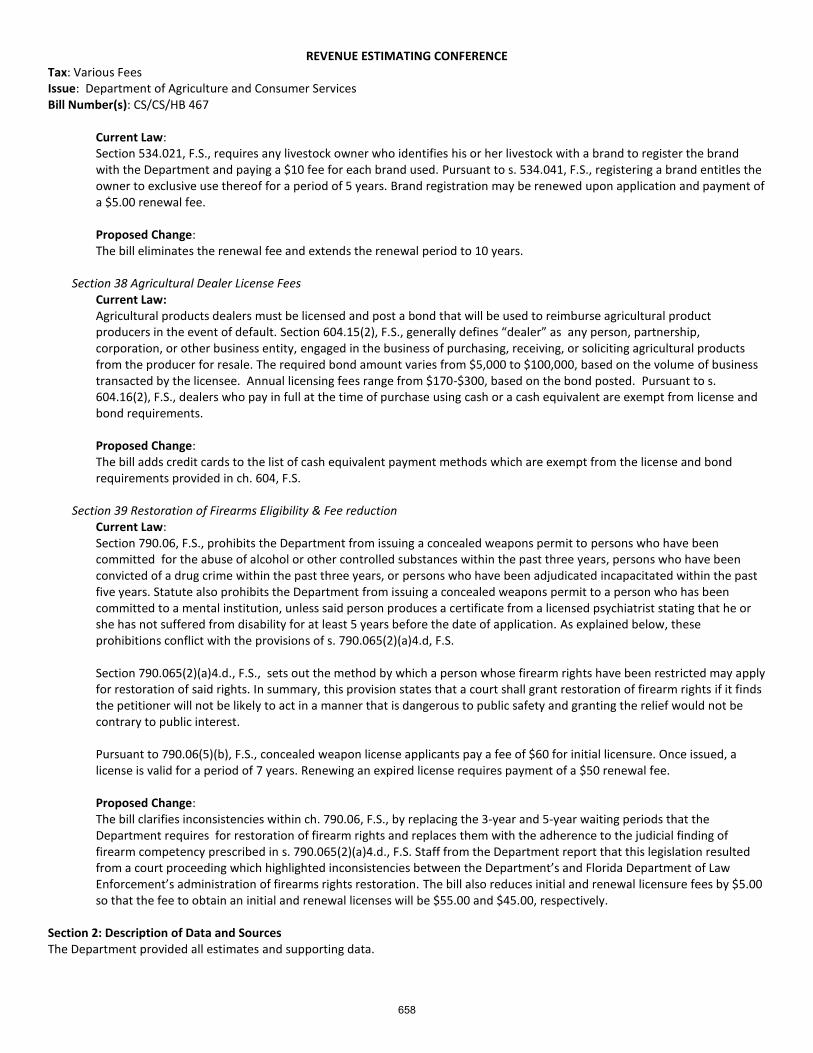
Current Law: Section 534.021, F.S., requires any livestock owner who identifies his or her livestock with a brand to register the brand with the Department and paying a $10 fee for each brand used. Pursuant to s. 534.041, F.S., registering a brand entitles the owner to exclusive use thereof for a period of 5 years. Brand registration may be renewed upon application and payment of a $5.00 renewal fee.
Proposed Change:
The bill eliminates the renewal fee and extends the renewal period to 10 years. Section 38 Agricultural Dealer License Fees Current Law:
Agricultural products dealers must be licensed and post a bond that will be used to reimburse agricultural product producers in the event of default. Section 604.15(2), F.S., generally defines “dealer” as any person, partnership, corporation, or other business entity, engaged in the business of purchasing, receiving, or soliciting agricultural products from the producer for resale. The required bond amount varies from $5,000 to $100,000, based on the volume of business transacted by the licensee. Annual licensing fees range from $170-$300, based on the bond posted. Pursuant to s. 604.16(2), F.S., dealers who pay in full at the time of purchase using cash or a cash equivalent are exempt from license and bond requirements. Proposed Change: The bill adds credit cards to the list of cash equivalent payment methods which are exempt from the license and bond requirements provided in ch. 604, F.S.
Section 39 Restoration of Firearms Eligibility & Fee reduction
Current Law: Section 790.06, F.S., prohibits the Department from issuing a concealed weapons permit to persons who have been committed for the abuse of alcohol or other controlled substances within the past three years, persons who have been convicted of a drug crime within the past three years, or persons who have been adjudicated incapacitated within the past five years. Statute also prohibits the Department from issuing a concealed weapons permit to a person who has been committed to a mental institution, unless said person produces a certificate from a licensed psychiatrist stating that he or she has not suffered from disability for at least 5 years before the date of application. As explained below, these prohibitions conflict with the provisions of s. 790.065(2)(a)4.d, F.S. Section 790.065(2)(a)4.d., F.S., sets out the method by which a person whose firearm rights have been restricted may apply for restoration of said rights. In summary, this provision states that a court shall grant restoration of firearm rights if it finds the petitioner will not be likely to act in a manner that is dangerous to public safety and granting the relief would not be contrary to public interest. Pursuant to 790.06(5)(b), F.S., concealed weapon license applicants pay a fee of $60 for initial licensure. Once issued, a license is valid for a period of 7 years. Renewing an expired license requires payment of a $50 renewal fee. Proposed Change: The bill clarifies inconsistencies within ch. 790.06, F.S., by replacing the 3-year and 5-year waiting periods that the Department requires for restoration of firearm rights and replaces them with the adherence to the judicial finding of firearm competency prescribed in s. 790.065(2)(a)4.d., F.S. Staff from the Department report that this legislation resulted from a court proceeding which highlighted inconsistencies between the Department’s and Florida Department of Law Enforcement’s administration of firearms rights restoration. The bill also reduces initial and renewal licensure fees by $5.00 so that the fee to obtain an initial and renewal licenses will be $55.00 and $45.00, respectively.
Section 2: Description of Data and Sources The Department provided all estimates and supporting data.
658
REVENUE ESTIMATING CONFERENCE Tax: Various Fees Issue: Department of Agriculture and Consumer Services Bill Number(s): CS/CS/HB 467
Section 3: Methodology (Include Assumptions and Attach Details)
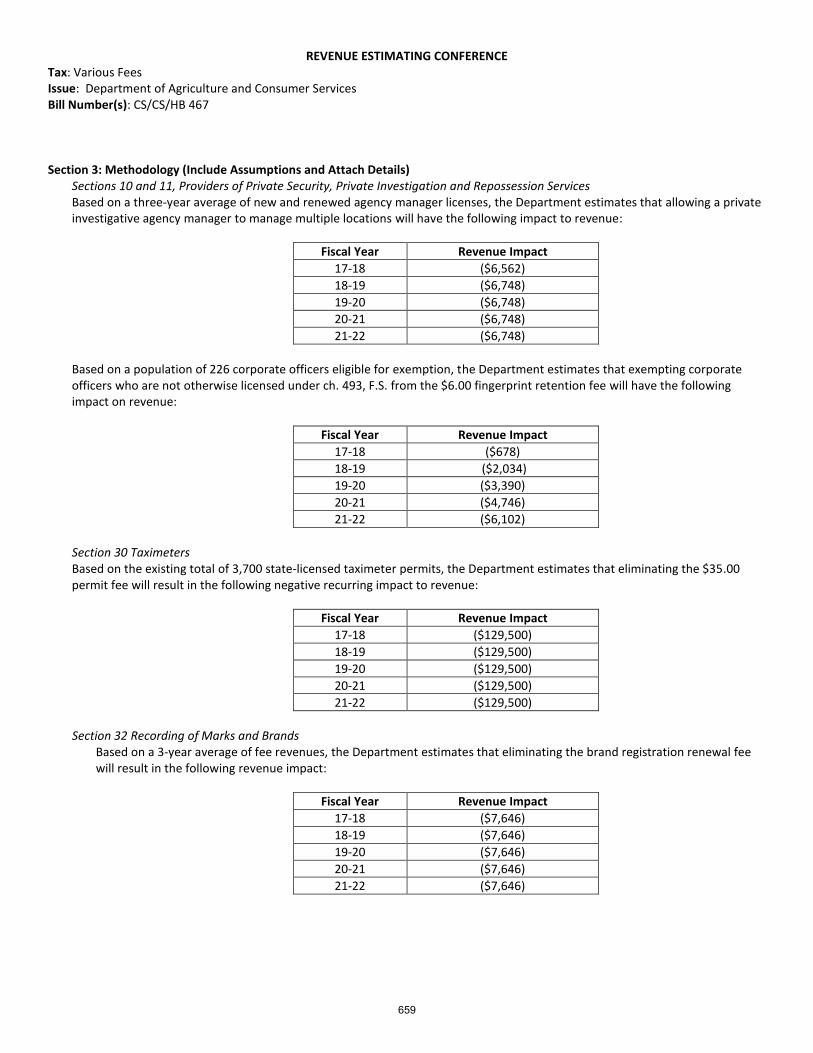
Sections 10 and 11, Providers of Private Security, Private Investigation and Repossession Services Based on a three-year average of new and renewed agency manager licenses, the Department estimates that allowing a private investigative agency manager to manage multiple locations will have the following impact to revenue:
Fiscal Year Revenue Impact
17-18 ($6,562)
18-19 ($6,748)
19-20 ($6,748)
20-21 ($6,748)
21-22 ($6,748)
Based on a population of 226 corporate officers eligible for exemption, the Department estimates that exempting corporate officers who are not otherwise licensed under ch. 493, F.S. from the $6.00 fingerprint retention fee will have the following impact on revenue:
Fiscal Year Revenue Impact
17-18 ($678)
18-19 ($2,034)
19-20 ($3,390)
20-21 ($4,746)
21-22 ($6,102)
Section 30 Taximeters Based on the existing total of 3,700 state-licensed taximeter permits, the Department estimates that eliminating the $35.00 permit fee will result in the following negative recurring impact to revenue:
Fiscal Year Revenue Impact
17-18 ($129,500)
18-19 ($129,500)
19-20 ($129,500)
20-21 ($129,500)
21-22 ($129,500)
Section 32 Recording of Marks and Brands
Based on a 3-year average of fee revenues, the Department estimates that eliminating the brand registration renewal fee will result in the following revenue impact:
Fiscal Year Revenue Impact
17-18 ($7,646)
18-19 ($7,646)
19-20 ($7,646)
20-21 ($7,646)
21-22 ($7,646)
659
REVENUE ESTIMATING CONFERENCE Tax: Various Fees Issue: Department of Agriculture and Consumer Services Bill Number(s): CS/CS/HB 467
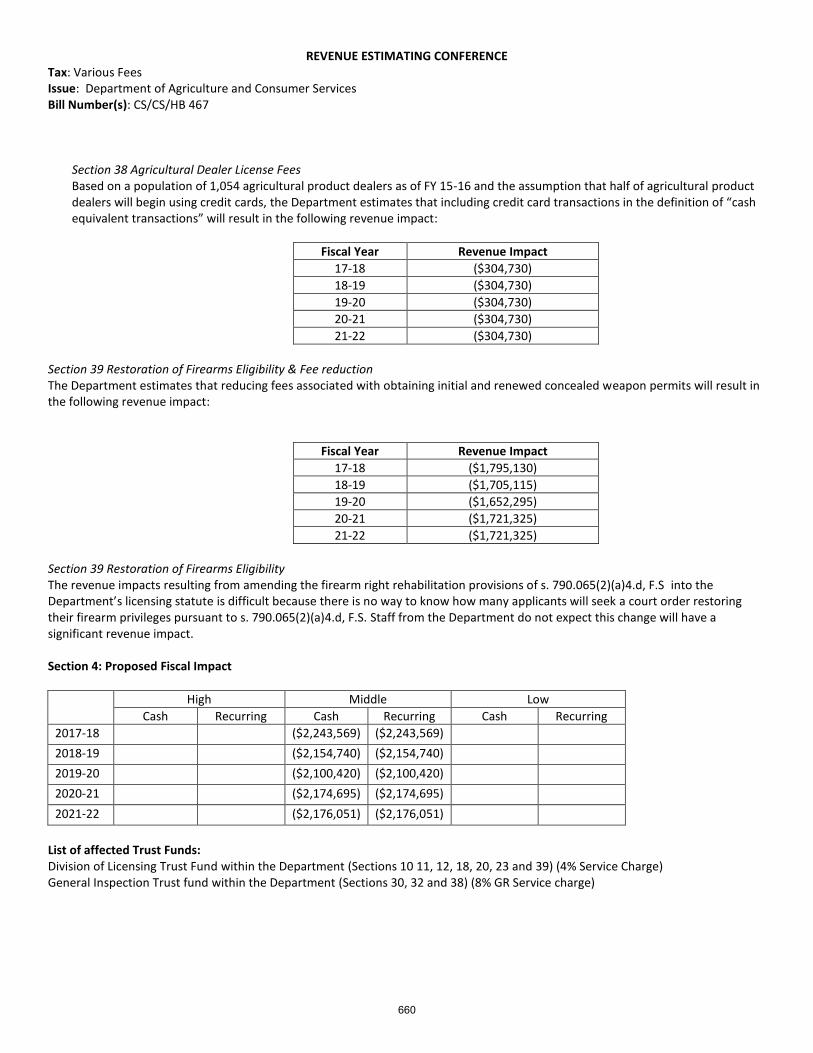
Section 38 Agricultural Dealer License Fees Based on a population of 1,054 agricultural product dealers as of FY 15-16 and the assumption that half of agricultural product dealers will begin using credit cards, the Department estimates that including credit card transactions in the definition of “cash equivalent transactions” will result in the following revenue impact:
Fiscal Year Revenue Impact
17-18 ($304,730)
18-19 ($304,730)
19-20 ($304,730)
20-21 ($304,730)
21-22 ($304,730)
Section 39 Restoration of Firearms Eligibility & Fee reduction The Department estimates that reducing fees associated with obtaining initial and renewed concealed weapon permits will result in the following revenue impact:
Fiscal Year Revenue Impact
17-18 ($1,795,130)
18-19 ($1,705,115)
19-20 ($1,652,295)
20-21 ($1,721,325)
21-22 ($1,721,325)
Section 39 Restoration of Firearms Eligibility The revenue impacts resulting from amending the firearm right rehabilitation provisions of s. 790.065(2)(a)4.d, F.S into the Department’s licensing statute is difficult because there is no way to know how many applicants will seek a court order restoring their firearm privileges pursuant to s. 790.065(2)(a)4.d, F.S. Staff from the Department do not expect this change will have a significant revenue impact.
Section 4: Proposed Fiscal Impact
High Middle Low
Cash Recurring Cash Recurring Cash Recurring
2017-18 ($2,243,569) ($2,243,569)
2018-19 ($2,154,740) ($2,154,740)
2019-20 ($2,100,420) ($2,100,420)
2020-21 ($2,174,695) ($2,174,695) 2021-22 ($2,176,051) ($2,176,051)
List of affected Trust Funds: Division of Licensing Trust Fund within the Department (Sections 10 11, 12, 18, 20, 23 and 39) (4% Service Charge) General Inspection Trust fund within the Department (Sections 30, 32 and 38) (8% GR Service charge)
660
REVENUE ESTIMATING CONFERENCE Tax: Various Fees Issue: Department of Agriculture and Consumer Services Bill Number(s): CS/CS/HB 467
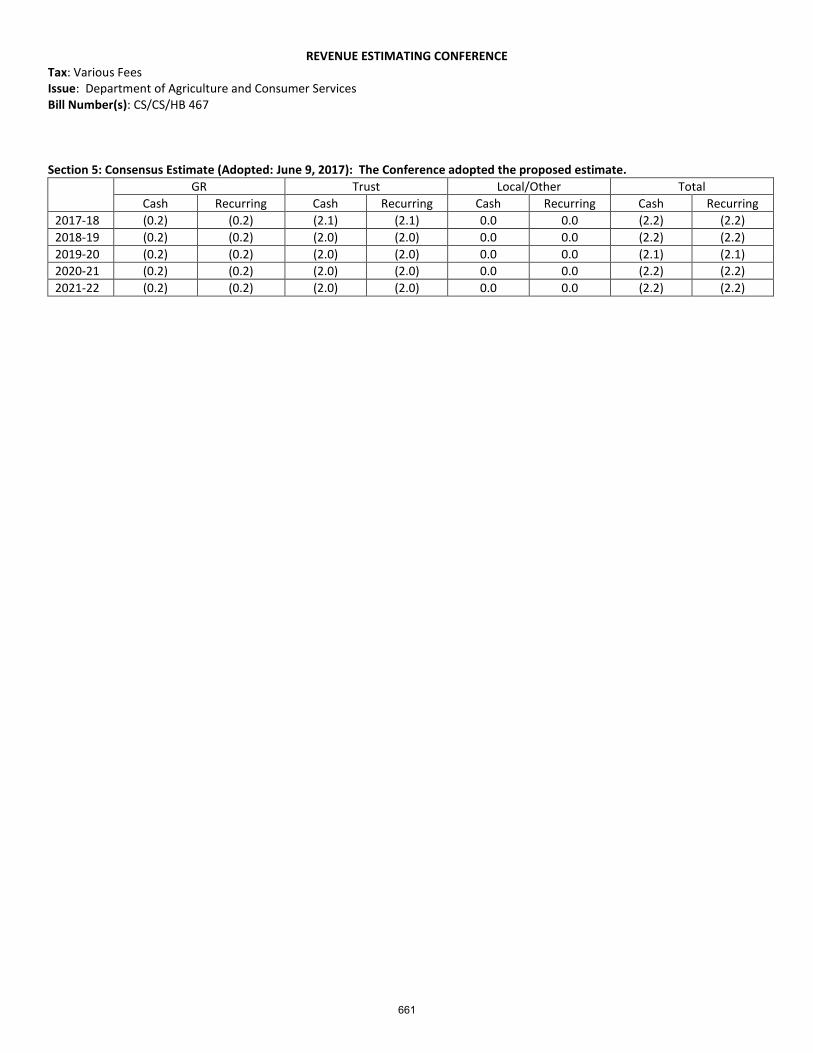
Section 5: Consensus Estimate (Adopted: June 9, 2017): The Conference adopted the proposed estimate.
GR Trust Local/Other Total
Cash Recurring Cash Recurring Cash Recurring Cash Recurring
2017-18 (0.2) (0.2) (2.1) (2.1) 0.0 0.0 (2.2) (2.2)
2018-19 (0.2) (0.2) (2.0) (2.0) 0.0 0.0 (2.2) (2.2)
2019-20 (0.2) (0.2) (2.0) (2.0) 0.0 0.0 (2.1) (2.1)
2020-21 (0.2) (0.2) (2.0) (2.0) 0.0 0.0 (2.2) (2.2)
2021-22 (0.2) (0.2) (2.0) (2.0) 0.0 0.0 (2.2) (2.2)
661

REVENUE ESTIMATING CONFERENCE Tax: Other Taxes and Fees Issue: Certificates of Nonviable Birth Bill Number(s): CS/CS/SB101 Entire Bill Partial Bill: Sponsor(s): Cortes, B. Month/Year Impact Begins: July 1, 2017 Date of Analysis: May 1, 2017 Section 1: Narrative a. Current Law: The Department of Health does not collect information on fetal demise occurring before a gestation period of 20
completed weeks that do not result in a live birth. The department files fetal deaths for pregnancies at 20 or more weeks of gestation in accordance with National Center for Health Statistics standards. DOH must issue a certificate of birth resulting in stillbirth upon the request of any parent listed on a fetal death certificate.
b. Proposed Change: Allows the parents of a pregnancy that results in a fetal demise to request and be issued a certificate of
“nonviable birth.” The bill defines “nonviable birth” as an unintentional, spontaneous fetal demise occurring after the 9th week of gestation but before the completion of the 20th week of gestation of a pregnancy that has been verified by a health care practitioner. The bill authorizes DOH to collect fees of at least $3 but no more than $5 for the processing and filing of a certificate of nonviable birth.
Section 2: Description of Data and Sources
FL Bureau of Vital Statistics – annual recorded live births, fetal deaths (>20 weeks), and number of certificates of stillbirth requested
U.S. Dep’t of Health and Human Services, Office of Women’s Health, Pregnancy: Pregnancy Loss, (last rev. Sept. 27, 2010), available at https://www.womenshealth.gov/pregnancy/you-are-pregnant/pregnancy-loss.html (last visited May 1, 2017) – miscarriage rates and statistics
American Pregnancy Association, Miscarriage, (updated August 2016), available at http://americanpregnancy.org/pregnancy-complications/miscarriage/ (last visited May 1, 2017) – miscarriage rates and statistics
Section 3: Methodology (Include Assumptions and Attach Details) Using 3-year average (2013-2015) total recorded live births and fetal deaths from FL Bureau of Vital Statistics, the average number of nonviable births per year is estimated assuming that 17.5% of all pregnancies end in miscarriage and 40% of those miscarriages occur after the 9th week of gestation but before the completion of the 20th week of gestation. That figure is then used to estimate the number of nonviable birth certificate requests per year by applying 2.55% - the 10 year average number of stillbirth certificates requested divided by the ten year average number of fetal deaths. It is assumed that the percentage of nonviable birth certificates requested will be similar to the percentage of stillbirth certificates requested. It is assumed that DOH will collect a $5 processing and filing fee for each nonviable birth certificate.
Three-year average total live births and
fetal deaths Estimated
nonviable births
Estimated nonviable birth
certificate requests
Estimated revenue assuming $5 fee
221,660 18,807 479 $2,395
Section 4: Proposed Fiscal Impact
High Middle Low
Cash Recurring Cash Recurring Cash Recurring
2017-18 * *
2018-19 * *
2019-20 * *
2020-21 * *
2021-22 * *
x
662
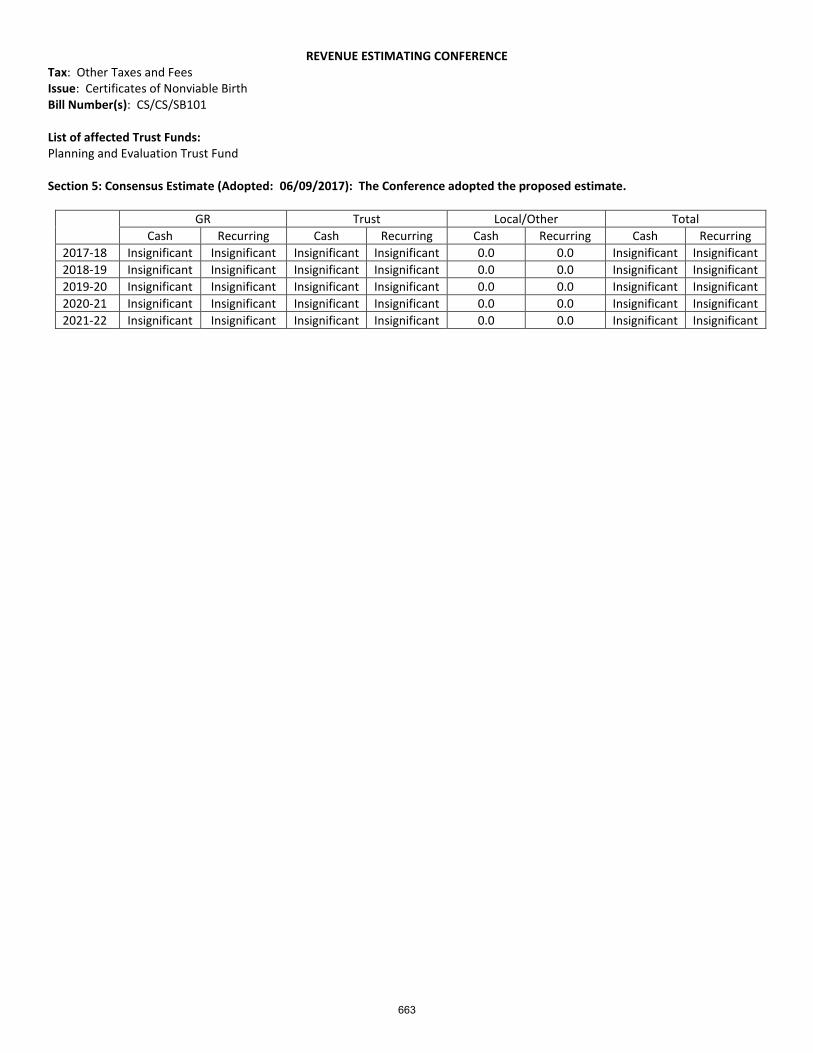
REVENUE ESTIMATING CONFERENCE Tax: Other Taxes and Fees Issue: Certificates of Nonviable Birth Bill Number(s): CS/CS/SB101 List of affected Trust Funds: Planning and Evaluation Trust Fund Section 5: Consensus Estimate (Adopted: 06/09/2017): The Conference adopted the proposed estimate.
GR Trust Local/Other Total
Cash Recurring Cash Recurring Cash Recurring Cash Recurring
2017-18 Insignificant Insignificant Insignificant Insignificant 0.0 0.0 Insignificant Insignificant
2018-19 Insignificant Insignificant Insignificant Insignificant 0.0 0.0 Insignificant Insignificant
2019-20 Insignificant Insignificant Insignificant Insignificant 0.0 0.0 Insignificant Insignificant
2020-21 Insignificant Insignificant Insignificant Insignificant 0.0 0.0 Insignificant Insignificant
2021-22 Insignificant Insignificant Insignificant Insignificant 0.0 0.0 Insignificant Insignificant
663