review article a comprehensive review on measurement and
TRANSCRIPT

Review ArticleA Comprehensive Review on Measurement and CorrelationDevelopment of Capillary Pressure for Two-Phase Modeling ofProton Exchange Membrane Fuel Cells
Chao Si,1,2 Xiao-Dong Wang,1,2 Wei-Mon Yan,3 and Tian-Hu Wang4
1State Key Laboratory of Alternate Electrical Power System with Renewable Energy Sources, North China Electric Power University,Beijing 102206, China2Beijing Key Laboratory of Multiphase Flow and Heat Transfer for Low Grade Energy, North China Electric Power University,Beijing 102206, China3Department of Energy and Refrigerating Air-Conditioning Engineering, National Taipei University of Technology,Taipei 10608, Taiwan4Mathematics and Physics Department, North China Electric Power University, Beijing 102206, China
Correspondence should be addressed to Xiao-Dong Wang; [email protected] and Wei-Mon Yan; [email protected]
Received 21 October 2014; Revised 23 March 2015; Accepted 24 March 2015
Academic Editor: Tingyue Gu
Copyright © 2015 Chao Si et al. This is an open access article distributed under the Creative Commons Attribution License, whichpermits unrestricted use, distribution, and reproduction in any medium, provided the original work is properly cited.
Water transport and the correspondingwatermanagement strategy in proton exchangemembrane (PEM) fuel cells are quite criticalfor the improvement of the cell performance. Accuracy modeling of water transport in porous electrodes strongly depends on theappropriate constitutive relationship for capillary pressure which is referred to as 𝑝
𝑐-𝑠 correlation, where 𝑝
𝑐is the capillary pressure
and 𝑠 is the fraction of saturation in the pores. In the present PEM fuel cell two-phase models, the Leverett-Udell 𝑝𝑐-𝑠 correlation
is widely utilized which is proposed based on fitting the experimental data for packed sands. However, the size and structure ofpores for the commercial porous electrodes used in PEM fuel cells differ from those for the packed sands significantly. As a result,the Leverett-Udell correlation should be improper to characterize the two-phase transport in the porous electrodes. In the recentdecade, many efforts were devoted to measuring the capillary pressure data and developing new 𝑝
𝑐-𝑠 correlations. The objective
of this review is to review the most significant developments in recent years concerning the capillary pressure measurements andthe developed 𝑝
𝑐-𝑠 correlations. It is expected that this review will be beneficial to develop the improved PEM fuel cell two-phase
model.
1. Introduction
Proton exchange membrane (PEM) fuel cells are one kind ofthe most promising power generators which can offer cleanpower source for mobile and stationary applications due totheir high efficiency, low start-up temperature, portability,and near-zero emissions [1–4].The performance of PEM fuelcells is strongly related to the material properties, structuredesign, and operating conditions. By optimizing the structuredesign and operating conditions, the reactant transport to theporous electrodes can be significantly enhanced due to theimproved water distribution in the cell.
Watermanagement is essential to improve the cell perfor-mance [5–11]. The polymer exchange membranes currentlyused in PEM fuel cells require well hydration to maintainlarge proton conductivity. Lower membrane water contentreduces the cell performance due to the increase of ohmicresistance in the membrane. To avoid membrane dehydra-tion, the reactants usually need to be humidified.On the otherhand, the cathode catalyst layer produces water vapor dueto electrochemical reactions. The vapor will condense intoliquid water when the local partial pressure is higher thanthe saturation pressure, so that the produced liquidwatermayaccumulate in the pores of the porous electrodes. Moreover,
Hindawi Publishing CorporationJournal of ChemistryVolume 2015, Article ID 876821, 17 pageshttp://dx.doi.org/10.1155/2015/876821

2 Journal of Chemistry
the electroosmosis effect also leads to water transport fromthe anode to the cathode. Thus, if liquid water cannot beremoved effectively from the cathode porous electrode, itspores will be blocked, which will significantly increase themass transfer resistance of the reactants and lead to seriousconcentration polarization.
In the recent two decades, numerical modeling andsimulations have already become powerful tools to predictthe cell performance and optimize the cell structure andoperation conditions [1, 5–7]. Numerical simulations canprovide the local transport characteristics and distributionsof reactants and water anywhere in the fuel cell; however, thisinformation is very difficult to be observed and measuredby experiments. Accurate description of liquid water trans-port and contribution in the porous electrodes is especiallyimportant to improve the accuracy of PEM fuel cell models.Two kinds of PEM fuel cell two-phase models have beendeveloped. One is referred to as the multiphase mixturemodel and the other is the two-fluid model [1]. The twokinds of models both adopt the so-called volume-averagemethod to treat the porous electrode, so that the real porestructure is not considered. Due to the limitation of thevolume-average approach, how to describe the complex two-phase interactions in the pores of the porous electrodes isgreatly challenging. Since the capillary force and the viscousdrag are the main forces governing the liquid water transportin the porous electrodes, Wang et al. [12, 13] for the firsttime introduced a concept of capillary pressure to connectthe pressures of reactants and liquid water in the porouselectrodes and treated the capillary pressure as a function ofthe liquid water saturation. The introduction of the correla-tion of capillary pressure versus liquid water saturation (𝑝
𝑐-𝑠
correlation) greatly simplifies the complexity of two-phasemodeling in the porous electrodes and this concept has beenextensively adopted by other research groups [6, 7, 14–30]. Upto now, the two kinds of PEM fuel cell two-phase models alluse the 𝑝
𝑐-𝑠 correlation and Wang’s idea is considered to be
the most feasible approach to model the full-scale PEM fuelcell.
Unfortunately, since accurate experimentally determined𝑝𝑐-𝑠 correlation for the gas diffusion layer (GDL) was lacking,
Wang et al. [12, 13] used a Leverett-Udell 𝑝𝑐-𝑠 correlation,
proposed by Leverett [31] and Udell [32] based on theexperimental data of packed sands, in their model. The poresize, structure, and wettability of packed sands are greatlydifferent from those of real carbon cloth or carbon paperGDLs; thus, this correlation may be improper to describe theliquid water transport in GDLs of PEM fuel cells [33–35].
In the last decade, many researchers measured the 𝑝𝑐-𝑠
data for various commercially used GDLs [36–60]. Somestudies are also devoted to modifying the Leverett-Udellcorrelation [33, 37–39] or developing a new 𝑝
𝑐-𝑠 correlation
[34, 35]. Up to now, a large number of papers on the 𝑝𝑐-𝑠 data
have been published in open literature and the development isreaching a plateau. A comprehensive review on it is urgentlynecessary to generate knowledge in this field and makefurther breakthrough for the fuel cell two-phase modeling.
The aim of this work is to summarize current statusand recent advance of capillary pressure measurement and
modeling for PEM fuel cells. The review is organized as fol-lows. Section 2 briefly describes the definition of the capillarypressure and the reasons for introduction of 𝑝
𝑐-𝑠 correlation
in the PEM fuel cell two-phase modeling. The Leverett-Udellcorrelation has been extensively used in the PEM fuel two-phase models, and hence its disadvantages are also presentedin Section 2. Section 3 reviews the measurement methodsof the capillary pressure. Section 4 reviews the experimentaland simulated data of the capillary pressure for a varietyof commercial GDLs. Section 4 also reviews the new 𝑝
𝑐-𝑠
correlations based on fitting themeasured experimental data.Section 5 reviews the comparative studies of Leverett-Udellcorrelation and new 𝑝
𝑐-𝑠 correlation for predicting water
transport and distribution in the fuel cell. Finally, the furtherdevelopment directions for the 𝑝
𝑐-𝑠 correlation and PEM fuel
cell two-phase modeling are presented in Section 6.
2. Leverett-Udell Correlation forCapillary Pressure
For a real porous medium, it is very difficult to modelthe flow and heat transfer in an individual pore since thepore scale is far less than the scale of the porous medium.Moreover, the pore structure is generally irregular.Therefore,a volume-average method is adopted, which is based on theassumption that there coexist solid matrix and pores foreach space point in the porous medium, so that the volume-averaged parameters such as porosity and permeability can beintroduced to characterize the pore structure and porous flowfeature. In the current PEM fuel cell two-phase modeling,the volume-average method is also widely adopted to modelthe porous electrodes [1]. In fact, however, the transport ofgaseous reactants and liquid water occurs inside the poresin the real porous electrodes and there exist many interfacesbetween the two phases. Thus, the mass, momentum, andenergy may exchange through the interface, and hence theseexchanges in the porous electrodes should be taken intoaccount to construct a reasonable two-phase model.
Unfortunately, in the volume-average method, the con-cepts, such as porosity, 𝜀, and permeability, 𝑘
𝑝, are introduced
to characterize the porous structure. The solid matrix andpores coexist everywhere in the porous media, and thevolume fractions for themare 1−𝜀 and 𝜀, respectively. Besides,in the modeling based on the volume-average method, thesaturation, 𝑠, is also introduced to characterize the volumefractions of gaseous phase and liquid phase for each spacepoint, with the fraction of 𝜀𝑠 for the liquid phase and of 𝜀(1−𝑠)for the gaseous phase. From this point of view, the interfacesbetween the two phases are neglected.
The above neglect leads to an issue that the exchanges formass, momentum, and energy through the two-phase inter-faces cannot be described. One alternative way to addressthe issue is to add source terms into the liquid and gasgoverning equations. For the two-phase modeling in PEMfuel cells, the generation mechanisms for mass source termsin the continuity equation andheat source terms in the energyequation are clear. However, momentum source terms in themomentum equation are very complex; they are not onlydetermined by the phase fractions of the two phases but

Journal of Chemistry 3
also influenced by the phase distributions of the two phases.For example, when the liquid phase exists in the form ofliquid films or discrete drops, the interactions between thetwo phases are entirely different. It is difficult to accuratelymeasure the phase distribution of the liquid phase in realporous electrodes. Consequently, an accurate description offorce source terms in the momentum equation is almostimpossible.
Due to the difficulty for accurately modeling the forcesource terms, Wang et al. [12, 13] introduced a conceptof capillary pressure which correlated the local pressuredifference between the liquid and gaseous phases in theporous electrodes to the local liquid water saturation. Thecapillary pressure is defined as [12, 13]
𝑝𝑐= 𝑝𝑔− 𝑝𝑙, (1)
where 𝑝𝑐is the capillary pressure, 𝑝
𝑔is the pressure of the
gaseous phase, and 𝑝𝑙is the pressure of the liquid phase.
Because there were not any experimental data of the capillarypressure versus saturation for porous GDLs, Wang et al.[12, 13] introduced a𝑝
𝑐-𝑠 correlation for packed sands into the
modeling of the fuel cell. This correlation can be expressed as[31]
𝑝𝑐= 𝜎 cos 𝜃( 𝜀
𝑘𝑝
)
1/2
𝐽 (𝑠) , (2)
where 𝜎 is the water surface tension and 𝜃 is the contact angleof water on the pore walls. Equation (2) is also referred to asthe Leverett correlation, and 𝐽(𝑠) is the Leverett 𝐽-function. Itis noted that, by introducing a scaling factor 𝜎 cos 𝜃(𝜀/𝑘
𝑝)0.5
into the Leverett correlation, the experimental data of 𝑝𝑐-𝑠
measured in different porous media and with different fluidpairs gather together into a single curve 𝐽(𝑠) [54]. Basedon Leverett’s experimental data, Udell adopted a polynomialfitting to obtain the Leverett 𝐽-function [32]:
𝐽 (𝑠) = 1.417 (1 − 𝑠) − 2.120 (1 − 𝑠)2
+ 1.262 (1 − 𝑠)3
,
𝜃 < 90∘
.
(3a)
For case with 𝜃 > 90∘, Pasaogullari and Wang [61] proposed
a modified 𝐽 function expressed as follows:
𝐽 (𝑠) = 1.417𝑠 − 2.120𝑠2
+ 1.262𝑠3
, 𝜃 > 90∘
. (3b)
Equation (2) with 𝐽 functions expressed by (3a) or (3b) iscalled the Leverett-Udell correlation in the PEM fuel cellmodeling.
Until now, almost all PEM fuel cell two-phase modelsadopted the Leverett-Udell correlation to characterize theliquid water transport in the porous electrodes. However, thiscorrelation has some obvious drawbacks. The contact angle,𝜃, in (2) should exactly reflect the local wettability of wateron the pore walls in the GDL material. However, the contactangle in the pores is very difficult to measure, so that someearly studies specified 𝜃 = 0
∘ [8, 9, 13–19] in the Leverett-Udell correlation. To improve the removal of liquid water,commercial carbon paper or carbon cloth GDL is generally
loaded with hydrophobic materials such as PTFE (polyte-trafluoroethylene) and FEP (fluorinated ethylene propylene)[62]. Based on the hydrophobic characteristics of GDL,subsequent studies adopted the contact angles greater than90∘, such as 𝜃 = 92∘ [22], 110∘ [20], 120∘ [24, 63], 91–120∘ [23],or 91–130∘ [25].
It is noted that the contact angles adopted in abovestudies are all hypothetical due to lack of experimental data.Therefore, many efforts were carried out to determine thecontact angle of water on GDL surface by sessile drop orcapillary rise methods [64, 65]. For example, Mathias et al.[65] measured the contact angles of Toray-TGP-060 carbonpaper by the sessile drop method. They found that thevalues were 135∘, 156∘, and 164∘ for carbon papers with 0,9, and 23wt% PTFE, respectively. Unfortunately, the contactangles measured by these methods are the external contactangles, which are not the contact angles of water on the porewalls in the porous material. Gurau et al. [26] for the firsttime evaluated the internal contact angles by the Washburntechnique and theOwens-Wendt two-parameter theory.Theypresented that the internal contact angle ranged from 88 to101∘ for water in various GDLs, which was slightly lower thanthat on a smooth surface of pure PTFE (108∘) andmuch lowerthan the external contact angle measured on the GDL surfaceby the sessile drop method.
It is worth noting that hydrophobic pores and hydrophilicpores coexist in the GDLs due to the heterogeneous distribu-tion of the loaded hydrophobic materials, and hence the porewalls of GDLs have a mixed wettability. Consequently, usinga single contact angle in the Leverett-Udell correlation maybe improper. In addition, when liquid plugs and/or liquidfilms transport in the GDL pores, a dynamic contact angleshould be adopted to characterize the wettability of the porewalls [66–68].This phenomenon adds further complexity forwettability of GDL pores. More importantly, the pore size,pore structure, and wettability of packed sands are found tobe greatly different from those of real carbon paper or carboncloth GDLs, as shown in Figure 1 [37, 69].The Leverett-Udellcorrelation may be intrinsically inappropriate for the GDLseven though the internal contact angle could be determinedaccurately. Severalmeasurements of the liquidwater distribu-tions in GDLs using neutron radiography techniques [70, 71]and pressure drop methods [72] have shown that the PEMfuel cell two-phase model incorporated with the Leverett-Udell correlation underestimates the liquid water saturation.
Since the Leverett-Udell correlation does not correctlycapture the properties of porous electrodes in PEM fuel cells,it is urgent to develop amore comprehensive𝑝
𝑐-𝑠 correlation.
The data of capillary pressure versus saturation for variouscommonly used GDLs are the fundament for developing thenew correlation, which have motivated many experimentaland numerical investigations devoted to obtaining such datain the last decade.
3. Measurement Methods forCapillary Pressure
In the recent decade, researchers have developed severalkinds of measurementmethods for capillary pressure in GDL

4 Journal of Chemistry
Carbon fiber
(a)
Pore space
(b) (c)
Figure 1: SEM images of (a) carbon paper; (b) carbon cloth; and (c) packed sands. Source: Figures 1(a) and 1(b) in [37] and Figure 1(c) in[69].
Vacuum P0 = 0
h0
P1
h1
PN→∞
hN
Figure 2: Schematic of mercury intrusion porosimetry. Source: [85].
materials. Mercury intrusion porosimetry (MIP), volume-controlled method (VCM), method of standard porosimetry(MSP), and gas controlled porosimetry (GCP) are the mostcommon methods. These four methods are reviewed in thissection, while the other methods such as X-ray CT methodand gravimetrical saturation measurement can be found in[36, 45, 47, 55, 73, 74].
3.1. Mercury Intrusion Porosimetry. As a development oftraditional capillary pressure measurement method raised byMorrow et al. [75, 76], mercury intrusion porosimetry (MIP)was firstly used to study the morphology of the microporouslayer (MPL) [77–80] and the influence of adding PTFEon the MPL [81]. Later the method was introduced toinvestigate the capillary property of GDL materials usedin PEM fuel cell devices [82–84]. The assumption that thecontact angle distribution was expressed by a normalizedGaussian distribution was raised; thus contact angles of thepores could be computed through MIP data, by taking themeasured effective pore radius into consideration [48]. Alsothe effects of capillary property of GDL material on PEMfuel cell performance were qualitatively explained in theseinvestigations.
In the MIP method as shown in Figure 2, the testedporous sample is placed in a glass sample tube. The sampletube is pumped into vacuum as the preparation of themeasurement. Then the mercury is injected into the vac-uum sample tube, with the controlled surrounding pressureincreasing from 0MPa to an enough large value in severalsteps. The pressure value and the corresponding injectedvolume of mercury from each step are recorded and thus thecapillary pressure curve can be obtained. Reference [85] haswell introduced the detailed operation steps and the principleof MIP methods.
As an evaluation, the advantages of MIP are the lowvolatility and high surface tension of mercury, which lead tothe negligible gaseous pressure, simplified sample equipment,and large measurement range of pressure [85]. Furthermore,it is worth noting that mercury is highly nonwetting inalmost every GDL pore, so that MIP test cannot distinguishthe hydrophobic pore and the hydrophilic pore. In the caseof porous GDL materials for PEM fuel cells, MIP cannotdirectly provide a 𝑝
𝑐-𝑠 correlation corresponding to liquid
water, unless several empirical assumptions are taken intoconsideration.

Journal of Chemistry 5
Hydrophobicmembrane
Sample chamber
GDL sample
Hydrophilicmembrane
Water can becompletely drainedfrom sample butcannot leavesample chamber
Sample can becompletely filledwith water, butwater cannot leavesample chamber
Sample volume isisolated
Figure 3: Schematic of volume-controlled method. Source: [85].
3.2. Volume-Controlled Method. Due to the disadvantages ofMIP, a series of volume-controlled methods (VCM) wereraised byGostick [85].They can be regarded asmodifiedMIPmethods which use water as the injecting liquid. However,the use of liquid water presents several new problems formeasurements. The biggest one is that, unlike mercury withits low volatility, liquid water will cavitate in the tested sample[85]. As a response of the difficulty, the sample holder isdesigned to allow air to escape when liquid water is injected,but water cannot escape from the sample holder. In themost common design, tested sample is loaded in a sealedsample holder with two sandwiched porous membranes withopposite wettability, as shown in Figure 3. The hydrophobicmembrane is a barrier to the escape of liquid water from theair gallery, while the hydrophilic membrane on the other sideprevents air from escaping out of the sample holder whenliquid water is injected [85]. Acosta et al. [41] obtained air-water 𝑝
𝑐-𝑠 curve by the data tested in this designed sample
holder.As a further improvement, Fairweather et al. [42] raised
volume-controlled method using the concept above. Theyemployed a syringe to pump quantitative volumes of liquidinto the sample holder and measured the pressure by trans-ducers equipped on the piping. Briefly, in their measure-ments, after the liquidmanifold and sample holder were filledunder vacuum, the syringe pump was used to cycle water at aconstant rate into and out of the sample when the liquid-gaspressure difference was measured. The method allows a time(120 s in theirmeasurements) for capillary equilibrium beforegoing to the next data point. Also, the processes of increasingand decreasing water saturation can be both realized, sothat the curve can cover both positive and negative capillarypressure region. Sole [86] presented a similar measurementmethod, where the hydrophilic membrane below the sampleholder was omitted and a constant rate was adopted for the
Standard sample 2
GDL
Standard sample 1
Wetting phase
between layers tomaintain capillaryequilibrium
Nonwetting phase
Wetting phaseis redistributed
Figure 4: Schematic of method of standard porosimetry. Source:[85].
liquid water injection into the sample holder. Due to the lackof hydrophilic membrane, Sole [86] did not measure the 𝑝
𝑐-𝑠
correlation for water withdrawn from the sample.In the volume-controlled method, the volume of the
injected liquid is controlled to determine the saturation,which often introduces errors due to the difficulty of control-ling the liquid volume. Nguyen et al. [44, 59] introduced animprovedmethodwhich controlled liquid pressure instead ofliquid volume.Thus the capillary pressure can bemeasured bycommunicating pipes connected with the sample holder.
3.3. Method of Standard Porosimetry. Method of standardporosimetry (MSP) [40] is a measurement technique devel-oped from experimental investigations of cermet in solidoxide fuel cells [87] and Nafion membranes [88]. Theschematic of the method is shown in Figure 4. The methoduses the capillary equilibrium between two porous materialskeeping in touch, so they have the same capillary pressure.In the design of Gostick et al. [40], two standard sampleswith a specific capillary pressure curve were needed. Betweenthem one tested sample was loaded. The three sandwichedsamples (the two standard samples and the one tested) wereprepared by flooding them with the wetting fluid (oftenoctane) and ensured that no air was in the pores of thesamples. Then the combination of the samples was exposedto air, so that the wetting fluid would evaporate and lead to achanged saturation.The capillary pressure could bemeasuredby periodically weighing the tested sample and standardsamples.
It is worth noting that the process of MSP is also areplacement of a nonwetting phase into a material filled withwetting phase, so it can use both octane and water as workingfluids, which can obtain partially useful 𝑝
𝑐-𝑠 curve for GDLs.
The liquid water transport properties of hydrophilic poresespecially can be obtained. But the MSP technique is also oflimitationwhen used to test GDLmaterials.Thismethod onlyscans along the direction of increasing air saturation and onlyfor positive capillary pressure region.
6 Journal of Chemistry
Gas port
Sample
Liquid port
Waterdrainage
Waterreservoir
Analytical balance
3-wayvalve
Sample holder
Syringe pump
PG
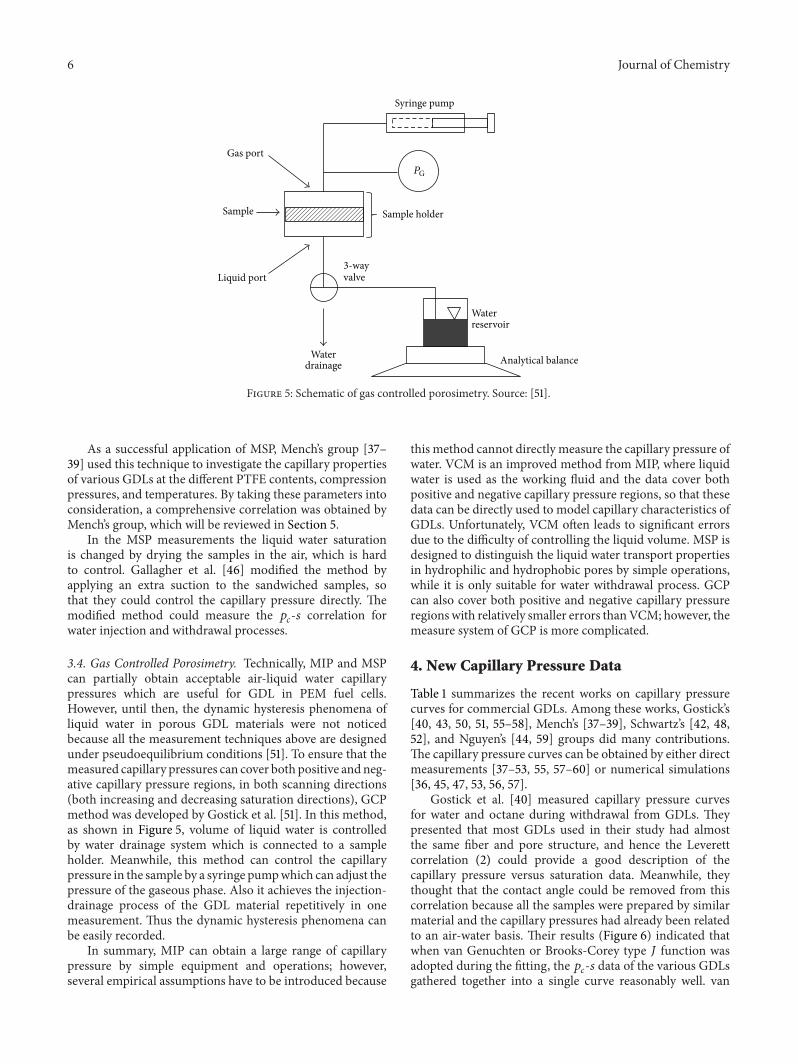
Figure 5: Schematic of gas controlled porosimetry. Source: [51].
As a successful application of MSP, Mench’s group [37–39] used this technique to investigate the capillary propertiesof various GDLs at the different PTFE contents, compressionpressures, and temperatures. By taking these parameters intoconsideration, a comprehensive correlation was obtained byMench’s group, which will be reviewed in Section 5.
In the MSP measurements the liquid water saturationis changed by drying the samples in the air, which is hardto control. Gallagher et al. [46] modified the method byapplying an extra suction to the sandwiched samples, sothat they could control the capillary pressure directly. Themodified method could measure the 𝑝
𝑐-𝑠 correlation for
water injection and withdrawal processes.
3.4. Gas Controlled Porosimetry. Technically, MIP and MSPcan partially obtain acceptable air-liquid water capillarypressures which are useful for GDL in PEM fuel cells.However, until then, the dynamic hysteresis phenomena ofliquid water in porous GDL materials were not noticedbecause all the measurement techniques above are designedunder pseudoequilibrium conditions [51]. To ensure that themeasured capillary pressures can cover both positive andneg-ative capillary pressure regions, in both scanning directions(both increasing and decreasing saturation directions), GCPmethod was developed by Gostick et al. [51]. In this method,as shown in Figure 5, volume of liquid water is controlledby water drainage system which is connected to a sampleholder. Meanwhile, this method can control the capillarypressure in the sample by a syringe pumpwhich can adjust thepressure of the gaseous phase. Also it achieves the injection-drainage process of the GDL material repetitively in onemeasurement. Thus the dynamic hysteresis phenomena canbe easily recorded.
In summary, MIP can obtain a large range of capillarypressure by simple equipment and operations; however,several empirical assumptions have to be introduced because
this method cannot directly measure the capillary pressure ofwater. VCM is an improved method from MIP, where liquidwater is used as the working fluid and the data cover bothpositive and negative capillary pressure regions, so that thesedata can be directly used to model capillary characteristics ofGDLs. Unfortunately, VCM often leads to significant errorsdue to the difficulty of controlling the liquid volume. MSP isdesigned to distinguish the liquid water transport propertiesin hydrophilic and hydrophobic pores by simple operations,while it is only suitable for water withdrawal process. GCPcan also cover both positive and negative capillary pressureregions with relatively smaller errors thanVCM; however, themeasure system of GCP is more complicated.
4. New Capillary Pressure Data
Table 1 summarizes the recent works on capillary pressurecurves for commercial GDLs. Among these works, Gostick’s[40, 43, 50, 51, 55–58], Mench’s [37–39], Schwartz’s [42, 48,52], and Nguyen’s [44, 59] groups did many contributions.The capillary pressure curves can be obtained by either directmeasurements [37–53, 55, 57–60] or numerical simulations[36, 45, 47, 53, 56, 57].
Gostick et al. [40] measured capillary pressure curvesfor water and octane during withdrawal from GDLs. Theypresented that most GDLs used in their study had almostthe same fiber and pore structure, and hence the Leverettcorrelation (2) could provide a good description of thecapillary pressure versus saturation data. Meanwhile, theythought that the contact angle could be removed from thiscorrelation because all the samples were prepared by similarmaterial and the capillary pressures had already been relatedto an air-water basis. Their results (Figure 6) indicated thatwhen van Genuchten or Brooks-Corey type 𝐽 function wasadopted during the fitting, the 𝑝
𝑐-𝑠 data of the various GDLs
gathered together into a single curve reasonably well. van

Journal of Chemistry 7
Table 1: Measurements and simulations of capillary pressure curves for various commercial GDL.
Authors Technique GDL series Working fluid Pressure range (MPa)Gosticket al. [40] MSP, MIP SGL 10BA/10BB, Toray 090, E-Tek Cloth A,
Lyflex 484C/352C Octane 10−5 ∼10
Gosticket al. [43]
Single measurementof a GCP sample SGL 10BA, Toray 090 Water −0.025∼0.035
Gosticket al. [51] GCP SGL 10AA/10BA/10CA/10DA, Toray
060A/060C/090A/090C/090D/120A/120D Water −0.02∼0.02
Gosticket al. [50]
Single measurementof a GCP sample SGL 10BA/10BB Water −0.001∼0.02
Gosticket al. [55] X-ray CT Toray 120A/120C/120D Water −0.015∼0.015
Gostick [57]Single measurementof a GCP sample, porenetwork model
Toray 120A/120C/060A/060C/060D, SGL10BA/10BB Water 0∼0.015
Gostick et al.[56] Pore network model Toray 060 Mercury 0∼0.3
Shrestha andGostick [58]
A modified GCP witha temperaturecontroller
Toray 120 with 0 and 10% PTFE Water −0.025∼0.025
Kumburet al. [37] MSP SGL 24BC/24CC/24DC, E-Tekelat 1200W Octane and water 0.01∼10
Kumburet al. [38] MSP SGL 24BC/24DC/10BB Octane and water 0.01∼10
Kumburet al. [39] MSP SGL 24BC/24CC/24DC/10BB Octane and water 0.01∼10
Kumburet al. [36]
Artificial neuralnetwork SGL 24BC/24CC/24DC None 0.01∼10
Fairweatheret al. [42]
Volume-controlledmethod
Toray TGP-090, unsintered Avcarb P75T,heat-treated Avcarb P75T Mercury −0.02∼0.02
Cheunget al. [48]
Volume-controlledmethod Toray 090 Mercury −0.02∼0.02
Fairweatheret al. [52]
Volume-controlledmethod Toray 090 with 5%/10%/20%/40% Teflon Mercury −0.013∼0.015
Nguyenet al. [59] Modified MSP SGL 10AA/10BA Water −0.0005∼0.0003
Nguyenet al. [44] Modified MSP SGL 10CA, Toray 060 Water −0.0002∼0.0005
Acostaet al. [41] Unknown E-TekELAT-DS Unknown −2∼0
Koidoet al. [45]
X-ray CT, porenetwork model Toray 060 Water −0.01∼0
Rensinket al. [47]
Gravimetricalsaturationmeasurement, VOF
Toray 060 Water 0∼0.05
Sole and Ellis[60]
Volume-controlledmethod Toray 090 with 0%/10%/20%/30% PTFE Water 0∼0.02
Gallagheret al. [46] Modified MSP MRC, Toray 060 Water 0∼0.025
Harknesset al. [49]
Volume-controlledmethod Toray 060 Water −0.028∼0.049
Hao andCheng [53]
Volume-controlledmethod, LBM Toray 090 with 10%/30%PTFE Water −0.015∼0.015

8 Journal of Chemistry
0.0
0.1
0.2
0.3
0.4
0.5
0.6
0.7
0.8
0.9
1.0
Non
wet
ting
phas
e sat
urat
ion
10−3 10−2 10−1 100 101 102
Brooks-Corey
J = Pc/(𝜎(𝜀/k)1/2)
SGL 10BA-waterSGL 10BA-octaneToray 090-waterToray 090-octaneE-Tek cloth-water
E-Tek cloth-octaneSGL 10BB-watervan Genuchten
Figure 6: Comparison of experimental 𝐽(𝑠)-𝑠 curves for the over-all and hydrophilic pore networks with Brooks-Corey and vanGenuchten models for all unimodal GDLs tested. Source: [40].
Genuchten or Brooks-Corey type 𝐽 function can be expressedas follows, respectively:
𝑠 = (1 + (𝐽
𝐽𝑐
)
𝑛
)
−𝑚
, (4a)
𝑠 = (𝐽
𝐽𝑐
)
−𝜆
, (4b)
where 𝐽𝑐, 𝜆,𝑚, and 𝑛 are fitted parameters.
Gostick et al. [43, 51, 55] further measured 𝑝𝑐-𝑠 curves
for water withdrawal and injection. They found that thereexisted a capillary pressure hysteresis during the loop of waterinjection and withdrawal [51, 55] and water withdrawal fromany 𝑠 reached by water injection also resulted in hysteresis(Figure 7) [43]. Water can neither be injected into a dry GDLspontaneously nor be drained from a water-saturated GDLspontaneously. Therefore, a positive pressure is needed tocompel water and air to be injected into GDLs. They pro-posed that adding PTFE could increase the hydrophobicityof the GDL, so that the work required for water removalwas decreased. They also found that water-air 𝑝
𝑐-𝑠 curves
depended on GDL thickness, which indicated that finite sizeeffects were nonignorable. They thought that hysteresis camefrom two origins [43, 51]. Firstly, the advancing contact angle𝜃𝐴for water injection and receding contact angle 𝜃
𝑅for water
withdrawal differed, which is referred to as the contact anglehysteresis [61]. Secondly, capillary equilibrium was achievedby irreversible meniscus transitions and depended on thehistory of saturation change. Fairweather et al. [42], Acostaet al. [41], Harkness et al. [49], and Gallagher et al. [46] alsofound the hysteresis of the 𝑝
𝑐-𝑠 curves during water injection
into and withdrawing from GDLs. Fairweather et al. [52]further experimentally studied the effect of the Teflon loading
0.00.1
0.2
0.3
0.4
0.5
0.6
0.7
0.8
0.9
1.0
Wat
er sa
tura
tion
−25000 −15000 −5000 5000 15000 25000 35000
Capillary pressure (PL-PG) (Pa)
Figure 7: Air water capillary pressure curve for Toray 090. Source:[43].
on the𝑝𝑐-𝑠 curves.These authors added 5–40wt%Teflon into
Toray 090 carbon paper and noted hysteresis in all their testswith GDLs. Nguyen et al. [44, 59] measured the 𝑝
𝑐-𝑠 curves
of two GDL materials, a high-porous material of SGL 10CAand a less porous denser material by Toray 060. Somewhatsurprised, these authors did not note any hysteresis, probablyowing to a small range of capillary pressure studied.
Gostick et al. [50] also studied the MPL effect in PEMfuel cell operation by ex situ measurements of the capillarypressure curves.Their capillary pressure data showed that thesaturation in the GDL for water breakthrough was reducedsignificantly from 25% to 5% in the presence of MPL. Theirfindings suggested that the effectiveness of the MPL mightbe further improved by designing them with large holes forwater passage into the GDL, while leaving the microporositydry for gas transport.
In Shrestha and Gostick’s work [58], the 𝑝𝑐-𝑠 curves for
Toray 120 with 0 and 10% PTFE loadings were measured inthe temperature range of 25–85∘C. They found that notableshifts in the capillary behavior were seen and in some casesthe shifts were of the same size as PTFE addition. In untreatedsamples, the results suggested that GDL wettability changedwith temperature once the temperature dependence of thesurface tension had been accounted for. In treated samples,however, the wettability remained more or less constant withtemperature.
In series works of Mench’s group [37–39], the capillarypressure curves for SGL series carbon papers were tested at alarge range of 5–20wt% PTFE loadings, at compressions of 0,0.6, and 1.4MPa, and at operating temperatures of 20, 50, and80∘C. They examined the effectiveness of the Leverett-Udellcorrelation and found a significant deviation of the standardLeverett function from the experimental data.
Sole and Ellis [60] measured and compared the 𝑝𝑐-𝑠
curves for two kinds of representative GDL materials (onepaper, one cloth), each with four different bulk loadings ofPTFE (0, 10, 20, and 30wt%). Their results showed that thePTFE loading had only a small influence on the capillarypressure within the pressure range normally associated withPEM fuel cell water transport. The results also showedthat carbon cloth-based GDL materials required greater

Journal of Chemistry 9
capillary pressures than papermaterials to achieve significantsaturation and that compression could homogenize the porestructure and the slope of the capillary pressure-saturationcurve of both materials.
Besides direct experimental measurement, numericalmodeling and simulations are another important way toproduce data of capillary pressure versus saturation. Koido etal. [45] applied pore network model to predict the 𝑝
𝑐-𝑠 curve
of Toray 060 GDL. They presented two reasons for the useof pore network model. Firstly, the approach did not requirehigh computational cost because themodel idealized the poremorphology and topology as a pore network composed ofthroats and pores. Secondly, the GDL properties, such aswettability, pore size distribution, and pore connectivity, wereeasily modified as parameters in the calculation. In work ofGostick et al. [56, 57], the pore network model was also usedto simulate realistic water configurations generated withinGDLs. The model was able to reproduce the experimentalinjection breakthrough saturations and had been extendedto describe water condensation.Their simulations confirmedthat the water saturation at breakthrough was decreasedsignificantly when a MPL was incorporated into the GDL,agreeing with experiments. However, the simulations yieldedlimiting currents significantly higher than those observed inpractice whether or not anMPLwas present, which suggestedthat mass transfer resistance within the catalyst layer playedan important role. Rensink et al. [47] used a volume offluid (VOF) method to determine the two-phase behavior ina virtually created substrate. No constitutive relations wereused since the liquid/gas boundary was resolved. Using thesimulated liquid saturation and pressure as a function of time,they combined them to get a capillary pressure curve. Thecurve was compared with the Leverett-Udell correlation.Thecomparison showed that the best fit between VOF results andthe Leverett-Udell correlation was achieved for liquid satu-ration below 0.2. For higher liquid saturations the Leverett-Udell correlation yielded higher saturation. Hao and Cheng[53] adopted lattice Boltzmann simulation to produce capil-lary pressure curves in a carbon paperGDLwith hydrophobicand hydrophilic pores. They compared the simulated andmeasured 𝑝
𝑐-𝑠 curves for water withdrawal and injection.
The results indicated that 𝑝𝑐-𝑠 curves for the withdrawal and
injection agreed well with those measured by experiment,which demonstrated the coexistence of hydrophobic andhydrophilic pores in the carbon paper GDLs treated by PTFE.They thought that the 𝑝
𝑐-𝑠 curves fitted by lattice Boltzmann
simulations provided better predictions in carbon paperGDLs with homogeneous wettability and porosity, comparedwith the standard Leverett-Udell correlation.
5. New 𝑝𝑐-𝑠 Correlations
The aim of measurements and simulations for capillarypressure curves is to develop a new 𝑝
𝑐-𝑠 correlation for
commercial GDLs, because such correlation is imperativeto the understanding and prediction of two-phase transportphenomenon in the porous electrodes of PEM fuel cells. Upto now, large amount of capillary pressure data for GDLs
commonly used in the PEM fuel cell has been reported, whichmake it possible to develop the new 𝑝
𝑐-𝑠 correlations. In
recent years, some researchers were devoted to developingnew 𝑝
𝑐-𝑠 correlations based on these available capillary
pressure data, and the main progresses are summarized asfollows.
It was a very challenging task to propose an overall new𝑝𝑐-𝑠 correlation, hence, a majority of researchers adopted the
simplest way tomodel𝑝𝑐-𝑠 correlation.The capillary pressure
was assumed to be a function of saturation only; that is, 𝑝𝑐=
𝑓(𝑠). The function form of 𝑓(𝑠) was chosen arbitrarily. Namand Kaviany [89] used a linear function:
𝑝𝑐= 𝑐𝑠. (5)
Lin and van Nguyen [90] also adopted the same linear𝑝𝑐-𝑠 correlation. Later, more complex function such as the
polynomial was used. For example, Kumbur et al.’s functionwas [33]
𝑝𝑐= 𝑐1𝑠 + 𝑐2𝑠2
. (6)
Sole and Ellis’s function was [60]
𝑑𝑝𝑐
𝑑𝑠= 𝑐0+ 𝑐1𝑠 + 𝑐2𝑠2
+ 𝑐3𝑠3
+ 𝑐4𝑠4
+ 𝑐5𝑠5
+ 𝑐6𝑠6
. (7)
And Wang et al.’s function was [35]
𝑝𝑐= 𝑐0+ 𝑐1𝑠 + 𝑐2𝑠2
+ 𝑐3𝑠3
. (8)
Ye and van Nguyen adopted an exponential form [34]:
𝑝𝑐= 𝑑1exp (−𝑎
1[𝑠 − 𝑐]) − 𝑑
2exp (𝑎
2[𝑠 − 𝑐]) + 𝑏. (9)
Acosta et al. [41] used a semiexponential and semipolynomialform:
𝑝𝑐= 𝑎1exp (𝑏
1𝑠 + 𝑐1)
+ 𝑑1(1 − 𝑠) for the imbibition process
(10a)
𝑝𝑐= 𝑎2exp (𝑏
2𝑠 + 𝑐2) + 𝑑2(1 − 𝑠)
+𝑒2
𝑠for the drainage process.
(10b)
The parameters in (5)–(10b) can be determined by fittingthe experimentally measured 𝑝
𝑐-𝑠 data. It should be noted
that the above correlations ((5)–(10b)) are less meaningfulphysically and this kind of empirical correlations is subjectedto a great limitation that only the fitted data agree with the𝑝𝑐-𝑠 correlation.Through a bundle of capillaries model, Cheung et al.
[48] proposed a method to deconvolute the effects of porewettability and structure from 𝑝
𝑐-𝑠 measurements. Their
study firstly reported representative distributions of contactangle which described the internal wettability in GDLs forboth liquid and gas injection and agreed with experimen-tally measured 𝑝
𝑐-𝑠 data. The model considered the surface
roughness and chemical heterogeneity of the GDLs by usinga single Gaussian distribution of the contact angle based on
10 Journal of Chemistry
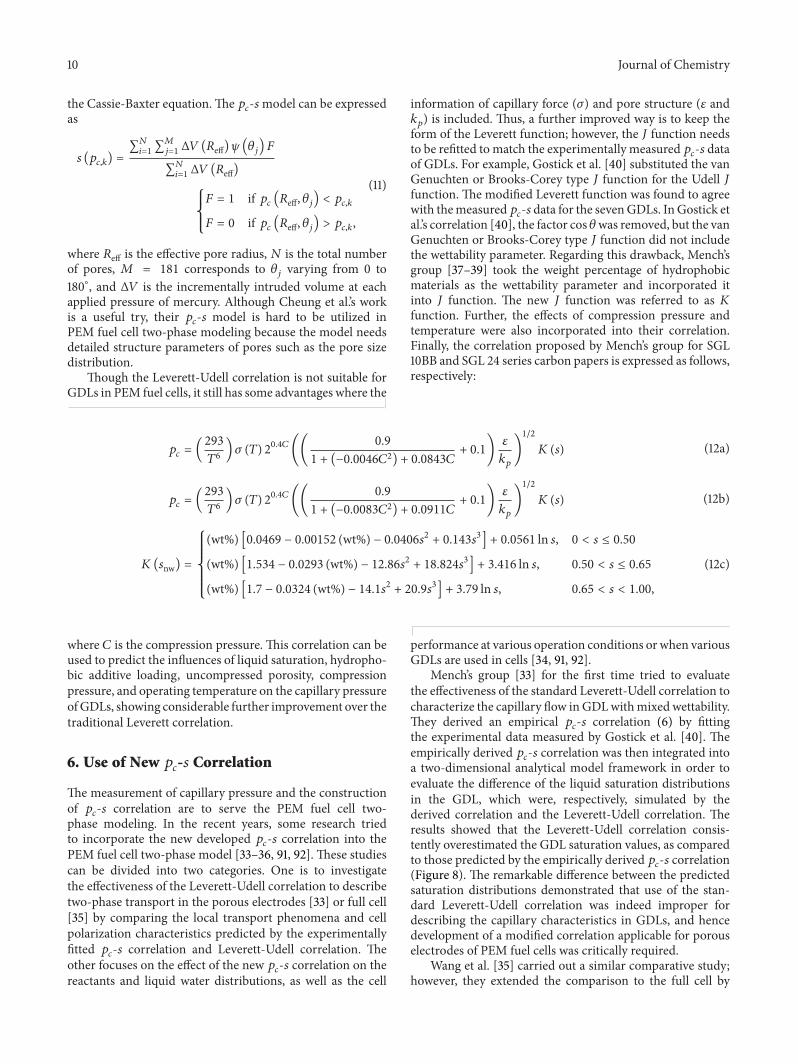
the Cassie-Baxter equation.The 𝑝𝑐-𝑠model can be expressed
as
𝑠 (𝑝𝑐,𝑘) =
∑𝑁
𝑖=1∑𝑀
𝑗=1Δ𝑉 (𝑅eff) 𝜓 (𝜃𝑗) 𝐹
∑𝑁
𝑖=1Δ𝑉 (𝑅eff)
{
{
{
𝐹 = 1 if 𝑝𝑐(𝑅eff, 𝜃𝑗) < 𝑝𝑐,𝑘
𝐹 = 0 if 𝑝𝑐(𝑅eff, 𝜃𝑗) > 𝑝𝑐,𝑘,
(11)
where 𝑅eff is the effective pore radius, 𝑁 is the total numberof pores, 𝑀 = 181 corresponds to 𝜃
𝑗varying from 0 to
180∘, and Δ𝑉 is the incrementally intruded volume at eachapplied pressure of mercury. Although Cheung et al.’s workis a useful try, their 𝑝
𝑐-𝑠 model is hard to be utilized in
PEM fuel cell two-phase modeling because the model needsdetailed structure parameters of pores such as the pore sizedistribution.
Though the Leverett-Udell correlation is not suitable forGDLs in PEM fuel cells, it still has some advantages where the
information of capillary force (𝜎) and pore structure (𝜀 and𝑘𝑝) is included. Thus, a further improved way is to keep the
form of the Leverett function; however, the 𝐽 function needsto be refitted to match the experimentally measured 𝑝
𝑐-𝑠 data
of GDLs. For example, Gostick et al. [40] substituted the vanGenuchten or Brooks-Corey type 𝐽 function for the Udell 𝐽function. The modified Leverett function was found to agreewith themeasured𝑝
𝑐-𝑠 data for the sevenGDLs. InGostick et
al.’s correlation [40], the factor cos 𝜃was removed, but the vanGenuchten or Brooks-Corey type 𝐽 function did not includethe wettability parameter. Regarding this drawback, Mench’sgroup [37–39] took the weight percentage of hydrophobicmaterials as the wettability parameter and incorporated itinto 𝐽 function. The new 𝐽 function was referred to as 𝐾function. Further, the effects of compression pressure andtemperature were also incorporated into their correlation.Finally, the correlation proposed by Mench’s group for SGL10BB and SGL 24 series carbon papers is expressed as follows,respectively:
𝑝𝑐= (
293
𝑇6)𝜎 (𝑇) 2
0.4𝐶
((0.9
1 + (−0.0046𝐶2) + 0.0843𝐶+ 0.1)
𝜀
𝑘𝑝
)
1/2
𝐾 (𝑠) (12a)
𝑝𝑐= (
293
𝑇6)𝜎 (𝑇) 2
0.4𝐶
((0.9
1 + (−0.0083𝐶2) + 0.0911𝐶+ 0.1)
𝜀
𝑘𝑝
)
1/2
𝐾 (𝑠) (12b)
𝐾(𝑠nw) =
{{{{
{{{{
{
(wt%) [0.0469 − 0.00152 (wt%) − 0.0406𝑠2 + 0.143𝑠3] + 0.0561 ln 𝑠, 0 < 𝑠 ≤ 0.50
(wt%) [1.534 − 0.0293 (wt%) − 12.86𝑠2 + 18.824𝑠3] + 3.416 ln 𝑠, 0.50 < 𝑠 ≤ 0.65
(wt%) [1.7 − 0.0324 (wt%) − 14.1𝑠2 + 20.9𝑠3] + 3.79 ln 𝑠, 0.65 < 𝑠 < 1.00,
(12c)
where 𝐶 is the compression pressure. This correlation can beused to predict the influences of liquid saturation, hydropho-bic additive loading, uncompressed porosity, compressionpressure, and operating temperature on the capillary pressureofGDLs, showing considerable further improvement over thetraditional Leverett correlation.
6. Use of New 𝑝𝑐-𝑠 Correlation
The measurement of capillary pressure and the constructionof 𝑝𝑐-𝑠 correlation are to serve the PEM fuel cell two-
phase modeling. In the recent years, some research triedto incorporate the new developed 𝑝
𝑐-𝑠 correlation into the
PEM fuel cell two-phase model [33–36, 91, 92]. These studiescan be divided into two categories. One is to investigatethe effectiveness of the Leverett-Udell correlation to describetwo-phase transport in the porous electrodes [33] or full cell[35] by comparing the local transport phenomena and cellpolarization characteristics predicted by the experimentallyfitted 𝑝
𝑐-𝑠 correlation and Leverett-Udell correlation. The
other focuses on the effect of the new 𝑝𝑐-𝑠 correlation on the
reactants and liquid water distributions, as well as the cell
performance at various operation conditions or when variousGDLs are used in cells [34, 91, 92].
Mench’s group [33] for the first time tried to evaluatethe effectiveness of the standard Leverett-Udell correlation tocharacterize the capillary flow inGDLwithmixed wettability.They derived an empirical 𝑝
𝑐-𝑠 correlation (6) by fitting
the experimental data measured by Gostick et al. [40]. Theempirically derived 𝑝
𝑐-𝑠 correlation was then integrated into
a two-dimensional analytical model framework in order toevaluate the difference of the liquid saturation distributionsin the GDL, which were, respectively, simulated by thederived correlation and the Leverett-Udell correlation. Theresults showed that the Leverett-Udell correlation consis-tently overestimated the GDL saturation values, as comparedto those predicted by the empirically derived 𝑝
𝑐-𝑠 correlation
(Figure 8). The remarkable difference between the predictedsaturation distributions demonstrated that use of the stan-dard Leverett-Udell correlation was indeed improper fordescribing the capillary characteristics in GDLs, and hencedevelopment of a modified correlation applicable for porouselectrodes of PEM fuel cells was critically required.
Wang et al. [35] carried out a similar comparative study;however, they extended the comparison to the full cell by

Journal of Chemistry 11
0
0.2
0.4
0.6
0.8
0 0.2 0.4 0.6 0.8 1
Wat
er sa
tura
tion
Friction distance from catalyst later
Case 1
Case 2
DMLDM = 0.7
𝜗DM =KDM = 10−12 m2
Thickness = 200𝜇m
MPLLDM = 0.4
𝜗DM = 150KDM = 10−12 m2
Thickness = 60𝜇m
110∘ ∘
1.0A/cm2Case 1: I =1.0A/cm2Case 2: I =
Figure 8: Predicted saturation profiles for Case 1 (using standard Leverett-Udell correlation) andCase 2 (using empirical curve-fit) for 200 𝜇mGDL material and the net water transport coefficient value of 0.5 at current density 1.0 A cm−2. Source: [33].
0.2
0.3
0.4
0.5
0.6
0.7
0.8
0.9
1.0
1.1
0 2000 4000 6000 8000 10000 12000 14000
I (A/m2)
kC = 5000 𝜏 = 1.5 𝜀GDL = 0.78
Leverett-Udell, 𝜃 = 135∘
Leverett-Udell, 𝜃 = 96∘
Leverett-Udell, 𝜃 = 0∘
V(V
)
Toray 060A, withdrawalToray 060A, injection
Figure 9: Polarization curves of fuel cells for various 𝑝𝑐-𝑠 correlations. Sources: [35].
using a three-dimensional, nonisothermal, and two-phasefuel cell model. Key physical and chemical processes occur-ring in the cell were taken into account, and the experi-mentally fitted 𝑝
𝑐-𝑠 correlation and the standard Leverett-
Udell correlation were incorporated into the same full cellmodel, respectively. The cell performances simulated by thetwo models were evaluated at GDL tortuosity of 1.5 and2.5, GDL porosity of 0.6 and 0.9, and coefficient of watervapor condensation rate of 500 s−1 and 5000 s−1.Their results(Figure 9) showed that the standard Leverett-Udell correla-tion with 𝜃 = 96
∘ predicted a far worse cell performancethan those with 𝜃 = 0
∘ and 𝜃 = 135∘, which contradicted
with the experimental observations. Thus, introduction ofthe factor “cos 𝜃” into the standard Leverett-Udell correlationcould not capture the influence of wettability on the capillarypressure. The Leverett-Udell correlation with 𝜃 = 135
∘
could predict a cell performance close to that predicted by
the experimentally fitted 𝑝𝑐-𝑠 correlation. However, this
contact angle was far higher than the actual values of 88–101∘;as a result, the liquid water saturation in the GDL for 𝜃 = 135∘was quite different from that for an actual angle and hencedeviated from the experimental saturation. They proposedthat quantitative modeling adopting the standard Leverett-Udell correlation was not suggested. Nevertheless, PEM fuelcell model with the standard Leverett-Udell correlation couldqualitatively estimate the cell performance.
Nguyen should be the first person who pointed out theinappropriateness of the Leverett-Udell correlation for GDLsof PEM fuel cells as early as 2001 [91]. Later, Ye and vanNguyen [34] incorporated experimentallymeasured capillarypressure functions into a single-domain, three-dimensional,and two-phase transport model to evaluate liquid waterdistribution in the porous electrode of a PEM fuel cellwith parallel channels. Their results showed that the liquid

12 Journal of Chemistry
0.5
0.45
0.4
0.35
0.3
0.25
0.2
0.15
0.1
0.05
0
s
(a)
0.5
0.45
0.4
0.35
0.3
0.25
0.2
0.15
0.1
0.05
0
s
(b)
0.5
0.45
0.4
0.35
0.3
0.25
0.2
0.15
0.1
0.05
0
s
(c)
Figure 10: Saturation distributions on the cathode GDL-CL interface for SGL 24 series treated with different PTFE load at operating voltageof 0.3 V: (a) SGL 24BC, 5% PTFE; (b) SGL 24CC, 10% PTFE; (c) SGL 24DC, 20% PTFE. Source: [92].
water distribution was lower under the rib than that underthe channel in the cathode catalyst layer for high currentdensities. In the cathode GDL, however, the liquid waterdistribution was higher under the rib than that under thechannel. The average water saturation levels were insensitiveto current density and fell in the range of 0.4–0.5 in thecatalyst layer and 0.2–0.3 in theGDL at high current densities.With more reliable 𝑝
𝑐-𝑠 correlation, liquid water distribution
showed reasonable values and a trend without artificiallyintroduced boundary conditions on the interface between thecathode channel and GDL.
More recently, Wang and Si [92] incorporated Mench’s𝑝𝑐-𝑠 correlation with𝐾(𝑠) function into a three-dimensional,
nonisothermal, and two-phase model of PEM fuel cell toinvestigate the effects of the PTFE content, MPL, and com-pression pressure for two GDL series (SGL 10 and SGL 24) onthe liquid water and oxygen transport and cell performancefor a parallel flow field fuel cell. Restated that Mench’s 𝑝
𝑐-𝑠
correlation retains the factor of (𝜀/𝑘𝑝)0.5 used in Leverett
function, because this factor characterizes the effects of theporous structure and surface tension between gaseous andliquid phases on the liquid water distribution. Meanwhile,Mench’s 𝑝
𝑐-𝑠 correlation removes the factor of cos 𝜃 based on
the fact that a single contact angle cannot describe the mixedwettability of porous electrodes. Furthermore, 𝐾(𝑠) functionin Mench’s 𝑝
𝑐-𝑠 correlation is derived based on fitting a
variety of experimentally measured 𝑝𝑐-𝑠 data for various
commercial GDLs. During the fitting, the key parametersaffecting the liquid water transport in the porous electrodes,such as content of hydrophobic materials, MPL, compressionpressure, and temperature, are all taken into account in the𝑝𝑐-𝑠 correlation. Therefore, Mench’s 𝑝
𝑐-𝑠 possesses a good
versatility. It can be expected that a two-phase PEM fuel cellmodel incorporated with this correction will describe two-phase transport phenomena in the pores of porous electrodesmore reasonably.
The effects of the content of PTFE material, compressionpressure, and MPL on the liquid water distribution areshown in Figures 10–12, respectively [92]. Larger content ofhydrophobicmaterials can enhance the hydrophobicity of theporous electrode, causing the liquidwater to be expelledmoreeasily from the pores. Figure 10 shows that SGL 24BC with5% PTEF has the highest saturation, followed by the SGL24CC with 10% PTFE and the SGL 24DC with 20% PTFE.After introducing Mench’s 𝑝
𝑐-𝑠 correlation, the two-phase
model could predict reasonably that increasing the contentof the hydrophobic materials could help to expel the liquidwater from the pores. However, the conventional Leverett-Udell correlation characterizes the content of hydrophobicmaterials through contact angle; larger content correspondsto larger contact angle. The study of Wang et al. [35]indicated that the cell performance with the contact angleof 0∘ was superior to that of 96∘; obviously, the Leverett-Udell correlation could not really reflect the effect of thecontent of hydrophobic materials. Similarly, the two-phasemodel based onMench’s 𝑝
𝑐-𝑠 correlation indicated that larger
compression pressure led to some pores to be collapsed,which decreases the porosity and deteriorates the liquidwaterremoval capability. As a result, a larger saturation appears inthe porous electrode (Figure 11). The effect of the MPL onthe liquid water removal can also be studied by incorporatingMench’s 𝑝
𝑐-𝑠 correlation into the two-phase model. Figure 12
shows that the capability of liquidwater removal in the porouselectrode is enhanced when MPL were introduced betweenthe catalyst layer and GDL, which corresponds to the lowersaturation. This agrees well with the experimental reports.
7. Closing Remarks
Modeling and simulations have been becoming powerfultools for performance prediction and design optimization of

Journal of Chemistry 13
0.5
0.45
0.4
0.35
0.3
0.25
0.2
0.15
0.1
0.05
0
s
(a)
0.5
0.45
0.4
0.35
0.3
0.25
0.2
0.15
0.1
0.05
0
s
(b)
0.5
0.45
0.4
0.35
0.3
0.25
0.2
0.15
0.1
0.05
0
s
(c)
0.5
0.45
0.4
0.35
0.3
0.25
0.2
0.15
0.1
0.05
0
s
(d)
Figure 11: Saturation distributions on the cathode GDL-CL interface for SGL 24BC treated with different compression pressures at operatingvoltage of 0.3 V: (a) 1MPa; (b) 2MPa; (c) 3MPa; (d) 4MPa. Source: [92].
PEM fuel cells, which proposes an urgent requirement fordeveloping an accurate porous electrode two-phase modelfor fuel cells. For the porous electrode modeling based onthe volume-average method, Wang et al. [12, 13] introduced acorrelation to relate the pressure difference between gaseousand liquid phases in the porous electrode pores with thelocal saturation by means of a capillary pressure concept.Theintroduction of the 𝑝
𝑐-𝑠 correlation leads to the fact that it is
not necessary to focus on the complex interactions betweenthe gaseous and liquid phases in the pores, which greatlysimplifies the two-phase modeling for the porous electrodesand becomes the main method for the current two-phasemodeling for fuel cells.
As the reason of the extremely inadequate experimentaldata of the capillary pressure for porous GDL, Wang et al.introduced the Leverett-Udell correlation which was fitted
from the experimental data of packed sands into the mod-eling for PEM fuel cells. The recent studies indicated that thiscorrelation could not cover the experimental data of capillarypressure versus saturation for the commercial used GDLswell. This motivated more and more researchers to measurethe capillary pressure for various GDLs. A massive publishedexperimental data makes it possible to propose a new 𝑝
𝑐-𝑠
correlation. The representative work is the correlation pro-posed by Mench’s group. However, the experiments showedthat there existed a hysteresis of capillary pressure betweenwater withdrawal with𝑝
𝑐> 0 andwater injectionwith𝑝
𝑐< 0,
and water withdrawal from any 𝑠 reached by water injectionalso led to the hysteresis. The hysteresis means that the 𝑝
𝑐-𝑠
curve for water injection does not coincidewith that for waterwithdrawal. In the real porous electrodes, the withdrawalor injection of the water in the local pore is determined by

14 Journal of Chemistry
0.5
0.45
0.4
0.35
0.3
0.25
0.2
0.15
0.1
0.05
0
s
(a)
0.5
0.45
0.4
0.35
0.3
0.25
0.2
0.15
0.1
0.05
0
s
(b)
0.5
0.45
0.4
0.35
0.3
0.25
0.2
0.15
0.1
0.05
0
s
(c)
Figure 12: Saturation distributions on the cathode GDL-CL interface at operating voltage of 0.3 V for different treated GDLs: (a) SGL 24BC,5% PTFE with MPL; (b) SGL 24BC, 5% PTFE without MPL; (c) SGL 10BB with MPL. Source: [92].
the local pressure difference between the gaseous and liquidphases. However, the correlation proposed by Mench’s grouponly can describe thewithdrawal process.Thus, it is necessaryto develop a 𝑝
𝑐-𝑠 correlation which can be applicable to both
withdrawal and injection processes.In addition, the real gas-liquid interface in the pores of
porous electrodes cannot be considered based on the currentvolume-averagemethod.The introduction of𝑝
𝑐-𝑠 correlation
simplifies the treatment of the complex interactions betweenliquid and gaseous phases and makes it possible to carry outthe two-phase modeling of porous electrodes. However, itcould not capture the real transport and distributions of thetwo phases in the pores of porous electrodes. As a result,developing of new two-phase modeling method based onthe real porous structure is the key point in the immediatefuture. Although it may be a great challenge to develop sucha model, fortunately, some researchers have tried to modelthe two-phase transport in the real porous electrodes bymeans of lattice Boltzmann method (LBM). The next mostpressing problem is to couple two-phase transport with otherphysical and chemical phenomena occurring in porous elec-trodes such as the electrochemical reactions, conductions ofelectron and proton, and electric osmosis. A conceivable wayis the coupled LBM-CFD (computational fluid dynamics)method. Once this kind of models is constructed, the 𝑝
𝑐-𝑠
correlation will no longer be needed, and the phase distri-butions of liquid and gaseous phases in the pores of porouselectrodes and the complex interactions between the twophases can be simulated directly, which makes developinga more realistic water management strategy become morebelievable.
Conflict of Interests
The authors declare that there is no conflict of interestsregarding the publication of this paper.
Acknowledgments
This study was partially supported by the National NaturalScience Foundation of China (no. 51276060), the 111 Project(no. B12034), Program for New Century Excellent Talentsin University (no. NCET-11-0635), and the FundamentalResearch Funds for the Central Universities (no. 13ZX13).
References
[1] C.-Y. Wang, “Fundamental models for fuel cell engineering,”Chemical Reviews, vol. 104, no. 10, pp. 4727–4765, 2004.
[2] X.-D. Wang, Y.-Y. Duan, and W.-M. Yan, “Novel serpentine-baffle flow field design for proton exchange membrane fuelcells,” Journal of Power Sources, vol. 173, no. 1, pp. 210–221, 2007.
[3] X.-D. Wang, Y.-Y. Duan, and W.-M. Yan, “Numerical study ofcell performance and local transport phenomena in PEM fuelcells with various flow channel area ratios,” Journal of PowerSources, vol. 172, no. 1, pp. 265–277, 2007.
[4] H.-C. Liu, W.-M. Yan, and X.-D. Wang, “Effects of flowchannel area ratio on local transport characteristics and cellperformance of 3D PEMFCs,” Journal of the ElectrochemicalSociety, vol. 154, no. 12, pp. B1338–B1348, 2007.
[5] H. Li, Y. Tang, Z. Wang et al., “A review of water flooding issuesin the proton exchange membrane fuel cell,” Journal of PowerSources, vol. 178, no. 1, pp. 103–117, 2008.
[6] W. Q. Tao, C. H. Min, X. L. Liu, Y. L. He, B. H. Yin, andW. Jiang, “Parameter sensitivity examination and discussion ofPEM fuel cell simulationmodel validation. Part I. Current statusofmodeling research andmodel development,” Journal of PowerSources, vol. 160, no. 1, pp. 359–373, 2006.
[7] X.-D. Wang, J.-L. Xu, and D.-J. Lee, “Parameter sensitivityexamination for a complete three-dimensional, two-phase,non-isothermal model of polymer electrolyte membrane fuelcell,” International Journal of Hydrogen Energy, vol. 37, no. 20,pp. 15766–15777, 2012.

Journal of Chemistry 15
[8] X.-D. Wang, Y.-Y. Duan, W.-M. Yan, and F.-B. Weng, “Effectof humidity of reactants on the cell performance of PEM fuelcells with parallel and interdigitated flow field designs,” Journalof Power Sources, vol. 176, no. 1, pp. 247–258, 2008.
[9] X.-D. Wang, Y.-Y. Duan, W.-M. Yan, and X.-F. Peng, “Localtransport phenomena and cell performance of PEM fuel cellswith various serpentine flow field designs,” Journal of PowerSources, vol. 175, no. 1, pp. 397–407, 2008.
[10] W.-M. Yan, X.-D. Wang, D.-J. Lee, X.-X. Zhang, Y.-F. Guo, andA. Su, “Experimental study of commercial size proton exchangemembrane fuel cell performance,” Applied Energy, vol. 88, no. 1,pp. 392–396, 2011.
[11] W. M. Yan, X. D. Wang, S. S. Mei, X. F. Peng, Y. F. Guo, andA. Su, “Effects of operating temperatures on performance andpressure drops for a 256 cm2 proton exchange membrane fuelcell: an experimental study,” Journal of Power Sources, vol. 185,no. 2, pp. 1040–1048, 2008.
[12] C. Y. Wang, Z. H. Wang, and Y. Pan, “Two-phase transport inproton exchange membrane fuel cells,” in Proceedings of ASMEHeat Transfer Division, vol. 364, pp. 351–357, November 1999.
[13] Z. H. Wang, C. Y. Wang, and K. S. Chen, “Two-phase flow andtransport in the air cathode of proton exchange membrane fuelcells,” Journal of Power Sources, vol. 94, no. 1, pp. 40–50, 2001.
[14] E. F. Medici and J. S. Allen, “Existence of the phase drainagediagram in proton exchange membrane fuel cell fibrous diffu-sionmedia,” Journal of Power Sources, vol. 191, no. 2, pp. 417–427,2009.
[15] L. X. You and H. T. Liu, “A two-phase flow and transport modelfor the cathode of PEM fuel cells,” International Journal of Heatand Mass Transfer, vol. 45, no. 11, pp. 2277–2287, 2002.
[16] S. Mazumder and J. V. Cole, “Rigorous 3-D mathematicalmodeling of PEM fuel cells II. Model predictions with liquidwater transport,” Journal of the Electrochemical Society, vol. 150,no. 11, pp. A1510–A1517, 2003.
[17] H. Sun, H. Liu, and L.-J. Guo, “PEM fuel cell performance andits two-phasemass transport,” Journal of Power Sources, vol. 143,no. 1-2, pp. 125–135, 2005.
[18] M. Vynnycky, “On the modelling of two-phase flow in thecathode gas diffusion layer of a polymer electrolyte fuel cell,”AppliedMathematics and Computation, vol. 189, no. 2, pp. 1560–1575, 2007.
[19] A. Su, Y. M. Ferng, W. T. Chen, C. H. Cheng, F. B. Weng, and C.Y. Lee, “Investigating the transport characteristics and cell per-formance for a micro PEMFC through the micro sensors andCFD simulations,” International Journal of Hydrogen Energy,vol. 37, no. 15, pp. 11321–11333, 2012.
[20] Y. Wang and C.-Y. Wang, “A nonisothermal, two-phase modelfor polymer electrolyte fuel cells,” Journal of the ElectrochemicalSociety, vol. 153, no. 6, pp. A1193–A1200, 2006.
[21] P. Zhou and C. W. Wu, “Numerical study on the compressioneffect of gas diffusion layer on PEMFC performance,” Journal ofPower Sources, vol. 170, no. 1, pp. 93–100, 2007.
[22] H. Ju, G. Luo, and C.-Y. Wang, “Probing liquid water saturationin diffusion media of polymer electrolyte fuel cells,” Journal ofthe Electrochemical Society, vol. 154, no. 2, pp. B218–B228, 2007.
[23] M.-H. Chang, F. L. Chen, and H.-S. Teng, “Effects of two-phasetransport in the cathode gas diffusion layer on the performanceof a PEMFC,” Journal of Power Sources, vol. 160, no. 1, pp. 268–276, 2006.
[24] G. L. He, Y. Yamazaki, and A. Abudula, “A three-dimensionalanalysis of the effect of anisotropic gas diffusion layer(GDL)
thermal conductivity on the heat transfer and two-phase behav-ior in a proton exchange membrane fuel cell(PEMFC),” Journalof Power Sources, vol. 195, no. 6, pp. 1551–1560, 2010.
[25] J. H. Chun, K. T. Park, D. H. Jo, S. G. Kim, and S. H. Kim,“Numerical modeling and experimental study of the influenceof GDL properties on performance in a PEMFC,” InternationalJournal of Hydrogen Energy, vol. 36, no. 2, pp. 1837–1845, 2011.
[26] V. Gurau, M. J. Bluemle, E. S. De Castro, Y.-M. Tsou, J.A. Mann Jr., and T. A. Zawodzinski Jr., “Characterization oftransport properties in gas diffusion layers for proton exchangemembrane fuel cells. 1. Wettability (internal contact angle towater and surface energy of GDL fibers),” Journal of PowerSources, vol. 160, no. 2, pp. 1156–1162, 2006.
[27] W.-C. Weng, W.-M. Yan, H.-Y. Li, and X.-D. Wang, “Numericalsimulation of cell performance in proton exchange membranefuel cells with contracted flow field design,” Journal of theElectrochemical Society, vol. 155, no. 9, pp. B877–B886, 2008.
[28] X. D. Wang, Y. Y. Duan, W. M. Yan, and X. F. Peng, “Effects offlow channel geometry on cell performance for PEM fuel cellswith parallel and interdigitated flow fields,” Electrochimica Acta,vol. 53, no. 16, pp. 5334–5343, 2008.
[29] W.-M. Yan, H.-Y. Li, P.-C. Chiu, and X.-D. Wang, “Effects ofserpentine flow field with outlet channel contraction on cellperformance of proton exchange membrane fuel cells,” Journalof Power Sources, vol. 178, no. 1, pp. 174–180, 2008.
[30] X.-D. Wang, Y.-X. Huang, C.-H. Cheng et al., “An inversegeometry design problem for optimization of single serpentineflow field of PEM fuel cell,” International Journal of HydrogenEnergy, vol. 35, no. 9, pp. 4247–4257, 2010.
[31] M. C. Leverett, “Capillary hehavior in porous solids,” Society ofPetroleum Engineers, vol. 142, pp. 152–169, 1941.
[32] K. S. Udell, “Heat transfer in porous media considering phasechange and capillarity-the heat pipe effect,” International Jour-nal of Heat and Mass Transfer, vol. 28, no. 2, pp. 485–495, 1985.
[33] E. C. Kumbur, K. V. Sharp, and M. M. Mench, “On theeffectiveness of Leverett approach for describing the watertransport in fuel cell diffusion media,” Journal of Power Sources,vol. 168, no. 2, pp. 356–368, 2007.
[34] Q. Ye and T. van Nguyen, “Three-dimensional simulation ofliquid water distribution in a PEMFC with experimentallymeasured capillary functions,” Journal of the ElectrochemicalSociety, vol. 154, no. 12, pp. B1242–B1251, 2007.
[35] X.-D. Wang, Y.-L. Wang, Y. Chen, C. Si, A. Su, and D.-J. Lee,“Proton exchange membrane fuel cell modeling with diffusionlayer-based and sands-based capillary pressure correlations:comparative study,” Journal of the Taiwan Institute of ChemicalEngineers, vol. 45, no. 4, pp. 1532–1541, 2014.
[36] E. C. Kumbur, K. V. Sharp, and M. M. Mench, “A design toolfor predicting the capillary transport characteristics of fuel celldiffusion media using an artificial neural network,” Journal ofPower Sources, vol. 176, no. 1, pp. 191–199, 2008.
[37] E. C. Kumbur, K. V. Sharp, and M. M. Mench, “Validatedleverett approach for multiphase flow in PEFC diffusion media.I. Hydrophobicity effect,” Journal of the Electrochemical Society,vol. 154, no. 12, pp. B1295–B1304, 2007.
[38] E. C.Kumbur, K.V. Sharp, andM.M.Mench, “Validated leverettapproach for multiphase flow in PEFC diffusion media: II.Compression effect,” Journal of the Electrochemical Society, vol.154, no. 12, pp. B1305–B1314, 2007.
[39] E. C. Kumbur, K. V. Sharp, and M. M. Mench, “Validatedleverett approach for multiphase flow in PEFC diffusion media:

16 Journal of Chemistry
III. Temperature effect and unified approach,” Journal of theElectrochemical Society, vol. 154, no. 12, pp. B1315–B1324, 2007.
[40] J. T.Gostick,M.W. Fowler,M.A. Ioannidis,M.D. Pritzker, Y.M.Volfkovich, and A. Sakars, “Capillary pressure and hydrophilicporosity in gas diffusion layers for polymer electrolyte fuel cells,”Journal of Power Sources, vol. 156, no. 2, pp. 375–387, 2006.
[41] M. Acosta, C. Merten, G. Eigenberger et al., “Modeling non-isothermal two-phase multicomponent flow in the cathode ofPEM fuel cells,” Journal of Power Sources, vol. 159, no. 2, pp. 1123–1141, 2006.
[42] J. D. Fairweather, P. Cheung, J. St-Pierre, and D. T. Schwartz,“A microfluidic approach for measuring capillary pressure inPEMFCgas diffusion layers,”Electrochemistry Communications,vol. 9, no. 9, pp. 2340–2345, 2007.
[43] J. T. Gostick, M. A. Ioannidis, M.W. Fowler, andM. D. Pritzker,“Direct measurement of the capillary pressure characteristicsof water-air-gas diffusion layer systems for PEM fuel cells,”Electrochemistry Communications, vol. 10, no. 10, pp. 1520–1523,2008.
[44] T. V. Nguyen, G. Lin, H. Ohn, and X. Wang, “Measurementof capillary pressure property of gas diffusion media used inproton exchange membrane fuel cells,” Electrochemical andSolid-State Letters, vol. 11, no. 8, pp. B127–B131, 2008.
[45] T. Koido, T. Furusawa, and K. Moriyama, “An approach tomodeling two-phase transport in the gas diffusion layer of aproton exchange membrane fuel cell,” Journal of Power Sources,vol. 175, no. 1, pp. 127–136, 2008.
[46] K. G. Gallagher, R. M. Darling, T.W. Patterson, andM. L. Perry,“Capillary pressure saturation relations for PEM fuel cell gasdiffusion layers,” Journal of the Electrochemical Society, vol. 155,no. 11, pp. B1225–B1231, 2008.
[47] D. Rensink, J. Roth, and S. Fell, “Liquid water transport anddistribution in fibrous porous media and gas channels,” in Pro-ceedings of the 6th International Conference on Nanochannels,Microchannels, and Minichannels (ICNMM ’08), pp. 1271–1277,Darmstadt, Germany, June 2008.
[48] P. Cheung, J. D. Fairweather, and D. T. Schwartz, “Characteri-zation of internal wetting in polymer electrolyte membrane gasdiffusion layers,” Journal of Power Sources, vol. 187, no. 2, pp.487–492, 2009.
[49] I. R. Harkness, N. Hussain, L. Smith, and J. D. B. Sharman, “Theuse of a novel water porosimeter to predict the water handlingbehaviour of gas diffusion media used in polymer electrolytefuel cells,” Journal of Power Sources, vol. 193, no. 1, pp. 122–129,2009.
[50] J. T. Gostick, M. A. Ioannidis, M.W. Fowler, andM. D. Pritzker,“On the role of the microporous layer in PEMFC operation,”Electrochemistry Communications, vol. 11, no. 3, pp. 576–579,2009.
[51] J. T. Gostick, M. A. Ioannidis, M.W. Fowler, andM. D. Pritzker,“Wettability and capillary behavior of fibrous gas diffusionmedia for polymer electrolyte membrane fuel cells,” Journal ofPower Sources, vol. 194, no. 1, pp. 433–444, 2009.
[52] J. D. Fairweather, P. Cheung, and D. T. Schwartz, “The effectsof wetproofing on the capillary properties of proton exchangemembrane fuel cell gas diffusion layers,” Journal of PowerSources, vol. 195, no. 3, pp. 787–793, 2010.
[53] L. Hao and P. Cheng, “Capillary pressures in carbon paper gasdiffusion layers having hydrophilic and hydrophobic pores,”International Journal of Heat and Mass Transfer, vol. 55, no. 1–3,pp. 133–139, 2012.
[54] J. T. Gostick, M. A. Ioannidis, M.W. Fowler, andM. D. Pritzker,“Chapter 7: characterization of the capillary properties of gasdiffusion media,” in Modeling and Diagnostics of Polymer Elec-trolyte Fuel Cells, vol. 49 ofModern Aspects of Electrochemistry,pp. 225–254, Springer, New York, NY, USA, 2010.
[55] J. T. Gostick, H. Gunterman, B. Kienitz, J. Newman, A.MacDowell, and A. Weber, “Tomographic imaging of waterinjection and withdrawal in PEMFC gas diffusion layers,” ECSTransactions, vol. 33, no. 1, pp. 1407–1412, 2010.
[56] J. T. Gostick, M. A. Ioannidis, M. D. Pritzker, andM.W. Fowler,“Impact of liquid water on reactant mass transfer in PEM fuelcell electrodes,” Journal of the Electrochemical Society, vol. 157,no. 4, pp. B563–B571, 2010.
[57] J. T. Gostick, “Random pore network modeling of GDLs usingVoronoi and Delaunay tessellations,” ECS Transactions, vol. 41,no. 1, pp. 125–130, 2011.
[58] K. P. Shrestha and J. T. Gostick, “Measurement of capillarypressure curves in GDLs at elevated temperatures,” ECS Trans-actions, vol. 50, no. 2, pp. 469–476, 2013.
[59] T. V. Nguyen, G. Lin, H. Ohn, D. Hussey, D. Jacobson, and M.Arif, “Measurements of two-phase flow properties of the porousmedia used in PEM fuel cells,” ECS Transactions, vol. 3, no. 1, pp.415–423, 2006.
[60] J. D. Sole and M. W. Ellis, “Determination of the relationshipbetween capillary pressure and saturation in PEMFC gas diffu-sion media,” in Proceedings of the 6th International Conferenceon Fuel Cell Science, Engineering, and Technology, pp. 829–840,Denver, Colo, USA, June 2008.
[61] U. Pasaogullari and C. Y. Wang, “Liquid water transport in gasdiffusion layer of polymer electrolyte fuel cells,” Journal of theElectrochemical Society, vol. 151, no. 3, pp. A399–A406, 2004.
[62] W.-M. Yan, D.-K. Wu, X.-D. Wang, A.-L. Ong, D.-J. Lee, and A.Su, “Optimalmicroporous layer for proton exchangemembranefuel cell,” Journal of Power Sources, vol. 195, no. 17, pp. 5731–5734,2010.
[63] X.-D. Wang, X.-X. Zhang, W.-M. Yan, D.-J. Lee, and A. Su,“Non-isothermal effects of single or double serpentine protonexchange membrane fuel cells,” Electrochimica Acta, vol. 55, no.17, pp. 4926–4934, 2010.
[64] C. Lim and C. Y. Wang, “Measurement of contact angles ofliquid water in PEM fuel cell gas diffusion layer (GDL) bysessile drop and capillary rise methods,” Penn State UniversityElectrochemical Engine Center (ECEC) Technical Report 2001-03, Penn State University, State College, Pa, USA, 2001.
[65] M. Mathias, J. Roth, W. Lehnert, and J. Fleming, Handbook ofFuel Cells—Fundamentals, Technology and Applications, vol. 3,chapter 42, John Wiley & Sons, New York, NY, USA, 2003.
[66] X. D. Wang, X. F. Peng, and B. X. Wang, “Contact angle hys-teresis and hysteresis tension on rough solid surface,” ChineseJournal of Chemical Engineering, vol. 12, no. 5, pp. 615–621, 2004.
[67] X. D. Wang, D. J. Lee, X. F. Peng, and J. Y. Lai, “Spreadingdynamics and dynamic contact angle of non-newtonian fluids,”Langmuir, vol. 12, no. 15, pp. 8042–8047, 2007.
[68] X. D. Wang, Y. Zhang, D. J. Lee, and X. F. Peng, “Spreading ofcompletely wetting or partially wetting power-law fluid on solidsurface,” Langmuir, vol. 23, no. 18, pp. 9258–9262, 2007.
[69] W. L. Gao, Petrophysics, China University of Petroleum Press,Beijing, China, 2009.
[70] T. A. Trabold, J. P. Owejan, D. L. Jacobson, M. Arif, andP. R. Huffman, “In situ investigation of water transport inan operating PEM fuel cell using neutron radiography: part

Journal of Chemistry 17
1—experimental method and serpentine flow field results,”International Journal of Heat and Mass Transfer, vol. 49, no. 25-26, pp. 4712–4720, 2006.
[71] R. Satija, D. L. Jacobson, M. Arif, and S. A. Werner, “In situneutron imaging technique for evaluation ofwatermanagementsystems in operating PEM fuel cells,” Journal of Power Sources,vol. 129, no. 2, pp. 238–245, 2004.
[72] Z. Lu, S. G. Kandlikar, C. Rath et al., “Water managementstudies in PEM fuel cells—part II: ex situ investigation of flowmaldistribution, pressure drop and two-phase flow pattern ingas channels,” International Journal of Hydrogen Energy, vol. 34,no. 8, pp. 3445–3456, 2009.
[73] J. Becker, V. Schulz, and A. Wiegmann, “Numerical determina-tion of two-phase material parameters of a gas diffusion layerusing tomography images,” Journal of Fuel Cell Science andTechnology, vol. 5, no. 2, Article ID 021006, 2008.
[74] V. P. Schulz, J. Becker, A. Wiegmann, P. P. Mukherjee, and C.-Y. Wang, “Modeling of two-phase behavior in the gas diffusionmedium of PEFCs via full morphology approach,” Journal of theElectrochemical Society, vol. 154, no. 4, pp. B419–B426, 2007.
[75] N. R. Morrow and N. Mungan, “Wettability and capillary inporous media,” Report RR-7, Petroleum Recovery ResearchInstitute, Calgary, Canada, 1971.
[76] N. R. Morrow, “Capillary pressure correlations for uniformlywetted porous media,” Journal of Canadian Petroleum Technol-ogy, vol. 15, no. 4, pp. 49–69, 1976.
[77] H.-K. Lee, J.-H. Park, D.-Y. Kim, and T.-H. Lee, “A study on thecharacteristics of the diffusion layer thickness and porosity ofthe PEMFC,” Journal of Power Sources, vol. 131, no. 1-2, pp. 200–206, 2004.
[78] C. S. Kong, D.-Y. Kim, H.-K. Lee, Y.-G. Shul, and T.-H. Lee,“Influence of pore-size distribution of diffusion layer on mass-transport problems of proton exchange membrane fuel cells,”Journal of Power Sources, vol. 108, no. 1-2, pp. 185–191, 2002.
[79] L. R. Jordan, A. K. Shukla, T. Behrsing, N. R. Avery, B. C.Muddle, and M. Forsyth, “Effect of diffusion-layer morphologyon the performance of polymer electrolyte fuel cells operating atatmospheric pressure,” Journal of Applied Electrochemistry, vol.30, no. 6, pp. 641–646, 2000.
[80] E. Passalacqua, G. Squadrito, F. Lufrano, A. Patti, and L. Giorgi,“Effects of the diffusion layer characteristics on the performanceof polymer electrolyte fuel cell electrodes,” Journal of AppliedElectrochemistry, vol. 31, no. 4, pp. 449–454, 2001.
[81] E. Antolini, A. Pozio, L. Giorgi, and E. Passalacqua, “Morpho-logical characteristics of carbon/polytetrafluoroethylene filmsdeposited on porous carbon support,” Journal of MaterialsScience, vol. 33, no. 7, pp. 1837–1843, 1998.
[82] M. V. Williams, E. Begg, L. Bonville, H. R. Kunz, and J. M.Fenton, “Characterization of gas diffusion layers for PEMFC,”Journal of the Electrochemical Society, vol. 151, no. 8, pp. A1173–A1180, 2004.
[83] J. Ihonen, M. Mikkola, and G. Lindbergh, “Flooding of gasdiffusion backing in PEFCs: physical and electrochemical char-acterization,” Journal of the Electrochemical Society, vol. 151, no.8, pp. A1152–A1161, 2004.
[84] M. Prasanna, H. Y. Ha, E. A. Cho, S. A. Hong, and I. H. Oh,“Influence of cathode gas diffusion media on the performanceof the PEMFCs,” Journal of Power Sources, vol. 131, no. 1-2, pp.147–154, 2004.
[85] J. T. Gostick, Multiphase mass transfer and capillary propertiesof gas diffusion layers for polymer electrolyte membrane fuel cells[Ph.D. thesis], The University of Waterloo, 2008.
[86] J. Sole, Investigation of water transport parameters and processesin the gas diffusion layer of PEM fuel cells [Ph.D. thesis], VirginiaPoly Technical Institute, Blacksburg, Va, USA, 2008.
[87] J. Divisek, R. Wilkenhoner, and Y. Volfkovich, “Structureinvestigations of SOFC anode cermets. Part I. Porosity inves-tigations,” Journal of Applied Electrochemistry, vol. 29, no. 2, pp.153–163, 1999.
[88] J. Divisek, M. Eikerling, V. Mazin, H. Schmitz, U. Stimming,and Y. M. Volfkovich, “A study of capillary porous structureand sorption properties of nafion proton-exchange membranesswollen in water,” Journal of the Electrochemical Society, vol. 145,no. 8, pp. 2677–2683, 1998.
[89] J. H. Nam and M. Kaviany, “Effective diffusivity and water-saturation distribution in single- and two-layer PEMFC diffu-sion medium,” International Journal of Heat and Mass Transfer,vol. 46, no. 24, pp. 4595–4611, 2003.
[90] G. Y. Lin and T. V. Van Nguyen, “A two-dimensional two-phasemodel of a PEM fuel cell,” Journal of the Electrochemical Society,vol. 153, no. 2, pp. A372–A382, 2006.
[91] D. Natarajan and T. Van Nguyen, “A two-dimensional, two-phase, multicomponent, transient model for the cathode of aproton exchange membrane fuel cell using conventional gasdistributors,” Journal of the Electrochemical Society, vol. 148, no.12, pp. a1324–a1335, 2001.
[92] X. D. Wang and C. Si, “The efforts of gas diffusion layer prop-erties on the performance of proton exchange membrane fuelcell: a following study based on experimental measurementsof gas diffusion layers,” Tech. Rep. 2014-02, Department ofRenewable Energy of North China Electric Power University,Beijing, China, 2014.

Submit your manuscripts athttp://www.hindawi.com
Hindawi Publishing Corporationhttp://www.hindawi.com Volume 2014
Inorganic ChemistryInternational Journal of
Hindawi Publishing Corporation http://www.hindawi.com Volume 2014
International Journal ofPhotoenergy
Hindawi Publishing Corporationhttp://www.hindawi.com Volume 2014
Carbohydrate Chemistry
International Journal of
Hindawi Publishing Corporationhttp://www.hindawi.com Volume 2014
Journal of
Chemistry
Hindawi Publishing Corporationhttp://www.hindawi.com Volume 2014
Advances in
Physical Chemistry
Hindawi Publishing Corporationhttp://www.hindawi.com
Analytical Methods in Chemistry
Journal of
Volume 2014
Bioinorganic Chemistry and ApplicationsHindawi Publishing Corporationhttp://www.hindawi.com Volume 2014
SpectroscopyInternational Journal of
Hindawi Publishing Corporationhttp://www.hindawi.com Volume 2014
The Scientific World JournalHindawi Publishing Corporation http://www.hindawi.com Volume 2014
Medicinal ChemistryInternational Journal of
Hindawi Publishing Corporationhttp://www.hindawi.com Volume 2014
Chromatography Research International
Hindawi Publishing Corporationhttp://www.hindawi.com Volume 2014
Applied ChemistryJournal of
Hindawi Publishing Corporationhttp://www.hindawi.com Volume 2014
Hindawi Publishing Corporationhttp://www.hindawi.com Volume 2014
Theoretical ChemistryJournal of
Hindawi Publishing Corporationhttp://www.hindawi.com Volume 2014
Journal of
Spectroscopy
Analytical ChemistryInternational Journal of
Hindawi Publishing Corporationhttp://www.hindawi.com Volume 2014
Journal of
Hindawi Publishing Corporationhttp://www.hindawi.com Volume 2014
Quantum Chemistry
Hindawi Publishing Corporationhttp://www.hindawi.com Volume 2014
Organic Chemistry International
ElectrochemistryInternational Journal of
Hindawi Publishing Corporation http://www.hindawi.com Volume 2014
Hindawi Publishing Corporationhttp://www.hindawi.com Volume 2014
CatalystsJournal of