review of incident management teamwork and multi-agency
TRANSCRIPT
BBuusshhffiirree CCRRCC in partnership with
UUnniivveerrssiittyy ooff TTaassmmaanniiaa
AIIMS National Report - December 2009
Review of Incident Management Teamwork
and multi-agency collaboration
Dr Christine Owen and
Ian Dwyer (PhD candidate)
State Coord
Regional Coord
IMT IC/ Officers
IMT Func units
Div/Sec Comm
Crew/ Strike
Team-working
Preoccupation with failure
Within Teams
Shift Resources
Temporal responsiveness
Distributed Sense-making
Between Teams
Flexibility
Systemic Capability
Personnel Capability
Intra-organisational
Organisational Impediments
Inter-organisational
Inter-operability
Serious Concern
Attention Required
Some Concerns
Neutral Positive
Table of Contents List of Tables............................................................................................................. iv
List of Figures............................................................................................................vi
List of Appendices..................................................................................................... ix
Executive Summary.................................................................................................i
1. Introduction ........................................................................................................ 1
1.1. The Australasian Inter-service Incident Management System.................... 2
1.2. Teamwork and coordination in dynamic environments............................... 2
1.2.1. Teamwork and AIIMS......................................................................... 5
1.3. Aim of this research ................................................................................... 8
2. Research method............................................................................................... 9
2.1. Development of the survey ........................................................................ 9
2.1.1. Evaluation of the survey ..................................................................... 9
2.2. Structure of the survey............................................................................. 10
2.3. Distribution of the survey.......................................................................... 13
2.4. Analyses .................................................................................................. 14
2.5. Possible limitations of the study ............................................................... 15
2.6. Demographics of the sample ................................................................... 16
2.6.1. Functional areas of respondents ...................................................... 16
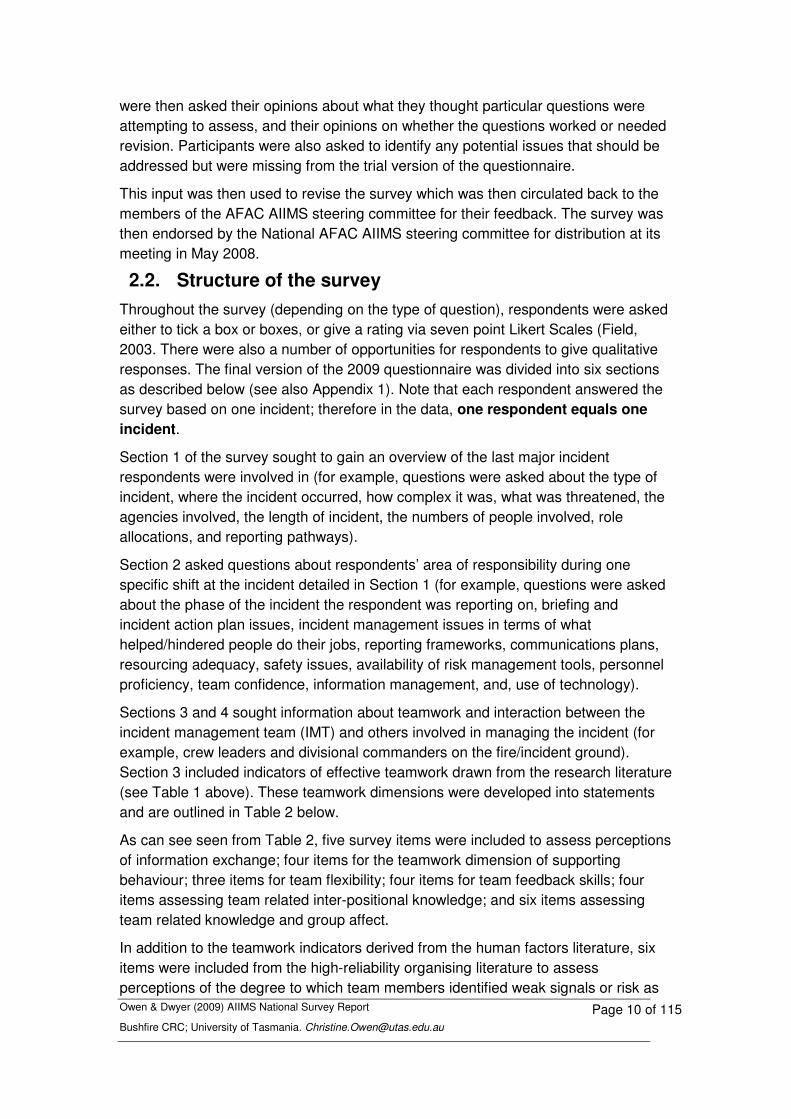
2.6.1.1. Gender and incident management ................................................... 17
2.6.2. The agency sample.......................................................................... 20
2.6.3. Agency Functions............................................................................. 21
2.6.4. Summary.......................................................................................... 23
3. Types of emergency incidents managed .......................................................... 24
3.1. Emergency threats................................................................................... 25
3.2. Complexity of incidents managed ............................................................ 25
3.3. Personnel engaged in the emergency...................................................... 27
3.4. Supporting agencies involved .................................................................. 27
3.4.1. Summary.......................................................................................... 29
4. Processes supporting information flow within AIIMS......................................... 30
4.1. Information flow on arrival at the incident ................................................. 30
4.2. Information flow during an incident........................................................... 35
4.2.1. Use of an Incident Action Plan ......................................................... 35
4.2.2. Risk management and assessment tools ......................................... 39
4.2.3. Span of control ................................................................................. 40
4.2.4. Safety processes.............................................................................. 41
4.2.5. Gender differences in incident management .................................... 41
4.2.6. Factors that prevented personnel from doing their job effectively ..... 43
4.2.7. Job prevention factors and incident phase ....................................... 45
4.2.8. Job prevention factors and demographic data.................................. 46
4.2.9. Summary.......................................................................................... 46
5. Teamwork and distributed interaction............................................................... 49
5.1. Teamwork................................................................................................ 49
5.2. Descriptive analyses of teamwork dimensions ......................................... 51
5.2.1. Information Exchange ...................................................................... 51
5.2.2. Supporting Behaviour....................................................................... 51
5.2.3. Flexibility .......................................................................................... 52
5.2.4. Team Feedback ............................................................................... 52
5.2.5. Inter-positional Knowledge ............................................................... 53
5.2.6. Team Attitudes and Affect ................................................................ 54
5.2.7. Pre-occupation with failure ............................................................... 54
5.2.8. Additional operational items ............................................................. 57
5.3. Team-related interactions between the IMT and the ground .................... 58
5.3.1. Information Exchange between the IMT and the ground .................. 58
5.3.2. Supporting Behaviour between the IMT and the ground................... 59
5.3.3. Flexibility between the IMT and the ground ...................................... 60
5.4. Team-related Feedback between the IMT and the ground....................... 61
5.4.1. Inter-positional Knowledge sharing between the IMT and the ground63
5.4.2. Team-related Attitudes and Affect between the IMT and the ground 64
5.4.3. Summary.......................................................................................... 65
6. Organisational Processes ................................................................................ 67
6.1.1. Systemic organisational capability.................................................... 67
6.1.2. Organisational processes supporting personnel capability ............... 69
6.1.3. Summary.......................................................................................... 72

7. Factors enhancing and inhibiting incident management effectiveness.............. 73
7.1. Four teamwork conditions ........................................................................ 73
7.1.1. Team working .................................................................................. 73
7.1.2. Preoccupation with failure ................................................................ 75
7.1.3. Shift resources ................................................................................. 76
7.1.4. Temporal responsiveness ................................................................ 77
7.2. IMT-Ground interaction factors ................................................................ 78
7.2.1. Distributed sense-making................................................................. 79
7.2.2. Flexibility conditions ......................................................................... 80
7.3. Organisational Process factors ................................................................ 82
7.3.1. Systemic capability........................................................................... 82
7.3.2. Personnel capability ......................................................................... 83
7.3.3. Organisational impediments............................................................. 84
7.3.4. Inter-agency inter-operability ............................................................ 85
7.3.5. Summary.......................................................................................... 86
7.4. Factors preventing work effectiveness ..................................................... 87
8. Conclusion and implications of the research .................................................... 89
8.1. Directions for future research................................................................... 92
9. References....................................................................................................... 95
List of Tables Table 1: Dimensions of effective teamwork ............................................................... 4
Table 2: Features important in team-based work activity IMTs and multi-agency collaborations .......................................................................................................... 12
Table 3: Comparison of age within IMT roles........................................................... 18
Table 4: Comparison of experience levels ............................................................... 19
Table 5: Number of supporting agencies cross tabulated with incident ICS level..... 25
Table 6: Number of agencies involved at peak of incident ....................................... 28
Table 7: Number of supporting agencies cross-tabulated with incident levels.......... 29
Table 8: A 2003 and 2008 data comparison of information flow and readiness to perform particular roles ........................................................................................... 30
Table 9: An incident phase comparison of information flow and readiness to perform the role prior to or on arrival at the incident ............................................................. 32
Table 10: Cross tabulation of 2003 and 2008 data in relation to briefings................ 33
Table 11: A cross-tabulation of whether the respondents were given a briefing by phase of incident .................................................................................................... 33
Table 12: A cross-tabulation of the identification of alternative strategies in the briefing (where one was received) by incident level................................................. 35
Table 13: Cross-tabulation between receipt of an Incident Action Plan and the incident phase......................................................................................................... 36
Table 14: Cross-tabulation of the incident phase by whether the Incident Action Plan included predictions of the development of the incident........................................... 38
Table 15: Cross-tabulation between incident complexity and the inclusion of prediction of development in the Incident Action Plan.............................................. 38
Table 16: Number of persons reporting directly to the respondent cross-tabulated with incident phases................................................................................................ 40
Table 17: A cross-tabulation of questions: Were safety issues identified? and Was there a formal process to identify potential safety issues?....................................... 41
Table 18: Respondents witnessing or experiencing discrimination ......................... 43
Table 19: Types of discrimination experienced and witnessed by female and male respondents ............................................................................................................ 43
Table 20: Number of respondents within AIIMS work- teams .................................. 50
Table 21: “Team working” –1st Factor (PCA of Survey Section 3)............................ 74
Table 22: “Discussion of Weaknesses– pre-occupation with failure” –2nd Factor (PCA Survey Section 3) .......................................................................................... 76
Table 23: “Shift Resources” – 3rd Factor (PCA Survey Section 3)........................... 77
Table 24: “Temporal Responsiveness” –4th Factor (PCA Section 3) ........................ 78
Table 25: “Distributed Sense making” –1st Factor (PCA Survey Section 4).............. 79
Table 26: “Flexibility” –2nd Factor (PCA Survey Section 4)....................................... 80
Table 27: “Systemic Capability” –1st Factor (PCA Section 5) ................................... 82
Table 28: “Personnel Capability” –2nd Factor (PCA Survey Section 5).................... 83
Table 29: “Organisational Impediments” –3rd Factor (PCA Survey Section 5).......... 85
Table 30: “Inter-operability” –4th Factor (PCA Survey Section 5) ............................ 86
Table 31: Discriminant Function Analysis of factors that predict job prevention ....... 88
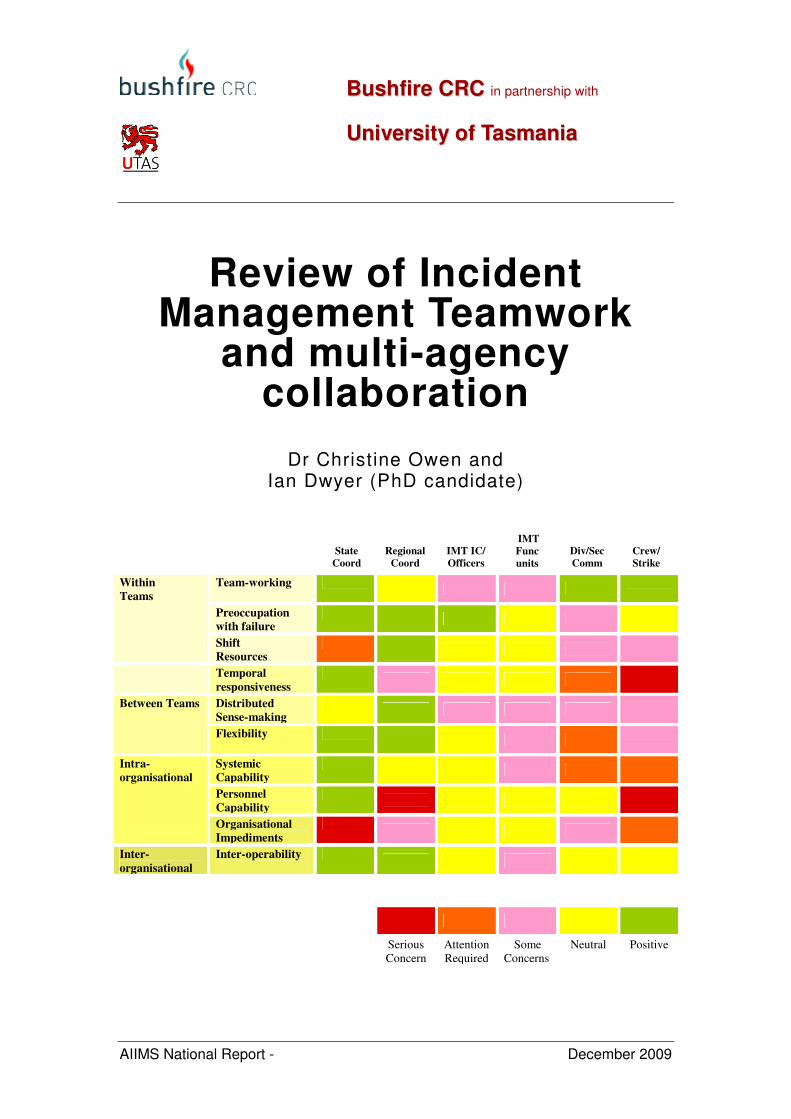
Table 32: Diagnosis of Incident Management Teamwork and Coordination ............ 89

List of Figures Figure 1: AIIMS Structure .......................................................................................... 6
Figure 2: Respondent functional areas.................................................................... 16
Figure 3: Gender and participation in incident management.................................... 17
Figure 4: Age of respondents .................................................................................. 17
Figure 5: Comparison of the age of male & female respondents ............................. 18
Figure 6: Comparison: The phase of the incident in which the reported shift lies.... 20
Figure 7: Comparison: How long the incident was underway before attendance .... 20
Figure 8: Number of responses from each agency .................................................. 21
Figure 9: Functions of agencies responding to AIIMS National Survey 2008........... 21
Figure 10: Number of responses by location ........................................................... 22
Figure 11: Year of incident reported ........................................................................ 22
Figure 12: Comparison of incident type ................................................................... 24
Figure 13: Overlaps between types of incidents ..................................................... 25
Figure 14: Comparison of incident levels................................................................. 26
Figure 15: Respondents' perceived levels of complexity of ICS level 3 incidents.... 27
Figure 16: Number of people involved at peak of incident ....................................... 27
Figure 17: Supporting agencies reported at incidents.............................................. 28
Figure 18: A state comparison of information flow and readiness to perform the role prior to or on arrival at the incident .......................................................................... 32
Figure 19: Content of the briefing ............................................................................ 34
Figure 20: Did you receive an Incident Action Plan: 2003 and 2008. ....................... 36
Figure 21: Comparison between all agencies in 2003 and 2008: Did the Incident Action Plan (where one was received) include certain items? ................................. 37
Figure 22: Comparison between all agencies in 2003 and 2008 of the availability of risk management tools ............................................................................................ 39
Figure 23: Workplace climate rating questions (1=low, 7=high): Comparison between male and female (2008) .......................................................................................... 42
Figure 24: Job prevention factors in each phase of the incident .............................. 46
Figure 25: Team members effectively monitored each other’s performance............ 52
Figure 26: The IMT was 'ahead of the game'........................................................... 53
Figure 27: We effectively achieved our tasks........................................................... 54
Figure 28: The team constructively discussed lack of clear information as a potential weakness ................................................................................................................ 56

Figure 29: The team constructively discussed lack of resources as a potential weakness ................................................................................................................ 56
Figure 30: The team constructively discussed external influences as a potential weakness ................................................................................................................ 57
Figure 31: There was a pre-determined frequency for situation reporting from the operations area of the fire-incident ground .............................................................. 59
Figure 32: Personnel activities were coordinated to achieve the best outcome ....... 60
Figure 33: Strategies were adjusted in a timely manner as the incident unfolded .... 60
Figure 34: Roles were effectively re-allocated as the situation changed.................. 61
Figure 35: Personnel provided helpful advice to one another .................................. 62
Figure 36: Personnel provided constructive feedback to each other........................ 62
Figure 37: Personnel felt that they contributed to the decision making .................... 63
Figure 38: IMT Fire/Incident Ground Personnel anticipated the needs of others...... 64
Figure 39: IMT Fire/Incident Ground Personnel were able to state and maintain opinions openly with each other .............................................................................. 65
Figure 40: IMT Fire/Incident Ground Personnel trusted each other ......................... 65
Figure 41: Effectiveness of the organisational framework........................................ 68
Figure 42: Level of inclusion in the decision making process................................... 68
Figure 43: Adequacy of information provided at changeover ................................... 69
Figure 44: Your level of informal knowledge (experience) ....................................... 70
Figure 45: Your familiarity with the Incident Management System (IMS) being used70
Figure 46: Your training for the incident at hand ...................................................... 70
Figure 47: Your understanding of the policies and procedures used during the incident.................................................................................................................... 71
Figure 48: Your certainty of what needed to be done .............................................. 71
Figure 49: Your understanding of who to contact for information and expertise....... 71
Figure 50: Plotted T-score means for Team working factor ..................................... 75
Figure 51: Plotted T-score means for Discussion of Weaknesses- Preoccupation with failure factor ............................................................................................................ 76
Figure 52: Plotted T-score means for shift resources factor..................................... 77
Figure 53: Plotted T-score means for temporal responsiveness factor .................... 78
Figure 54: Plotted T-score means for distributed sense-making factor .................... 80
Figure 55: Plotted T-score means for Flexibility factor ............................................. 81
Figure 56: Plotted T-score means for Systemic Capability factor............................. 83
Figure 57: Plotted T-score means for Personnel capability factor ............................ 84

Figure 58: Plotted T-score means for Organisational Impediments factor (reversed scores) .................................................................................................................... 85
Figure 59: Plotted T-score means for Inter-operability factor ................................... 86
Figure 60: Cross tabulation of T-score means by factors preventing doing job effectively ................................................................................................................ 87
List of Appendices
Appendix 1: National AIIMS Survey
Appendix 2: Survey distribution instructions and contact list
Appendix 3: Kruskal Wallis comparision of mean-ranks based on individual likert-type items for Teamwork; Interaction between the IMT and the fire-or incident-ground and organisational processes underpinning AIIMS
Appendix 4: Principal Components Analysis and Discriminant Function Analysis details

Acknowledgements
The authors would sincerely like to acknowledge the support of the Bushfire CRC, AFAC and the personnel from the agencies involved in completing the survey. A special thank you goes to Sandra Lunardi for her tireless efforts and support as well as to the members of the AFAC AIIMS Steering Committee.
Closer to the office, large bouquets must flow to Debbie Vogel, Kirsty Vogel and Simone Bett, without whom this work would not have been so well illustrated or presented. Thanks also to Jan Douglas and Gregory Hickey for their part with some of the literature review and contextual documentation.

Owen & Dwyer (2009) AIIMS National Survey Report – Executive Summary i Bushfire CRC; University of Tasmania. [email protected]
Executive Summary The study reported here is the first systematic review of Australia's emergency Incident Management System to be conducted since its national introduction in 2004. The report is based on 579 responses from fire and emergency services personnel who worked within 25 agencies representing all Australian states and territories and also includes a sample from New Zealand. The purpose of the survey was to:
• Review information and communication flows;
• Review how teams work with the AIIMS system;
• Identify opportunities for improvement.
The survey included a number of questions which were the same as items included in a 2003 questionnaire conducted the Australasian Fire Authorities Council (AFAC) as a precursor to the formal adoption of the Australasian Inter-service Incident Management System (AIIMS)as the national system in Australia. This meant it was possible to make comparisons with the 2003 baseline data which provided insights into how the system had evolved over the past five years.
The survey was divided into six sections which sought information about:
• the incident itself (for example, type, complexity, duration of the incident
• the area of responsibility of the respondent, and activity during a particular shift (which included information in relation to reporting pathways; briefings, Incident Action Plans, use of risk management and assessment tools, what helped/hindered people do their jobs, communication plans, resourcing and safety issues);
• perceptions of teamwork as well as identification of which team the respondent worked within (state or regional levels of coordination; within an Incident Management Team; on the Ground as a Division or Sector Commander; Crew Leader or within a strike team or equivalent).
• Perceptions of interaction between the Incident Management Team and those working on the fire/incident ground;
• levels of satisfaction with AIIMS/organisational procedures and processes; and
• respondent demographics.
In reading the results it is important to realise, therefore, that one response (respondent) equates to one incident
The nature of the incidents reported on are largely forest/scrub fires. Also included are fires on the urban/rural interface, structure fires as well as cyclones, floods and storms. The majority of incidents reported (71%) are ICS Level 3 incidents. These incidents were complex in nature, involving a large number of people in managing the incident. Close to one third of incidents (27.4%) involved more than 250 people at

Owen & Dwyer (2009) AIIMS National Survey Report – Executive Summary ii Bushfire CRC; University of Tasmania. [email protected]
the peak of the incident. They also required a large amount of inter-agency cooperation. Close to one half of all incidents (47%) involved seven or more support agencies.
There is a wide diversity of perceived complexity reported in ICS Level 3 incidents. Given the diversity of complexity in Level 3 incidents one question that arises is in relation to whether the current 3 ICS levels are sufficiently differentiated to provide the requisite triggers for the appropriate level of emergency management response.
Although there were 54 incidents reported from urban brigades, there is no national agreement on what constitutes an “alarm level” (used instead of ICS Level) and so it is not possible to prepare any national data or comparisons on urban brigade use of AIIMS. This seems a wasted opportunity to learn from the urban agency responses and to share data on systemic performance for urban brigades.
There were four areas in particular where findings could be compared with data collected in 2003 to ascertain how the AIIMS system has evolved over the five year period since its national introduction.
The first area assessed information flow prior to arrival at the incident. The survey sought information on awareness of role to be performed at the incident; clarity of who to report to on arrival and ability of the respondent to report to the designated person when they had arrived. The survey indicates that a high proportion of personnel (between 73-76%) were able to fulfil these tasks, however the survey also shows that since 2003:
• the proportion of persons who were advised of the role they would be performing prior to arrival at the incident has declined;
• being clear about who to report to on arrival has remained stable and
• being able to report to the designated person has declined.
The second area of comparison was information flow on arrival at the incident. On arrival at the incident 80% of personnel received a briefing (which is commensurate with the 2003 results). Of the 111 people who did not receive a briefing only 37 of them were reporting at the beginning of an incident. Most personnel felt comfortable asking questions, and felt their input was valued at the briefing. However, there are gender differences, with women reporting less comfort asking clarification questions during a briefing. Women were also more likely than men to experience factors that prevented them effectively doing their job.
The majority of briefings explained the current situation; explained what had happened so far; provided an outline of the objectives, strategies and rationale for managing the incident. Information provided identifying current and expected resourcing in the briefing had increased since 2003. Survey results show a low reporting that information on alternative strategies (in either a briefing or in an Incident Action Plan) was provided. Only one third (38%) of personnel reported having information on alternative strategies, even when the incident was a complex Level 3 incident.
Owen & Dwyer (2009) AIIMS National Survey Report – Executive Summary iii Bushfire CRC; University of Tasmania. [email protected]
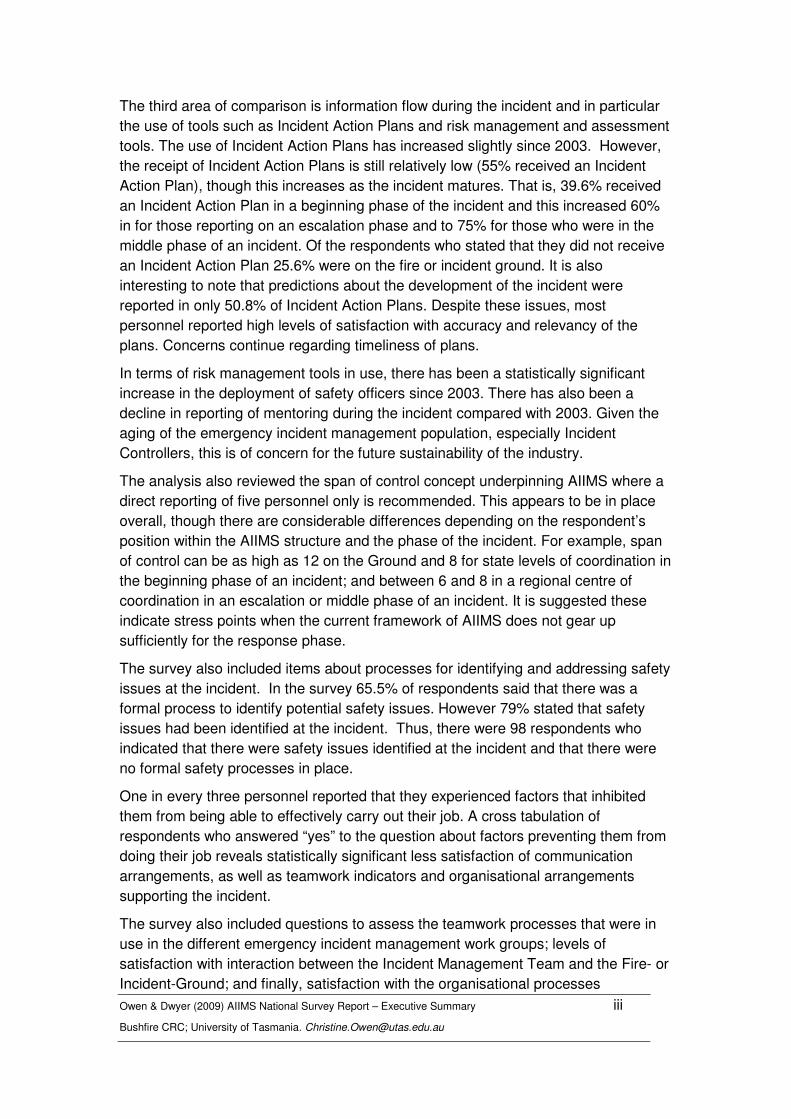
The third area of comparison is information flow during the incident and in particular the use of tools such as Incident Action Plans and risk management and assessment tools. The use of Incident Action Plans has increased slightly since 2003. However, the receipt of Incident Action Plans is still relatively low (55% received an Incident Action Plan), though this increases as the incident matures. That is, 39.6% received an Incident Action Plan in a beginning phase of the incident and this increased 60% in for those reporting on an escalation phase and to 75% for those who were in the middle phase of an incident. Of the respondents who stated that they did not receive an Incident Action Plan 25.6% were on the fire or incident ground. It is also interesting to note that predictions about the development of the incident were reported in only 50.8% of Incident Action Plans. Despite these issues, most personnel reported high levels of satisfaction with accuracy and relevancy of the plans. Concerns continue regarding timeliness of plans.
In terms of risk management tools in use, there has been a statistically significant increase in the deployment of safety officers since 2003. There has also been a decline in reporting of mentoring during the incident compared with 2003. Given the aging of the emergency incident management population, especially Incident Controllers, this is of concern for the future sustainability of the industry.
The analysis also reviewed the span of control concept underpinning AIIMS where a direct reporting of five personnel only is recommended. This appears to be in place overall, though there are considerable differences depending on the respondent’s position within the AIIMS structure and the phase of the incident. For example, span of control can be as high as 12 on the Ground and 8 for state levels of coordination in the beginning phase of an incident; and between 6 and 8 in a regional centre of coordination in an escalation or middle phase of an incident. It is suggested these indicate stress points when the current framework of AIIMS does not gear up sufficiently for the response phase.
The survey also included items about processes for identifying and addressing safety issues at the incident. In the survey 65.5% of respondents said that there was a formal process to identify potential safety issues. However 79% stated that safety issues had been identified at the incident. Thus, there were 98 respondents who indicated that there were safety issues identified at the incident and that there were no formal safety processes in place.
One in every three personnel reported that they experienced factors that inhibited them from being able to effectively carry out their job. A cross tabulation of respondents who answered “yes” to the question about factors preventing them from doing their job reveals statistically significant less satisfaction of communication arrangements, as well as teamwork indicators and organisational arrangements supporting the incident.
The survey also included questions to assess the teamwork processes that were in use in the different emergency incident management work groups; levels of satisfaction with interaction between the Incident Management Team and the Fire- or Incident-Ground; and finally, satisfaction with the organisational processes

Owen & Dwyer (2009) AIIMS National Survey Report – Executive Summary iv Bushfire CRC; University of Tasmania. [email protected]
underpinning AIIMS. A Principal Components Analysis was conducted with these three survey sections. The analysis revealed that four intra-team factors (team working; preoccupation with failure; shift resources; temporal responsiveness) two inter-team factors (distributed sense making; flexibility) three intra-organisational factors (systemic capability; personnel capability and organisational impediments) and one inter-organisational factor (inter-operability) underpinned the AIIMS structure.
This allowed for further analysis of concerns for different work groups within AIIMS as well as for an analysis of the degree to which these elements could account for whether personnel confronted factors that prevented them from effectively doing their job.
Indicated in the survey is the need to give greater support to providing improved flexibility, especially to those at the Divisional/Sector Commander level. This includes giving those personnel greater capacity to be able to adjust strategies as the incident unfolds; and to reallocate roles as the situation changes. To enable such flexibility there is a need for greater inclusion in decision-making of Divisional and Sector Commanders in formulating strategy.
Work teams on the Fire- or Incident-Ground were also concerned with shift resources and with getting information that is timely (temporal responsiveness). What does not seem to be widely appreciated is the role that those on the Ground play in providing useful information that enables others (at the Incident Management Team, regional and state coordination roles) to be able to resource and supply relevant information in a way that is timely. Greater attention to information exchange between those on the Ground and those in an IMT is needed. This was also indicated in another factor preoccupation with failure which assessed levels of concern with the risks of unclear information and lack of continuity in strategic thinking from team to team. These concerns increased proportionally the further away from the Ground (i.e., IMT high levels of concern; regional coordination- expressing higher levels of concern, State coordination expressing the highest level of concern).
Within an Incident Management Team structure there were differences in responses from those who comprised the “core” team (being the Incident Controller; Operations Officer; Planning Officer; Logistics Officer) and those additional personnel who populate the functional units (within Operations; Planning; Logistics) when an Incident Management Team has scaled up. The factor that appeared relatively more problematic for the core IMT Officers was to do with the factor of inter-operability. This indicates greater attention is needed to addressing how various combat agencies work effectively together, as well as how those in the IMT core roles work with other agencies responsible for differing responsibilities within emergency management arrangements (e.g., police; municipal authorities; Health Departments).
Personnel operating within an IMT functional unit have strongest concerns with team working. There are a number of indicators that suggest those working within functional units within an IMT do not feel part of the broader incident management team in terms of decision-making; information exchange and supporting/feedback

Owen & Dwyer (2009) AIIMS National Survey Report – Executive Summary v Bushfire CRC; University of Tasmania. [email protected]
behaviour. There are also indications of difficulty in distributed sense-making between those within IT functional units and those on the Ground. In short, it appears there is a need for greater integration within the Incident Management Team to enhance teamwork effectiveness.
The regional level suffers most from concerns about its personnel capability. This is evident in the comparatively lower levels of certainty of what needed to be done; lack of informal knowledge as well as familiarity with the incident management systems being used at that level and understanding about who to contact for information or expertise. This indicates a lack of definition and ambiguity with the regional function and of its roles within the Incident Management System. Respondents from the regional level of coordination also reported higher levels of experiencing contradictions in guiding policies and a reasonably high tension if there is a need to go outside normal procedures. It should be noted that responses on regional centres of coordination were derived from incidents in New South Wales, Victoria, South Australia, Western Australia, Northern Territory and New Zealand.
The State level of coordination has the highest reporting of experiencing organisational impediments. This included tensions experienced for having to go outside normal procedures as well as being asked to go outside the chain of command. Not surprisingly under these conditions personnel operating at a State level of coordination also felt most concern of feeling exposed for having done so.
Finally, a critical question to ask is what contribution do each of these Factors make to preventing personnel from effectively being able to do their job and, therefore, what might be the areas required for priority in targeting intervention? Although there were no work groups within the AIIMS structure that accounted for higher levels of job prevention factors, or demographic characteristics (levels of experience; training), with the exception of team discussion of potential weakness areas, personnel capability and inter-operability, all the Factors just discussed were associated statistically significantly with preventing respondents from being able to effectively do their work.
Moreover, a Discriminant Function Analysis revealed that there were two factors that that were critical to predicting whether personnel experienced factors that prevented them from being able to effectively do their job. These were organisational impediments and systemic capability. Under these circumstances it is critically important that attention be given to better understanding what organisational and reporting arrangements can provide the most responsive and effective management of an emergency incident. Only then will we be in a better position to guide training and development to enhance personnel capability.
These results show how the activity of emergency incident management transforms into different sets of demands depending on the location of work teams within the AIIMS structure.
The report provides guidance about areas to target to achieve improvements in incident management work activity and coordination arrangements. These require a
Owen & Dwyer (2009) AIIMS National Survey Report – Executive Summary vi Bushfire CRC; University of Tasmania. [email protected]
need for greater flexibility and responsiveness in coordination throughout the AIIMS structure to service both horizontal command and control as well as to support lateral integration with other agency networks and emergency management responsibilities to that communities may be supported in their decision-making.

Owen & Dwyer (2009) AIIMS National Survey Report Bushfire CRC; University of Tasmania. [email protected]
Page 1 of 115
1. Introduction The need for a coordinated approach in emergency management has long been recognized (Moynihan & La Follette, 2007; Militello, Patterson, Bowman & Wears, 2007; Lutz & Lindell, 2008). For example, Comfort, Ko and Zagorecki (2004) note that lack of resources, lack of coordination, and poor communication are recurring problems for the organizational performance in emergency operations. A disaster (or emergency) “is an unexpected event that exceeds the normal capacity of a community to respond to adverse advents” (Comfort, Ko & Zagorecki 2004, p. 298). Emergency events, by definition, threaten the potential collapse of functional systems that support communities. When technical, social, economic, and or cultural services to a specific region or community are disrupted, communities and regions have their existing functional capacity threatened. In these cases there are also many interdependencies. These include for example, electrical power, communications, transportation, gas, water and sewerage distribution. Failure of emergency management coordination can also lead to shocks and disruptions and unexpected consequences, and cascading failure creating new dangers for the population (Moynihan & La Follette, 2007; Militello, Patterson, Bowman & Wears, 2007). Under these circumstances, effective communication and coordination of personnel operating within interdependent systems becomes essential to mitigate the potential disruptive effects of both the incident and its consequences.
In Australia the organising processes used in emergency events arising from natural hazards are articulated in the Australasian Inter-service Incident Management System (AIIMS). AIIMS was adapted from the National Incident Management System (NIMS) developed in the United States of America. NIMS had grown out of developing the Incident Control System concept from coordinating responses to previous major events. These included the major forest fires that occurred within the US during the 1980s and 90s. The aim to improve coordination came from lessons learned during those disasters, particularly the forest fires in the 1990s where numerous problems were identified associated with the emergency response. These included overloaded spans of control, lack of reliable information, inadequate and incompatible communications, lack of interagency coordination, unclear lines of authority, lack of common terminology among responding agencies and unclear or unspecified incident objectives (Lutz & Lindell, 2008).
While the importance of having organisational systems that support coordination and effective communication has been widely appreciated in the literature (e.g. Militello, Patterson, Bowman & Wears, 2007), reports of the failure of such systems in major international events has also been identified (The 9/11 Commission, 2004, Lutz & Lindell, 2008; Wise, 2006). The emergency management response to Hurricane Katrina, for example, was regarded as the first large-scale test of the National Incident Management System in America. It is interesting to note that the
Owen & Dwyer (2009) AIIMS National Survey Report Bushfire CRC; University of Tasmania. [email protected]
Page 2 of 115
coordination problems identified as lessons learned from previous disasters in the United States were all revisited during Katrina. As Wise (2006, p. 304) noted during hurricane Katrina “[t]here were lapses in command and control within each level of government and between the three levels of government…our architecture of command and control mechanisms as well as out of existing structure of plans did not serve us well.” Subsequent reviews of the Katrina disaster identified that emergency management was substantially hampered by a lack of information from the ground, and that “the lack of communications and situation awareness paralysed, command and control" (ibid., p.304). As Wise (2006, p. 304) noted “this inability to connect multiple communications plans and architectures clearly impeded coordination and communication at the federal state and local levels".
However, while these sorts of reviews have led to subsequent changes and recent updates to NIMS (Department of Homeland Security, 2008), it is also noteworthy that despite extensive use of Incident Control Systems (ICS) such as NIMS over the past 30 years there have been very few empirical studies of its effectiveness (Lutz & Lindell, 2008).
In Australia, although AIIMS had been used by Agencies for some time (as was NIMS in the US) it wasn’t until 2003 that the Australasian Fire and Emergency Service Authorities Council (AFAC) coordinated external consultation with its member agencies that then led to the subsequent endorsement of AIIMS in Australia as a national system in 2004 (AFAC, 2005).
1.1. The Australasian Inter-service Incident Management System
AIIMS is underpinned by three key principles; namely, management by objectives (all personnel involved in the incident work from a common set of objectives and complementary Incident Action Plans for achieving those objectives); functional management (which includes utilisation of four specific functions (control, planning, operations, and logistics) within an Incident Management Team tasked with managing the incident); and, span of control (within incident control structures, as an incident escalates, a supervising officer’s span of control should not exceed five reporting groups) (AFAC, 2005). These three principles mean that the units managing the incident should be able to scale up or down accordingly (AFAC, 2005). The capacity to scale up or down like this is seen by proponents of the system as critical in enabling successful and flexible incident management work practices and processes (DHS, 2008; Moynihan & La Follette, 2007; Dwyer & Owen, 2009; Wise, 2006). Critical to doing so is the role of effective teamwork to support such coordination
1.2. Teamwork and coordination in dynamic environments The are many instances of teams comprising highly skilled individuals working in dynamic environments failing to perform as effective teams (sometimes with devastating ramifications) simply because of poor communication and/or coordination

Owen & Dwyer (2009) AIIMS National Survey Report Bushfire CRC; University of Tasmania. [email protected]
Page 3 of 115
(Cannon-Bowers & Salas,1998). It is important to recognise, therefore, that successful emergency incident management organising (which also operates within the context of a high consequence domain) is highly dependent on effective teamwork and inter-team communication and/or coordination.
In the literature, there are numerous definitions of teams. However, one commonly cited in high consequence domains (for example military contexts and aviation) is also pertinent to emergency incident management work. This definition, used as the basis for framing this report, defines teams as:
Social work units of two or more people that: 1) have meaningful task interdependencies and dynamic social interaction; 2) share valued goals; 3) exist for a delimited lifespan; 4) have expertise distributed among its members; and 5) possess clearly defined roles and responsibilities (Salas, Rosen, Burke & Nicholson 2007, p. 78).
Within this report, teamwork is thus defined as the processes that individuals use to coordinate their decisions and activities, such as sharing information and resources to attain shared goals (Cannon-Bowers & Salas, 1998). It is important that team members have both technical expertise and social interactions that will lead to adaptive coordinated action (Salas, Rosen, Burke, Goodwin & Fiore, 2006). This is why in fire and emergency management a great deal of attention has been given to establishing ways of coordinating activity through both the Incident Control Structure and the Incident Management Team.
In related industries such as the military and aviation, considerable effort has gone into improving communication within and between work teams (e.g. Smith-Jentsch Kraiger, Salas & Cannon-Bowers, 1999; Schaafstal, Johnston & Oser, 2001; Cannon-Bowers & Salas, 1998). A comprehensive review of the teamwork literature is beyond the scope of this report (the reader is referred to Owen, Dwyer & Douglas, 2006 “A review of the IMT-related literature in fire and emergency management settings” Bushfire CRC report for more detail). However, included below (Table 1) are key dimensions found to be important in the teamwork literature in research conducted in associated high consequence/high reliability domains (see for example Cannon-Bowers, Salas 1997; Smith-Jentsch et al, 2001 and also Table 2, page 12). These are the teamwork dimensions which were used to underpin the AIIMS questionnaire.
Obstacles to personnel effectively communicating meaningful information also have implications for their ability to develop shared mental models (SMMs). SMMs are considered critical in a team’s ability to operate effectively as a team rather than a collective of individuals (Cannon-Bowers, Salas & Converse, 1993; Langan-Fox, Anglim & Wilson, 2004). It is further suggested that having shared mental models also enables teams and team members to continue coordinating their activities when not in communication with each other (Cannon-Bowers & Salas, 1998).

Owen & Dwyer (2009) AIIMS National Survey Report Bushfire CRC; University of Tasmania. [email protected]
Page 4 of 115
Table 1: Dimensions of effective teamwork
Teamwork Indicators & Definition Information Exchange Definition: involves passing relevant data to team members who need it, in a timely manner. Includes transmitting and receiving Rationale: Effective information exchange helps members to build and maintain their own situation awareness as well as contribute to the teams understanding of the big picture Supporting behaviour Definition: Offering and requesting assistance in an effective manner both within and across teams Rationale: Effective supporting behaviour allows teams to maintain a high level of performance in complex high workload situations Flexibility Definition: The ability and willingness to adapt performance strategies quickly and appropriately to changing task demands (inc monitoring for cues that a change in strategy is needed, identifying viable alternatives, objectively considering input from others, and compromising when needed Rationale: Effective flexibility allows a team to deal successfully with the unexpected and provide consistently safe and efficient service Team feedback skills Definition: The ability to enable team members to communicate their observations, concerns, suggestions and requests in a clear and direct manner without becoming hostile and defensive Rationale: With effective team feedback skills the team can correct and prevent errors, resolve conflict and continuously enhance performance Team-related knowledge and Team-specific knowledge Rationale: Helps team members know when and how to apply the above four teamwork skills (a) Teammate generic knowledge -Interpositional knowledge Definition: Involves understanding the tasks performed by the other teams and team members with whom a member must coordinate (includes physical layout of the workplace). (b) Teammate specific knowledge Definition: Information members learn about their individual team-mates’ characteristics Rationale: Allows members to anticipate the information needs of others, support one another during high workload periods and avoid frustration and inter-team conflicts.
Owen & Dwyer (2009) AIIMS National Survey Report Bushfire CRC; University of Tasmania. [email protected]
Page 5 of 115
Source: Cannon-Bowers, Salas 1997; Smith-Jentsch et al, 2001
Literature published on the issue of multi-organisational work in the area of command and control organisations (Liao, 2008), emergency organisational networks (Comfort & Kapucu, 2005), military coalitions (Clark & Jones, 1999; Report of a French-German-UK-US Working Group, 2000; Stewart, Clarke, Goillau, Verrall & Widdowson, 2004) and distributed work environments clearly emphasises the importance of effective and efficient communication, information flow and shared understandings as critical in achieving high levels of coordination and interoperability.
Again, for the purposes of this report, coordination is defined as “mutually agreed linking of activities of two or more groups” (Quarantelli, 1986, p. 9). One of the key issues in organisational coordination is that of interoperability. Interoperability is defined as, “. . . the ability of systems, units or forces to provide services to and accept services from other systems, units or forces and to use the service so exchanged to enable them to operate effectively together without altering or degrading the information exchanged” (in Stewart, Clarke, Goillau, Verrall & Widdowson 2004, p. 4). The level to which the above attributes of interoperability are achieved is a matter of degree, and consequently, organisational arrangements can be said to have either “low” or “high” levels of interoperability (Crabtree, Rodden & Benford, 2005; Huber, Eggenhofer, Romer, Schafer & Titze, 2007). Consequently, the role of information exchange and understanding are also critical in achieving an effective multi-organisational approach (Dawes, Birkland, Tayi & Scheinder, 2004; Comfort & Kapucu, 2005).
1.2.1. Teamwork and AIIMS The purpose of this report is not to articulate the entire workings of AIIMS as an organising structure (see AFAC, 2005 for more policy detail). However, a brief outline is useful for those unfamiliar with the system.

Owen & Dwyer (2009) AIIMS National Survey Report Bushfire CRC; University of Tasmania. [email protected]
Page 6 of 115
Figure 1: AIIMS Structure
Source: AFAC AIIMS Manual, 2005
Incident
Controller
Operations
Logistics
Planning
Situation Unit
Resources Unit
Communications
Planning Unit
Management
Support Unit
Information
Unit
Supply Unit
Communications
Support Unit
Facilities Unit
Ground
Support Unit
Finance Unit
Medical
Services Unit
Catering Unit
Division(s)
Division(s)
Air Operations
Sector(s)
Sector(s)
Strike Team(s)
Task Force(s)
Single
Resource(s)
Safety Advisor
Liaison with
external bodies
Owen & Dwyer (2009) AIIMS National Survey Report Bushfire CRC; University of Tasmania. [email protected]
Page 7 of 115
The AIIMS structure is underpinned by team-based organising operating across different roles within the incident management system. According to AFAC (2005) the central driver is the work undertaken within an Incident Management Team which is required to be effective and efficient in minimising the impact of the incident on the community and the environment (AFAC 2005). The Incident Management Team is formed to support the Incident Controller in confirming that the control of the incident is properly planned, has adequate resources, and provides for the safety and welfare of ground personnel. An Incident Management Team is formed when all functions (i.e. Control, Operations, Planning and Logistics) become necessary because of the scale of the incident. At the most basic level, the Incident Management Team comprises the Incident Controller, Planning Officer, Operations Officer and Logistics Officer.
When an emergency grows in complexity the Incident Management Team “scales up” and more personnel are added to the core functional units who then report to each of the Officers of the core team (e.g., a Planning Officer is head of a planning function with has a situation unit; media unit; information unit (etc), all staffed by agency personnel (see AFAC, 2005 for more detail).
It is also important to acknowledge that the work planned in the Incident Management Team is carried out on the fire- or incident-ground by inter-connected teams that, in large scale incidents, comprise Division and Sector Commanders; and within those Sectors, Crew Leaders, crews and strike teams.
Within an emergency control agency responsible for the emergency, particularly when the emergency may involve multiple incident management teams there will also be coordination at a state level of coordination, and possibly a regional level of coordination. Clearly these different teams operating at different layers in the incident control system have different task demands. They also need to work together effectively. The AIIMS structure is thus intended to enable effective incident management regardless of the type or scale of the incident (AFAC, 2005).
The study reported here is the first systematic review of Australia's Incident Management System to be conducted since its national introduction in 2004.
Owen & Dwyer (2009) AIIMS National Survey Report Bushfire CRC; University of Tasmania. [email protected]
Page 8 of 115
1.3. Aim of this research The aim of this research was to investigate the use AIIMS by personnel involved in emergency incident management in fire and emergency services agencies, and in particular to analyse the ways in which information flows and communication are currently supported or impeded. The approach taken was to develop a survey, the intention of which was to:
• Review information and communication flows;
• Review how teams work with the AIIMS system;
• Identify opportunities for improvement.
Research questions
The following research questions guided the purpose of the study:
1. For what type of emergency incidents is the AIIMS system is use?
2. To what degree are the processes embedded within AIIMS to support information flow and coordination practiced by personnel engaged in emergency incident management?
3. Have these practices improved since AIIMS was introduced nationally in 2004?
4. To what degree are effective teamwork practices in use in emergency incident management work?
5. What organizational processes can be identified and how do these enhance or inhibit effective ICS/IMT work performance?
6. What collective practices and organizational processes can be identified that need to be improved in order to enhance IMT/ICS work performance?
The analysis has been aimed at achieving the following benefits:
• improved strategies to enhance the effectiveness of AIIMS work practices;
• improved flows of information between personnel involved in incident response and its management;
• generating data that can be transferred into improved training initiatives to enhance the effectiveness of AIIMS.
Owen & Dwyer (2009) AIIMS National Survey Report Bushfire CRC; University of Tasmania. [email protected]
Page 9 of 115
2. Research method Before proceeding to discuss the findings, the methods used to develop the survey (which included a pilot and evaluation phase to enhance the validity of the survey items) will be described and the eventual structure of the survey outlined . Also reviewed in this section of the Report will be the distribution process used as well as possible limitations of the research methodology. Finally, demographic details will be provided to develop an appreciation of the widespread and national aspects of the sample obtained.
Note also that while the data set generated by the survey has been used to compile this report, it is also being used to develop a PhD. This PhD is expected to be completed towards the end of 2010 and will focus on theoretical aspects of the relationship(s) established between high performance IMT teamwork, incident complexity and organisational structures and processes.
2.1. Development of the survey Development of our 2008 survey went through a number of phases. The 2003 survey conducted by AFAC had previously been reviewed and descriptive data summarised for the AFAC AIIMS Steering Committee1.
The 2003 survey conducted by AFAC as part of its consultation process served as a template to begin work for the 2008 data collection process. In doing so a number of questions that were asked in 2003 were asked again in 2008 in order to provide comparative data. In addition, a number of questions asked in 2003 were modified to enhance clarification. There were also a number of new sections added.
2.1.1. Evaluation of the survey The draft survey underwent a number of phases of evaluation by both stakeholders and users. Subject matter experts and members of the AFAC AIIMS steering committee provided detailed feedback on the questions and also made modification suggestions on others. The draft survey underwent a trial phase where it was completed by three separate focus groups (comprising between 20 and 25 subject matter experts) to provide pilot survey responses and panel feedback. Members participating in the focus groups were experienced in emergency incident management and came from agencies in Victoria and Tasmania. In each of these, focus group participants were requested to complete the survey. The time taken was recorded. Following completion, in order to assess and improve validity, participants
1 The AFAC AIIMS Steering Committee is a national body comprised of senior personnel (e.g., Commissioner; Chief
Fire Officer; Director Operations level) from state agencies
Owen & Dwyer (2009) AIIMS National Survey Report Bushfire CRC; University of Tasmania. [email protected]
Page 10 of 115
were then asked their opinions about what they thought particular questions were attempting to assess, and their opinions on whether the questions worked or needed revision. Participants were also asked to identify any potential issues that should be addressed but were missing from the trial version of the questionnaire.
This input was then used to revise the survey which was then circulated back to the members of the AFAC AIIMS steering committee for their feedback. The survey was then endorsed by the National AFAC AIIMS steering committee for distribution at its meeting in May 2008.
2.2. Structure of the survey Throughout the survey (depending on the type of question), respondents were asked either to tick a box or boxes, or give a rating via seven point Likert Scales (Field, 2003. There were also a number of opportunities for respondents to give qualitative responses. The final version of the 2009 questionnaire was divided into six sections as described below (see also Appendix 1). Note that each respondent answered the survey based on one incident; therefore in the data, one respondent equals one incident.
Section 1 of the survey sought to gain an overview of the last major incident respondents were involved in (for example, questions were asked about the type of incident, where the incident occurred, how complex it was, what was threatened, the agencies involved, the length of incident, the numbers of people involved, role allocations, and reporting pathways).
Section 2 asked questions about respondents’ area of responsibility during one specific shift at the incident detailed in Section 1 (for example, questions were asked about the phase of the incident the respondent was reporting on, briefing and incident action plan issues, incident management issues in terms of what helped/hindered people do their jobs, reporting frameworks, communications plans, resourcing adequacy, safety issues, availability of risk management tools, personnel proficiency, team confidence, information management, and, use of technology).
Sections 3 and 4 sought information about teamwork and interaction between the incident management team (IMT) and others involved in managing the incident (for example, crew leaders and divisional commanders on the fire/incident ground). Section 3 included indicators of effective teamwork drawn from the research literature (see Table 1 above). These teamwork dimensions were developed into statements and are outlined in Table 2 below.
As can see seen from Table 2, five survey items were included to assess perceptions of information exchange; four items for the teamwork dimension of supporting behaviour; three items for team flexibility; four items for team feedback skills; four items assessing team related inter-positional knowledge; and six items assessing team related knowledge and group affect.
In addition to the teamwork indicators derived from the human factors literature, six items were included from the high-reliability organising literature to assess perceptions of the degree to which team members identified weak signals or risk as

Owen & Dwyer (2009) AIIMS National Survey Report Bushfire CRC; University of Tasmania. [email protected]
Page 11 of 115
important to the success of their operations (see for example Stanton, Baber & Harris, 2008; Wilson, Burke, Priest & Salas, 2005; Vogus & Sutcliffe, 2007; Weick, & Sutcliffe, 2001) . High Reliability Organising (HRO) principles used in fire services in the US emphasise a need for personnel to have a preoccupation with failure. That is, having sensitivity in operations to pick up on all weak signals that something might be going wrong or about to go wrong.
Section 4 used similar indicators and requested respondents to consider the interaction between the Incident Management Team and the Fire- or incident-ground. This was considered important because communication and information flow between these layers in the incident management system are critical for successful emergency incident management.

Owen & Dwyer (2009) AIIMS National Survey Report Bushfire CRC; University of Tasmania. [email protected]
Page 12 of 115
Table 2: Features important in team-based work activity IMTs and multi-agency collaborations
Key indicator Survey Items Sources
Information exchange
Passing relevant data to team members who need it, in a timely manner
3.2.1 Team members exchanged information clearly
3.2.2 Team members exchanged information accurately
3.2.8 Team members kept one another well informed about work-related issues
3.2.9 There were genuine attempts to share information
3.2.16 Team members interacted effectively with stakeholders outside their own team
Cannon-Bowers & Salas 1997; Smith-Jentsch et al. 2001; Entin & Serfaty 1999; Orasanu & Salas 1993; Schaafstal et al. 2001; Sheehan & Robertson et al 2007; Salas, Diaz Granados et al 2008; Guise & Sigel 2008
Supportive team climate
Offering and requesting assistance in an effective manner both within and across teams.
3.2.5 Team members effectively monitored each other’s performance
3.2.7 Team members operated in an open and honest manner
3.2.19 New team members were quickly integrated into the team.
3.2.23 I felt comfortable approaching members of this team for help if I needed it.
McLennan et al. 2005; Smith-Jentsch et al. 2001; Driskell 2000; Autrey & Moss 2006
Flexibility
The ability and willingness to adapt performance strategies quickly and appropriately to changing task demands
3.2.13 Strategies were adjusted in a timely manner as the incident unfolded
3.2.15 Roles were effectively re-allocated as the situation changed
3.2.22 When problems occurred the team was able to recover quickly and get on with the job
Serfaty et al. 1999; Ekornas et al. 2001;
Mills & Stothard 2000
Team feedback skills
Team members communicate their observations, concerns, suggestions and requests in a clear and direct and assertive manner.
3.2.3 Team members provided helpful advice to each other
3.2.4 Team members provided constructive feedback to each other
3.2.10 Team members shared their individual knowledge to gain a better understanding of the situation at hand
3.2.21 Team members received clear direction in relation to the tasks at hand (from the supervisor or officer in charge)
Orasanu 1990; Schaafstal et al. 2001; Smith-Jentsch et al. 2001; Jentsch 1999; Mills & Stothard 2000; Erricsson et al 2006
Team-related inter-positional knowledge
Involves understanding the tasks performed by the other teams and team members with whom a member must coordinate (includes physical layout of the workplace)
3.2.14 Team members anticipated the needs of others
3.2.20 Team members co-ordinated their activities to achieve the best possible outcome
3.2.26 We deliberately sought local expertise
Mathieu et al. 2000; Cannon-Bowers & Salas 1997; Volpe, Cannon-Bowers & Salas 1996; Striechert et al. 2005; Ancona & Calwell 1992

Owen & Dwyer (2009) AIIMS National Survey Report Bushfire CRC; University of Tasmania. [email protected]
Page 13 of 115
Team attitudes & affect
Information members learn about their individual team-mates’ characteristics
Team-related attitudes affect team members’ willingness to use effective teamwork skills
3.2.6 Team members exhibited a strong ‘we are in this together’ attitude
3.2.11 Team members were able to state and maintain opinions openly
3.2.12 Team members had the majority of skills needed to effectively perform their respective roles
3.2.17 Team members had a clear and common purpose for the incident at hand
3.2.18 Team members trusted each other
3.2.24 The IMT was ‘ahead of the game’
3.2.31 We effectively achieved our tasks
Schaafstal et al. 2001; McLennan & Omodie cited in McLennan 2005; Dickinson & McIntyre 1997 Driessen, Outka-Perkins & Anderson 2005; Mohammed and Dumville 2001; Cannon-Bowers & Salas 1997; Volpe, Cannon-Bowers & Salas 1996; Smith-Jentsch et al. 2001 Ericsson et al 2006
Pre-occupation with failure
Taking note of ALL small warning signals
3.3 Lack of knowledge
3.3 No continuity of strategic thinking from team to team
3.3 Unclear information
3.3 Lack of resources
3.3 External influences
3.3 Heavy workload
Weick & Sutcliffe 2001;
Weick 1987;Weick, Sutcliffe & Obstfeld 1999
Section 5 was devoted to ascertaining levels of satisfaction with incident management system procedures and processes, in particular, how these procedures and processes affected the effectiveness of agency interoperability. The final section, Section 6, sought to build a demographic profile of respondents, including their exposure to various forms of training and learning initiatives.
In terms of overlap with the 2003 AFAC survey, it was important to re-ask questions in 2008 that would allow a direct comparison with the 2003 data, given the 2003 survey was a ‘National Review’ of the AIIMS Incident Control System (AIIMS ICS) and key stakeholders had a vested interest in how their system was evolving. Areas of overlap therefore included questions pertaining to the overview of the incident and roles performed, reporting pathways, specific shift details, including for example, briefing, Incident Action Plans, and safety issues, resource and information management, communication arrangements, overall effectiveness of the Incident Management Team and factors that enhanced or hindered optimal team member performances, risk management tool availability and usage, as well as comprehensive demographic information.
2.3. Distribution of the survey The survey received ethics approval (HREC 8810) to be distributed and a list of targeted agencies and their contacts can be found in Appendix 2. Instructions were provided to the contacts on how to distribute the survey within their own agency.
Agency contacts were given a range of options in terms of completing the survey. Respondents were advised they could use either an online survey or paper copy. Contacts were asked to prepare a distribution list and complete a distribution plan and return it to the researchers (see Appendix 2). The distribution plans were

Owen & Dwyer (2009) AIIMS National Survey Report Bushfire CRC; University of Tasmania. [email protected]
Page 14 of 115
developed in order to try and achieve a stratified sample of between 15 to 30 persons in each of the role categories identified for targeting in the survey. The sample was thus stratified to include personnel working on the fire or incident ground; personnel working in incident management teams; and personnel working in a regional or state level of coordination. Contacts were also requested to circulate an ethics information sheet accompanying the survey.
2.4. Analyses
In reporting the data a number of analyses have been conducted. Initially, descriptive statistics are provided to describe the survey results, for example frequencies are reported for use of AIIMS tools and where appropriate, chi-square tests of significance are reported. This is particularly the case for reporting on sections one and two of the survey.
In sections three, four and five of the survey a different approach was needed based on the Likert-type of survey scales used. In these sections the data reported are predominantly at an ordinal level of measurement and initial review showed that the spread of scores did not represent a normal distribution. Therefore, initial non-parametric statistical tests were applied and are detailed in Appendix 3. Appendix 3 reports the statement included in the survey, the team-membership of the respondent, the number of responses, the median and the mean-ranking of those medians and the results of a Kruskal-Wallis comparison of medians. In order to provide for a Bonferroni correction to allow for post-hoc comparisons statistical significance was set at the .01. Only these are reported here. Where there was a statistically significant alpha of >.05 these are reported as trends (see Appendix 3). These data are reported in Section 5 Teamwork and distributed interaction and Section 6 Organisational Processes.
Second, in order to best understand the degree to which teamwork and coordination were enabled or constrained across the various teams working within the Incident Control System it was necessary to reduce the data available and to look for overarching patterns and trends. To do this an exploratory factor analysis (or Principal Components Analysis) was conducted on the Sections of the Survey relating to teamwork, interaction between IMT and Fire/Incident Ground as well as the Organisational Processes.
Factor analysis is useful because it looks for trends and patterns in the way items correlate with each other. One reason for adopting this course of action was that where groups of items appear to measure the same latent variable, the resulting scale score tends to provide a more reliable indicator of that latent variable/factor than would any single item. The aim is to capture or account for most of the variability (variance) in the patterns of correlations. In each case, items were factor analysed via exploratory factor analysis (EFA) using Principal Components Analysis (PCA)

Owen & Dwyer (2009) AIIMS National Survey Report Bushfire CRC; University of Tasmania. [email protected]
Page 15 of 115
extraction and Varimax (orthogonal) rotation, with factor loadings above 0.50 visible, and with items sorted to reflect the relative strength of loadings per factor. As a rule of thumb, a factor analysis is regarded as robust if it explains more than 50% of the variation of the correlations. Also, a Kaiser-Meyer-Olkin measure of sampling adequacy (KMO) of 0.800 and above is regarded as optimal. The details of the statistics used are reported in Appendix 4. The data are reported in Section 7 Factors enhancing and inhibiting incident management effectiveness.
An advantage in undertaking an exploratory factor analysis is that each respondent can be calculated on a unique Factor Score based on their combination of items that were included in the Factor. Overall, Factor scores have a particular advantage in that they also follow a normal distribution which means that they can be used in parametric statistical analysis. To assist, Factor scores have been standardised as “T-scores” which means that every Factor has a standardised mean of 50 and a standard deviation of 10. In this way all the factors can be compared to each other. These data are reported in 8.1, Directions for future research.
2.5. Possible limitations of the study First, although the survey has so far elicited 579 responses from people working within Incident Management Teams, combat roles and coordination centres across Australia and New Zealand, the overarching concern is that the sample might not be generalisable to the entire population of personnel involved in incident management. This is a potential problem for nearly all quantitative studies, most especially one like this which is attempting to capture an accurate snapshot of many thousands of people spread widely across a large geographic area. Steps were taken to try and mitigate this possibility with the 2008 survey (for example, via the dissemination of a distribution plan to assist in stratifying the sample) but the results should still be considered with this potential limitation in mind.
Second, by using third parties to disseminate the questionnaire it is not possible to know exactly how many people received the questionnaire and thus what the response rate is for every agency. Where known however, the response rate varied between 10% and 100%.
Third, it should be appreciated we were asking respondents to recall events that in some instances might have occurred a year or more previously. It is therefore possible there are inaccuracies in the data simply because peoples’ recollection of what happened was incomplete; for example, when they were asked to recall the contents of Incident Action Plans or what transpired at briefings. Again, this possibility was mitigated by adopting the same data gathering procedures as those used in 2003 by AFAC.
Finally, it would have been desirable in a report such as this to provide a cross-country comparison. However, since the numbers received from New Zealand agencies were small (n=22), and since there were no obvious differences in responses evident, the database reported here is a combined one.

Owen & Dwyer (2009) AIIMS National Survey Report Bushfire CRC; University of Tasmania. [email protected]
Page 16 of 115
2.6. Demographics of the sample
2.6.1. Functional areas of respondents This report is based on the first download of 579 respondents (July 2009). Figure 2 shows the overall distribution of respondents in relation to their respective roles within the incident management system. It can be seen there is a good spread of responses from people involved on the fire/incident ground (n = 109). Personnel completing the survey with involvement on the fire or incident ground included Division Commander, Section Commander, Crew Leader, Officer in charge of an Appliance and Fire Fighter roles.
The survey also received 59 responses from those involved in a regional or state level coordination role. In addition, the survey received responses from 375 Incident Management Team personnel. Of these, 99 were from Incident Controllers and 13 from Deputy Incident Controllers. There were 50 personnel reporting as Operations Officer, and a further 46 responses from personnel involved in the Operations Unit function. The Planning section is also reasonably well represented with 37 Planning Officers completing the survey. There were also 70 respondents who were involved in planning unit functional areas. Finally there were 18 Logistic Officers, and 29 responses from people working within a logistics functional unit area.
Figure 2: Respondent functional areas
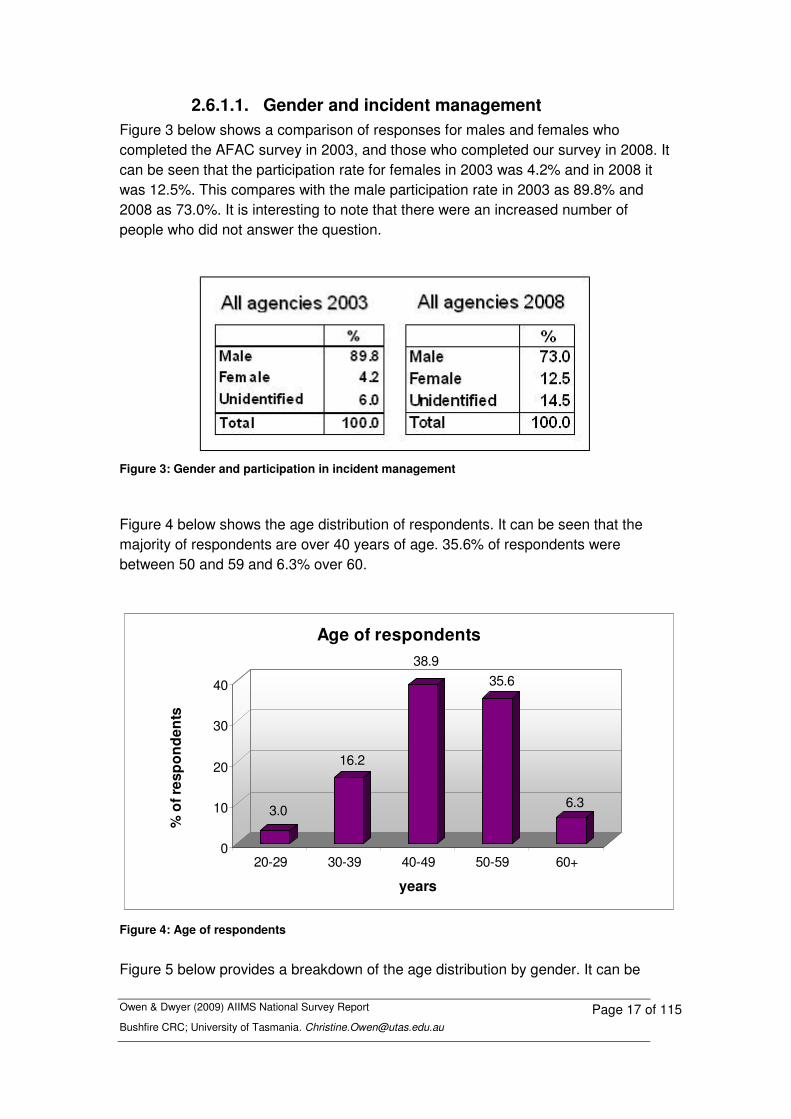
Owen & Dwyer (2009) AIIMS National Survey Report Bushfire CRC; University of Tasmania. [email protected]
Page 17 of 115
2.6.1.1. Gender and incident management Figure 3 below shows a comparison of responses for males and females who completed the AFAC survey in 2003, and those who completed our survey in 2008. It can be seen that the participation rate for females in 2003 was 4.2% and in 2008 it was 12.5%. This compares with the male participation rate in 2003 as 89.8% and 2008 as 73.0%. It is interesting to note that there were an increased number of people who did not answer the question.
Figure 3: Gender and participation in incident management
Figure 4 below shows the age distribution of respondents. It can be seen that the majority of respondents are over 40 years of age. 35.6% of respondents were between 50 and 59 and 6.3% over 60.
3.0
16.2
38.935.6
6.3
0
10
20
30
40
% o
f res
pon
den
ts
20-29 30-39 40-49 50-59 60+
years
Age of respondents
Figure 4: Age of respondents
Figure 5 below provides a breakdown of the age distribution by gender. It can be
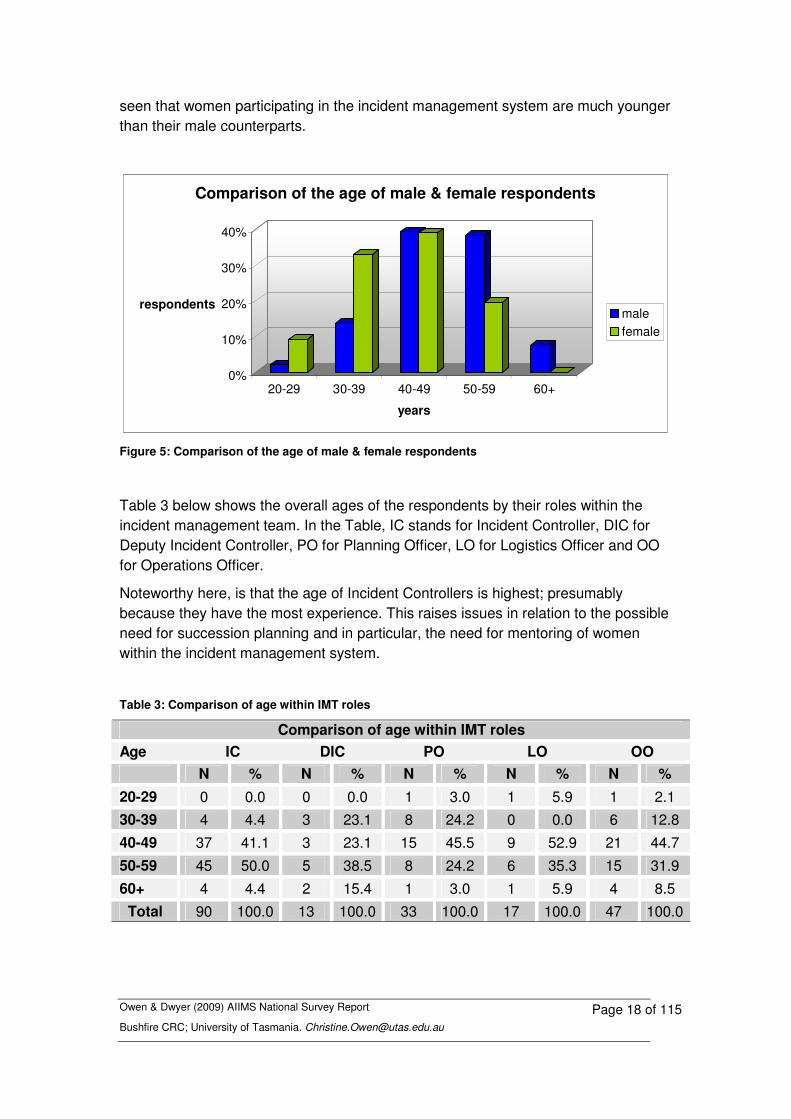
Owen & Dwyer (2009) AIIMS National Survey Report Bushfire CRC; University of Tasmania. [email protected]
Page 18 of 115
seen that women participating in the incident management system are much younger than their male counterparts.
0%
10%
20%
30%
40%
respondents
20-29 30-39 40-49 50-59 60+
years
Comparison of the age of male & female respondents
malefemale
Figure 5: Comparison of the age of male & female respondents
Table 3 below shows the overall ages of the respondents by their roles within the incident management team. In the Table, IC stands for Incident Controller, DIC for Deputy Incident Controller, PO for Planning Officer, LO for Logistics Officer and OO for Operations Officer.
Noteworthy here, is that the age of Incident Controllers is highest; presumably because they have the most experience. This raises issues in relation to the possible need for succession planning and in particular, the need for mentoring of women within the incident management system.
Table 3: Comparison of age within IMT roles
Comparison of age within IMT roles Age IC DIC PO LO OO
N % N % N % N % N % 20-29 0 0.0 0 0.0 1 3.0 1 5.9 1 2.1 30-39 4 4.4 3 23.1 8 24.2 0 0.0 6 12.8
40-49 37 41.1 3 23.1 15 45.5 9 52.9 21 44.7
50-59 45 50.0 5 38.5 8 24.2 6 35.3 15 31.9
60+ 4 4.4 2 15.4 1 3.0 1 5.9 4 8.5 Total 90 100.0 13 100.0 33 100.0 17 100.0 47 100.0
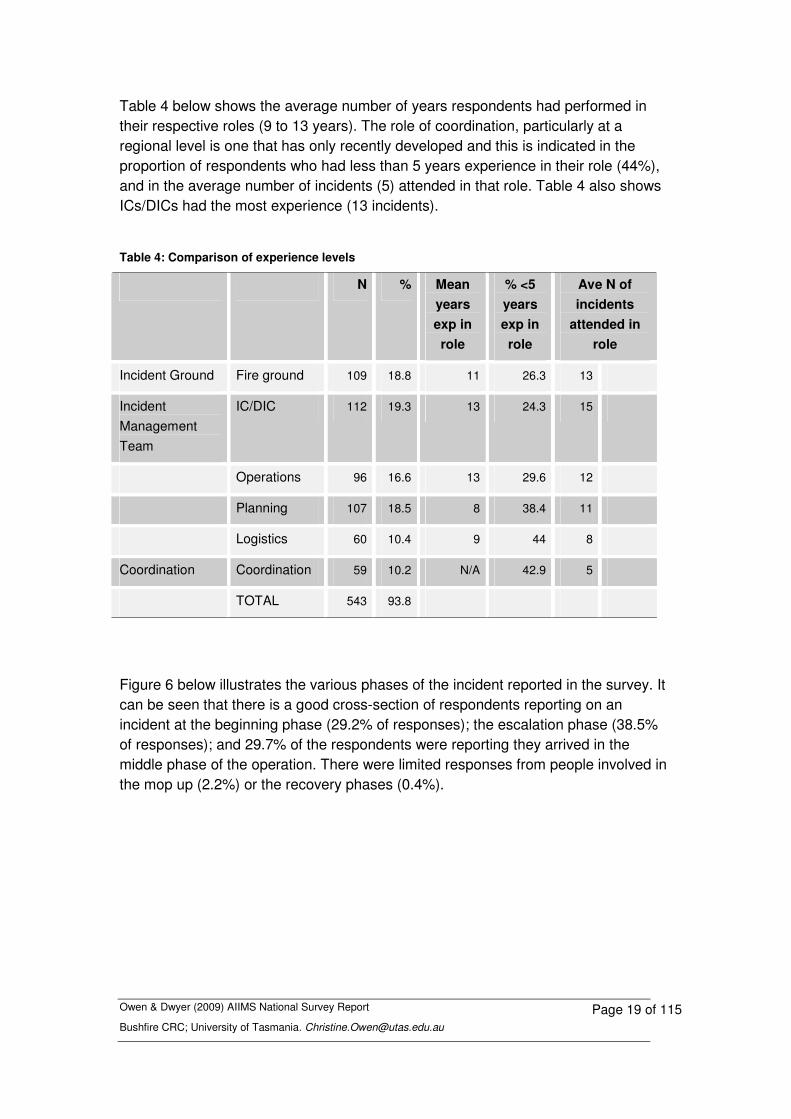
Owen & Dwyer (2009) AIIMS National Survey Report Bushfire CRC; University of Tasmania. [email protected]
Page 19 of 115
Table 4 below shows the average number of years respondents had performed in their respective roles (9 to 13 years). The role of coordination, particularly at a regional level is one that has only recently developed and this is indicated in the proportion of respondents who had less than 5 years experience in their role (44%), and in the average number of incidents (5) attended in that role. Table 4 also shows ICs/DICs had the most experience (13 incidents).
Table 4: Comparison of experience levels
N % Mean years exp in role
% <5 years exp in role
Ave N of incidents
attended in role
Incident Ground Fire ground 109 18.8 11 26.3 13
Incident Management Team
IC/DIC 112 19.3 13 24.3 15
Operations 96 16.6 13 29.6 12
Planning 107 18.5 8 38.4 11
Logistics 60 10.4 9 44 8
Coordination Coordination 59 10.2 N/A 42.9 5
TOTAL 543 93.8
Figure 6 below illustrates the various phases of the incident reported in the survey. It can be seen that there is a good cross-section of respondents reporting on an incident at the beginning phase (29.2% of responses); the escalation phase (38.5% of responses); and 29.7% of the respondents were reporting they arrived in the middle phase of the operation. There were limited responses from people involved in the mop up (2.2%) or the recovery phases (0.4%).
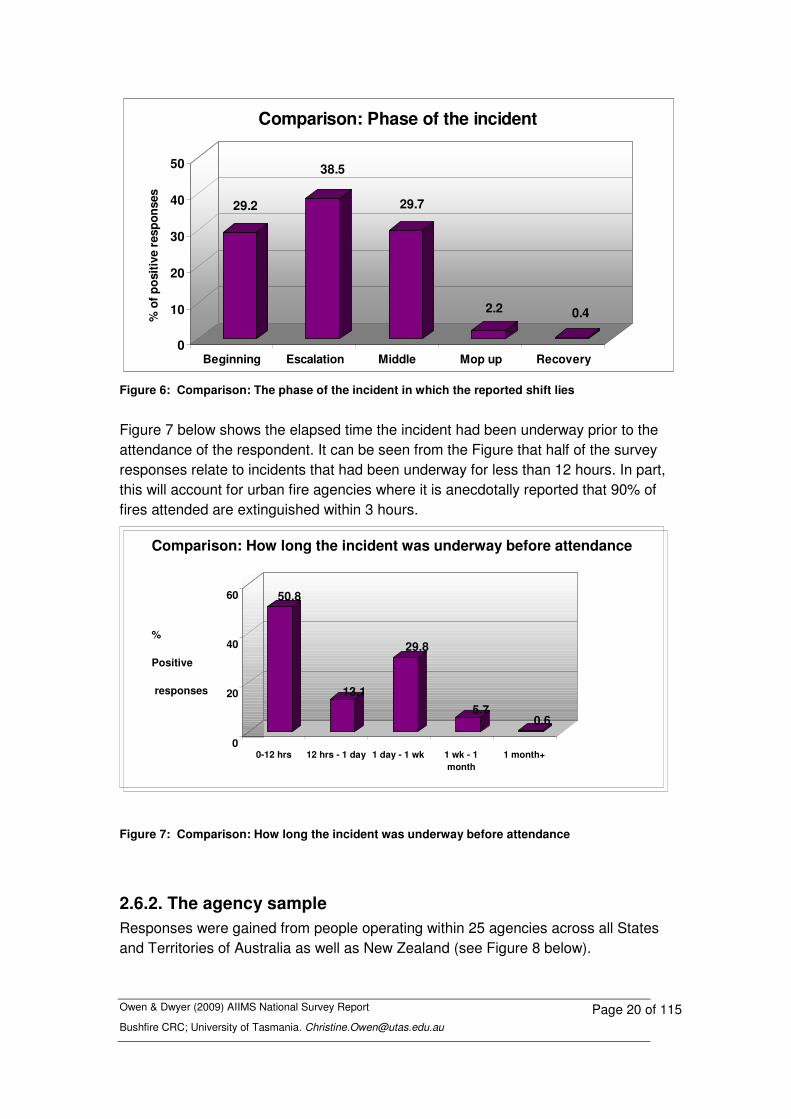
Owen & Dwyer (2009) AIIMS National Survey Report Bushfire CRC; University of Tasmania. [email protected]
Page 20 of 115
29.2
38.5
29.7
2.2 0.4
0
10
20
30
40
50%
of p
ositi
ve r
espo
nses
Beginning Escalation Middle Mop up Recovery
Comparison: Phase of the incident
Figure 6: Comparison: The phase of the incident in which the reported shift lies
Figure 7 below shows the elapsed time the incident had been underway prior to the attendance of the respondent. It can be seen from the Figure that half of the survey responses relate to incidents that had been underway for less than 12 hours. In part, this will account for urban fire agencies where it is anecdotally reported that 90% of fires attended are extinguished within 3 hours.
Figure 7: Comparison: How long the incident was underway before attendance
2.6.2. The agency sample Responses were gained from people operating within 25 agencies across all States and Territories of Australia as well as New Zealand (see Figure 8 below).
50.8
13.1
29.8
5.7 0.6
0
20
40
60
%
Positive
responses
0-12 hrs 12 hrs - 1 day 1 day - 1 wk 1 wk - 1 month
1 month+
Comparison: How long the incident was underway before attendance

Owen & Dwyer (2009) AIIMS National Survey Report Bushfire CRC; University of Tasmania. [email protected]
Page 21 of 115
Number of responses per agency
31
244
10771
206
114
1493
223
174
5587
46
2221
0 20 40 60 80 100 120
TFS TAS PWSState Forests of NSWSA SESSA CFSQFRSQPWSNZ DOC & NRFANTFRSNSW SESNSW RFSNSW Fire BrigadesMFBForestry TasForestry SADEC WAFESADSE (inc Parks Vic & Vic Forest)DECC NSWCFABushfires NTACT ESA
Figure 8: Number of responses from each agency
2.6.3. Agency Functions Figure 9 below shows the functions of the various agencies responding to the survey. It can be seen from the Figure that 34.9% of agencies responding were responsible for rural fire management and 21.9% of agencies responding had land management responsibilities. 20.4% of respondents came from urban fire agencies and 22.7% of responses came from agencies responsible for other emergency events.
Functions of agencies responding to AIIMS National Questionnaire 2008
20.4%
34.9%21.9%
22.7%urban fire
rural fire
land management
emergency
Figure 9: Functions of agencies responding to AIIMS National Survey 2008
Figure 10 below shows the location of the incidents reported by survey respondents.
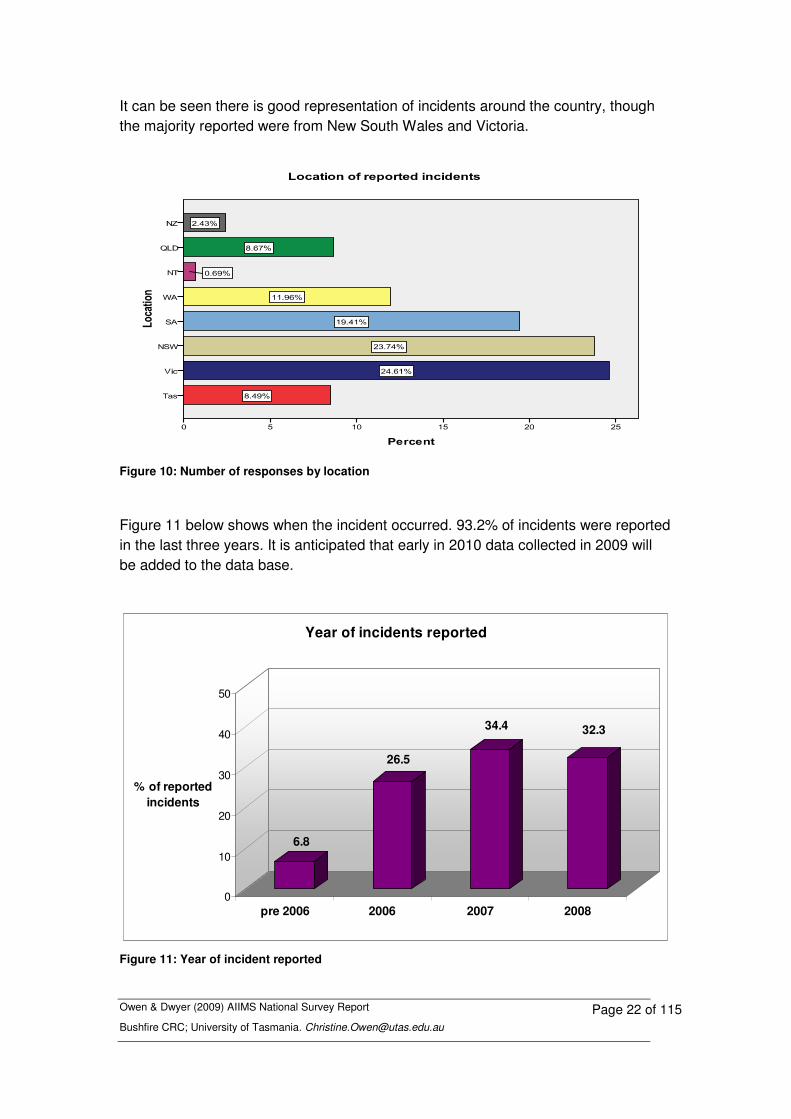
Owen & Dwyer (2009) AIIMS National Survey Report Bushfire CRC; University of Tasmania. [email protected]
Page 22 of 115
It can be seen there is good representation of incidents around the country, though the majority reported were from New South Wales and Victoria.
Figure 10: Number of responses by location
Figure 11 below shows when the incident occurred. 93.2% of incidents were reported in the last three years. It is anticipated that early in 2010 data collected in 2009 will be added to the data base.
6.8
26.5
34.4 32.3
0
10
20
30
40
50
% of reported incidents
pre 2006 2006 2007 2008
Year of incidents reported
Figure 11: Year of incident reported

Owen & Dwyer (2009) AIIMS National Survey Report Bushfire CRC; University of Tasmania. [email protected]
Page 23 of 115
2.6.4. Summary This section has outlined the methods used and the demographic details of the sample of the survey, together with a brief outline of some of the features of incidents reported. The next sections will address each of the research questions.

Owen & Dwyer (2009) AIIMS National Survey Report Bushfire CRC; University of Tasmania. [email protected]
Page 24 of 115
3. Types of emergency incidents managed
This section addresses the first research question: For what type of emergency incidents is the AIIMS system is use?
As Figure 12 below shows, it is not surprising, given the composition of the responding agencies, that the predominant incident type to which agencies responded were forest or scrub fires. However, it is also important to note that there was reasonable reporting of rural/urban interface fires as well as emergency incidents including cyclones, floods and storms. This will allow later analyses to be conducted on how the AIIMS structure supports other types of emergency events.
Comparison of incident type
0 10 20 30 40 50 60 70
cyclone\flood\storm
structural collapse
structure fire
rural urban interface
Grass
forest\scrub fire
% of total responses
Figure 12: Comparison of incident type
Figure 13 below relates to the overlaps between different types of incidents (respondents could tick as many boxes as relevant). For example on the left hand side (14a) it can be seen that there is a high degree of overlap between grass and forest scrub fires with the rural urban interface. While the majority of forest-scrub fires (n=273) did not impact on the rural urban interface or were connected with grass fires, there were a proportion that did. For example Figure 14a shows that there were 33 fires that were forest-scrub fires that also involved grass and threatened an urban-rural interface. These types of conditions are more likely to be the ones fought by rural fire services and land management agencies. Similarly Figure 14b shows the overlap between incidents where structure fires, structural collapses and hazardous materials would have been involved. Most structure fires for example reported had

Owen & Dwyer (2009) AIIMS National Survey Report Bushfire CRC; University of Tasmania. [email protected]
Page 25 of 115
only involved a structure and some had involved other structural collapse and/or hazardous materials. These types of incidents are more typically faced by those in urban agencies, or agencies that include urban fire response capability.
Incident Types
Figure 13: Overlaps between types of incidents
3.1. Emergency threats Table 5 shows the number of incidents where threats were involved. It is interesting to note that in 42% of incidents there were 6 or more threats, 11.5% of incidents involved more than 9 threats. In 56% of all incidents life was threatened and in 55% of incidents some form of critical infrastructure (water, gas or electricity) was threatened.
Table 5: Number of supporting agencies cross tabulated with incident ICS level
Incidents where threats were involved Threats Incidents
N % 1-2 threats 106 19.6 3-5 threats 206 38.1 6-8 threats 167 30.9 9+ threats 62 11.5
Total 541 100
3.2. Complexity of incidents managed Figure 14 below shows the incident in terms of ICS levels according to the AFAC AIIMS Manual. It can be seen that 70.7% of the incidents reported were at ICS Level 3. A Level 3 incident is defined as one that is sufficiently complex to involve the full deployment of an ICS. That is, sectorisation of the fire or incident ground into divisions, each with their respective crews or teams of responders; a fully functioning
14a 14b

Owen & Dwyer (2009) AIIMS National Survey Report Bushfire CRC; University of Tasmania. [email protected]
Page 26 of 115
Incident Management Team (with personnel in the differing functional units of Operations, Planning and Logistics) and, if there are multiple Incident Management Teams in place; establishment of a regional level of coordination, as well monitoring from a State Coordination Centre (AFAC, 2005). This is not to suggest that most incidents managed are ICS level incidents but rather that these are more likely to be the most memorable.
7.4
22.0
70.7
0
20
40
60
80
% o
f pos
itive
res
pons
es
ICS level 1 ICS level 2 ICS level 3
Comparison of incident levels
Figure 14: Comparison of incident levels
Respondents were also asked to rate the complexity of the incident on a scale of 1-7. A cross-tabulation of ICS level 3 incidents by perceived levels of complexity (see Figure 15 below) shows there were a range of level 3 incidents that had varying levels of complexity according to the respondents. Given the new ratings of fire danger indices it may be appropriate to review what constitutes an ICS level 3 incident and whether there is sufficient differentiation in the emergency incident management system with the three current levels in operation.
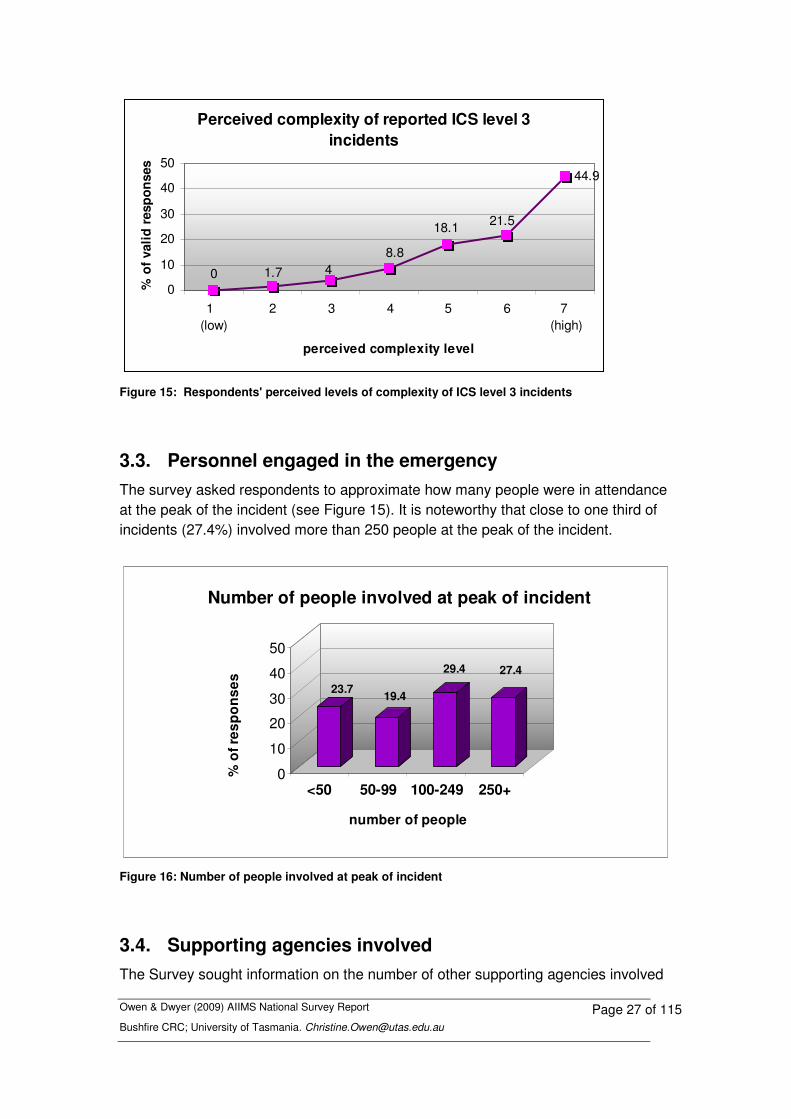
Owen & Dwyer (2009) AIIMS National Survey Report Bushfire CRC; University of Tasmania. [email protected]
Page 27 of 115
Perceived complexity of reported ICS level 3 incidents
44.9
0 1.7 48.8
21.518.1
0
10
20
30
40
50
1 (low)
2 3 4 5 6 7 (high)
perceived complexity level
% o
f val
id r
espo
nses
Figure 15: Respondents' perceived levels of complexity of ICS level 3 incidents
3.3. Personnel engaged in the emergency The survey asked respondents to approximate how many people were in attendance at the peak of the incident (see Figure 15). It is noteworthy that close to one third of incidents (27.4%) involved more than 250 people at the peak of the incident.
23.7 19.4
29.4 27.4
0
10
20
30
40
50
% o
f res
pons
es
<50 50-99 100-249 250+
number of people
Number of people involved at peak of incident
Figure 16: Number of people involved at peak of incident
3.4. Supporting agencies involved The Survey sought information on the number of other supporting agencies involved
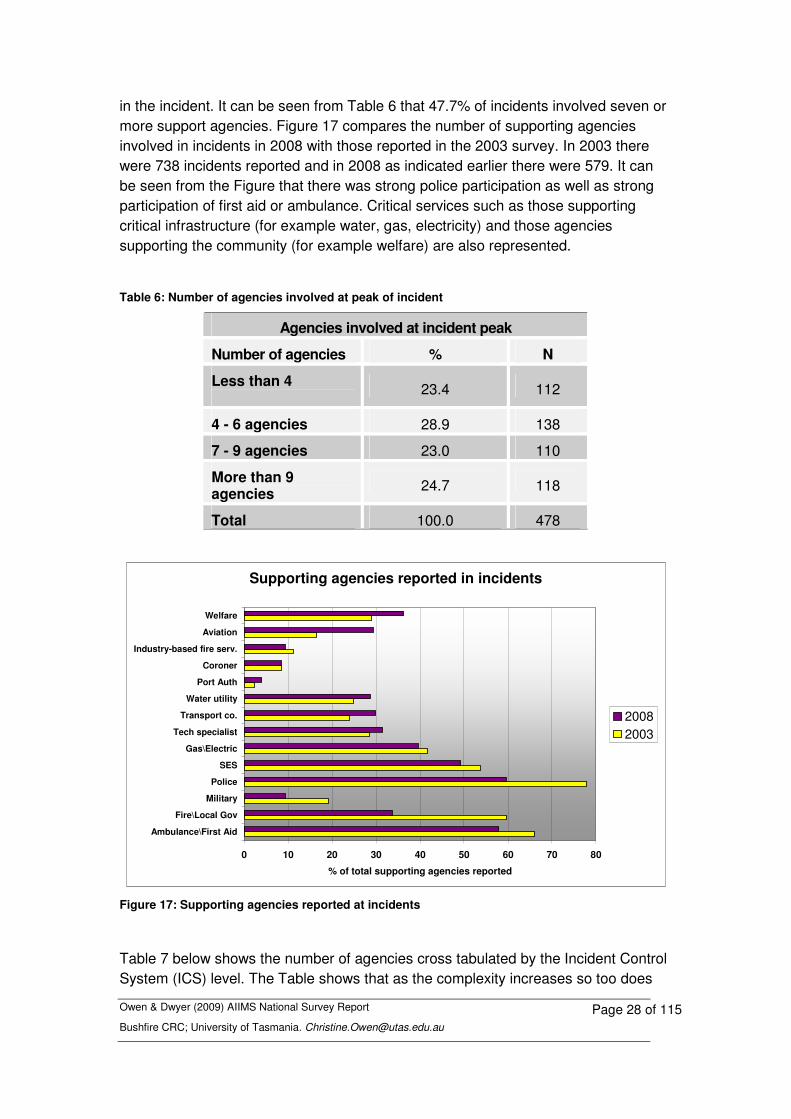
Owen & Dwyer (2009) AIIMS National Survey Report Bushfire CRC; University of Tasmania. [email protected]
Page 28 of 115
in the incident. It can be seen from Table 6 that 47.7% of incidents involved seven or more support agencies. Figure 17 compares the number of supporting agencies involved in incidents in 2008 with those reported in the 2003 survey. In 2003 there were 738 incidents reported and in 2008 as indicated earlier there were 579. It can be seen from the Figure that there was strong police participation as well as strong participation of first aid or ambulance. Critical services such as those supporting critical infrastructure (for example water, gas, electricity) and those agencies supporting the community (for example welfare) are also represented.
Table 6: Number of agencies involved at peak of incident
Agencies involved at incident peak
Number of agencies % N
Less than 4 23.4 112
4 - 6 agencies 28.9 138
7 - 9 agencies 23.0 110
More than 9 agencies 24.7 118
Total 100.0 478
Supporting agencies reported in incidents
0 10 20 30 40 50 60 70 80
Ambulance\First Aid
Fire\Local Gov
Military
Police
SES
Gas\Electric
Tech specialist
Transport co.
Water utility
Port Auth
Coroner
Industry-based fire serv.
Aviation
Welfare
% of total supporting agencies reported
20082003
Figure 17: Supporting agencies reported at incidents
Table 7 below shows the number of agencies cross tabulated by the Incident Control System (ICS) level. The Table shows that as the complexity increases so too does

Owen & Dwyer (2009) AIIMS National Survey Report Bushfire CRC; University of Tasmania. [email protected]
Page 29 of 115
the number of supporting agencies involved. In the ICS level 3 incidents reported, for example, 34% had more then 9 agencies involved. It is worth noting that with increased numbers of support agencies requiring coordination there is an additional degree of difficulty in managing emergency incidents. “The exchange of timely and accurate information and the capacity of disparate agencies to find, absorb and adapt to that information is fundamental to the ability of those same agencies to integrate their activities” (Comfort & Kapucu 2006, p. 298).
Table 7: Number of supporting agencies cross-tabulated with incident levels
Number of supporting agencies crossed with incident ICS level
ICS Level 1 ICS Level 2 ICS Level 3
N % N % N % Less than 4 agencies 9 34.6 41 45.1 49 15.6
4 - 6 agencies 9 34.6 35 38.5 73 23.2
7 - 9 agencies 5 19.3 12 13.1 85 27.1
More than 9 agencies
3 11.5 3 3.3 107 34.1
Total 26 100.0 91 100.0 314 100.0
3.4.1. Summary
In terms of the first research question, the AIIMS system is in use for a variety of different types of natural emergency incidents. The findings also show the levels of complexity within emergency incident management in Australia (and in some respects New Zealand, though the sample size is small). The emergency events managed frequently involved multiple threats, large numbers of personnel requiring coordination and considerable inter-agency co-operation. There is a wide variety of complexity reported across what is currently described as a ‘Level 3’ incident. In terms of assisting to articulate the coordination and interagency requirements a more finely grained set of indices may be worthy of consideration.

Owen & Dwyer (2009) AIIMS National Survey Report Bushfire CRC; University of Tasmania. [email protected]
Page 30 of 115
4. Processes supporting information flow within AIIMS
The whole purpose of AIIMS is to provide a common management framework to assist with the effective and efficient control of incidents through the use of common structures for “appropriate communication between organisations at all levels of the incident [because it] establishes a cohesive chain of command within the incident management structure” (AFAC, 2005 p.3). This section will address the research questions:
• To what degree are the processes embedded within AIIMS to support information flow and coordination practiced by personnel engaged in emergency incident management?; and,
• Have these practices improved since AIIMS was introduced nationally in 2004?
4.1. Information flow on arrival at the incident The survey included a number of items to assess information flow and people’s readiness to perform particular roles when engaged in incident management. Table 8 below shows a cross tabulation of a number of items that were asked in 2003 and compares the responses to the same questions asked again in 2008.
Table 8: A 2003 and 2008 data comparison of information flow and readiness to perform particular roles
Cross tabulation of 2003 and 2008 data – readiness to perform role
2003 2008
Yes
N (%)
No
N (%)
Total
N (%)
Yes
N (%)
No
N (%)
Total
N (%)
Role advised 665 (94) 42 (5.9) 707 (100) 420 (72.5) 159 (27.5) 579 (100)
Clear who to report to 581 (78.7) 142 (19) 723 (100) 440 (76) 139 (24) 579 (100)
Able to report to 595 (80.7) 142 (19) 737 (100) 430 (74.3) 149 (25.7) 579 (100)
The Table shows that in 2003 94% of respondents (n=665) stated that they had been advised of their role before arriving at the incident compared with 72% (n=420) of respondents in 2008. A Chi-square goodness-of-fit test indicates a
Owen & Dwyer (2009) AIIMS National Survey Report Bushfire CRC; University of Tasmania. [email protected]
Page 31 of 115
statistically significant difference in the proportion of respondents who were advised of their role before arriving at the incident. The proportion was lower in the current sample (72%) than the proportion in the 2003 study (94%), �² (1, n = 579), = 32.198 p< .0005.
A comparison can also be made between 2003 and 2008 on whether respondents felt it was clear to whom they should report. The Table shows that in 2003 78.7% (n=581) of personnel stated yes to this question compared with 76% (n=440) of personnel in 2008.
The survey also included an item seeking information on whether, on arrival at the incident, the respondent was able to report to this person. Table 8 shows that in 2003, 80.7% (n=595) personnel stated that they were able to report to the identified person compared with 74.3% (n=430) personnel in 2008. A Chi-square goodness-of-fit test indicates a statistically significant difference in the proportion of respondents who were able to report to a designated person on arrival at the shift. The proportion was lower in the current sample (74.3%) than the proportion in the 2003 study (80.7%), �² (1, n = 579), = 17.060 p< .0005.
These numbers indicate that the capacity to be advised of a role prior to an incident, to be able to report to a designated person on arrival, and having clarity about who to report to, has either remained static or declined in the five years between 2003 and 2008.
In terms of systemic health this trend would be worthy of further attention. One question is whether there are differences that can be accounted for from different states and/or incident phases.
A cross-tabulation is prepared in Table 9 below which reviews these items and how they were reported at different phases of the incident. It can be seen from the Table that there is a slightly lower reporting at the beginning of an incident on all three items. There are no significant differences across incident phases on whether or not it was clear whom to report to on arrival at the incident.
Figure 18 below provides a cross-tabulation of the responses by state where the incident occurred. It is interesting to note that Tasmania and Victoria report above average responses on all three questions. It can be seen from the Table that responses from other states are quite variable.
One possible explanation for this variability and for the lower scores in 2008 compared with 2003 may be that respondents were reporting lower levels of these practices because they were arriving at earlier stages of the incident.

Owen & Dwyer (2009) AIIMS National Survey Report Bushfire CRC; University of Tasmania. [email protected]
Page 32 of 115
Table 9: An incident phase comparison of information flow and readiness to perform the role prior to or on arrival at the incident
Readiness to perform role prior to arrival at the incident by phase
Phase of incident
Role advised before arrival at incident?
Clear whom to report to on arrival at
incident?
Able to report to advised person on
arrival? Yes
N (%) No N (%)
Total N (%)
Yes N (%)
No N (%)
Total N (%)
Yes N (%)
No N (%)
Total N (%)
Beginning 112 (70.4)
47 (29.6)
159 (100)
129 (81.1)
30 (18.9)
159 (100)
123 (77.4)
36 (22.6)
159 (100)
Escalation 162 (77.1)
48 (22.9)
210 (100)
173 (82.4)
37 (17.6)
210 (100)
173 (82.4)
37 (17.6)
210 (100)
Middle 127 (78.4)
35 (21.6)
162 (100)
127 (78.4)
35 (21.6)
162 (100)
124 (76.5)
38 (23.5)
162 (100)
Readiness to perform role
0 20 40 60 80 100
NSW
QLD
SA
Tas
Vic
WA
% of valid responses
Role advised beforearrival?Clear whom toreport to on arrival?Able to report toadvised person?
Figure 18: A state comparison of information flow and readiness to perform the role prior to or on arrival at the incident
The survey also included questions about the information flow processes that support enhancing awareness of the situation when an incident is being managed. Awareness of the situation is likely to be first be reported in a briefing. Therefore, items were included which asked whether a briefing occurred and the nature of the content of the briefing as well as information on the types of risk assessment tools that were employed during the incident. It can be seen from Table 11 below that 80.8% of people responded that they received a briefing when they arrived for their shift. Of the 19.2% (n=111) of people who did not receive a briefing only 37 were

Owen & Dwyer (2009) AIIMS National Survey Report Bushfire CRC; University of Tasmania. [email protected]
Page 33 of 115
reporting in the beginning phase of the incident. Once again this is perplexing and in need of further attention. However it should be noted that as the incident phase matured so too did certain elements of the emergency management systems such as providing briefings (see Table 10 below).
Table 10: Cross tabulation of 2003 and 2008 data in relation to briefings
Cross tabulation of 2003 and 2008 data - briefings
2003 2008
Yes
N (%)
No
N (%)
Total
N (%)
Yes
N (%)
No
N (%)
Total
N (%)
Did you give a briefing?
unavailable unavailable unavailable 252 (43.5)
327 (56.5)
579 (100)
Were you given a briefing?
612 (83.4)
122 (16.6)
734 (100)
468 (80.8)
111 (19.2)
579 (100)
Was there an opportunity to ask questions?
402 (99) 4 (1) 406 (100)
452 (96.6) 16 (3.4) 468
(100)
Table 11 below shows a cross tabulation of whether the respondents were given a briefing by the phase of the incident. It can be seen that, for example, 91.4% of respondents reporting on the middle of the incident phase stated that they received a briefing.
Table 11: A cross-tabulation of whether the respondents were given a briefing by phase of incident
Respondents given briefings by phase of incident
Phase of incident Given briefing?
Yes (n)
Yes (%)
No (n)
No (%)
Total (n)
Total (%)
Beginning 122 77.2 36 22.8 158 100.0
Escalation 186 89.0 23 11.0 209 100.0
Middle 148 91.4 14 8.6 162 100.0
Mop-up 9 75.0 3 25.0 12 100.0
Recovery 2 100.0 0 0.0 2 100.0
Total 467 86.0 76 14.0 543 100.0 Figure 19 below shows the nature of the content which can reasonably be expected in a briefing (AFAC, 2005). The content to be provided in briefings was outlined by AFAC in its initial survey in 2003 and included in the 2008 version. Respondents

Owen & Dwyer (2009) AIIMS National Survey Report Bushfire CRC; University of Tasmania. [email protected]
Page 34 of 115
could tick as many items as applied. It can be seen from the Figure that the majority of briefings explained the current situation; explained what had happened so far; provided an outline of the objectives, strategies and rationale for managing the incident, as well as the current and expected resourcing. Briefings also identified key operation points; boundaries in sectors where appropriate; the chain of command in the IMT and identified occupational health and safety issues.
Comparison: Did the briefing (where one was received)...?
0 10 20 30 40 50 60 70 80 90 100
Explain w hat had happened so far
Explain the current situation
Outline objectives, strategies & rationale
Id current & expected resourcing
Id alternative strategies
Id economic, social, public health & enviro risks
Id key operation points
Id boundaries of Sectors & Divisions
Outline the chain of command in the IMT
Id location of IMT personnel
Provide info on the communications plan
Id OH&S issues
Define shif t times
Utilise a SMEACS format
% of valid responses
20082003
Figure 19: Content of the briefing
A Chi-square goodness-of-fit test indicates a statistically significant difference in the proportion of respondents who received information identifying current and expected resourcing. In 2008 this proportion was higher (78%, n = 363) than the proportion in the previous 2003 study (49%), �² (1, n = 579), = 44.553 p< .0005.
In an emergency incident management context, it is clearly important to understand what resources are available and likely to be available in the future to help plan a response.
One aspect of concern is the reasonably low level of reporting that the briefing identified alternative strategies. The Figure shows that alternative strategies were identified in 36.3% of briefings reported, and, while this is an improvement on the data reported in 2003 it still seems quite a small proportion. One possible explanation could be that the incident was one of low complexity where identification of alternative strategies might not be necessary. However, this is not the case. Table 12 below provides a cross tabulation of the levels of complexity reported by whether alternative strategies were identified.
It can be seen that counter-intuitively a higher proportion of alternative strategies were identified in incidents of low complexity (ICS level 1) and that in incidents of

Owen & Dwyer (2009) AIIMS National Survey Report Bushfire CRC; University of Tasmania. [email protected]
Page 35 of 115
high complexity alternative strategies were identified 38% of the time.
In discussing this finding with a number of personnel in the industry, one issue which was highlighted was that the survey question might have been problematic in its interpretation. Does alternative strategy mean fully fledged alternative plans or contingency strategies for example?
Contingency strategies are important, particularly in highly dynamic environments. This finding was discussed in a related paper (Dwyer & Owen, 2009) and the authors pointed out that this finding raised a concern that needs to be addressed if improvements are to be made within AIIMS. There is a need to ensure there are practices supporting the capacity for contingency planning to be enhanced, given its importance in achieving consistently safe, high performance outcomes (Weick & Sutcliffe, 2001).
Table 12: A cross-tabulation of the identification of alternative strategies in the briefing (where one was received) by incident level
Incident level Alternative strategies
Yes (N)
Yes (%) No (N) No (%) Yes
Total Yes
Total
ICS level 1 15 48.4 16 51.6 31 100
ICS level 2 27 31.8 58 68.2 85 100
ICS level 3 118 38.1 192 61.9 310 100
Total 160 37.5 266 62.4 426 100
4.2. Information flow during an incident There are a variety of tools embedded within AIIMS that are to be used to provide a common communications framework to enhance coordination. These include the use of an Incident Action Plan to generate and communicate intent and to provide advice to stakeholders on the planned management of the incident. There are also other risk management and assessment tools and protocols that are to be used to support consistency in communication and coordination approaches. The practice of their use as reported in the survey will now be discussed.
4.2.1. Use of an Incident Action Plan In a Level 3 incident for example, an Incident Action Plan is prepared within the Incident Management Team and provided to the Divisional Commanders for dissemination to personnel on the incident or fire-ground. Its purpose is to set the strategy for the overall coordination of the incident management effort. The Incident Action Plan is also forwarded to regional and state levels of coordination to inform them about the overall operational decisions being taken.
Figure 20 below shows that use of an Incident Action Plan had increased in 2008

Owen & Dwyer (2009) AIIMS National Survey Report Bushfire CRC; University of Tasmania. [email protected]
Page 36 of 115
compared with 2003. In 2008 55% of respondents reported that they received an Incident Action Plan. Of concern is that in 2008 the same proportion of respondents as in 2003 (37%) stated they did not receive an Incident Action Plan.
Comparison: Did you receive an IAP?
47.6
37.0
55.1
37.7
0 10 20 30 40 50 60
Yes
No
% of positive responses
2008
2003
(N = 218)
(N = 273)
(N = 319)
(N = 351)
Figure 20: Did you receive an Incident Action Plan: 2003 and 2008.
Table 13 below shows a cross-tabulation between receipt of an Incident Action Plan and incident phase. Of the 545 respondents who answered both questions, 39.6% received an incident action plan in a beginning phase of the incident and this increased 60% for those reporting on an escalation phase and 75% for those who reported on the middle phase.
It is interesting to note that of those reporting on an escalation phase 39.5% of respondents stated that they did not receive an Incident Action Plan, either verbal or written.
Table 13: Cross-tabulation between receipt of an Incident Action Plan and the incident phase
Incident phase Received an Incident Action Plan?
Yes (N)
Yes (%)
No (N) No (%) Yes Total
Yes Total
Beginning 63 39.6 96 60.3 159 100
Escalation 127 60. 83 39.5 210 100
Middle 121 75 41 19.5 162 100
Mop-up 5 . 7 . 426 100
Recovery 2 . 0 . 2 100
Total 318 58.3 227 41.6 545 100

Owen & Dwyer (2009) AIIMS National Survey Report Bushfire CRC; University of Tasmania. [email protected]
Page 37 of 115
It is also interesting to note that of the respondents in 2008 who stated that they did not receive an Incident Action Plan 25.6% were on the fire or incident ground. It is difficult to understand how a coordinated effort would be managed without access to an Incident Action Plan. Of further interest, is that half the respondents who stated they did not receive an Incident Action Plan were personnel operating in an Incident Management Team in the roles of the Incident Controller/Deputy Incident controller; Planning, Operations or Logistics Officer. One possible explanation for this finding could be that the Incident Management Team perceive that they produce the plan for others. It is not known whether this finding means that respondents perceive that they don’t receive a plan for their own work or whether it means that team members don’t receive a copy of the Plan that is supposed to drive the strategy for the incident. If the latter then this needs further attention.
Figure 21 below shows the types of content included in the Incident Action Plan. As with briefings, the item asking about the type of content expected in an Incident Action Plan was included in the AFAC 2003 survey and so can be used as a comparison.
Did the Incident Action Plan (where one was received) include...?
0 20 40 60 80 100
Overall objectives
Strategies for divisions/sectors
Info on alternative strategies
Resources allocated to sectors/divs
Site plan
Medical plan
Info/contact details of agencies
Communications plan
Predictions of incident development
Organisational chart
Safety condiderations
% of valid responses
20082003
Figure 21: Comparison between all agencies in 2003 and 2008: Did the Incident Action Plan (where one was received) include certain items?
This Figure illustrates the increasing application of particular forms of information within the Incident Action Plan, when compared to 2003. It shows that the most common content included in the Incident Action Plan includes the overall objectives, the strategies for each division and/or sector and a map or site plan of the incident location. Once again providing information on alternative strategies is one of the lowest in comparison with 2003 and has declined in 2008. It is also interesting to note that the prediction of the development of the incident is included in only 50.8% of

Owen & Dwyer (2009) AIIMS National Survey Report Bushfire CRC; University of Tasmania. [email protected]
Page 38 of 115
cases.
Once again, emergency incident management would be difficult without an understanding of the predicted development of the incident. Table 14 below shows the cross-tabulation of the incident phase by whether the Incident Action Plan included predictions of the development of the incident. It can be seen that predictions of how the incident is anticipated to develop is only included for 38% of cases in the middle of the incident; and in only 39% of cases when the incident is in an escalation phase. Out of 210 incidents reported in the escalation phase and in which an Incident Action Plan was given, 29.5% of cases included predictions of the development of the incident.
This potentially illustrates the difficulty of providing predictions and also highlights how difficult emergency incident management must be without this information.
Table 14: Cross-tabulation of the incident phase by whether the Incident Action Plan included predictions of the development of the incident
Prediction development
Incident phase Yes (N) Yes (%) No (N) No (%) Total N (%)
Beginning 36 22.6 123 77.4 159 (100)
Escalation 62 29.5 148 70.5 210 (100)
Middle 63 38.9 99 610.1 162 (100)
Mop up 4 33.3 8 66.7 12 (100)
Recovery 1 50.0 1 50.0 2 (100)
An additional cross tabulation with ICS level is provided in Table 15 below. The Table shows that in incidents of ICS level 3 there is still only one third of all Incident Action Plans including some estimation of the predicted development of the incident. This represents a serious concern.
Table 15: Cross-tabulation between incident complexity and the inclusion of prediction of development in the Incident Action Plan
Incident level Prediction Development
Yes (N)
Yes (%)
No (N) No (%) Yes Total
Yes Total
ICS level 1 11 29.7 26 70.3 37 100
ICS level 2 32 29.1 78 70.9 110 100
ICS level 3 114 32.2 240 67.8 354 100
Total 157 31.3 344 68.7 501 100
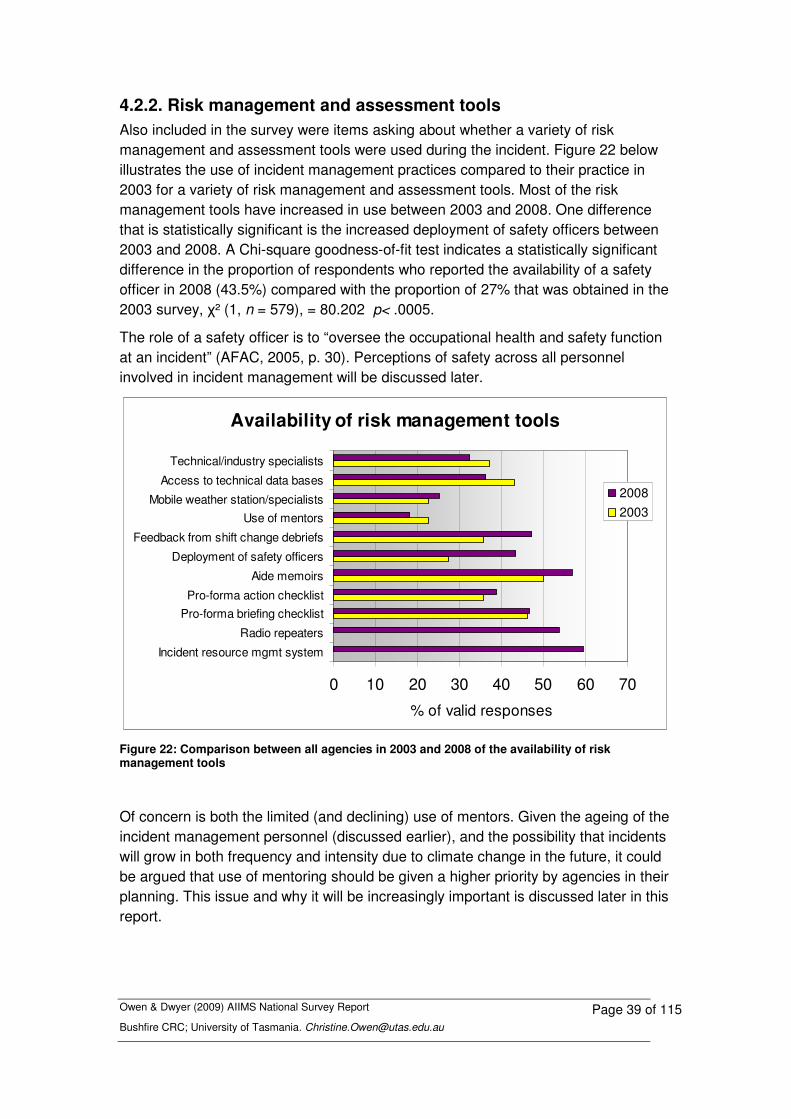
Owen & Dwyer (2009) AIIMS National Survey Report Bushfire CRC; University of Tasmania. [email protected]
Page 39 of 115
4.2.2. Risk management and assessment tools Also included in the survey were items asking about whether a variety of risk management and assessment tools were used during the incident. Figure 22 below illustrates the use of incident management practices compared to their practice in 2003 for a variety of risk management and assessment tools. Most of the risk management tools have increased in use between 2003 and 2008. One difference that is statistically significant is the increased deployment of safety officers between 2003 and 2008. A Chi-square goodness-of-fit test indicates a statistically significant difference in the proportion of respondents who reported the availability of a safety officer in 2008 (43.5%) compared with the proportion of 27% that was obtained in the 2003 survey, �² (1, n = 579), = 80.202 p< .0005.
The role of a safety officer is to “oversee the occupational health and safety function at an incident” (AFAC, 2005, p. 30). Perceptions of safety across all personnel involved in incident management will be discussed later.
Availability of risk management tools
0 10 20 30 40 50 60 70
Incident resource mgmt system
Radio repeaters
Pro-forma briefing checklistPro-forma action checklist
Aide memoirs
Deployment of safety officers
Feedback from shift change debriefs
Use of mentorsMobile weather station/specialists
Access to technical data bases
Technical/industry specialists
% of valid responses
20082003
Figure 22: Comparison between all agencies in 2003 and 2008 of the availability of risk management tools
Of concern is both the limited (and declining) use of mentors. Given the ageing of the incident management personnel (discussed earlier), and the possibility that incidents will grow in both frequency and intensity due to climate change in the future, it could be argued that use of mentoring should be given a higher priority by agencies in their planning. This issue and why it will be increasingly important is discussed later in this report.

Owen & Dwyer (2009) AIIMS National Survey Report Bushfire CRC; University of Tasmania. [email protected]
Page 40 of 115
4.2.3. Span of control
According to the AIIMS Manual (AFAC 2005, p. 5) the span of control is a concept that relates to the number of groups or individuals that can be successfully supervised by one person and at the same time maintain a supervisor’s ability to effectively task, monitor and evaluate the performance of those reporting groups or individuals. The Manual recommends a maximum of five reporting groups.
To assess this concept, the survey included the question During the shift: At most, how many people reported directly to you at any one time? 95% of responses fell between 1 and 50 persons. Higher outliers were removed because it was clear the respondent had not understood the intent of the question (e.g., an answer of 400 was regarded as untenable). Included in Table 16 below are the median scores cross-tabulated by phases of the incident.
Table 16: Number of persons reporting directly to the respondent cross-tabulated with incident phases
No people reporting directly to respondent at any one time by incident phase
Beginning Escalation Middle Mop up Recovery Total
State Coord 8 4 4.5 6 5
Reg’nl Coord 4.5 6 8.5 5 6
IMT Officers 5 5 5 8 5
IMT functional unit
5 4.5 5.5 5
Div/Sec Com 7 5.5 6.5 9 . 6
Crew/Strike T 12 5.5 4 5.5 6
Total 6 5 5 6 6 5
The Table shows how, overall, the span of control concept recommending a direct reporting of five personnel appears to hold, though there are considerable differences depending on the position within AIIMS and the phase of the incident. One interpretation is that the differences indicate where the system has not geared up sufficiently and that appropriate structure and resources are not yet in place. For example, at the beginning of an incident, the State level of Coordination and the Ground appear to be under pressure. In an escalation and middle phase the regional coordination level exceeds recommended span of control reporting while the State and Ground areas have settled. While activity is understandably winding down within the mop up phase span of control reporting also appears at risk within the IMT and on the Ground.
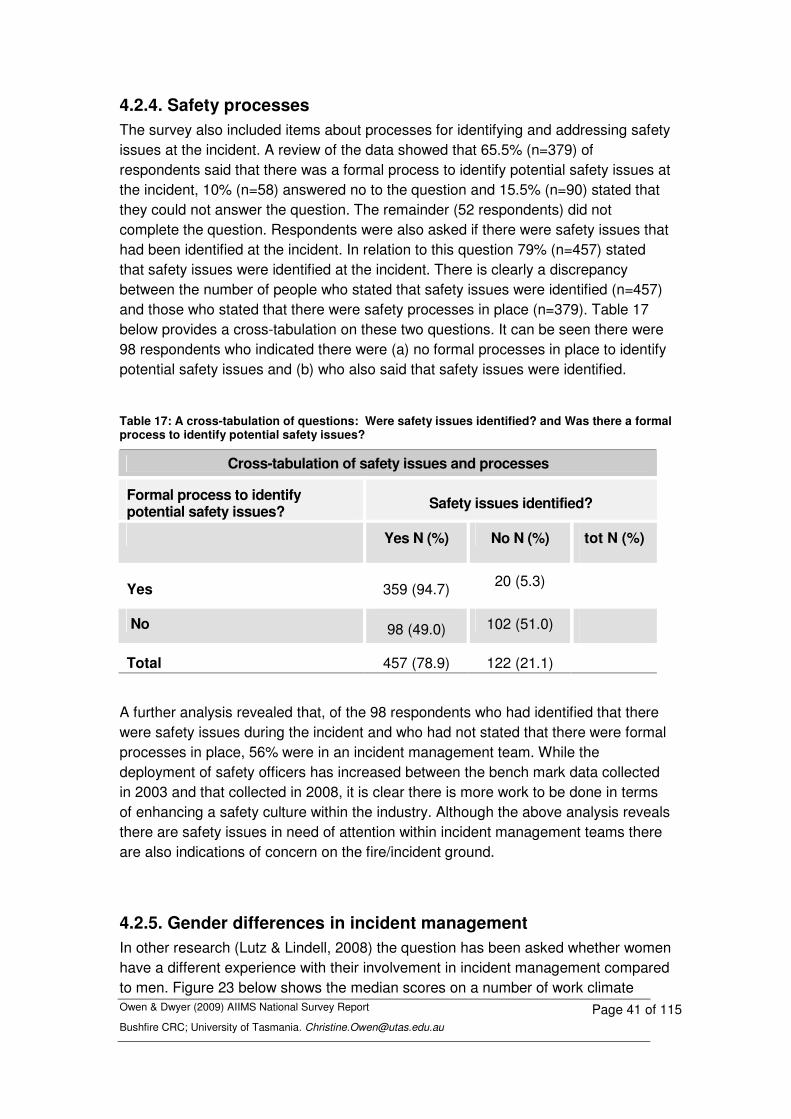
Owen & Dwyer (2009) AIIMS National Survey Report Bushfire CRC; University of Tasmania. [email protected]
Page 41 of 115
4.2.4. Safety processes The survey also included items about processes for identifying and addressing safety issues at the incident. A review of the data showed that 65.5% (n=379) of respondents said that there was a formal process to identify potential safety issues at the incident, 10% (n=58) answered no to the question and 15.5% (n=90) stated that they could not answer the question. The remainder (52 respondents) did not complete the question. Respondents were also asked if there were safety issues that had been identified at the incident. In relation to this question 79% (n=457) stated that safety issues were identified at the incident. There is clearly a discrepancy between the number of people who stated that safety issues were identified (n=457) and those who stated that there were safety processes in place (n=379). Table 17 below provides a cross-tabulation on these two questions. It can be seen there were 98 respondents who indicated there were (a) no formal processes in place to identify potential safety issues and (b) who also said that safety issues were identified.
Table 17: A cross-tabulation of questions: Were safety issues identified? and Was there a formal process to identify potential safety issues?
Cross-tabulation of safety issues and processes
Formal process to identify potential safety issues? Safety issues identified?
Yes N (%) No N (%) tot N (%)
Yes 359 (94.7) 20 (5.3)
No 98 (49.0) 102 (51.0)
Total 457 (78.9) 122 (21.1)
A further analysis revealed that, of the 98 respondents who had identified that there were safety issues during the incident and who had not stated that there were formal processes in place, 56% were in an incident management team. While the deployment of safety officers has increased between the bench mark data collected in 2003 and that collected in 2008, it is clear there is more work to be done in terms of enhancing a safety culture within the industry. Although the above analysis reveals there are safety issues in need of attention within incident management teams there are also indications of concern on the fire/incident ground.
4.2.5. Gender differences in incident management In other research (Lutz & Lindell, 2008) the question has been asked whether women have a different experience with their involvement in incident management compared to men. Figure 23 below shows the median scores on a number of work climate
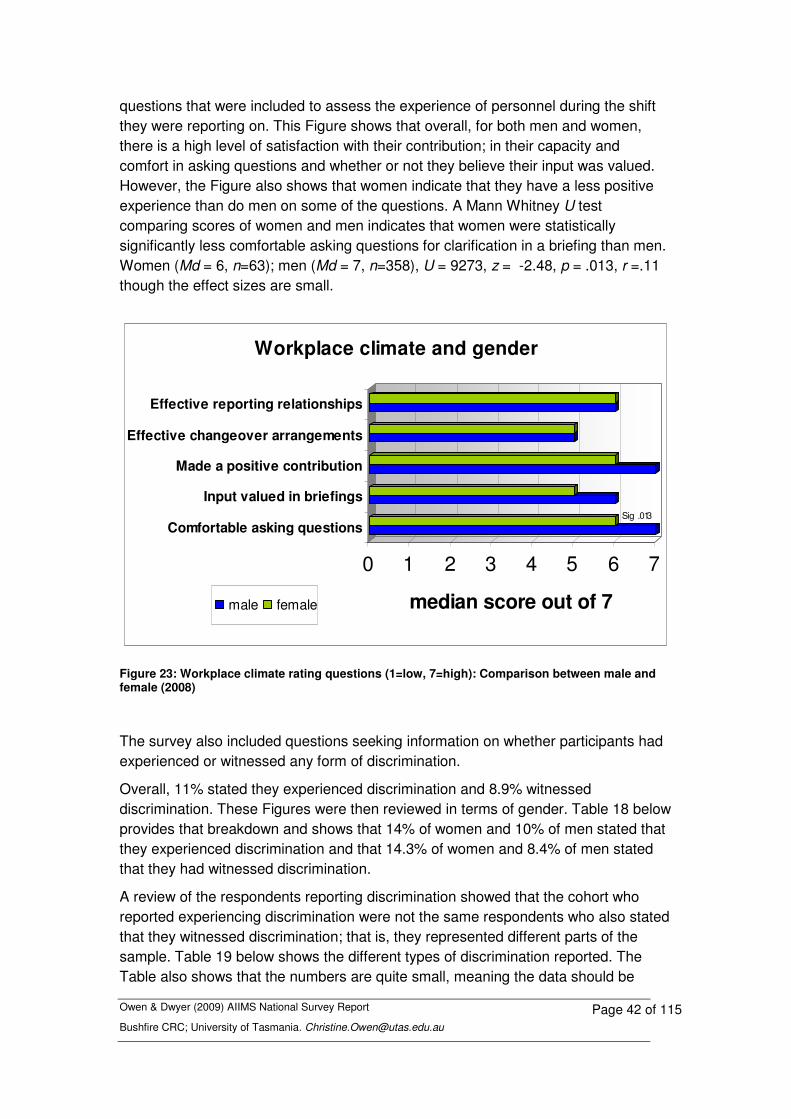
Owen & Dwyer (2009) AIIMS National Survey Report Bushfire CRC; University of Tasmania. [email protected]
Page 42 of 115
questions that were included to assess the experience of personnel during the shift they were reporting on. This Figure shows that overall, for both men and women, there is a high level of satisfaction with their contribution; in their capacity and comfort in asking questions and whether or not they believe their input was valued. However, the Figure also shows that women indicate that they have a less positive experience than do men on some of the questions. A Mann Whitney U test comparing scores of women and men indicates that women were statistically significantly less comfortable asking questions for clarification in a briefing than men. Women (Md = 6, n=63); men (Md = 7, n=358), U = 9273, z = -2.48, p = .013, r =.11 though the effect sizes are small.
0 1 2 3 4 5 6 7
median score out of 7
Comfortable asking questions
Input valued in briefings
Made a positive contribution
Effective changeover arrangements
Effective reporting relationships
Workplace climate and gender
male female
Sig .013
Figure 23: Workplace climate rating questions (1=low, 7=high): Comparison between male and female (2008)
The survey also included questions seeking information on whether participants had experienced or witnessed any form of discrimination.
Overall, 11% stated they experienced discrimination and 8.9% witnessed discrimination. These Figures were then reviewed in terms of gender. Table 18 below provides that breakdown and shows that 14% of women and 10% of men stated that they experienced discrimination and that 14.3% of women and 8.4% of men stated that they had witnessed discrimination.
A review of the respondents reporting discrimination showed that the cohort who reported experiencing discrimination were not the same respondents who also stated that they witnessed discrimination; that is, they represented different parts of the sample. Table 19 below shows the different types of discrimination reported. The Table also shows that the numbers are quite small, meaning the data should be

Owen & Dwyer (2009) AIIMS National Survey Report Bushfire CRC; University of Tasmania. [email protected]
Page 43 of 115
treated with caution. Inter-agency discrimination was added in the focus groups and then tested and validated in subsequent focus groups during the review phase. This element of discrimination had the highest numbers, with bullying being the most prevalent.
Table 18: Respondents witnessing or experiencing discrimination
Respondents Experiencing or Witnessing Discrimination
Male Female Experienced Discrimination N % N %
Yes 42 10.2 10 14.1 No 370 89.8 61 85.9
Total 412 100.0 71 100.0 Witnessed Discrimination N % N %
Yes 35 8.4 10 14.3
No 381 91.6 60 85.7
Total 416 100.0 70 100.0
Table 19: Types of discrimination experienced and witnessed by female and male respondents
Discrimination Experienced & Witnessed by Respondents
Experienced Witnessed Female
N Male
N Female
N Male
N Racial 1 0 0 0
Sexual discrimination
4 1 3 1
Sexual harassment 1 0 1 0
Sexual orientation 0 0 0 1
Age related 3 1 3 2
Bullying 3 7 5 9
Inter-agency 6 27 7 21
4.2.6. Factors that prevented personnel from doing their job effectively
The survey included items aiming to assess whether there were any factors that prevented respondents from doing their job effectively.
34.2% (n=198) of respondents stated there were factors that prevented them from doing their job effectively. A review of the text written to explain what prevented

Owen & Dwyer (2009) AIIMS National Survey Report Bushfire CRC; University of Tasmania. [email protected]
Page 44 of 115
respondents from doing their job indicates different concerns for different states. The following synopsis is extracted from executive summaries prepared for states where the response rate was sufficient to conduct a state-based analysis of like agencies (e.g., NSW rural and land management agencies). Included in the synopsis are three illustrative concerns mentioned for each of the states.
Tasmania
In Tasmania the respondents’ concerns were about:
• communication between the IMT and the fire/incident ground; • communication from the State level which was regarded as
“interference” that added “unnecessary confusion”; and,
• a lack of basic resources (e.g., equipment on the fire/incident ground).
New South Wales
In NSWRLM agencies the respondents’ concerns were about:
• differences between inter-agency communications; • difficulties of inter-agency coordination made problematic through
different layers of required authorisation between agencies; and,
• difficulties when key personnel “go mobile” and lose the ability to effectively control their units and coordination the services of other agencies.
South Australia
In South Australia the respondents’ concerns were about;
• lack of interagency coordination and follow-up (e.g., not following up with the Bureau of meteorology (BOM) that they had received data in order to provide forecasts);
• lack of clarity in reporting, including at changeover; and,
• lack of resources, particularly in the escalating phase of the incident.
Western Australia
In FESA the respondents’ concerns were about:
• “Fatigue – had already worked normal days work then sent to incident to relieve IMT. Then expected to conduct normal days work again the next day. After 36 hours working was asked to attend another incident (refused)”;

Owen & Dwyer (2009) AIIMS National Survey Report Bushfire CRC; University of Tasmania. [email protected]
Page 45 of 115
• “Significant involvement from the state which added to misinformation and confusion, State also implemented certain strategies that were not communicated and did not involve consultation with the IC or other members of the IMT”; and,
• “In beginning was invited to planning meetings then was left out. This meant it was difficult to prepare the required sitreps to be forwarded”.
Queensland
In Queensland the respondents’ concerns were about:
• “Roles of regional ICC and SOCC not following information flow processes”;
• “Lack of IMS understanding in other agencies”; and,
• “Lack of clarity in reporting, including at changeover”.
Victoria
In Victorian the respondents’ concerns were about:
• “Lack of directions; Inconsistent directions; Lack of radio reception; Lack of feedback from IMT”;
• “An individual calling up and trying to influence who was in command of the sector when he was not even mentioned in the IAP”; and,
• “Local volunteer brigades working outside of AIIMS. Multi-agency staff not experienced in the role, or adequately skilled, in the role they were appointed to undertake”.
4.2.7. Job prevention factors and incident phase Across the data-set respondents who experienced factors that prevented them from doing their job effectively were most frequently in the escalation phase of the incident, regardless of when that phase occurred (i.e., the escalation phase was problematic regardless of whether it occurred in the first few hours, or days into the incident) (see Figure 24 below).
A cross tabulation of respondents who answered “yes” to the question about factors preventing them from doing their job effectively by incident phase reveals statistically significant less satisfaction of communication arrangements, as well as teamwork indicators and organisational arrangements supporting the incident (this is discussed in more detail later in this report).
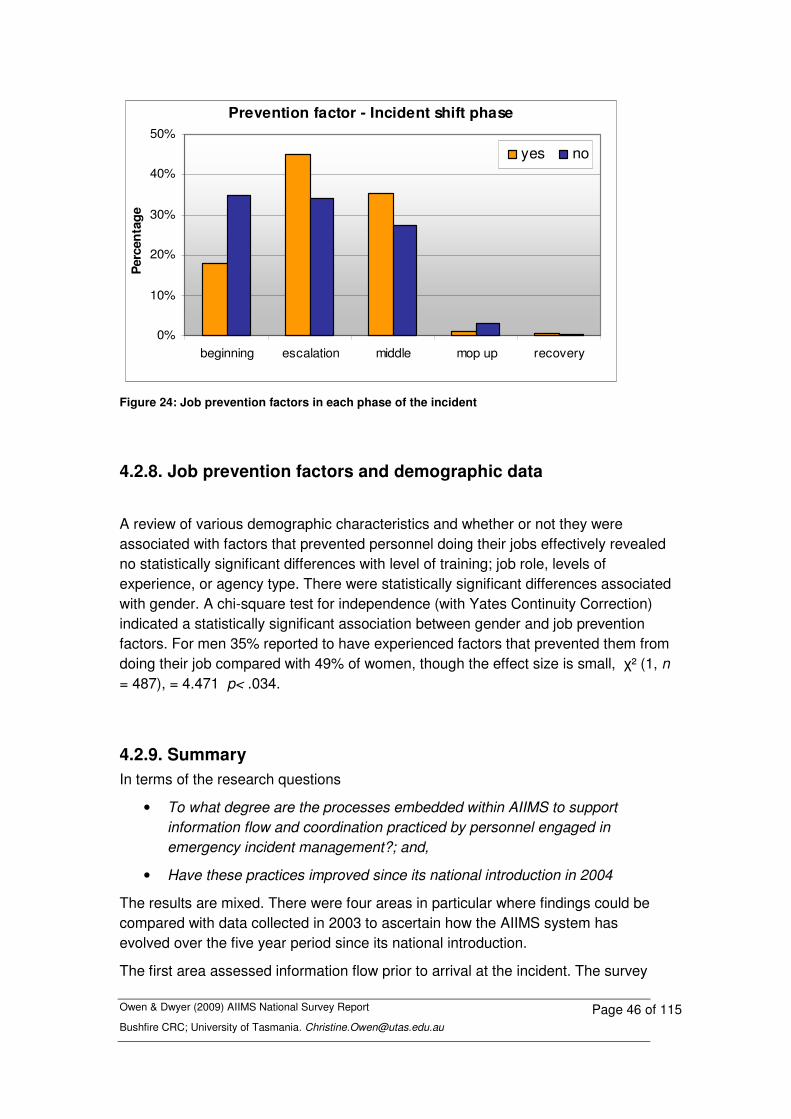
Owen & Dwyer (2009) AIIMS National Survey Report Bushfire CRC; University of Tasmania. [email protected]
Page 46 of 115
Prevention factor - Incident shift phase
0%
10%
20%
30%
40%
50%
beginning escalation middle mop up recovery
Per
cen
tage
yes no
Figure 24: Job prevention factors in each phase of the incident
4.2.8. Job prevention factors and demographic data
A review of various demographic characteristics and whether or not they were associated with factors that prevented personnel doing their jobs effectively revealed no statistically significant differences with level of training; job role, levels of experience, or agency type. There were statistically significant differences associated with gender. A chi-square test for independence (with Yates Continuity Correction) indicated a statistically significant association between gender and job prevention factors. For men 35% reported to have experienced factors that prevented them from doing their job compared with 49% of women, though the effect size is small, �² (1, n = 487), = 4.471 p< .034.
4.2.9. Summary In terms of the research questions
• To what degree are the processes embedded within AIIMS to support information flow and coordination practiced by personnel engaged in emergency incident management?; and,
• Have these practices improved since its national introduction in 2004
The results are mixed. There were four areas in particular where findings could be compared with data collected in 2003 to ascertain how the AIIMS system has evolved over the five year period since its national introduction.
The first area assessed information flow prior to arrival at the incident. The survey

Owen & Dwyer (2009) AIIMS National Survey Report Bushfire CRC; University of Tasmania. [email protected]
Page 47 of 115
indicates that a high proportion of personnel (between 73-76%) were able to fulfil these tasks, however the survey also shows that since 2003:
• the proportion of people who were advised of the role they would be performing prior to arrival at the incident has declined;
• being clear about who to report to on arrival has remained stable; and,
• being able to report to the designated person has declined.
The second area of comparison was information flow on arrival at the incident. On arrival at the incident 80% of personnel received a briefing (which is commensurable with the 2003 results). Of the 111 people who did not receive a briefing only 37 were reporting at the beginning of an incident. Most personnel felt comfortable asking questions, and felt their input was valued at the briefing. However, there are gender differences, with women reporting less comfort in being able to ask questions for clarification during a briefing. Women were also more likely to experience factors that prevented them from doing their job effectively than men.
Survey results show a low reporting of information on alternative strategies (in either a briefing or in an Incident Action Plan). Only one third (38%) of personnel reported having information on alternative strategies which included if the incident was a Level 3 (and thus complex) incident.
The third area of comparison is information flow during the incident and in particular the use of tools such as Incident Action Plans and risk management and assessment tools. The use of Incident Action Plans has increased slightly since 2003. However the receipt of Incident Action Plans is still relatively low (55% received an Incident Action Plan), though this increases as the incident matures. That is, 39.6% received an incident action plan in a beginning phase of the incident and this increased to 60% for those reporting on an escalation phase and to 75% for those who were in the middle phase of an incident. Of the respondents who stated that they did not receive an Incident Action Plan 25.6% were on the fire or incident ground. It is also interesting to note that predictions about the development of the incident were reported in only 50.8% of cases. Despite these issues, most personnel reported high levels of satisfaction with accuracy, relevancy of the plans. Concerns continue regarding timeliness of plans.
In terms of risk management tools in use, there has been a statistically significant increase in the deployment of safety officers since 2003. There has also been a decline in reporting of mentoring during the incident compared with 2003. Given the aging of the emergency incident management population, especially Incident Controllers this is of concern for the future sustainability of the industry.
The analysis also reviewed the span of control concept underpinning AIIMS where a direct reporting of five personnel only is recommended. This appears to be in place overall, though there are considerable differences depending on the respondent’s position within the AIIMS structure and the phase of the incident. The survey also included items about processes for identifying and addressing safety issues at the incident. In the survey 65.5% of respondents said that there was a formal process to

Owen & Dwyer (2009) AIIMS National Survey Report Bushfire CRC; University of Tasmania. [email protected]
Page 48 of 115
identify potential safety issues. However 79% stated that safety issues had been identified at the incident. Thus, there were 98 respondents who indicated there were safety issues identified at the incident and no formal safety processes in place.
One in three personnel reported they experienced factors that inhibited them from being able to effectively carry out their job. This number does not seem to be accounted for in terms of individual demographic characteristics or individual capabilities. The types of organisational factors and teamwork factors that might help account for difficulties or be of use as resources to enable improved performances will now be discussed.

Owen & Dwyer (2009) AIIMS National Survey Report Bushfire CRC; University of Tasmania. [email protected]
Page 49 of 115
5. Teamwork and distributed interaction
This section will discuss items included in the survey aimed at ascertaining levels of satisfaction with teamwork; and interaction between the IMT and the fire- or incident-ground.
First, the degree to which teamwork processes were in use in emergency incident management teams – at various positions of the incident control system – was of particular interest given the importance placed on teamwork through the entire incident control system and the research evidence that demonstrates the value of effective teamwork. At issue was the respondents’ perceptions of the degree to which the dimensions of effective teamwork identified in the research literature were in evidence within emergency incident management, and whether there were any discrepancies in perceptions of teamwork identifiable that could be targeted for possible future improvements in incident management performance.
Second, Section 4 of the survey (IMT and Incident/Fire-Ground Interaction) was included because throughout previous research phases and in the previous analysis of the AFAC 2003 survey data, the interaction between the incident management team and personnel on the fire- or incident-ground was seen as problematic . Given the oft-quoted ideal that personnel from the incident management team and those on the ground should view themselves as part of a distributed team, Section 4 of the survey included items intended to ascertain perceptions of the quality of interactions between the IMT and Incident/Fire-Ground personnel.
This section thus addresses the research question:
• To what degree are effective teamwork practices in use in emergency incident management work?
5.1. Teamwork Section 3 of the survey commenced by asking Which best described the TEAM of people you worked with most closely during the incident? Table 20, below, shows the number of respondents who were working in particular work teams at different positions within the incident control system.
It can be seen that 21 respondents advised that they were working within a state coordination centre, 36 respondents at a regional coordination centre, 108 respondents in an Incident Management Team officer role (comprising IC; DIC; Operations, Planning and Logistics Officer) and 247 respondents operating within a functional unit within the incident management team. The outline of the various divisions of labour found within the Incident Management Team was provided in Figure 1 (see Page 6). Personnel in the Planning unit, for example, include those involved in the situation unit, the information unit and so on. In the Operations Unit personnel are engaged, for example, as resources officers, radio communications

Owen & Dwyer (2009) AIIMS National Survey Report Bushfire CRC; University of Tasmania. [email protected]
Page 50 of 115
officers. Likewise, logistics personnel can be involved in catering, IT facilities, as well as other roles. In many respects the Planning Officer, Logistics Officer and Operations Officer are seen as (together with the Incident Controller and the Deputy) the core of the IMT while the IMT Officers are the interface to the workers in the various functional units. For this report, only personnel working in the functional units are included in the IMT functional unit category. Seventy nine (79) respondents worked at a division or sector role and 54 respondents worked as either as part of a crew / leader or a strike team.
Table 20: Number of respondents within AIIMS work- teams
“Which best describes the TEAM people you worked with most closely during the incident?”
N %
State Coord 21 4
Reg’nl Coord 36 7
IMT Officers 108 20
IMT functional unit
247 45
Div/Sec Com 79 14
Crew/Strike T 54 10
Total 545 100
As discussed earlier in the report, there were a number of teamwork dimensions theoretically important in the literature. These included the quality of information exchange; supporting behaviour; flexibility, team feedback, inter-positional knowledge and team attitudes and affect. In addition, reference was made to a construct from the high reliability organising (HRO) literature where there is an emphasis on encouraging a pre-occupation with failure. Selected items included in the survey were developed to tap into respondent perceptions of these teamwork dimensions.
Respondents were asked, on a scale of 1-7, where 1= strongly disagree and 7= strongly agree, to indicate their level of agreement with the statements indicated below. A “can’t answer” option was also provided. For a description of the analyses used, see Section 2.4 Analyses. The Kruskal Wallis comparison of mean-ranks based on the individual items is reported in Appendix 3 (for more information on the use of non-parametric analyses and mean-ranks, see Field, 2003).
Owen & Dwyer (2009) AIIMS National Survey Report Bushfire CRC; University of Tasmania. [email protected]
Page 51 of 115
5.2. Descriptive analyses of teamwork dimensions
5.2.1. Information Exchange As discussed earlier in this report, there were four items included in the survey to assess perceptions with regard to the quality of information exchange, namely:
• Team members exchanged information clearly;
• Team members exchanged information accurately;
• Team members kept one another well informed about work-related issues;
• There were genuine attempts to share information,
In relation to these items it can be seen from Appendix 3 that teams operating within an AIIMS structure all reported positively (medians of 6 for each ICS team) with no differences identified between any of these groups. This illustrates a high level of satisfaction with information exchange within each of the work teams.
5.2.2. Supporting Behaviour In terms of perceptions about team practices that indicated supporting behaviour, there were four items included in the survey, namely:
• Team members effectively monitored each other’s performance;
• Team members operated in an open and honest manner;
• New team members were quickly integrated into the team; and,
• I felt comfortable approaching members of this team for help if I needed it.
A review of the Table in Appendix 3 shows that overall there was support for these items although there was less satisfaction on the item: Team members effectively monitored each other’s performance. This result was statistically significant when comparing responses across the various AIIMS-related teams. Figure 25 below shows the different responses for the various teams on the item. It can be seen that potentially, the most problematic area for this element of teamwork (Supporting Behaviour) on that item is within the functional units operating within an IMT (See Figure 25 below).
Figure 25 also shows that perceptions of monitoring within the team are reported more positively on the fire- or incident-ground, while monitoring within teams is reported less positively within the various positions of coordination, and least positively within functional units in the IMT
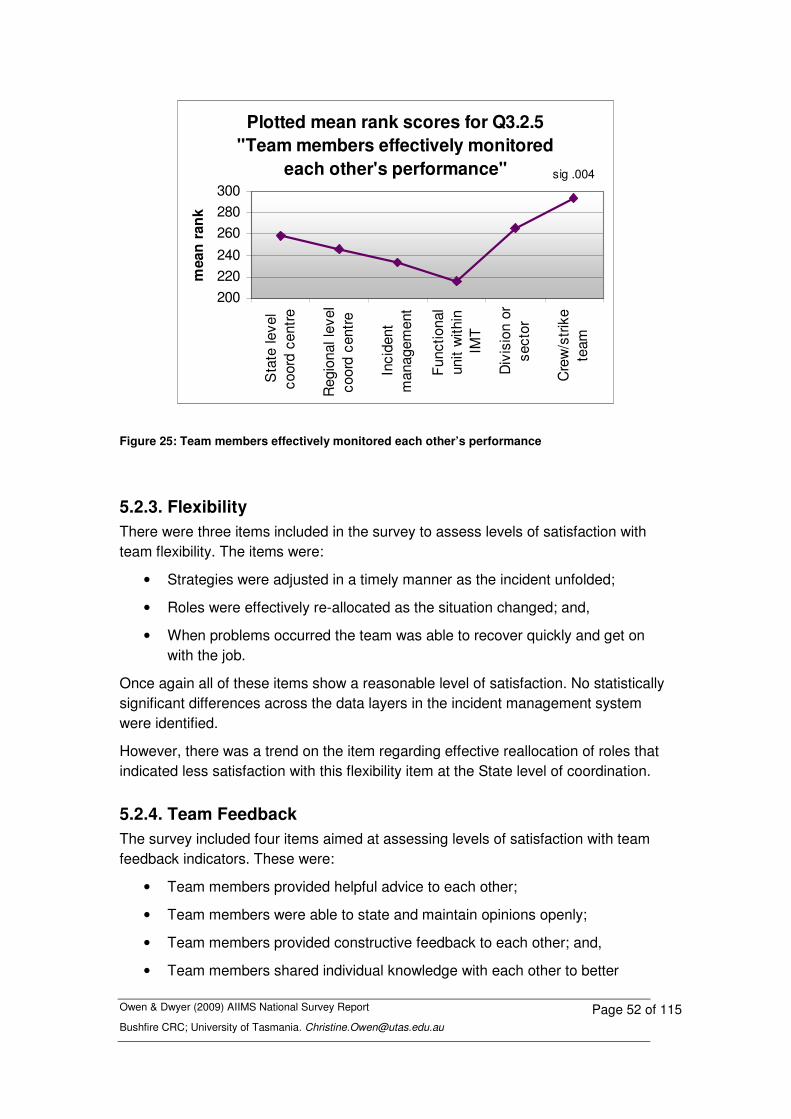
Owen & Dwyer (2009) AIIMS National Survey Report Bushfire CRC; University of Tasmania. [email protected]
Page 52 of 115
Plotted mean rank scores for Q3.2.5 "Team members effectively monitored
each other's performance"
200220240260280300
Sta
te le
vel
coor
d ce
ntre
Reg
iona
l lev
elco
ord
cent
re
Inci
dent
man
agem
ent
Func
tiona
lun
it w
ithin
IMT
Div
isio
n or
sect
or
Cre
w/s
trik
ete
am
mea
n ra
nk
sig .004
Figure 25: Team members effectively monitored each other’s performance
5.2.3. Flexibility There were three items included in the survey to assess levels of satisfaction with team flexibility. The items were:
• Strategies were adjusted in a timely manner as the incident unfolded;
• Roles were effectively re-allocated as the situation changed; and,
• When problems occurred the team was able to recover quickly and get on with the job.
Once again all of these items show a reasonable level of satisfaction. No statistically significant differences across the data layers in the incident management system were identified.
However, there was a trend on the item regarding effective reallocation of roles that indicated less satisfaction with this flexibility item at the State level of coordination.
5.2.4. Team Feedback The survey included four items aimed at assessing levels of satisfaction with team feedback indicators. These were:
• Team members provided helpful advice to each other;
• Team members were able to state and maintain opinions openly;
• Team members provided constructive feedback to each other; and,
• Team members shared individual knowledge with each other to better
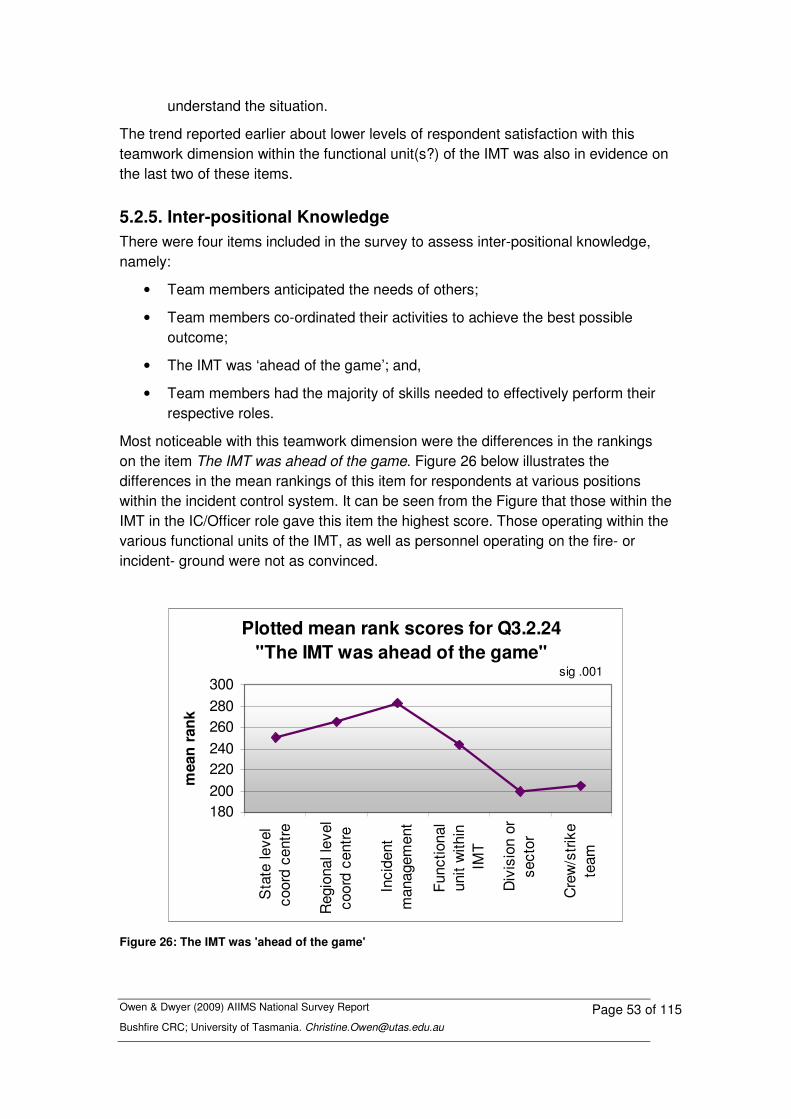
Owen & Dwyer (2009) AIIMS National Survey Report Bushfire CRC; University of Tasmania. [email protected]
Page 53 of 115
understand the situation.
The trend reported earlier about lower levels of respondent satisfaction with this teamwork dimension within the functional unit(s?) of the IMT was also in evidence on the last two of these items.
5.2.5. Inter-positional Knowledge There were four items included in the survey to assess inter-positional knowledge, namely:
• Team members anticipated the needs of others;
• Team members co-ordinated their activities to achieve the best possible outcome;
• The IMT was ‘ahead of the game’; and,
• Team members had the majority of skills needed to effectively perform their respective roles.
Most noticeable with this teamwork dimension were the differences in the rankings on the item The IMT was ahead of the game. Figure 26 below illustrates the differences in the mean rankings of this item for respondents at various positions within the incident control system. It can be seen from the Figure that those within the IMT in the IC/Officer role gave this item the highest score. Those operating within the various functional units of the IMT, as well as personnel operating on the fire- or incident- ground were not as convinced.
Plotted mean rank scores for Q3.2.24"The IMT was ahead of the game"
180200220240260280300
Sta
te le
vel
coor
d ce
ntre
Reg
iona
l lev
elco
ord
cent
re
Inci
dent
man
agem
ent
Func
tiona
lun
it w
ithin
IMT
Div
isio
n or
sect
or
Cre
w/s
trike
team
mea
n ra
nk
sig .001
Figure 26: The IMT was 'ahead of the game'
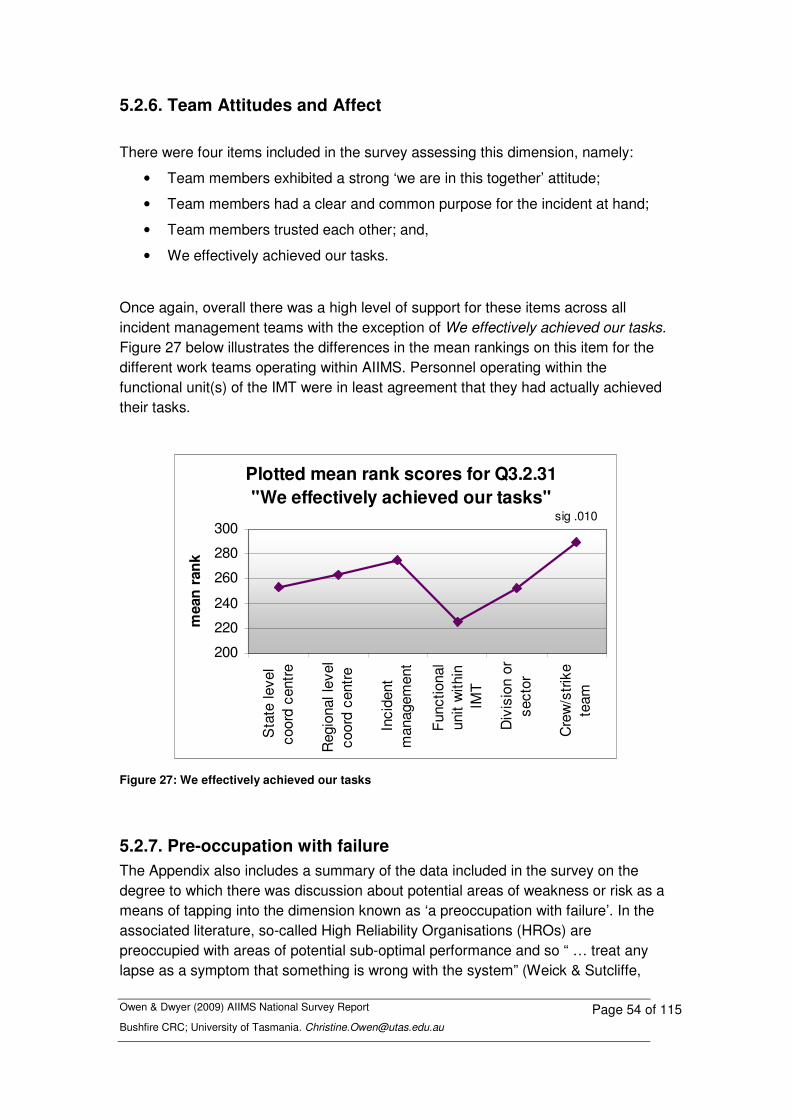
Owen & Dwyer (2009) AIIMS National Survey Report Bushfire CRC; University of Tasmania. [email protected]
Page 54 of 115
5.2.6. Team Attitudes and Affect
There were four items included in the survey assessing this dimension, namely:
• Team members exhibited a strong ‘we are in this together’ attitude;
• Team members had a clear and common purpose for the incident at hand;
• Team members trusted each other; and,
• We effectively achieved our tasks.
Once again, overall there was a high level of support for these items across all incident management teams with the exception of We effectively achieved our tasks. Figure 27 below illustrates the differences in the mean rankings on this item for the different work teams operating within AIIMS. Personnel operating within the functional unit(s) of the IMT were in least agreement that they had actually achieved their tasks.
Plotted mean rank scores for Q3.2.31"We effectively achieved our tasks"
200
220
240
260
280
300
Sta
te le
vel
coor
d ce
ntre
Reg
iona
l lev
elco
ord
cent
re
Inci
dent
man
agem
ent
Func
tiona
lun
it w
ithin
IMT
Div
isio
n or
sect
or
Cre
w/s
trike
team
mea
n ra
nk
sig .010
Figure 27: We effectively achieved our tasks
5.2.7. Pre-occupation with failure The Appendix also includes a summary of the data included in the survey on the degree to which there was discussion about potential areas of weakness or risk as a means of tapping into the dimension known as ‘a preoccupation with failure’. In the associated literature, so-called High Reliability Organisations (HROs) are preoccupied with areas of potential sub-optimal performance and so “ … treat any lapse as a symptom that something is wrong with the system” (Weick & Sutcliffe,

Owen & Dwyer (2009) AIIMS National Survey Report Bushfire CRC; University of Tasmania. [email protected]
Page 55 of 115
2001, p. 10). They do this because within such dynamic environments it could be disastrous to ignore even minor warning signals that a problem might exist.
To assess the extent to which agencies involved in emergency incident management were focussing on this dimension, the survey also sought information on the degree to which the team constructively discussed the following potential team weaknesses (where 1= no discussion; 7 = regular discussion):
• Lack of knowledge
• No continuity of strategic thinking from team to team
• Unclear information
• Lack of resources
• External influences
• Heavy workload
The Figures illustrating these items (below) highlight there were statistically significant differences reported in the data at various layers of the incident control system on 3 of these items (namely, unclear information, lack of resources, and external influences respectively). In the Figures, it is important to remember that a high mean-rank indicates a higher level of discussion about concern for the risk of the particular potential weakness. The Figures illustrate the differences in mean ranks for respondents at various layers of the incident control system.
Of most concern in Figure 28 below, is that personnel placed in the most dangerous situations (i.e. those on the incident/fire ground) were the ones who were actually less likely to discuss the possibility that a lack of clear information could constitute a potential weakness for the team. Clearly such discussions should take place because a team not receiving/disseminating regular, reliable information about the development of an incident for instance, is almost certain to miss vital small clues that something may be going/about to go awry – thus placing the crews at even greater risk. The Figure also shows how those at the State level of coordination have the highest amount of reported discussion about this concern, illustrating their frustration at receiving information.

Owen & Dwyer (2009) AIIMS National Survey Report Bushfire CRC; University of Tasmania. [email protected]
Page 56 of 115
Plotted mean rank scores for Q3.3 Unclear information
180200220240260280300320
Sta
te le
vel
coor
d ce
ntre
Reg
iona
l lev
elco
ord
cent
re
Inci
dent
man
agem
ent
Func
tiona
lun
it w
ithin
IMT
Div
isio
n or
sect
or
Cre
w/s
trike
team
mea
n ra
nk
sig .002
Figure 28: The team constructively discussed lack of clear information as a potential weakness
Again, in Figure 29, it is of interest that those on the incident/fire ground were the ones least likely to broach the possibility that a lack of resources may constitute a problem for the team. A strike team’s effectiveness is heavily dependent of the provision of appropriate resources. The Figure may indicate that concern for lack of resources is not an issue because the Teams feel that they are well resourced. It may also indicate a lack of awareness of a concern for potential for failure.
Plotted mean rank scores for Q3.3 Lack of resources
160180200220240260280300
Sta
te le
vel
coor
d ce
ntre
Reg
iona
l lev
elco
ord
cent
re
Inci
dent
man
agem
ent
Func
tiona
lun
it w
ithin
IMT
Div
isio
n or
sect
or
Cre
w/s
trike
team
mea
n ra
nk
sig .005
Figure 29: The team constructively discussed lack of resources as a potential weakness
Figure 30 shows that those closest to the action were less likely to constructively discuss the possibility that external influences were potential barriers to effective team performances. This may mean that there is no problem with external influences interfering with work undertaken on the incident/fire ground. It may also mean that as

Owen & Dwyer (2009) AIIMS National Survey Report Bushfire CRC; University of Tasmania. [email protected]
Page 57 of 115
for the previous two items on this dimension, there is no consideration given to managing any potential external influences as threats to effectiveness.
Plotted mean rank scores for Q3.3 External influences
180200220240260280300
Sta
te le
vel
coor
d ce
ntre
Reg
iona
l lev
elco
ord
cent
re
Inci
dent
man
agem
ent
Func
tiona
lun
it w
ithin
IMT
Div
isio
n or
sect
or
Cre
w/s
trike
team
mea
n ra
nksig .001
Figure 30: The team constructively discussed external influences as a potential weakness
5.2.8. Additional operational items Also included in the survey were operational items added in the focus groups when the survey was being piloted. Appendix 3 provides the data for 2 negative items included in the survey assessing the degree to which the incident management team was consistently playing catch-up and whether there was a perception there were too many hurry-up and wait type situations. The Appendix lustrates that there were no statistically significant differences across the various layers of the incident control system in this regard and that globally there was less satisfaction with too many hurry-up and wait situations.
In addition, the Appendix also includes 3 items that were included to assess operational matters such as having in place provisions to control fatigue, ensuring change-over arrangements between shifts were effective, and assessing whether the transport arrangements were also effective. It can be seen from the Appendix that there were no statistically significant differences reported across the layers of the incident control system on the item that changeover arrangements were effective.

Owen & Dwyer (2009) AIIMS National Survey Report Bushfire CRC; University of Tasmania. [email protected]
Page 58 of 115
5.3. Team-related interactions between the IMT and the ground
As discussed, the level and quality of interaction between personnel involved in an IMT and those on the fire- or incident-ground was of particular interest. Findings in relation to this part of the AIIMS teamwork equation appear below. Note that in this section of the report, we are analysing the responses from all the various ICS teams about how well they thought the IMT was interacting with personnel on the fire/ incident ground.
5.3.1. Information Exchange between the IMT and the ground
Five items were included in the survey to assess perceptions of information exchange between the IMT and the fire-or incident-ground. These included whether IMT and Fire/Incident ground personnel:
• exchanged information clearly and accurately;
• kept each other well informed;
• made genuine attempts to share information with each other
• critically appraised weaknesses in what was being undertaken; and
• there was a predetermined frequency for situation reporting from the operations area
Most of these items were reported positively by respondents from all ICS teams. However, Figure 31 below highlights that those working within the State Centre of Coordination were more strongly in agreement with the statement there was a predetermined frequency for situation reporting from the operations area than were those on the incident/fire ground. This finding points to a possible disconnect between these layers of incident management. A similar trend was reported on the item Personnel exchanged information clearly and accurately.

Owen & Dwyer (2009) AIIMS National Survey Report Bushfire CRC; University of Tasmania. [email protected]
Page 59 of 115
Perceptions of IMT/Ground interaction:"there was a pre-determined frequency for situation reporting from operations area"
180200220240260280300320
Sta
te le
vel
coor
d ce
ntre
Reg
iona
l lev
elco
ord
cent
re
Inci
dent
man
agem
ent
Func
tiona
lun
it w
ithin
IMT
Div
isio
n or
sect
or
Cre
w/s
trike
team
mea
n ra
nk
sig .009
Figure 31: There was a pre-determined frequency for situation reporting from the operations area of the fire-incident ground
5.3.2. Supporting Behaviour between the IMT and the ground In terms of perceptions about communicative practices that indicated supporting behaviour, there were two items included in the survey:
• IMT fire/incident personnel interacted in an open and honest manner; and,
• The activities of IMT fire/incident personnel were co-ordinated to achieve the best possible outcome.
Figure 32 below shows that in terms of perceptions of coordination, personnel on the incident/fire ground were less in agreement that optimal coordination was occurring and certainly not to the same extent as their IMT or regional/state colleagues. This is a potentially concerning issue, especially given the previous finding that those operating on the fire/incident ground were less likely than others working within the system to discuss the possibility that a lack of clear information may constitute a team weakness.

Owen & Dwyer (2009) AIIMS National Survey Report Bushfire CRC; University of Tasmania. [email protected]
Page 60 of 115
Perceptions of IMT/Ground interaction:"personnel activities were co-ordinated
to achieve best possible outcome"
180200220240260280300
Sta
te le
vel
coor
d ce
ntre
Reg
iona
l lev
elco
ord
cent
re
Inci
dent
man
agem
ent
Func
tiona
lun
it w
ithin
IMT
Div
isio
n or
sect
or
Cre
w/s
trike
team
mea
n ra
nk
sig .007
Figure 32: Personnel activities were coordinated to achieve the best outcome
5.3.3. Flexibility between the IMT and the ground There were three items included in the survey to assess levels of satisfaction with team flexibility. The items were:
• Strategies were adjusted in a timely manner as the incident unfolded;
• Roles were effectively re-allocated as the situation changed; and,
• When problems arose, IMT fire/incident personnel were able to recover quickly and get on with the job.
There were statistically significant differences in the reporting of the first two items across the various ICS team roles. For example, Figure 33 below highlights that perceptions of flexibility were greater at the state and regional centres of coordination than was reported on the fire/incident ground. Again, this finding points to a possible disconnect between these layers of incident management in particular.
Perceptions of IMT/Ground interaction:"Strategies were adjusted in a timely
manner as the incident unfolded"
190
210
230
250
270
290
Sta
te le
vel
coor
d ce
ntre
Reg
iona
l lev
elco
ord
cent
re
Inci
dent
man
agem
ent
Func
tiona
lun
it w
ithin
IMT
Div
isio
n or
sect
or
Cre
w/s
trike
team
mea
n ra
nk
sig .002
Figure 33: Strategies were adjusted in a timely manner as the incident unfolded

Owen & Dwyer (2009) AIIMS National Survey Report Bushfire CRC; University of Tasmania. [email protected]
Page 61 of 115
Figure 34 below shows that perceptions of the capacity to reallocate roles as the situation changed were lower within functional units of the IMT and on the fire/incident ground. Such a capability is an important feature of so-called High Reliability Organisations, and it is therefore of particular concern that those in the IMT functional units and at the Division or Sector Commander level did not think there was that effective reallocation occurring as the need arose.
Perceptions of IMT/Ground interaction:"roles were effectively re-allocated as the
situation changed"
180
200
220
240
260
280
Sta
te le
vel
coor
d ce
ntre
Reg
iona
l lev
elco
ord
cent
re
Inci
dent
man
agem
ent
Func
tiona
lun
it w
ithin
IMT
Div
isio
n or
sect
or
Cre
w/s
trike
team
mea
n ra
nk
sig .007
Figure 34: Roles were effectively re-allocated as the situation changed
5.4. Team-related Feedback between the IMT and the ground The survey included four items aimed at assessing levels of satisfaction with team feedback between the IMT and the incident/fire ground. The survey asked about the extent to which IMT Fire/Incident Ground personnel:
• provided helpful advice to each another;
• provided constructive feedback to each other;
• felt that they contributed to the decision making; and,
• shared their individual knowledge with each other to gain a better understanding of the situation at hand.
The first three of these items showed concerning trends across the various ICS teams. Reviewing the data shows a consistent level of reporting of these items from the perspective of those on the Fire-incident ground.
Figure 35 below highlights the issue in relation to how the IMT/Ground provide helpful advice to each other. Yet again, those operating closest to the action reported that they thought there were lower levels of helpful advice passing between the IMT and the incident/fire ground than did people operating elsewhere in the system.
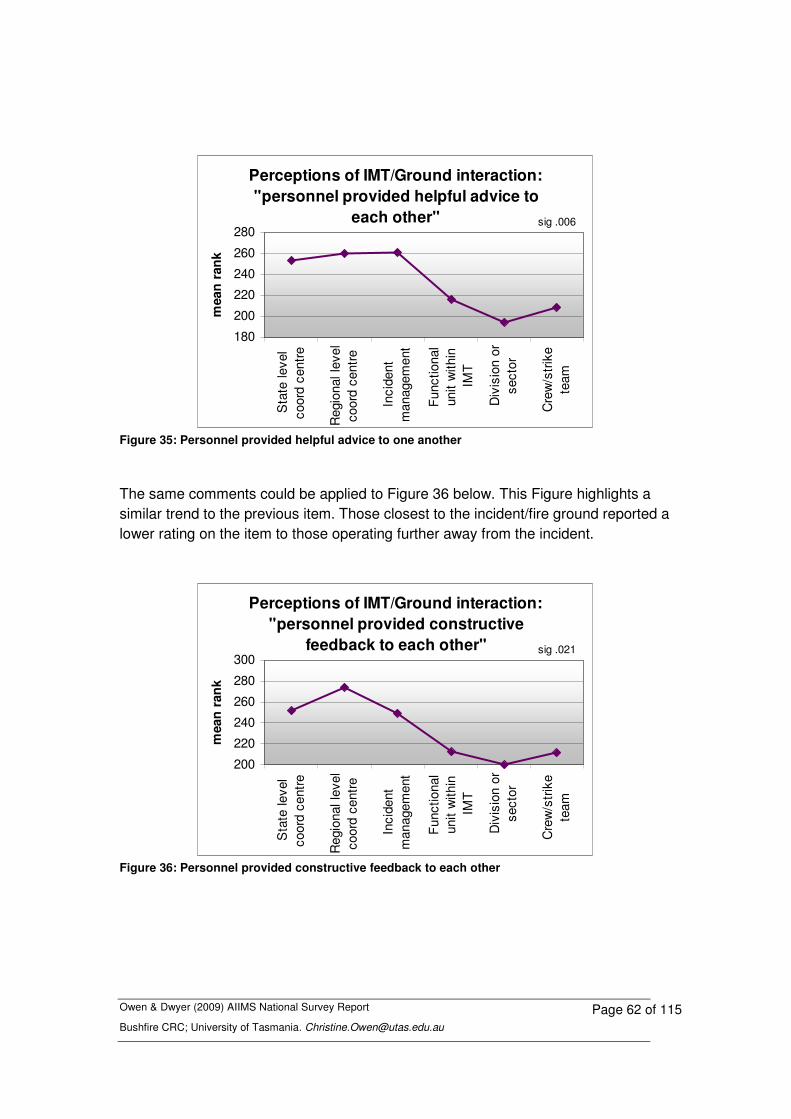
Owen & Dwyer (2009) AIIMS National Survey Report Bushfire CRC; University of Tasmania. [email protected]
Page 62 of 115
Perceptions of IMT/Ground interaction:"personnel provided helpful advice to
each other"
180
200
220
240
260
280
Sta
te le
vel
coor
d ce
ntre
Reg
iona
l lev
elco
ord
cent
re
Inci
dent
man
agem
ent
Func
tiona
lun
it w
ithin
IMT
Div
isio
n or
sect
or
Cre
w/s
trike
team
mea
n ra
nksig .006
Figure 35: Personnel provided helpful advice to one another
The same comments could be applied to Figure 36 below. This Figure highlights a similar trend to the previous item. Those closest to the incident/fire ground reported a lower rating on the item to those operating further away from the incident.
Perceptions of IMT/Ground interaction:"personnel provided constructive
feedback to each other"
200
220
240
260
280
300
Sta
te le
vel
coor
d ce
ntre
Reg
iona
l lev
elco
ord
cent
re
Inci
dent
man
agem
ent
Func
tiona
lun
it w
ithin
IMT
Div
isio
n or
sect
or
Cre
w/s
trike
team
mea
n ra
nk
sig .021
Figure 36: Personnel provided constructive feedback to each other

Owen & Dwyer (2009) AIIMS National Survey Report Bushfire CRC; University of Tasmania. [email protected]
Page 63 of 115
Figure 37 below illustrates that once again, those placed in the most potentially dangerous situation thought that personnel within the IMT and on the incident/fire ground were not involved in the decision making to the extent that people away from the incident thought they were. This is particularly concerning, given High Reliability Organisations claim to routinely migrate decision making to those most able to make the decision – regardless of where they may be working within the system.
Perceptions of IMT/Ground interaction:"personnel felt that they contributed to
the decision making"
170190210230250270290
Sta
te le
vel
coor
d ce
ntre
Reg
iona
l lev
elco
ord
cent
re
Inci
dent
man
agem
ent
Func
tiona
lun
it w
ithin
IMT
Div
isio
n or
sect
or
Cre
w/s
trike
team
mea
n ra
nk
sig .0005
Figure 37: Personnel felt that they contributed to the decision making
5.4.1. Inter-positional Knowledge sharing between the IMT and the ground
There were two items included to assess inter-positional knowledge:
• IMT Fire/Incident Ground personnel anticipated the needs of others; and,
• I had the confidence that I and the others had the skills needed to effectively perform our respective roles.
Again, a comparison of medians and of mean-ranks for perceptions about the degree to which IMT and Ground personnel anticipated the needs of others was statistically significantly different across the various ICS team groups.
Figure 38 below shows that those in the IMT in the IC/Officer roles had a higher level of agreement on this item than those on the incident/fire ground. It is somewhat worrying that perceptions were so different between the two groups who are the focus of this part of the analysis. Apparently those working within the IMT perceived there was a higher level of needs anticipating occurring between the IMT and incident/fire ground than did those people working on the incident/fire ground itself.
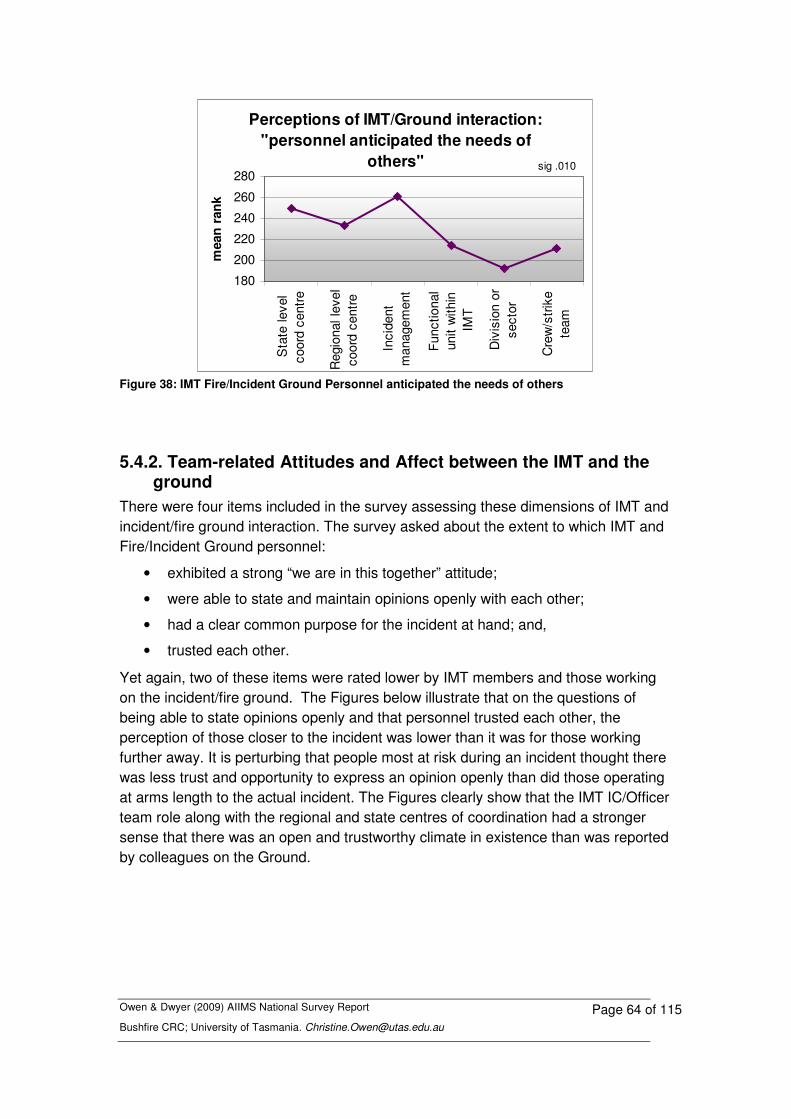
Owen & Dwyer (2009) AIIMS National Survey Report Bushfire CRC; University of Tasmania. [email protected]
Page 64 of 115
Perceptions of IMT/Ground interaction:"personnel anticipated the needs of
others"
180
200
220
240
260
280
Sta
te le
vel
coor
d ce
ntre
Reg
iona
l lev
elco
ord
cent
re
Inci
dent
man
agem
ent
Func
tiona
lun
it w
ithin
IMT
Div
isio
n or
sect
or
Cre
w/s
trike
team
mea
n ra
nk
sig .010
Figure 38: IMT Fire/Incident Ground Personnel anticipated the needs of others
5.4.2. Team-related Attitudes and Affect between the IMT and the ground
There were four items included in the survey assessing these dimensions of IMT and incident/fire ground interaction. The survey asked about the extent to which IMT and Fire/Incident Ground personnel:
• exhibited a strong “we are in this together” attitude;
• were able to state and maintain opinions openly with each other;
• had a clear common purpose for the incident at hand; and,
• trusted each other.
Yet again, two of these items were rated lower by IMT members and those working on the incident/fire ground. The Figures below illustrate that on the questions of being able to state opinions openly and that personnel trusted each other, the perception of those closer to the incident was lower than it was for those working further away. It is perturbing that people most at risk during an incident thought there was less trust and opportunity to express an opinion openly than did those operating at arms length to the actual incident. The Figures clearly show that the IMT IC/Officer team role along with the regional and state centres of coordination had a stronger sense that there was an open and trustworthy climate in existence than was reported by colleagues on the Ground.
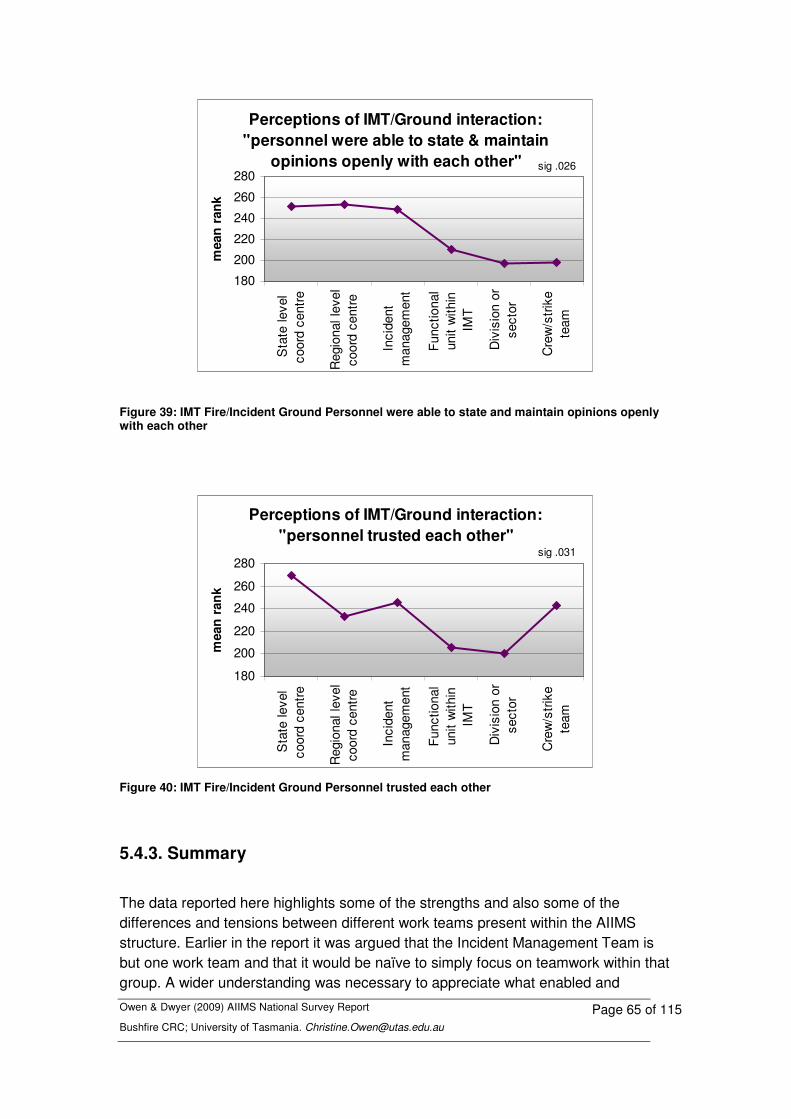
Owen & Dwyer (2009) AIIMS National Survey Report Bushfire CRC; University of Tasmania. [email protected]
Page 65 of 115
Perceptions of IMT/Ground interaction:"personnel were able to state & maintain
opinions openly with each other"
180
200
220
240
260
280
Sta
te le
vel
coor
d ce
ntre
Reg
iona
l lev
elco
ord
cent
re
Inci
dent
man
agem
ent
Func
tiona
lun
it w
ithin
IMT
Div
isio
n or
sect
or
Cre
w/s
trike
team
mea
n ra
nk
sig .026
Figure 39: IMT Fire/Incident Ground Personnel were able to state and maintain opinions openly with each other
Perceptions of IMT/Ground interaction:"personnel trusted each other"
180
200
220
240
260
280
Sta
te le
vel
coor
d ce
ntre
Reg
iona
l lev
elco
ord
cent
re
Inci
dent
man
agem
ent
Func
tiona
lun
it w
ithin
IMT
Div
isio
n or
sect
or
Cre
w/s
trike
team
mea
n ra
nk
sig .031
Figure 40: IMT Fire/Incident Ground Personnel trusted each other
5.4.3. Summary
The data reported here highlights some of the strengths and also some of the differences and tensions between different work teams present within the AIIMS structure. Earlier in the report it was argued that the Incident Management Team is but one work team and that it would be naïve to simply focus on teamwork within that group. A wider understanding was necessary to appreciate what enabled and

Owen & Dwyer (2009) AIIMS National Survey Report Bushfire CRC; University of Tasmania. [email protected]
Page 66 of 115
constrained effective emergency management performance across the wide range of teams present within AIIMS.
The survey provided the opportunity to assess teamwork within state and regional levels of coordination; and within the various work groups important on the fire- or Incident Ground as well as within the Incident Management Team. The findings show that in terms of the teamwork dimensions reported as important in the literature, there are no intra-team differences on information exchange; flexibility and team attitudes.
There were however, statistically significant differences in perceptions of supporting behaviour, with less reported within IMT functional units, particularly in the areas of accessing team-feedback to improve performance as well as monitoring behaviour. Included also was an item assessing what is known as ‘pre-occupation with failure’ in the High Reliability literature. Concerns with failure and with the risks of unclear information, for example, increased the further away from the Ground the Team was, with the State level of coordination reporting the highest level of concern.
These comparisons indicate there is a greater need to achieve better quality interaction occurring between the personnel on the Fire or Incident-Ground and those in the Incident Management Team. Also suggested is the need to develop better processes at regional and state levels to monitor disturbances or difficulties with this level of interaction.
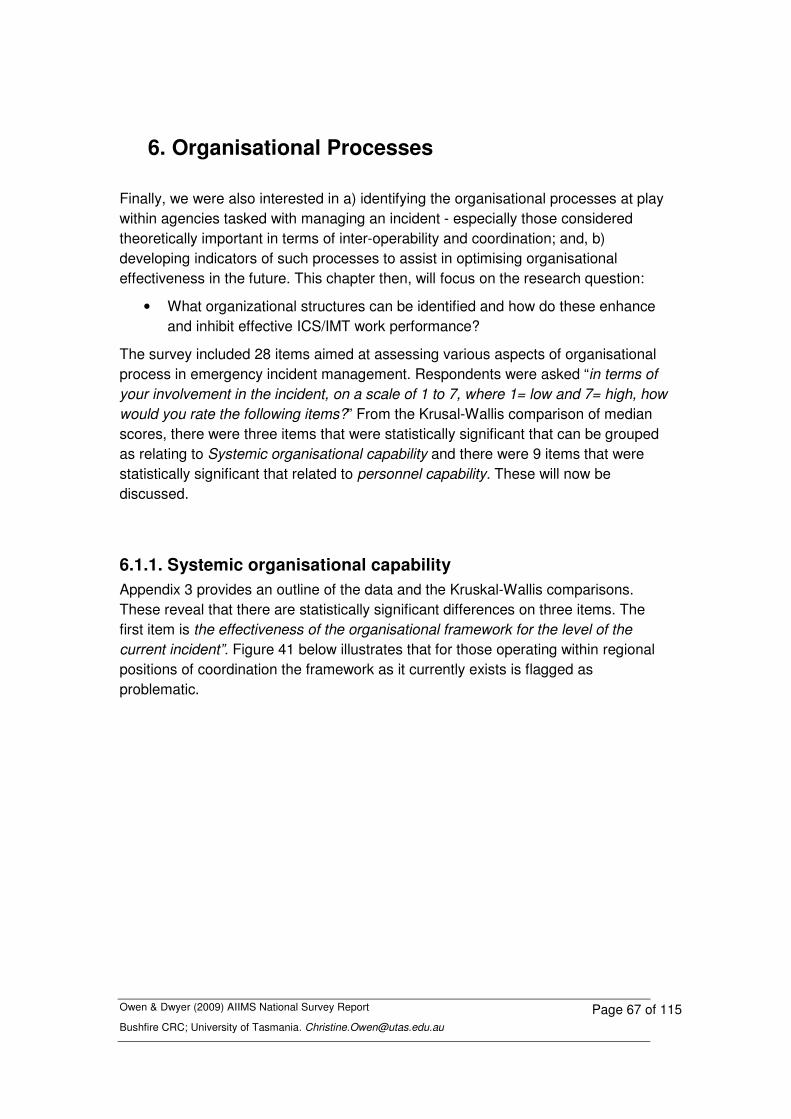
Owen & Dwyer (2009) AIIMS National Survey Report Bushfire CRC; University of Tasmania. [email protected]
Page 67 of 115
6. Organisational Processes
Finally, we were also interested in a) identifying the organisational processes at play within agencies tasked with managing an incident - especially those considered theoretically important in terms of inter-operability and coordination; and, b) developing indicators of such processes to assist in optimising organisational effectiveness in the future. This chapter then, will focus on the research question:
• What organizational structures can be identified and how do these enhance and inhibit effective ICS/IMT work performance?
The survey included 28 items aimed at assessing various aspects of organisational process in emergency incident management. Respondents were asked “in terms of your involvement in the incident, on a scale of 1 to 7, where 1= low and 7= high, how would you rate the following items?” From the Krusal-Wallis comparison of median scores, there were three items that were statistically significant that can be grouped as relating to Systemic organisational capability and there were 9 items that were statistically significant that related to personnel capability. These will now be discussed.
6.1.1. Systemic organisational capability Appendix 3 provides an outline of the data and the Kruskal-Wallis comparisons. These reveal that there are statistically significant differences on three items. The first item is the effectiveness of the organisational framework for the level of the current incident”. Figure 41 below illustrates that for those operating within regional positions of coordination the framework as it currently exists is flagged as problematic.
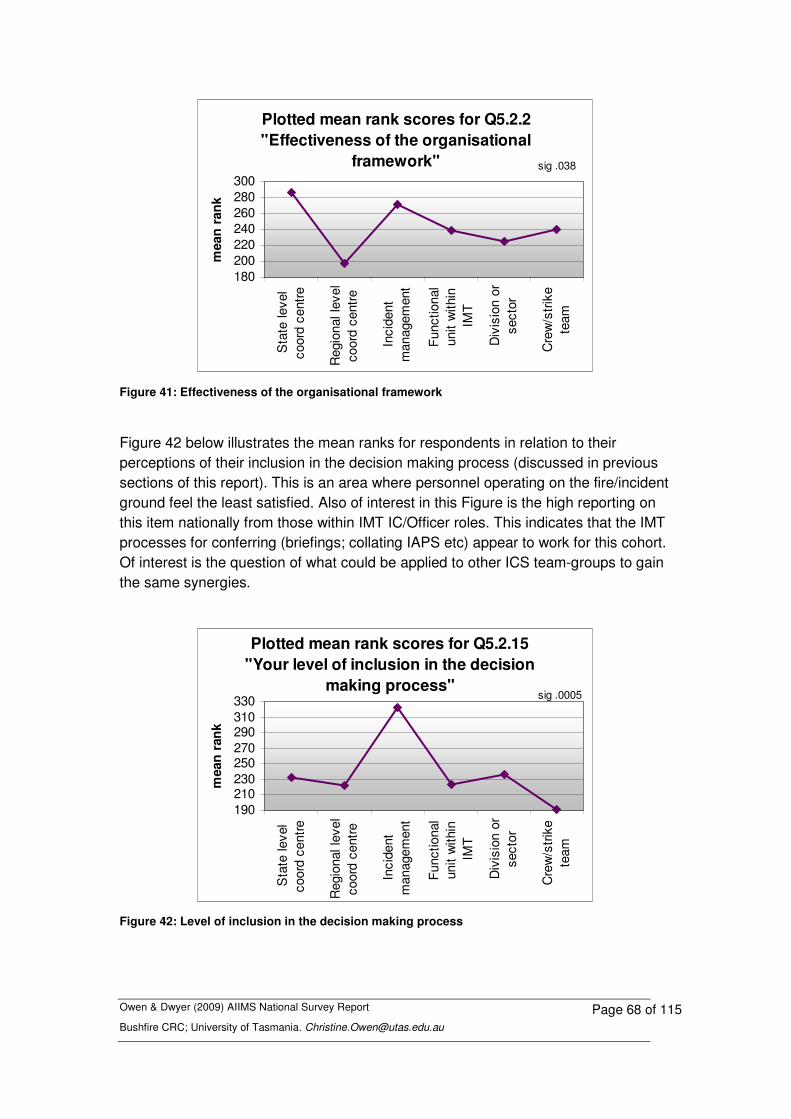
Owen & Dwyer (2009) AIIMS National Survey Report Bushfire CRC; University of Tasmania. [email protected]
Page 68 of 115
Plotted mean rank scores for Q5.2.2 "Effectiveness of the organisational
framework"
180200220240260280300
Sta
te le
vel
coor
d ce
ntre
Reg
iona
l lev
elco
ord
cent
re
Inci
dent
man
agem
ent
Func
tiona
lun
it w
ithin
IMT
Div
isio
n or
sect
or
Cre
w/s
trike
team
mea
n ra
nk
sig .038
Figure 41: Effectiveness of the organisational framework
Figure 42 below illustrates the mean ranks for respondents in relation to their perceptions of their inclusion in the decision making process (discussed in previous sections of this report). This is an area where personnel operating on the fire/incident ground feel the least satisfied. Also of interest in this Figure is the high reporting on this item nationally from those within IMT IC/Officer roles. This indicates that the IMT processes for conferring (briefings; collating IAPS etc) appear to work for this cohort. Of interest is the question of what could be applied to other ICS team-groups to gain the same synergies.
Plotted mean rank scores for Q5.2.15 "Your level of inclusion in the decision
making process"
190210230250270290310330
Sta
te le
vel
coor
d ce
ntre
Reg
iona
l lev
elco
ord
cent
re
Inci
dent
man
agem
ent
Func
tiona
lun
it w
ithin
IMT
Div
isio
n or
sect
or
Cre
w/s
trike
team
mea
n ra
nk
sig .0005
Figure 42: Level of inclusion in the decision making process

Owen & Dwyer (2009) AIIMS National Survey Report Bushfire CRC; University of Tasmania. [email protected]
Page 69 of 115
Another area that was identified as problematic was the area of adequacy of information at changeover (see Figure 43 below). This appears to be more of a problem for those in crew leader/strike team leader roles, divisional commander/ sector roles level, as well as in regional centres of coordination.
Plotted mean rank scores for Q5.2.26 "Adequacy of information provided at
changeover"
180200220240260280
Sta
te le
vel
coor
d ce
ntre
Reg
iona
l lev
elco
ord
cent
re
Inci
dent
man
agem
ent
Func
tiona
lun
it w
ithin
IMT
Div
isio
n or
sect
or
Cre
w/s
trike
team
mea
n ra
nk
sig .005
Figure 43: Adequacy of information provided at changeover
6.1.2. Organisational processes supporting personnel capability
There were also six items compiled into a factor labelled “personnel capability”. The inter-relationships of these items will be further discussed in Section 7.3.2 of this report. These were:
• Level of informal knowledge (see Figure 44)
• Familiarity with incident management system in use (see Figure 45)
• Training for the incident (see Figure 46)
• Understanding of policies/procedures during incident (see Figure 47)
• Certainty about what needed to be done (see Figure 48)
• Understanding about who to contact for information/expertise (see Figure 49)
It can be seen from reviewing the Figures that those respondents reporting from regional centres of coordination are less satisfied with their capability on each of these items. The item your certainty of who to contact was lowest in the functional unit of the IMT.

Owen & Dwyer (2009) AIIMS National Survey Report Bushfire CRC; University of Tasmania. [email protected]
Page 70 of 115
Plotted mean rank scores for Q5.2.4 "Your level of informal knowledge
(experience)"
180200220240260280
Sta
te le
vel
coor
d ce
ntre
Reg
iona
l lev
elco
ord
cent
re
Inci
dent
man
agem
ent
Func
tiona
lun
it w
ithin
IMT
Div
isio
n or
sect
or
Cre
w/s
trik
ete
am
mea
n ra
nk
sig .009
Figure 44: Your level of informal knowledge (experience)
Plotted mean rank scores for Q5.2.11 "Your familiarity with the IMS being
used"
180200220240260280300
Sta
te le
vel
coor
d ce
ntre
Reg
iona
l lev
elco
ord
cent
re
Inci
dent
man
agem
ent
Func
tiona
lun
it w
ithin
IMT
Div
isio
n or
sect
or
Cre
w/s
trike
team
mea
n ra
nk
sig .002
Figure 45: Your familiarity with the Incident Management System (IMS) being used
Plotted mean rank scores for Q5.2.3"Your training for the incident at hand"
180200220240260280300
Sta
te le
vel
coor
d ce
ntre
Reg
iona
l lev
elco
ord
cent
re
Inci
dent
man
agem
ent
Func
tiona
lun
it w
ithin
IMT
Div
isio
n or
sect
or
Cre
w/s
trik
ete
am
mea
n ra
nk
sig .017
Figure 46: Your training for the incident at hand
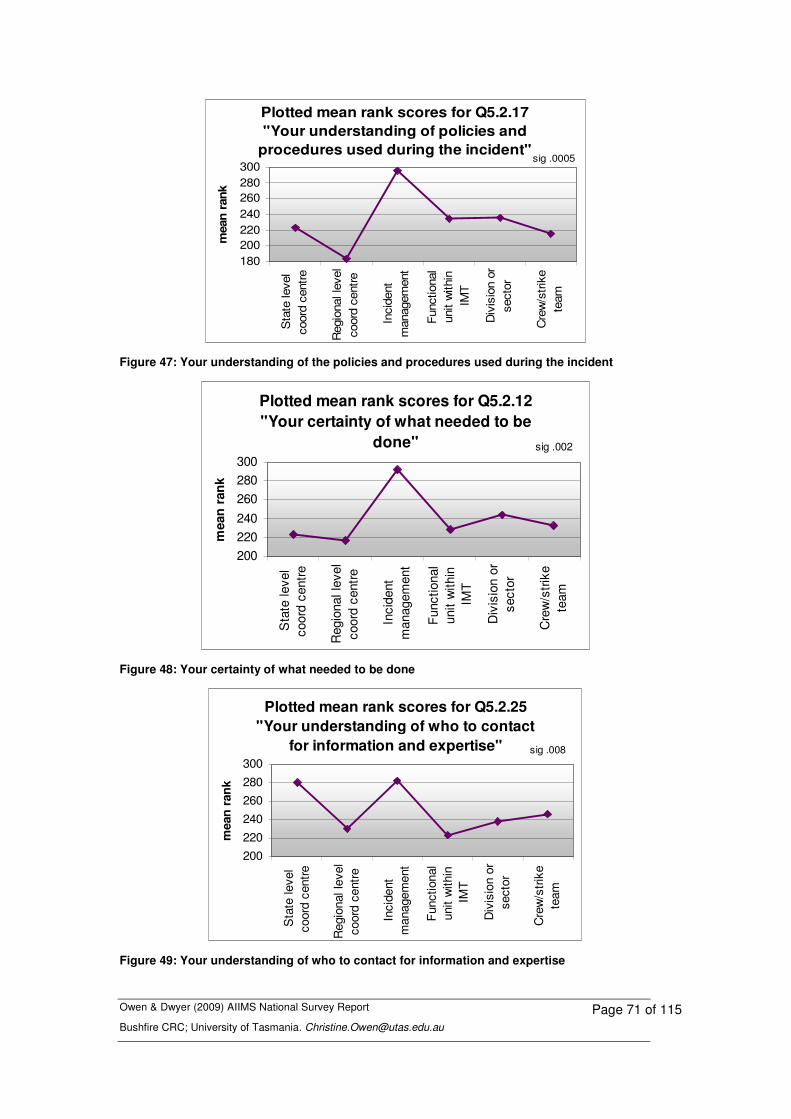
Owen & Dwyer (2009) AIIMS National Survey Report Bushfire CRC; University of Tasmania. [email protected]
Page 71 of 115
Plotted mean rank scores for Q5.2.17 "Your understanding of policies and
procedures used during the incident"
180200220240260280300
Sta
te le
vel
coor
d ce
ntre
Reg
iona
l lev
elco
ord
cent
re
Inci
dent
man
agem
ent
Fun
ctio
nal
unit
with
inIM
T
Div
isio
n or
sect
or
Cre
w/s
trik
ete
am
mea
n ra
nk
sig .0005
Figure 47: Your understanding of the policies and procedures used during the incident
Plotted mean rank scores for Q5.2.12 "Your certainty of what needed to be
done"
200220240260280300
Sta
te le
vel
coor
d ce
ntre
Reg
iona
l lev
elco
ord
cent
re
Inci
dent
man
agem
ent
Func
tiona
lun
it w
ithin
IMT
Div
isio
n or
sect
or
Cre
w/s
trike
team
mea
n ra
nk
sig .002
Figure 48: Your certainty of what needed to be done
Plotted mean rank scores for Q5.2.25 "Your understanding of who to contact
for information and expertise"
200220240260280300
Sta
te le
vel
coor
d ce
ntre
Reg
iona
l lev
elco
ord
cent
re
Inci
dent
man
agem
ent
Fun
ctio
nal
unit
with
inIM
T
Div
isio
n or
sect
or
Cre
w/s
trike
team
mea
n ra
nk
sig .008
Figure 49: Your understanding of who to contact for information and expertise

Owen & Dwyer (2009) AIIMS National Survey Report Bushfire CRC; University of Tasmania. [email protected]
Page 72 of 115
6.1.3. Summary This section provided findings addressing the research question
• What organizational structures can be identified and how do these enhance and inhibit effective ICS/IMT work performance?
From analysis of the data nine organisational process items were significant in their statistical differences reported from different work teams within the AIIMS structure. These nine items coalesce around two main themes that will be discussed at length in Section 7 Factors enhancing and inhibiting incident management effectiveness. Three of the items group within a theme characterised as systemic organisational capability. These relate to levels of satisfaction with reporting relationships and organisational arrangements underpinning AIIMS. These items show that particular work groups within AIIMS, such as those involved in regional coordination and those respondents reporting from the Ground, are less satisfied than their counterparts. In addition there are six items included in a theme characterised as personnel capability. These items show how those respondents reporting from regional centres of coordination are less satisfied on all items.
Owen & Dwyer (2009) AIIMS National Survey Report Bushfire CRC; University of Tasmania. [email protected]
Page 73 of 115
7. Factors enhancing and inhibiting incident
management effectiveness
In addition to analysing the individual items and their implications for various work groups within AIIMS it is important to understand their relationships to one another and to examine the degree to which they might predict incident management effectiveness or point towards issues that need to be systematically addressed if improvements are to be made. In undertaking these analyses the intention was to address the final research question:
• What collective practices and organizational processes can be identified that need to be improved in order to enhance IMT/ICS work performance?
As discussed in Section 2.4 Analyses a Principal Components Analysis (PCA) was conducted with the three survey components discussed in the previous sections (teamwork, interaction with the fire- or incident-ground and organisational processes). The analysis revealed four intra-team factors (team working; preoccupation with failure; shift resources; temporal responsiveness) two inter-team factors (distributed sense making; flexibility) three intra-organisational factors (systemic capability; personnel capability and organisational impediments) and one inter-organisational factor (inter-operability).
This approach also allowed for further analysis of concerns for different work groups within AIIMS as well as for an analysis of the degree to which these elements could account for whether personnel confronted factors that prevented them from doing their job effectively.
7.1. Four teamwork conditions In conducting a Principal Components Analysis on the items discussed in the Teamwork section of the survey (see Appendix 3), four teamwork factors (or components) were identified that explained 63% of the variance for all of the responses (and had a KMO sampling adequacy of .949). These are discussed below.
7.1.1. Team working Of the items included in the Teamwork section of the survey, 24 were subsumed into one factor which, for the purposes of this report is called “teamwork”. The items included in the Team working conditions are reported in Table 21 below.
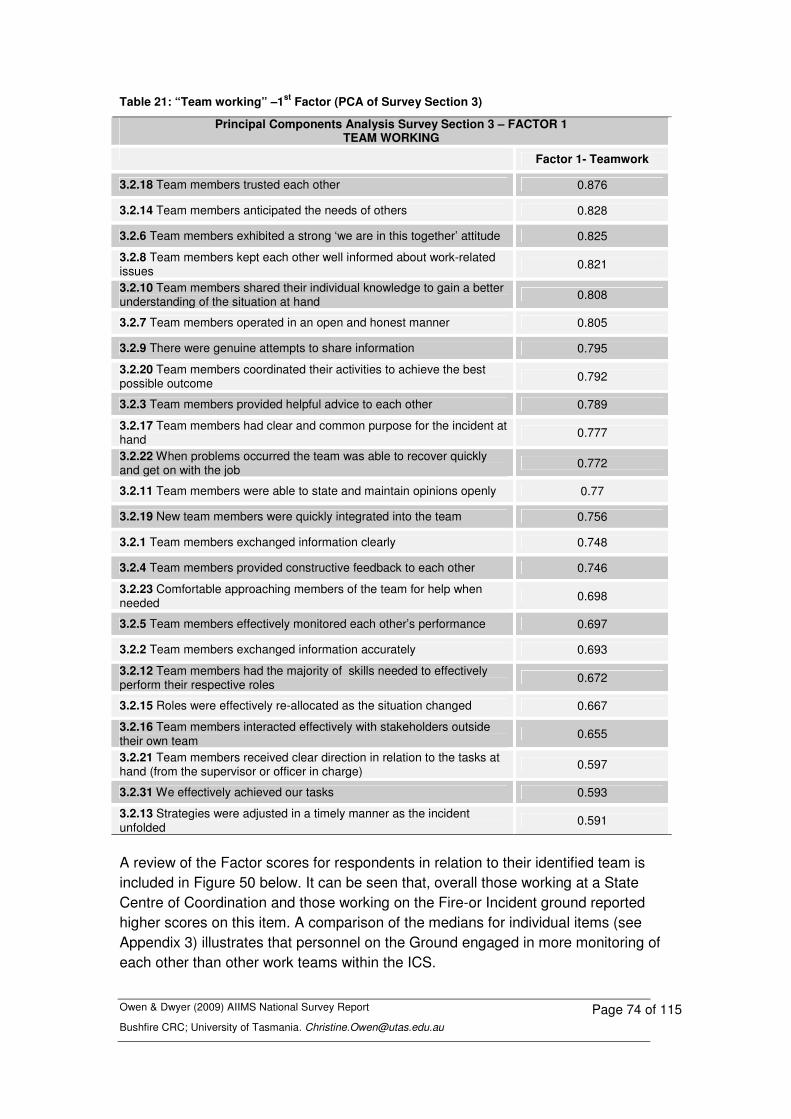
Owen & Dwyer (2009) AIIMS National Survey Report Bushfire CRC; University of Tasmania. [email protected]
Page 74 of 115
Table 21: “Team working” –1st Factor (PCA of Survey Section 3)
Principal Components Analysis Survey Section 3 – FACTOR 1 TEAM WORKING
Factor 1- Teamwork
3.2.18 Team members trusted each other 0.876
3.2.14 Team members anticipated the needs of others 0.828
3.2.6 Team members exhibited a strong ‘we are in this together’ attitude 0.825
3.2.8 Team members kept each other well informed about work-related issues 0.821
3.2.10 Team members shared their individual knowledge to gain a better understanding of the situation at hand 0.808
3.2.7 Team members operated in an open and honest manner 0.805
3.2.9 There were genuine attempts to share information 0.795
3.2.20 Team members coordinated their activities to achieve the best possible outcome 0.792
3.2.3 Team members provided helpful advice to each other 0.789
3.2.17 Team members had clear and common purpose for the incident at hand 0.777
3.2.22 When problems occurred the team was able to recover quickly and get on with the job 0.772
3.2.11 Team members were able to state and maintain opinions openly 0.77
3.2.19 New team members were quickly integrated into the team 0.756
3.2.1 Team members exchanged information clearly 0.748
3.2.4 Team members provided constructive feedback to each other 0.746
3.2.23 Comfortable approaching members of the team for help when needed 0.698
3.2.5 Team members effectively monitored each other’s performance 0.697
3.2.2 Team members exchanged information accurately 0.693
3.2.12 Team members had the majority of skills needed to effectively perform their respective roles 0.672
3.2.15 Roles were effectively re-allocated as the situation changed 0.667
3.2.16 Team members interacted effectively with stakeholders outside their own team 0.655
3.2.21 Team members received clear direction in relation to the tasks at hand (from the supervisor or officer in charge) 0.597
3.2.31 We effectively achieved our tasks 0.593
3.2.13 Strategies were adjusted in a timely manner as the incident unfolded 0.591
A review of the Factor scores for respondents in relation to their identified team is included in Figure 50 below. It can be seen that, overall those working at a State Centre of Coordination and those working on the Fire-or Incident ground reported higher scores on this item. A comparison of the medians for individual items (see Appendix 3) illustrates that personnel on the Ground engaged in more monitoring of each other than other work teams within the ICS.
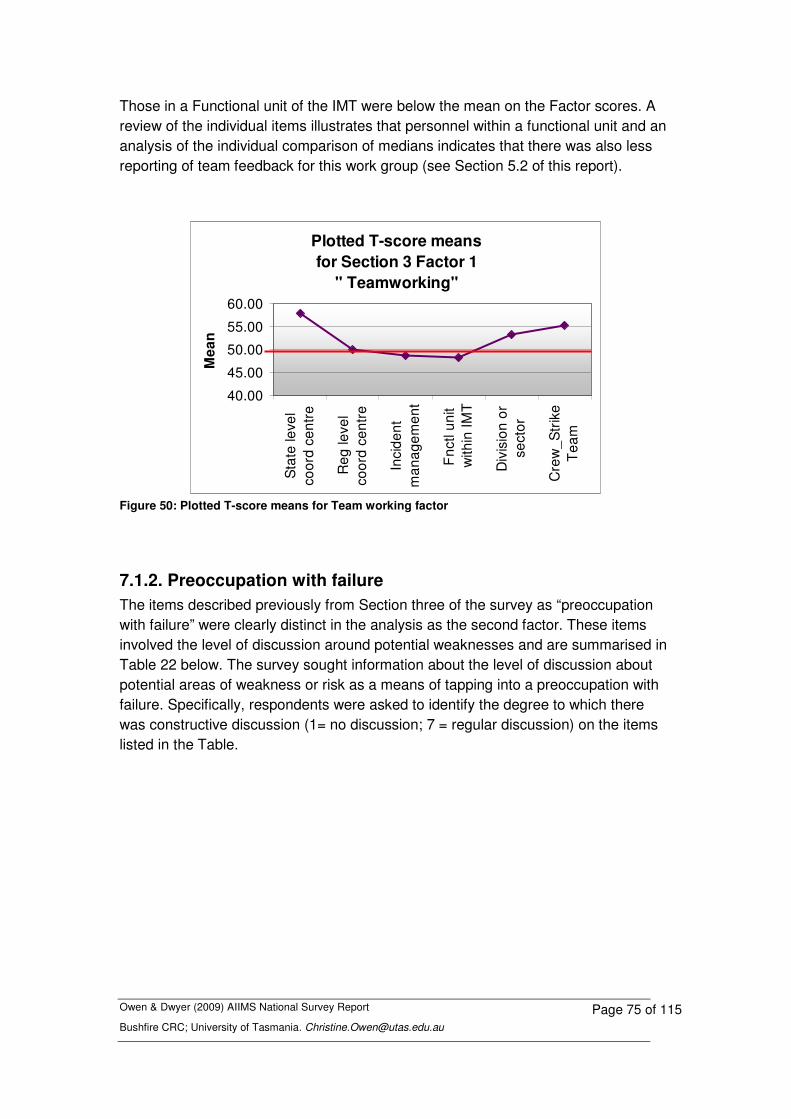
Owen & Dwyer (2009) AIIMS National Survey Report Bushfire CRC; University of Tasmania. [email protected]
Page 75 of 115
Those in a Functional unit of the IMT were below the mean on the Factor scores. A review of the individual items illustrates that personnel within a functional unit and an analysis of the individual comparison of medians indicates that there was also less reporting of team feedback for this work group (see Section 5.2 of this report).
Plotted T-score meansfor Section 3 Factor 1
" Teamworking"
40.00
45.00
50.00
55.00
60.00S
tate
leve
lco
ord
cent
re
Reg
leve
lco
ord
cent
re
Inci
dent
man
agem
ent
Fnc
tl un
itw
ithin
IMT
Div
isio
n or
sect
or
Cre
w_S
trik
eT
eam
Mea
n
Figure 50: Plotted T-score means for Team working factor
7.1.2. Preoccupation with failure The items described previously from Section three of the survey as “preoccupation with failure” were clearly distinct in the analysis as the second factor. These items involved the level of discussion around potential weaknesses and are summarised in Table 22 below. The survey sought information about the level of discussion about potential areas of weakness or risk as a means of tapping into a preoccupation with failure. Specifically, respondents were asked to identify the degree to which there was constructive discussion (1= no discussion; 7 = regular discussion) on the items listed in the Table.
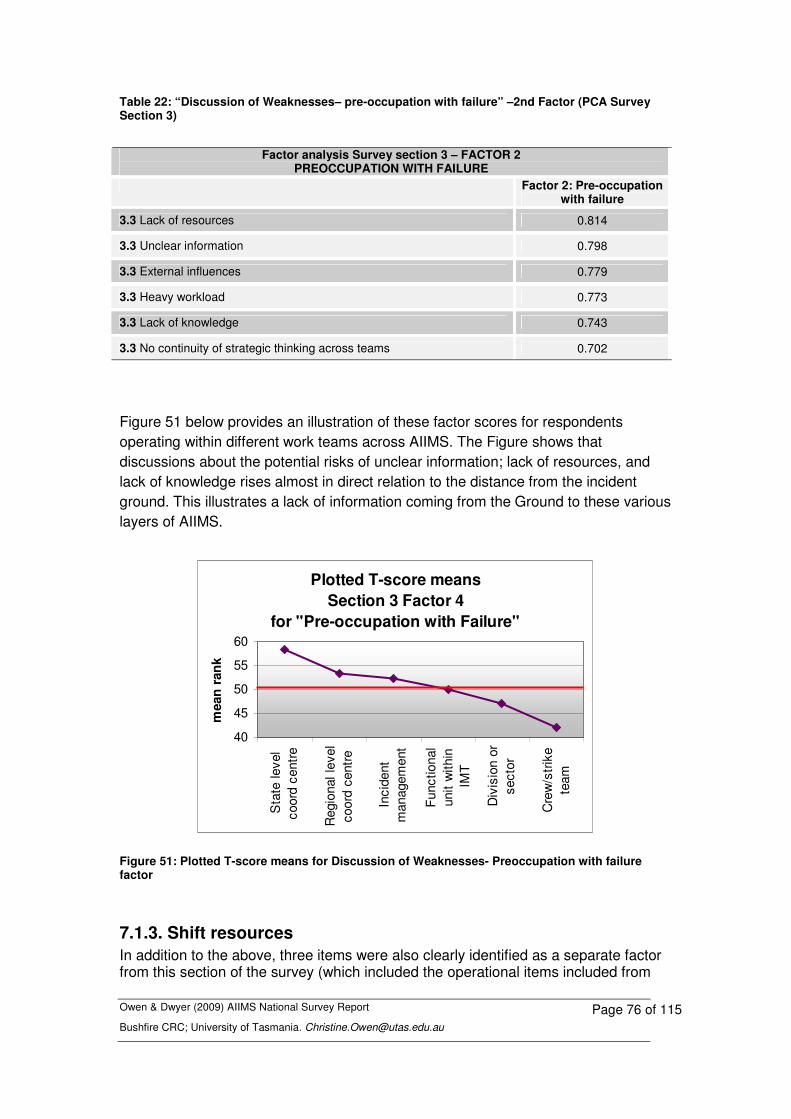
Owen & Dwyer (2009) AIIMS National Survey Report Bushfire CRC; University of Tasmania. [email protected]
Page 76 of 115
Table 22: “Discussion of Weaknesses– pre-occupation with failure” –2nd Factor (PCA Survey Section 3)
Factor analysis Survey section 3 – FACTOR 2
PREOCCUPATION WITH FAILURE Factor 2: Pre-occupation
with failure
3.3 Lack of resources 0.814
3.3 Unclear information 0.798
3.3 External influences 0.779
3.3 Heavy workload 0.773
3.3 Lack of knowledge 0.743
3.3 No continuity of strategic thinking across teams 0.702
Figure 51 below provides an illustration of these factor scores for respondents operating within different work teams across AIIMS. The Figure shows that discussions about the potential risks of unclear information; lack of resources, and lack of knowledge rises almost in direct relation to the distance from the incident ground. This illustrates a lack of information coming from the Ground to these various layers of AIIMS.
Plotted T-score meansSection 3 Factor 4
for "Pre-occupation with Failure"
40
45
50
55
60
Sta
te le
vel
coor
d ce
ntre
Reg
iona
l lev
elco
ord
cent
re
Inci
dent
man
agem
ent
Func
tiona
lun
it w
ithin
IMT
Div
isio
n or
sect
or
Cre
w/s
trike
team
mea
n ra
nk
Figure 51: Plotted T-score means for Discussion of Weaknesses- Preoccupation with failure factor
7.1.3. Shift resources In addition to the above, three items were also clearly identified as a separate factor from this section of the survey (which included the operational items included from

Owen & Dwyer (2009) AIIMS National Survey Report Bushfire CRC; University of Tasmania. [email protected]
Page 77 of 115
the focus groups). These items are summarised as Factor 3 Table 23 below.
Table 23: “Shift Resources” – 3rd Factor (PCA Survey Section 3)
Factor analysis Survey section 3 – FACTOR 3
SHIFT RESOURCES Factor 3- Shift resources
3.2.29 Transport arrangements were effective 0.796
3.2.28 Change over arrangements were effective 0.795
2.2.27 Provisions to control fatigue 0.729
Figure 52 below provides an outline of how this combined Factor was reported by different work teams operating within AIIMS. It can be seen that those most concerned with shift resources (which included transport arrangement, change over arrangements and provisions to control fatigue) were those operating in Divisional Command/Sector Command roles.
Plotted T-score means Section 3 Factor 3
for "Shift Resources"
40.00
45.00
50.00
55.00
60.00
Sta
te le
vel
coor
d ce
ntre
Reg
leve
lco
ord
cent
re
Inci
dent
man
agem
ent
Fnct
l uni
tw
ithin
IMT
Div
isio
n or
sect
or
Cre
w_S
trike
Team
Mea
n
Figure 52: Plotted T-score means for shift resources factor
7.1.4. Temporal responsiveness The final factor included in the analysis included three items also added in the focus group phase about the degree to which the IMT and incident planning and organising were responsive (see Table 24 below).
These items relate to perceptions of the level of responsiveness in terms of the IMT and planning. Two of the items have been reversed so that they could be properly correlated with the positive direction of the other item.
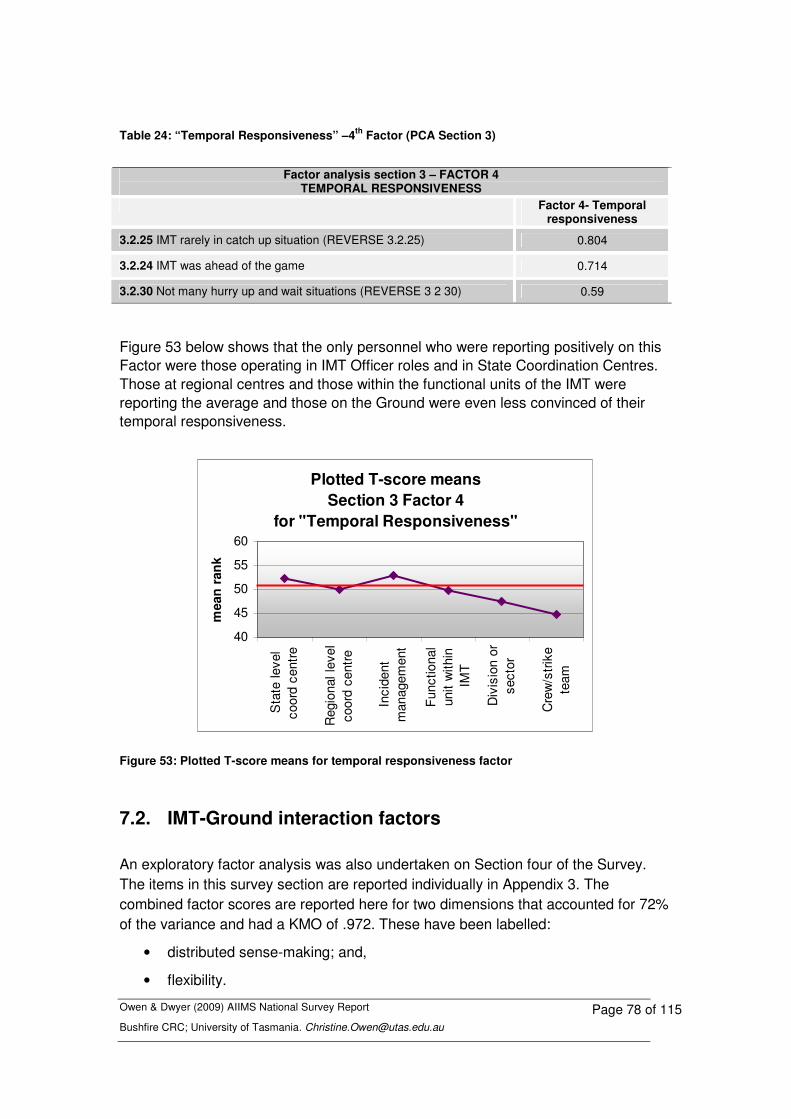
Owen & Dwyer (2009) AIIMS National Survey Report Bushfire CRC; University of Tasmania. [email protected]
Page 78 of 115
Table 24: “Temporal Responsiveness” –4th Factor (PCA Section 3)
Factor analysis section 3 – FACTOR 4
TEMPORAL RESPONSIVENESS Factor 4- Temporal
responsiveness
3.2.25 IMT rarely in catch up situation (REVERSE 3.2.25) 0.804
3.2.24 IMT was ahead of the game 0.714
3.2.30 Not many hurry up and wait situations (REVERSE 3 2 30) 0.59
Figure 53 below shows that the only personnel who were reporting positively on this Factor were those operating in IMT Officer roles and in State Coordination Centres. Those at regional centres and those within the functional units of the IMT were reporting the average and those on the Ground were even less convinced of their temporal responsiveness.
Plotted T-score meansSection 3 Factor 4
for "Temporal Responsiveness"
40
45
50
55
60
Sta
te le
vel
coor
d ce
ntre
Reg
iona
l lev
elco
ord
cent
re
Inci
dent
man
agem
ent
Func
tiona
lun
it w
ithin
IMT
Div
isio
n or
sect
or
Cre
w/s
trike
team
mea
n ra
nk
Figure 53: Plotted T-score means for temporal responsiveness factor
7.2. IMT-Ground interaction factors An exploratory factor analysis was also undertaken on Section four of the Survey. The items in this survey section are reported individually in Appendix 3. The combined factor scores are reported here for two dimensions that accounted for 72% of the variance and had a KMO of .972. These have been labelled:
• distributed sense-making; and,
• flexibility.
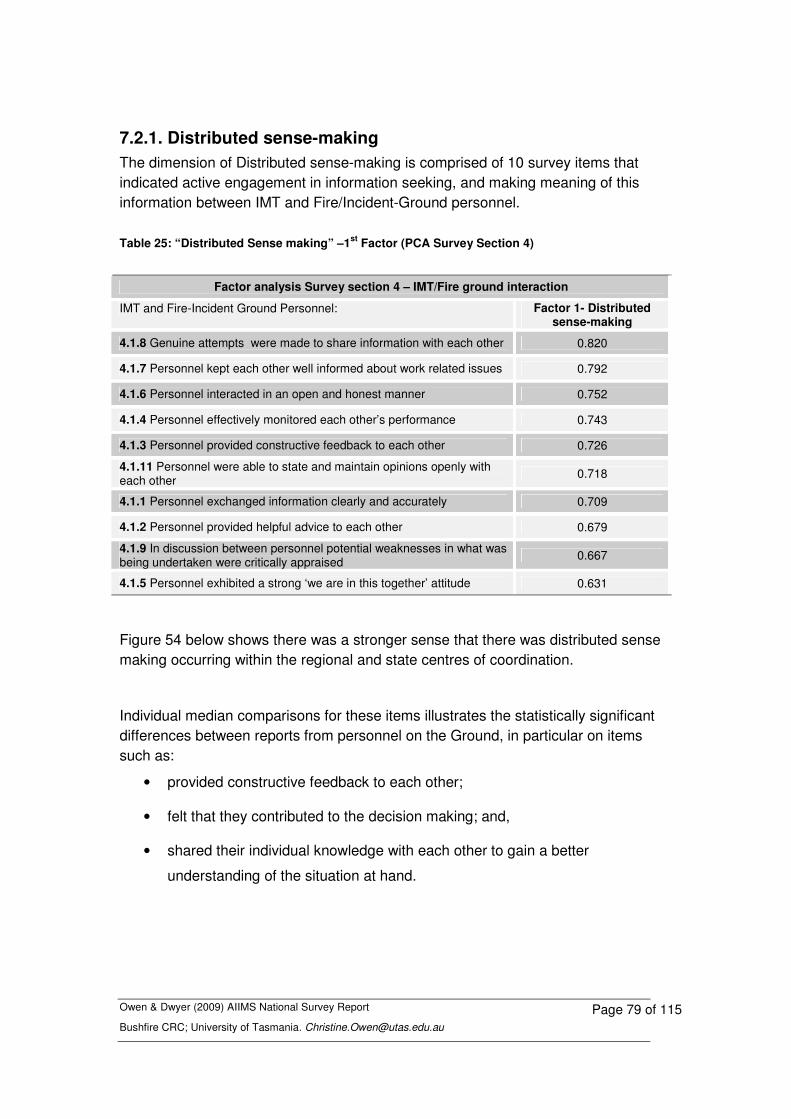
Owen & Dwyer (2009) AIIMS National Survey Report Bushfire CRC; University of Tasmania. [email protected]
Page 79 of 115
7.2.1. Distributed sense-making The dimension of Distributed sense-making is comprised of 10 survey items that indicated active engagement in information seeking, and making meaning of this information between IMT and Fire/Incident-Ground personnel.
Table 25: “Distributed Sense making” –1st Factor (PCA Survey Section 4)
Factor analysis Survey section 4 – IMT/Fire ground interaction
IMT and Fire-Incident Ground Personnel: Factor 1- Distributed sense-making
4.1.8 Genuine attempts were made to share information with each other 0.820
4.1.7 Personnel kept each other well informed about work related issues 0.792
4.1.6 Personnel interacted in an open and honest manner 0.752
4.1.4 Personnel effectively monitored each other’s performance 0.743
4.1.3 Personnel provided constructive feedback to each other 0.726
4.1.11 Personnel were able to state and maintain opinions openly with each other 0.718
4.1.1 Personnel exchanged information clearly and accurately 0.709
4.1.2 Personnel provided helpful advice to each other 0.679
4.1.9 In discussion between personnel potential weaknesses in what was being undertaken were critically appraised 0.667
4.1.5 Personnel exhibited a strong ‘we are in this together’ attitude 0.631
Figure 54 below shows there was a stronger sense that there was distributed sense making occurring within the regional and state centres of coordination.
Individual median comparisons for these items illustrates the statistically significant differences between reports from personnel on the Ground, in particular on items such as:
• provided constructive feedback to each other;
• felt that they contributed to the decision making; and,
• shared their individual knowledge with each other to gain a better
understanding of the situation at hand.
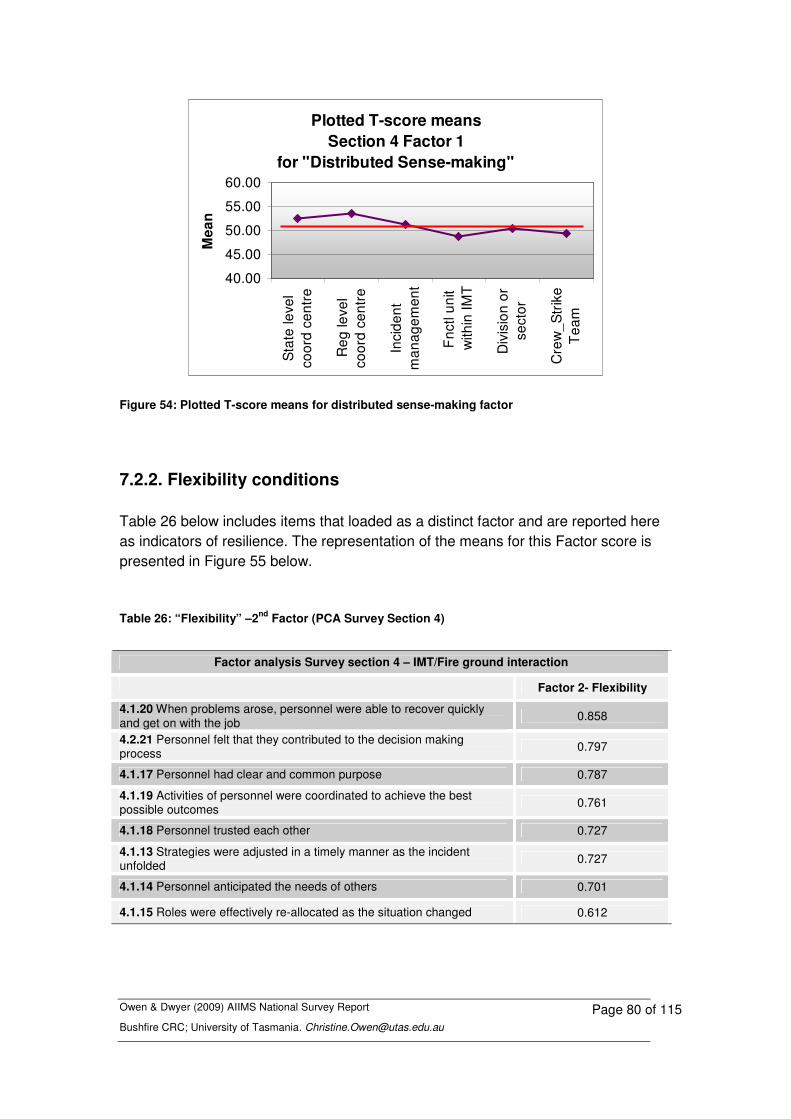
Owen & Dwyer (2009) AIIMS National Survey Report Bushfire CRC; University of Tasmania. [email protected]
Page 80 of 115
Plotted T-score means Section 4 Factor 1
for "Distributed Sense-making"
40.00
45.00
50.00
55.00
60.00
Sta
te le
vel
coor
d ce
ntre
Reg
leve
lco
ord
cent
re
Inci
dent
man
agem
ent
Fnc
tl un
itw
ithin
IMT
Div
isio
n or
sect
or
Cre
w_S
trik
eT
eam
Mea
n
Figure 54: Plotted T-score means for distributed sense-making factor
7.2.2. Flexibility conditions Table 26 below includes items that loaded as a distinct factor and are reported here as indicators of resilience. The representation of the means for this Factor score is presented in Figure 55 below.
Table 26: “Flexibility” –2nd Factor (PCA Survey Section 4)
Factor analysis Survey section 4 – IMT/Fire ground interaction
Factor 2- Flexibility
4.1.20 When problems arose, personnel were able to recover quickly and get on with the job 0.858
4.2.21 Personnel felt that they contributed to the decision making process 0.797
4.1.17 Personnel had clear and common purpose 0.787
4.1.19 Activities of personnel were coordinated to achieve the best possible outcomes 0.761
4.1.18 Personnel trusted each other 0.727
4.1.13 Strategies were adjusted in a timely manner as the incident unfolded 0.727
4.1.14 Personnel anticipated the needs of others 0.701
4.1.15 Roles were effectively re-allocated as the situation changed 0.612

Owen & Dwyer (2009) AIIMS National Survey Report Bushfire CRC; University of Tasmania. [email protected]
Page 81 of 115
Figure 55 below shows how there are significant differences between perceptions of the degree to which personnel are able to recover quickly, coordinate outcomes, adjust strategies, and reallocate roles. Also indicated is having a clear and common purpose and trusting one another. Moreover, the Figure illustrates the differences between functional IMT personnel, and those on the Ground on the one hand and IMT Officers and regional/state centres of coordination on the other.
Plotted T-score means Section 4 Factor 2
for "Flexibility"
40.00
45.00
50.00
55.00
60.00
Sta
te le
vel
coor
d ce
ntre
Reg
leve
lco
ord
cent
re
Inci
dent
man
agem
ent
Fnc
tl un
itw
ithin
IMT
Div
isio
n or
sect
or
Cre
w_S
trik
eT
eam
Mea
n
Figure 55: Plotted T-score means for Flexibility factor
These comparisons indicate there is a greater need to achieve better quality interaction between the personnel on the Fire or Incident-Ground and those in the Incident Management Team. Also suggested is the need to develop better processes within regional and state teams to monitor disturbances or difficulties with this level of interaction within other work teams.
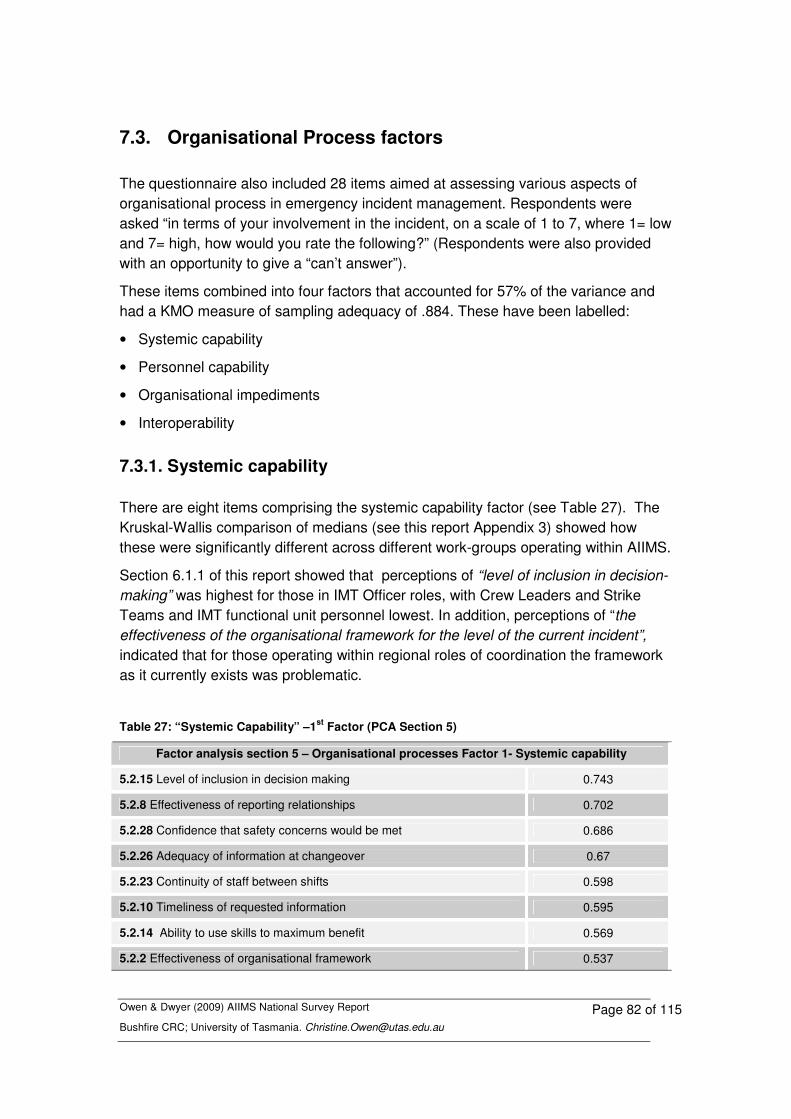
Owen & Dwyer (2009) AIIMS National Survey Report Bushfire CRC; University of Tasmania. [email protected]
Page 82 of 115
7.3. Organisational Process factors The questionnaire also included 28 items aimed at assessing various aspects of organisational process in emergency incident management. Respondents were asked “in terms of your involvement in the incident, on a scale of 1 to 7, where 1= low and 7= high, how would you rate the following?” (Respondents were also provided with an opportunity to give a “can’t answer”).
These items combined into four factors that accounted for 57% of the variance and had a KMO measure of sampling adequacy of .884. These have been labelled:
• Systemic capability
• Personnel capability
• Organisational impediments
• Interoperability
7.3.1. Systemic capability There are eight items comprising the systemic capability factor (see Table 27). The Kruskal-Wallis comparison of medians (see this report Appendix 3) showed how these were significantly different across different work-groups operating within AIIMS.
Section 6.1.1 of this report showed that perceptions of “level of inclusion in decision-making” was highest for those in IMT Officer roles, with Crew Leaders and Strike Teams and IMT functional unit personnel lowest. In addition, perceptions of “the effectiveness of the organisational framework for the level of the current incident”, indicated that for those operating within regional roles of coordination the framework as it currently exists was problematic.
Table 27: “Systemic Capability” –1st Factor (PCA Section 5)
Factor analysis section 5 – Organisational processes Factor 1- Systemic capability
5.2.15 Level of inclusion in decision making 0.743
5.2.8 Effectiveness of reporting relationships 0.702
5.2.28 Confidence that safety concerns would be met 0.686
5.2.26 Adequacy of information at changeover 0.67
5.2.23 Continuity of staff between shifts 0.598
5.2.10 Timeliness of requested information 0.595
5.2.14 Ability to use skills to maximum benefit 0.569
5.2.2 Effectiveness of organisational framework 0.537
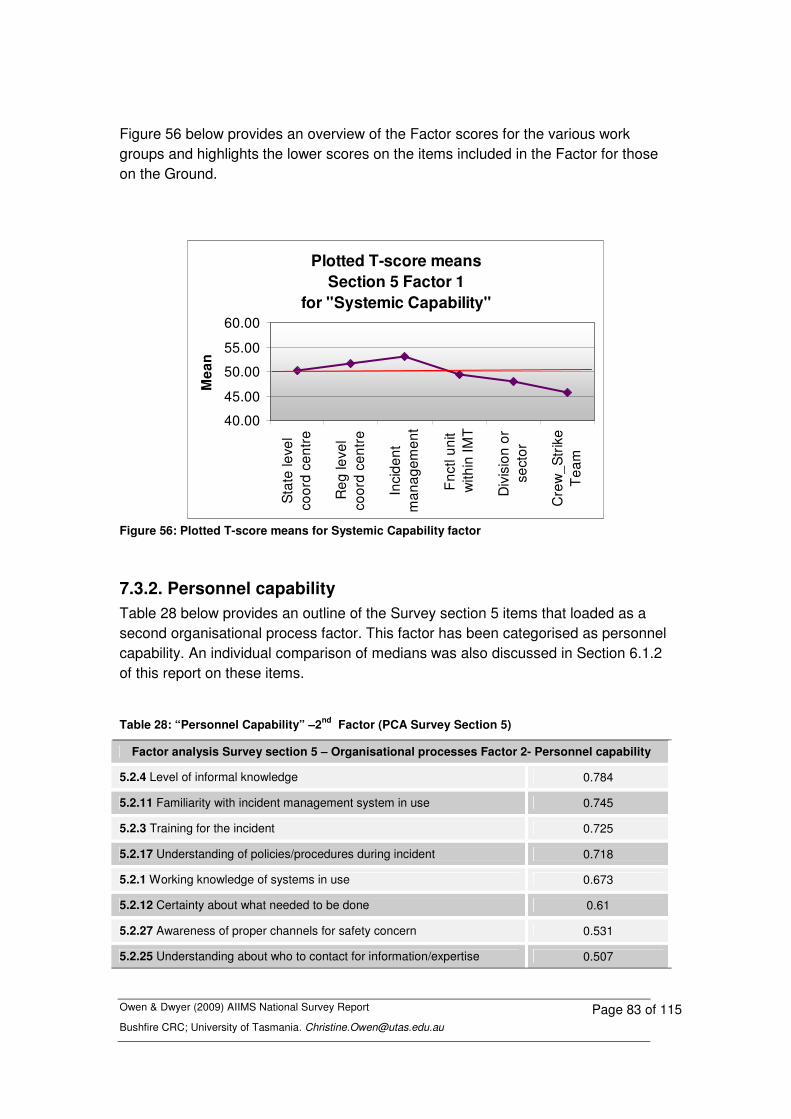
Owen & Dwyer (2009) AIIMS National Survey Report Bushfire CRC; University of Tasmania. [email protected]
Page 83 of 115
Figure 56 below provides an overview of the Factor scores for the various work groups and highlights the lower scores on the items included in the Factor for those on the Ground.
Plotted T-score means Section 5 Factor 1
for "Systemic Capability"
40.00
45.00
50.00
55.00
60.00
Sta
te le
vel
coor
d ce
ntre
Reg
leve
lco
ord
cent
re
Inci
dent
man
agem
ent
Fnc
tl un
itw
ithin
IMT
Div
isio
n or
sect
or
Cre
w_S
trik
eT
eam
Mea
n
Figure 56: Plotted T-score means for Systemic Capability factor
7.3.2. Personnel capability Table 28 below provides an outline of the Survey section 5 items that loaded as a second organisational process factor. This factor has been categorised as personnel capability. An individual comparison of medians was also discussed in Section 6.1.2 of this report on these items.
Table 28: “Personnel Capability” –2nd Factor (PCA Survey Section 5)
Factor analysis Survey section 5 – Organisational processes Factor 2- Personnel capability
5.2.4 Level of informal knowledge 0.784
5.2.11 Familiarity with incident management system in use 0.745
5.2.3 Training for the incident 0.725
5.2.17 Understanding of policies/procedures during incident 0.718
5.2.1 Working knowledge of systems in use 0.673
5.2.12 Certainty about what needed to be done 0.61
5.2.27 Awareness of proper channels for safety concern 0.531
5.2.25 Understanding about who to contact for information/expertise 0.507
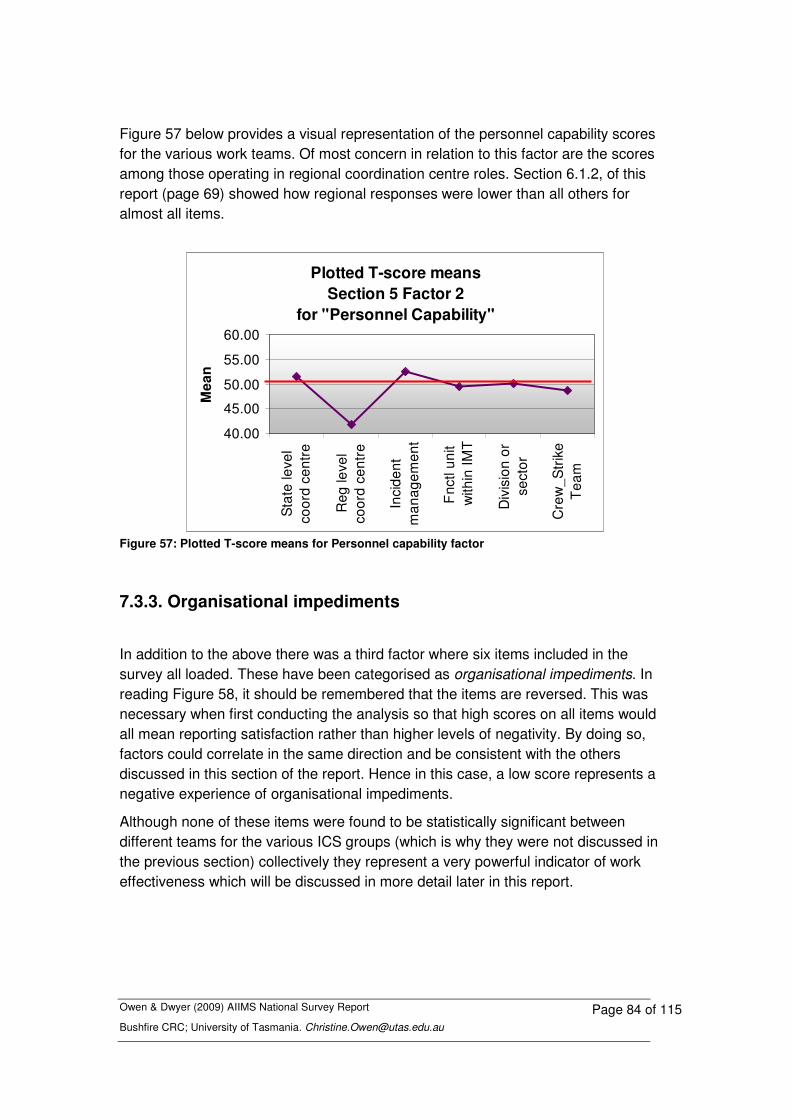
Owen & Dwyer (2009) AIIMS National Survey Report Bushfire CRC; University of Tasmania. [email protected]
Page 84 of 115
Figure 57 below provides a visual representation of the personnel capability scores for the various work teams. Of most concern in relation to this factor are the scores among those operating in regional coordination centre roles. Section 6.1.2, of this report (page 69) showed how regional responses were lower than all others for almost all items.
Plotted T-score means Section 5 Factor 2
for "Personnel Capability"
40.00
45.00
50.00
55.00
60.00
Sta
te le
vel
coor
d ce
ntre
Reg
leve
lco
ord
cent
re
Inci
dent
man
agem
ent
Fnc
tl un
itw
ithin
IMT
Div
isio
n or
sect
or
Cre
w_S
trik
eT
eam
Mea
n
Figure 57: Plotted T-score means for Personnel capability factor
7.3.3. Organisational impediments
In addition to the above there was a third factor where six items included in the survey all loaded. These have been categorised as organisational impediments. In reading Figure 58, it should be remembered that the items are reversed. This was necessary when first conducting the analysis so that high scores on all items would all mean reporting satisfaction rather than higher levels of negativity. By doing so, factors could correlate in the same direction and be consistent with the others discussed in this section of the report. Hence in this case, a low score represents a negative experience of organisational impediments.
Although none of these items were found to be statistically significant between different teams for the various ICS groups (which is why they were not discussed in the previous section) collectively they represent a very powerful indicator of work effectiveness which will be discussed in more detail later in this report.

Owen & Dwyer (2009) AIIMS National Survey Report Bushfire CRC; University of Tasmania. [email protected]
Page 85 of 115
Table 29: “Organisational Impediments” –3rd Factor (PCA Survey Section 5)
Factor analysis Survey section 5 – Factor 3 – Organisational Impediments
Didn’t need to go Outside normal procedures (i.e. REVERSED) 0.864
Didn’t feel at risk (i.e. REVERSED) 0.858
Didn’t experience External factors (i.e. REVERSED) 0.774
Didn’t need to go Outside chain of command (i.e. REVERSE) 0.709
Didn’t experience Level of contradiction in policies guiding the management of the incident (i.e. REVERSED0 0.574
Didn’t experience Level of competing demands (i.e. REVERSED) 0.501
Figure 58 below shows that those within State positions of coordination experienced more difficulty on the items overall. In support of this, a review of the individual items discussed in Appendix 3 shows those in regional roles of coordination as well as IMT Officers experienced the greatest difficulty in negotiating the contradictions in policies guiding the management of the incident.
As will be discussed in the next section of this report, when these indicators are combined they provide a critical predictor of personnel reporting that they are unable to effectively carry out their role, regardless of their position within AIIMS.
Plotted T-score means Section 5 Factor 3
for "Organisational Impediments" REVERSED
40.00
45.00
50.00
55.00
60.00
Sta
te le
vel
coor
d ce
ntre
Reg
leve
lco
ord
cent
re
Inci
dent
man
agem
ent
Fnc
tl un
itw
ithin
IMT
Div
isio
n or
sect
or
Cre
w_S
trik
eT
eam
Mea
n
Figure 58: Plotted T-score means for Organisational Impediments factor (reversed scores)
7.3.4. Inter-agency inter-operability Also included in the survey were three items (see Table 30 below) assessing perceptions of organisational processes known to impact on interoperability. Inter-operability is a concern for fire control agencies in particular when they need to be responding and coordinating with other support agencies engaged in the incident.
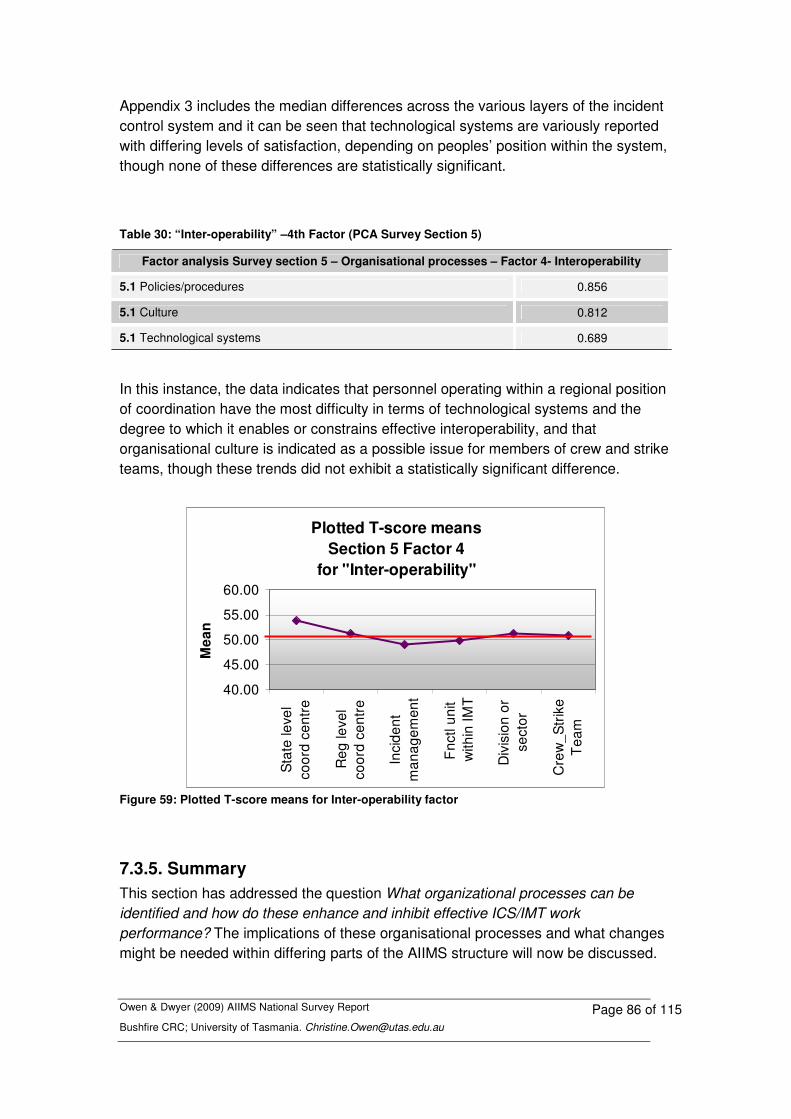
Owen & Dwyer (2009) AIIMS National Survey Report Bushfire CRC; University of Tasmania. [email protected]
Page 86 of 115
Appendix 3 includes the median differences across the various layers of the incident control system and it can be seen that technological systems are variously reported with differing levels of satisfaction, depending on peoples’ position within the system, though none of these differences are statistically significant.
Table 30: “Inter-operability” –4th Factor (PCA Survey Section 5)
Factor analysis Survey section 5 – Organisational processes – Factor 4- Interoperability
5.1 Policies/procedures 0.856
5.1 Culture 0.812
5.1 Technological systems 0.689
In this instance, the data indicates that personnel operating within a regional position of coordination have the most difficulty in terms of technological systems and the degree to which it enables or constrains effective interoperability, and that organisational culture is indicated as a possible issue for members of crew and strike teams, though these trends did not exhibit a statistically significant difference.
Plotted T-score means Section 5 Factor 4
for "Inter-operability"
40.00
45.00
50.00
55.00
60.00
Sta
te le
vel
coor
d ce
ntre
Reg
leve
lco
ord
cent
re
Inci
dent
man
agem
ent
Fnc
tl un
itw
ithin
IMT
Div
isio
n or
sect
or
Cre
w_S
trik
eT
eam
Mea
n
Figure 59: Plotted T-score means for Inter-operability factor
7.3.5. Summary This section has addressed the question What organizational processes can be identified and how do these enhance and inhibit effective ICS/IMT work performance? The implications of these organisational processes and what changes might be needed within differing parts of the AIIMS structure will now be discussed.

Owen & Dwyer (2009) AIIMS National Survey Report Bushfire CRC; University of Tasmania. [email protected]
Page 87 of 115
7.4. Factors preventing work effectiveness
Perhaps not surprisingly, with the exception of team discussion of potential weakness areas, personnel capability and inter-operability, all the Factors just discussed were statistically significantly associated with preventing respondents from being able to do their work effectively (see Figure 60 below).
Figure 60: Cross tabulation of T-score means by factors preventing doing job effectively
A critical question to ask is what contribution do each of these Factors make to inhibiting personnel from doing their job effectively, and, therefore, what might be the areas required for priority in targeting areas for improvement?
A Discriminant Function Analysis was conducted (see Appendix 4) of the Factor Scores to ascertain which best predicted whether or not respondents experienced factors that inhibited them doing their job effectively. The details are reported in Appendix 4 and the items predicting Incident Management effectiveness are in order of importance.
Table 31 below .shows that of all the Factors discussed to date, the two that are critical in predicting whether or not the respondent also had aspects that prevented them from being able to effectively do their job were (in order of importance) organisational impediments and systemic capability. That is, when the AIIMS structure supported personnel such that they did not need to find work-arounds (go outside normal procedures; outside of the chain of command; did not experience contradictions in policies guiding the management of the incident etc) they were able
T-score means by factors preventing doing job effectively
42.00 44.00 46.00 48.00 50.00 52.00 54.00
Teamworking
Weaknesses Shift Resources
Temporal Reponsiveness
Distd Sit Awareness
Flexibility Systemic Capability
Personnel Capability
Interoperability OrgInisational Impediments**
Factors
T-Score means
Yes No
** reversed

Owen & Dwyer (2009) AIIMS National Survey Report Bushfire CRC; University of Tasmania. [email protected]
Page 88 of 115
to work effectively. When personnel experienced these organisational impediments they were inhibited from being able to work effectively.
Table 31: Discriminant Function Analysis of factors that predict job prevention
Discriminant Function Analysis Structure Matrix
Function 1
Organisational impediments 0.73 Systemic Capability 0.65 IMT-Ground resilience 0.51
Within group Teamwork 0.45 Temporal Responsiveness 0.42 Distributed Sense-making 0.31
Shift Resources 0.13 Personnel Capability -0.08
Weak Signals -0.06 Interoperability 0.00
Understanding what it is within AIIMS that creates these disturbances is of critical importance. Connected with this will be those processes that support systemic capability. They include the teamwork and organisational processes that enhance effectiveness of reporting relationships and organisational frameworks; as well as effective information flows between groups; ability to use skills to maximum benefit and bringing all resources to bear in decision-making.
These arrangements are both structural as well as relational. Enhancing teamwork, through, for example, adoption of practices associated with what is known as “Crew Resource Management” in other high-reliability organisations is worthy of attention in an attempt to gain systemic improvements. The next section provides a diagnostic framework for targeting areas for possible improvements within AIIMS.

Owen & Dwyer (2009) AIIMS National Survey Report Bushfire CRC; University of Tasmania. [email protected]
Page 89 of 115
8. Conclusion and implications of the research By reviewing perceptions about the teamwork, coordination and organisational processes, the data analysed here provides a systematic evaluation and diagnostic framework for future intervention. The rest of this section will discuss the implications for each of the work groups identified in the AIIMS structure.
Table 32: Diagnosis of Incident Management Teamwork and Coordination
State
Coord Regional
Coord IMT IC/ Officers
IMT Func units
Div/Sec Comm
Crew/ Strike
Team-working
Preoccupation with failure
Within Teams
Shift Resources
Temporal responsiveness
Distributed Sense-making
Between Teams
Flexibility
Systemic Capability
Personnel Capability
Intra-organisational
Organisational Impediments
Inter-organisational
Inter-operability
Serious Concern
Attention Required
Some Concerns
Neutral Positive
Table 32 above shows a synopsis of the discussion to date. In the Table, the rows represent each of the factors identified through the Factor Analysis process and the columns represent each of the work groups in operation within the AIIMS structure. The Table represents a colour-coded synthesis of all data discussed. It identifies, based on the data analysed in this report, key areas proposed for intervention in order to improve emergency incident management performance within the AIIMS.
Fire- Incident-Ground The issues emerging from the data for personnel operating at a Divisional or Sector Commander role, as well as those respondents who reported at Crew or Strike Team level have been combined for this discussion.

Owen & Dwyer (2009) AIIMS National Survey Report Bushfire CRC; University of Tasmania. [email protected]
Page 90 of 115
Concerns of personnel on the Ground are, not surprisingly, mainly in relation to resources. These include a need to give greater attention to transport as well as provisions to control fatigue. Also highlighted are concerns regarding a lack of continuity of information between shifts as well as securing needed support from the IMT in a way that is temporally responsive.
What appears not to be understood is the role that the fire-incident ground plays in enabling others to support their needs. It is interesting to note that Table 32 shows that IMT Officers, Regional and State levels of coordination all reported increasingly higher scores on their discussion about concerns about the risks of unclear information; lack of knowledge, and lack of continuity of strategic thinking from team to team. Creating better strategies to share knowledge of the situation between work teams would ameliorate both the temporal responsiveness problem expressed on the Ground as well as the levels of discussion about weaknesses in the other parts of the system.
Of concern to personnel on the Ground is their capacity to be able to act flexibly. That is, to have the capacity to be able to recover quickly from problems as they arose and to be able to adjust strategies in a timely manner. Also contributing to this factor were items that point to group climate – or feeling that there is inclusion in the decision-making processes; trust; as well as a clear and common purpose.
Ground personnel also had the lowest reporting of the Factor Systemic Capability. This included effectiveness of the organisational framework for the level of the current incident; effectiveness of reporting relationships; adequacy of information provided at changeover; continuity of staff between shifts and ability to use skills to maximum benefit. In addition, it also included confidence that safety concerns would be acted upon.
Incident Management Teams Incident Management Teams are a complex constellation of activity where much of the information flow needed for successful emergency management is processed, generated, and coordinated. As discussed, it is in the IMT that the Incident Action Plan is constructed. Information flows to and from the Fire- or Incident Ground into the IMT and information also flows from the IMT to the regional and state levels of coordination. In addition to the information flows required within the control agency functions, there is also a need to convey information to support communities in their decision-making. Finally there is also a need to coordinate with other stakeholders such as providers of medical services; critical infrastructure, the political sphere and the police.
The interviews conducted as part of the previous research within this project indicated that IMTs are not homogeneous. Particularly in Level 3 incidents that are large and complex, IMTs are differentiated into smaller functional units that, based on the interviews conducted, sometimes have considerable difficulty in getting their own needs met from the “core” IMT members, namely the Incident Controller, Operations Officer, Planning Officer and Logistics Officer. Given these concerns it was thought
Owen & Dwyer (2009) AIIMS National Survey Report Bushfire CRC; University of Tasmania. [email protected]
Page 91 of 115
important in the structure of the survey to be able to differentiate between IMT members in terms of their functional roles and to IMT Officers and IMT functional unit member responses as separate categories. If they were one and the same (all members of the one “team”) then they would show the same reporting patterns. This in fact turns out not to be the case, as will be discussed below.
IMT functional areas Personnel from within these work teams reported lowest on interactions supporting distributed sense-making between the IMT and the fire-ground. Given their critical roles in supporting a coordinated effort on the fire ground and for preparing information critical for external stakeholders (including communities), teamwork between officers and functional units is in need of serious attention.
Better strategies are needed to provide information flow between functional areas. It is possible that those with function unit areas of responsibility feel the need to go around those at the IMT officer level simply because they are not obtaining the information needed from those officers. Better strategies to enable greater systemic capability and flexibility are also indicated.
It is also possible that the whole division of labour and role responsibilities within the Incident Management Team needs review. This is also indicated by the ways in which various state agencies are developing new with-in team roles with the aim of enhancing integration within the team, which includes reviewing the positioning of the Information Unit and its status. However, what the data here suggests is that it is not only the Information Unit that faces difficulties – other functional units operating within an IMT face similar challenges.
IMT Officer level At the IMT officer level the data indicates that greater attention is needed in relation to providing more streamlined inter-operability. This is likely to require better systems connections within the Incident Management Structure (between the IMT and regional/state levels of coordination) but also between the IMT and other supporting emergency arrangements (e.g., MECCs) and between the Emergency Management partner agencies. Regional level of coordination The regional level suffers most from concerns about its personnel capability. This is evident in the comparatively lower levels of certainty around the lack of informal knowledge as well as familiarity with the incident management systems being used at that level and understanding about who to contact for information or expertise. These indicate a lack of definition and ambiguity of the regional function and of its roles within the Incident Management System.
This was also indicated in other data included in the survey. In the demographic section respondents were asked to report on the number of incidents experienced. Respondents involved in a regional level reported a median of 5 previous incidents in this role. This illustrates the recent of the development of a regional functional role in

Owen & Dwyer (2009) AIIMS National Survey Report Bushfire CRC; University of Tasmania. [email protected]
Page 92 of 115
the coordination process and one that needs further development if it is to support and not hinder management and coordination.
It is not surprising therefore to note that of most concern to this group was the issue of their own capability. It was at the regional level that the lowest reports of training for the incident at hand and understanding of policies and procedures used during the incident were in evidence. The priority need for personnel operating within a regional centre of coordination is both a greater clarity about function and roles as well as support in developing the necessary skills.
Respondents from the regional level of coordination also reported higher levels of experiencing contradictions in guiding policies and a reasonably high tension for having gone outside of normal procedures.
State level of coordination The State level of coordination had the highest reporting of experiencing organisational impediments. Personnel working within State Centres of coordination experienced having to go outside normal procedures as well as being asked to go outside the chain of command. Not surprisingly under these conditions they also felt most concern of feeling exposed for having done so.
The State level also reports the highest levels of discussion of weaknesses. That is, it is concerned about the risks associated with having unclear information, lack of knowledge and concerns about continuity of strategic thinking across teams. Not surprisingly, in an earlier section of the survey (Section 2) personnel operating at a State level also reported the lowest levels of feeling comfortable with their own psychological safety.
It is also important to note that the items comprising organisational impediments has the highest correlation in the discriminant functional analysis predicting factors that either enable or constrain personnel from being able to do their job effectively. Under these circumstances it is essential that attention be given to analysis of the working and coordination arrangements and to how better processes (both human and technological) can be employed to provide information throughout the system.
At issue is how personnel best share their knowledge at state and regional levels of coordination, as well as with the community and other Emergency Management Partner Organisations. At regional and state levels of coordination, the activity of emergency incident management transforms into a different set of demands of servicing the needs of horizontal control but also of lateral connectivity to other agency networks.
8.1. Directions for future research The findings generated in compiling this report open a number of important opportunities for future research. As evidenced by the ‘Diagnosis of Incident Management Teamwork and Coordination’ overview provided in Table 32 (page 88

Owen & Dwyer (2009) AIIMS National Survey Report Bushfire CRC; University of Tasmania. [email protected]
Page 93 of 115
of this report) there are a number of areas which need closer scrutiny to achieve more reliable incident management performances and outcomes.
First, in relation to information flow within and between agencies, it was noted that briefings only identified alternative strategies 36% of the time in 2008, while in terms of the types of information supplied in Incident Action Plans, two of the lowest ratings were given to the provision of information on alternative strategies, and predictions of incident development.
These findings raise two concerns that need to be further investigated if improvements are to be made within an ICS. First, is the need to ensure there are practices supporting the capacity for contingency planning, given its importance in achieving consistently safe, high performance outcomes (Weick & Sutcliffe, 2001). The second area that remains problematic is that of modelling the future development of an emergency incident as well as providing appropriate information to those within the system about those possible developments. This is more likely to be an issue in dynamic, fast moving and escalating events such as wildfires and less difficult in, say, a flood situation. Strategies to address this to improve ICS functioning are likely to include different components. New developments are needed to support future emergency modelling prediction. These may take the form of new technologies; and/or new strategies of organising for intelligence gathering and value-adding to this intelligence. In addition there may be a need to review reporting functions and authority to act, particularly under conditions of escalation.
Second, while there was evidence of good levels of support for the use of key ICS practices (such as the widespread use of briefings and Incident Action Plans), there were notable differences in the levels of satisfaction across layers of the ICS with the organisational arrangements (for example, between the Incident Management Team, fire/incident ground, and coordination centres).
In the initiative to establish AIIMS in Australia, one of the main objectives was to provide appropriate organisational structural support around the core unit of the system, the Incident Management Team. That this aim was at least partially met is supported by findings reported here. However, the findings also highlight differences between the various layers of the ICS on a number of key survey items, where personnel working on the incident or fire-ground and in the levels of Coordination in particular were substantially less happy on these items than their counterparts in the Incident Management Team. These findings suggest it is important to move beyond a teamwork-only focus to better understand the communication and coordination issues between the Incident Management Team and incident/fire ground, and between the Incident Management Team and coordination centres.
This does not imply that the potential organisational issues confronting the Incident Management Team are any less important. Our findings also suggest there are still systemic issues within Incident Management Teams that are in need of further investigation – particularly in relation to perceived tensions in the reporting frameworks between Incident Management Team functional groups and the effectiveness of communication arrangements. Also of concern, is the issue of how

Owen & Dwyer (2009) AIIMS National Survey Report Bushfire CRC; University of Tasmania. [email protected]
Page 94 of 115
the planning section actually goes about the business of predicting the future course of events. Again, our findings not only highlight that questions remain about how well the ICS supports the role and tasks of the planning section in particular, but raise the prospect of a need for future emergency management research to test the effectiveness of more finely-honed intelligence-based data gathering techniques, as well as different levels of communication arrangements and reporting relationships.
The third area in need of further work is in relation to the potential teamwork/ organisational linkages and interdependencies. Our findings clearly demonstrate that when the various teams engage in teamwork practices that actively support organisational flexibility and distributed sense-making for instance, people have manifestly fewer problems doing their job effectively. This aspect of the study opens a number of exciting directions for future research, which, as mentioned previously in this report, are the focus of a PhD to be completed towards the end of 2010.
For example, in related literature there have been few, if any, attempts to establish empirical links between the principles underpinning organising for high reliability (including approaches such as ICS), complexity, and high performance teamwork – although some theoretical connections have been proposed (Stanton, Baber & Harris, 2008; Wilson, Burke, Priest & Salas, 2005). The desirability of empirically linking the organisational functioning with team level functioning more closely in the future should yield important benefits. These include first, more precisely articulating the types of team work indicators that are likely to support organising for high reliability (HRO) within emergency services agencies, and second, how people might learn and train in the future.
Finally, it is also important to better understand the organisational processes which are needed to support those teams who work in managing emergency events. In what ways might the system need to flex in order to support the people managing the incident? What skills and attributes are needed in those personnel to be able to adapt and make the most of the resources they can bring to bear to manage in these conditions? What inhibits personnel and systems from successfully doing so? Given the current predictions of climate change and the increased likelihood of more extreme weather events, a better understanding of these sorts of ICS issues is critical for achieving more consistent, reliable and safe incident management performances and outcomes.
Owen & Dwyer (2009) AIIMS National Survey Report Bushfire CRC; University of Tasmania. [email protected]
Page 95 of 115
9. References
AFAC 2005, The Australasian inter-service incident management system: a management system for any emergency, Australasian Fire Authorities Council, Melbourne.
Ancona, DG & Caldwell, DF 1992, 'Bridging the boundary: external activity and performance in organizational teams', Administrative Science Quarterly, vol. 37, no. 4, pp. 634-665.
Autrey, P & Moss, J 2006, 'High-reliability teams and situation awareness: implementing a hospital emergency incident command system', The Journal of Nursing Administration, vol. 36, no. 2, pp. 67-72.
Cannon-Bowers, JA, Salas, E & Converse, S 1993, 'Shared mental models in expert team decision making', in NJ Castellan (ed.), Individual and group decision making: current issues, Lawrence Erlbaum Associates, New Jersey.
Cannon-Bowers, JA & Salas, E 1997, 'Teamwork competencies: the interaction of team member knowledge, skills and attitudes', in HF O'Neil (ed.), Workforce readiness: competencies and assessment, Lawrence Erlbaum Associates, New Jersey, pp. 151-174.
Cannon-Bowers, JA & Salas, E 1998, 'Team performance and training in complex environments: recent findings from applied research', Current Directions in Psychological Science, vol. 7, no. 3, pp. 83-87.
Comfort, LK, Ko, K & Zagorecki, A 2004, 'Coordination in rapidly evolving disaster response systems', Amercian Behavioral Scientist, vol. 48, no. 3, pp. 295-313.
Comfort, LK 2005, 'Risk, security, and disaster management ', Annual Review of Political Science, vol. 8 pp. 335-356
Comfort, LK & Kapucu, N 2006, 'Inter-organizational coordination in extreme events: the world Trade Center attacks, September 11, 2001.' Natural Hazards, vol. 39, pp. 309-327.
Crabtree, A, Rodden, T & Benford, S 2005, 'Moving with the times: IT research and the boundaries of CSCW', Computer Supported Cooperative Work, vol. 14, pp. 217-251.
Dawes, S, Birkland, T, Tayi, G & Scheinder, C 2004, Information technology and coordination: lessons from the World Trade Centre response, Centre for Technology and Government, SUNY at Albany, New York.
Department of Homeland Security (DHS) 2008, National Incident Management System. Available online at:

Owen & Dwyer (2009) AIIMS National Survey Report Bushfire CRC; University of Tasmania. [email protected]
Page 96 of 115
http://www.fema.gov/pdf/emergency/nims/NIMS_core.pdf
Driessen, J, Outka-Perkins, L & Anderson, L 2005, 'Two entrapment avoidance projects: studying crew cohesion as a social human factor', paper presented to Eighth International Wildland Firefighter Safety Summit: Human Factors - 10 Years later, Missoula, MT.
Dwyer, I & Owen, C 2009, 'Emergency incident management: an evolving incident control system framework', Journal of Pacific RIM Psychology, vol. 3, no. 2, pp. 66-75.
Entin, EE & Serfaty, D 1999, 'Adaptive team co-ordination', Human Factors., vol. 41, no. 2, June., pp. 312-325.
Ekornas, B, Brun, W, Eid, J, Johnsen, B, Laberg, J, Kobbeltvedt, T, Utne, K, Rogde, T & Sirhaug, F 2001, Studying the effect of a crew and bridge resource management training program: shared mental models and task performance, Royal Norwegian Naval Academy & University of Bergen, Norway.
Field, A. 2003, Discovering statistics using SPSS for windows, Sage, London.
Huber, RK, Eggenhofer, PM, Romer, J, Schafer, S & Titze, K 2007, 'Effects of individual and team characteristics on the performance of small networked teams', The International C2 Journal, vol. 1, no. 1, pp. 113-144.
Klein, CD, D. Salas, E. Shawn Burke, C. Lyons, R. Huy, L. Goodwin, G. 2009, 'Does Team Building Work?' Small Group Research, vol. 40, no. 2, pp. 181-222.
Langan-Fox, J, Anglim, J & Wilson, JR 2004, 'Mental models, team mental models, and performance: process development, and future directions', Human Factors and Ergonomics in Manufacturing, vol. 14, no. 4, pp. 331-352.
Liao, S 2008, 'Problem structuring methods in military command and control', Expert Systems with Applications, vol. 35, no. 3, pp. 645-653.
Lutz, L & Lindell, M 2008, 'Incident command system as a response model within emergency operation centres during Hurricane Rita', Journal of Management, vol. 34, no. 3, pp. 410-476.
Mathieu, J, Maynard, MT, Rapp, T & Gilson, L 2008, 'Team effectiveness 1997-2007: a review of recent advancements and a glimpse into the future', Journal of Management, vol. 34, no. 3, pp. 410-476.
McLennan, J, Holgate, AM, Omodei, MM & Wearing, AJ 2005, 'Bushfire incident management team decision making', Australian Journal of Psychology, vol. 57, no. Supp, pp. 230-231.
Mendonca, D & Wallace, W 2006, 'Impacts of the world trade centre attack on New York city infrastructure', Journal of Infrastructure Systems, vol. 12, no. 4, pp. 260-270.
Mohammed, S & Dumville, BC 2001, 'Team mental models in a team knowledge framework: expanding theory and measurement across disciplinary

Owen & Dwyer (2009) AIIMS National Survey Report Bushfire CRC; University of Tasmania. [email protected]
Page 97 of 115
boundaries', Journal of Organizational Behaviour, vol. 22, pp. 89-106.
Militello, LG, Patterson, ES, Bowman, L & Wears, RL 2007, 'Information flow during crisis management: challenges to coordination in the emergency operations centre', Cognition, Technology and Work, vol. 9, pp. 25-31.
Moynihan, DP 2007, From forest fires to hurricane Katrina: case studies of incident command systems, IBM Center for the Business of Government, Washington, DC.
Orasanu, J 1990, Shared mental models and crew decision making, Technical Report No. 46, Princeton University, Cognitive Sciences Laboratory, Princeton, NJ.
Orasanu, J & Salas, E 1993, 'Team decision making in complex environments', in GA Klein, J Orasanu, R Calderwood & CE Zsambok (eds), Decision making in action: models and methods, Ablex, Norwood, NJ.
Quarantelli, EL 1986, Disaster Crisis Management, #113, Disaster Research Centre, University of Delaware.
Owen, C, Dwyer, I & Douglas, J 2006, A Review of the IMT-related Literature in Fire and Emergency Management Settings, Bushfire Cooperative Research Centre, University of Tasmania, Hobart.
Salas, E & Cannon-Bowers, JA 2001, 'The science of training: a decade of progress', Annual Review of Psychologists, vol. 52, pp. 471-499.
Salas, E, Rosen, MA, Burke, CS, Goodwin, GF & Fiore, SM 2006, 'The making of a dream team: when expert teams do best', in KA Ericsson, N Charness, PJ Feltovich & RR Hoffman (eds), The Cambridge handbook of expertise and expert performance, Cambridge University Press, New York, pp. 439-453.
Salas, ER, M; Burke, C; Nicholson, D 2007, 'Markers for Enhancing Team Cognition in complex Environments: The Power of Team Performance', Aviation, Space, and Environmental Medicine, vol. 78, no. 5, p. B77_B85.
Schaafstal, A, Johnston, J & Oser, R 2001, 'Training teams for emergency management', Computers in Human Behaviour, vol. 17, no. 5-6, pp. 615-626.
Serfaty, D & Entin, EE 1999, 'Team adaptation and coordination training', in R Flin, E Salas, M Strub & L Martin (eds), Decision making under stress: emerging themes and applications, Ashgate Publishing, Aldershot, Brookfield, pp. 170-184.
Streichert, LC, O'Carroll, PW, Gordon, PR, Stevermer, AC, Turner, AM & Nicola, RM 2005, 'Using problem-based learning as a strategy for cross-discipline emergency preparedness training', Journal of Public Health Management and Practice, vol. Suppl., pp. 595-599.
Smith-Jentsch, KA, Kraiger, K, Salas, E & Cannon-Bowers, JA 1999, 'Teamwork in the control tower: how does it differ from cockpit resource management?' paper presented to Tenth International Symposium on Aviation Psychology,

Owen & Dwyer (2009) AIIMS National Survey Report Bushfire CRC; University of Tasmania. [email protected]
Page 98 of 115
Columbus, OH.
Vogus, TJ & Sutcliffe, KM 2007, 'The impact of safety organizing, trusted leadership and care pathways on reported medication errors in hospital nursing units', Medical Care, vol. 45, no. 10, pp. 997-1002.
Volpe, CE, Cannon-Bowers, JA & Salas, E 1996, 'The impact of cross-training on team functioning: an empirical investigation', Human Factors, vol. 38, no. 1, p. 87 (14).
Weick, KE & Sutcliffe, KM 2001, Managing the unexpected: assuring high performance in an age of complexity, Jossey-Bass, San Francisco.
Wilson, KA, Burke, CS, Priest, HA & Salas, E 2005, Promoting health care safety through training high reliability teams, viewed June 24 2006, <http://www.qshc.com>.