review of some head-up display formats - nasa · schematic for pilot using hud i1 ..... 35...
TRANSCRIPT

NASA Technical Paper 1499
NASA TP 1499 :’
c .1 ( HUD Report !
A Review of Some Head-Up Display Formats
J. M. Naish
OCTOBER 1979
https://ntrs.nasa.gov/search.jsp?R=19790025030 2018-06-12T04:48:25+00:00Z

TECH LIBRARY KAFB, NM
NASA Technical Paper 1499
A Review of Some Head-Up Display Formats
J. M. Naish Ames Research Center M o ffett Field, California
National Aeronautics and Space Administration
Scientific and Technical Information Branch
0134719 HUD Report 4
1979

TABLE OF CONTENTS
. Page
LIST OF TABLES . . . . . . . . . . . . . . . . . . . . . . . . . . . . . . . . . . . . . . . . . . . . . . . . . . . . . . . . . . . iv
LIST OF FIGURES . . . . . . . . . . . . . . . . . . . . . . . . . . . . . . . . . . . . . . . . . . . . . . . . . . . . . . . . . . v
SUMMARY . . . . . . . . . . . . . . . . . . . . . . . . . . . . . . . . . . . . . . . . . . . . . . . . . . . . . . . . . . . . . . . . . 1
INTRODUCTION . . . . . . . . . . . . . . . . . . . . . . . . . . . . . . . . . . . . . . . . . . . . . . . . . . . . . . . . . . . . 1 Origin of the Head-Up Display (HUD I) . . . . . . . . . . . . . . . . . . . . . . . . . . . . . . . . . . . . . . . . 2 Alternatesystems . . . . . . . . . . . . . . . . . . . . . . . . . . . . . . . . . . . . . . . . . . . . . . . . . . . . . . . . 5 Criteria for Comparison of Display Systems: Preliminary Review . . . . . . . . . . . . . . . . . . . . 8
TESTS OF VISUAL APPROACH FORMAT (HUD 11) . . . . . . . . . . . . . . . . . . . . . . . . . . . . . 10 Head-Up Display for the Visual Approach . . . . . . . . . . . . . . . . . . . . . . . . . . . . . . . . . . . . . . 10 Aircraft Installation and Checkout . . . . . . . . . . . . . . . . . . . . . . . . . . . . . . . . . . . . . . . . . . . . 12 Evaluation of Fixed Depression Symbol . . . . . . . . . . . . . . . . . . . . . . . . . . . . . . . . . . . . . . . . 13 Evaluation of Flight-Path Symbol . . . . . . . . . . . . . . . . . . . . . . . . . . . . . . . . . . . . . . . . . . . . 18 Combined Use of Fixed Depression and Flight-Path Symbols . . . . . . . . . . . . . . . . . . . . . . . 23 Simulation for Wind Shear Experiments . . . . . . . . . . . . . . . . . . . . . . . . . . . . . . . . . . . . . . . . 25
32 Schematic for Pilot Using HUD I1 . . . . . . . . . . . . . . . . . . . . . . . . . . . . . . . . . . . . . . . . . . . . 35
Experiment 1 . Effect of Display Format on Use of HIJD in Wind Shear . . . . . . . . . . . . . . . 28 Experiment 2 . Effect of Operating Conditions on Use of HUD in Wind Shear . . . . . . . . . .
COMPARISON OF HUD FORMATS ( I AND 11) . . . . . . . . . . . . . . . . . . . . . . . . . . . . . . . . . . 36 Display Properties . . . . . . . . . . . . . . . . . . . . . . . . . . . . . . . . . . . . . . . . . . . . . . . . . . . . . . . . 36 Discussion . . . . . . . . . . . . . . . . . . . . . . . . . . . . . . . . . . . . . . . . . . . . . . . . . . . . . . . . . . . . . . 39
CONCLUSIONS . . . . . . . . . . . . . . . . . . . . . . . . . . . . . . . . . . . . . . . . . . . . . . . . . . . . . . . . . . . . . . 41
REFERENCES . . . . . . . . . . . . . . . . . . . . . . . . . . . . . . . . . . . . . . . . . . . . . . . . . . . . . . . . . . . . . . . 44
... 111
.

LIST O F TABLES
Page
1 . DISPLAY FORMAT PROPERTIES . . . . . . . . . . . . . . . . . . . . . . . . . . . . . . . . . . . . . . . . . . 9
.
2 . DIP O F VISIBLE HORIZON . . . . . . . . . . . . . . . . . . . . . . . . . . . . . . . . . . . . . . . . . . . . . . 14
3 . MANUAL APPROACH PERFORMANCE IN FIXED DEPRESSION (DISPLACEMENT) MODE . . . . . . . . . . . . . . . . . . . . . . . . . . . . . . . . . . . . . . . . . . . . . . . 16
4 . MANUAL APPROACH PERFORMANCE IN FLIGHT-PATH (DIRECTION) MODE . . . . . . . . . . . . . . . . . . . . . . . . . . . . . . . . . . . . . . . . . . . . . . . . . . . . . . . . . . . . . . . 21
5 . HUD I1 FORMAT PROPERTIES FROM FLIGHT TESTS . . . . . . . . . . . . . . . . . . . . . . . 25
6 . DISPLAY CONFIGURATIONS IN EXPERIMENT 1 . . . . . . . . . . . . . . . . . . . . . . . . . . . 28
7 . PATH STABILITY IN EXPERIMENT 1 . . . . . . . . . . . . . . . . . . . . . . . . . . . . . . . . . . . . . 30
8 . ANALYSIS O F VARIANCE FOR PATH ERRORS IN EXPERIMENT 1 . . . . . . . . . . . . . . . . . . . . . . . . . . . . . . . . . . . . . . . . . . . . . . . . . . . . . . . 30
9 . DIFFERENCES OF DISPLAY MEANS IN EXPERIMENT 1 . . . . . . . . . . . . . . . . . . . . 30
10 . SCHEDULE FOR EXPERIMENT 2 . . . . . . . . . . . . . . . . . . . . . . . . . . . . . . . . . . . . . . . . . 32
1 1 . PATH STABILITY IN EXPERIMENT 2 . . . . . . . . . . . . . . . . . . . . . . . . . . . . . . . . . . . . . 34
12 . COMPARISON O F DISPLAY FORMATS (HUD I AND 11) . . . . . . . . . . . . . . . . . . . . . 36
iv

LIST O F FIGURES
1 . Development of HUD I format . . . . . . . . . . . (a) Pathway analog . (b) Pathway director . (c) Basic symbol format .
Page
. . . . . . . . . . . . . . . . . . . . . . . . . . . . . . . 3
.
2 . Lane and Cumming display . . . . . . . . . . . . . . . . . . . . . . . . . . . . . . . . . . . . . . . . . . . . . . . . . 6
3 . Vertical guidance information . . . . . . . . . . . . . . . . . . . . . . . . . . . . . . . . . . . . . . . . . . . . . . . 11
4 . HUD I1 visual approach format . . . . . . . . . . . . . . . . . . . . . . . . . . . . . . . . . . . . . . . . . . . . . . 11
5 . Aircraft installation . . . . . . . . . . . . . . . . . . . . . . . . . . . . . . . . . . . . . . . . . . . . . . . . . . . . . . . 13
6 . Manual approach with fixed depression symbol. showing long-period perturbations . . . . . . 16
7 . Manual approach in fixed depression mode with inertial attitude showing residual perturbations . . . . . . . . . . . . . . . . . . . . . . . . . . . . . . . . . . . . . . . . . . . . . . . . . . . . . . . . . . 17
8 . Manual approach showing path displacement due to incorrect use of symbols . . . . . . . . . . 20
9 . Manual approach showing path curvature due to incorrect use of symbols . . . . . . . . . . . . . 21
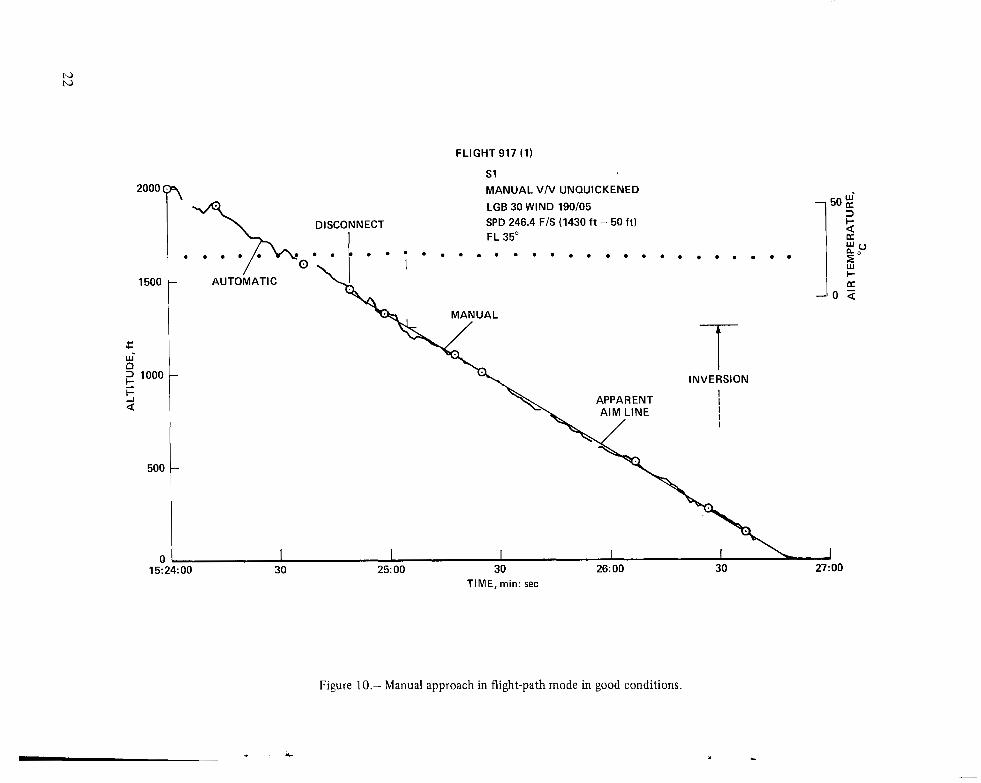
10 . Manual approach in flight-path mode in good conditions . . . . . . . . . . . . . . . . . . . . . . . . . . 22
1 1 . Generation of driving signals for HUD I1 . . . . . . . . . . . . . . . . . . . . . . . . . . . . . . . . . . . . . . . 27
12 . Windsforexperimentl . . . . . . . . . . . . . . . . . . . . . . . . . . . . . . . . . . . . . . . . . . . . . . . . . . . . 29
13 . Windsforexperiment2 . . . . . . . . . . . . . . . . . . . . . . . . . . . . . . . . . . . . . . . . . . . . . . . . . . . . 33
14 . Schematic for pilot using HUD I1 . . . . . . . . . . . . . . . . . . . . . . . . . . . . . . . . . . . . . . . . . . . . 35
15 . Effect of operational decisions on symbol format . . . . . . . . . . . . . . . . . . . . . . . . . . . . . . . . 40
V

A REVIEW OF SOME HEAD-UP DISPLAY FORMATS
J. M. Naish*
Ames Research Center
SUMMARY
A distinction is drawn between the original Head-Up Display, in which guidance is by means of an unreferenced, or unstabilized, flight director (HUD I) and concepts based on the proposal of Lane and Cumming to show displacement, or path error, and flight-path direction in relation to a ground frame (HUD 11). The display properties used in comparing the two systems are associated with easy, accurate performance of concurrent tasks based on superimposed fields in different flight modes. Results for HUD I are collected from earlier work, and flight tests in a large commercial jet transport are used to furnish previously unpublished results for HUD 11.
The use of displacement and flight-path information for vertical control is discussed in terms of path stability with special reference to error effects experienced in real flight and to signal pro- cessing. Several combinations of symbols and driving signals, including a compensated control law, are used in simulated flight to deal with windshear, without marked effect by day, but a general advantage is indicated for HUD in night conditions with unexpected shear, and several combinations of throttle control, turbulence, and initial offset. A schematic is given for the pilot using HUD 11.
Comparison of HUD I and 11 shows neither format to be uniformly superior or entirely ade- quate. Choice of a display may ultimately depend on decisions relating to the quality of data sources, the use of processed information, and the number of modes in which the display is used, while taking account of the techniques for wind shear, height control, and monitoring.
INTRODUCTION
The term Head-Up Display has been widely used in recent years, often in a sense broader than originally intended. From meaning a particular system with a specific purpose, it has come to mean a number of systems with a variety of applications. While it may be undesirable, and probably impossible, t o reverse the trend, it is nevertheless necessary to distinguish between current con- tenders for the function of providing head-up guidance to the aircraft pilot. This is because of dif- ferences in principle, and means of implementation, which lead to appreciable differences in display properties. The distinction is made in the present report by introducing the idea of different types of symbol array. or format, which are called HUD 1 and HUD 11. The name HUD I is used for the system which was first called the Head-Up Display, as will be described. The name HUD I1 is used for systems originally known by other names, such as the Airborne Approach Aid of Lane and Cumming, and its derivatives, which have since come to be included under the HUD umbrella.
*This work has been carried out while a Resident Research Associate of the National Research Council at NASA-Ames Research Center.

Origin of the Head-Up Display (HUD I)
While working at the Royal Aircraft Establishment, Farnborough, in 1956, the author was asked to suggest how it might be possible to fly close to the ground at high speed and in poor visi- bility, yet without distracting attention from the external visual scene. This meant that the informa- tion needed to follow the partly visible terrain, which would be derived from sensing equipment, would have to be seen while looking at the external scene, because there would be almost no time available for shifting attention to and from an indicator located in the flight instrument panel. Evi- dently, two sources of information had to be brought together and combined in a manner so that the pilot could perform concurrent tasks of visual and instrument flight.
One possible method was to superimpose the steering information on a televised picture of the forward view which would be seen in the instrument panel. This was rejected because the television camera would have to work from a single, fixed, and displaced “eye position,” and would be limited in resolution, field of view, color, and frame rate. A far greater visual capability could be preserved for the pilot by using a reflecting collimator, as in a weapon sight. The steering information would then be superimposed directly on the forward view and the only losses would be those due to absorption in the (partially) reflecting plate and to edge effects. Then to satisfy the operational requirement, it would be necessary to show that such losses were negligible and that a concurrent capability for precise instrument and visual flying could be sustained by this method for extended periods. In other words, the emphasis would be on eliminating the transition between instrument and visual flight modes, on securing a capability for critical appraisal of each of the superimposed fields of information, on accurate tracking, and on operating at a low workload.
To avoid the remarkable cost of test flying, initial tests were carried out by simulation.’But it was soon realized that what was lacking in current flight simulators, and was indeed essential to the purpose in hand, was a representation of the pilot’s forward view. A visual flight simulator was therefore constructed, and this was based on the simple experimental finding that when an aerial photograph (taken vertically downwards) is observed at grazing incidence it looks quite similar to the forward view in flight. The same was found to be true for a projection of a photomosaic trans- parency when observed by means of a studio type television camera (using facilities loaned by the BBC). This led to a laboratory system in which closed circuit television was used to provide six degrees of freedom for the visual scene, and which was demonstrated at the Famborough Air Show in 1958 (ref. 1). The system was used for some 1200 hours of experimental investigation and one of its most important contributions was in showing immediately what information would be difficult to present in the head-up mode.
There was great interest at that time in the so-called Contact Analog because it offered the pos- sibility of integrating the information shown in several flight instruments within a common frame- work, and the author was under some pressure to make use of this principle. Since the analog was usually shown as a rather complicated pattern of lines, a decision was made to simplify it by reduc- tion to a pathway consisting of lines parallel to the horizon which were spaced to suggest perspec- tive and shortened progressively to a vanishing point. This is shown by solid lines in figure I(a). The simplification was necessary because the pattern was to be written on a newly developed cathode-ray tube, which was bright enough to be used in flight conditions but imposed a limitation on the length of written line. Nevertheless, the simple pathway was sufficient for showing pitch atti- tude (more precisely, angle of elevation), bank angle, and heading, so that no significant informa- tion was lost from the parent form.
2

When this reduced analog was presented in the visual flight simulator by reflecting collimation, its essential limitation was at once evident. It could only be used for a very limited flight regime because significant parts of the display disappeared from view during quite small changes of pitch attitude and heading, as shown in figure l(a) by dotted lines. But the idea of integrated presenta- tion was seen to be useful (except for showing speed and height) and a way was therefore sought to overcome the problem of a limited display field. The solution lay in turning the pathway into a flight director which would not be referenced to a ground point. Commands would be shown by distorting the overall shape to suggest movements in azimuth and elevation (as distinct from yaw and pitch) (fig. l(b)), while keeping the pathway lines parallel to the horizon to show bank angle. The axis system of the external world was thus retained but not the scale; in other words, the dis- play was part-conformal. Pitch attitude was presented by adding an artificial horizon and this was driven at reduced gain to keep it visible at all times. A fixed aircraft symbol was provided, and a gap in the horizon (suggested by one of the pilots taking part in the experimental program) as a means for avoiding interference. This basic format, which is shown for a partly satisfied command in figure l(c), was used in the simulator t o establish properties of the display system.
\ . -. I /
\ "4 \ I
\ / - - + \ / \ /
\ \
/ \
/ / '. 0 " " - 0
\ I
\ / \ \ /
1
I """
(a) Pathway analog. (b) Pathway director.
/'
/ I
C" " . /' *
\ . \ \
/ \ \
/ \
(c) Basic symbol format.
Figure 1 .-- Development of HUD I fonnat.
3

The simulator experiments (ref. 2) showed that tasks of tracking and external acquisition could be performed without effect on each other, thus eliminating the transition, and that super- imposed fields were observed concurrently and critically. In regard to tracking accuracy, there was a marked improvement on performance with a conventional (attitude-director) flight instrument, which was attributed to presenting the more significant (command) information in the common framework of the external world (pitch attitude was of less importance). Learning time was gen- erally small for experienced pilots, although some showed initial reluctance to become involved. It was shown in subsidiary experiments that disturbing effects could be eliminated, and that under conditions of a misaligned display, there was no increase in the time to acquire objects appearing in an empty external field. No attempt was made to generalize these findings by applying them to other types of symbol format, however.
These results gave reasonable hope of meeting the operational requirement and justified tests in real flight, which started in 1960. The same symbol format, with the addition of a speed element in the periphery of the display, was written in monochrome on a bright cathode-ray tube contained in a weapon sight.. This equipment was installed in a tandem, two-place jet fighter aircraft, together with means for generating flight director commands. It was described as a system for presenting steering information during visual flight, and was defined as the Head-Up Display (ref. 3). The resulting flight tests, besides reinforcing laboratory findings for transition, concurrent observation, and learning, had an unexpected outcome. At the conclusion of the first flight, the pilot generated his own commands from instructions received during a ground-controlled approach and used the display to follow these commands - although no provision had been made for using the display in this phase of flight. He thus accomplished a new kind of instrument approach on his own initiative and opened the way for a far-reaching application of the system.
Further tests were then carried out in a side-by-side, two-place, high performance jet fighter during 1963 and 1964, with guidance provided for approach and terrain following modes (rudimen- tary in the latter case), with facilities for recording pilot performance, and with small changes in the peripheral elements of the display - including a digital height readout (ref. 4). As a result, the required operational capability was demonstrated. In particular, concurrent critical scanning in both fields was found to take place under stress, as was shown by pilots ignoring a fly-down command inserted by the instructor when close to the ground at high speed. Ease of learning was evident in the use of the system without training and, on several occasions, by nonpilots performing in the terrain following mode. Tracking accuracy was at a level sufficient to suggest using the display as an alter- nate to an automatic approach and landing system (ref. 5). There also was an improvement in the visual pickup of objects appearing in an empty external field, which was attributed to a reduction in space myopia (refs. 6 and 7). Night flying was successful and directed takeoffs were accomplished with the help of a computer furnished by Fry, Burden, and Green (ref. 8). Reliability was an order of magnitude better than for an equivalent electromechanical system. These satisfactory tests were followed by modification for VTOL aircraft (ref. 9), in which the display became a primary flight instrument system for the first time. The tests also led to adoption of the display as standard equip- ment in military aircraft, where it became known as HUD.
Less progress was made in the field of commercia1 aviation for besides the obvious lack of need for terrain following, there were already systems in use for aFproach and landing, the typical cock- pit had not been designed to accept a reflecting collimator, and there was no central authority requiring such changes to be made. On the other hand, circumstances might, from time to time, occur when it would be advantageous if instruments could be seen without distracting attention
4

from the outside world. Moreover, an automatic approach and landing system was an expensive alternative, it had no independent monitoring, and it was programmed only to deal with predictable eventualities. For these rcasons, it was interesting to pursue development in the direction of com- mercial aviation, especially as Morrall had by now shown in independent tests that a manual approach with HUD was at least as accurate as an automatic approach (ref. 10).
In 1965, the author was givcn the timely opportunity to carry out flight tests of HUD in a commercial jet transport at the Douglas Aircraft Company in Long Beach, California. Preliminary trials with a mocked-up installation soon showed that what had previously been established for mili- tary aircraft could also be realized in commercial aviation. Airline pilots used HUD successfully without special training, some even completing blind landings with small lateral and longitudinal dispersions and with small touchdown rates (refs. 1 1 and 12). These results were sufficient to justify the design of preproduction cockpit installations and an extensive program for the optimization of symbol control gains; at the same time, further peripheral changes in the symbol format were made by adding raw ILS scales and a master warning symbol. Satisfactory results were then obtained in a further series of flight tests with a large group of airline pilots, all of whom performed with an accu- racy equivalent to that required of an autopilot - thus confirming Morrall’s finding. Again, learning was rapid and there were no adverse effects in the transition, even with a deliberately misaligned dis- play. There was some evidence of an i~nproved capability for avoiding collision, and it was found that error effects were very small. Comparison with an automatic approach showed that HUD bought time for the pilot (refs. 1 1 and 13), permitted better decisions on the basis of more com- plete information, and provided a suitable medium for presenting monitoring information.
Alternate Systems
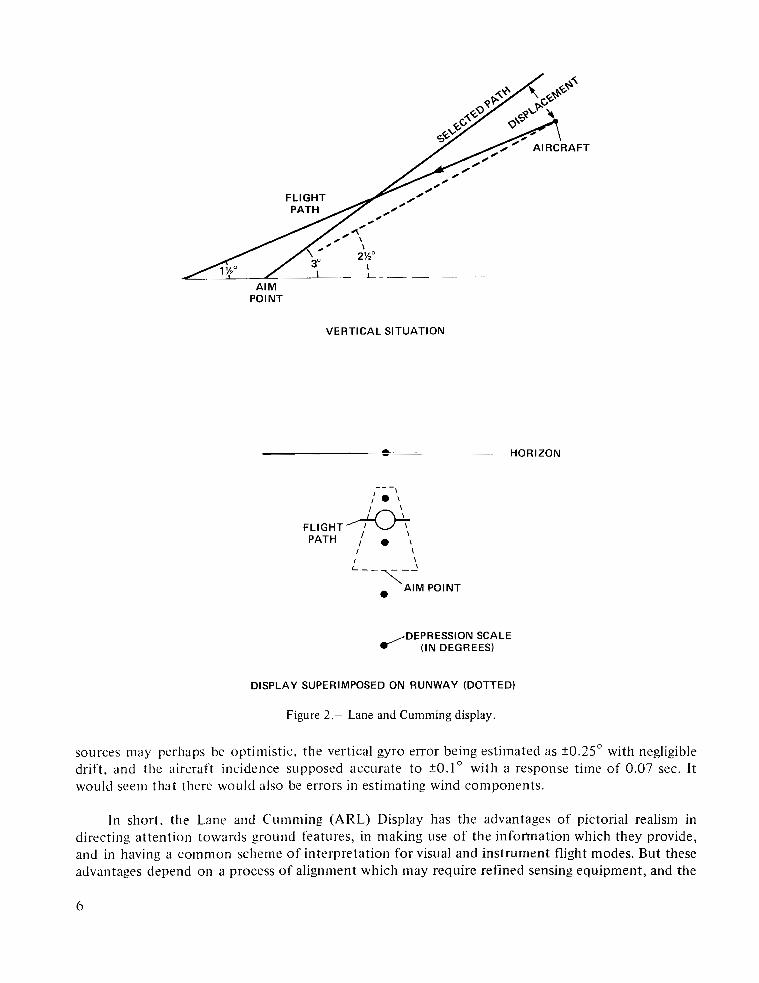
An important alternate to HUD is the Aeronautical Research Laboratories (Australia) Display put forward by Lane and Cumming in May, 1956 (ref. 14), which depends upon knowing displace- ment and direction of movement to achieve a given path. This information is presented to the pilot by means of a reflector gunsight, with an angular scale showing depression of the aim point below the horizon (to give vertical displacement from a selected approach path), and an aiming circle representing flight path (direction of movement). Figure 2 illustrates the principle of the display for the simplified case of an aircraft below a selected 3” path, with the aim point (assumed to be at the threshold) seen at a depression of 7.5” and the flight path directed at an angle 1.5” below the hori- zon. The circle is driven by a signal derived from an incidence vane, with corrections for airspeed and (manually inserted) weight, headwind and sidewind. In addition, a “ghost circle” shows raw ILS information (not included in fig. 2). Mirrors are used in generating the display and, in the form described by Baxter and Workman (ref. 15), the whole gunsight is moved about the pilot’s eye posi- tion and stabilized with respect to runway heading and horizon.
A visual approach with this system begins when the runway aim point is in coincidence with a selected mark on the depression scale, and the aiming circle is thereafter maintained on the aim point. In an instrument approach, the aiming circle is held on the ILS “ghost circle,’’ while both symbols are maintained on the selected depression mark. This information, it is claimed, shows both the action required and the reason for it. Also, the position in which an invisible runway may be expected to appear is shown beforehand. However, it is not made clear whether three indepen- dent symbols can be expected to be distinguished from each other and from the runway aim point when moving in close proximity. And the accuracies suggested by Lane and Cumming for data
5
POINT
VERTICAL SITUATION
a. . - HORIZON
FLIGHT PATH / 0 \!
I \ \
L--\-J 0 AIM POINT
(IN DEGREES) DEPRESSION SCALE
DISPLAY SUPERIMPOSED ON RUNWAY (DOTTED)
Figure 2.- Lane and Cumming display
sources may perhaps be optimistic. the vertical gyro error being estimated as k0.25" with negligible drift, and the aircraft incidence supposed accurate to 20.1" with a response time of 0.07 sec. It would seem that there would also be errors in estimating wind components.
In short, the Lane and Cumming (ARL) Display has the advantages of pictorial realism in directing attention towards ground features, i n making use of the infomation which they provide, and in having a common scheme of interpretation for visual and instrument flight modes. But these advantages depend on a process of alignment which may require refined sensing equipment, and the
6

tracking accuracy which is typical of a conventional flight director might conceivably be sacrificed by the neglect of higher-order control terms. So, it is important to know the performance of the system in real flight. In passing, it is interesting to note that while Lane and Cumming also analyze the cues to be found in the external scene during a visual approach, their display does not depend for its success on the practical usefulness of those cues. For they point out that aim-point depres- sion can only be judged in unaided visual tlight if a horizon is seen, and that the apparent expansion of the forward view is a cue of unknown accuracy for judging flight path (ref. 14).
Another system dating from 1956 is the Sperry Display proposed by Gold and Pine.’ Accord- ing to Baxter and Workman (ref. 15), this was originally a flight director presented by means of a gunsight with the later addition of a runway symbol, and the provision of alternate signals to drive the director symbol as a flight-path symbol or as a displacement symbo1:There are similarities with the ARL Display, since both are referenced to the aim point on the runway, but the Sperry Display depends on mode switching and this caused difficulties in flight tests through mistaking the (changeable) meaning of a symbol (ref. 15). Later versions of these displays make partial use of a cathode-ray tube, which is evidently not very luminous. There is a tendency for the guidance symbol of the Speny Display to oscillate in the flight-path mode and, to lesser extent, in the (ground referenced) director mode because of sideslip and yawing disturbances. There is a problem in obtaining fast enough response with the servos stabilizing the ARL Display; and there is difficulty in aligning symbols with the real world.
The principles of Lane and Cumming have also been incorporated in other systems. A display of this kind was developed for aircraft carrier approaches and flown in 1965 with “most satisfactory results” according to Johnson (ref. 16). Another display of this kind was used in a Varsity aircraft by Harlow in 197 1 (ref. 17), who found that a simple display of displacement produced an improvement in pitch performance compared with visual approaches, but that flight path was inaccurate and of little assistance. He considered a conventional gyro to be a sufficiently accurate source of pitch attitude to stabilize the depression symbol, except that configuration and speed changes could give rise to transient errors, but incidence vanes might be only accurate to k0.5”. An even further simplified display was described by Brown and Ginn in 1973 (ref. 18), which was used for tlight tests in a Comet aircraft. This had a fixed depression symbol stabilized by either an inertial platform or flight-control system gyros. I t was found that the inertial platform appeared to give smaller values for the standard deviation of the height error at various ranges, but the differences were not statistically significant. Yet, inspection of their results shows that whereas inertial and gyro sources gave equal results at both long and short ranges, there were large differences at intermediate ranges. This suggests that a nonnegligible and time-dependent error may have been present in the gyro as might occur through deceleration.
In the Thomson-CSF Display, which is called a Visual Approach Collimator (Type CV 9 1 ) and is of the reticle type, the basic symbols are again those of Lane and Cumming, with the addition of incidence hold and total energy components, so that four symbols have evidently to be aligned with the aim point during the course of an approach. This display has been carefully evaluated as a prin- ciple flight instrument by tests in a Nord 260 aircraft at the Centre d’Essais en Vol. BrCtigny, during 1973 (ref. 19). The data sources included an inertial system and an incidence probe filtered to 2 sec.
’ Gold, T.; and Pine, C.: Proposal for a Visual Landing Aid Based on Gunsight Techniques,” Sperry Flight Research Menlo Report 120, June 1956. (Quoted from Baxter &Workman.)
7

The velocity vector was corrected for wind, this correction being removed on reaching a height of 200 ft, and guidance was provided for the flare. The flight path was reconstructed by kinetheodolite and laser techniques, while reticle positions were recorded by an aiming camera.
In these tests, symbols were found to be manageable at an acceptable level of workload, even in turbulence, and with suitable proficiency after a learning period covering 12 approaches. Dis- placement and energy symbols were considered to be good but no judgment of the velocity vector was made, except to note that it was difficult to use when displaced laterally in a crosswind. Per- formance in holding path and speed was better than in a normal visual approach and was largely independent of operating conditions, whether by day or night, but a clearly defined ground aim point was required. The standard deviation of the height error at 100 ft, as inferred from the pub- lished results, was in the range of 4% to 8% ft, which is somewhat larger than the value of about 5 f t obtained by Morrall with HUD 1 (ref. 10). The distribution and control of reticle brightness was not entirely satisfactory.
Criteria for Comparison of Display Systems Preliminary Review
It is possible to compare HUD I with display systems of the Lane and Cumming type in a number of ways, of which the most reasonable seems to be to consider the properties which are associated with the symbol format. This is because it is the fonnat which truly distinguishes each system rather than the means used to generate and present the symbols so a feature such as display brightness is not particularly relevant t o a comparison of the potential values of the two concepts. It should be assumed instead that the same means of implementation could be made available to each of the systems. On the other hand, data sources are not the same for each system and these are to be considered as linked firmly with the symbol format. The properties t o be discussed are listed in table 1.
At the outset, it has to be recognized that there is a fundamental similarity between HUD I and the alternate systems, because each depends upon controlling the reduction of displacernent. In simple systems of the Lane and Cumming type this is done at a rate chosen by the pilot, who is thus free to join thc selected path as he sees fit. For cxarnple, in figure 2, the flight path could be directed at an angle of 1.25" below the horiLon. In more complex systems of the same kind, the rate is computed for the best performance, and the path i s to be joined i n a prescribed manner. In either case the principle is that of a flight director, where a command becomes zero when a displace- ment is correctly balanced by a rate of change of displacement. The essential difference i n Lane and Cumming systems is in using a ground point as reference, whereas the flight director in HUD 1 is not referred to any ground point. In consequence, the two kinds of systems differ markedly in their dependence on the data sources needed for alignment with the real world.
Clearly, the difterence between systems could be removed by refkrring the HUD I flight direc- tor to a ground point. I t would then acquire the more conformal qualities of the other systenl.,. But, what would happen to the properties established by prior HUD I tlight and simulator tests'? Unfor- tunately, the properties of alternate systems are not yet ful ly known and this question cannot be answered completely. There seems to have bcen no systematic investigation of the transition, nor of the capability for concurrent critical observation, nor of the problem of disorientation. Tracking accuracy is evidently better than i n the nonnal visual approach but it is not clear whether autopilot
8

TABLE 1 .- DISPLAY FORMAT PROPERTIES (From previously published work, see text.)
Transition
Conformity
Concurrent observation
Disorientation resistance
Simplicity
Tracking accuracy
Ease of learning
Interference resistance
Fixation resistance
Error resistance
Applicability
Drift capability
Monitoring capability
HUDI (Unstabilized director)
1 sec or less
Partial Discrepancy detection, concurrent tasks,
collision avoidance
Breakout survival with misalignment
Readily available
Better than automatic control
Immediate for display, 30-45 min for display and forward view
Some at center
Achieved with distributed symbol
High for good ILS
All modes except visual approach
Not specifically available
Needs ILS scales
HUD I1 (Conformal flight path
and displacement)
Not known
Complete
Not known
Not known
Less available
Better than manual visual control
Needs 12 approaches
Not known
Not known
Doubtful
Final visual approach
Available
Not known
performance can be equalled as is the case with HUD I. The Br6tigny tests (ref. 19) indicate a greater learning time which may reflect an increased workload. If this is the case, it may be due t o a lack of the self-evident aspect of HUD I which is achieved largely by flying a fixed aircraft symbol to a moving index associated with the external field (ref. 13). It may also be due in part to interfer- ence of the several freely moving guidance symbols of a fully conformal display, and to crossovers with peripheral components of the format, which are avoided in HUD I by recourse to the zoning principle (ref. 13). Another difficulty seems to be that the guidance symbols cannot readily be given the distributed form found useful for avoiding fixation effects in HUD I (ref. 13).
Regarding the quality of information in alternate display systems, Harlow indicates that a con- ventional gyro may not be sufficiently accurate for use throughout the approach phase, and the results of Brown and Ginn point to the same conclusion (this type of data source was not used in the Br6tigny tests). There were difficulties with the flight-path symbol in the Sperry Display and in Harlow’s work, while the velocity vector symbol was not critically evaluated in the Brktigny report. These results indicate that special care would be needed in choosing sources of vertical and flight- path information for a fully conformal version of HUD, whereas the only precautions needed in the flight director version were in securing a fully protected (shielded) ILS signal of high quality.
It also has to be considered whether an alternate system could be used in various phases of an approach. The attitude changes expected in setting up the final approach, in the flare maneuver, and in a missed approach, cannot be allowed to exceed the limitations imposed by the display’s field of view unless the whole display device can be realigned within the cockpit. In the flare maneuver,
9

there will be some loss of conformity if the reference for the flight path is moved to an arbitrary position, such as 0.8" below the horizon (ref. 19), so that the display becomes an unreferenced flight director. There will be an obvious need to change the aim point and allow for a difference in runway geometry because of any change in the pilot's height of eye between aircraft. On the other hand, the fully conformal display is more suitable for the visual approach when no ILS is available than the director form of HUD, which can then only be used for attitude, height, and speed infor- mation. Moreover, the conformal display may be corrected for drift and may thus be useful in locating the runway, although this feature may lead to interference with the external scene in con- ditions of very poor visibility if a runway symbol is shown.
It is clear from this brief comparison that there are too many differences between HUD and systems of the Lane and Cumming type to justify the practice (ref. 20) of including both under the title originally used by the author; and this is the reason for the distinction between HUD I and HUD 11. I t is also clear that there are inequalities in the extent t o which the two types have been investigated, for it cannot be assumed that the same properties apply to each of them. What is known for each type is summarized in table 1.
Besides providing new information the main aim in the present work is to compare the two types of display format. This task is addressed by attempting to fill the gaps in table 1, with the implication that the properties listed there are relevant to the assessment of a high performance, low workload display system for carrying out concurrent tasks of information processing in a variety of flight modes, and in real operating conditions. These properties take into account a wider range of operational factors than those of Baxter and Workman, which were limited to information content, simplicity, and compatibility (ref. 15), and they provide some measurement criteria. The experi- mental aspects of the task are dealt with by adapting HUD for the visual approach, using a large commercial aircraft as the principle test vehicle while seeking stable and accurate path control with immunity to errors and'disturbances. Supplementary work is carried out in simulated wind shear conditions.
TESTS O F VISUAL APPROACH FORMAT (HUD 11)
Head-Up Display for the Visual Approach
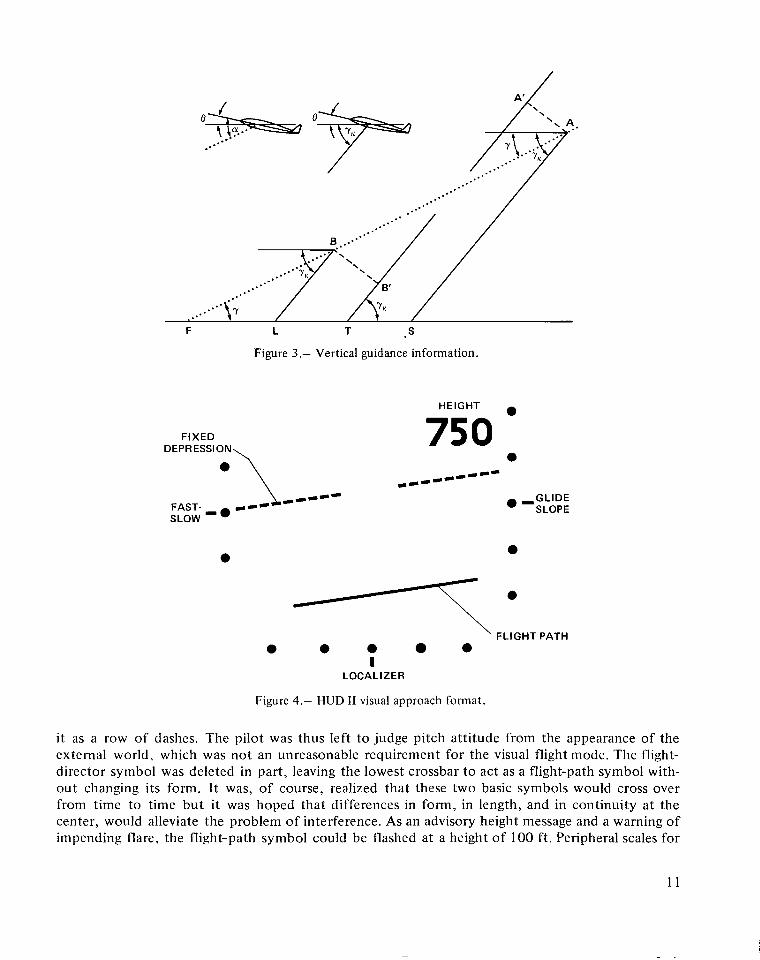
In an approach over featureless or barely visible terrain, towards a runway which allows esti- mation only of lateral position, control in the vertical plane is essentially open-loop except at short range (refs. 21-24). As previously noted, displays of the Lane and Cumming type ars applicable in this kind of situation because they usually show vertical displacement from, and rate of closure to an approach path which the pilot intends to achieve. Figure 3 shows how this guidance information can be furnished by a symbol placed at a fixed angle of depression below the horizon, yK and another symbol placed in the direction of the flight path, y. Then the displacement, A A ', from the selected path, A 'T , is shown by the ground position of the y~ symbol at S, and the direction of the flight path is shown by the ground position of the other (y) symbol at F.
Figure 4 shows how the basic format of figure 1 was modified to provide the two symbols without extensive alteration in the method of waveform generation. The aircraft symbol was removed entirely and the artificial horizon was converted to a fixed depression symbol after writing
10
F L T S
Figure 3.- Vertical guidance information.
HEIGHT
DEPRESSI:\
FIXED
FAST- I SLOW
CL---
750 -
0
‘ FLIGHT PATH 0 0 0 e 0
I LOCALIZER
Figure 4.- HUD I1 visual approach format.
it as a row of dashes. The pilot was thus left to judge pitch attitude from the appearance of the external world, which was not an unreasonable requirement for the visual flight mode. The flight- director symbol was deleted in part, leaving the lowest crossbar to act as a flight-path symbol with- out changing its form. It was, of course, realized that these two basic symbols would cross over from time to time but it was hoped that differences in form, in length, and in continuity at the center, would alleviate the problem of interference. As an advisory height message and a warning of impending flare, the flight-path symbol could be flashed at a height of 100 ft . Peripheral scales for
11

ILS and speed information were retained from a previous configuration, together with a digital read- out of radio altitude (ref. 13). The whole HUD I1 format could be selected by a mode switch as an alternate to the HUD I flight-director format.
A driving signal for the fixed depression symbol was obtained by summing the pitch attitude output of a vertical gyro with a reference voltage representing the selected approach path angle, usually 2.7” or 2.8”. The flight-path symbol was driven by an angle-of-attack signal which was obtained by averaging the outputs of left and right fuselage probes. This signal was filtered to remove frequencies above a selected value which varied between 0.16 Hz and 1 .O Hz. Provision was made, however, to restore control response by adding washed-out pitch attitude. It was also possible to combine the fixed depression and flight-path signals in a chosen proportion, as in the “director mode” of the Sperry Display (ref. 15) and as in the “delta gamma mode” of Bateman (ref. 25). For the flare maneuver, the fixed depression signal was decayed to a value placing the symbol at an ang!e of 0.8” below the horizon. The same signal was used as a flare command when reverting to the HUD I format.
Aircraft Installation and Checkout
The display equipment consisted in the collimator, waveform generator, and deflection ampli- fier used in previous flight tests (ref. 13), except for the changes noted in the previous section. This equipment was installed in a DC-10-10 aircraft together with a reflector assembly and an arrange- ment of controls suited to the cockpit layout. The collimator was mounted overhead to avoid the direct entry of sunlight into the lens system and to minimize structural alterations. The optical diameter was 4 in. and the collimator housing, also accommodating the bright cathode-ray tube on which the symbol format was written, was about 13 in. in length, the whole unit weighing about 8 Ib. The reflector assembly was mounted on the glare shield and consisted in a fold-down, flat glass plate and clamping fixture. Deviations in the plate were held to 0.5 min of arc and the glass surface was coated with a 50 percent transmission neutral density filter. This relatively high density coating was used to test claims that absorption losses would not be noticeable for the particular process employed (Keim type). The instantaneous monocular field of view of the optical system was 7.5” for a viewing distance of 3 1 in. (at the captain’s station) and this was 19 percent less than in the pre- vious flight tests. Figure 5 shows the salient features of the installation and indicates the clearance between the collimator fairing and the pilot’s head, which was about 4 in.
After making adjustments for parallax, exit pupil position, and boresighting, the system was calibrated by theodolite and simulated gyro signals for angles of elevation (“pitch attitude”). Angles of attack were set up by moving the probes to fuselage positions determined by flight measurements of the coefficient of lift. Preliminary flights were then made to check optical and muchanical fea- tures of the installation. The field of view was found adequate except when using a high seat posi- tion or in a strong crosswind. There were no complaints about visibility through the reflector plate, which was occasionally used for periods of about 4 h, but no tests were made in dusk conditions. There were occasional adverse comments on the accuracy of collimation but these were eliminated by explaining the correct method of checking collimation (by parallax). Head clearance was found to be sufficient except when entering or leaving the seat. Some residual vibration of the reflector plate was removed by bolting it to the window frame and to the autopilot control box.
12
. . . . . , ........,.
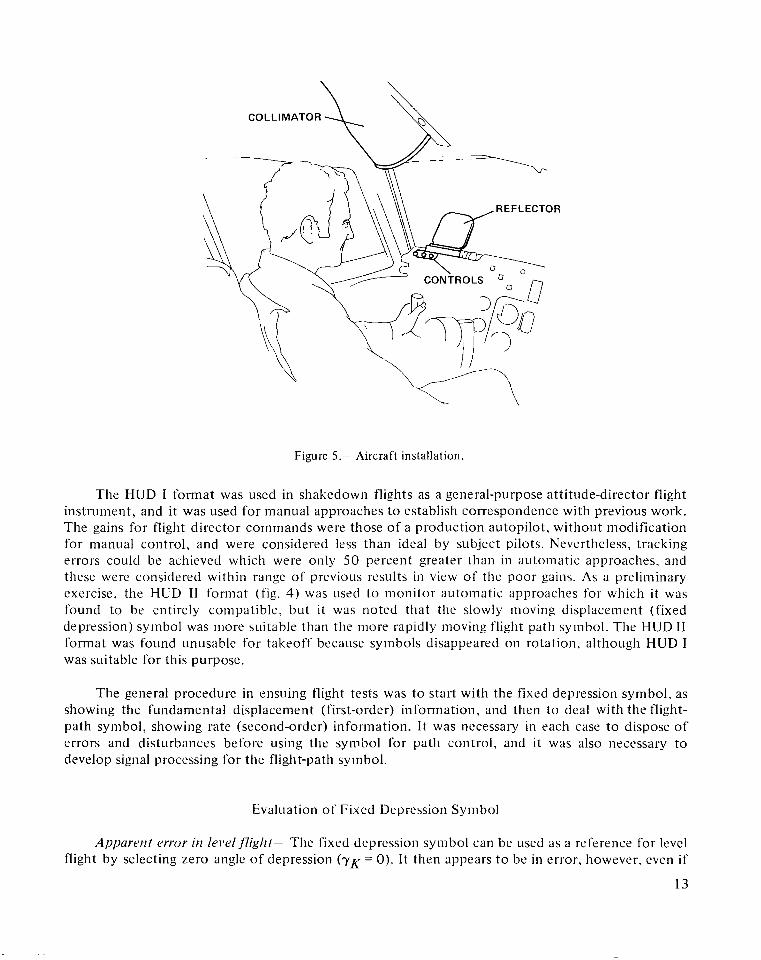
Figure 5.- Aircraft installation.
The HUD I format was used in shakedown flights as a general-purpose attitude-director flight instrument, and it was used for manual approaches to establish correspondence with previous work. The gains for flight director commands were those of a production autopilot, without modification for manual control, and were considered less than ideal by subject pilots. Nevertheless, tracking errors could be achieved which were only 50 percent greater than in automatic approaches, and these were considered within range of previous results in view of the poor gains. As a preliminary exercise, the HUD I1 format (fig. 4) was used to monitor automatic approaches for which it was found to be cntirely compatible, but it was noted that the slowly moving displacement (fixed depression) symbol was more suitable than the more rapidly moving flight path symbol. The HUD I1 format was found unusable for takeoff because symbols disappeared on rotation, although HUD I was suitable for this purpose.
The general procedure in ensuing tlight tests was to start with the fixed depression symbol, as showing the fundamental displacement (first-order) information, and then to deal with the flight- path symbol, showing rate (second-order) information. It was necessary i n each case to dispose of errors and disturbances before using the symbol for path control, and it was also necessary to develop signal processing for the flight-path symbol.
Evaluation of Fixed Depression Symbol
Apparerzt error irz I e ~ v l j7ight- The fixed depression symbol can be used as a reference for level flight by selecting zero angle of depression ( y ~ = 0). I t then appears to be i n error, however, even if
13

no error exists, because of the dip of the visible horizon which causes the latter to be depressed below a truly horizontal reference. The angle of dip is a consequence of the earth's curvature and is a significant factor in optical sighting techniques. It varies as the square root of height, amounting to about 0.7" a t 1,600 ft and 1.6" at 10,000 ft, which are noticeable displacements in the HUD field of view.
This apparent error was troublesome to pilots until a procedure was developed for measuring the angle of dip in which a calibrated display control (Y-shift) was used t o bring the symbol down into line with the visible horizon. Table 2 shows how observed values compared with dip angles cal- culated for a spherical earth and unlimited visibility. The agreement was poor except when a good horizon was available, on Flight 842. Nevertheless, confidence in the display grew as a result of the experiment, and it could be appreciated by users that depression angles-would be referenced to a true horizon in future visual approaches.
TABLE 2.- DIP OF VISIBLE HORIZON
Flight
810 842 L-
Visibility
! Height,
' ft i
Poor ' 25,000 ! 10,000
Slightly hazy 1 24,000
Calculated
-2.6" - 1.6" -2.5"
Observed
.. .
-1 .o" +1.6" -2.4"
Gyro error- An error in the gyro, through (slow) erection to a false vertical, causes the fixed depression symbol to be out of position by the amount of the error. The vertical gyro used to stabi- lize the symbol was required by specification to be correct within 0.35" under normal conditions but could be in error by as much as 1.1 5" during an approach through erection cutoff under longi- tudinal acceleration. The symbol was therefore subject to a more-or-less steady error which could be about a degree in the early part of an approach but which would be expected to diminish as the approach stabilized. The effect of the error would be to alter the angle of the selected path - if the symbol were to be held on the aim point - or simply to displace the symbol from aim in an approach made by independent means, as in an automatic landing.
Gyro error was measured approximately during pitch upset maneuvers in level flight using a distant object as a reference while correcting any change in symbol position by a Y-shift of the dis- play. The error was found to be about 0.3". It was then measured more exactly during automatic approaches by estimating the longitudinal offset of the symbol along the runway, as seen from a known height on the glide slope. The mean error for 25 observations was 0.9 1" with a standard devi- ation of 0.26", all symbol positions being short of aim. These results were consistent with the gyro specification.
Gyro error was often smaller when operating at heights less than about 700 ft, as would be expected for the more stable conditions obtaining in the latter part of an approach. It was greater when the approach was preceded by rapid turns and large decelerations. Sylnbol behavior improved when an inertial system was used to provide pitch attitude, and recordings then showed a slowly varying difference of up to 0.6" between inertial and gyro source data (fig. 7).
14
Cain error- An incorrect gain in the pitch attitude channel causes the fixed depression symbol to wander during changes of aircraft attitude. This effect was reported persistently, being seen mostly as a "lag" in the symbol. It was eliminated by recalibrating the channel with a tilt table.
Ejfect of longitudinal wind- When an aircraft is displaced from the approach path by a longi- tudinal wind component, the fixed depression (displacement) symbol is moved away from the aim point to a position short of aim in a headwind and to a position beyond aim in a tailwind. The pilot is able to correct the displacement if he makes a long-term change in flight path, and in so doing he may gain knowledge of the airmass. A series of corrections is needed in a wind shear situation because of changing displacements of the symbol as the aircraft experiences different longitudinal wind components.
The surface headwind (w) was never more than 3 1.2 knots in the experimental program. The corresponding alteration in the flight-path angle (y), for an approach speed (V) of 135 knots, was wy/( V-w) or 0.81" at most, which caused no difficulty in containing symbols within the field of view. Nor was there any difficulty due to wind shear, which was determined (from comparison of surface and upper winds) as being always less than 5 . 5 knots per thousand feet. and which would obviously make no serious contribution to a field of view problem.
Miscelluneous errors- It was found necessary to check periodically for zero error in the pitch attitude channel because of electrical drift. This error was usually less than 0.3" and was removed by Y-shift before flight. As additional precautions, checks were made for transmission delay and for effects of airframe distortion in moving HUD relative to the vertical gyro or in displacing optical components. Both effects were negligible, transmission delay being less than 0 . 0 5 sec and the effect of distortion less than 0.2" under extreme loading.
Put/? control- The fixed depression symbol was sed by two test pilots (S2. S3) i n approaches at Palmdale, California and Yuma, Arizona. These were made in a standard configuration of tlaps, slats, and landing gear, with automatic throttle control in the speed mode, and with a depression angle selected to match the airfield glide slope. The degree of path control achieved by pilots was judged by the straightness of airmass profiles, which were constructed from recordings of radio alti- tude and corrected, where possible, for ground contour. The slope of profiles was extracted after allowing for wind (at constant airspeed).
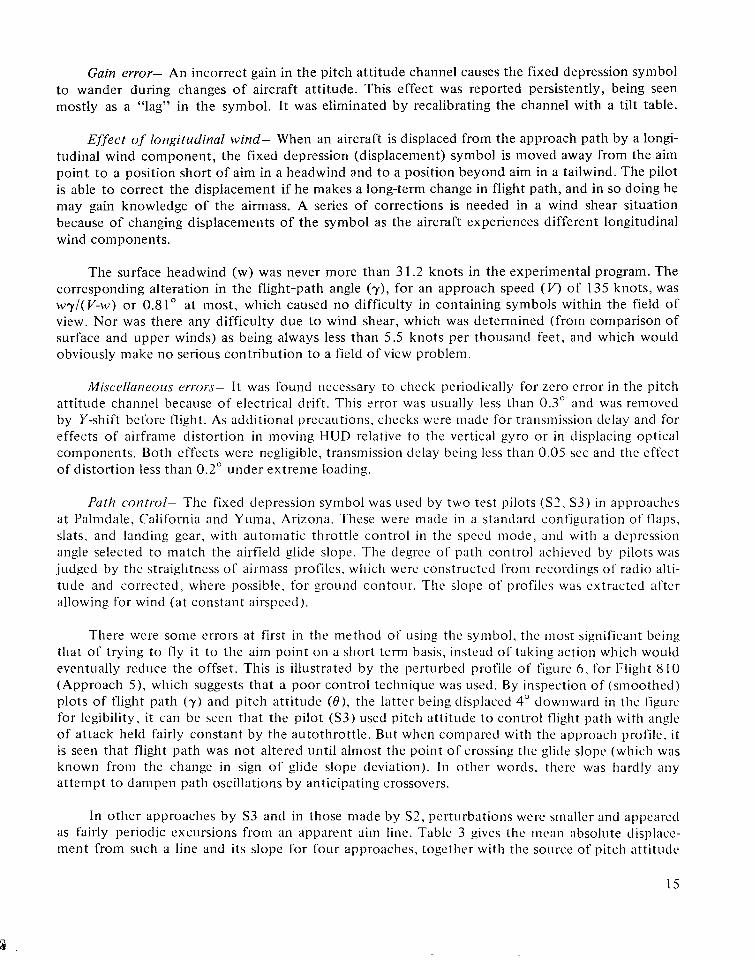
There were some errors at first i n the method oi' using the symbol, the most significant being that of trying to fly it to the aim point on a short term basis, instead of taking action which would eventually reduce the offset. This is illustrated by the perturbed profile of figure 6, for Flight 8 10 (Approach 5 ) , which suggests that a poor control technique was used. By inspection of (smoothed) plots of flight path (y) and pitch attitude ( e ) , the latter being displaced 4" downward i n the figure for legibility, it can be seen that the pilot (S3) used pitch attitude to control flight path with angle of attack held fairly constant by the autothrottle. But when compared with the approach profile. it is seen that flight path was not altered until almost the point of crossing the glide slope (which was known from the change in sign of glide slope deviation). I n other words. there was hardly any attempt to dampen path oscillations by anticipating crossovers.
In other approaches by S3 and in those made by S2, perturbations were smaller and appeared as fairly periodic excursions from an apparent aim line. Tablc 3 gives the mean absolute displace- ment from such a line and its slope for four approaches, together with the source of pitch attitude

FLIGHT 810 (5) PROFILE
2500 r s3 MANUALyK (2.7') PMD 25 WIND 230120 1 l o
,,,- 1500
3 I-
.c 4-
n - -I
500 - GLIDE SLOPE
14 1:oo 30 15:OO 30 16:OO 30 TIME, min: sec
Figure 6.- Manual approach with fixed depression symbol, showing long-period perturbations.
TABLE 3.- MANUAL APPROACH PERFORMANCE IN FIXED DEPRESSION (DISPLACEMENT) MODE
'-Flight ' j Pitch ~ Aim point, 1 Periodicity, ' , Height 1 Mean absolute path ~
I T 1 1 - - - . T 1 (approach) , 'lot ~ attitude I ft ~ sec
, range,
I I t t 1 801(8) , S2 VG' I 695 85 1
j 801(9) I s 2 VG j 2025 j 95 ' 813(4) i S3 VG 1 (GO around) I 80
i 1 8 ( 1 0 ) b 1 S2 1 INC 1 560 - J 55 'Vertical Gyro. bFigure 7. 'Inertial System.
ft
1000-50 1200-50 1580-435 1650-100
error, ft
30.1 33.5 51 . I 24.6
Mean slope
4.0" 2.75" 1.8" 3.2"
and other information descriptive of the profiles. The most stabIe path was achieved on the last approach, for which an inertial system was used to provide pitch attitude. The pilot (S2) reported that the symbol was more stable than when using a gyro source, and he achieved a mean path error of 24.6 ft for the relatively straight profile shown in figure 7, which is for Flight 8 18 (Approach 10). This error may perhaps represent an irreducible minimum for a mode in which rate damping must be supplied by the pilot, by anticipating changes in flight path, and it is to be noted that the pilot reported a need for a lot of attention in controlling the symbol. The path angle was 3.3', while a depression of 2.7" had been selected for an approach to Palmdale, and the difference is attributed to uncorrected zero error.
Summary- The fixed depression symbol is thus useful in providing basic displacement infor- mation for crude vertical path control, given proper attention to the elimination of errors and ade- quate knowledge of symbol characteristics. The quality of attitude information is clearly of major
16

2000 - FLIGHT 818 (IO) PROFILE
s2 MANUAL yK (2.7") PMD 25 WIND 230/18 SPD 229 FIS
c r
w'
ASSUMED AIM LINE
THRESHOLD
LONGITUDINAL ACCELERATION
30.2 59:00.2 30.2 00:00.2 30.2 01:00.2 TIME, min: sec
Figure 7.- Manual approach in fixed depression mode with inertial attitude showing residual perturbations.

importance: a vertical gyro can perhaps be used if the approach is set up carefully but this may not always be practicable and an inertial source appears to be an inevitable requirement in future air- craft. The symbol has the capability of showing the effect of a longitudinal wind component and can contribute materially to an understanding of the environment. But some workload is imposed by the task of assimilating first-order information, at least when operating in a mode where vertical displacement is not controlled directly. Experience indicates a need to remind users of the practical consequence of the Earth's curvature in depressing the visible horizon. A bonus for the symbol is its use for monitoring an automatic approach.
Evaluation of Flight-Path Symbol
Source errors- Zero and gain errors in the angle-of-attack system were removed, as far as possi- ble, by calibration. No automatic correction was made for the effect of flaps.
Wind error- A symbol responding to an angle-of-attack signal shows the flight path relative to the airmass and is in error when interpreted as a direction relative to the ground. As mentioned above, the angular error is wy/( V-w) and? if the symbol is held on aim, the effect is to bend the approach path into a continuous curve (ref. 26). This is to be contrasted with the effect of an (atti- tude) error in the fixed depression symbol, which leads to a straight path at the wrong angle. If the inertial flight path is held on aim as in an automatic approach, the uncorrected symbol is displaced.
There was no systematic investigation of wind error in the test program because of the pre- ponderant effect of other errors but recordings made in automatic approaches did show wind effects.
Signal processing- During initial flight tests, the angle-of-attack signal was derived from a single fuselage probe. As expected from previous work (ref. 41, the flight-path symbol was too active without filtering. With simple filtering, the symbol was satisfactory for the purpose of reflect- ing autopilot activity but was barely acceptable for manual control. So a complementary filter was used with an input of pitch attitude to make the symbol more responsive when adequately filtered. In the ensuing tests, covering a period of 13 flights, various combinations of filter constants were tried but only one successful approach was flown, as will be described.
Later. after checking calibration and removing a zero error. provision was made for averaging the outputs of left and right fuselage probes to minimize local flow effects. Filter constants were finally set at 0.25 Hz and 24 dB per octave. and an elevator input was added as an option. The symbol was somewhat steadier as a result and handling was improved. with occasional use of the ele- vator input.
As a check on accuracy. tests were carried out i n cruising flight by bringing the flight-path symbol into coincidence with a refcrencc provided by the fixed symbol at zero depression. The slope of the flight path actually achieved was found from the change i n altitude i n a known period of time at known speed. This was compared with the path angle which should rcsult from aligning with a horizontal reference a symbol driven by the angle of attack for the known wcigllt. height. and speed of the aircraft, after correcting for the (zero) flap deflection of thc cruise mode. The comparison showed an error varying in the range 0.1" t o 0.6". which was considered acceptable i n view of the known gyro error affecting thc fixed symbol.
I8

Path controZ- Approaches flown with the flight-path symbol were generally unsuccessful in the first part of the flight-test program, whether with averaged or single probe signals, and it was necessary for pilots to smooth out residual activity of the symbol. In the one good approach noted above, the mean absolute path error was 13.3 ft, which was much better than with the fixed depres- sion symbol and showed how rate information could be used to straighten the profile if residual activity could be adequately handled. Besides this, there were only two cases yielding useful infor- mation. In one case, Flight 846 (7), the flight path symbol was flown to the fixed depression symbol and thus led to a profile displaced longitudinally by wind (fig. 8), the amount of displace- ment being in agreement with calculation. In the other, Flight 846 ( 1 l), it was flown directly to the ground aim point instead of being placed beyond aim to compensate for headwind and thus led to the curved path of figure 9. The angle of the flight path was usually wrong in these approaches because the symbol was used by itself, and thus gave no indication whether the aircraft was high or low, or because of improper procedure or zero error.
In the next part of the flight program, further attention was paid to the signal driving the flight- path symbol. The sign of the pitch attitude input to the complementary filter was reversed and pitch attitude gain was reduced. The symbol was then used without elevator input and with a filter frequency of 0.1 Hz for a successful series of approaches. The approaches were made to Runway 30 at Long Beach, California, by test pilots S1 and S2. A nonstandard flap setting was used by pilots for procedural reasons and this was calculated to cause a calibration error of 0.2". The operational procedure was to set up the approach on the glide slope under automatic control while using the Y-shift to correct calibration error, then to disengage the autopilot and complete the approach by flying the flight-path symbol to a ground aim point at the glide slope origin. These approaches were made over comparatively flat terrain and profiles were plotted without correcting radio alti- tude for ground contour.
All profiles were found to be free of long-period perturbatons and to show an improved level of performance. Information relating to the approaches is given in table 4. Columns 2-4 show the pilot, use of pitch attitude quickening, and height range - the latter being from autopilot discon- nect to flare except for Flight 9 14 (1) where a procedural difficulty limited the usable range. In column 5 the mean absolute deviation from an aim line identified as the glide slope is given for the height range. Column 6 shows the slope of the profile after correcting for wind and this yields the angular path error with respect to the nominal glide slope for the airfield (column 7). The next three columns give the setting error used by the pilot to correct flap calibration error, wind error, and calculated flap error, respectively, a positive error meaning that the symbol was too high. In calculating wind error it was assumed that the longitudinal wind component was constant through- out the height range and this was justified in each case by showing that either an inversion lay above the range or wind shear was less than one knot per thousand feet. Column 11 shows the total symbol error which would be zero in the ideal case of no wind and a setting error exactly cancelling flap error. The last line of the table has entries for the slope and stability of an automatic approach (to Palmdale) in the same test vehicle.
It is clear from the data in table 4 that all approaches were very satisfactory. In all cases except one, tracking was better than under automatic control and the error in slope was usually less than for the autopilot. There was little difference in performance when pitch attitude quickening was switched out, by S1, who reported that the symbol behaved similarly in either regime. This pilot also found the symbol a little too sensitive above 500 ft and in turbulence, and he noted that it should not be held exactly on aim during the first part of the final approach to avoid a large ground
19

2500 r 1500 -
5 a 1000 -
500 +
FLIGHT 846 (7) PROFILE
s4
MANUAL V/V TO yK
PMD 25 WIND 280136
SPD 240.5 FIS
0 I I I I I 07:OO 30 08: 00 30 09: 00 30 10: 00
TIME, min: sec
:
Figure 8.- Manual approach showing path displacement due to incorrect use of symbols.

2500 r FLIGHT 846 (11) PROFILE
: p
li
s4 MANUAL MIXED PMD 25 WIND 280/25 SPD 235.7 FIS
c c
u-
5 a
1000 -
500 I I I 30 54: 00 30 55: 00
TIME, rnin: sec
Figure 9.- Manual approach showing path curvature due to incorrect use of symbols.
TABLE 4.- MANUAL APPROACH PERFORMANCE IN FLIGHT-PATH (DIRECTION) MODE
Flight (approach ""
912(1)
914(2) 917(1)
914(I)
j 796(11)
Pilot
s1 s 2 s 2 s1
Auto
Quickening
In Pn In
o u t "_
range, ft
670-65 500-50
1475-1 0 5 1430-50 1568-51
Mean deviation,
ft
10.5 16.2 11.0 10.3 1 1.9
True slope
2.80" 2.81 " 2.87" 2.75" 2.79"
Path error
+0.05" +0.06" +0.12"
+O .09 " 0
Setting error
0 -0.13" -0.13" +0.03"
"_
Wind error
+0.16" - 0.02" - 0.02" -0.03"
"_
Note: Path errors are with respect to a nominal 2.75' glide slope at Long Beach, California, except in the last 1 case, where errors are with respect to a nominal 2.70" glide slope at Palmdale, California.
1 intercept (longitudinal dispersion) later. Both S1 and S2 reported finding the symbol too high by an amount varying between 0.6" and 1.6" at one or two min after lowering flaps, this error disappear- ing of its own accord, however, by about 1500 ft. Symbol error was always sufficiently small to be without significant effect on the path flown, for it can be shown in the worst case of an error of about 0.3" and with a pilot error of 0.1" in setting the symbol on aim that the impact point is altered by only about 20 ft (ref. 26): also, the profiles showed no path curvature.
The profile for the first approach of Flight 9 17 is shown in figure 10. This was flown by S1 without symbol quickening and performance was obviously very satisfactory, the angular path error
21
13 13
FLIGHT 917 (1)
2000 1
1500
LC 4-
u- a 2 1000 5 - 6
5011
0 15:
DISCONNECT
SI MANUAL V/V UNQUICKENED
LGB 30 WIND 190/05 SPD 246.4 F/S (1430 f t - 50 ft) FL 35"
I AUTOMATIC
. . . . . .
MANUAL
INVERSION T
APPARENT I I
AIM LINE I !
I I I I I : 00 30 25: 00 30 26: 00 30 27:OO
TIME, min: sec
Figure 10.- Manual approach in flight-path mode in good conditions.
* . L

being zero and the mean deviation less than for the autopilot when referred to an apparent aim line passing through glide slope crossovers (circles) in figure 10. Operating conditions were good, however, the longitudinal wind causing an error of only -0.03", so that little correcting action was necessary. Moreover, an inversion at 1250 ft, shown by air temperature recordings, could be assumed to have had the effect of isolating the lower air and securing uniform conditions within the height range.
Sumnzary- Under simple wind conditions and when properly mechanized, the flight-path symbol, by giving direction, evidently provides the rate information needed in controlling displace- ment from an ideal path. This is shown by an absence of the long-period perturbations of approaches with the fixed depression symbol and by path holding with autopilot accuracy, or better. This result was obtained without workload-related complaints and with the flight path treated as a vertical vector. The mechanization needs to include averaging and filtering of angle-of- attack inputs and complementary filtering may be used, although some pilots may prefer a symbol with more lag. The approach needs to be set up by independent means and, if this is done, the slope of the profile is accurate within autopilot limits. Small wind components can be handled without difficulty although stronger components cause the path to be bent if the symbol is held on aim. A correction is needed for flap angle but this needs to be calibrated with the flight path established independently to, say, 0.25", and symbol behavior needs to be treated with some care during change of flap setting. Subject to these provisos, it aFpears possible to reduce symbol error to an acceptable level.
Combined Use of Fixed Depression and Flight-Path Symbols
Gmeral- It had been intended, of course, t o use symbols in conjunction, each supplying infor- mation missing in the other; for example, by initiating the approach when the fixed depression symbol reached coincidence with the ground aim point and then holding the flight-path symbol on aim; or. more precisely, by using the fixed symbol to show incidental path displacements needing to be reduced by suitable positioning of the flight-path symbol. This was not generally possible, how- ever, because of inaccuracy in the fixed symbol due to gyro error and little experience was gained in the combined use of symbols for nianual control. It was nevertheless possible to draw certain gen- eral conclusions from the monitoring of automatic approaches with HUD I1 and from the use of individual symbols for manual control.
In regard to conformity, no difficulty was expected because each symbol was to be interpreted in the framework of the external world and this was done easily, as shown by estimating symbol errors as runway intercepts and by the general practice of referring symbols to the ground aim point. There was thus some degree of concurrent observation of superimposed fields when symbols were used for monitoring and a more critical degree when individual symbols were used for manual control. No disorientation was reported and this also may be attributed to conformity. The sim- plicity of the display fonnat in which guidance information was limited to a basic minimum may explain an absence of complaints about cluttering the forward view. Nor was there any report of failure to distinguish between the two symbols which were thus sufficiently different in form. Little difficulty was experienced i n learning to use the display, the main task being to understand the dynamic characteristics of symbols which took longer than with the HUD I format.

In regard to symbol interference, some difficulty was expected because of symbol overlap (about 50 percent by length) but an absence of complaints indicated that this effect might be just acceptable. No interference with peripheral elements was reported and symbols did not seem to have left the display field very often, both results being presumably due to the small range of pitch attitude used in well-controlled approaches (fig. 6 shows an exceptional case) and, more certainly, because the display was not used for takeoff or go-around. Excessive visual fixation was not reported, although S2 noted the difficulty of looking elsewhere when occupied with the full-time job of managing first-order information. The drift angle caused some uncertainty in estimating the ground position of symbols in a crosswind because of their limited lateral extent (length).
Effect of longitudinal wind2 - Although very few approaches were made with a longitudinal wind component of any magnitude, it was nevertheless clear that alternative methods can be devel- oped for dealing with this situation. The flight-path symbol may simply be held on aim without learning a great deal about the strength of the component and with a tendency for the path to become curved, or it may be put in a position resulting in a constant offset of the fixed depression symbol, so that wind strength may be estimated from the position of the flight-path symbol (by an approximately linear law) and a straight path thereby achieved. It is also arguable whether or not the flight-path symbol should be corrected automatically for a known wind; at least some pilots prefer to make their own correction.
Flare- The flare maneuver was executed by S2 on a limited number of occasions by flying the path symbol to the depression symbol as it moved upward to its final position (-0.8') in a sequence initiated at a selected decision height of 50 ft. Insufficient experience was gained to evaluate the procedure, for while upward movement of the fixed depression symbol was evident, the flight-path symbol was not always used deliberately to follow it because of the normal tendency to flare unaided in visual conditions.
The use of flashing symbols as an advisory was not altogether satisfactory, being considered rather too conspicuous by pilots.
Delta gamma mode- A combined drive for a single symbol was used on a few occasions with fixed depression and flight-path inputs mixed equally. Most of the approaches in this mode were under automatic control with the display used to observe error effects. One manual approach was made but it was difficult t o achieve a well-controlled path at heights greater than 700 ft because of the influence of errors. It was not possible to differentiate between contributory errors but the main effect was believed to be due to gyro error.
Sunzmary- It is possible to use fixed depression and flight-path symbols in conjunction for monitoring: manual control may also be possible but this has not been established. Provisional entries of a favorable nature, as in table 5, may be made for the HUD evaluation properties of con- formity, concurrent observation, disorientation resistance, simplicity, learning, and fixation resis- tance, together with the monitoring capability, based on very limited use. Less favorable entries are made for interference, resistance to disturbances, applicability, and drift correction. The property of situation visibility is added to describe a capability for showing the situation in which the aircraft is found. Alternative methods for dealing with a longitudinal wind are available for exploration.
Work on the effect of vertical wind on a flight-path symbol driven by angle of attack is reported in a paper by J. R. Lowe (ref. 27).
24

TABLE 5.- HUD I1 FORMAT PROPERTIES FROM FLIGHT TESTS
Conformity
Concurrent observation
Disorientation resistance
Simplicity
Tracking accuracy
Ease of learning
Interference resistance
Fixation resistance
Error resistance
Applicability
Drift capability
Situation visibility
Monitoring capability
Complete.
Limited evidence for.
No disorientation reported.
Uncluttered forward view, symbols distinguishable.
Equivalent to autopilot.
Flight-path symbol used easily to give rate damping, fixed depression symbol more difficult to use in reducing displacement. More time needed than in learning HUD Horizon dip needs to be understood.
Some symbol overlap. No peripheral interference in limited pitch maneuvers.
No major fixation effects reported.
Poor with existing data sources, compound errors possible.
Evaluated only in final approach, and flare (as an unreferenced display).
Limited by lateral extent of symbols.
Fixed depression symbol shows situation to be corrected and direct effect of wind, flight-path symbol shows action taken.
Possible mainly with fixed depression symbol. .~
The flare maneuver is feasible with HUD I1 but guidance may not be necessary for rotation in visual conditions: perhaps all that is needed is an indication of when to start the maneuver. The delta gamma mode is also feasible with the display but there is a double need for protection against errors.
Simulation for Windshear Experiments
Experirne/7tal a i m - It has been shown that symbols of the HUD I1 format can be used indi- vidually for vertical path control. That they should be used in conjunction follows from their com- plementary nature, one showing the path error to be corrected, the other showing the corrective action taken. It may be argued, however, that path errors are unlikely to arise when the driving signals are of good quality, and this is probably true, except for the effect of head or tail wind. The fixed depression symbol may then be used to show directly that a displacement is caused by the wind while the flight-path symbol shows the strength of the wind by its position for constant path error. It follows that the combined use of symbols should be particularly useful in the presence of an unknown wind or when the wind is variable. Similar reasons may be used to support the use of a single symbol incorporating the two kinds of information.
Work is described in the following section which was undertaken to investigate HUD I1 approach capabilities in windshear using simulation techniques to avoid the crippling effect of errors experienced in real flight. It was thus possible to obtain extcnded experience of the two symbols in

conjunction, and of a single symbol driven by combined signals. Another reason for using simula- tion was to provide a repertoire of wind conditions which would only be encountered by chance in real flight. It was also intended to attempt improvement of the HUD field of view because large changes in wind were expected to displace symbols appreciably.
The work to be described consists in two experiments. In the first, alternate display configura- tions are examined in a limited variety of wind conditions to find a suitable arrangement of symbols and to examine a control law for a single symbol. In the second, a selected display is used, in a range of winds and in various operatjng conditions, to find when HUD becomes effective in showing environmental changes which might not otherwise be perceived. +
Installation- The installation was made in a cab resembling the cockpit of the test vehicle. An improved field of view was obtained by a method used previously in DC-9 flight tests (ref. I3), in which an integral collimator and reflector unit was mounted in the glare shield in a position chosen to clear the control column and basic flight instruments. This (skew) mounting is known to be satisfactory, except for the possibility of sunlight entering the collimator, which was obviously of no concern in the simulator. The instantaneous monocular field was 11.65", or more than 50 per- cent better than in the preceding flight tests, and the optical axis was inclined downwards by 20" for alignment with the runway touchdown zone. The face clearance was 12 in.
Electrical- The test vehicle was simulated by means of a hybrid computer (Xerox Sigma 5 and Comcor C1-5000). The display electrical equipment was the same as in the aircraft, except for minor changes in cabling and the provision of unblanking signals to replace aircraft validitiy signals, and altitude trips.
Symbol drives- Figure 1 1 shows the method of generating drives for the symbols, which was an extension of an arrangement used in the flight tests. Complementary filtering was again used to construct the flight-path driving signal from fuselage angle of attack (uf> and pitch attitude (0) inputs with the same filter frequency of 0.1 Hz (or a time constant of 1.6 sec), while the fixed depression symbol was again driven by a reference signal stabilized by pitch attitude. An additional capability was provided for generating a compensated drive for a single symbol according to a method due to J . R. Lowe (ref. 27). This consisted in providing a correction to the fixed depression symbol such that when the compensated symbol was held on the runway aim point, displacement was reduced in an optimum manner. The correction was derived from a flight path based on height rate, and it was modified as a function of height. This method was designed to combine displace- ment and rate information in a fashion determined by visual feedback (by means of aim point align- ment) and was intended to avoid dependence on angle of attack as a source of information. The compensated driving signal was developed initially by analytical techniques, using a model of the human pilot, with later modifications as a result of simulator tests. Changes included reduction of the pitch attitude gain to less than unity and increasing lead by adding a normal acceleration term. Besides this compensated symbol drive, signals were provided to drive the flight-path symbol according to the ratio of vertical and forward speeds, either with or without filtering and with or without wind correction.
Visual flight simulation- The forward view in an approach was simulated by the standard technique of moving a television camera over an airport model in response to aircraft attitude and position signals; the resulting picture was seen by the pilot, in color and with day or night lighting, on a monitor viewed through a large collimating lens. The lens was mounted in the space normally

K, S + 1
YK -FIXED
DEPRESSION
$L COM- PENSATED
Figure 1 1 .- Generation of driving signals for HUD 11.
occupied by the windshield, allowing the display and forward view to be seen in the same direction. It was adjusted for zero parallax, using a properly collimated display image as reference, so that dis- play and forward view were seen at equal distances. Vertical features such as high-rise buildings were removed from the airport model t o ensure that experimental results would be applicable to approaches over featureless terrain.
Precautions were taken to secure reasonable accuracy in the scaling of visual fields, especially regarding pitch attitude. Depression of the runway aim point (glide slope origin) was measured by theodolite and found correct within 0.5 percent, after allowing for the height of the television
given changes in aircraft pitch attitude and found accurate within 0.4 percent. A check was then made for zero motion of the fixed depression symbol with respect to a ground object during changes in pitch attitude. This condition could only be met with an accuracy of 3 percent, which was less than desirable but somewhat inevitable with the distortion introduced by the large colli- mating lens. Checks were also run on the positions of flight path and compensated symbols. Finally, motion characteristics of the symbols were checked during automatic approaches in wind, and path errors were measured for comparison with standard values.
/ camera above the visible horizon. Displacement of the visual scene was measured by theodolite for

Experiment 1. Effect of Display Format on Use of HUD in Wind Shear (Suitability of Symbols and Control Law)
Displays- Table 6 shows the symbol formats used in the first experiment, and the signals driv- ing the flight-path symbol when present in the display. In the first configuration, D 1 , no display was presented, the approach being flown by inspection of the external scene. In D2, only the flight-path symbol was used and this was driven by a complementary filtered angle of attack. The fixed depres- sion symbol was added in displays D3-D7, inclusive, while varying drives to the flight-path symbol. These included the ratio of vertical speed to indicated airspeed in D4, and the ratio of vertical speed to ground speed in D5, while the same signals were processed by complementary filtering in B6 and D7, respectively. In D8, a single symbol was driven by the compensated control law, and D9 was the HUD I format with command signals generated by a production flight director computer.
i
TABLE 6.- DISPLAY CONFIGURATIONS IN EXPERIMENT 1 r- ".
)isplay
Dl D2
-
D6 D7 D8 D9 "
Symbol format I
No display Flight path
Fixed depression and
Flight path
Single compensated symbol HUD I
Flight path drives
None Complementary filtered alpha Complementary filtered alpha VSlIAS
Filtered VS/IAS Filtered VSlGS Incorporated in control law None (flight director computation)
VSlGS
..
Winds- Figure 12 shows the winds used in the experiment in ascending order of difficulty from left to right. The simplest wind, W 1, was a constant headwind of 35 knots. In W2, a headwind of 35 knots was reduced steadily at heights below 300 f t to a surface tailwind of 10 knots. In the most complex wind, W3, a rapidly varying downward wind component reached a maximum value of 17 knots at 265 ft, subsequently decreasing to zero at the surface,while the horizontal component decreased from a headwind of about 35 knots at 365 f t to a surface headwind of 5 knots. These components were similar to those found at Kennedy Interational Airport at the time of the acci- dent to Eastern Airlines Flight 66 on June 24, 1975. The three experimental winds were used with- out turbulence. I
Mefhod- Manual approaches in daylight conditions were flown by one subject, S1, for each wind, which was unknown to him, and each display, in random order. Approaches were started on the glide slope at a height of 750 ft and continued to touchdown, with lateral and vertical control. and with automatic throttle control. Mean absolute deviation was computed with respect to the intended (3") approach path for each run and subjective ratings were given by the pilot for the displays using an 8-point scale ( 1 = cxcellcnt, 8 = bad).
Results- Mean absolute path errors for displays and winds are given in table 7 with results of an analysis of variance in table 8 and differences between display means in table 9. The analysis showed significant differences for displays 0) = 0.05 and almost 0.01) and for winds ( p = 0.001).
28

800 - w1
700 -
600 -
500 -
r I" I 400 - Iz w I
300 -
200 1-
l o o /
. - - -. HORIZONTAL COMPONENT
."_."_. VERTICAL COMPONENT
l-
v2
i i i i i i i i
0 I I I I I 1 1 1 1 40 30 20 10 0 10 20 30 40
TAILWIND HEADWIND DOWNDRAFT knots UPDRAFT
" ~~~ ~~
nll"lJ
40 30 20 10 0 10 20 30 40 TAlLJVlND HEADWIND
DOWNDRAFT UPDRAFT
I
!
!
! I I ! I I ! I I
I ! I !
I I
I I
I I i
I I
/. /
{''
\ \ \ \
'. 'I
! I
i w 3 1
/I /'
/ i
I .
!
40 30 20 10 0 8 10 20 30 40 TAILWIND HEADWIND
DOWNDRAFT knots UPDRAFT
I I I I I I I I
Figure 12.- Winds for experiment 1.

TABLE 7.- PATH STABILITY IN EXPERIMENT 1
(Mean absolute path error in feet for displays and winds in day approaches with automatic throttles in calm air from known position for Pilot SI)
D3
12.91 D9 14.42 D8 16.63 D7 24.58 D6 12.23 D5 14.08 D4 19.01
Mean 20.86 "
Wind
w2
13.73 40.42 15.93 14.16 18.16 20.77 14.69 14.97 16.86 18.85
-
w 3
36.93 64.85 33.73 35.59 39.70 3 1.84 43.52 42.64 64.97 43.75
Mean
27.84 48.77 22.89 21.28 23.36 25.73 24.95 24.0 1 31.58
TABLE 8.- ANALYSIS OF VARIANCE FOR PATH ERRORS IN EXPERIMENT 1
Displays Winds Remainder
Total
ss . . " .~
1701.4876 3443.7870 940.7967
6086.07 13 " .
"
df
8 2
16 26 -
MS -
.
21 2.6859 1721.8935
58.7998
"
F
3.62 29.28
P
0.05 .oo 1
"-
TABLE 9.- DIFFERENCES OF DISPLAY MEANS IN EXPERIMENT I
_ _
D4 21.28 D3 22.89 D5 23.36 D8 24.01 D7 24.95 D6 25.73 Dl 27.84 D9 31.58 D2 48.77
~
D4
"- "_ "- "- "_ "_ "- _" "-
D5
2.08 0.47 " - "- "_ "-
D8
2.73 1.12 0.65 "
"_ " -
" I --- _ _ _ j _ _ _ "- "_
D7
3.67 2.06 1.59 0.94
"- "_ "- "_ "_
D6
4.45 2.84 2.37 1.72 0.78
"- "_ _" "-
Dl
6.56 4.95 4.48 3.83 2.89 2.1 1
"_ "_ "_
D9
10.30 8.69 8.22 7.57 6.63 5.85 3.74
"_ "_
D2
27.49' 25.88' 25.41' 24.76' 23 .82a 23 .04' 20.9 3' 17.19
"-
'Exceeding a least significant difference at the 1 percent level of 18.3.
30

,
I Examination of the means showed little difference between most of the displays, incll.tding the case j ’j P
where no display was shown, D l . The implication was that no display wzs necessary in the experi- mental conditions and this was confirmed by subsidiary tests in which even W 3 was survived when autothrottles were in use. i A significant difference in display means was only found for the case of the flight-path symbol
b ! used by itself, D2, and this was negative. Although the symbol could be used very well by itself in 4 the calm conditions of the real flight tests, it was less than an asset in the experimental wind condi- c tions. This result is consistent with the absence of displacement information in D2 and with the ten-
dency for an angle of attack device to weathercock into wind so that a downdraft would cause the symbol to show a rising flight path and thus mislead the user. f ’
The very significant wind differences were not unexpected in view of the severity of W3. I t was nevertheless surprising to find little difference between means for W 1 and W 2 since the path holding task was different in the two cases. It is possible, however, that the pilot learned the winds suffi- ciently well to obliterate differences in tracking performance; each wind being flown nine times.
,’ ’ 3 This possibility could be avoided by enlarging the repertoire of available winds.
Subjective ratings and user comments were a little more useful in distinguishing between dis- plays. A poor rating of 7.0 was given for the D2 configuration and the flight-path symbol was found to be too sensitive. Ratings for D3-D7 were all in the range 4.8 to 5.3, indicating some difficulty in dealing with the two symbols of these displays, and showing no marked preference for any symbol drive. The symbols were nevertheless considered good in conjunction, the flight path being used as “extra” information. It was noted that the wind could be read with this type of display but the user had to contend with some interference between symbols (of somewhat similar shape). The compensated single symbol display, D8, required no interpretation and was highly rated at 2.7, being preferred t o all except the director display, D9, which had the best rating of 2.2.
A general comment was that HUD showed shear rapidly but it was noted that symbols left the field of view in severe conditions (W3), except with D9. In the latter case, however, the guidance was not optimal. An incidental comment was that it occasionally appeared advisable to avoid hold- ing a symbol on aim because the external scene sometimes showed other action to be preferable.
ColzcZusions- HUD gave no clear advantage in path stability when used in daylight conditions,
out turbulence, although users (in this and supporting tests) felt confident that the system had the
severe, and more varied, conditions. The compensated symbol appeared to be best suited to further visual approach work: it was essentially similar to the useful fixed depression symbol, it was free of the false information which could appear in a flight-path symbol driven by angle of attack, it was free of interference and easy of interpretation. On the other hand, this symbol did not provide the capability for assessing wind conditions, which was a feature of the two-symbol formats, and the field of view might be exceeded in severe conditions. The HUD I1 format and the forward view could together be observed critically, since discordant situations were detected. The pitch attitude control loop could evidently be closed simply by reference to the external world, this information being absent from the display.
1 , from a known starting position, with autothrottles, in a limited selection of wind shears, and with-
d capability for dealing with shear. It seemed that a significant effect might only be shown in more
,
31

Experiment 2. Effect of Operating Conditions on Use of HUD in Wind Shear (Conditions Critical to Usefulness of Display)
Operating conditions- An extended range of conditions was obtained by variations in the method of throttle control, in winds, turbulence, and in starting position, as shown in the schedule of table 10. For greater severity, approaches were flown under night lighting conditions (N). The display consisted in the single compensated symbol (D8),3 or no display at all (Dl). Throttle con- trol was automatic (A), or manual (M). Winds were chosen from an enlarged repertoire (W3 1 -W38), and these were used with or without turbulence (T). W 3 was also used for two runs. The starting position was chosen to be at a height of 700 f t on a 3" beam, or with a vertical offset of S O ft.
Winds- The experimental winds, W3 1 -W38, are shown in figure 13. They were designed to be similar in type to the Kennedy wind (W3), but less severe, and to be broadly equivalent to each other. Their common feature was a 200-ft belt in which headwind decreased, at 8 knots per hun- dred feet, and downdraft increased, at 4 knots per hundred feet. The difference between winds was in the magnitude of each component and in the height at which the double shear belt was encoun- tered. Numerical values were determined by a subsidiary experiment, with the object of giving a task of sufficient difficulty but without causing the HUD field of view to be exceeded.
TABLE 10.- SCHEDULE FOR EXPERIMENT 2 ~
Run ~
1 2 3 4 5 6 7 8 9
10 11 12 13 14 15 16 17 18
~
"
Lighting
N N N N N N N N N N N N N N N N N N
Display
Dl D8 Dl D8 Dl D8 Dl Dl D8 Dl D8 D8 D8 Dl D8 Dl D8 Dl
Throttle
A A A M A A M A A M A M M M A M M A
Wind, turbulence
W3 1 W32 + T w33 W34 + T w35 + T W35 + T W34 + T w3 w33 W36 W3 1 w37 W38 + T W38 + T w3 w37 W36 W32 + T
Start. ft
700 650 750 700 700 700 7 00 700 750 750 700 700 650 650 700 700 7 50 650
-
3This experiment was not intended as a full evaluation of the compensated symbol drive, with a thorough investigation of gains and time constants.
32

800 -
700 -
600 -.
500 -
.z i $, 400;
300 -
200 -
.-.-. HORIZONTAL COMPONENT
."_._". VERTICAL COMPONENT - -
33 32 31 31-33
WIND COMPONENTS, knots (HEADWIND & UPDRAFT POSITIVE)
w w Figure 13.- Winds for experiment 2.

Method- Approaches were flown with lateral and vertical control by S1 according to the schedult of table 10. This ensured that each combination of throttle control, wind, turbulence, and initial offset was used with and without HUD in random order. Conditions were announced before each run except that starting position was not given and the wind was not defined. The ILS and alti- tude indicators in the head-down instrument panel were deliberately failed, so that path errors could only be learned from HUD or forward view. A speed error component was included in the D8 format for throttle management. These arrangements were designed to secure a wide range in the degree of help required of HUD. Mean absolute error with respect to a 3" path was computed for each approach.
<
Results- No statistical analysis was attempted with the limited experimental data but table 11 gives an indication of the effect of HUD on path stability in each combination of conditions with results listed separately for W3. The effect was to reduce path errors, except in the one case of auto- throttles, turbulence, and starting on the beam in which a small increase occurred (column 3). The mean reduction in path error, Dl -D8, was 34 ft. In experiment 1, however, there was no signifi- cant difference for runs with and without the display, the Dl-D8 difference being less than 4 f t (table 9). The present increase in effectiveness of the display, if not attributable to chance, is con- sidered due to having to make the approaches in night lighting conditions and in winds which could less easily be learned.
TABLE 11 .- PATH STABILITY IN EXPERIMENT 2
(Mean absolute path error in feet for night approaches with combinations of throttle, turbulence, offset, and display in equivalent winds for Pilot S I )
HUD (DI) ' HUD (D8) Difference Mean difference
aCrashed.
Automatic throttles ~~- ~ . 7 - ---
Calm air Turbulence "
" t
135 28 39 82
107 -2 1 1 34 I
- ___"_~__ Manual throttles
_ _ _ _ - -
4 r 1 8 4 17 38 37 4 47
Turbulence ~- - . . . ____ On beam Offset On beam Offset - . ~ -
~ .. .. ~ . " . " -
The most pronounced effect was in the case of W3, which was not survived without HUD even though the approach was started on the beam and autothrottles were used. By contrast, similar con- ditions were survived in experiment 1 (table 7, D l ) , and the difference is attributed to meeting W 3 unexpectedly and at night. (The pilot offered the comment that winds could not be learned in experiment 2.) Discrimination between the effects due to each experimental variable is scarcely justified by the limited data available but it appears that turbulence may have been a relatively strong factor, increasing the path error from 36 f t to 60 ft , on average.
Co/zclusiv/zs- An advantage in path stability was indicated for HUD with a single compensated symbol when used in wind shear in night conditions with several combinations of throttle control,
34

turbulence. and initial offset. The advantage appears t o have been greater in a more severe shear and in turbulence. The unexpectedness of a wind condition may be an important factor in surviving it. The pitch attitude loop could still be closed by reference to the reduced information available in the external scene by night, which suggests the following schematic.
Schematic for Pilot Using HUD I1
Figure 14 represents the vertical control task when using HUD 11 in the visual approach, as in experiments 1 and 2. The pilot draws information from the forward view and from HUD, the latter being supplied by flight path and speed error computers. In outer loop control, the position of the fixed depression symbol ( y ~ ) in relation to the touchdown zone (TDZ) is referred to the overall operational requirement for zero displacement (height error). In the next inner loop, the position of the flight-path symbol (y) in relation to the touchdown zone is so adjusted that, when wind error is allowed for, the height error is reduced at a suitable rate. The innermost, pitch attitude, control loop is closed by reference to the forward view alone but this, of course, would not be true for all forms of HUD.
REQUIREMENTS
LIGHT PATH
Figure 14.- Schematic for pilot using HUD 11.
35

COMPARISON OF HUD FORMATS (I AND 11)
Display Properties
General- It is now possible to attempt an overall comparison of the HUD formats. This is done by collecting the material of tables 1 and 5 together with results of experiments 1 and 2, and evaluating the symbol formats for each of the display properties. The results are shown in table 12 and the grounds for individual assessments are given below. The letter S or P is used in the table to show when a property is realized to a satisfactory or partial extent, respectively. An interrogation mark indicates a need for further investigation and no symbol is used in the absence of a property.
Transition- The time to make a transition from HUD I1 to the forward view is not known. The time for HUD I is small. (In measuring this time, account is taken of the continuity of tasks associated with the superimposed fields in which the information is changing continuously.)
Conformity- The HUD I format is the less conformal of the two because its guidance symbol is not necessarily in registration with the real world although it moves in an external axis system. As explained previously, this lack of conformity could be removed by referencing the flight director to the ground aim point but this capability remains to be demonstrated.
Concurrent observation- The ability to observe critically and concurrently in each of the superimposed fields has only been established for the HUD I format and further observations are needed for HUD 11. Because of the high degree of conformity in the latter format, satisfactory or even better results are expected with it but practical investigation will be difficult in commercial aircraft in view of the risk factor implicit in the more effective experimental methods. Less effec- tive methods include those based on the pilot's interpretation of the forward view, which is not a clearly defined process (refs. 2 1-24).
TABLE 12.- COMPARISON OF DISPLAY FORMATS (HUD I AND 11)
[" - - 1 .
"
HUD j IlUD i I I 1 j I 11
i Transition s ? I Fixation resistance s '? I Confi)rmity P" S 1 Error resistance I
S P , Concurrent observation S ? , Applicability P P I Disorientation resistance S ? Drift capability ? ? ' ~i rnp~ ic i ty S P 1 Wind shear capability ? ? ' Tracking accuracy S ? S~tuation visibility P S l Frise 0 1 learning S P ~ Monitoring capability P P ~ Interference resistance P - 1 Maintenance s <?
1
L-
Legend: S P~-operty pl-esent 10 satisfactory extent P Property present t u partial extent '! Further investigation needed -. Property absent * Refers to motion conformity, see text.

i i in reducing any tendency to disorientation on breakout. At the present time, only the HUD I p Disorientation resistance- The high degree of conformity of HUD I1 may also prove effective
format has definitely been shown effective in this respect. Clearly, an important factor affecting this property in HUD I1 will be residual motions of symbols with respect to the ground, which may arise through inadequate stabilization.
Simplicity- HUD I is a simple format because only one symbol is needed for guidance, i ' l whereas two are used in HUD 11, although it is still reasonably simple. i;
i: : or better than, that of an autopilot. But while this was achieved with HUD I in a variety of condi- i" Trucking accuracy- Both formats have been shown to mediate tracking performance equal to, . .
tions, it was only achieved with HUD 11 in favorable conditions. To some extent, this may have been due to lacking the benefit of the higher-order control terms which are readily incorporated in a flight director display.
Ease of learning- The HUD I format was learned almost immediately, but several approaches were required with HUD I1 before proficiency was achieved. The time needed to understand the complementary nature and dynamic characteristics of the fixed depression and flight-path symbols is a price which has to be paid for the information about the environment which they yield in separable form. It may be noted, however, that the fixed depression symbol may prove easier to learn in situations where there is a fairly direct control of vertical position as may occur in some STOL aircraft.
Interference resistunce- The HUD I format is amenable to zoning, whereby symbol crossovers are reduced to a minimum. By contrast, symbols are required to move freely through the HUD I1
1 format and interference will therefore always be likely with this type of display.
Fixation resistunce- This property has been observed at length for HUD I , and to a lesser extent for HUD 11. It may well be that further investigation will show the latter display to be also consistently free of any tendency to cause fixation on an individual symbol but it would seem to be generally more difficult t o give its symbols the capability of yielding information without being directly regarded. This is achieved in HUD I by a Gestalt effect, the position of the director index being suggested by the invisible envelope enclosing the pathway symbol (fig. 1).
Error resistance- HUD I depends on ILS guidance signals which can be protected against spurious effects and which are usually of known accuracy. The only difficulty experienced to date
, + has been on rare occasions when the beam has been distorted through parked aircraft. HUD I1 depends on signals which are difficult to protect in conventionally equipped aircraft. In addition to turning and deceleration effects, local flow, sideslip, and flap effects have been experienced. On the basis of what has been found in the commercial aircraft used in this study and previous flight tests, HUD I is the better able to resist errors. It may well be that HUD I1 will eventually achieve parity in this respect, given stabilization of inertial accuracy and error-free computation of flight path, but it would be misleading to suggest that these fzcilities are automatically available at the present time.
(The horizon anomaly is not an error of the HUD I1 format. The user should soon be aware that the position of the ordinary visible horizon, besides depending on height, varies with meteoro- logical conditions and terrain, and is therefore false, but that the display horizon is intended to
37

show a truly horizontal direction, normally invisible, from which he may estimate depression of the touchdown zone with improved accuracy.)
Applicability- The HUD I format has been validated in a large variety of flight modes but not in the aided visual approach, where it can only be used in a supporting role to show attitude, speed, and height. On the other hand, the HUD I1 format has been designed for guidance in the visual approach and is less useful in other modes of flight. The two formats are thus somewhat comple- mentary in application.
Drift capability- Each form of display needs t o be capable of providing vertical guidance in the presence of crosswind. In the case of HUD I, this can be done without aligning the guiding symbol with the ground aim point because the command information is independent of its position in the format. In the case of HUD 11, it can be done by using the lateral extension of symbols to obtain vertical alignment with the touchdown zone. The two formats are thus functionally equiva- lent but further work is needed in this area, especially as regarding the decrab maneuver and obser- vation in the external field.
Wind shear capability- Experiment 1 showed that both types of format could be used in wind shear, without significant difference in path holding performance (D9 vs D3-D7, table 9), the only observed shortcoming of HUD I being that the given guidance computation was not entirely suitable for severe shear conditions, which is not an insurmountable disadvantage. On the other hand, HUD I1 provides the capability for reading the wind, which seems t o be a considerable asset, although it may eventually be found better simply to get the pilot through the environmental con- ditions without understanding them. At present there is insufficient evidence relating to this matter or to the more general question whether to use processed information such as flight director com- mands and the effective compensated signal used in experiment 1, or unprocessed information such as conformal representations of flight path and displacement. The difference in knobledge gained has to be balanced against the difference in ease of using each form of display.
Situation visibility- It has already been noted that the conformity of HUD I1 may be a factor affecting concurrent observation of the superimposed fields, each being understood by the same rules, whereas the rules, although similar, are not exactly the same in the case of HUD I . It may also be that as components of information are separable in HUD 11, it would be possible t o resolve indi- vidual discrepancies when the display is checked against an ILS of restricted utility. These effects would devolve from the capability of the display to give what has been called situation visibility. or an overall understanding of the state of the aircraft’s progress. HUD I1 appears to be a good display in this respect. 9
Monitoring capability- If a display can be used to check the end result of a control process, as when showing if performance limits are exceeded, it may be said to have monitoring capability. Thus, the fixed depression symbol of HUD I1 can be used to monitor an automatic approach if it can be related to an approach “gate,” or “window.” It is also possible t o use HUD I in a similar way when ILS scales are added. But while the two formats may have corresponding capabilities, they differ in that the source of information used in HUD I1 is independent of the (ILS) source on which the automatic control process depends - which is obviously untrue for HUD I. In so far as moni- toring requires independence of information sources, HUD I1 is the better format, but this is only true in visual flight where the need for monitoring may not be great.
38

Ease of maintenance- The HUD I format requires little maintenance after initial calibration, while the HUD I1 format needs careful, periodic boresighting and recalibration. This result seems relevant to the overall comparison of formats and is added to table 12.
Reliability- As both formats were generated by the same display equipment, no significant difference in reliability was expected or found in operating the two alternate systems during a period of more than 1300 hours. Some trouble was experienced with the symbol drive generator for HUD I1 but this was a mocked-up unit and could not be considered typical. Failures occurred in a sine-cosine potentiometer used to resolve bank angle, and in a voltage regulator, but neither of these was specific t o HUD 11. There was a greater tendency, perhaps, to burn the cathode-ray tube when boresighting conformal symbols because this took longer than the calibration of HUD I, but this was insufficient to justify comparison of the formats for reliability and no entry is made in table 12.
Discussion
Two alternate symbol formats have been compared for properties relevant to the accurate per- formance of concurrent tasks, at low workload, mainly in real flight conditions, and in various flight modes. Neither format is uniformly superior and neither is entirely adequate. Each has to be taken with its advantages and disadvantages, while realizing that not all properties are of equal weight.
Error resistance has a dominant effect in rendering other properties worthless if a format cannot be used because of the errors prevalent in aircraft data sources. This is unfortunately true of HUD I1 except at short range and its advantages can only be secured generally if stabilization is of high quality4 and flight path can be computed without angle of attack, in a smooth yet responsive manner. A dominant quality is also associated with wind shear capability, situation visibility, and monitoring capability because when these are needed the effect is t o devalue HUD I although its capabilities can be improved by the addition of ILS scales. These properties have in common a dependence on unprocessed information with the effect of making the user responsible for his own course of action. By contrast, there is a dependence in HUD I on the principle of showing the pilot his best course of action by means of processed information. The choice between the two kinds of information is thus intimately bound up with the determination of symbol format. Finally, the property of applicability has an overriding effect because, clearly, none of the other properties can be realized in a mode to which a format is not applicabIe and this is true for each format at different times.
It is thus a matter of first importance to make determinations for dominant properties, after which it may be possible to estimate the remaining properties, which are not mutually exclusive (e.g., simplicity does not preclude ease of learning, or tracking accuracy, and it can be realized in either format). Figure 15 is a decision tree showing the effect of the main determinations. First, a decision to provide data sources of high quality makes it possible to refer, or stabilize, symbols with respect to the ground, so that conformal, as distinct from unreferenced, symbols can be used. Next, a decision to use processed information leads through the upper branches to a symbol marked by an asterisk, which represents either Lowe's compensated symbol o r a ground referenced flight director, whereas a decision to stay with unprocessed information leads to the fixed depression and
Systems are available which are claimed to provide the requisite accuracy.
39

SYMBOLS: * COMPENSATED, OR REFERENCED DIRECTOR RIW RUNWAY yK FIXED DEPRESSION FP FLIGHT PATH FD FLIGHT DIRECTOR 0 NONE
GROUND REFERENCED
SYMBOLS
YK. FP, RIW
SYMBOLS
t t ‘O T HIGH (UP) OR PROCESSED (UP) OR IFR (UP) LOW (DOWN) UNPROCESSED (DOWN) VFK (MID) OK
QUALITY DATA INFORMATION IFR & VFR (DOWN)
Figure 15.- Effect of operational decisions on symbol format.
flight-path symbols. In the lower branches, processed information corresponds with an unreferenced flight director and unprocessed information with no practical symbol. Finally, a decision t o use HUD in conditions of IFR, VFR, or both, determines the viability of surviving symbols. The ground referenced symbols function unaided in visual flight but need the addition of a runway symbol for instrument flight. On the other hand, the unreferenced flight director in present form only works in instrument flight (if VFR is taken to mean that ILS cannot be used).
The scheme of figure 15 relates only to guidance in the vertical plane and needs elaboration to deal with related problems in the lateral control plane. It nevertheless allows two general conclu- sions to be drawn. First, since no unreferenced symbol in present form survives the requirement to operate in both instrument and visual flight conditions while both types of referenced symbols do so, i t follows that high quality data sources may be an inevitable requirement for general flight con- ditions. In practice, however, this may mean restricting use of the display to operations at short range, since these sources will not be immediately available in all user aircraft. Second, it is not
40

possible to arrive at a single ideal display without a definitive position on the question of information processing, which limited operational experience has been unable to supply, which should depend on procedures to be developed for dealing with wind shear, and which should take account of the technique for controlling height (e.g., the “backside” method). This decision will, no doubt , also be influenced by monitoring requirements and approach procedure. It may even take account of the pilot’s technique in extracting information from the external world.
[ If it is eventually decided to use processed information, the symbol format may well be based on a compensated guidance symbol or a referenced flight director, with a runway symbol added for instrument flight. In this case, display properties will probably be similar to those of HUD I but
I with possible increases in clutter, learning time, susceptibility to errors, and maintenance. There ‘i may also be changes in resistance to disorientation and to fixation. On the other hand, if the deci- \ 7 sion goes in favor of unprocessed information, the advantages of HUD I1 will become available. i
CONCLUSIONS
I The following conclusions are drawn from the work which has been reported:
1 . In its original form with a symbol array based on an unreferenced flight director, the
accuracy, and ease of learning. It also provides resistance to disorientation, interference, fixation, and errors, while needing little maintenance. It is suitable for all modes of flight except the visual approach, and it depends on processed information. This display is presently called HUD I.
I Head-Up Display has properties of transition and concurrent observation, simplicity, tracking
2. Other formats for head-up presentation are based on the displacement and direction infor- mation proposed by Lane and Cumming (ref. 14). This alternate concept can be embodied simply in fixed depression and flight path symbols, which are conformal and yield capabilities for dealing with drift, wind shear, and monitoring, while providing situation visibility. The display requires data sources of unusually high quality, it is intended primarily for the visual approach, and it depends on unprocessed information. It is presently called HUD 11.
3 . The fixed depression symbol gives the basic (displacement) information for vertical path control but requires the user to supply rate information. In the absence of pilot inputs, it shows directly the effect of longitudinal wind. The approach segment in which it may be used is governed by stabilization accuracy which, in the absence of an inertial system, depends on the avoidance of deceleration and turning effects. The symbol can be used to monitor an automatic approach. When subject to steady error, the effect is to alter the angle of the approach path.
I 4. The flight-path symbol gives rate information for the accurate reduction of known path errors, in good wind conditions. It is not reliable in all circumstances when the driving signal is derived from angle of attack. It is better to use, at least in simulated flight, the ratio of vertical speed to forward speed, which may be either airspeed or ground speed. I n real flight, short-period variations need to be eliminated by some form of averaging and, if necessary, response may be improved by complementary filtering; it is also necessary to deal with transient flap-related effects. The symbol can be used to estimate longitudinal wind from its position relative to the aim point for
41

constant offset of the aircraft from the chosen approach path. The effect of an error may be to curve the flight path.
5. Fixed depression and flight-path symbols may be used in conjunction, each supplying infor- mation missing in the other. Some interference may be experienced, however. It is necessary to learn to place the flight-path symbol beyond the aim point to reduce at a suitable rate the displace- ment shown by the fixed symbol.
6. As a solution to problems of interference and symbol management, driving signals may be combined in several ways and applied to a single guidance symbol. This kind of information process- ing is used with the compensated symbol and with a flight director, whether referenced or unref- erenced. It results in some loss of conformity and situation visibility.
7. Several configurations of HUD symbols and drives can be used for vertical path control in simulated wind shear conditions but the display may not be uniquely necessary when the approach is from a known position, with autothrottles, in smooth air, and when the shear condition is not altogether unexpected. It may then be hard to assess the relative values of airspeed and ground speed drives for the flight-path symbol and the benefit of filtering, although an angle of attack drive is unsatisfactory when the symbol is shown by itself. Symbols may move out of the field of view in severe shear.
8. In simulated night conditions and unexpected shear, an advantage in path stability is indi- cated for HUD, using the compensated symbol with several combinations of throttle control, tur- bulence, and initial offset.
9. A schematic for the pilot using HUD II can be based, in the outer loops, on reducing to zero the observed departures from aim of fixed depression and flight-path symbols, by means of information drawn from external and display fields, while the inner loop is closed simply by refer- ence to the external field.
10. Comparison of HUD I and HUD I1 for properties associated with easy, accurate perfor- mance of concurrent visual tasks in a variety of real flight conditions shows neither format t o be uniformly superior or entirely adequate.
1 1 . Decisions relating to the provision of high quality data sources, the use of processed infor- mation, and the modes in which the display will be flown, have a critical effect on the choice of symbol format, being closely related to the dominant properties of error resistance, situation visi- bility, and applicability.
12. Operation of HUD, in a form capable of supporting both instrument and visual tlight modes, leads to a requirement for information sources of a quality not generally found in current aircraft.
13. Realization of an ideal display format appears unlikely unless a definitive position can be reached on the use of processed information, after taking account of the techniques to be used in wind shear, for height control, and for monitoring.
42

1 1 14. The author feels that the total balance of properties is currently in favor of HUD I but this
I! could change as a result of the major decisions affecting the format and in the light of further exper- imental investigations which are currently in hand.
i ' National Aeronautics and Space Administration Ames Research Center
Moffett Field, California 94035, June 4, 1979
43

REFERENCES
1. Naish, J. M.: Simulation of Visual Flight, With Particular Reference to the Study of Flight Instruments. Aero- nautical Research Council CP488, HMSO London, 1960.
2. Naish, J . M.: Combination of Information in Superimposed Visual Fields. Nature, vol. 202, no. 4933, May 16, 1964, pp. 641-646.
3. Naish, J. M.: A System for Presenting Steering Information During Visual Flight (The Head-Up Display). z
Part I - The Effect of Location of the Instrument Display on Combined Instrument and Visual Flying. Royal Aircraft Establishment, Technical Note IAPl132, Oct. 1961.
4. Naish, J. M.; and Shiel, R.: Flight Trials of the Head-Up Display (HUD) in Meteor 7/8 and Hunter 12 Aircraft. Royal Aircraft Establishment TR65254, Nov. 1965.
5. Naish, J . M.: Properties of a Head-Up Display System Relevant to Approach and Landing. International Air Transport Assoc., IATA 15th Technical Conference, Lucerne, WP106, April 1963.
6. Whiteside, T. C. D.: Problems of Vision in Flight at High Altitude. Butterworth, London, 1957, p. 92. (AGARDograph no. 13)
7. Naish, J. M.: Information Transfer in All-Weather Operation. Shell Aviation News, no. 396, 1971, pp. 8-10.
8. Fry, D. E.; Burden, K.; and Green, M . R.: Design and Flight Testing of a Takeoff and Overshoot Director Royal Aircraft Establishment TR-66083, Mar. 1966.
9. Anon.: British Push for Advanced VTOL Systems. Aviation Week and Space Technology, vol. 88, no. 26, June 24, 1968, p. 229.
10. Morrall, J . C.: The Pilot's Safety Problem in Category I1 Operations and the Potential Contribution of Head-Up Display. Royal Aircraft Establishment TR66195, 1966.
11. Stout, C. L.; and Naish, J. M.: The Total Systems Concept for Category 111 Operations. Society of Experimental Test Pilots, 1 Ith Symposium Proceedings, Los Angeles, California, Technical Review, vol. 8, no. 4, Sept. 1967, pp. 79-105.
12. Anon.: Air Line Pilots in First HUD Landing. Air Line Pilot, May 1967.
13. Naish, J. M.: Flight Tests of the Head-Up Display (HUD) in DC-9-20 Ship 382, Nov. 1968-Jan. 1969. Douglas Aircraft Company, Long Beach, California, MDC 5-0878, Sept. 1970.
14. Lane, J . C.; and Curnming, R. W.: The Role of Visual Cues in Final Approach to Landing. Commonwealth of Australia, Department of Supply, Aeronautical Research Laboratories, Human Engineering Note 1 , May 1956.
15. Baxter, .I. R.; and Workman, J . D.: Review of Projected Displays of Flight Information and Recommendations for Further Development. Commonwealth of Australia, Department of Supply, Aeronautical Research Laboratories, Human Engineering Report 2, Aug. 1962.
16. Johnson, D.: Discussion following Symposium on Displays. Journal of the Royal Aeronautical Society, vol. 69, no. 658, Oct. 1965, pp. 673-674.
44

17. Harlow, R. A.: Flight Assessment of Head-Up Display as a Clear Weather Approach Aid. Royal Aircraft Estab- lishment TR7 1 141, July 197 1.
18. Brown, A. D.; and Ginn, S. B.: Manual Approach Performance Using a Simple Airborne VAS1 Head-Up Display. Royal Aircraft Establishment TR73080, Sept. 1973.
19. Anon.: Essais du Collimateur d'Approche i Vue CV91 sur Nord 260 No. 9. Centre d'Essais en Vol, BrCtigny, 19/SE/EQ/1974.
20. Jenney, L. L.; Malone, T. B.; and Schweickert, G . A.: Head-Up Displays, a Study of Their Applicability in Civil Aviation. Matrix Research,NASA CR-117135, Jan. 1971.
21. Llewellyn, K. R.: Judgments Made in Relation to an Expanding Field of Visual Stimulation. Ph.D. thesis, University of Sydney, 1962.
22. Havron, M. D.: Information Available from Natural Cues During Final Approach and Landing. Human Sciences Research Inc., HSR-RR-62/3-MK-X, Mar. 1962.
23. Palmer, E. A.: Experiments on Aim Point Estimation at Various Rates of Closure. NASA TM X-61,077, Mar. 1968.
24. Naish, J . M.: Control Information in Visual Flight. Seventh Annual Conference on Manual Control, University of Southern California, Los Angeles, California, June 1971, NASA SP-281, 1972, pp. 167-176.
25. Bateman, C. D.: The Single Task. A Flyability Improvement to the Visual Landing Aid. United Control, Red- mond, Washington, 1971.
26. Naish, J. M.: Head-Up Display for the Visual Approach. Eighth Annual Conference on Manual Control, Univer- sity of Michigan, Ann Arbor, Michigan, May 17-19, 1972, pp. 159-174.
27. Lowe, J . R.: Improving the Accuracy of HUD Approaches in Wind Shear with a New Control Law. Douglas Aircraft Company, Long Beach, California, AIAA Paper 78-1494, Aug. 1978.
45

I . Report No. NASATP-1499 2. Government Accession No. ." ". . " - "" - ~~
3. Recipient's Catalog No.
HUD Report " 4 4. Title and Subtitle 5. Report Date
A REVIEW OF SOME HEAD-UP DISPLAY FORMATS
.. . ~~
7. Author(r1 8. Performing Organization Report No.
J. M. Naish* A-7708 ~~ ~~ . - . . . . - - . 10. Work Unit No.
9. Performing Organization Name and Address 505-09-3 1-05-00 Ames Research Center, NASA Moffett Field, Calif. 94035
11. Contract or Grant No.
. "_ _ ~ _ _ _ - . . . ." 13. Type of Report and Period Covered 2. Sponsoring Agency Name and Address
National Aeronautics and Space Administration Washington, D.C. 20546
- "
5. Supplementary Notes - ~ - ". ~~ .
*This report was prepared while the author was a Resident Research Associate of the National Research Council at Ames Research Center-NASA. Part of the research was carried out before coming to Ames. - ~... -
6. Abstract " ." . ." . - . ."
A distinction is drawn between the original Head-Up Display, in which guidance is by means of an unreferenced, or unstabilized, flight director (HUD I) and concepts based on the proposal of Lane and Cumming to show displacement, or path error, and flight-path direction in relation to a ground frame (HUD 11). The display properties used in comparing the two systems are associated with easy, accurate performance of concurrent tasks based on superimposed fields in different flight modes. Results of HUD I are collected from earlier work, and flight tests in a large commercial jet transport are used to furnish previously unpublished results for HUD 11.
The use of displacement and flight-path information for vertical control is discussed in terms of path stability with special reference to error effects experienced in real flight and to signal processing. Several combinations of symbols and driving signals, including a compensated control law, are used in simulated flight to deal with wind shear, without marked effect by day, but a general advantage is indicated for HUD in night conditions with unexpected shear, and several combinations of throttle control, turbulence, and initial offset. A schematic is given for the pilot using HUD 11.
Comparison of HUD 1 and I1 shows neither format to be uniformly superior or entirely adequate. Choice of a display may ultimately depend on decisions relating to the quality of data sources, the use of processed information, and the number of modes in which the display is used, while taking account of the techniques for wind shear, height control, and monitoring.
~
7. Key Words (Suggested by Authorb)) ~ - -~ ~
Head-up display Symbol format HUD evaluation data Flight testing
." . - - . - I 18. Distribution Statement . . . .. -
Unlimited
STAR Category - 06 .~ "- -~ - - . .~~ .I. -
9. Security Classif. (of this report) 20. Security Classif. (of this page) 21. NO. of Pages 22. Price' .
Unclassified Unclassified 1 $4.00 ~ . ~ ". " . ". "___
'For sale by the National Technical Information Service, Springfield, Virginia 22161 NASA-Langley, 1979

111 l1 l l11mI~1111111 I II I I 1 1 l 1 l l National Aeronautics and Space Administration
Washington, D.C. 20546 Official Business Penalty for Private Use, $300
THIRD-CLASS BULK RATE Postage and Fees Paid National Aeronautics and Space Administration NASA451
U
2 3 1U,A, 107579 SOfl903DS DEPT OF THE AIB FORCE AF WEAPONS LBBCBATORY i '
ATTN: TECHNICAL LIBRARY {SUI.) K I R T L A N D BFB N M 87117
pus, MAS, ljR: If Undeliverable (Section 1 5 8 Postal Manual) Do Not Return