review of the ebrd energy sector strategy – management ... · special study: review of the ebrd...
TRANSCRIPT

ab0cd
THEMATIC EVALUATION
Review of the EBRD Energy Sector Strategy – MANAGEMENT COMMENTS
April 2018
EBRD EVALUATION DEPARTMENT
THEMATIC EVALUATION ANNEXES to the Review of the EBRD Energy Sector Strategy
April 2018
EBRD EVALUATION DEPARTMENT

i
Annexes to: EvD’s Review of the EBRD’s Energy
Sector Strategy
Table of Content
Annex 1 Evaluation methodology ........................................................................................................ 1
Annex 2 2013 ESS approval process .................................................................................................... 6
Annex 3 Comparing the 2006 Energy Operations Policy and the 2013 Energy Sector Strategy ................................................................................................................................... 10
Annex 4 IFIs approaches to coal ....................................................................................................... 12
Annex 5 IFIs approaches to oil and gas ........................................................................................... 14
Annex 6 Operational Performance Indicator .................................................................................. 17
Annex 7 Data analysis .......................................................................................................................... 25
Annex 8 People interviewed ............................................................................................................... 56
List of Tables Table A. 1: Revised evaluation matrix ........................................................................................................................ 3 Table A. 2: Snapshot of public comments issues and actual incorporation in ESS ........................................... 7 Table A. 3: OPI 2 on Cost reflective pricing .......................................................................................................... 17 Table A. 4: OPI 3 on Energy Efficiency .................................................................................................................. 18 Table A. 5: OPI 4 on Carbon intensity .................................................................................................................... 19 Table A. 6: OPI 5 on Energy trade ........................................................................................................................... 20 Table A.7: EBG Financial Frameworks approved by the EBRD Board (Dec 2013-Apr 2017) in
chronological order .............................................................................................................................. 25 Table A. 8: EBG operations approved and signed (Dec 2013-Apr 2017) ......................................................... 27 Table A. 9: Portfolio class of the EBG operations approved and signed (Dec 2013-Apr 2017) .................. 27 Table A. 10: Transition impact source for EBG operations approved Dec2013-Apr2017 ........................... 29 Table A.11: Approved and signed operations in Natural Resources (ordered by country), Dec2013-
Apr2017 .................................................................................................................................................. 33 Table A. 12: Natural Resources – country distribution per industry (Dec 2013-Apr 2017) ........................... 35 Table A. 13: Natural Resources – geographic distribution (Dec 2013-Apr 2017) ........................................... 36 Table A. 14: Natural Resources – Transition Impact at approval (Dec 2013-Apr 2017) ............................... 37 Table A. 15: Natural Resources – SEI/SRI/GET and Environmental Category (Dec 2013-Apr 2017) .... 38 Table A.16: Approved and signed operations in Power & Energy (ordered by country), Dec2013-
Apr2017 .................................................................................................................................................. 38 Table A. 17: Power & Energy – country distribution per industry (Dec 2013-Apr 2017) ............................. 42 Table A. 18: Power & Energy – geographic distribution (Dec 2013-Apr 2017) .............................................. 43 Table A. 19: Power & Energy – Transition Impact at approval (Dec 2013-Apr 2017) .................................. 45 Table A. 20: Power & Energy – SEI/SRI/GET and Environmental Category (Dec 2013-Apr 2017) ....... 46 Table A. 21: Operations in Electric Power Distribution, Transmission, Control (Dec2013-Apr2017) ....... 46 Table A. 22: Operations in renewable energy approved Dec2013-Apr2017..................................................... 47 Table A. 23: Non-TC grants linked to EBRD operations supply-side of energy approved Dec13-Apr17 . 54

ii
Table A.24: Interviews related to the EBRD’s engagement in the energy sector in Jordan (24-28 Sep 2017) ....................................................................................................................................................... 56
Table A.25: Interviews related to the EBRD’s engagement in the energy sector in Kazakhstan (16-20 Oct 2017) ............................................................................................................................................... 57
Table A.26: Interviews in EBRD HQ related to the EBRD’s engagement in the energy sector .................. 58
List of figures Figure A.1: Review approach ....................................................................................................................................... 1 Figure A.2: Timeline of the approval process and monitoring of the 2013 ESS ................................................ 6 Figure A.3: OPI 2 – Pre-tax subsidies (% of GDP) .............................................................................................. 22 Figure A.4: OPI 2 – Post-tax subsidies (% of GDP) ............................................................................................ 22 Figure A.5: OPI 3 – Energy Efficiency: absolute energy consumption (toe per capita) ................................. 23 Figure A.6: OPI 3 – Energy efficiency: energy intensity (toe per thousand GDP 2010 USD PPP) ............. 23 Figure A.7: OPI 4 – Carbon intensity: CO2 emissions per unit of GDP, PPP adjusted (KgCO2 per
2010 USD PPP) .................................................................................................................................... 24 Figure A.8: OPI 4 – Carbon intensity: absolute CO2 emissions per capita (tCO2 per capita) ...................... 24 Figure A.9: Energy Business Group NCBI per country (Dec 2013 – Apr 2017) ............................................ 26 Figure A.10: Volume (€) and Number of EBG operations approved (Dec 2013 – Apr 2017) ..................... 27 Figure A.11: Country distribution of EBG operations approved (Dec 2013 – Apr 2017) in million € ....... 28 Figure A.12: Number of energy operations by transition impact source (Dec 2013-April2017) .................. 30 Figure A.13: TI at approval and related risk for energy operations (Dec2013-Apr2017) ............................... 30 Figure A.14: SEI/SRI/GET share of SEI/SRI/GET qualified EBG operations approved Dec2013-
Apr2017 .................................................................................................................................................. 31 Figure A.15: Primary energy savings toe/year from EBRD’s operations (2014-2016) ................................... 31 Figure A.16: Portfolio class EBG operations 2011-2016 (€M) ............................................................................ 32 Figure A.17: Portfolio class EBG operations 2011-2016 (%) .............................................................................. 32 Figure A.18: EBRD finance, private syndication, special funds finance, co-finance and other external
finance over total project value (approvals 2011-16) in € million ............................................... 32 Figure A.19: Industry of energy operations (excluding extractive industry) by year of Board approval ...... 33 Figure A.20: Natural Resources – industry distribution by number of operations (Dec 2013 – Apr
2017) ....................................................................................................................................................... 36 Figure A.21: Natural Resources – industry distribution by volume (Dec 2013 – Apr 2017) ......................... 36 Figure A.22: Natural Resources - Net Cumulative Bank Investment and number of projects (Dec 2013
– Apr 2017) ............................................................................................................................................ 37 Figure A.23: Power & Energy – industry distribution by number of operations (Dec 2013 – Apr 2017) .. 43 Figure A.24: Power & Energy – industry distribution by volume (Dec 2013 – Apr 2017) ............................ 43 Figure A.25: Power & Energy - Net Cumulative Bank Investment and number of projects (Dec 2013
– Apr 2017) ............................................................................................................................................ 45 Figure A.26: EBRD’s investments (volume) in renewable energy projects (Dec 2013-Apr 2017) ............... 50 Figure A.27: Cumulative EBRD investments in renewable energy by country of operation (Dec 2013-
Apr 2017) ............................................................................................................................................... 51
Special Study: Review of the EBRD Energy Sector Strategy – ANNEXES 1
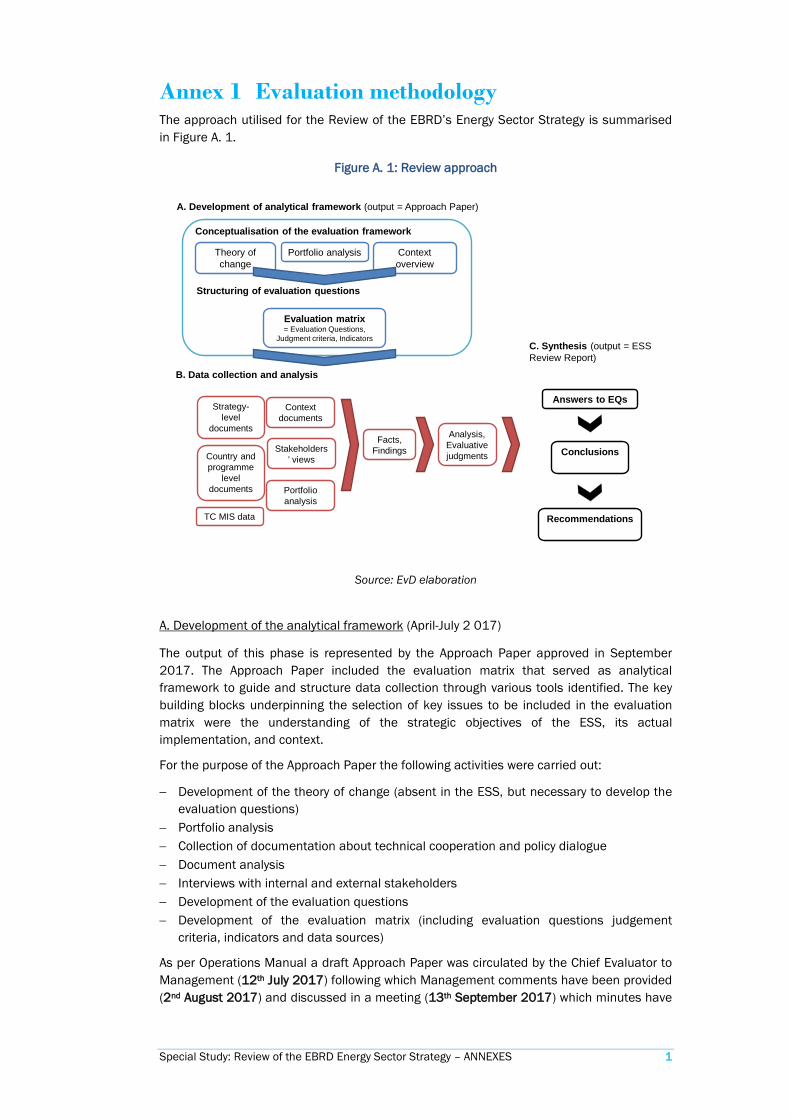
Annex 1 Evaluation methodology The approach utilised for the Review of the EBRD’s Energy Sector Strategy is summarised in Figure A. 1.
Figure A. 1: Review approach
Theory of change
Context overview
Portfolio analysis
Evaluation matrix= Evaluation Questions,
Judgment criteria, Indicators
Conceptualisation of the evaluation framework
Structuring of evaluation questions
B. Data collection and analysis
Strategy-level
documents
Country and programme
level documents
Context documents
Stakeholders’ views
Facts,Findings
Analysis,Evaluative judgments
C. Synthesis (output = ESS Review Report)
Answers to EQs
Conclusions
Recommendations
A. Development of analytical framework (output = Approach Paper)
Portfolio analysis
TC MIS data
Source: EvD elaboration
A. Development of the analytical framework (April-July 2 017)
The output of this phase is represented by the Approach Paper approved in September 2017. The Approach Paper included the evaluation matrix that served as analytical framework to guide and structure data collection through various tools identified. The key building blocks underpinning the selection of key issues to be included in the evaluation matrix were the understanding of the strategic objectives of the ESS, its actual implementation, and context.
For the purpose of the Approach Paper the following activities were carried out:
− Development of the theory of change (absent in the ESS, but necessary to develop the evaluation questions)
− Portfolio analysis − Collection of documentation about technical cooperation and policy dialogue − Document analysis − Interviews with internal and external stakeholders − Development of the evaluation questions − Development of the evaluation matrix (including evaluation questions judgement
criteria, indicators and data sources)
As per Operations Manual a draft Approach Paper was circulated by the Chief Evaluator to Management (12th July 2017) following which Management comments have been provided (2nd August 2017) and discussed in a meeting (13th September 2017) which minutes have
Special Study: Review of the EBRD Energy Sector Strategy – ANNEXES 2
been recorded. The final Approach Paper was circulated by the Chief Evaluator on 19th September 2017 and published on EBRD’s website.
B. Data collection and analysis (July-October 2017)
Data was collected via the various tools and methods for data collection structured along the review matrix. Data were of a quantitative and qualitative nature - to allow to the extent possible for verification and cross-checking (triangulation) from different sources. The Review has combined secondary (desk) sources with fresh data collection through interviews of relevant stakeholders (for a total of 102 people interviewed during country visits, conference calls and in EBRD HQ – see Annex 8).
Two country visits took place: 24-28 September 2017 in Jordan and 16-20 October 2017 in Kazakhstan. The list of people interviewed is available in Annex 8. All the credit for the success of the missions goes to the sector and country teams – to which the evaluation team is grateful.
C. Synthesis (November 2017-February 2018)
The synthesis phase has been devoted to constructing answers to the evaluation questions based on the findings from data collected in phase B. During this phase the original evaluation matrix has been amended to reflect the inputs substantive for achieving the objective of the evaluation – see Table A. 1.
Also, the evaluation team has seen value in adding extra resources to add a stand-alone piece about the role of sector strategies in the EBRD’s strategic planning process, which is likely to be useful for the future work on other sector strategic documents other than ‘energy’ related ones. This has required collection of internal documentation and interviews, as well as analysis of documentation from partner IFIs.
Based on the harvested findings the evaluation team has formulated conclusions and recommendations. The final output of the synthesis is this report.
As per Operations Manual a draft report was circulated by the Chief Evaluator to Management (2nd March 2018) following which Management comments have been provided and carefully reviewed by EvD.
The final report was circulated to Management and the Board by the Chief Evaluator on 28th March 2018 and will be discussed at the Board’s Audit Committee on 17th April 2018. Eventually the report is published on the EBRD website.
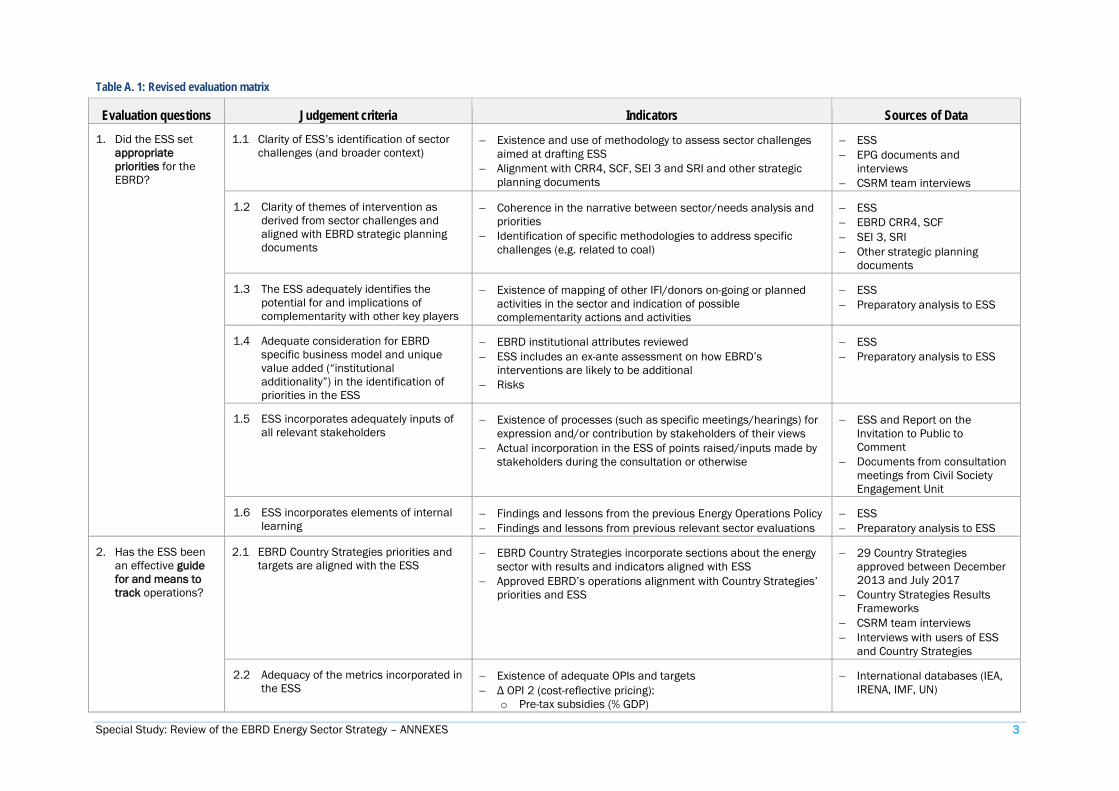
Special Study: Review of the EBRD Energy Sector Strategy – ANNEXES 3
Table A. 1: Revised evaluation matrix
Evaluation questions Judgement criteria Indicators Sources of Data 1. Did the ESS set
appropriate priorities for the EBRD?
1.1 Clarity of ESS’s identification of sector challenges (and broader context)
− Existence and use of methodology to assess sector challenges aimed at drafting ESS
− Alignment with CRR4, SCF, SEI 3 and SRI and other strategic planning documents
− ESS − EPG documents and
interviews − CSRM team interviews
1.2 Clarity of themes of intervention as derived from sector challenges and aligned with EBRD strategic planning documents
− Coherence in the narrative between sector/needs analysis and priorities
− Identification of specific methodologies to address specific challenges (e.g. related to coal)
− ESS − EBRD CRR4, SCF − SEI 3, SRI − Other strategic planning
documents
1.3 The ESS adequately identifies the potential for and implications of complementarity with other key players
− Existence of mapping of other IFI/donors on-going or planned activities in the sector and indication of possible complementarity actions and activities
− ESS − Preparatory analysis to ESS
1.4 Adequate consideration for EBRD specific business model and unique value added (“institutional additionality”) in the identification of priorities in the ESS
− EBRD institutional attributes reviewed − ESS includes an ex-ante assessment on how EBRD’s
interventions are likely to be additional − Risks
− ESS − Preparatory analysis to ESS
1.5 ESS incorporates adequately inputs of all relevant stakeholders
− Existence of processes (such as specific meetings/hearings) for expression and/or contribution by stakeholders of their views
− Actual incorporation in the ESS of points raised/inputs made by stakeholders during the consultation or otherwise
− ESS and Report on the Invitation to Public to Comment
− Documents from consultation meetings from Civil Society Engagement Unit
1.6 ESS incorporates elements of internal learning
− Findings and lessons from the previous Energy Operations Policy − Findings and lessons from previous relevant sector evaluations
− ESS − Preparatory analysis to ESS
2. Has the ESS been an effective guide for and means to track operations?
2.1 EBRD Country Strategies priorities and targets are aligned with the ESS
− EBRD Country Strategies incorporate sections about the energy sector with results and indicators aligned with ESS
− Approved EBRD’s operations alignment with Country Strategies’ priorities and ESS
− 29 Country Strategies approved between December 2013 and July 2017
− Country Strategies Results Frameworks
− CSRM team interviews − Interviews with users of ESS
and Country Strategies
2.2 Adequacy of the metrics incorporated in the ESS
− Existence of adequate OPIs and targets − Δ OPI 2 (cost-reflective pricing):
o Pre-tax subsidies (% GDP)
− International databases (IEA, IRENA, IMF, UN)

Special Study: Review of the EBRD Energy Sector Strategy – ANNEXES 4
Evaluation questions Judgement criteria Indicators Sources of Data o Post-tax subsidies (% GDP)
− Δ OPI 3 (energy efficiency): o Absolute energy consumption per capita (toe per capita) o Energy intensity (toe per thousand GDP 2010 USD PPP)
− Δ OPI 4 (carbon intensity): o CO2 emissions per unit of GDP, PPP adjusted (KgCO2 per
2010 USD PPP) o Absolute CO2 emission per capita (tCO2 per capita)
− Δ OPI 5 (energy trade): o % of energy export over total energy consumption o % of energy imports over total energy consumption
− Use of the OPIs
2.3 Adequate accountability mechanisms − Frequency and quality of the updates to the Board − Existence of other mechanisms
− Office of the Secretary General (OSG)
3. What results are observable thus far?
3.1 Progresses towards improved energy and resource efficiency / lower energy intensity on the supply and demand sides
Contribution of activities to ESS outcome and SEI/SRI/GET as reflected by: − Primary energy savings (Toe/year) from EBRD’s operations − Water savings (cubic meters per year) from EBRD’s operations − Material savings (tons) from EBRD’s operations − Progresses made by policy dialogue activities (donor funded,
EBRD funded, and part of daily EBRD activities in HQ and countries of operations) on legislation conducive to energy efficiency
− Project documentation (investments, TCs and policy dialogue)
− Interviews with internal stakeholders (EBG, E2C2, ESD, LTT)
− Interviews with external stakeholders in Jordan and Kazakhstan
3.2 Progresses towards improved environmental performance
Contribution of activities to ESS outcome and SEI/SRI/GET as reflected by: − GHG emissions reduction (Mt CO2-equ.) from EBRD’s operations − Progresses made by policy dialogue activities (donor funded,
EBRD funded, and part of daily EBRD activities in HQ and countries of operations) on NDCs and Paris Agreement commitments
− Project documentation (investments, TCs and policy dialogue)
− Interviews with internal stakeholders (EBG, E2C2, ESD, LTT)
− Interviews with external stakeholders in Jordan and Kazakhstan
3.3 Progresses towards enhanced quality and security of supply
Contribution of activities to ESS outcome as reflected by: − Gas transportation from EBRD’s operations − Power transmission, distribution and control from EBRD’s
operations − Cross-border energy trade from EBRD’s operations − Renewable energy from EBRD’s operations:
o Δ # and volume of operations
− Project documentation (investments, TCs and policy dialogue)
− Interviews with internal stakeholders (EBG, E2C2, ESD, LTT)
− Interviews with external

Special Study: Review of the EBRD Energy Sector Strategy – ANNEXES 5
Evaluation questions Judgement criteria Indicators Sources of Data o Δ installed capacity
− Progresses made by policy dialogue activities on renewable energy
stakeholders in Jordan and Kazakhstan
− Interviews for Azerbaijan and Poland cases
3.4 Progresses towards more open and better functioning markets
Contribution of activities to ESS outcome as reflected by: − Δ ratio private/state from EBRD’s operations in the energy
supply-side − Δ ratio EBRD finance, private syndication, special funds, co-
finance and external finance out of total projects’ values from EBRD’s operations in the energy supply-side
− Δ use of grants for operations in the energy supply-side − Progresses made by policy dialogue on energy regulatory
programmes, etc.
− Project documentation (investments, TCs and policy dialogue)
− Interviews with internal stakeholders (EBG, E2C2, ESD, LTT)
− Interviews with external stakeholders in Jordan and Kazakhstan
3.5 Progresses towards improved transparency, governance, skills, and standards/practices
Contribution of activities to ESS outcome as reflected by progresses made by policy dialogue activities − transparency practices (e.g. EITI principles) − social, environmental and governance practices − modernised SOEs
− Project documentation (investments, TCs and policy dialogue)
− Interviews with internal stakeholders (EBG, E2C2, ESD, LTT)
− Interviews with external stakeholders in Jordan and Kazakhstan

Special Study: Review of the EBRD Energy Sector Strategy – ANNEXES 6
Annex 2 2013 ESS approval process The approval process of the 2013 ESS is summarised in Figure A. 2.
Figure A. 2: Timeline of the approval process and monitoring of the 2013 ESS
2012
Nov 2012 to Apr 2013
2013
InformationSession
FOPC
1st draft of ESS
presented to FOPC
Jul 2013 to Sep 2013
Final ESS approved
by the Board
Public comments & 2nd
ESS draft presented to FOPC
2014
Collectionof
baseline for OPIs
Methodology for
assessment of coal fired projects
Source: EvD elaboration
Pre-drafting phase
During the pre-drafting phase from November 2012 to April 2013, EBRD has sought input from the widest possible range of stakeholders to ensure that its review was informed by an awareness of the full range of concerns and opportunities in this area. This engagement took the shape of:
− An Invitation to Comment on the 2006 EBRD Energy Operations Policy published on the EBRD’s website on 16 November 2012 and closed on 16 January 2013;
− A brainstorming meeting with a group of CSOs specialising in energy issues held on 6 December 2012 in London;
− A joint workshop with Chatham House on Future trends in the energy sector and priorities for EBRD energy policy with a number of key energy experts on 2 February 2013 in London;
− Two separate brainstorming discussions with Greenpeace on 22 January 2013 (via a conference call) and CEE Bankwatch on 20 February 2013 in London.
Key topics discussed are available in a summary document.1
On 13 March 2013 an Information Session for the Board was organised to introduce the key issues for the Energy Strategy under drafting.2 There is no official record of the proceedings.
1 Summary of comments received on the existing Energy Operations Policy (2006) and the forthcoming Draft Energy Strategy in the period from November 2012 to April 2013.
Special Study: Review of the EBRD Energy Sector Strategy – ANNEXES 7
First draft
A first draft of the ESS was circulated in late June 20133 and submitted for consideration of the Board’s Financial and Operations Policies Committee. The latter discussed the document in its meeting of the 11 July 2013.
The official minutes of the meeting stress that the document was welcome. Specific elements discussed are summarised:
− “the strategy could set out more clearly its overall objectives (…)In particular, many felt that the nature of the strategic performance indicators should be made more precise before publication for comment;
− discussion of the nature of the Bank’s sectoral documents and the relationship between them and country strategies;
− the need for the Bank’s activities on energy demand to be reflected in this strategy; − The need to emphasise more the work in supporting greater transparency; − Unconventional oil and gas exploration (including fracking) needed to be discussed
more because of different views; − Talking about coal where mixed views emerged again “management needed to strongly
emphasise its expectation of very limited participation in this area”.4
Following FOPC meeting few changes were made to the draft before circulating it for public consultation (such as the introduction of Operational Performance Indicators).
Public consultation
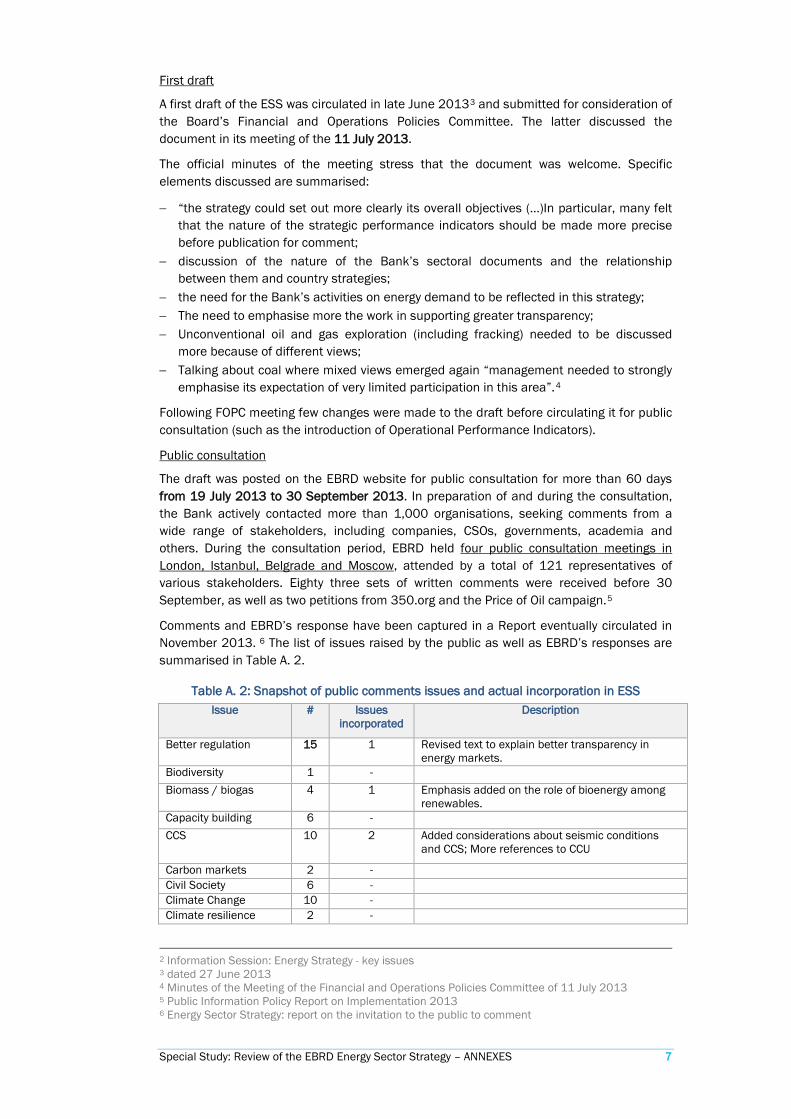
The draft was posted on the EBRD website for public consultation for more than 60 days from 19 July 2013 to 30 September 2013. In preparation of and during the consultation, the Bank actively contacted more than 1,000 organisations, seeking comments from a wide range of stakeholders, including companies, CSOs, governments, academia and others. During the consultation period, EBRD held four public consultation meetings in London, Istanbul, Belgrade and Moscow, attended by a total of 121 representatives of various stakeholders. Eighty three sets of written comments were received before 30 September, as well as two petitions from 350.org and the Price of Oil campaign.5
Comments and EBRD’s response have been captured in a Report eventually circulated in November 2013. 6 The list of issues raised by the public as well as EBRD’s responses are summarised in Table A. 2.
Table A. 2: Snapshot of public comments issues and actual incorporation in ESS Issue # Issues
incorporated Description
Better regulation 15 1 Revised text to explain better transparency in energy markets.
Biodiversity 1 - Biomass / biogas 4 1 Emphasis added on the role of bioenergy among
renewables. Capacity building 6 - CCS 10 2 Added considerations about seismic conditions
and CCS; More references to CCU
Carbon markets 2 - Civil Society 6 - Climate Change 10 - Climate resilience 2 -
2 Information Session: Energy Strategy - key issues 3 dated 27 June 2013 4 Minutes of the Meeting of the Financial and Operations Policies Committee of 11 July 2013 5 Public Information Policy Report on Implementation 2013 6 Energy Sector Strategy: report on the invitation to the public to comment

Special Study: Review of the EBRD Energy Sector Strategy – ANNEXES 8
Issue # Issues incorporated
Description
Coal 40 1 Clarified commitment on greenfield coal power generation
Coal - shadow pricing 11 4 Methodology to screen coal projects CHP 2 - Decentralised energy 2 - Decommissioning 2 - EBRD financing 17 - Energy efficiency 23 - Energy security 3 - Energy storage 1 - Environmental and
1 -
EU integration 1 - Evaluation of projects 1 - Fossil fuels 12 - Fuel switching 1 - Gas flaring 1 - Gas resources 3 - General 14 1 Annex 3 includes a map of EBRD's regions Hydrocarbons 10 - Integrity 2 - Key partners 2 - Local Content
2 -
Nuclear energy 8 - Pricing of externalities 2 - Public consultation
6 -
Public information 2 - Refining 2 - Renewables 19 - Rethinking energy systems
6 -
Role of LNG 2 - Security of supply 1 - Sensitive regions 2 - Smart infrastructure 9 2 Clarified intention to work on smart metering Social aspects, affordability
5 -
Standards and best practice
9 -
Stranded assets 2 - Strategic Orientation 6 - Subsidies 3 - Supporting a cleaner transport sector
4 -
Table of contents 1 1 Included coal in the table of content Low Carbon Transition 6 - Transparency 5 2 Commitment to standards as per other policies;
Added reference to disclosure of subsoil licenses and contracts.
Unconventional Oil and Gas
7 -
Waste to energy 1 - TOTAL 315 15
Source: EvD elaboration based on the Report on the Invitation to the Public to Comment on the Energy Sector Strategy

Special Study: Review of the EBRD Energy Sector Strategy – ANNEXES 9
Second draft
On 15th November 2013 a revised draft of the ESS was circulated7 together with the Report on the invitation to the public to comment.8 The second draft tracked changes reflecting the comments received from the public – to the extent EBRD’s found it appropriate – and the FOPC’s requests discussed in July 2013.
The second draft and the Report on the invitation to the public to comment were discussed by the FOPC on 25th November 2013 – unusually as it is not normal practice for a sector strategy to be discussed twice at FOPC before submission to the Board.
The official minutes of the meeting stress that the revised document was welcome. Specific elements discussed were:
− OPIs are welcome, despite the attribution issue − Low carbon agenda − The wording on coal was subject to particular attention (with different views expressed
by Board Directors) − The language on unconventional oil and gas was subject to particular attention (with
different views expressed by Board Directors) − The Committee supported the priorities of the Strategy, the performance indicators and
other features.9
The comments made at FOPC were incorporated in the second draft – a revised version was circulated on 3rd December 2013.10
Final
On 10th December 2013 the EBRD Board discussed and approved the Energy Sector Strategy11 following the recommendation for approval included in the Report by the Chairman of the FOPC.12
The document was eventually approved with the following abstentions:
− Austria and Israel because of the opposition to supporting financing in nuclear generation that are not exclusively or even primarily safety driven.
− Japan considered that there was excessive restrictiveness of financing of coal projects in the text.
− United Kingdom noted his authorities’ policy that greenfield coal construction should take place only in the poorest countries. The abstention was based on the absence of such distinction.13
Follow-up actions
Operational performance indicators (OPIs) – in 2014 the Bank collected data and information (baseline) on the five OPIs in each country of operation. The indicators will again be collected after the end of the strategy period in 2019.
On 25 September 2014 the Bank circulated its methodology for the assessment of coal fired generation projects.
7 Energy Sector Strategy 8 Energy Sector Strategy: report on the invitation to the public to comment 9 Minutes of the Meeting of the Financial and Operations Policies Committee of 25 November 2013 10 Energy Sector Strategy 11 Energy Sector Strategy 12 Report by the Chairman of the Financial and Operations Policies Committee on Energy Sector Strategy 13 Minutes of the Board Meeting of 10 December 2013
Special Study: Review of the EBRD Energy Sector Strategy – ANNEXES 10
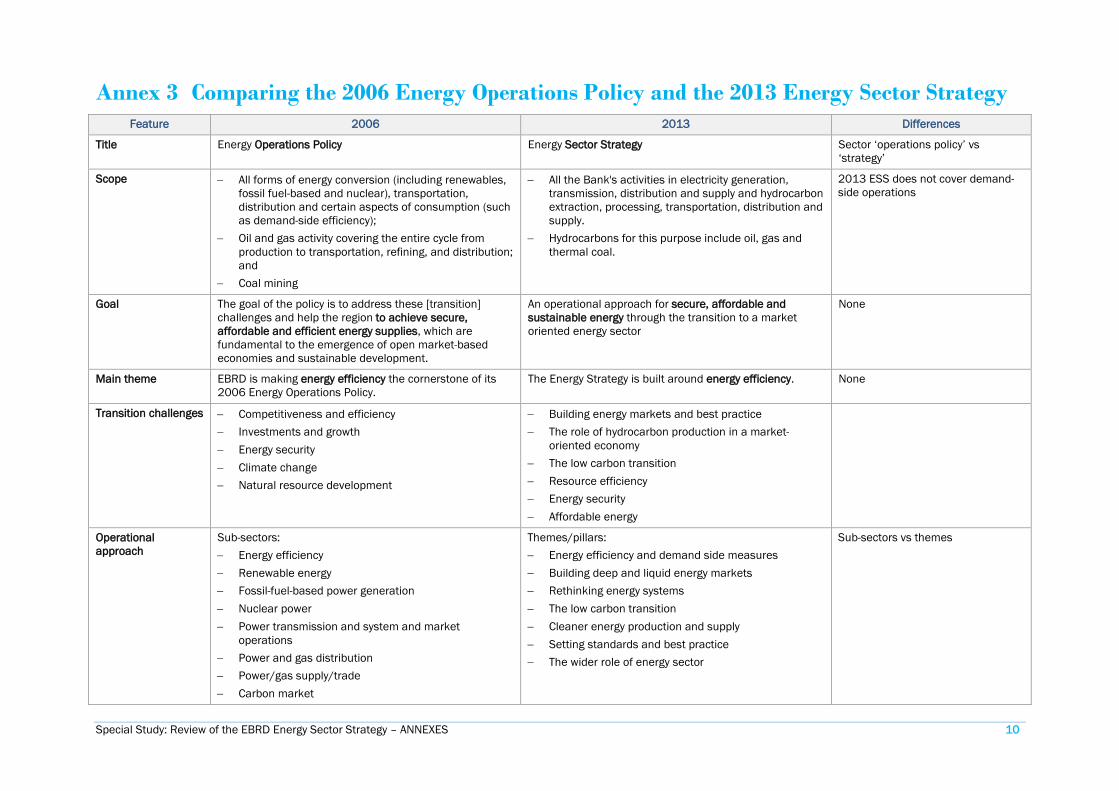
Annex 3 Comparing the 2006 Energy Operations Policy and the 2013 Energy Sector Strategy Feature 2006 2013 Differences
Title Energy Operations Policy Energy Sector Strategy Sector ‘operations policy’ vs ‘strategy’
Scope − All forms of energy conversion (including renewables, fossil fuel-based and nuclear), transportation, distribution and certain aspects of consumption (such as demand-side efficiency);
− Oil and gas activity covering the entire cycle from production to transportation, refining, and distribution; and
− Coal mining
− All the Bank's activities in electricity generation, transmission, distribution and supply and hydrocarbon extraction, processing, transportation, distribution and supply.
− Hydrocarbons for this purpose include oil, gas and thermal coal.
2013 ESS does not cover demand-side operations
Goal The goal of the policy is to address these [transition] challenges and help the region to achieve secure, affordable and efficient energy supplies, which are fundamental to the emergence of open market-based economies and sustainable development.
An operational approach for secure, affordable and sustainable energy through the transition to a market oriented energy sector
None
Main theme EBRD is making energy efficiency the cornerstone of its 2006 Energy Operations Policy.
The Energy Strategy is built around energy efficiency. None
Transition challenges − Competitiveness and efficiency − Investments and growth − Energy security − Climate change − Natural resource development
− Building energy markets and best practice − The role of hydrocarbon production in a market-
oriented economy − The low carbon transition − Resource efficiency − Energy security − Affordable energy
Operational approach
Sub-sectors: − Energy efficiency − Renewable energy − Fossil-fuel-based power generation − Nuclear power − Power transmission and system and market
operations − Power and gas distribution − Power/gas supply/trade − Carbon market
Themes/pillars: − Energy efficiency and demand side measures − Building deep and liquid energy markets − Rethinking energy systems − The low carbon transition − Cleaner energy production and supply − Setting standards and best practice − The wider role of energy sector
Sub-sectors vs themes

Special Study: Review of the EBRD Energy Sector Strategy – ANNEXES 11
Feature 2006 2013 Differences − Oil and gas upstream − Oil and gas midstream − Oil and gas downstream − Coal mining − District heating − Energy operations through financial intermediaries
Priorities − Promoting energy efficiency (target: a minimum of €1 million in EE and RE)
− Advancing the unfinished reform agenda − Promoting renewable energy technologies − Promoting carbon trading − Unlocking regions’ energy potential − Supporting sound natural resource management − Promoting energy trade and competition − Increasing nuclear safety − Promoting environmentally sustainable development
− Energy producers − EU Member States, candidate countries and ECSEE
members − Small, isolated markets − State-dominated sectors − Regional markets
Sub-sector vs group of countries
Approach to coal (fossil fuels)
The Bank will finance both rehabilitation and greenfield projects […]. A project should fit within a least-cost solution that takes into account security of supply and new or rehabilitated transmission as an alternative, does not contradict any regionally-based plan, and results in an overall efficiency gain to the Region served.
The Bank will not finance any greenfield coal-fired power plant, except in rare circumstances, where there are no economically feasible alternative energy sources.
2013 ESS restricts greenfield coal-fired power plants and a methodology has been developed accordingly
Indicators None Five Operational Performance Indicators (OPIs): − Private participation − Cost reflective pricing − Energy efficiency − Carbon intensity − Interconnections/energy trade
Indicators introduced by ESS
Monitoring/reporting None Baseline of the OPIs collected in the first half of 2014 and then updated at the end of the Strategy period (end 2018)
Tracking indicators introduced by ESS

Special Study: Review of the EBRD Energy Sector Strategy – ANNEXES 12
Annex 4 IFIs approaches to coal IFI Source Extract
AfDB 2012 Energy Sector Policy
“The Bank is committed to supporting RMCs achieve universal access to energy in an environmentally sustainable manner. For many African countries, coal-fired power generation is likely to form part of such an approach to help the continent increase its access to modern energy at an affordable cost. To ensure that any Bank support for coal-power generation is consistent with this approach, this support will take place within the broad framework outlined below: 1. Development impact: A proposed greenfield or retrofit coal-fired power plant supported by the Bank should have a strong developmental impact. In particular, such a power plant should contribute: (i) to poverty reduction, and (ii) addressing national and/or regional energy security needs. 2. Transitioning towards green growth: Bearing in mind the Long Term Strategy objective to help Africa transition to a cleaner energy path, the Bank will collaborate with RMCs to ensure that any coal power plant to be financed by the Bank will form part of a technologically and commercially feasible low-carbon and cost-effective strategy for energy resources. 3. Environmentally responsible: When supporting a coal power plant, the Bank will take advantage of progress in technology to adequately mitigate negative environmental impacts, allow for high efficiency, reduce greenhouse gas (GHG) emissions, and diversify the energy mix. 4. Technology: The Bank will work with RMCs to ensure adoption of the most appropriate, commercially available and affordable technology for reducing GHG emissions. The Bank will assist in sourcing additional financing to invest in such technologies. The Bank will ensure that a desk-top assessment of the technical, economic and financial feasibility of abatement is undertaken, and will encourage assessment of the potential for readiness for relevant Carbon Capture and Storage technologies. 5. Offsetting measures: The Bank is in line with, and seeks to promote United Nations conventions on climate change. Consequently, it ensures that its interventions comply with agreements and related standards that are ratified by its RMCs within the framework of climate-change negotiations in terms of GHG emissions, including offsetting measures. The Bank will therefore support RMCs that express an interest in implementing offsetting measures in relation to these agreements, or on a voluntary basis.” (pp. 21-22)
ADB 2009 Energy Policy
“Since coal and oil are internationally traded commodities with established commercial interests, ADB will not finance coal mine development except for captive use by thermal power plants, and oil field development except for marginal and already proven oil fields.” (p. 4) “To meet the electricity needs of the region, large capacity additions will be required for which coal-based generation will grow. ADB will encourage DMCs to adopt available cleaner technologies, such as fluidized bed combustion, supercritical and ultra-supercritical boilers, and flue gas desulfurization. As new technologies—such as integrated gasification combined cycle and carbon capture and storage (or sequestration)—are shown to be technically feasible and economically viable, ADB will support their deployment in DMCs to increase their financial viability. ADB will also assist DMCs in collaborating with developed countries on long-term technology transfer agreements for new and better technologies under development. It will selectively support coal-based power projects if cleaner technologies are adopted and adequate mitigation equipment and measures are incorporated into the project design. Some DMCs with smaller size grids that depend on oil-based power supply or imports from neighbouring countries may need to install coal-based power plants using subcritical boiler technology. Such diversification will improve power system reliability and energy security, and may be the least-cost option. In the interest of economical and developmental needs, ADB will support such base-load power plants, if found to be justified after due diligence. Assistance will also be extended to retrofit existing power plants that need to improve efficiency.” (p. 6) “Since coal is a major source of energy for electricity and heat, several DMCs will aggressively pursue coal mine development. As coal is an internationally traded commodity, ADB will maintain its current policy of not directly financing coal mine development except for captive use by power plants. This is the case

Special Study: Review of the EBRD Energy Sector Strategy – ANNEXES 13
IFI Source Extract
when a substantial part of the production of thermal coal is tied to long-term fuel supply contracts, or administrative allocation, for power plants. ADB will not finance when a coal mine is envisaged to be developed to sell thermal coal to the open markets or is linked through international trading channels to power generation in another country because the transaction will be considered market-based.” (p. 8)
AIIB 2017 Energy Sector Strategy
“Carbon efficient oil- and coal-fired power plants would be considered if they replace existing less efficient capacity or are essential to the reliability and integrity of the system, or if no viable or affordable alternative exists in specific cases.” (p. 17)
EIB 2013 Energy Lending Criteria
“These criteria – discussed below – would screen out power only coal or lignite fired power stations, but would allow some high efficiency coal and lignite fired CHP, coal and lignite projects fitted with CCS and some coal/lignite stations co-fired with carbon neutral fuel sources (e.g. biomass) and gas fired CCGT power and CHP plants. All fossil fuel power plants financed by the Bank:
− Must be economically justified based on a cost benefit analysis – including a carbon price which reflects the marginal damage of each unit harmful emission (e.g. CO2, NOx, SOx).
− Have CO2 emissions of less than the EPS (Emission Performance Standard), expressed in gCO2/kWh.” (p. 26) “Shale gas present in some EU countries with limited diversification of gas supplies and high coal utilisation, and the potential for gas as a transition fuel may be particularly welcome in such cases.” (p. 30)
EIB Emission Performance Standard
EPS Absolute Level The EIB has introduced an Emission Performance Standard (or EPS) of 550gCO2/kWh to screen the Bank’s investments in fossil fuel generation projects. EPS Calculation Methodology The EPS is calculated as the moving average of the ratio of annual targeted annual carbon emissions from power plants to the electricity generated by the same plants in the same year. The annual carbon emissions from power plants are calculated assuming an annual reduction consistent with the requirements of the ETS Directive (2009/29/EC). The electricity generated by the power plants is forecasted to grow yearly at a rate consistent with the higher end of the full set of scenarios contained in the Energy Roadmap 2050.
IaDB 2015 Energy Sector Framework Document
“An Approach to Reconciling the Financing of Coal-fired Power Plants with Climate Change Objectives” (p. 47)
WBG Towards a Sustainable Energy Future for All: Directions for the WBG’s Energy Sector
“The WBG will provide financial support for greenfield coal power generation projects only in rare circumstances. Considerations such as meeting basic energy needs in countries with no feasible alternatives to coal and a lack of financing for coal power would define such rare cases. The “Criteria for Screening Coal Projects under the Strategic Framework for Development and Climate Change” will apply to all greenfield coal power projects undertaken in such exceptional circumstances.” (pp. V-VI)
Special Study: Review of the EBRD Energy Sector Strategy – ANNEXES 14
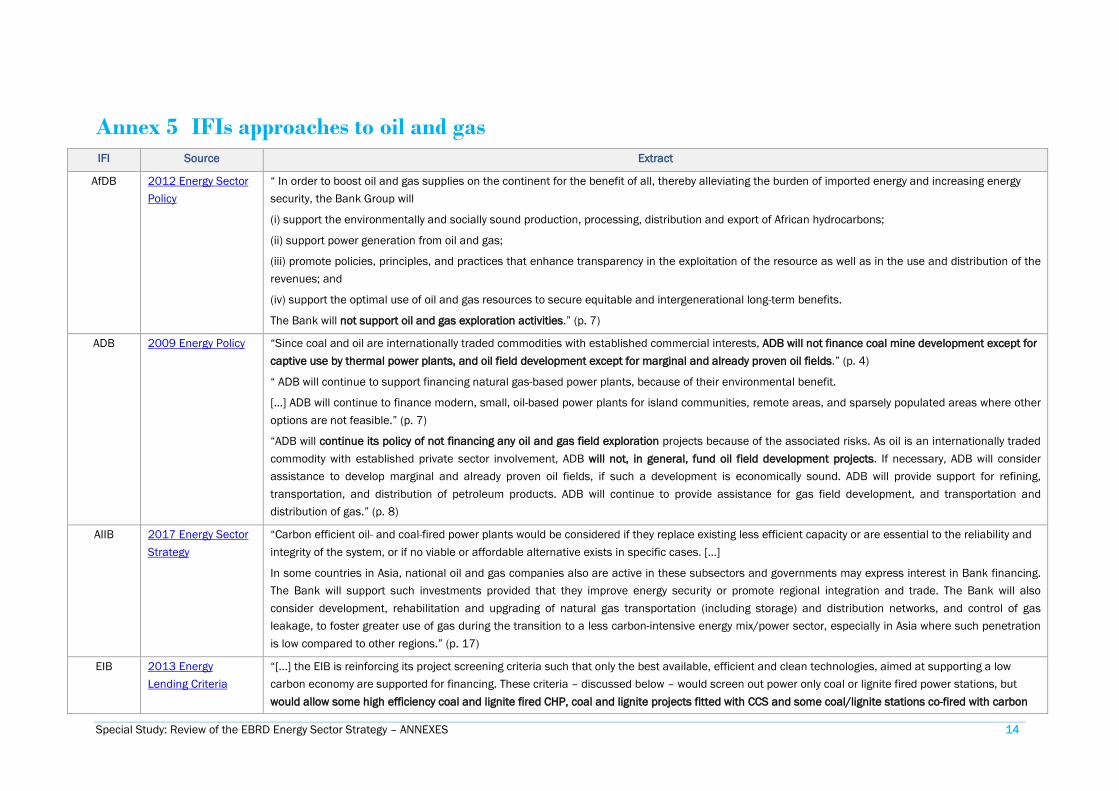
Annex 5 IFIs approaches to oil and gas IFI Source Extract
AfDB 2012 Energy Sector Policy
“ In order to boost oil and gas supplies on the continent for the benefit of all, thereby alleviating the burden of imported energy and increasing energy security, the Bank Group will
(i) support the environmentally and socially sound production, processing, distribution and export of African hydrocarbons;
(ii) support power generation from oil and gas;
(iii) promote policies, principles, and practices that enhance transparency in the exploitation of the resource as well as in the use and distribution of the revenues; and
(iv) support the optimal use of oil and gas resources to secure equitable and intergenerational long-term benefits.
The Bank will not support oil and gas exploration activities.” (p. 7)
ADB 2009 Energy Policy “Since coal and oil are internationally traded commodities with established commercial interests, ADB will not finance coal mine development except for captive use by thermal power plants, and oil field development except for marginal and already proven oil fields.” (p. 4)
“ ADB will continue to support financing natural gas-based power plants, because of their environmental benefit.
[…] ADB will continue to finance modern, small, oil-based power plants for island communities, remote areas, and sparsely populated areas where other options are not feasible.” (p. 7)
“ADB will continue its policy of not financing any oil and gas field exploration projects because of the associated risks. As oil is an internationally traded commodity with established private sector involvement, ADB will not, in general, fund oil field development projects. If necessary, ADB will consider assistance to develop marginal and already proven oil fields, if such a development is economically sound. ADB will provide support for refining, transportation, and distribution of petroleum products. ADB will continue to provide assistance for gas field development, and transportation and distribution of gas.” (p. 8)
AIIB 2017 Energy Sector Strategy
“Carbon efficient oil- and coal-fired power plants would be considered if they replace existing less efficient capacity or are essential to the reliability and integrity of the system, or if no viable or affordable alternative exists in specific cases. […]
In some countries in Asia, national oil and gas companies also are active in these subsectors and governments may express interest in Bank financing. The Bank will support such investments provided that they improve energy security or promote regional integration and trade. The Bank will also consider development, rehabilitation and upgrading of natural gas transportation (including storage) and distribution networks, and control of gas leakage, to foster greater use of gas during the transition to a less carbon-intensive energy mix/power sector, especially in Asia where such penetration is low compared to other regions.” (p. 17)
EIB 2013 Energy Lending Criteria
“[…] the EIB is reinforcing its project screening criteria such that only the best available, efficient and clean technologies, aimed at supporting a low carbon economy are supported for financing. These criteria – discussed below – would screen out power only coal or lignite fired power stations, but would allow some high efficiency coal and lignite fired CHP, coal and lignite projects fitted with CCS and some coal/lignite stations co-fired with carbon

Special Study: Review of the EBRD Energy Sector Strategy – ANNEXES 15
IFI Source Extract
neutral fuel sources (e.g. biomass) and gas fired CCGT power and CHP plants.” (p. 26)
“All fossil fuel power plants financed by the Bank:
• Must be economically justified based on a cost benefit analysis – including a carbon price which reflects the marginal damage of each unit harmful emission (e.g. CO2, NOx, SOx).
• Have CO2 emissions of less than the EPS (Emission Performance Standard), expressed in gCO2/kWh.
In addition all projects would have to comply with the principles of EU legislation, including the CCS Directive, the large combustion plant Directive, the industrial emissions Directive, and the ETS Directive, and make use of best available technology. […] The same EPS threshold will be used for Bank’s operations outside the EU […] exceptions will be made for projects outside the EU located in the poorest countries where it can be demonstrated that projects with carbon emissions above the threshold will have a significant and material positive impact on poverty alleviation and economic development.” (p.26)
“[…] the upgrading and construction of new infrastructure for the security of energy supplies, notably new gas and oil facilities, is a priority area for energy investments in the EU and for the EIB. […] The Bank adopts a very selective approach to the oil and gas upstream (extraction) and the petroleum refining sector. In particular in the refining sector, the Bank prioritises investments aiming at improving energy efficiency, meeting EU fuel specification requirements to support the development of more fuel efficient engines and increasing the production of such fuels at the expense of lower value products, without increasing the overall refining processing capacity. […]
The EIB will finance the extraction of hydrocarbons if opportunities arise, which are technically, financially and economically justified, taking into account environmental and social impacts. […]
For projects outside the EU, financing will be mandate dependent. Priority would be given to projects that aim to supply gas to the EU, support significant local economic development and poverty alleviation or generate climate action or other environmental benefits. In the operations it finances, the EIB will ensure the application of the updated Transparency Directive and Accounting directive, which build upon the Extractive Industries Transparency Initiative (EITI) endorsed by the EIB since 2008.” (p. 30)
EIB Emission Performance Standard
EPS Absolute Level The EIB has introduced an Emission Performance Standard (or EPS) of 550gCO2/kWh to screen the Bank’s investments in fossil fuel generation projects. EPS Calculation Methodology The EPS is calculated as the moving average of the ratio of annual targeted annual carbon emissions from power plants to the electricity generated by the same plants in the same year. The annual carbon emissions from power plants are calculated assuming an annual reduction consistent with the requirements of the ETS Directive (2009/29/EC).
The electricity generated by the power plants is forecasted to grow yearly at a rate consistent with the higher end of the full set of scenarios contained in the Energy Roadmap 2050.
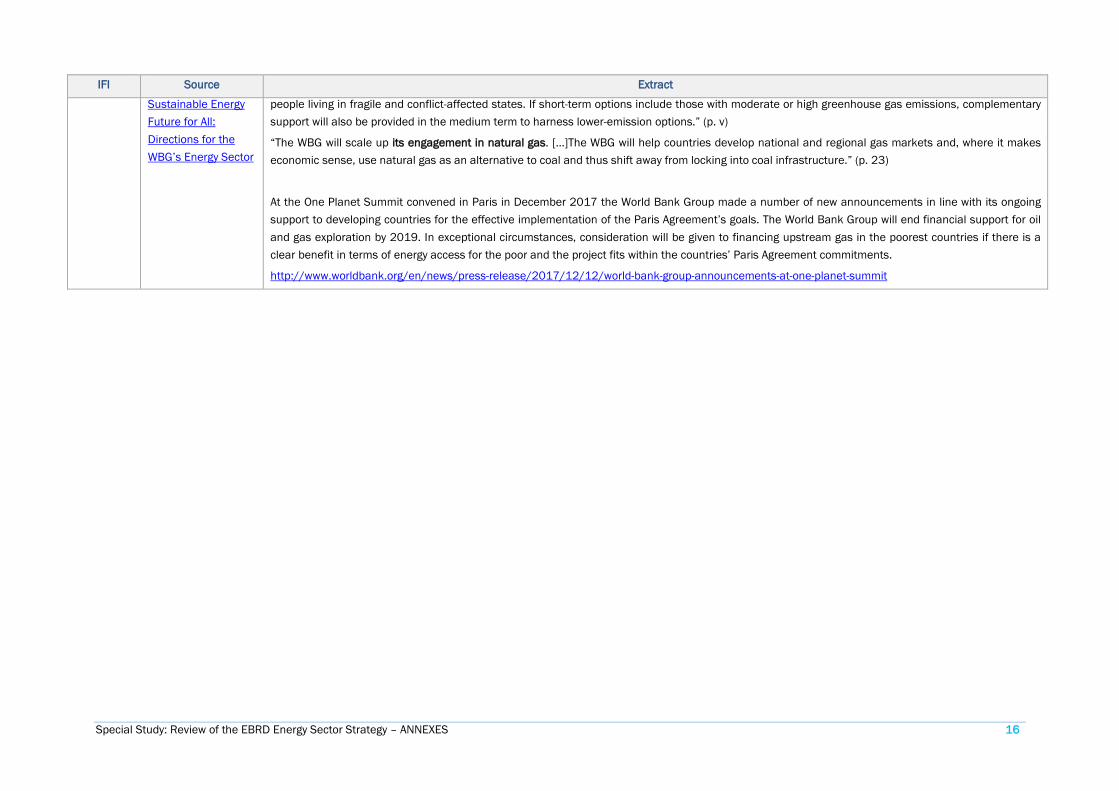
WBG Towards a “As part of a drive for universal access, financial solutions or guarantees will be made available for the most feasible energy options for the poor and for
Special Study: Review of the EBRD Energy Sector Strategy – ANNEXES 16
IFI Source Extract
Sustainable Energy Future for All: Directions for the WBG’s Energy Sector
people living in fragile and conflict-affected states. If short-term options include those with moderate or high greenhouse gas emissions, complementary support will also be provided in the medium term to harness lower-emission options.” (p. v)
“The WBG will scale up its engagement in natural gas. […]The WBG will help countries develop national and regional gas markets and, where it makes economic sense, use natural gas as an alternative to coal and thus shift away from locking into coal infrastructure.” (p. 23)
At the One Planet Summit convened in Paris in December 2017 the World Bank Group made a number of new announcements in line with its ongoing support to developing countries for the effective implementation of the Paris Agreement’s goals. The World Bank Group will end financial support for oil and gas exploration by 2019. In exceptional circumstances, consideration will be given to financing upstream gas in the poorest countries if there is a clear benefit in terms of energy access for the poor and the project fits within the countries’ Paris Agreement commitments.
http://www.worldbank.org/en/news/press-release/2017/12/12/world-bank-group-announcements-at-one-planet-summit

Special Study: Review of the EBRD Energy Sector Strategy – ANNEXES 17
Annex 6 Operational Performance Indicator Baseline and update
Below the baseline and the update to the OPIs identified in the 2013 ESS.
OPI 1 on private participation was not updated by the evaluation team due to lack of access to data.
OPI 5 on interconnections and energy trade the evaluation team updated only indicators about energy trade. It was not possible to update interconnections due to lack of access to data.
Table A. 3: OPI 2 on Cost reflective pricing
Country Pre-tax subsidies (%GDP) Post-tax subsidies (%GDP)
Baseline 2013 EvD update 2016
Baseline 2013 EvD update 2016
Albania 1% 1% 3% 3%
Armenia 0% 0% 5% 5%
Azerbaijan 3% 2% 9% 16%
Belarus 0% 0% 10% 13%
Bosnia and Herzegovina 0% 0% 38% 50%
Bulgaria 0% 0% 34% 40%
Croatia 0% 0% 3% 5%
Cyprus 0% 0% 0% 0%
Egypt 11% 5% 17% 11%
Estonia 0% 0% 0% 1%
Georgia 0% 0% 5% 7%
Greece 0% 0% 2% 4%
Hungary 0% 0% 3% 5%
Jordan 4% 2% 11% 5%
Kazakhstan 1% 2% 10% 23%
Kosovo N/A 0% N/A 0%
Kyrgyz Republic 15% 11% 35% 37%
Latvia 0% 0% 1% 2%
Lithuania 0% 0% 4% 6%
FYR Macedonia 0% 0% 18% 22%
Moldova 0% 0% 5% 7%
Mongolia 0% 0% 15% 26%
Montenegro 0% 0% 16% 22%
Morocco 0% 0% 4% 3%
Poland 0% 0% 9% 13%
Romania 0% 0% 7% 8%
Russia 2% 3% 15% 27%
Serbia 0% 0% 34% 41%
Slovak Republic 0% 0% 3% 4%
Slovenia 0% 0% 2% 3%
Tajikistan 3% 5% 6% 11%
Tunisia 3% 3% 6% 5%

Special Study: Review of the EBRD Energy Sector Strategy – ANNEXES 18
Country Pre-tax subsidies (%GDP) Post-tax subsidies (%GDP)
Baseline 2013 EvD update 2016
Baseline 2013 EvD update 2016
Turkey 0% 0% 4% 5%
Turkmenistan 16% 18% 29% 40%
Ukraine 5% 9% 51% 96%
Uzbekistan 18% 12% 34% 28% Subsidies: IMF Energy Subsidy Template, dated December 2015
GDP data: https://data.worldbank.org/indicator/NY.GDP.MKTP.CD?end=2016&start=2013
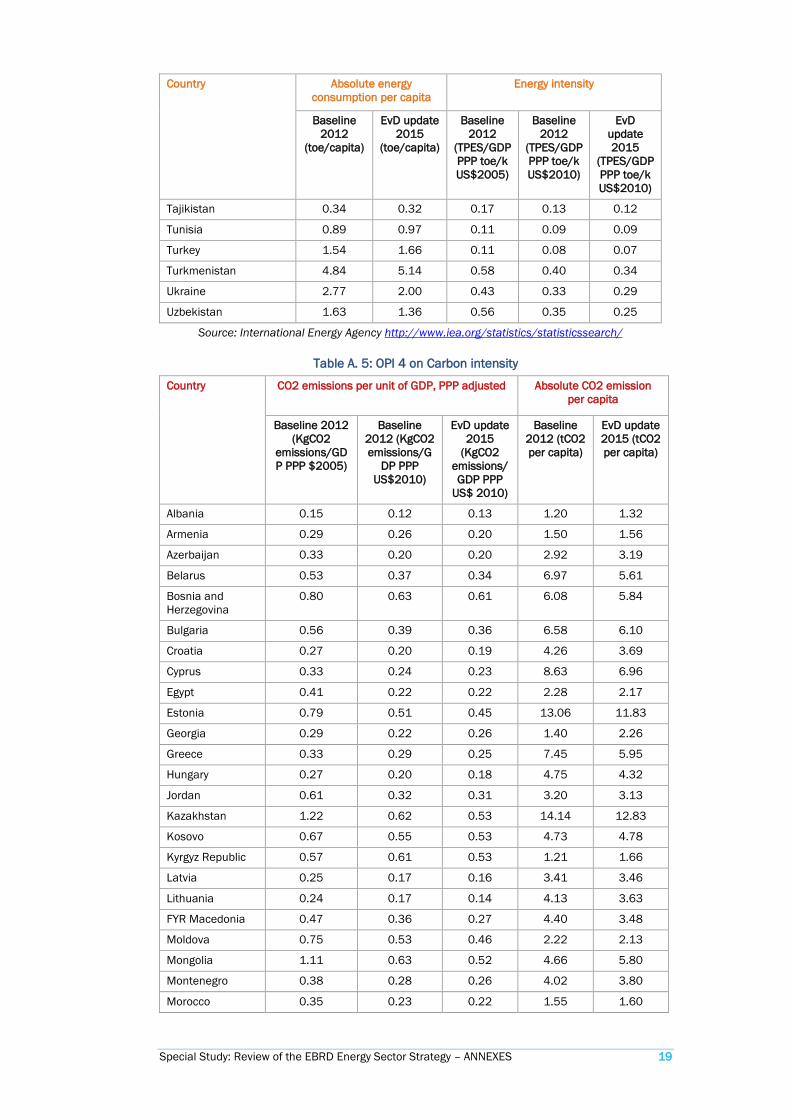
Table A. 4: OPI 3 on Energy Efficiency
Country Absolute energy consumption per capita
Energy intensity
Baseline 2012
(toe/capita)
EvD update 2015
(toe/capita)
Baseline 2012
(TPES/GDP PPP toe/k US$2005)
Baseline 2012
(TPES/GDP PPP toe/k US$2010)
EvD update 2015
(TPES/GDP PPP toe/k US$2010)
Albania 0.68 0.76 0.09 0.07 0.07
Armenia 0.88 1.02 0.17 0.14 0.13
Azerbaijan 1.37 1.49 0.15 0.09 0.09
Belarus 3.11 2.66 0.24 0.19 0.16
Bosnia and Herzegovina 1.89 2.11 0.25 0.19 0.22
Bulgaria 2.57 2.59 0.22 0.16 0.15
Croatia 1.91 2.00 0.12 0.11 0.10
Cyprus 2.95 2.38 0.11 0.08 0.08
Egypt 0.94 0.87 0.17 0.09 0.09
Estonia 4.27 4.13 0.23 0.17 0.16
Georgia 0.79 1.25 0.16 0.13 0.14
Greece 2.45 2.14 0.11 0.10 0.09
Hungary 2.36 2.56 0.14 0.11 0.11
Jordan 1.14 1.14 0.22 0.11 0.11
Kazakhstan 4.72 4.45 0.41 0.20 0.19
Kosovo 1.41 1.40 0.20 0.16 0.16
Kyrgyz Republic 0.56 0.67 0.27 0.26 0.21
Latvia 1.97 2.16 0.14 0.11 0.10
Lithuania 2.28 2.49 0.13 0.11 0.10
FYR Macedonia 1.51 1.29 0.16 0.12 0.10
Moldova 0.94 0.95 0.31 0.24 0.20
Mongolia 1.29 1.67 0.31 0.17 0.15
Montenegro 1.83 1.62 0.17 0.13 0.11
Morocco 0.54 0.56 0.12 0.08 0.08
Poland 2.51 2.47 0.14 0.11 0.10
Romania 1.68 1.61 0.15 0.10 0.08
Russia 5.15 4.93 0.35 0.23 0.23
Serbia 2.23 2.08 0.23 0.17 0.17
Slovak Republic 3.06 3.02 0.14 0.12 0.11
Slovenia 3.47 3.19 0.14 0.13 0.11
Special Study: Review of the EBRD Energy Sector Strategy – ANNEXES 19
Country Absolute energy consumption per capita
Energy intensity
Baseline 2012
(toe/capita)
EvD update 2015
(toe/capita)
Baseline 2012
(TPES/GDP PPP toe/k US$2005)
Baseline 2012
(TPES/GDP PPP toe/k US$2010)
EvD update 2015
(TPES/GDP PPP toe/k US$2010)
Tajikistan 0.34 0.32 0.17 0.13 0.12
Tunisia 0.89 0.97 0.11 0.09 0.09
Turkey 1.54 1.66 0.11 0.08 0.07
Turkmenistan 4.84 5.14 0.58 0.40 0.34
Ukraine 2.77 2.00 0.43 0.33 0.29
Uzbekistan 1.63 1.36 0.56 0.35 0.25
Source: International Energy Agency http://www.iea.org/statistics/statisticssearch/
Table A. 5: OPI 4 on Carbon intensity
Country CO2 emissions per unit of GDP, PPP adjusted Absolute CO2 emission per capita
Baseline 2012 (KgCO2
emissions/GDP PPP $2005)
Baseline 2012 (KgCO2 emissions/G
DP PPP US$2010)
EvD update 2015
(KgCO2 emissions/ GDP PPP
US$ 2010)
Baseline 2012 (tCO2 per capita)
EvD update 2015 (tCO2 per capita)
Albania 0.15 0.12 0.13 1.20 1.32
Armenia 0.29 0.26 0.20 1.50 1.56
Azerbaijan 0.33 0.20 0.20 2.92 3.19
Belarus 0.53 0.37 0.34 6.97 5.61
Bosnia and Herzegovina
0.80 0.63 0.61 6.08 5.84
Bulgaria 0.56 0.39 0.36 6.58 6.10
Croatia 0.27 0.20 0.19 4.26 3.69
Cyprus 0.33 0.24 0.23 8.63 6.96
Egypt 0.41 0.22 0.22 2.28 2.17
Estonia 0.79 0.51 0.45 13.06 11.83
Georgia 0.29 0.22 0.26 1.40 2.26
Greece 0.33 0.29 0.25 7.45 5.95
Hungary 0.27 0.20 0.18 4.75 4.32
Jordan 0.61 0.32 0.31 3.20 3.13
Kazakhstan 1.22 0.62 0.53 14.14 12.83
Kosovo 0.67 0.55 0.53 4.73 4.78
Kyrgyz Republic 0.57 0.61 0.53 1.21 1.66
Latvia 0.25 0.17 0.16 3.41 3.46
Lithuania 0.24 0.17 0.14 4.13 3.63
FYR Macedonia 0.47 0.36 0.27 4.40 3.48
Moldova 0.75 0.53 0.46 2.22 2.13
Mongolia 1.11 0.63 0.52 4.66 5.80
Montenegro 0.38 0.28 0.26 4.02 3.80
Morocco 0.35 0.23 0.22 1.55 1.60

Special Study: Review of the EBRD Energy Sector Strategy – ANNEXES 20
Country CO2 emissions per unit of GDP, PPP adjusted Absolute CO2 emission per capita
Baseline 2012 (KgCO2
emissions/GDP PPP $2005)
Baseline 2012 (KgCO2 emissions/G
DP PPP US$2010)
EvD update 2015
(KgCO2 emissions/ GDP PPP
US$ 2010)
Baseline 2012 (tCO2 per capita)
EvD update 2015 (tCO2 per capita)
Poland 0.43 0.35 0.30 7.79 7.34
Romania 0.35 0.23 0.18 3.82 3.51
Russia 0.79 0.49 0.47 11.65 10.19
Serbia 0.70 0.52 0.51 6.86 6.27
Slovak Republic 0.30 0.22 0.19 6.22 5.43
Slovenia 0.30 0.27 0.22 7.43 6.22
Tajikistan 0.21 0.17 0.20 0.43 0.51
Tunisia 0.24 0.21 0.21 1.98 2.28
Turkey 0.29 0.21 0.18 3.86 4.10
Turkmenistan 1.45 1.01 0.85 12.06 12.86
Ukraine 0.98 0.73 0.60 6.24 4.20
Uzbekistan 1.29 0.78 0.55 3.76 3.05 Source: International Energy Agency http://www.iea.org/statistics/statisticssearch/
Table A. 6: OPI 5 on Energy trade
Country Energy export over total energy production
Energy imports over total energy consumption
Baseline 2011
EvD update 2015
Baseline 2011 EvD update 2015
Albania 54% 60.1% 69% 69.2%
Armenia 25% 20.6% 77% 73.3%
Azerbaijan 79% 76.2% 0% 2.0%
Belarus 410% 543.4% 143% 161.3%
Bosnia and Herzegovina 27% 21.9% 51% 41.9%
Bulgaria 38% 49.1% 62% 69.1%
Croatia 55% 69.0% 80% 85.8%
Cyprus N/A 19.8% 112% 122.1%
Egypt 25% 22.0% 16% 32.7%
Estonia 22% 36.9% 34% 47.8%
Georgia 13% 30.6% 74% 82.2%
Greece 104% 194.6% 111% 150.3%
Hungary 45% 39.7% 73% 71.7%
Jordan 3% 1.4% 97% 101.5%
Kazakhstan 59% 57.3% 13% 9.6%
Kosovo 13% 3.5% 37% 30.0%
Kyrgyz Republic 21% 12.6% 70% 70.4%
Latvia 63% 91.4% 96% 105.7%
Lithuania 541% 488.0% 195% 200.9%
FYR Macedonia 22% 13.2% 58% 59.1%
Moldova 12% 4.6% 98% 91.0%

Special Study: Review of the EBRD Energy Sector Strategy – ANNEXES 21
Country Energy export over total energy production
Energy imports over total energy consumption
Baseline 2011
EvD update 2015
Baseline 2011 EvD update 2015
Mongolia 84% 73.1% 30% 26.2%
Montenegro 10% 13.0% 43% 39.4%
Morocco 121% 26.3% 106% 99.3%
Poland 23% 30.9% 48% 52.4%
Romania 16% 22.8% 33% 36.0%
Russia 46% 47.2% 4% 3.9%
Serbia 9% 13.5% 36% 37.7%
Slovak Republic 75% 86.7% 89% 94.3%
Slovenia 44% 74.0% 73% 87.6%
Tajikistan 3% 6.2% 39% 34.7%
Tunisia 42% 41.6% 57% 69.3%
Turkey 25% 27.1% 82% 87.1%
Turkmenistan 61% 65.4% 0% 0.0%
Ukraine 12% 2.3% 46% 35.0%
Uzbekistan 19% 25.7% 3% 2.3% Source: International Energy Agency http://www.iea.org/statistics/statisticssearch/
OPIs analysis
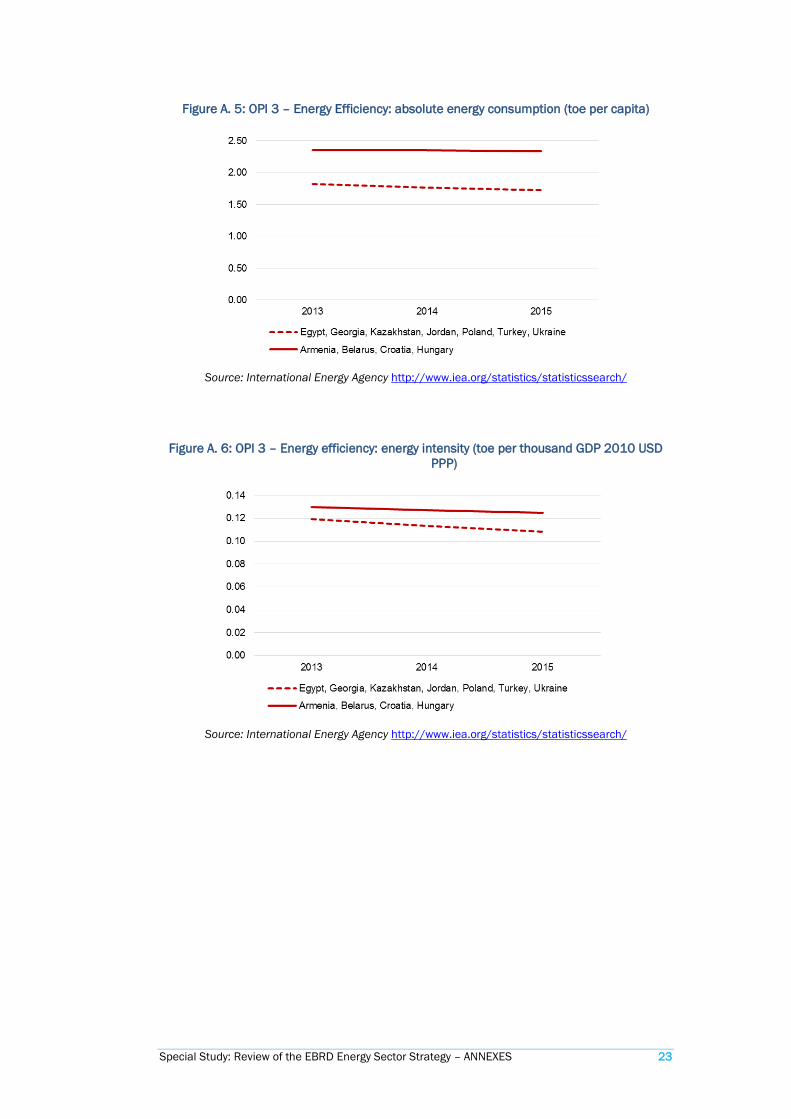
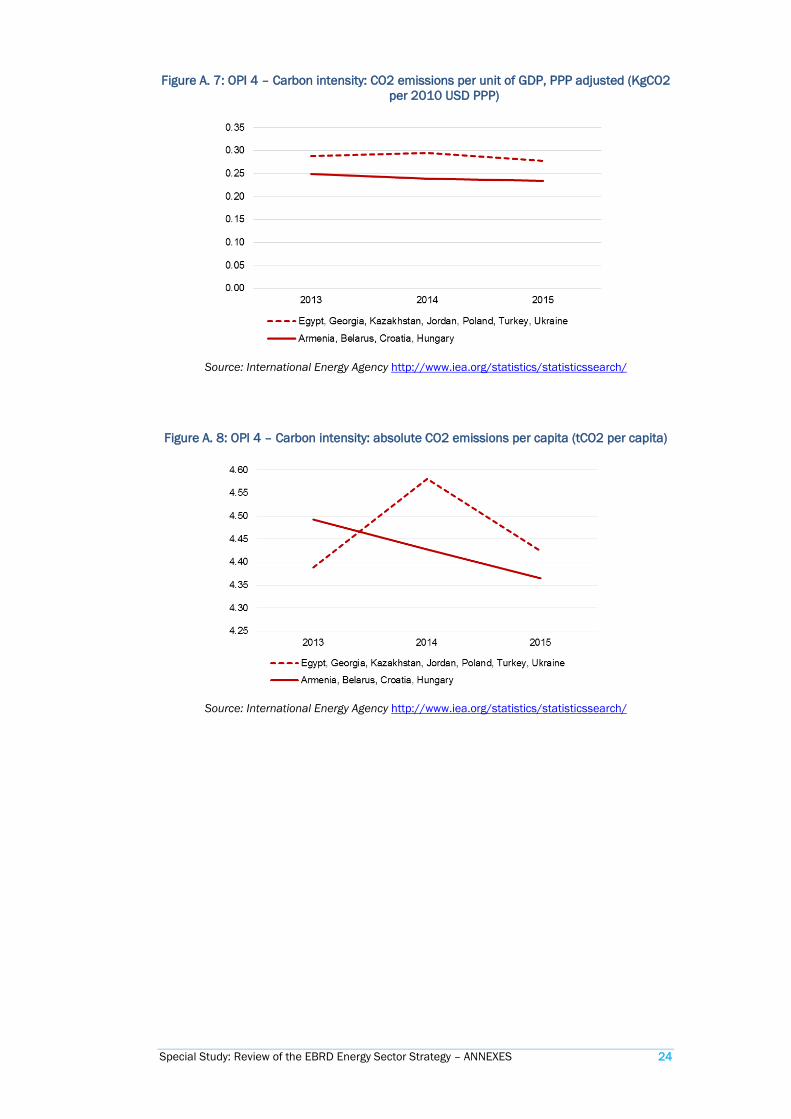
In order to make some considerations about the updated OPIs, the evaluation team has looked at those that could be aggregated (OPIs 2, 3 and 4) in the seven countries that absorbed most of the EBRD’s investments (Egypt, Georgia, Kazakhstan, Jordan, Poland, Turkey and Ukraine)14 versus the same OPIs in countries where the Bank did not perform any investment (Armenia, Belarus, Croatia and Hungary). The timeframe for comparison is the one overlapping with the ESS, since end 2013.
This analysis reveals that for both group of countries (with or without EBRD’s interventions) the indicators show similar results. The graphs below show no significant difference in the trends between the countries where EBRD operated versus where EBRD did not operate.
The analysis confirms that the OPIs identified in the ESS are not adequate to assess the contribution of EBRD’s operations approved – as indicated in the ESS “it does not expect necessarily to be able to show clear causal links between its activities and these indicators.”
14 The seven countries together count for 60% of the total volume (€2.7 billion) and 49% in terms of number of operations (41)

Special Study: Review of the EBRD Energy Sector Strategy – ANNEXES 22
Figure A. 3: OPI 2 – Pre-tax subsidies (% of GDP)
Subsidies: IMF Energy Subsidy Template, dated December 2015
GDP data: https://data.worldbank.org/indicator/NY.GDP.MKTP.CD?end=2016&start=2013
Figure A. 4: OPI 2 – Post-tax subsidies (% of GDP)
Subsidies: IMF Energy Subsidy Template, dated December 2015
GDP data: https://data.worldbank.org/indicator/NY.GDP.MKTP.CD?end=2016&start=2013
Special Study: Review of the EBRD Energy Sector Strategy – ANNEXES 23
Figure A. 5: OPI 3 – Energy Efficiency: absolute energy consumption (toe per capita)
Source: International Energy Agency http://www.iea.org/statistics/statisticssearch/
Figure A. 6: OPI 3 – Energy efficiency: energy intensity (toe per thousand GDP 2010 USD PPP)
Source: International Energy Agency http://www.iea.org/statistics/statisticssearch/
Special Study: Review of the EBRD Energy Sector Strategy – ANNEXES 24
Figure A. 7: OPI 4 – Carbon intensity: CO2 emissions per unit of GDP, PPP adjusted (KgCO2 per 2010 USD PPP)
Source: International Energy Agency http://www.iea.org/statistics/statisticssearch/
Figure A. 8: OPI 4 – Carbon intensity: absolute CO2 emissions per capita (tCO2 per capita)
Source: International Energy Agency http://www.iea.org/statistics/statisticssearch/

Special Study: Review of the EBRD Energy Sector Strategy – ANNEXES 25
Annex 7 Data analysis Data considered are operations approved by the EBRD Board from December 2013 (when the ESS was approved) until April 2017. The population considered refers only to the supply-side of energy, hence with the portfolio of the Energy Business Group (EBG), with the exclusion of extractive industries operations.
Information about investments and other activities implemented after April 2017 or before December 2013 have been used when relevant or to allow comparisons over time.
Financial Frameworks
From December 2013 until April 2017, the EBRD Board of Directors has approved seven financial frameworks, including one Integrated Approach, as listed below. One framework has been cancelled.
Table A.7: EBG Financial Frameworks approved by the EBRD Board (Dec 2013-Apr 2017) in chronological order
Framework FW OPID
Board approv
al
Banking team
Country EBRD finance
approved
Status (Sub-) operation
s approved
*
IA: Integrated Approach to Polish Renewables (IAPR)
46289 15 Oct 2014
Power & Energy
Poland €400 million**
Active 5 (signed)
Genesis Framework
47091 28 Jan 2015
Power & Energy
Poland €250 million
Cancelled 2 (cancelled
)
SEMED Private Renewable Energy Framework (SPREF)
46907 14 Oct 2015
Power & Energy
Regional US$ 250 million
Active 2 (1 not signed
yet)
PLUTO - Early stage geothermal support framework
46809 09 Dec 2015
Power & Energy
Turkey US$ 100 million
Active 2 (1 signed)
Georgian Low Carbon Framework (GLCF)
48124 16 Dec 2015
Power & Energy
Georgia US$ 120 million
Active 2 (1 signed)
Kazakhstan Renewables Framework (KAZREF)
48919 14 Dec 2016
Power & Energy
Kazakhstan
€200 million
Active 2 (signed)
Greek Renewable Energy Framework (GREF)
49024 08 Mar 2017
Power & Energy
Greece €300 million
Active 1
Source: DTM *As of December 2017. Operations approved as part of Integrated Approach Financial Frameworks are classified as stand-alone, not sub-operations. **differently from other financial frameworks, in the case of Integrated Approach the envelope of investments is indicatively approved, but resources are not committed as each operation is required to be Board approved (no delegation of authority as for standard sub-operations of financial frameworks)

Special Study: Review of the EBRD Energy Sector Strategy – ANNEXES 26
It is also worth mentioning other two frameworks approved by the Board by end 2017, namely:
− Integrated Approach to Economic Inclusion in Natural Resources and Power15 to address substantial inclusion gaps in relation to youth and gender in Kazakhstan through a set of measurable and achievable project and policy level inclusion transition goals in Natural Resources and Power & Energy. It consists of two stages with a total envelope of US$ 1 billion. As of end 2017, two operations under the Integrated Approach have been signed.16
− Egypt Renewable Feed-In-Tariff Framework17 which consists of EBRD debt financing for multiple loans to private developers to construct and operate renewable energy generation projects in Egypt under the Feed-In-Tariff Scheme. The Board approved an envelope of US$ 500 million. As of end 2017, 16 sub-operations have been signed.
Standalone and sub-operations
In the timeframe December 2013-April 2017 the EBRD Board approved 85 operations eventually signed. Out of those, as of end 2017, one was cancelled.18 Therefore the total population under consideration is composed by 84 operations.
Figure A. 9: Energy Business Group NCBI per country (Dec 2013 – Apr 2017)
Source: EvD elaboration based on DTM
15 Approved on 4th May 2017 (OPID 49219) 16 Kyzyl Project (OPID 48218) approved in May 2017 and signed in June 2017 – senior loan of US$ 140 million for the development of the Kyzyl gold project in Kazakhstan; Shalkiya Zinc: Pre-Privatization Loan (OPID 48347) approved and signed in June 2017 – loan of US$ 175 million to support the pre-privatisation efforts in expanding operations of the existing Shalkiya zinc-lead mine located in the Kyzylorda region and construction of a 4 million tonnes per annum processing plant at the site 17 Approved on 7th June 2017 (OPID 48213) 18 Egypt: Damanhour CCGT(OPID 47336) approved and signed in November 2015, sovereign loan of up to US$ 200 million to finance the construction of a combined cycle power plant in Damanhour City. The project was cancelled in March 2017 as it was no longer considered a priority by the Egyptian Government due to a successful completion of the investment programme addressing the electricity shortage in the country and was moved to 2022-2027 investment plan.

Special Study: Review of the EBRD Energy Sector Strategy – ANNEXES 27
Table A. 8: EBG operations approved and signed (Dec 2013-Apr 2017)
Sector Team NCBI (€ million) % # of operations
Average size (€ million)
Natural Resources 1,721 37.8% 23 75 Debt 1,721 37.8% 23 75
Power & Energy 2,831 62.2% 61 46 Debt 2,650 58.2% 59 45
Equity 180 4.0% 2 90 TOTAL 4,551 100% 84 54
Source: DTM
In the same timeframe the EBRD approved 949 investments for a total amount of €24,128,913,558, thus making count the energy supply-side operations (exclusive of the ore mining projects) its 8.9% of it in terms of number of projects, and 18.9% in terms of volume.
Table A. 9: Portfolio class of the EBG operations approved and signed (Dec 2013-Apr 2017)
Class Natural Resources Power & Energy TOTAL
Private 19 41 60 State 4 20 24 TOTAL 23 61 84
Source: DTM
Figure A. 10: Volume (€) and Number of EBG operations approved (Dec 2013 – Apr 2017)
Source: EvD elaboration based on DTM

Special Study: Review of the EBRD Energy Sector Strategy – ANNEXES 28
Figure A. 11: Country distribution of EBG operations approved (Dec 2013 – Apr 2017) in million €
Source: EvD elaboration based on DTM
In terms of transition impact, an operation can address more than one source of transition impact. The transition impact sources are:
− TI sources 1: “Greater competition in the project sector” − TI sources 2: “Competitive market interactions in other sectors” − TI sources 3: “More widespread private ownership” − TI sources 4: “Institutions, laws and policies that promote market functioning and
efficiency” − TI sources 5: “Transfer and dispersion of skills” − TI sources 6: “Demonstration of new replicable behaviour and activities” − TI sources 7: “Setting standards for corporate governance and business conduct”

Special Study: Review of the EBRD Energy Sector Strategy – ANNEXES 29
Table A. 10: Transition impact source for EBG operations approved Dec2013-Apr2017
Country Source 1
Source 2
Source 3
Source 4
Source 5
Source 6
Source 7
# ops
Albania 1
Azerbaijan 2
Bosnia and Herzegovina
2
Bulgaria 2
Estonia 2
FYRoM 1
Egypt 6
Georgia 5
Greece 3
Jordan 8
Kazakhstan 8
Kosovo 1
Kyrgyz R 1
Moldova 1
Mongolia 1
Montenegro 1
Morocco 2
Poland 4
Romania 4
Serbia 1
Tajikistan 2
Tunisia 1
Turkey 9
Ukraine 6
TOTAL 3 13 32 26 8 54 56 Source: EvD elaboration based on projects’ documentation
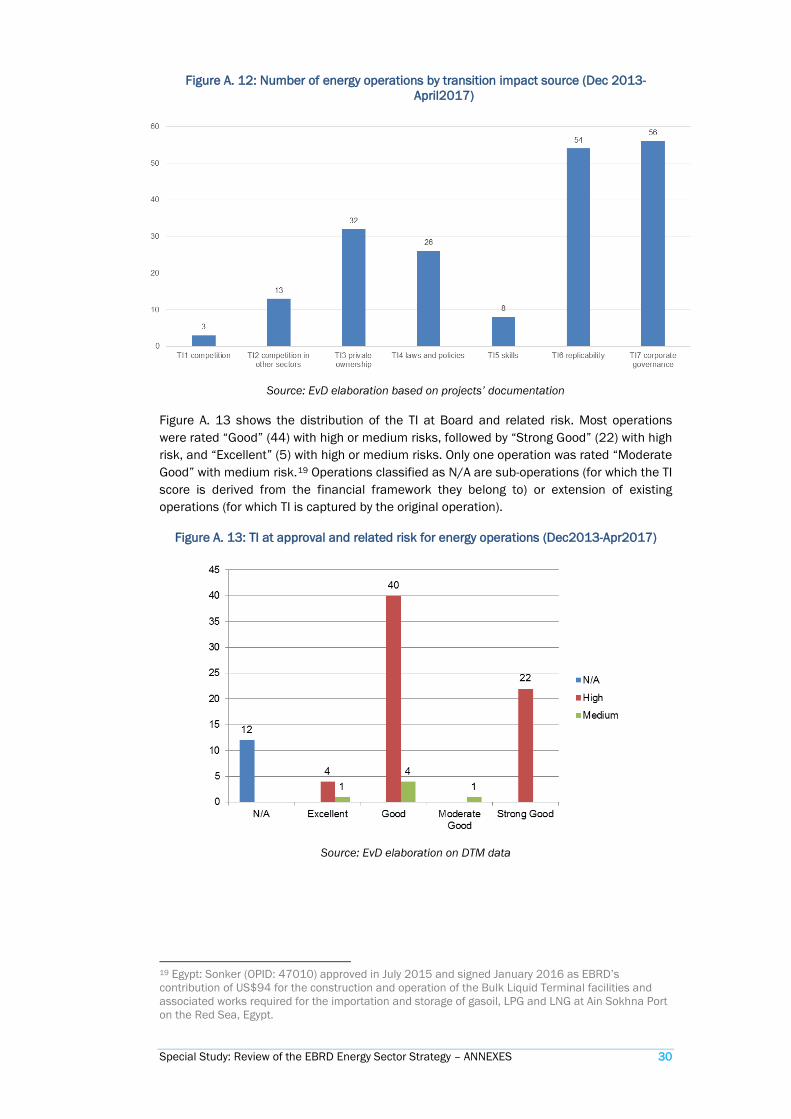
Figure A. 12 shows to which transition impact (TI) source the operations were aimed to address at approval. Most operations are associated to more than one TI source.
The TI sources more used are: TI source 6 (Demonstration of new replicable behaviour and activities) and TI source 7 (Setting standards for corporate governance and business conduct).
Special Study: Review of the EBRD Energy Sector Strategy – ANNEXES 30
Figure A. 12: Number of energy operations by transition impact source (Dec 2013-April2017)
Source: EvD elaboration based on projects’ documentation
Figure A. 13 shows the distribution of the TI at Board and related risk. Most operations were rated “Good” (44) with high or medium risks, followed by “Strong Good” (22) with high risk, and “Excellent” (5) with high or medium risks. Only one operation was rated “Moderate Good” with medium risk.19 Operations classified as N/A are sub-operations (for which the TI score is derived from the financial framework they belong to) or extension of existing operations (for which TI is captured by the original operation).
Figure A. 13: TI at approval and related risk for energy operations (Dec2013-Apr2017)
Source: EvD elaboration on DTM data
19 Egypt: Sonker (OPID: 47010) approved in July 2015 and signed January 2016 as EBRD’s contribution of US$94 for the construction and operation of the Bulk Liquid Terminal facilities and associated works required for the importation and storage of gasoil, LPG and LNG at Ain Sokhna Port on the Red Sea, Egypt.

Special Study: Review of the EBRD Energy Sector Strategy – ANNEXES 31
Figure A. 14: SEI/SRI/GET share of SEI/SRI/GET qualified EBG operations approved Dec2013-Apr2017
Source: EvD elaboration of Energy Efficiency and Climate Change data
Figure A. 15: Primary energy savings toe/year from EBRD’s operations (2014-2016)
Source: EvD elaboration of Energy Efficiency and Climate Change team
data

Special Study: Review of the EBRD Energy Sector Strategy – ANNEXES 32
Comparing 2011-2013 with 2014-16 energy sector operations approved by the Board
Figure A. 16: Portfolio class EBG operations 2011-2016 (€M)
Figure A. 17: Portfolio class EBG operations 2011-2016 (%)
Source: EvD elaboration of DTM data
Figure A. 18: EBRD finance, private syndication, special funds finance, co-finance and other external finance over total project value (approvals 2011-16) in € million
Source: EvD elaboration of DTM data
Special Study: Review of the EBRD Energy Sector Strategy – ANNEXES 33
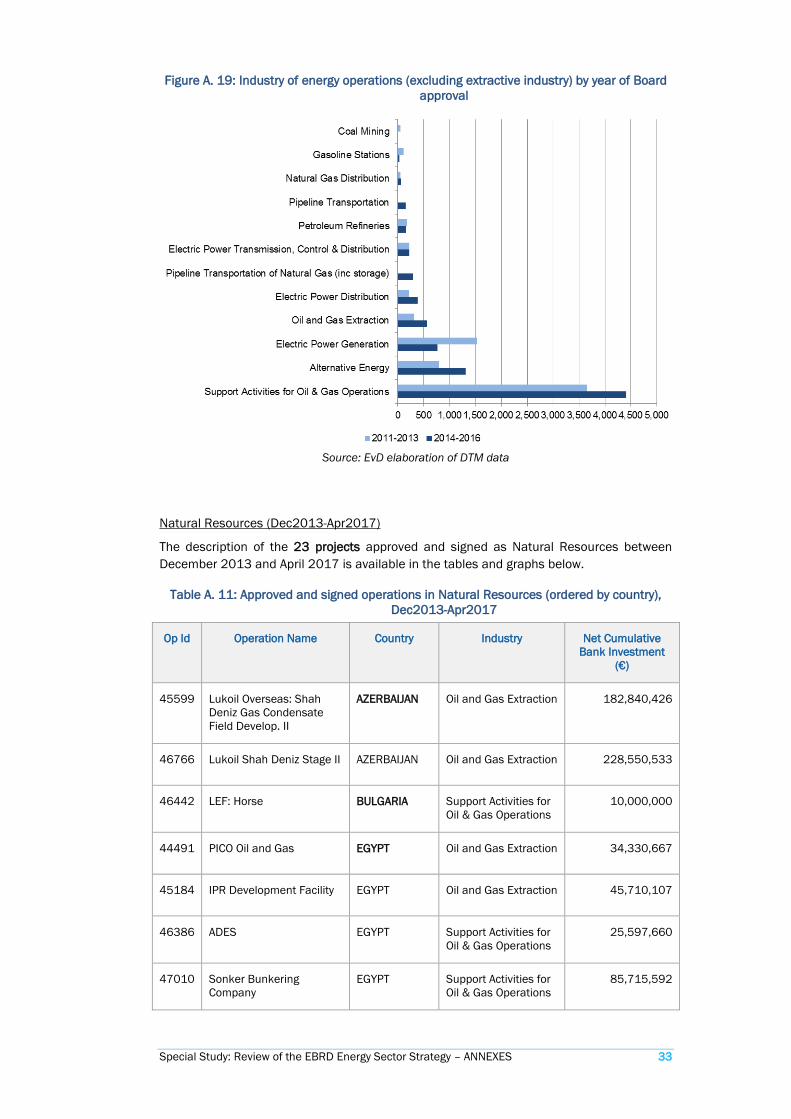
Figure A. 19: Industry of energy operations (excluding extractive industry) by year of Board approval
Source: EvD elaboration of DTM data
Natural Resources (Dec2013-Apr2017)
The description of the 23 projects approved and signed as Natural Resources between December 2013 and April 2017 is available in the tables and graphs below.
Table A. 11: Approved and signed operations in Natural Resources (ordered by country), Dec2013-Apr2017
Op Id Operation Name Country Industry Net Cumulative Bank Investment
(€)
45599 Lukoil Overseas: Shah Deniz Gas Condensate Field Develop. II
AZERBAIJAN Oil and Gas Extraction 182,840,426
46766 Lukoil Shah Deniz Stage II AZERBAIJAN Oil and Gas Extraction 228,550,533
46442 LEF: Horse BULGARIA Support Activities for Oil & Gas Operations
10,000,000
44491 PICO Oil and Gas EGYPT Oil and Gas Extraction 34,330,667
45184 IPR Development Facility EGYPT Oil and Gas Extraction 45,710,107
46386 ADES EGYPT Support Activities for Oil & Gas Operations
25,597,660
47010 Sonker Bunkering Company
EGYPT Support Activities for Oil & Gas Operations
85,715,592

Special Study: Review of the EBRD Energy Sector Strategy – ANNEXES 34
Op Id Operation Name Country Industry Net Cumulative Bank Investment
(€)
47177 Merlon Petroleum EGYPT Oil and Gas Extraction 28,645,000
45286 VKG Energy Efficiency ESTONIA Petroleum Refineries 20,240,122
45236 Wissol Petroleum Georgia GEORGIA Gasoline Stations 22,855,053
45237 MCFF - TBC Bank Wissol Petroleum III
GEORGIA Gasoline Stations 2,285,505
47822 Energean Oil GREECE Support Activities for Oil & Gas Operations
68,565,160
48358 Energean II GREECE Oil and Gas Extraction 18,284,043
46043 Petrom Kazakhstan KAZAKHSTAN Oil and Gas Extraction 64,908,351
48356 Bozoi Gas Storage Facility KAZAKHSTAN Pipeline Transportation of Natural Gas (inc storage)
256,340,441
45631 MCFF - KICB Standard Oil KYRGYZ REPUBLIC
Gasoline Stations 1,325,593
48769 UCNGP MOLDOVA Pipeline Transportation of Natural Gas (inc storage)
41,000,000
44754 DIF - Sharyn Gol MONGOLIA Coal Mining 4,571,011
47182 LEF: Winstar ROMANIA Oil and Gas Extraction 10,312,200
47073 Balpet Gasoline Stations TURKEY Gasoline Stations 7,280,000
48256 TUPRAS Resource Efficiency Loan
TURKEY Petroleum Refineries 137,130,320
42608 NAK Naftogaz Emergency Pipeline Upgrade and Modernisation
UKRAINE Pipeline Transportation
150,000,000
47283 Naftogaz Gas Purchase Facility
UKRAINE Support Activities for Oil & Gas Operations
274,260,639
Source: DTM

Special Study: Review of the EBRD Energy Sector Strategy – ANNEXES 35
Table A. 12: Natural Resources – country distribution per industry (Dec 2013-Apr 2017)
Industry Op # NCBI (€) % total volume
Average size (€)
Oil and Gas Extraction 8 613,581,326 35.7% 76,697,666
Azerbaijan 2 411,390,959 23.9%
Egypt 3 108,685,774 6.3%
Greece 1 18,284,043 1.1%
Kazakhstan 1 64,908,351 3.8%
Romania 1 10,312,200 0.6%
Support Activities for Oil & Gas Operations
5 464,139,050 27.0% 92,827,810
Bulgaria 1 10,000,000 0.6%
Egypt 2 111,313,251 6.5%
Greece 1 68,565,160 4.0%
Ukraine 1 274,260,639 15.9%
Pipeline Transportation of Natural Gas (inc storage)
2 297,340,441 17.3% 148,670,220
Kazakhstan 1 256,340,441 14.9%
Moldova 1 41,000,000 2.4%
Petroleum Refineries 2 157,370,442 9.1% 78,685,221
Estonia 1 20,240,122 1.2%
Turkey 1 137,130,320 8.0%
Pipeline Transportation (Ukraine) 1 150,000,000 8.7% 150,000,000
Gasoline Stations 4 33,746,152 2.0% 8,436,538
Georgia 2 25,140,559 1.5%
Kyrgyz Republic 1 1,325,593 0.1%
Turkey 1 7,280,000 0.4%
Coal Mining (Mongolia) 1 4,571,011 0.3% 4,571,011
TOTAL 23 1,720,748,421 100% 74,815,149
Source: DTM

Special Study: Review of the EBRD Energy Sector Strategy – ANNEXES 36
Figure A. 20: Natural Resources – industry distribution by number of
operations (Dec 2013 – Apr 2017)
Figure A. 21: Natural Resources – industry distribution by volume (Dec 2013 –
Apr 2017)
Source: EvD elaboration based on DTM
Table A. 13: Natural Resources – geographic distribution (Dec 2013-Apr 2017)
Region & Country Op # NCBI (€) % total Eastern Europe and Caucasus 7 901,792,156 52.4%
Azerbaijan 2 411,390,959 23.9% Georgia 2 25,140,559 1.5%
Moldova 1 41,000,000 2.4% Ukraine 2 424,260,639 24.7%
Central Asia 4 327,145,396 19.0% Kazakhstan 2 321,248,792 18.7%
Kyrgyz Republic 1 1,325,593 0.1% Mongolia 1 4,571,011 0.3%
Southern and Eastern Mediterranean 5 219,999,025 12.8% Egypt 5 219,999,025 12.8%
Turkey 2 144,410,320 8.4% Turkey 2 144,410,320 8.4%
Cyprus and Greece 2 86,849,202 5.0% Greece 2 86,849,202 5.0%
South-Eastern Europe 2 20,312,200 1.2% Bulgaria 1 10,000,000 0.6%
Romania 1 10,312,200 0.6% Central Europe and Baltics 1 20,240,122 1.2%
Estonia 1 20,240,122 1.2% TOTAL 23 1,720,748,421 100.0%
Source: EvD elaboration based on DTM

Special Study: Review of the EBRD Energy Sector Strategy – ANNEXES 37
Figure A. 22: Natural Resources - Net Cumulative Bank Investment and number of projects (Dec 2013 – Apr 2017)
Source: EvD elaboration based on DWH data
Table A. 14: Natural Resources – Transition Impact at approval (Dec 2013-Apr 2017)
TI TI Risk High Medium TOTAL
Excellent - - -
Strong Good 5 - 5 Good 10 1 11 Moderate Good - 1 1 Satisfactory - - - Marginal - - -
SUB-TOTAL 15 2 17 N/A* - - 6
TOTAL 23 Source: DTM
* 6 projects does not have TI rating because either are sub-operations in a Framework or because they are an extension of an existing operation

Special Study: Review of the EBRD Energy Sector Strategy – ANNEXES 38
Table A. 15: Natural Resources – SEI/SRI/GET and Environmental Category (Dec 2013-Apr 2017)
SEI/SRI/GET Category / Env Category
A B C None TOTAL
3 – Cleaner Energy Production 2 10 - - 12
No SEI 1 7 1 2 11
TOTAL 3 17 1 2 23 Source: DTM
Power & Energy (Dec 2013-Apr 2017)
The description of the 61 projects approved and signed classified as Power and Energy between December 2013 and April 2017 is available in the tables and graphs below.
In September 2017 the Energy Business Group re-classified the industry of nine operations from Electric Power Generation to Alternative Energy. The new classification is considered in the main report (section 4.3.3).
Table A. 16: Approved and signed operations in Power & Energy (ordered by country), Dec2013-Apr2017
Op Id Operation Country Industry Net Cumulative
Bank Investment (€)
48132 KESH Restructuring Project ALBANIA Electric Power Generation
118,000,000
47324 ISO - EMS, SCADA and IT upgrade BOSNIA AND HERZEGOVINA
Electric Power Transmission, Control & Distribution
8,500,000
47658 Elektrokrajna power distribution project
BOSNIA AND HERZEGOVINA
Electric Power Distribution
7,500,000
47632 CEZ Distribution Bulgaria BULGARIA Electric Power Distribution
69,600,000
48556 BEH Bond Issue BULGARIA Electric Power Generation
80,000,000
47520 DFF - CYPV Solar CYPRUS Alternative Energy
6,250,000
47697 DFF - TPT Solar CYPRUS Alternative Energy
4,100,000
45434 Power sector energy efficiency project
EGYPT Electric Power Generation
173,698,405
47509 Graanul Invest Phase III ESTONIA Alternative Energy
42,000,000
46274 MEPSO: FYR Macedonia-Albania Transmission Phase I
FYR MACEDONIA Electric Power Transmission, Control & Distribution
37,000,000

Special Study: Review of the EBRD Energy Sector Strategy – ANNEXES 39
Op Id Operation Country Industry Net Cumulative
Bank Investment (€)
45335 Shuakhevi HPP GEORGIA Alternative Energy*
82,141,976
45542 Dariali HPP GEORGIA Alternative Energy*
36,568,085
47164 MCFF - Bank of Georgia Pshavela SHP
GEORGIA Alternative Energy*
754,217
47431 Gori Wind Power Plant GEORGIA Alternative Energy
9,027,954
47534 RSF - TBC Bank Lukhuni 2 HPP GEORGIA Alternative Energy
5,071,408
48272 Terna Energy GREECE Alternative Energy*
50,000,000
44973 Ma'an Solar Power Project JORDAN Alternative Energy
22,855,053
46421 Oryx Solar Project Jordan JORDAN Alternative Energy*
10,584,747
46700 EJRE Solar Project Jordan JORDAN Alternative Energy
22,855,053
46701 Greenland Solar Project Jordan JORDAN Alternative Energy
11,829,949
47412 Hussein Thermal Power Station Repowering/Zarqa
JORDAN Electric Power Generation
67,469,926
48100 Al Rajef Wind Farm JORDAN Alternative Energy
63,463,337
48153 FRV Al Mafraq Solar PV Project JORDAN Alternative Energy
32,427,309
48322 ACWA Power Mafraq PV IPP JORDAN Alternative Energy
24,683,042
45618 Yereymentau Wind Farm KAZAKHSTAN Alternative Energy
40,685,453
46570 Burnoye Solar Power Plant KAZAKHSTAN Alternative Energy
40,859,819
46770 Kyzylorda Electricity Distribution Project
KAZAKHSTAN Electric Power Distribution
13,077,467
47478 Atyrau Energy Project KAZAKHSTAN Electric Power Generation
5,663,555

Special Study: Review of the EBRD Energy Sector Strategy – ANNEXES 40
Op Id Operation Country Industry Net Cumulative
Bank Investment (€)
48047 Gas Network Modernisation KAZAKHSTAN Natural Gas Distribution
58,122,076
48308 Samruk-Energy transformation loan
KAZAKHSTAN Electric Power Generation
100,000,000
45552 Kosovo Transmission Development Project
KOSOVO Electric Power Transmission, Control & Distribution
30,000,000
47118 Oshelectro Rehabilitation Project KYRGYZ REPUBLIC Electric Power Distribution
4,000,000
47949 Tsetsii Windfarm MONGOLIA Alternative Energy
22,855,053
44546 Krnovo Wind Farm MONTENEGRO Alternative Energy
48,500,000
47466 WeBSEDFF - Hydro Bistrica SHPP MONTENEGRO Alternative Energy
4,200,000
47297 Khalladi Wind Farm MOROCCO Alternative Energy
51,824,364
47379 ONEE Hydro Rehabilitation MOROCCO Alternative Energy*
35,000,000
45739 Darlowo Wind POLAND Alternative Energy
41,619,768
46645 Radzyn Wind Farm POLAND Alternative Energy
22,351,590
46962 Polenergia Wind Portfolio POLAND Alternative Energy
29,613,864
47932 Banie Wind Farm POLAND Alternative Energy
73,916,204
44601 Land Power Wind Farm ROMANIA Alternative Energy
73,426,313
46012 Transelectrica (Bond Issue) ROMANIA Electric Power Transmission, Control & Distribution
8,821,259
46271 Electrica Equity ROMANIA Electric Power Distribution
75,155,724
46630 CEZ Distribution Romania ROMANIA Electric Power Distribution
62,024,479
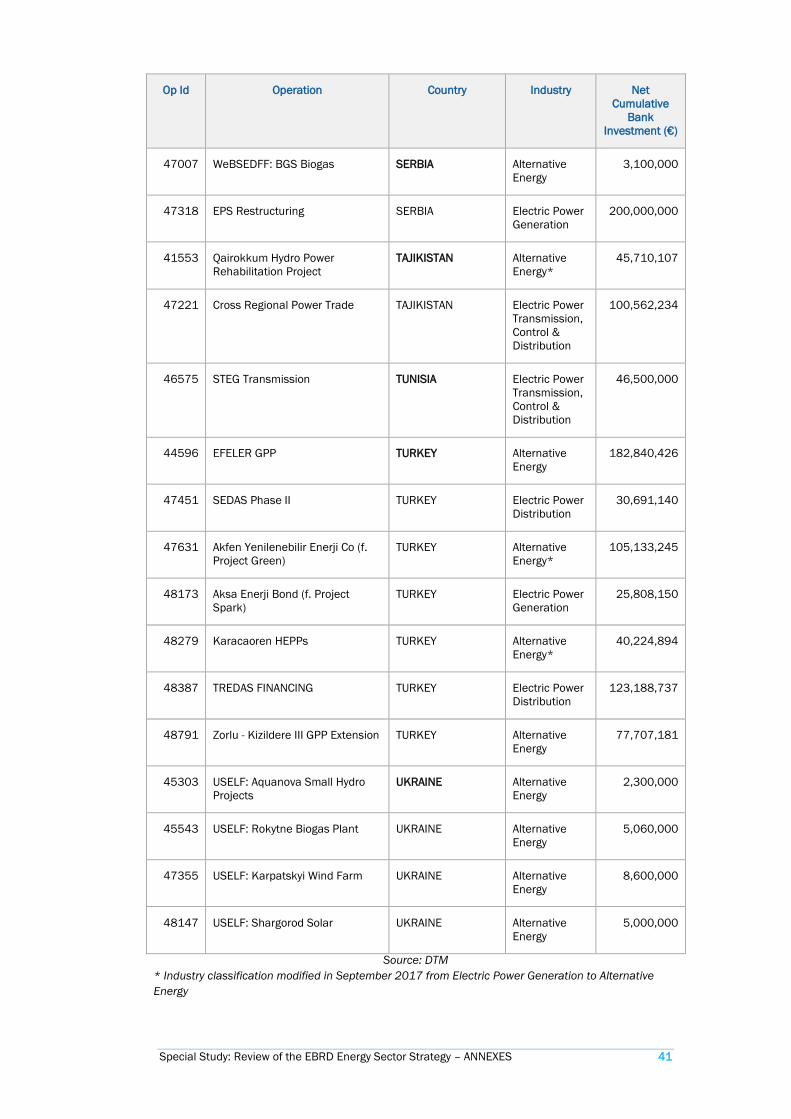
Special Study: Review of the EBRD Energy Sector Strategy – ANNEXES 41
Op Id Operation Country Industry Net Cumulative
Bank Investment (€)
47007 WeBSEDFF: BGS Biogas SERBIA Alternative Energy
3,100,000
47318 EPS Restructuring SERBIA Electric Power Generation
200,000,000
41553 Qairokkum Hydro Power Rehabilitation Project
TAJIKISTAN Alternative Energy*
45,710,107
47221 Cross Regional Power Trade TAJIKISTAN Electric Power Transmission, Control & Distribution
100,562,234
46575 STEG Transmission TUNISIA Electric Power Transmission, Control & Distribution
46,500,000
44596 EFELER GPP TURKEY Alternative Energy
182,840,426
47451 SEDAS Phase II TURKEY Electric Power Distribution
30,691,140
47631 Akfen Yenilenebilir Enerji Co (f. Project Green)
TURKEY Alternative Energy*
105,133,245
48173 Aksa Enerji Bond (f. Project Spark)
TURKEY Electric Power Generation
25,808,150
48279 Karacaoren HEPPs TURKEY Alternative Energy*
40,224,894
48387 TREDAS FINANCING TURKEY Electric Power Distribution
123,188,737
48791 Zorlu - Kizildere III GPP Extension TURKEY Alternative Energy
77,707,181
45303 USELF: Aquanova Small Hydro Projects
UKRAINE Alternative Energy
2,300,000
45543 USELF: Rokytne Biogas Plant UKRAINE Alternative Energy
5,060,000
47355 USELF: Karpatskyi Wind Farm UKRAINE Alternative Energy
8,600,000
48147 USELF: Shargorod Solar UKRAINE Alternative Energy
5,000,000
Source: DTM * Industry classification modified in September 2017 from Electric Power Generation to Alternative Energy

Special Study: Review of the EBRD Energy Sector Strategy – ANNEXES 42
Table A. 17: Power & Energy – country distribution per industry (Dec 2013-Apr 2017)
Industry Op # NCBI (€) % of total volume
Average size (€)
Alternative Energy (geothermal, ocean wave, solar, wind)
38 1,385,140,411 48.9% 36,451,063
Cyprus 2 10,350,000 0.4% 5,175,000 Estonia 1 42,000,000 1.5% 42,000,000 Georgia 5 133,563,640 4.7% 26,712,728 Greece 1 50,000,000 1.8% 50,000,000 Jordan 7 188,698,491 6.7% 26,956,927
Kazakhstan 2 81,545,272 2.9% 40,772,636 Mongolia 1 22,855,053 0.8% 22,855,053
Montenegro 2 52,700,000 1.9% 26,350,000 Morocco 2 86,824,364 3.1% 43,412,182
Poland 4 167,501,425 5.9% 41,875,356 Romania 1 73,426,313 2.6% 73,426,313
Serbia 1 3,100,000 0.1% 3,100,000 Tajikistan 1 45,710,107 1.6% 45,710,107
Turkey 4 405,905,746 14.3% 101,476,436 Ukraine 4 20,960,000 0.7% 5,240,000
Electric Power Generation 8 770,640,036 27.2% 96,330,004
Albania 1 118,000,000 4.2% 118,000,000 Bulgaria 1 80,000,000 2.8% 80,000,000
Egypt 1 173,698,405 6.1% 173,698,405 Jordan 1 67,469,926 2.4% 67,469,926
Kazakhstan 2 105,663,555 3.7% 52,831,777 Serbia 1 200,000,000 7.1% 200,000,000 Turkey 1 25,808,150 0.9% 25,808,150
Electric Power Distribution 8 385,237,547 13.6% 48,154,693
Bosnia and Herzegovina 1 7,500,000 0.3% 7,500,000 Bulgaria 1 69,600,000 2.5% 69,600,000
Kazakhstan 1 13,077,467 0.5% 13,077,467 Kyrgyz Republic 1 4,000,000 0.1% 4,000,000
Romania 2 137,180,203 4.8% 68,590,101 Turkey 2 153,879,877 5.4% 76,939,939
Electric Power Transmission, Control & Distribution
6 231,383,494 8.2% 38,563,916
Bosnia and Herzegovina 1 8,500,000 0.3% 8,500,000 FYR Macedonia 1 37,000,000 1.3% 37,000,000
Kosovo 1 30,000,000 1.1% 30,000,000 Romania 1 8,821,259 0.3% 8,821,259 Tajikistan 1 100,562,234 3.6% 100,562,234
Tunisia 1 46,500,000 1.6% 46,500,000 Natural Gas Distribution (Kazakhstan)
1 58,122,076 2.1% 58,122,076
TOTAL 61 2,830,523,563 100.0% 46,402,026 Source: EvD elaboration based on DTM

Special Study: Review of the EBRD Energy Sector Strategy – ANNEXES 43
Figure A. 23: Power & Energy – industry distribution by number of
operations (Dec 2013 – Apr 2017)
Figure A. 24: Power & Energy – industry distribution by volume (Dec 2013
– Apr 2017)
Source: EvD elaboration based on DTM
Table A. 18: Power & Energy – geographic distribution (Dec 2013-Apr 2017)
Region & Country Op Id NCBI (€) %
South-Eastern Europe 15 825,827,775 29.2%
Albania 1 118,000,000 4.2%
Bosnia and Herzegovina 2 16,000,000 0.6%
Bulgaria 2 149,600,000 5.3%
FYR Macedonia 1 37,000,000 1.3%
Kosovo 1 30,000,000 1.1%
Montenegro 2 52,700,000 1.9%
Romania 4 219,427,775 7.8%
Serbia 2 203,100,000 7.2%
Southern and Eastern Mediterranean 12 563,191,186 19.9%
Egypt 1 173,698,405 6.1%
Jordan 8 256,168,417 9.1%
Morocco 2 86,824,364 3.1%
Tunisia 1 46,500,000 1.6%
Turkey 7 585,593,773 20.7%
Turkey 7 585,593,773 20.7%
Central Asia 10 431,535,764 15.2%
Kazakhstan 6 258,408,370 9.1%

Special Study: Review of the EBRD Energy Sector Strategy – ANNEXES 44
Region & Country Op Id NCBI (€) %
Kyrgyz Republic 1 4,000,000 0.1%
Mongolia 1 22,855,053 0.8%
Tajikistan 2 146,272,341 5.2%
Central Europe and Baltics 5 209,501,425 7.4%
Estonia 1 42,000,000 1.5%
Poland 4 167,501,425 5.9%
Eastern Europe and Caucasus 9 154,523,640 5.5%
Georgia 5 133,563,640 4.7%
Ukraine 4 20,960,000 0.7%
Cyprus and Greece 3 60,350,000 2.1%
Cyprus 2 10,350,000 0.4%
Greece 1 50,000,000 1.8%
TOTAL 61 2,830,523,563 100.0%
Source: EvD elaboration based on DTM
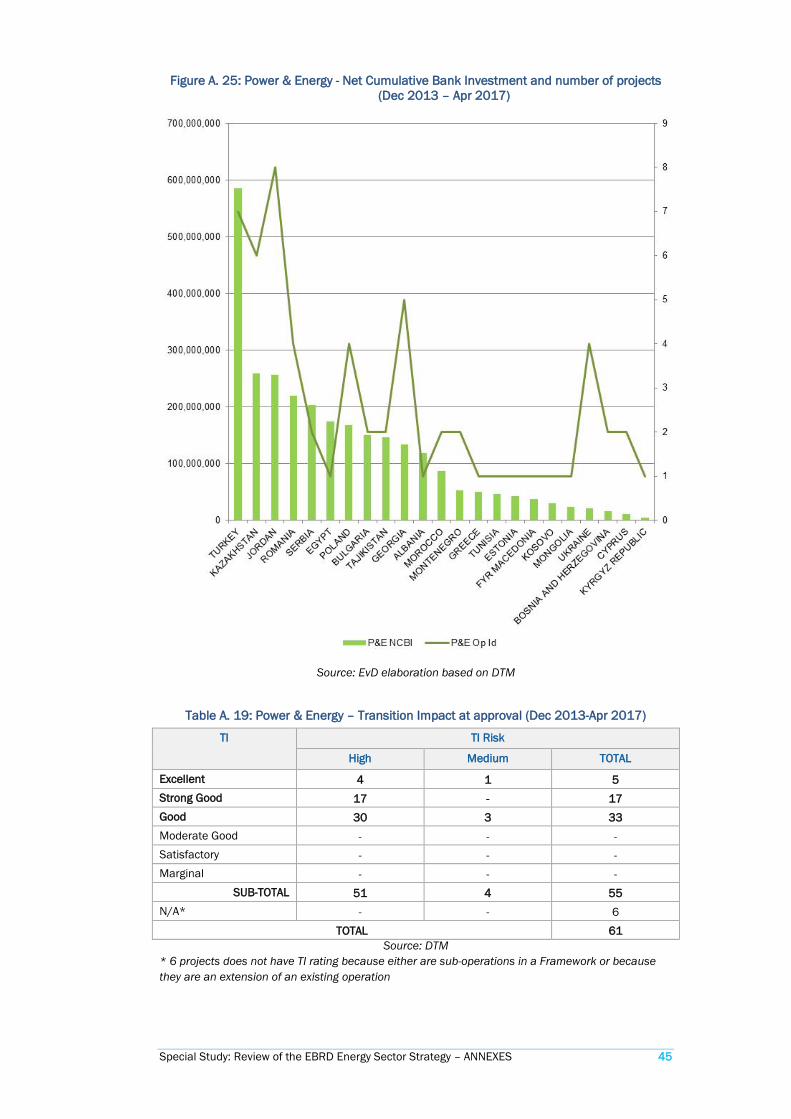
Special Study: Review of the EBRD Energy Sector Strategy – ANNEXES 45
Figure A. 25: Power & Energy - Net Cumulative Bank Investment and number of projects (Dec 2013 – Apr 2017)
Source: EvD elaboration based on DTM
Table A. 19: Power & Energy – Transition Impact at approval (Dec 2013-Apr 2017)
TI TI Risk
High Medium TOTAL
Excellent 4 1 5 Strong Good 17 - 17 Good 30 3 33 Moderate Good - - - Satisfactory - - - Marginal - - -
SUB-TOTAL 51 4 55 N/A* - - 6
TOTAL 61 Source: DTM
* 6 projects does not have TI rating because either are sub-operations in a Framework or because they are an extension of an existing operation

Special Study: Review of the EBRD Energy Sector Strategy – ANNEXES 46
Table A. 20: Power & Energy – SEI/SRI/GET and Environmental Category (Dec 2013-Apr 2017)
SEI/SRI/GET Category / Env Category
A B C None TOTAL
1 - Corporate Energy Efficiency - 1 - - 1
3 – Cleaner Energy Production 3 15 - - 18
4 - Renewable Energy 10 29 - - 39
No SEI - 3 - - 3
TOTAL 13 48 - - 61 Source: DTM
Table A. 21: Operations in Electric Power Distribution, Transmission, Control (Dec2013-Apr2017)
Country Project Short description Portfolio class
NCBI (€ million)
Bosnia and Herzegovina
ISO - EMS, SCADA and IT upgrade
Corporate loan to ISO BiH for EMS, SCADA and IT upgrade
STATE 8.5
Elektrokrajna power distribution project
Roll out of the metering system in order to reduce technical and commercial losses
STATE 7.5
Bulgaria CEZ Distribution Bulgaria
Financing of capital investment programme in the distribution network.
PRIVATE 69.6
FYR of Macedonia
MEPSO: FYR Macedonia-Albania Transmission Phase I
Bitola - Ohrid 400 kV Transmission Line and Ohrid 400/110kV substation
STATE 37.0
Kazakhstan Kyzylorda Electricity Distribution Project
Financing of rehabilitation of low and medium electricity distribution network in Kyzylorda Oblast,
STATE 13.1
Kosovo Kosovo Transmission Development Project
Kosovo electricity transmission system reinforcement and development project
STATE 30.0
Kyrgyz Republic
Oshelectro Rehabilitation Project
Financing of rehabilitation of low and medium electricity distribution network in Kyrgyzstan
STATE 4.0
Romania Transelectrica (Bond Issue)
Bank is participating in the first corporate bond issue of Transelectrica.
STATE 8.8
Electrica Equity Participation in an IPO of Electrica
STATE 75.2
CEZ Distribution Romania
Senior loan to CEZ Distribution Romania
PRIVATE 62.0
Tajikistan Cross Regional Power Trade
Finance the high-voltage transmission
STATE 100.6

Special Study: Review of the EBRD Energy Sector Strategy – ANNEXES 47
Country Project Short description Portfolio class
NCBI (€ million)
infrastructure in Tajikistan
Tunisia STEG Transmission Sovereign guaranteed loan to the state electricity and gas utility
STATE 46.5
Turkey SEDAS Phase II SEDAS Phase II financing
PRIVATE 30.7
Turkey TREDAS FINANCING Financing of TREDAS' capital investment programme for 2016 - 2020
PRIVATE 123.2
Source: DTM
Renewable energy operations
Table A. 22: Operations in renewable energy approved Dec2013-Apr2017
Country Project (*sub-operations)
Short description Installed capacity
(MW)
NCBI (€ million)
Solar power
CYPRUS DFF - CYPV Solar* 7.4 MW solar photovoltaic project involving three solar parks in Cyprus
7.4 6.3
CYPRUS DFF - TPT Solar* 4.5 MW solar photovoltaic project involving two solar parks in Cyprus
4.5 4.1
JORDAN Ma'an Solar Power Project
24 MW Ma'an Solar Power Project by SunEdison (Alcazar)
24.0 22.9
JORDAN Oryx Solar Project Jordan*
10MW solar power project by Scatec in Jordan
10.0 10.6
JORDAN EJRE Solar Project Jordan
20MW solar power project by Scatec Solar and EJRE in Jordan
20.0 22.9
JORDAN Greenland Solar Project Jordan
10 MW Ma'an Solar Power Project by Scatec and Greenland
10.0 11.8
JORDAN FRV Al Mafraq Solar PV Project
USD 36 million secured limited recourse loan to SPV in Jordan for 50 MW Solar PV power plant
50.0 32.4
JORDAN ACWA Power Mafraq PV IPP
USD 27 million secured limited recourse loan to SPV in Jordan for 50 MW Solar PV power plant
50.0 24.7
KAZAKHSTAN Burnoye Solar Power Plant
50 MW solar power plant in Zhambyl region, Kazakhstan
50.0 40.9

Special Study: Review of the EBRD Energy Sector Strategy – ANNEXES 48
Country Project (*sub-operations)
Short description Installed capacity
(MW)
NCBI (€ million)
UKRAINE USELF: Shargorod Solar*
Financing the construction of 9.5MW solar plant in Ukraine
9.5 5.0
Subtotal Solar 246.4 181.6
Wind power
GEORGIA Gori Wind Power Plant (STATE)*
Development, construction and operation of the 20 MW Gori wind power plant .
20.0 9.0
JORDAN Al Rajef Wind Farm 82 MW Al Rajef Wind Project by Alcazar Energy Partners
82.0 63.5
KAZAKHSTAN Yereymentau Wind Farm (STATE)
Wind farm construction 50.0 40.7
MONGOLIA Tsetsii Windfarm 50 MW windfarm in Mongolia
50.0 22.9
MONTENEGRO Krnovo Wind Farm Krnovo Wind Farm 72.0 48.5
MOROCCO Khalladi Wind Farm*
Construction of a wind farm in Morocco
120.0 51.8
POLAND Darlowo Wind Financing for one of the largest wind farms in Poland
74.0 41.6
POLAND Radzyn Wind Farm Senior debt financing for wind farm construction
39.0 22.4
POLAND Polenergia Wind Portfolio
Portfolio of 2-3 windfarms in Poland to be constructed by Polenergia
100.0 29.6
POLAND Banie Wind Farm Phase 1 (50MW Kozielice wind farm) of the 192MW Banie wind farm located in North-western Poland
50.0 73.9
ROMANIA Land Power Wind Farm
Construction of the 84 MW LP wind farm in the Tulcea region of Romania
84.0 73.4
UKRAINE USELF: Karpatskyi Wind Farm*
Development, construction and operation of 21MW wind farm in Lviv region in western Ukraine.
20.7 8.6
Subtotal Wind 762.0 485.9
Hydro power
GEORGIA RSF - TBC Bank Lukhuni 2 HPP*
Construction of 17.2 MW Lukhuni 2 HPP in northern Georgia.
17.2 5.1
GEORGIA Shuakhevi HPP Construction and operation of Shuakhevi HPP
185.0 82.1

Special Study: Review of the EBRD Energy Sector Strategy – ANNEXES 49
Country Project (*sub-operations)
Short description Installed capacity
(MW)
NCBI (€ million)
GEORGIA Dariali HPP Construction and operation of Dariali HPP
108.0 36.6
GEORGIA MCFF - Bank of Georgia Pshavela SHP*
Construction of a greenfield 2.0 MW run-of-river small hydro power plant Pshavela SHP in Kakheti
2.0 0.7
MONTENEGRO WeBSEDFF - Hydro Bistrica SHPP*
Long term loan under the WeBSEDFF to finance the construction of Hydro Bistrica SHPP.
3.5 4.2
MOROCCO ONEE Hydro Rehabilitation (STATE)
EUR35m sovereign loan to ONEE, the State-owned utility, to finance the rehabilitation of small hydro
N/A 35.0
TAJIKISTAN Qairokkum Hydro Power Rehabilitation Project (STATE)
Hydro rehabilitation 126.0 45.7
TURKEY Karacaoren HEPPs Financing of Gama Enerji's acquisition of Karacaoren HPP
N/A 40.2
UKRAINE USELF: Aquanova Small Hydro Projects*
Development, construction and operation of small hydro power plants with total capacity of 1.7MW
1.7 2.3
Subtotal hydro 443.4 251.9
Geothermal, biomass and biogas
ESTONIA Graanul Invest Phase III
Construction of two new Combined Heat & Powers (CHPs)
10 MWe, 28 MW heat
42.0
SERBIA WeBSEDFF: BGS Biogas*
A loan of up to EUR 4.5 million for a biogas project of 1.95 MW capacity in Serbia
2.0 3.1
TURKEY EFELER GPP Construction of a 123.3MW Greenfield geothermal power plant
123.3 + refinancing of
47.4
182.8
TURKEY Zorlu - Kizildere III GPP Extension
Construction of a 70MW greenfield geothermal power plant.
66.5 77.7
UKRAINE USELF: Rokytne Biogas Plant*
Development, construction and operation of a biogas power plant with initial total capacity 2.25MW
2.3 5.1
Other alternative energy
GREECE Terna Energy Corporate loan to finance the
48.0 50.0

Special Study: Review of the EBRD Energy Sector Strategy – ANNEXES 50
Country Project (*sub-operations)
Short description Installed capacity
(MW)
NCBI (€ million)
development, construction and operation of renewable energy power plants in Greece
TURKEY Akfen Yenilenebilir Enerji Co (f. Project Green)
Acquisition of a stake in a portfolio of electricity generation assets.
N/A 105.1
Sources: Installed capacity from EBRD Energy Business Group; NCBI from DTM
Figure A. 26: EBRD’s investments (volume) in renewable energy projects (Dec 2013-Apr 2017)
Source: EvD elaboration from DTM

Special Study: Review of the EBRD Energy Sector Strategy – ANNEXES 51
Figure A. 27: Cumulative EBRD investments in renewable energy by country of operation (Dec 2013-Apr 2017)
Source: EvD elaboration from DTM
Transactional TCs
Transactional TCs include resources marked in the data provided to the evaluation team mainly for: project preparation, project implementation support, and capacity building.
The evaluation team has considered only the transactional TCs linked to investments part of the population under consideration (investments approved from December 2013 until April 2017). The information provided below does not include all other TCs implemented by the EBRD in the period under review, but related to investments approved before December 2013 or not approved yet.
Table 1: Natural Resources operations – transactional TCs per country
Country €
Greece 1,352,465
Ukraine 583,218
Regional 82,465
Mongolia 72,306
Egypt 56,195
Kosovo 17,060
TOTAL 2,163,709 Source: EBRD databases

Special Study: Review of the EBRD Energy Sector Strategy – ANNEXES 52
Table 2: Natural Resources operations – donor distribution of transactional TCs
Donor €
Not available 1,585,000 Ukraine Multi Donor 292,918 EBRD SSF 157,290 Japan 57,131 EU 56,195 ETC Fund 15,175
TOTAL 2,163,709 Source: EBRD databases
Table 3: Power & Energy operations – transactional TCs per country
Country €
Tajikistan 7,577,486 Kazakhstan 2,785,922 Albania 2,705,640 Egypt 1,918,049 Kosovo 1,880,000 Morocco 1,595,000 Tunisia 1,274,000 Kyrgyz Republic 1,096,410 Turkey 397,598 Serbia 324,130 Georgia 276,790 Ukraine 212,999 Bosnia and Herzegovina 94,970 Jordan 66,320 Cyprus 47,500 Regional 11,400
TOTAL 22,264,214 Source: EBRD databases
Table 4: Power & Energy operations – donor distribution of transactional TCs
Donor €
EBRD SSF 8,188,118 Austria 5,476,212 Italy 2,197,640 SEMED Multi Donor 1,728,965 CIF 1,445,978 Japan 1,000,000 UK 998,920 EU 397,598 Norway 396,000 GEF 231,283 Not available 138,500 Germany 65,000
TOTAL 22,264,214 Source: EBRD databases

Special Study: Review of the EBRD Energy Sector Strategy – ANNEXES 53
Non-transactional – policy dialogue
For the purpose of tacking stock of policy dialogue activities carried out in the framework of the ESS, the evaluation team has considered data provided by EBG, E2C2, LTT, ESD, and EBRD TC databases. As in 2013-2014 the EBRD has modified the way in which TC information are captured, the evaluation team has done its best effort to consolidate those information and assumes that what has been provided covers the almost the entirety of activities carried out. A snapshot of the policy dialogue activities is provided below.
Additional policy dialogue activities carried out by the Bank in the sector and not funded by donors has complement the data – in particular from the country visits in Jordan and Kazakhstan. Information about those activities are not captured systematically in any EBRD system.
Table 5: Energy related technical cooperation activities marked as non-transactional (2013-2017)
Country € committed Number of TCs
Egypt 4,577,360 10 Regional 2,605,015 9 Kazakhstan 1,248,083 5 Turkey 1,043,479 6 Montenegro 877,212 4 Kyrgyz Republic 770,000 1 Mongolia 765,000 5 Bulgaria 750,000 1 Tajikistan 679,952 3 Georgia 667,999 4 Morocco 530,000 4 Jordan 471,450 2 Ukraine 398,840 3 SEMED 350,100 2 Moldova 349,900 2 Romania 300,220 3 Bosnia and Herzegovina 249,280 2 Albania 210,860 1 Poland 199,575 3 Tunisia 194,990 2 Belarus 180,000 1 Kosovo 157,205 1 FYR Macedonia 150,000 1 Serbia 139,990 1 Croatia 61,652 1
TOTAL 17,928,162 77 Source: EvD elaboration based on EBRD documents and databases

Special Study: Review of the EBRD Energy Sector Strategy – ANNEXES 54
Figure 1: Donors for energy related technical cooperation activities marked as non-transactional (2013-2017)
Source: EvD elaboration based on EBRD documents and databases
Grants
Data about non-TC grants (concessional co-finance, incentive payments, investment grants) are not systematically captured in EBRD databases. This is a Bank wide issue that EvD has raised in multiple occasions, never addressed in full. Therefore data about non-TC grants provide rely on the documentation shared by different teams.
Table A. 23: Non-TC grants linked to EBRD operations supply-side of energy approved Dec13-Apr17
Op Id Operation Country Concessional co-finance
€
Incentive payment €
Investment grant €
EBRD finance €
46274 MEPSO: FYR Macedonia-Albania Transmission Phase I
FYR MACEDONIA
12,000,000 (European
Western Balkans Joint
Fund)
37,000,000
45236 Wissol Petroleum Georgia
GEORGIA 375,418 (FINTECC/G
EF)
22,855,053
45618 Yereymentau Wind Farm
KAZAKHSTAN 18,000,000 (CIF)
40,685,453
46570 Burnoye Solar Power Plant
KAZAKHSTAN 13,780,000 (CIF)
40,859,819
46770 Kyzylorda Electricity Distribution Project
KAZAKHSTAN 1,056,000 (GEF)
963,585 (FINTECC)
13,077,467
47118 Oshelectro Rehabilitation Project
KYRGYZ REPUBLIC
1,000,000 (EU IFCA)
4,000,000
47949 Tsetsii Windfarm MONGOLIA 702,675 (Japan)
22,855,053
47297 Khalladi Wind Farm
MOROCCO 9,643,984 (CIF)
9,380,220 (CIF)
51,824,364

Special Study: Review of the EBRD Energy Sector Strategy – ANNEXES 55
Op Id Operation Country Concessional co-finance
€
Incentive payment €
Investment grant €
EBRD finance €
41553 Qairokkum Hydro Power Rehabilitation Project
TAJIKISTAN 9,801,297 (PPCR)
45,710,107
45303 USELF: Aquanova Small Hydro Projects
UKRAINE 1,000,000 (CTF)
2,300,000
45543 USELF: Rokytne Biogas Plant
UKRAINE 2,030,000 (CIF)
5,060,000
47355 USELF: Karpatskyi Wind Farm
UKRAINE 4,000,000 (CTF)
3,000,000 (CIF)
8,600,000
48147 USELF: Shargorod Solar
UKRAINE 1,900,000 (CTF)
5,000,000
TOTAL 16,543,984 1,431,418 70,657,776 299,827,316
Source: EBRD Banking and non-Banking teams

Special Study: Review of the EBRD Energy Sector Strategy – ANNEXES 56
Annex 8 People interviewed Table A. 24: Interviews related to the EBRD’s engagement in the energy sector in Jordan
(24-28 Sep 2017) Institution Position
EBRD client ACWA Power CEO AES Levant Holdings BV Jordan Operation & Maintenance Director
Health, Safety & Environment Manager Alcazar Energy Senior Advisor to CEO & President of the Royal Association
for the Conservation of Nature
Site Engineer (Al-Rajef) Owner's Engineer for Lahmeyer (Al-Rajef) Site Engineer (Ma'an) Site Representative
EJRE - European Jordanian Renewable Energy Projects
CEO
FRV Managing Director Middle East Head of Structured Finance and M&A
Scatec Solar CFO Jordan, Assets Manager Electrical Engineer for Israr Engineering (Ma'an and Oryx)
Government & Institutions Energy & Minerals Regulatory Commission (EMRC)
Deputy Chairman of EMRC & Vice President of MedReg
Ministry of Energy and Mineral Resources (MEMR)
Secretary General
National Electric Power Company (NEPCO)
Managing Director
Other stakeholders EcoPeace Middle East President, Jordanian Director
Deputy Director Energy Sector Capacity Building (ESCB) Resident Advisor
Chief of Party EDAMA - Energy Water and Environment Association
Chairman Vice Chair
EU Delegation Programme Manager, Energy Environment and Climate Change
National Energy Research Center (NERC)
Manager of Energy Efficiency and Solar Thermal Energy
Overseas Private Investment Corporation (OPIC)
Managing Director, Asset Management
Director, Structured Finance
Royal Association for the Conservation of Nature (RSCN)
Bird Researcher
USAID Project Management Specialist Economic Development & Energy Office
PFIs & Private Equity Arab Bank Vice President, Head of Project & Structured Finance
Catalyst Private Equity Fund Managing Director Finance Director
Jordan Kuwait Bank (JKB) Project Finance & Syndications Manager, Credit Department

Special Study: Review of the EBRD Energy Sector Strategy – ANNEXES 57
Institution Position
EBRD SEMED - Amman (Jordan) Director, Regional Head of Eastern Mediterranean
SEMED - Amman (Jordan) Associate Banker SEMED - Amman (Jordan) Associate Banker Economics, Policy & Governance Principal Economist, Sector Economics, Policy & Governance Analyst, Economics
Table A. 25: Interviews related to the EBRD’s engagement in the energy sector in Kazakhstan (16-20 Oct 2017)
Institution Position
EBRD Clients
Burnoye Solar 1 Chief SPP Burnoye
KazTransGas Aimak Deputy of General Director
Kyzylorda Electricity Distribution Company (KREC)
Deputy Head
KEGOC Managing Director for Finance and Accounting
Head of Business Initiatives and Projects Department
Intergas Central Asia - ICA Deputy General Director
Samruk Energy Senior Manager of Corporate Finance
Head Portfolio Management Department
Head Transformation Office
Director of Human Resources Department
Government and Institutions
Financial Settlement Center (FSC) General Director
Committee for Regulation of Natural Monopolies and Competition Protection (KREM)
Deputy Chairman
Ministry of Energy Head of RES Department
Other stakeholders
Centre for Sustainable Production and Consumption (CSPC)
President
ForteBank Deputy Chairman of the Management Board
International Finance Corporation (IFC) Senior Energy Specialist
KPMG Partner, Power & Utilities
Manager, Deal Advisory
Partner, Head of Management and Risk Consulting in Kazakhstan
Associate Director, Head of financial management and treasury group
Manager, Deal Advisory
USAID Energy Projects Coordinator, Economic Development Office
Project Management Specialist, Economic Development Office
EBRD
Kazakhstan Director, Head of Kazakhstan
Associate Director, Head of Astana

Special Study: Review of the EBRD Energy Sector Strategy – ANNEXES 58
Institution Position
ERCCA Director, Head ERCCA
Associate Director, Senior Banker
Associate Director, Senior Banker
Principal Banker
Principal Banker
Associate Banker
Analyst
Analyst
Russia Associate Banker
Economics, Policy and Governance Associate Director, Lead Economist Central Asia
Analyst
Table A. 26: Interviews in EBRD HQ related to the EBRD’s engagement in the energy sector
Department Position
Board of Directors offices
EIB Director
Spain Director
Sweden Director
Alternate Director
Adviser
Switzerland Director
Adviser
Client Services - Banking
Energy, Russia, Caucasus & Central Asia Director, Head of Energy Russia Caucasus & Central Asia
Associate Banker
Energy & Natural Resources Director, Strategy
Principal Banker, Policy & TC, Energy
Principal, Adviser to MD
Natural Resources Director, Head of Natural Resources
Power & Energy Director, Head of Power&Energy Utilities
Associate Director, Senior Banker
Poland – Energy coordination Associate Director, Senior Banker
Energy Efficiency and Climate Change Deputy Head of E2C2
Client Services – Policy and Partnerships
Country and Sector Economics Director, Sector Economics and Policy
Principal Economist, Sector
Principal Economist, Sector
Country Strategy Coordination & Results Management
Director
Associate Director, Deputy Director
Vice President Policy and Partnerships Associate Director, Advisor to VP
Finance and Operations
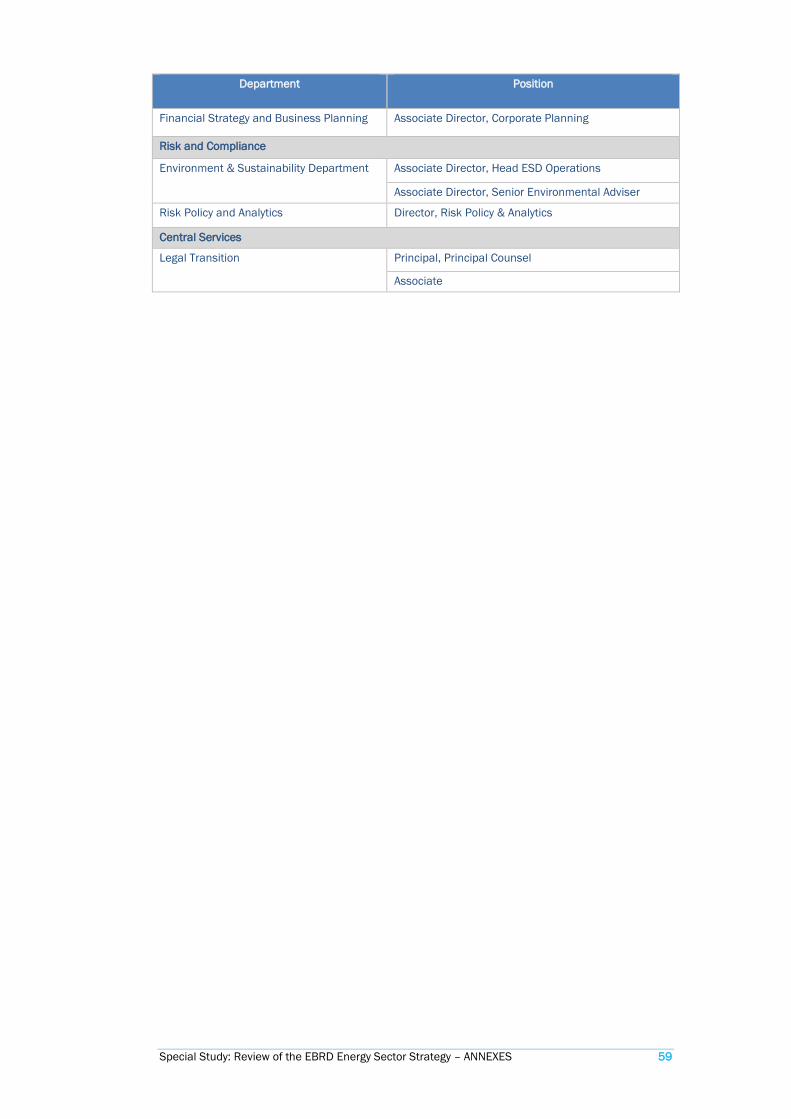
Special Study: Review of the EBRD Energy Sector Strategy – ANNEXES 59
Department Position
Financial Strategy and Business Planning Associate Director, Corporate Planning
Risk and Compliance
Environment & Sustainability Department Associate Director, Head ESD Operations
Associate Director, Senior Environmental Adviser
Risk Policy and Analytics Director, Risk Policy & Analytics
Central Services
Legal Transition Principal, Principal Counsel
Associate