review on the science and technology of water … · of water desalination by capacitive...
TRANSCRIPT
1
Review on the Science and Technology
of Water Desalination by Capacitive Deionization
S. Porada,1,2
R. Zhao,1,3
A. van der Wal,3 V. Presser
4,+ and P.M. Biesheuvel
1,3,*
1 Wetsus, centre of excellence for sustainable water technology, Agora 1, 8934 CJ Leeuwarden, The Netherlands.
2 Department of Polymers and Carbon Materials, Faculty of Chemistry, Wroclaw University of Technology, Wybrzeze Wyspianskiego 27, 50-370 Wroclaw, Poland.
3 Department of Environmental Technology, Wageningen University, Bornse Weilanden 9, 6708 WG Wageningen, The Netherlands.
4 INM - Leibniz-Institute for New Materials INM gGmbH, Energy Materials Group, Saarbrücken, Germany.
E-mail: + [email protected], * [email protected]
Abstract
Porous carbon electrodes have significant potential for energy-efficient water desalination using a
promising technology called Capacitive Deionization (CDI). In CDI, salt ions are removed from brack-
ish water upon applying an electrical voltage difference between two porous electrodes, in which the
ions will be temporarily immobilized. These electrodes are made of porous carbons optimized for salt
storage capacity and ion and electron transport. We review the science and technology of CDI and
describe the range of possible electrode materials and the various approaches to the testing of mate-
rials and devices. We summarize the range of options for CDI-designs and possible operational
modes, and describe the various theoretical-conceptual approaches to understand the phenomenon
of CDI.
Keywords
Porous carbon electrodes, capacitive deionization, water desalination, electrical double layer theory,
ion-exchange membranes, carbon aerogels, carbon nanotubes, activated carbon

2
1. Introduction
he availability of affordable clean water is one of the key technological, social, and economical
challenges of the 21st century. Clean water, acknowledged as a basic human right by the United
Nations [1], is still unavailable to one out of seven people worldwide. To complicate matters, increas-
ing groundwater extraction around the globe results in progressing salt water ingress in wells and aq-
uifers. As a consequence, there is a large interest in the development of economically attractive de-
salination technologies. Over the years, a number of desalination methods have been developed
among which distillation, reverse osmosis, and electrodialysis are the most commonly known and
widespread technologies [2]. A common goal for current research is to make these technologies more
energy efficient and cost effective, both for the deionization of seawater and for brackish water. Con-
sidering that there is more brackish water than freshwater in the world, it is clear that it is particularly
attractive to utilize the large brackish water resources for human consumption and residential use,
agriculture, and industry.
Capacitive deionization (CDI) has emerged over the years as a robust, energy efficient, and cost
effective technology for desalination of water with a low or moderate salt content [2]. The energy
efficiency of CDI for water with a salt concentration below approximately 10 g/L is due to the fact that
the salt ions, which are the minority compound in the water, are removed from the mixture. Other
methods rather extract the majority phase, the water, from the salt solution. Furthermore, energy
release during electrode regeneration (ion release, or electrode discharge) can be utilized to charge a
neighboring cell operating in the ion electrosorption step, and in this way energy recovery is possible.
As we will explain later in detail, a CDI cycle consists of an ion electrosorption, or charging, step to
purify the water, where ions are immobilized in porous carbon electrode pairs. In the following step,
ions are released, that is, are desorbed from the electrodes, and thus the electrodes are regenerated.
The basic mechanism underlying capacitive deionization is schematically shown in Figure 1.
With the majority of research on porous carbon electrodes dedicated to capacitive energy storage
devices over the past decades, capacitive deionization had been somewhat overlooked. Though the
application of porous carbon electrodes for water desalination had been documented since the 1960s
when it was called “electrochemical demineralization” or “electrosorb process for desalting water” [3-
7], only recently the academic interest in this technology increased exponentially, and companies
have begun marketing commercial CDI technologies.
T

3
Figure 1 Schematic design of a cell for (Membrane) Capacitive Deionization, (M)CDI. Upon applying a
voltage difference between two porous carbon electrodes, ions are attracted into the electrode,
cations into the negative electrode (cathode, on top), anions into the positive electrode (anode,
bottom). As a result, desalinated water is produced. A) CDI; B) MCDI, where in front of the cath-
ode a cation-exchange membrane is placed, while an anion-exchange membrane is placed in
front of the anode.
CDI uses pairs of oppositely placed porous carbon electrodes which store ions upon applying an
electrical voltage difference, see Figure 1. Such electrodes can be assembled in stacks of multiple
pairs. The ions are harvested from the water flowing through a “spacer channel” in between the two
electrodes and are immobilized in the pores inside the carbon material. This process is based on the
formation of electrical double layers (EDL) inside the intraparticle pores. EDL formation is the corner-
stone of capacitive energy storage and also the mechanism by which salt ions are immobilized and
selectively extracted from saline water. After some time, all of the accessible interparticle pore volume
is saturated with electrosorbed ions and the storage capacity of the device is reached. In order to re-
generate the carbon electrodes, the ions are released from the electrode again by reducing or even
reversing the cell voltage. In this way, a small stream enriched in ions is produced and the electrodes
regain their initial ion uptake capacity. Ideally, without the presence of chemical reactions, this pro-
cess is purely physical in nature and potentially enables CDI devices to have a long service life and
low maintenance.
Compared to the classical work of the 20th century, various modifications and new technologies
are nowadays considered for CDI, such as the inclusion of ion-exchange thin membrane barriers in

4
front of the electrodes, see Figure 1b [8-12], and optimized operational modes such as stop-flow op-
eration during ion release [13], salt release at reversed voltage [12], constant-current operation [14],
energy recovery from the desalination/release cycle [14], and flow-through electrodes where the water
is directed head-on through the electrodes [15, 16].
On the materials side, new materials and design strategies for novel and improved electrodes
continue to emerge. Fundamentally, even the very basic question of the “best” material remains un-
answered. Naturally, the choice of electrode material largely depends on required performance (de-
salting capacity, initial and final salt concentration), system requirements (flow rate, stack configura-
tion), and cost consideration (efficiency, material cost, lifetime). However, we are currently only start-
ing to understand the exact underpinning and limiting parameters for CDI operation on a quantitative
and kinetic basis. Thus, the next step in the development of improved CDI systems entails transition-
ing towards a guided and predictive materials design strategy. Ongoing research is not only dedicated
to further optimize the pore size distribution and chemical composition of already known carbons, but
also expands to novel materials and complex pore and electrode architectures. Carbon development
has truly emerged from “just” using activated carbons used for energy storage or sorption applica-
tions, to the development and design of novel and optimized structures, including ordered mesopo-
rous carbons [17] and metal-oxide / carbon mixtures [18, 19].
In this review we summarize the basics and theory of CDI. Furthermore, we discuss the range of
carbon materials used for CDI, and provide guidelines and strategies for a rational design of porous
carbon electrodes for desalination applications. Note that in Sections 3-7 the terminology macropores
and micropores is based on that used in porous electrode theory [20-23], with the term “macropores”
denoting the electrolyte-filled continuous interparticle space in between carbon particles, serving as
transport pathways for ion transport across the electrode, while the term “micropores” is used for all
the pore space within the carbon particles (intraparticle porosity). In Section 8 the formal IUPAC ter-
minology for porous material characterization is used where macro-, meso-, and micropores are dis-
tinguished based on the pore sizes in a porous material [24].
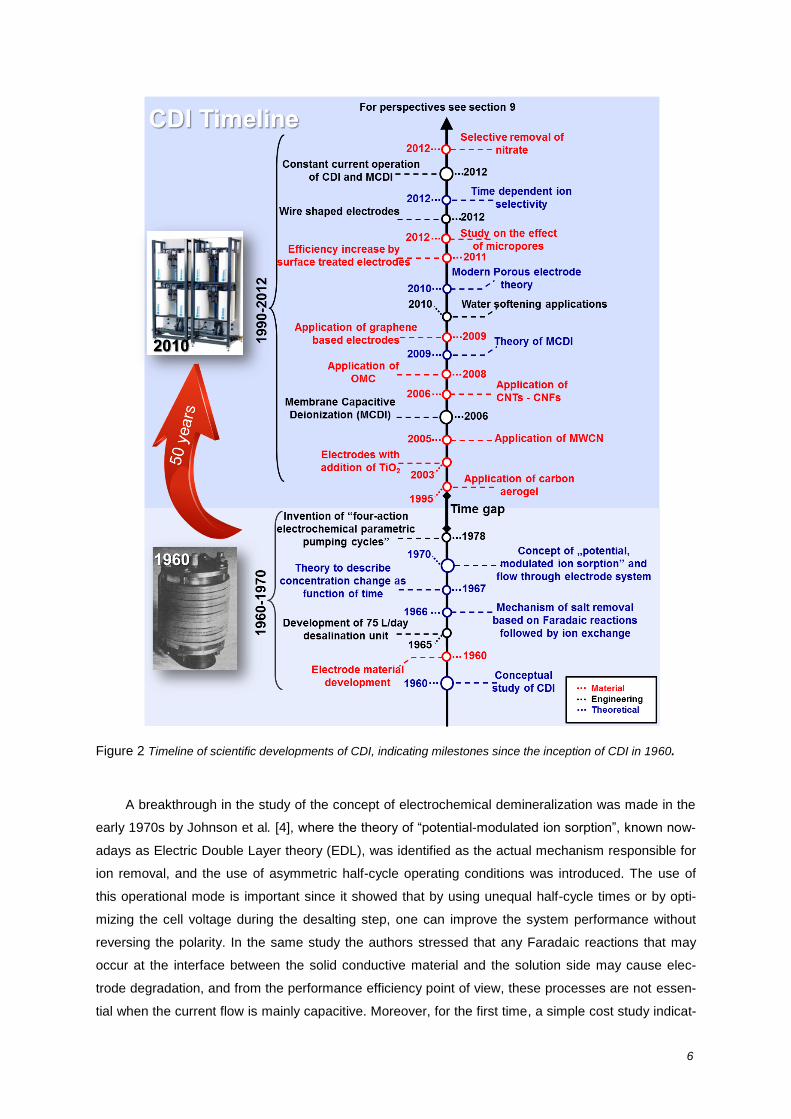
2. Historical background of CDI 1960-1995
In this section we present an overview of the early phase of CDI development as summarized in
Figure 2. We define this early phase to last until 1995, when carbon aerogel CDI electrodes were de-
veloped. A detailed discussion of carbon electrode development for CDI from 1995 onward is pre-
sented in Section 8.
Pioneering work on the concept of water desalination, called “electrochemical demineralization of
water” at that time, was performed by Blair, Murphy and co-workers in the early late 1960s, and con-
tinued until the late 1960s [25-28]. During that period, electrodes were classified according to their
“ion-representatives”, and it was assumed that ions could only be removed from water when specific
chemical groups present on the surface could undergo either reduction or oxidation, followed by the
creation of an ionic bond between the ion in solution and the ionized group on the carbon surface.
According to a study by Blair et al. [25] most of the graphite-like materials and other forms of carbon,
when used as an electrode material, were cation-responsive, due to the presence of the quinine-
5
hydroquinone couple and other cation-selective surface groups. This was the reason why during this
phase of CDI development much attention was focused on the development of a method to distin-
guish between the cation- and anion-selective nature of the electrodes, and on the preparation of an
anion-responsive electrode for instance by incorporation of an organic molecules [26].
Some years later the mechanism of “electrochemical demineralization” was studied by Coulo-
metric and mass balance analysis was studied by Evans et al. [29]. This study started off the discus-
sion on the extent of ion adsorption in the absence of an external voltage difference. Evans et al. [30]
also made an attempt to explain the fundamental mechanism of ion removal by CDI. Evans stated
that for the first step in water demineralization Faradaic reactions are required on the cathode side, to
adsorb hydrogen and to generate hydroxyl ions. In the next step, basic conditions created by hydroxyl
ions provide appropriate conditions for the ionization of weak acid groups, followed by the deminerali-
zation reaction based on ion exchange mechanism. Keeping this line of thought, during regeneration
step, the voltage had to be reversed to decrease the local pH, and to release previously removed
ions. Based on this mechanism, it was believed that to obtain full demineralization cycle the voltage
difference has to be reversed during regeneration cycle, and the efficiency of the salt removal was
determined by the concentration of surface groups. As will become clear from subsequent sections in
this review, these classical views on the fundamentals of water desalination by porous electrodes
have by now become obsolete and have been replaced by the view that the effect of electrical double
layer capacitive storage of ions is the most important, and thus, carbon-based electrodes are suitable
both as anode and cathode, while Faradaic reactions are no longer considered to be of primary im-
portance in driving the CDI process.
The first detailed study using a mathematical description of the demineralization process based
on a capacitive mechanism was presented by Murphy et al. [27]. In this work mass balance and
transport equations are combined to describe the salt concentration as function of time, and the mod-
el is used to describe experimental data obtained under several operating conditions. A different study
by Murphy et al. [28] focused on surface properties of carbon materials used as electrode material
after chemical treatment, e.g. treated with a mixture of concentrated sulfuric and nitric acids and their
influence on the process efficiency. This work is based on the mechanism of demineralization previ-
ously described by Evans et al. [29]. In Ref. [28] they concluded that the cation – responsive electrode
behaves as ion-exchanger because of the carboxyl groups incorporated in the surface after acid
treatment. More detailed studies on the mechanism and transport processes accompanying electro-
chemical demineralization were reported by Evans et al. [30] and Accomazzo et al. [31].
In 1968, a study done by Reid et al. [32] demonstrated the commercial relevance and long term
operation of a demineralization unit without substantial loss of salt adsorption capability over time.
Moreover, it was shown that besides sodium and chloride ions, calcium, magnesium, sulfate, nitrate,
and phosphate ions can be effectively removed.
6
Figure 2 Timeline of scientific developments of CDI, indicating milestones since the inception of CDI in 1960.
A breakthrough in the study of the concept of electrochemical demineralization was made in the
early 1970s by Johnson et al. [4], where the theory of “potential-modulated ion sorption”, known now-
adays as Electric Double Layer theory (EDL), was identified as the actual mechanism responsible for
ion removal, and the use of asymmetric half-cycle operating conditions was introduced. The use of
this operational mode is important since it showed that by using unequal half-cycle times or by opti-
mizing the cell voltage during the desalting step, one can improve the system performance without
reversing the polarity. In the same study the authors stressed that any Faradaic reactions that may
occur at the interface between the solid conductive material and the solution side may cause elec-
trode degradation, and from the performance efficiency point of view, these processes are not essen-
tial when the current flow is mainly capacitive. Moreover, for the first time, a simple cost study indicat-

7
ed the economical feasibility of CDI, if only stable electrodes can be produced. A further study by
Johnson and Newman [5] describes the development of a porous electrode model to analyze ion ad-
sorption in porous carbons, and their charge - voltage dependence, see Section 5. This work con-
cluded that the ion capacity of the electrode depends on the electrical capacity of the double layer, the
available surface area, and the applied cell voltage.
Following the concept of “potential-modulated ion sorption”, extensive studies on this and other
topics were initialized by Soffer, Oren and co-workers in the early 1970s, and still continue up to the
present time [6, 33-38]. Work presented in Ref. [33] focuses on developing a new technique to inves-
tigate double layer effects in porous electrodes. In the same work the authors concluded that even the
smallest pores in the size range of 0.5 - 3 nm are wetted and contribute to the ion removal process.
In 1978, in a study by Oren and Soffer [6] the idea was introduced of “four-action electrochemical
parametric pumping cycles” as an effective method to obtain a precise separation between just desal-
inated water and concentrate. This concept, as described in more details in Section 3.2 was further
investigated in Ref. [34, 35].
Starting from the 1990s, an increasing number of publications focused on developing an effec-
tive carbon material for water deionization. Amongst them, carbon aerogel materials developed by
Farmer et al. attracted the most attention [39]. Due to its monolithic structure, large internal surface
area and good conductivity, the carbon aerogel electrode was considered as an improvement over
traditional systems using activated carbons. Further study on the applications of carbon aerogels to
remove various salts, i.e., NaNO3 are described in Ref. [40, 41]. Modern developments in the applica-
tion of carbon materials for CDI is discussed in Section 8.
3. Experimental approaches to operation and testing of CDI
In the experimental study of CDI, many choices are available on what system to study, and by
what method of testing. Important questions in the study of CDI are:
What choices can be made for the method of testing of a CDI electrode or cell?
What CDI cell geometries can one choose from?
Which are the possible operational modes?
These three questions are addressed in this section. In Section 3.1 we discuss the basic choice
of using an experimental approach based on electrochemical analysis of faradaic systems (often
using three different electrodes, of which only one is the porous electrode to be tested), or to follow an
approach focusing on desalination performance, using a two-electrode cell with both electrodes
consisting of porous carbon. We continue in Section 3.2 with listing various of the possible CDI
designs that can be chosen based on the “two-porous-electrode” cell design, and discuss in Section
3.3 which different feedwater compositions can be used in CDI-testing. Section 3.4 discusses two CDI
experimental layouts used in literature. The detailed analysis of the CDI cycle in terms of salt
adsorption and charge is presented in Section 3.5. In Section 3.6 we introduce the important option of
adding ion-exchange membranes to the CDI system, and in Section 3.7 the common method of
8
constant voltage operation is explained and a comparison is made between desorption at zero
voltage and at reversed voltage. Finally, in Section 3.8 the distinction is explained between the
classical constant-voltage mode of operation and the novel mode of constant-current operation.
3.1 Electrochemical experimentation versus desalination using a two-electrode cell pair
For the characterization and testing of CDI electrodes, two different approaches have been de-
scribed in literature. The first approach is to perform electrochemical (EC) analysis, in general based
on a setup consisting of a working, counter, and reference electrode. In this approach only current
and voltage signals are measured, and not the actual change of salt concentration, and the water
containing the salt ions is not necessarily flowing along or through the porous carbon electrode (which
is the working electrode). All three electrodes are typically different, with only the working electrode
made of the CDI material to be tested [18, 42-45].
In a quite different approach, water containing salt is flowing along or through a cell pair consist-
ing of two porous carbon electrodes usually made of the same material and equal in mass and di-
mensions, between which a cell voltage is applied. A third (i.e., reference) electrode is not used. The
degree of desalination (see Section 3.4) as well as the current responding to a certain cell voltage
(see Section 3.4 and 3.5) can be measured in this setup. In the coming sections we focus on this se-
cond approach, where water is desalinated using cell pairs consisting of two porous electrodes. Sec-
tion 6 discusses one particular mode of EC testing using a symmetric porous electrode cell pair.
The use of the first approach (EC testing using a three-electrode setup) finds its roots in similar
testing of single electrodes for supercapacitor applications, and in the study of (planar) electrodes
where faradaic reactions take place. Instead, in CDI ideally no faradaic reactions take place, and ca-
pacitive processes are most important, see Section 4.2. In such a three-electrode experiment, the
voltage of the electrode under study is measured relative to a reference electrode, as function of the
current running between the working and counter electrode. Several well-known techniques are avail-
able to modulate the voltage- and current-signals, the two of which most often used for CDI are: 1.
cyclic voltammetry (CV) where the (working) electrode potential is swept in time following a triangular
pattern between a lower and higher set-point in voltage and the resulting current is plotted in a CV-
diagram;[18, 42, 45] and 2. electrochemical impedance spectroscopy (EIS), where a small voltage
signal, sinusoidally changing over time, is applied between the working and counter electrode which is
varied in a large window of frequencies, and the responding current (also sinusoidally varying, but
with a time-lag) is analyzed to construct Nyquist plots and other representations that allow one to de-
rive the magnitude of resistances and capacities in the electrode [43, 46].
Though these techniques are well established [47], their application to porous electrodes is more
complicated and analysis requires understanding of distributed charge/resistance networks [48, 49].
Classical analysis of data obtained from these methods assumes that the local resistances in the
electrode are not changing as a function of time and position in the electrode. However, this condition
is not met in CDI where desalination is the key objective, leading to strong salt concentration changes
with place and time in the electrode, as we will discuss in Sections 5.3 and 6.3. Therefore we argue in
Section 6 that EC testing should be based on high-ionic strength conditions of the electrolyte (e.g.
9
>0.5 M) as long as mathematical methods to analyze CV and EIS curves obtained in low salinity solu-
tions have not yet been developed for porous electrodes.
Therefore, in the remainder of this section we focus on the second experimental approach dis-
cussed above, namely testing of a symmetric two-porous electrode cell, using the cell voltage applied
between the two electrodes as the primary electrical signal. We note that this second approach is also
more reminiscent of actual operation and desalination using CDI, which is another reason to use this
approach.
3.2. Geometries for CDI testing based on a two-electrode layout
Most experimental work on CDI uses a design with two porous carbon film electrodes with a typi-
cal thickness between 100 and 500 µm, placed parallel to one another in such a way that a small pla-
nar gap is left in between the electrodes through which water can flow along the electrodes. This de-
sign is the classical CDI-geometry, and goes under various names, such as “flow-through capacitor
technology” or “flow-by” CDI and is schematically sketched in Figure 3a. In this “flow-by” CDI geome-
try, a typical electrode for laboratory scale experiments is in the range of 5x5 cm2 to 10x10 cm
2. Such
electrodes can be constructed either as freestanding thin films, or can be coated directly onto a flexi-
ble current collector such as graphite foil [9, 50]. It is possible to test a single cell pair, or to construct
a stack of multiple cell pairs. In that case, each current collector layer is contacting two porous elec-
trodes (one on each side) and, thus, the sequence of anode-cathode is reversed from one cell to the
next in the stack. Typically, each electrode is the same as the other in a cell pair, though cell pairs
with electrodes based on different synthesis conditions have been described in Ref. [51-56]. Recently
[57], a different kind of asymmetric cell geometry was introduced, namely to use cathode-to-anode
mass ratios not of one, but of two and three (and vice-versa, of one-half and one-third), and compare
desalination performance with the symmetric system where the two electrodes have equal masses.
The open channel between the electrodes, through which the water flows, can be an open chan-
nel, then typically at least 1 mm in thickness, or can be constructed from a spacer material, being a
porous thin layer, of thickness typically between 100 – 300 µm. The geometry is normally not such
that a purely one-dimensional flow pattern arises, but instead water flows from one edge of a square
channel to an exit point at the opposite corner [41], or from a hole in the center of a square cell radial-
ly outward to leave the cell on all four sides [58]; the direction of this flow pattern can also be re-
versed.
Instead of the water flowing along the electrodes, i.e., “flow-by” mode, it is also possible to direct
the water straight through the electrodes, a method applied by Newman and Johnson in Ref. [4, 5]
and further developed by Suss et al. [16], see Figure 3b. In this design the feed water is pumped
perpendicular to the layered structure, i.e., straight through the larger pores in the electrodes. This
flow condition has the advantage of a faster system response (rate of desalination) than flow-by CDI
because instead of the CDI system being limited by the diffusive time scale (based on the time re-
quired for ions to diffuse from the spacer channel into the electrodes), now the process can be accel-
erated to work at the much faster RC time scale [16].
10
Another approach is called “electrostatic ion pumping” [59], see Figure 3c, a method related to
the classical technique of “parametric pumping” [6, 13, 34, 35], two methods both having the ad-
vantage that (semi-continuously) two separate streams are produced from different exit points: a
freshwater stream from one end of the device and a concentrate stream from the other end. In classi-
cal parametric pumping, the feedwater is injected about halfway along the length of the relatively long
spacer (water) channel. In this method, while water is being fed continuously through the inlet hole in
the middle of the column, the cell voltage between the two electrodes is applied during a certain peri-
od of time and turned off during another period of time. During the period of applying the cell voltage,
a valve is opened on one end of the channel (valve A) and another valve closed on the opposite end
of that channel (valve B), allowing desalinated water to come out at end A. During the period of zero
cell voltage, valve A is closed and valve B is opened so that concentrate can be extracted through B.
Electrostatic ion pumping [59], see Figure 3c, is a modified approach because the one long channel
used in parameter pumping can be considered to be cut up in smaller electrodes which are stacked
together.
A new design employs movable carbon rod electrode wires [60], see Figure 3d, thereby avoiding
the sequential production of freshwater and concentrate from the same device for different periods of
time, as in flow-by CDI and flow-through CDI, and avoiding the need to reverse the water flow direc-
tion as in electrostatic ion pumping. Instead, the freshwater and concentrate streams are separated at
all times, right from the start. Thus, in contrast to the standard mode for CDI it does not have the dis-
advantage of the required precise switching of the effluent stream into freshwater and into concen-
trate, and the inadvertent mixing of just-produced water with the untreated water, an effect that may
occur right after switching. In the wire-based approach, cell pairs are constructed from wires, or thin
rods, with anode wires positioned close to cathode wires. An array of such wire pairs is lowered into
the water and upon applying a voltage difference between the anode and cathode wires, salt ions will
be adsorbed into their counter electrodes. The wire approach requires no spacer layer as long as the
wires are sufficiently rigid, or at least one set of wires is coated with an ion-exchange membrane. After
adsorbing salt, the assembly of wires is lifted from the compartment (or stream) that is desalinated,
and immersed into another water stream, upon which the cell voltage is reduced to zero and salt is
released. After salt release, the procedure can be repeated; thus, two continuous streams are ob-
tained, one in which feed water is steadily converted into freshwater and one where feed water is con-
tinuously becoming more saline. The saline stream (into which adsorbed salt is released) can also be
of a different source as the water to be desalinated. But when there is only one source of feed water,
then by upfront splitting the feed water stream in a certain ratio of volumes, the water recovery of the
process is automatically determined. Here, water recovery (WR) is the ratio of freshwater volume over
inlet volume, an important determinant to analyze performance of a water desalination process, see
also Section 7.

11
Figure 3 Overview of most relevant CDI system geometries. a) Flow-by mode, b) Flow-through mode, c)
Electrostatic Ion Pumping, d) Desalination with wires.
3.3 Feedwater Composition
The feed water used in CDI experiments can have very different compositions – ranging from
analytical grade water with specified amounts of ions, to the complex compositions of brackish natural
water or industrial process or waste water. First of all, it is important to decide whether or not to do
experiments in air-saturated water. Is so, it is advisable to make sure the oxygen- and CO2- content is
known, kept constant and reported. Oxygen- and CO2- free water can be obtained by using a nitrogen
blanket in the water storage (recycle) vessel, or by bubbling nitrogen gas through this tank.
In general, we can differentiate between the following types of feed water:
1. Real water (diluted sea water, tap water, ground water, waste or process water from agricul-
ture or industrial sources). This water will contain many different ions, monovalent as well as
divalent, and with some ions being amphoteric (i.e., their charge dependent on pH, such as
HCO3- or HPO4
2-). It will also contain colloidal matter, such as humic acids.
2. Water of a synthetic composition simulating a “real” water source, but which is free of organic
pollutants, solid particles, and the like.
3. Water containing only a single salt solution, such as NaCl or KCl. This is most commonly the
choice for laboratory-scale experiments in the literature.
When “real” water is chosen (option 1), one must decide on what pre-treatment to use to remove
particulate and biological matter, and organic pollutants. Another consideration is that the use of ionic
mixtures in options 1 and 2 leads to the requirement that the effluent freshwater produced must be
analyzed using (off-line) individual ion detection methods, such as ion chromatography or inductively
coupled plasma optical emission spectroscopy. However, in option 3, when utilizing only single salt
solutions, the measurement of the conductivity of the effluent water is sufficient (ideally combined with
pH measurements). In single salt solutions, we can choose for an electrolyte where the diffusion coef-

12
ficients, D, of the anion and cation are (almost) equal such as for KCl, or choose for a salt where
Dcation and Danion are rather different such as for NaCl.
Each of these three types of water has its own advantages and disadvantages when used as
feedwater in CDI experiments, and the choice between them must be made based on the objectives
of the actual study. For fundamental CDI experiments to determine, for example, the salt adsorption
capacity of an electrode material, option 3 using a single salt solution is most straightforward to ana-
lyze, because the desalination performance can be followed in time and on-line using a conductivity
meter. We note, however, that because of the complex composition of natural and industrial water,
CDI performance under real conditions may be very different from what has been determined based
on “clean” single salt solution experiments.
3.4 “Single-pass experiments” versus “batch-mode experiments”
For all CDI cell designs, in order to measure the actual water desalination by CDI, we need to
measure the change of ion concentration over time. This can be done by taking water samples and
analyzing the ion composition. This is also the required procedure for studies with ion mixtures, such
as for most real water sources or complex artificial mixtures, see Section 3.3 [23]. Only if a single salt
solution (such as NaCl or KCl) is used, simple on-line measurement of the water conductivity suffices.
Several options are available for the layout of a CDI experiment and in particular for the location
of the conductivity probe, i.e., where the conductivity is actually measured. Two main categories of
tests are found: In the single-pass (SP)-method (Figure 4a) water is fed from a storage vessel and
the salinity (conductivity) of the water leaving the cell is measured directly at the exit of the cell or
stack [12, 57, 61, 62]. In this case the measured effluent salinity will start to drop soon after applying
the cell voltage. Later on, however, the effluent (measured) salinity rises again to the inlet value, be-
cause the electrodes have reached their adsorption capacity. The effluent water is either discarded or
can be recycled to a reservoir container. This reservoir needs to be large to ensure that concentra-
tions here only change very slightly within the adsorption half of the cycle, say less than 1%, to make
sure that the influent concentration remains virtually constant during the cycle. The total amount of
removed salt molecules can be calculated from numeric integration of the effluent concentration ver-
sus time data (taking the difference with the feed concentration, and multiplying by the water flow rate
) [12, 14, 23, 57, 58, 61].
In another common approach, which we call the batch-mode (BM) method (Figure 4b), the recy-
cling reservoir is much smaller, and it is in this container where the water conductivity is measured [9,
17, 63]. The volume of the recycling reservoir needs to be small because otherwise the change in sa-
linity is low and cannot be measured accurately. In this experiment, the measured salinity drops
steadily and does not have a minimum; instead it levels off at a final, low, value. The difference in sa-
linity between the initial and final situation can be multiplied by the total water volume in the whole
system to calculate the amount of ions removed from the water.
The analysis by the BM-method (Figure 4b) is simpler than by the SP-method (Figure 4a). How-
ever, one problem is that the equilibrium salt adsorption is measured for a different (final) reservoir
concentration in each experiment, and this value is unknown a priori. Thus, in the BM method it is dif-
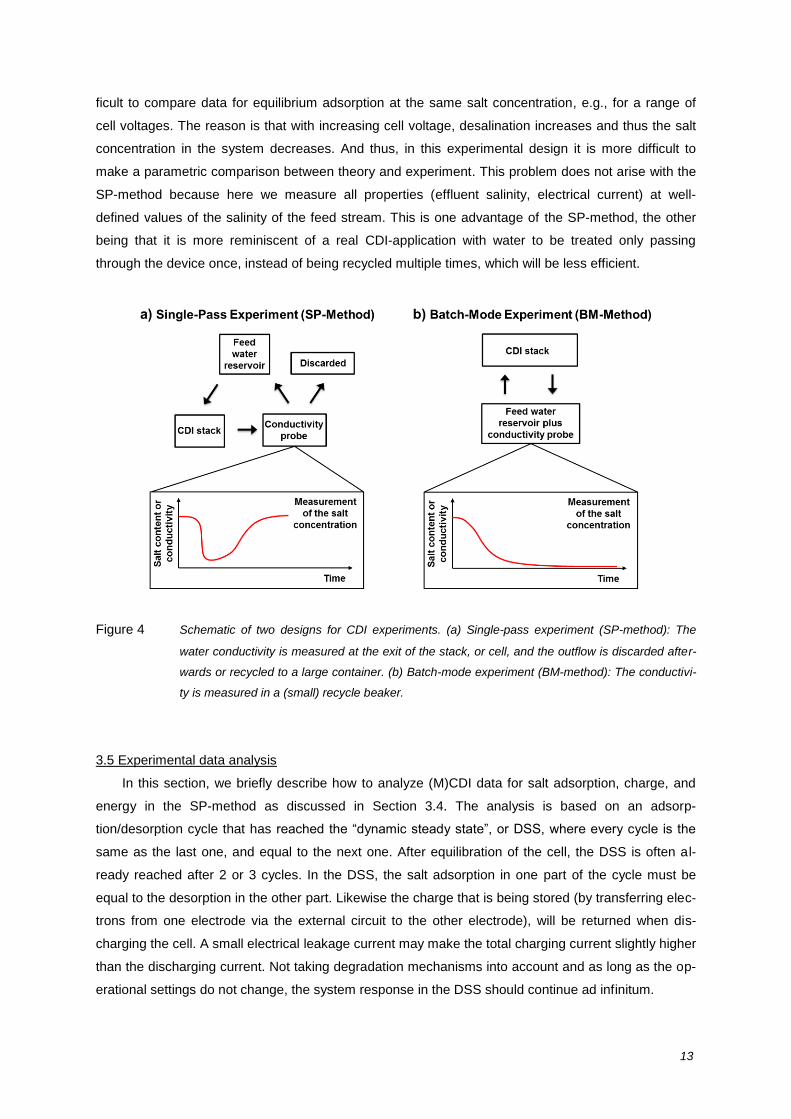
13
ficult to compare data for equilibrium adsorption at the same salt concentration, e.g., for a range of
cell voltages. The reason is that with increasing cell voltage, desalination increases and thus the salt
concentration in the system decreases. And thus, in this experimental design it is more difficult to
make a parametric comparison between theory and experiment. This problem does not arise with the
SP-method because here we measure all properties (effluent salinity, electrical current) at well-
defined values of the salinity of the feed stream. This is one advantage of the SP-method, the other
being that it is more reminiscent of a real CDI-application with water to be treated only passing
through the device once, instead of being recycled multiple times, which will be less efficient.
Figure 4 Schematic of two designs for CDI experiments. (a) Single-pass experiment (SP-method): The
water conductivity is measured at the exit of the stack, or cell, and the outflow is discarded after-
wards or recycled to a large container. (b) Batch-mode experiment (BM-method): The conductivi-
ty is measured in a (small) recycle beaker.
3.5 Experimental data analysis
In this section, we briefly describe how to analyze (M)CDI data for salt adsorption, charge, and
energy in the SP-method as discussed in Section 3.4. The analysis is based on an adsorp-
tion/desorption cycle that has reached the “dynamic steady state”, or DSS, where every cycle is the
same as the last one, and equal to the next one. After equilibration of the cell, the DSS is often al-
ready reached after 2 or 3 cycles. In the DSS, the salt adsorption in one part of the cycle must be
equal to the desorption in the other part. Likewise the charge that is being stored (by transferring elec-
trons from one electrode via the external circuit to the other electrode), will be returned when dis-
charging the cell. A small electrical leakage current may make the total charging current slightly higher
than the discharging current. Not taking degradation mechanisms into account and as long as the op-
erational settings do not change, the system response in the DSS should continue ad infinitum.
14
For practical CDI relevance, it is important to report experimental results of the DSS cycle, and not
results of runs prior to reaching the DSS and certainly not of the very first “run-in” cycle after assembly
of the cell with fresh material, as these runs can give quite markedly different desalination perfor-
mance, due to transient effects of salt accumulation in the cell and electrodes. Also, the desalination
degree in the first few runs will be influenced by the chemisorption of ions in the carbon, ions which
will not be desorbed when the voltage is reversed [9, 64, 65]. These transient, start-up effects are in-
teresting in their own respect, but for CDI it is more important to present DSS results because CDI is
meant to run continuously for many cycles, and the performance of start-up cycles is usually not rep-
resentative for such continuous operation.
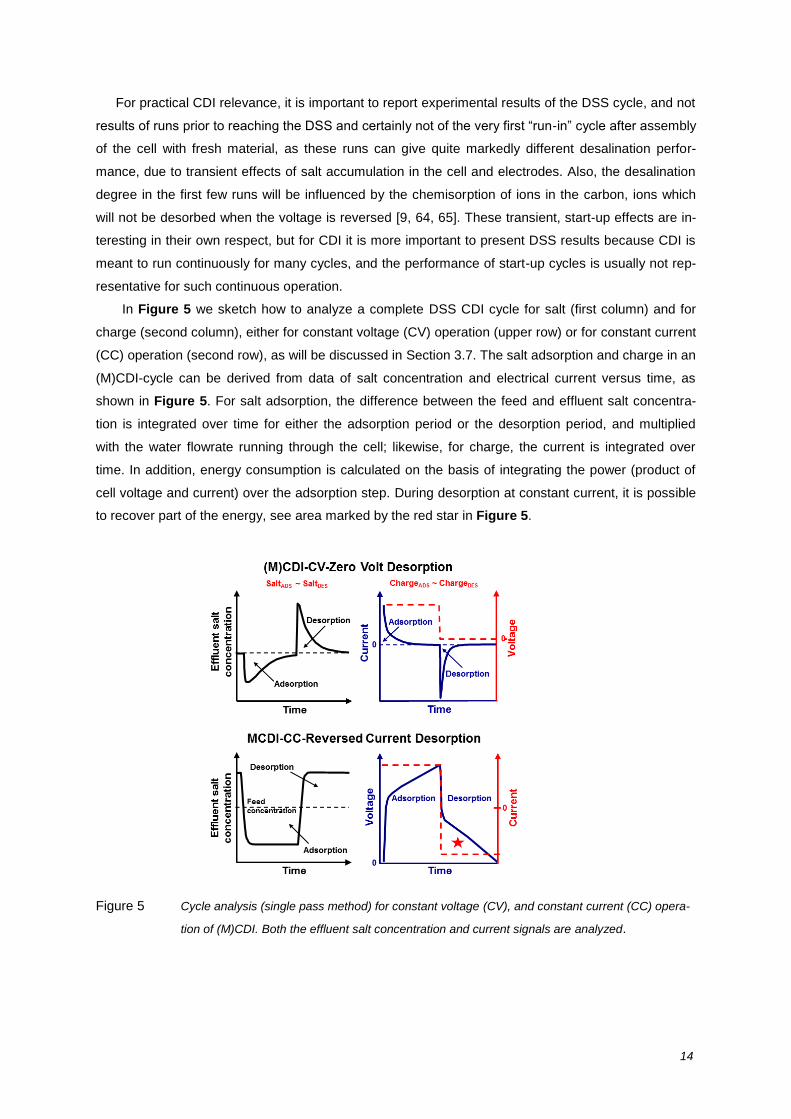
In Figure 5 we sketch how to analyze a complete DSS CDI cycle for salt (first column) and for
charge (second column), either for constant voltage (CV) operation (upper row) or for constant current
(CC) operation (second row), as will be discussed in Section 3.7. The salt adsorption and charge in an
(M)CDI-cycle can be derived from data of salt concentration and electrical current versus time, as
shown in Figure 5. For salt adsorption, the difference between the feed and effluent salt concentra-
tion is integrated over time for either the adsorption period or the desorption period, and multiplied
with the water flowrate running through the cell; likewise, for charge, the current is integrated over
time. In addition, energy consumption is calculated on the basis of integrating the power (product of
cell voltage and current) over the adsorption step. During desorption at constant current, it is possible
to recover part of the energy, see area marked by the red star in Figure 5.
Figure 5 Cycle analysis (single pass method) for constant voltage (CV), and constant current (CC) opera-
tion of (M)CDI. Both the effluent salt concentration and current signals are analyzed.

15
3.6 Membrane(-assisted) Capacitive Deionization (MCDI)
One of the most promising recent developments in CDI is to include ion-exchange membranes
(IEMs) in front of the electrodes (MCDI). IEMs can be placed in front of both electrodes, or just in front
of one. With only one IEM, the overall positive effect on salt adsorption is less pronounced than in the
case of using two IEMs. In the present section we only discuss data of MCDI containing two IEMs.
IEMs have a high internal charge because of covalently bound groups such as sulfonate or quarter-
nary amines, and therefore allow easy access for one type of ion (the counterion) and block access
for the ion of equal charge sign (the co-ion). As we will explain below, addition of IEMs significantly
improves desalination performance of the CDI-process. In general, IEMs have a selectivity for ions of
one charge sign relative to ions of another charge sign. In a further modification, the membrane can
be made to have a selectivity between ions of the same sign class: for instance between nitrate and
chloride (both monovalent anions) [66]. The membranes can be included as stand-alone films of
thicknesses between 50 and 200 µm, or can be coated directly on the electrode with a typical coating
thickness of 20 m [8-12, 67], see Figure 1b.
Where does the advantage of MCDI over CDI come from? In MCDI, just as in CDI, upon applying
a cell voltage in the ion adsorption step, counterions are adsorbed in the electrical double layers
(EDLs) formed within the intraparticle nanostructure (micropores) inside the porous carbon electrodes,
see Figure 10, while co-ions are expelled from these micropores. In CDI, the co-ions ultimately end
up in the spacer channel and reduce the desalination performance, i.e., for the whole cell the ratio of
salt removal over charge (the charge efficiency, ) is much less than unity (see also Sections 5.1.1,
and Figure 11). In MCDI, with ion exchange membranes placed in front of the electrodes, the co-ions
that are expelled from the micropores are blocked by the membrane and cannot leave the electrode
region. Consequently, they will end up in the interparticle pore space within the electrode
(macropores, see Figure 10) and accumulate there, which increases the macropore co-ion concentra-
tion to values beyond those in the spacer channel. Because of charge neutrality in the macropores,
this accumulation of co-ions there leads to an accumulation of counterions in the macropores as well.
Thus, in MCDI, not only are counterions adsorbed in the EDLs in the micropores, but an additional
part is stored in the macropores as well, where the salt concentration will ultimately be higher than in
the spacer channel, see Figure 14a. Therefore, the macropores play an important role in increasing
the salt adsorption capacity of MCDI relative to CDI. In contrast, in CDI the salt concentration in the
macropores is lower during ion-removal (not higher), while upon reaching equilibrium the salt concen-
tration there becomes the same as that outside the electrode, i.e., the same as in the spacer channel,
and thus the macropores have no salt storage capacity in CDI [12].
The advantage of MCDI over CDI is clearly shown in the results presented in Figure 6 (compare
bars a to c, and b to d) which shows that MCDI absorbs more salt per cycle than CDI. The various
modes of operation (ZVD, RVD) will be explained in Section 3.7.
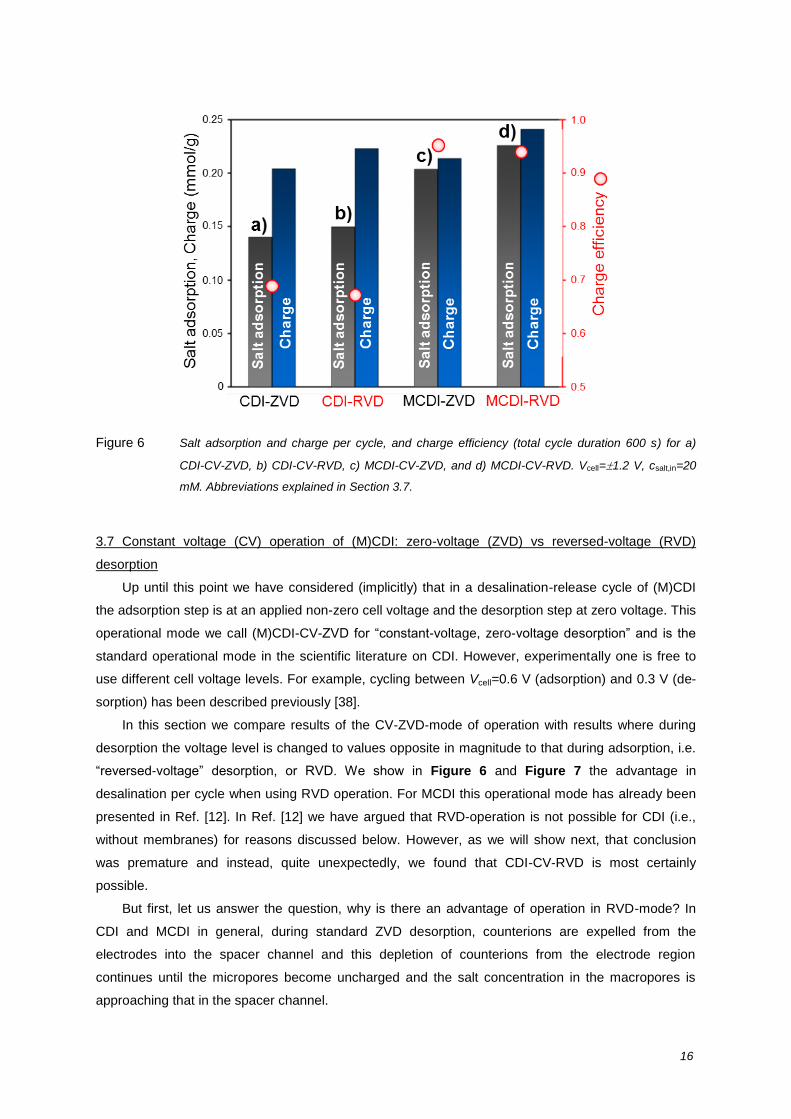
16
Figure 6 Salt adsorption and charge per cycle, and charge efficiency (total cycle duration 600 s) for a)
CDI-CV-ZVD, b) CDI-CV-RVD, c) MCDI-CV-ZVD, and d) MCDI-CV-RVD. Vcell=1.2 V, csalt,in=20
mM. Abbreviations explained in Section 3.7.
3.7 Constant voltage (CV) operation of (M)CDI: zero-voltage (ZVD) vs reversed-voltage (RVD)
desorption
Up until this point we have considered (implicitly) that in a desalination-release cycle of (M)CDI
the adsorption step is at an applied non-zero cell voltage and the desorption step at zero voltage. This
operational mode we call (M)CDI-CV-ZVD for “constant-voltage, zero-voltage desorption” and is the
standard operational mode in the scientific literature on CDI. However, experimentally one is free to
use different cell voltage levels. For example, cycling between Vcell=0.6 V (adsorption) and 0.3 V (de-
sorption) has been described previously [38].
In this section we compare results of the CV-ZVD-mode of operation with results where during
desorption the voltage level is changed to values opposite in magnitude to that during adsorption, i.e.
“reversed-voltage” desorption, or RVD. We show in Figure 6 and Figure 7 the advantage in
desalination per cycle when using RVD operation. For MCDI this operational mode has already been
presented in Ref. [12]. In Ref. [12] we have argued that RVD-operation is not possible for CDI (i.e.,
without membranes) for reasons discussed below. However, as we will show next, that conclusion
was premature and instead, quite unexpectedly, we found that CDI-CV-RVD is most certainly
possible.
But first, let us answer the question, why is there an advantage of operation in RVD-mode? In
CDI and MCDI in general, during standard ZVD desorption, counterions are expelled from the
electrodes into the spacer channel and this depletion of counterions from the electrode region
continues until the micropores become uncharged and the salt concentration in the macropores is
approaching that in the spacer channel.

17
Now, in MCDI-CV-RVD, not only are the counterions removed to the point that the electrode is
charge-neutral again, but counterion desorption continues, first of all from the EDLs in the micropores,
in which now the co-ions are attracted as countercharge, and secondly from the interparticle
macropores, of which the salt concentration drops dramatically to reach values close to zero at the
end of the desorption step, see Figure 14b. Thus we have a very effective “clean-up” of the
counterions from the electrode structure. Consequently, in the subsequent adsorption step of the next
cycle, the counterion adsorption rate and capacity are significantly increased compared to operation
at ZVD-conditions, as can be seen from Figure 7. MCDI-CV-RVD is possible because once the
counterion is released from electrode “A” into the spacer channel, even though it may now feel an
attractive force for adsorption in the opposite electrode “B”, it is because of the membrane located
there that it is blocked from entry in electrode “B”, and is thus flushed out of the cell.
In CDI it has been argued that because of the absence of membranes the ions that are released
from electrode “A” during desorption will be quickly adsorbed in the other electrode “B”, and therefore
it is not possible to work at RVD-conditions in CDI-CV because not much salt is effectively released
into the effluent stream [12, 14]. However, this prediction turned out to be wrong and we found that
CDI-CV-RVD is most certainly possible, with even a higher adsorption capacity per cycle than in CDI-
CV-ZVD, see Figure and Figure 7. The reason must be that the expelled counterions actually do
have sufficient chance to leave the spacer channel before being adsorbed in the opposite electrode.
Interestingly, as a consequence of RVD-operation in CDI, in one “original” cycle consisting of first
applying a positive cell voltage for a certain time and then a negative cell voltage (both durations
300 s for the data of Figure 7), in CDI-CV-RVD, there will be two adsorption phases and two
desorption phases condensed into one original cycle (of 600 s in total), or in other words, the cycle
frequency in CDI-CV-RVD is twice that in ZVD-mode. This phenomenon of “frequency doubling” can
be observed in Figure 7, when comparing panel a with c. Note that in Figure 6 we report desalination
for CDI-CV-RVD as achieved within the timeframe of the “original” cycle of 600 s.

18
Figure 7 Effluent salt concentration during three consecutive desalination/release cycles in four different
modes of CDI-operation as explained in the main text of section 3.7 (a) CDI-CV-ZVD, (b) MCDI-
CV-ZVD, (c) CDI-CV-RVD, and (d) MCDI-CV-RVD.
All four operational modes that have now been discussed are compared in Figure 7 which shows
that for salt adsorption, MCDI-CV-RVD > MCDI-CV-ZVD > CDI-CV-RVD > CDI-CV-ZVD. Although
both for MCDI and CDI, using RVD enhances the total salt adsorption per cycle, it decreases the
charge efficiency, the ratio of salt adsorption to charge per cycle[68]. In general, as will be discussed
in Sections 5.1.1 and 7.2, when considering charge efficiency, MCDI is preferable over CDI, because
both for ZVD and RVD mode, the charge efficiency is above 0.9, while for CDI, it is generally below
0.8.
3.8 Constant current (CC) operation of (M)CDI vs constant-voltage (CV) operation
Practically all published work on CDI uses one of the above experimental procedures based on a
constant cell voltage (CV-operation) applied during ion adsorption, which is reduced abruptly during
the ion desorption step resulting in salt release.
An operational mode quite different from CV-operation is constant current operation (CC) [14]. As
sketched in Figure 5, and in more detail in Figure 8, for CV operation, during the desalination step
the effluent water first decreases in salinity level, and then the salinity increases again. However, this
19
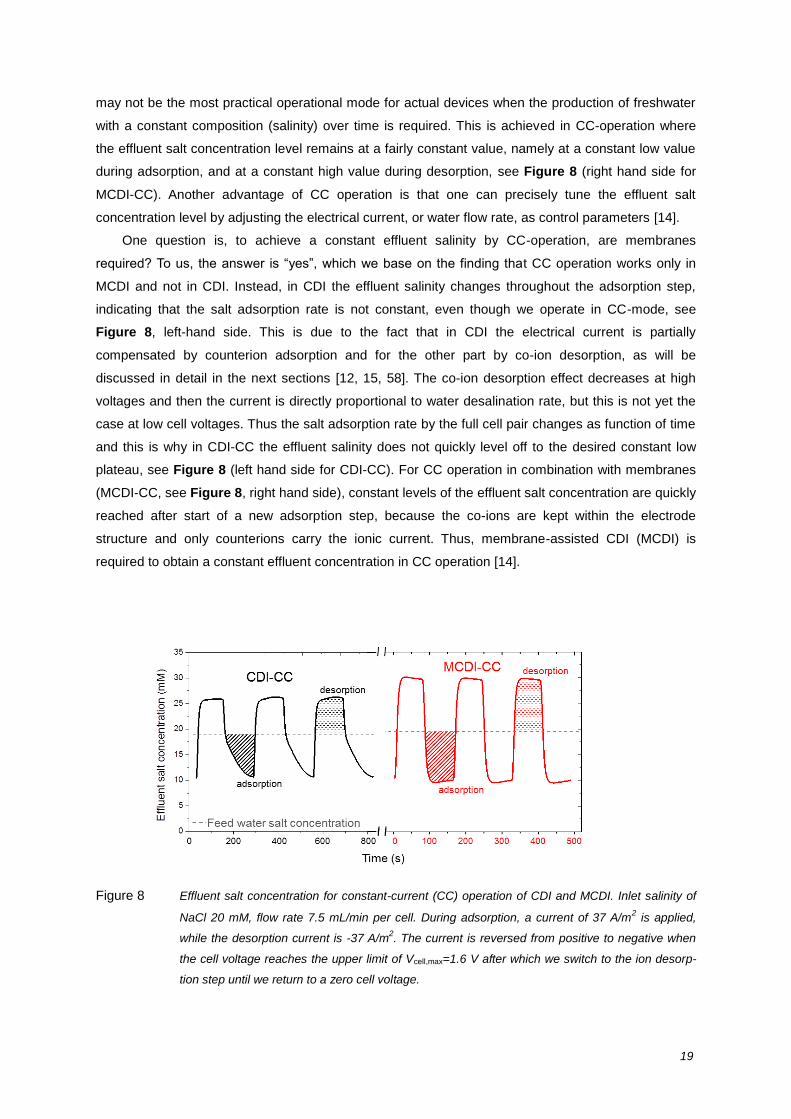
may not be the most practical operational mode for actual devices when the production of freshwater
with a constant composition (salinity) over time is required. This is achieved in CC-operation where
the effluent salt concentration level remains at a fairly constant value, namely at a constant low value
during adsorption, and at a constant high value during desorption, see Figure 8 (right hand side for
MCDI-CC). Another advantage of CC operation is that one can precisely tune the effluent salt
concentration level by adjusting the electrical current, or water flow rate, as control parameters [14].
One question is, to achieve a constant effluent salinity by CC-operation, are membranes
required? To us, the answer is “yes”, which we base on the finding that CC operation works only in
MCDI and not in CDI. Instead, in CDI the effluent salinity changes throughout the adsorption step,
indicating that the salt adsorption rate is not constant, even though we operate in CC-mode, see
Figure 8, left-hand side. This is due to the fact that in CDI the electrical current is partially
compensated by counterion adsorption and for the other part by co-ion desorption, as will be
discussed in detail in the next sections [12, 15, 58]. The co-ion desorption effect decreases at high
voltages and then the current is directly proportional to water desalination rate, but this is not yet the
case at low cell voltages. Thus the salt adsorption rate by the full cell pair changes as function of time
and this is why in CDI-CC the effluent salinity does not quickly level off to the desired constant low
plateau, see Figure 8 (left hand side for CDI-CC). For CC operation in combination with membranes
(MCDI-CC, see Figure 8, right hand side), constant levels of the effluent salt concentration are quickly
reached after start of a new adsorption step, because the co-ions are kept within the electrode
structure and only counterions carry the ionic current. Thus, membrane-assisted CDI (MCDI) is
required to obtain a constant effluent concentration in CC operation [14].
Figure 8 Effluent salt concentration for constant-current (CC) operation of CDI and MCDI. Inlet salinity of
NaCl 20 mM, flow rate 7.5 mL/min per cell. During adsorption, a current of 37 A/m2 is applied,
while the desorption current is -37 A/m2. The current is reversed from positive to negative when
the cell voltage reaches the upper limit of Vcell,max=1.6 V after which we switch to the ion desorp-
tion step until we return to a zero cell voltage.
20
4. Conceptual approaches to understand the phenomenon of CDI
In the previous section we have analyzed a wide range of experimental possibilities for CDI. In
the present section we discuss various conceptual approaches to describe CDI performance. Two
related questions in this respect are:
1. How to understand the fundamental phenomenon that porous electrodes are able to adsorb
salt under the application of an external voltage?
2. How to quantify experimental data for CDI, that is, what is the right theoretical modeling
framework?
In the present Section 4 we highlight various conceptual approaches that have been developed with
the aim to answer these questions. In Section 5 we will discuss in more detail those approaches that
can be used to quantify and predict the outcome of a CDI experiment, e.g., desalination, charge and
energy.
4.1 Understanding of CDI using the concept of operational voltage windows
To describe the behavior and the performance of porous carbon electrodes in a CDI cell, one ap-
proach is based on a general description of electrochemical processes, and points out the importance
that each electrode’s potential must be positioned appropriately relative to a reference potential, or
within a voltage window, required to have optimized ion adsorption and minimal faradaic, parasitic
electrode reactions [15, 69, 70]. Instead, if the potentials are not chosen correctly, then ion adsorption
is not optimized.
Because the optimum electrode potential depends on the material’s potential of zero charge
(PZC), modifying the PZC e.g., by oxidation or reduction of the carbon materials can improve the re-
sulting CDI performance. This can be done by reducing the positive electrode in a way that its PZC is
shifted negatively and likewise the negative electrode can be oxidized to positively shift its PZC. As a
result, after applying a voltage difference to a previously short-circuited CDI-system, both electrodes
will work in a voltage window where expulsion of co-ions is limited, and adsorption of counterions is
dominant, due to introduced potential shifts of both electrodes in opposite directions. The electrical
potential of both electrodes can also be optimized by the use of a third electrode (reference electrode)
which can lead to a higher charge efficiency and salt adsorption capacity [71].
4.2. Modeling based on charge-transfer between the electrodes
In a different approach, classical electrostatic double layer (EDL) theory for capacitive, ideally-
polarizable, electrodes is the starting point to describe the charge-voltage and salt-voltage character-
istics of the cell. In a first approximation it is assumed that the charge is only related to electronic
charge on the one hand (in the carbon electrode) and to ionic charge (ions in the aqueous phase),
compensating one another exactly, see Figure 10. In this first-level approach a surface charge due to
chemical ion adsorption or carbon redox chemistry, see Figure 9, is neglected, and, thus, when the
material is not charged, there is a zero voltage drop across the EDL. Electrokinetic modeling based
on the Nernst-Planck equation can be used to quantify the dynamics of the process. Though neglect-
21
ed in a first approximation, the effects of chemical ion adsorption and carbon redox chemistry (see
Section 4.4), can be incorporated in more detailed models [22].
In the EDL approach, the focus is not on how voltage windows are chosen relative to a reference
electrode, but on how much charge is transferred from one electrode to the other, and how this im-
pacts ion concentrations inside the porous electrodes (EDL structure) and the resulting local voltage
drops across the EDL, i.e., only local voltage differences play a role, not absolute potentials (relative
to a reference electrode). This review follows the EDL-based approach which is discussed in much
more detail in Section 5. Using similar concepts, Section 6 describes EC testing based on a pair of
carbon electrodes where only purely capacitive processes occur. Detailed transport and EDL model-
ing in a two-dimensional geometry of the pores and spacer channel is provided by Jeon and No [72].
4.3. Isotherm-based modeling
A third approach for CDI modeling is to quantify experimental data for salt adsorption in the elec-
trodes as function of salt concentration in the external bath (recycle volume) using one of several ad-
sorption isotherms, such as those based on the Langmuir- or Freundlich-equation [64]. From the fitted
parameters such as equilibrium constant K, information can be extracted on the interaction energy
between ion and substrate. The fitted isotherms can also be used to predict adsorption at other values
of the reservoir ionic strength.
Problematic in this approach is that it does not describe the fact that in CDI anions and cations
are separated into their respective counter-electrode when they are removed from the water. Instead,
isotherm-based modeling describes the adsorption of the whole salt molecule as if onto one and the
same sample of carbon material. Consequently, the impact of several parameters cannot be included
in this description, such as the role of the cell voltage. This approach neither describes how much
charge is required for a certain salt adsorption (i.e., the charge efficiency is not predicted, see Sec-
tion 5) nor how this approach can be extended to describe asymmetric electrodes (unequal mass of
anode to cathode) [57].
4.4 Overview of electrochemical reactions and processes at the carbon/electrolyte interface
In Sections 3 and 4.2 we have focused on the capacitive effects of ion storage in the electrical
double layer (EDL) formed inside the carbon micropores. However, the EDL effect is by far not the
only electrochemical process playing a role in CDI. In Figure 9 we summarize in six panels possible
electrochemical processes that can play a role in CDI, their importance dependent on parameters
such as applied voltage, electrode material, oxygen content of the water, and pH. Some of these pro-
cesses are at the heart of the CDI phenomenon (A and B) while others are effects which need to be
minimized, such as those leading to the formation of chemical byproducts or to pH-fluctuations of the
produced water. Some of the effects lead to a reduction in the (desalination) efficiency, while others
may in the long run even result in system performance loss. Therefore, all possible electrochemical
processes must be understood in order to optimize electrode performance stability, energy efficiency,
and to reduce pH-fluctuations. It may also be possible to make positive use of certain effects, such as
effects C) or D) in order to improve CDI performance (energy efficiency) in novel ways. In general, the
22
six processes that we identify below can be split up in two groups: non-Faradaic processes (effects A-
C below), and Faradaic reactions (D-F). The distinction is that in the latter group, electrons participate
in electrochemical reactions with reactants and products either part of the carbon/electrolyte interface
(D), or present in the electrolyte phase (E and F). Let us list the six categories one by one, see Fig-
ure 9.
4.4.1 Non-Faradaic Effects
a) First of all, Capacitive ion storage is the phenomenon of the formation of an electrical double layer
(EDL), where upon applying a charge, ions are captured electrostatically and stored capacitively in
the diffuse layer formed next to the carbon interface, see Sections 3, 4.2 and 5.1. The formation of the
capacitive EDL is at the heart of the CDI process.
b) Ion kinetics refers to the influence of the difference in mobility of the various ions on EDL formation.
Ions (salt ions, protons, hydroxyl ions) are transported from the spacer channel via macro- and meso-
pores into the micropores, see Sections 5.2 and 5.3. High rates of ion transport are essential in CDI,
but as indicated, the high mobility of the H+ and OH
- ions (relative to salt ions) may play a role, leading
to reduced adsorption of salts in the EDLs, and to pH fluctuations when H+-adsorption is different from
OH--adsorption. Note that here we suggest that pH fluctuations may be simply be due to the effect of
differences in ion mobility, besides more common explanations based electrochemical reactions such
as water splitting to be discussed below.
c) By Chemical surface charge we denote the presence of charged groups at the carbon/electrolyte
interface, groups responsible for the natural charge of carbons. Such groups are typically carboxylic
(to render the material negatively charged) or based on amine-functionalities (to give the material a
positive charge). When both such groups exist on the carbon, the material will be amphoteric which
implies that dependent on pH it may be positively or negatively charged, and thus there is a solution
pH beyond which the material is negatively charged, and below which it is positive, i.e., the carbon
has a pH of zero charge. The charge of these groups depends on their intrinsic pK-value as well as
on the local pH in the micropores [22], which depends a.o. on the local electrical voltage there [57,
73]. Therefore the micropore pH can be hugely different from that in bulk solution, and thus the charg-
ing state of these groups can vary dramatically during a CDI cycle. These changes in charging state
lead to a net H/OH adsorption and to pH-fluctuations in the flow channel. These H/OH adsorp-
tion/desorption fluxes will also influence the transport of salt ions, which can be modelled within the
Nernst-Planck-Poisson framework [22, 23, 74].
4.4.2 Faradaic Reactions
d) Carbon Redox Reactions is the term we use to describe that certain carbon surface groups are
able to change their redox state without the development of charge separation between surface and
solution. The archetypical example for carbon is the quinone (Q) to hydroquinone (HQ) conversion,
where two =O bonds in the quinone group on the carbon “react” with two electrons and two protons to
form two –OH-groups (HQ). The presence of these groups on the carbon will lead to electronic charge
storage in the desalination/release cycle, without it resulting in the adsorption of salt ions (such as Cl-

23
or Na+). Instead, in this way protons are chemically adsorbed in the cathode upon carbon reduction
from Q to HQ. Thus, the Q-to-HQ reaction may lead to pH fluctuations because not necessarily is this
effect as prominent (and fast) in the one electrode as in the other.
e) Water chemistry. By the term “water chemistry” we summarize all electrochemical processes where
components in the water react at the carbon surface, with the products not staying at the surface but
dissolving in the electrolyte. These components are mainly the water and its H+/OH
- charge carriers,
Cl- and dissolved O2. Water splitting (water electrolysis) is understood to limit the CDI process to volt-
ages below the limit of 1.23 V beyond which a significant electrical leakage current may be expected
with hydrogen gas and oxygen gas developing. However, the situation is found not to be so strict, be-
cause the CDI process is not running in steady-state and local ion concentrations in the electrode are
different from one another and not at free solution values. Also, the reverse of water splitting is possi-
ble with oxygen dissolved in the water undergoing reduction at the cathode side, causing a pH in-
crease of the effluent stream [62]. Oxidation of chloride ions at the anode followed by disproportiona-
tion of chlorine gas into hypochlorite is also of importance [62].
f) Finally, Carbon oxidation describes the possibility that the carbon itself not just catalyzes chemical
reactions as described in e) but sacrificially takes part in a conversion process, being increasingly oxi-
dized and, it has been suggested, electrochemically converted ultimately into CO2 leading to electrode
weight loss and collapse of CDI performance [13, 15].
This finalizes our summary of six categories of possible electrochemical effects that can take
place in CDI electrodes. Even though this is already a fairly long list, we are aware that other (elec-
tro-)chemical effects may also occur in CDI electrodes. Still, the list already suggests that in terms of
quantitative study and the theoretical modeling of CDI, much work is still to be done, because until the
present day only effects a) and b) have been considered to some extent in full-scale theoretical mod-
els to describe the CDI desalination cycle. Effects c)-f) have not yet been included in these CDI
transport models (effect c) to some extent in Ref. [22].
An important point to make is that it is not the case that when e.g. effect e) occurs, it will have to
happen to an equal (but opposite) extent in both electrodes. On the contrary, it may well be that one
effect of the list is important in the cathode, and a very different one in the anode. Thus, it is not the
case that an electron-transfer from carbon to water in one electrode (Faradaic electrochemical reac-
tions) must be compensated 1-to-1 by another Faradaic reaction in the other to conserve electron
balance. This is only true in a steady-state process, and CDI is not steady-state at any moment. In-
stead, a Faradaic reaction in one electrode can be compensated by a capacitive effect without elec-
tron-transfer in the other electrode. The only constraint in the CDI system is that the (electronic) cur-
rent running into the one electrode is the same in magnitude as the electronic current running out of
the other.

24
Figure 9 Overview of important electrochemical reactions and processes in CDI electrodes. Effects a-c
can be classified as non-Faradaic, and d-f as Faradaic processes.
5. Theory of ion transport and adsorption in CDI
In section 4 we discussed in general terms approaches to conceptually understand CDI. In the
present section we will discuss in more detail theoretical concepts to quantitatively describe ion
transport and ion storage properties of carbon electrodes for CDI. The literature on ion and water
transport in porous media is vast and we do not attempt a review of this field (cf. Ref. [75, 76] for an
introduction with references). Instead, here we will introduce several mathematical routes that have
shown to be effective tools in describing equilibrium and transport properties in CDI. Of course ap-
proximations are made in the theory, and by comparing theoretical predictions with actual perfor-
mance data, validity of the theory can be checked.
The mathematical approaches either require the solution of a set of algebraic equations (for EDL
equilibrium models, Section 5.1) or the solution of an ordinary differential equation for a simplified CDI
transport model, Section 5.2. Porous electrode theory presented in Section 5.3 requires the solution
of two coupled partial differential equations, simultaneously with several algebraic equations. Numeri-
cal examples elucidating the outcome of these models are given.
5.1. Electrostatic double layer models
5.1.1 Introduction
In this section we focus on describing salt adsorption and charge storage in the micropores within
the carbon particles using the concept of the electric double layer (EDL). Basically, the EDL-model
describes that across an interface (in our case, the carbon/electrolyte interface in the pores inside the
carbon particles) there can be charge separation, with some excess charge in one phase (i.e., the
25
electronic charge in the carbon matrix) locally charge-compensated by charge in the other phase (in
our case due to the ions in the electrolyte-filled pores). These two components of charge sum up to
zero, that is, as a whole, the EDL is uncharged. The concept of the EDL dates back to Helmholtz [77]
who assumed in the 19th century that all surface charge (either electronic charge in a conductor, or
chemically bound surface charge) is directly charge-compensated by countercharge adsorbed to
(“condensed onto”) the surface; put in other words: the condensed layer of counterions directly com-
pensates the surface charge. In this context, counterions are not to be mistaken with co-ions: counter-
ions are the ions of opposite charge as that of the surface (which in our case is the electronic charge
in the carbon, which can be of both positive and negative sign) and which are, therefore, attracted into
the micropores in the carbon upon introducing charge in the electrode. In contrast, co-ions have the
same charge sign as the surface and will be repelled away from the surface.
If the Helmholtz-model would hold, this would be an ideal situation for CDI: for every electron
transferred from one electrode to the other, one cation would be transferred into the cathode to com-
pensate the negative electronic charge there [assuming that all ions are monovalent], while one anion
would be transferred into the anode to compensate for the positive electronic charge there, and as a
result effectively one full salt molecule would be removed from the spacer channel. Thus, the charge
efficiency (to be defined below) would be unity: one salt molecule is removed for each electron
transferred from one to the other electrode. Note here that in CDI the definition of anode and cathode
is based on the charging step (when we adsorb salt): the cathode is where the cations go to during
charging. This is opposite to the definition in battery and supercapacitor applications, where anode
and cathode are defined based on where the ions go during electrode discharging.
Unfortunately, the Helmholtz model insufficiently describes the EDL structure in porous CDI elec-
trodes. For real systems, firstly we must consider the diffuse, or Gouy-Chapman (GC) layer [78, 79]
and secondly the inner (or compact) layer in between the electrode (the carbon matrix) and the diffuse
layer; this inner layer is also called Stern layer or Helmholtz layer. Combination of the diffuse layer
and (what is now called) Stern layer dates back to Stern in 1924 [80]. The diffuse layer considers that
ions do not condense in a plane right next to the surface, but remain diffusively distributed in a layer
close to the surface. This diffuse layer does not have a precise width, but instead, ion concentrations
progressively decay with increasing distance from the surface. The Debye length D is a characteristic
distance for the counterion concentration and potential to decay by a factor e (~2.7) (in the low-
voltage limit of the theory and for a planar single surface). For a NaCl solution of 10 mM ionic
strength, the Debye length is approximately D~3.1 nm at 20 C. As a rule of thumb, we can consider
the diffuse layer to have ended after 2- or 3-times the Debye length.
The above approach, as depicted graphically in Figure 10a, assumes that the diffuse layer ex-
tending from one surface is not “overlapping” with that of a nearby opposite surface. If, however, this
is the case, then the diffuse layer does have a finite extension, namely of half of the distance between
the two surfaces. This half-space contains all diffuse countercharge. Of course we have the same
situation for cylindrical pores, or pores of other geometries with a finite space for the diffuse layer to
form. This situation of “EDL overlap” will typically be the situation for the micropores (Ø < 2 nm) in ac-
tivated carbon particles as the average pore size is generally smaller than the Debye length.
26
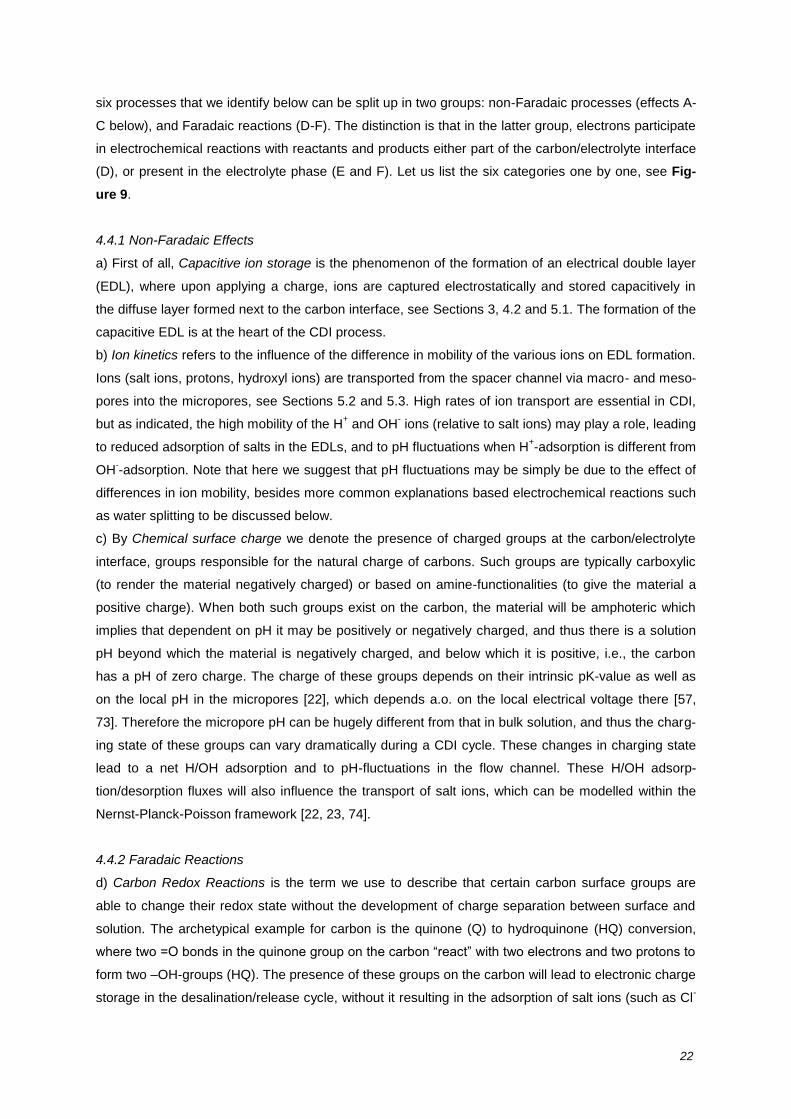
Figure 10 Models for charge and ion storage in porous CDI electrodes. (a) Structure of the electrical double
layer (EDL) according to the Gouy-Chapman-Stern theory for a single planar EDL. (b) Two-
porosity-model for the electrode[12, 14, 20, 57]. Both macro- and micropores are electrolyte-filled,
and in both we assume locally averaged ion concentrations (within the micropores described by
the Donnan model). The large and continuous interparticle pores (macropores) transport salt
across the electrode thickness and are charge neutral, with salt concentration c, while in the (in-
traparticle) micropores the excess ionic charge is charge-compensated by electrical charge lo-
cated in the carbon matrix.
As discussed, in the Gouy-Chapman (GC) model (Figure 10) the ions are not surface-adsorbed
in a condensed layer as considered by Helmholtz, but remain in solution because of their thermal mo-
tion. At equilibrium, the ion concentration profiles can be described in first approximation by the
Boltzmann distribution which is at the basis of the Poisson-Boltzmann equation. One of the key pre-
dictions of the Gouy-Chapman theory for the diffuse layer is that to compensate surface charge, two
routes are available. The first is counterion adsorption in the diffuse layer (the diffuse part of the EDL),
while the second option is co-ion desorption, which implies that ions that were close to the surface in
the absence of charge, are now being expelled because they have the same charge sign as the sur-
face charge that builds up. This effect is disadvantageous for CDI, because now for each electron
transferred between the two electrodes, only an extra, say, 0.6 or 0.8 ions are estimated to be stored
in each electrode (relative to the situation without charge) and (with the same process also occurring
in the other electrode), there will be only 0.6 or 0.8 salt molecules removed from the water flowing
through the spacer channel (we consider a monovalent salt in the present analysis). Thus, the charge
efficiency will drop significantly below 100% to values of 60-80%.

27
Figure 11 Effect of co-ion desorption from electrical double layers on salt adsorption in symmetric two-
electrode cell pair made of activated carbon containing electrodes, as quantified by the charge
efficiency (salt adsorption/charge-ratio). Data reproduced from Ref. [12, 58], see also Figure
12.
Unfortunately, the situation sketched above is by far not the worst situation, because the charge
efficiency can drop even further, all the way to zero. Zero salt adsorption is possible because at low
voltages we approach the Debye-Hückel (DH) limit, a limit that is reached when the EDL voltage
drops below the thermal voltage VT, which is VT=kBT/e=RT/F~25.7 mV at room temperature. In the
DH-limit, electronic charge is compensated for 50% by counterion adsorption and for 50% by co-ion
desorption, i.e., co-ions that were in the electrode micropores prior to applying the electrical charge,
are now expelled from the micropores. Consequently, the full electrode pair consisting of the two po-
rous electrodes (one in which the electrical charge is positive, the other negative) removes exactly
zero salt from the water channel that is in between the electrodes. Data in the literature quantitatively
underpin this effect, namely that with increasing cell voltage not only (1) the charge increases relative-
ly linearly (as expected), but (2) also the charge efficiency increases, from zero to unity [58]. As salt
adsorption is the product of these two parameters, it increases more than linearly with increasing cell
voltage, or charge, see Figure 11.
In CDI we typically work at cell voltages above 1.0 V, and thus, for a symmetrical cell design the
EDL-voltage will be above 0.5 V, which is about 20-times the “thermal voltage”, very far from the DH
limit. For such high voltages, GC-theory would predict that for each extra electron transferred between
anode and cathode, we are very close to removing a complete salt molecule from the water, because
in each electrode we have only counterion adsorption and no longer any co-ion desorption because
all co-ions initially present have already been expelled and there are none left. Thus, we expect the
charge efficiency to be close to ~1. Unfortunately, this is not the case. The origin of this discrepancy
is the importance of the Stern layer which is the thin dielectric layer in between the charged surface
and the start of the diffuse layer, as depicted in Figure 10. This “start of the diffuse layer” (or Stern
plane) can in first approximation be considered as the closest-approach-plane for the centers of the
ions to the charged carbon surface, with the thickness of the Stern layer corresponding to the (hydrat-

28
ed) radius of the ion, for example, 0.3 nm (see Figure 10). Across this dielectric layer (which is un-
charged of its own, i.e., does not contain ions), the voltage drop can be very high. Our estimates are
that it is not improbable that 80% of the applied voltage drops across this layer for the microporous
carbons currently used for CDI. However, note that this does not imply that 80% of the energy invest-
ed in water desalination by CDI will be lost in this way, as the energy associated with the Stern layer
is simply stored and can be completely recovered when the cell is discharged again. Thus, the Stern
layer does not contain charge but it is a dielectric layer separating two regions of opposite charge,
which acts as a capacity that is charged and discharged. Finally, it is important to realize that in the
simplest GCS-model as depicted in Figure 10 the intersection of Stern and diffuse layer, which is the
Stern plane, neither contains any charge nor (electro-)adsorbed ions. Instead, the Stern plane only
denotes the closest-approach-distance for ions to come to the surface.
The two concepts discussed above, namely the diffuse layer of diffusely distributed ions in the
electrolyte-filled pores, and the dielectric Stern layer separating that layer from the carbon matrix
structure, will be used in the further theory. Note that the Donnan model, discussed in Section 5.1.3,
assumes that the diffuse layer has properties independent of the distance from the Stern plane, but
otherwise this “Donnan part” of the model is similar to the diffuse Gouy-Chapman layer.
5.1.2 Gouy-Chapman-Stern theory for non-overlapping EDLs
Electrostatic double layer (EDL) theory is most often applied to derive a relation between stored
charge (density) and the voltage difference across the EDL, that is, the voltage difference between
the conducting electrode material (“matrix”, or “carbon” in our case) and a location outside the EDL.
“Outside the EDL” is defined as a position sufficiently far away from the surface that local charge neu-
trality is regained and thus (for a 1:1 salt) the concentration of cations equals that of the anions. The
necessary distance depends on many factors but, for example, for a 10 mM salt solution a distance of
10 nm will be more than sufficient. EDL-theory is an equilibrium theory and equilibrium formally as-
sumes that no further changes occur over time. One might suppose that such a theory cannot be ap-
plied for a dynamic process like CDI where - by definition – the transport rate of ions into the EDLs is
always significant. Still, in the EDL layer of a few nanometers in thickness, local equilibrium can be
assumed: even though there are significant ion transport fluxes across the electrode during the pro-
cess of desalination, the charge-voltage (and salt-voltage) relations that describe ion concentrations
in the micropores are very well described by assuming local equilibrium in the EDL layers. Formal
derivations for the validity of this assumption are given in Ref. [81], but the main reason is simply the
very short (nm-scale) typical thickness of the EDL across which equilibration will be very fast, relative
to the time-scale of seconds and minutes in a full CDI-cell with typical dimensions of the electrode
layers of more than 100 µm and full cell dimensions of 10s of cm’s.
The majority of literature on EDL-theory focuses on the amount of stored charge in the EDL.
However, for CDI we are more interested in the total number of ions stored in the EDL. This “salt stor-
age” has been studied in much less detail than the classical charge-voltage relationship of EDLs. In-
terestingly, the same EDL-model that predicts the charge vs. voltage relation also predicts the salt vs.
voltage relation. An important effect is that at low voltages across the EDL, the capacity for charge
29
storage is non-zero (i.e., the slope of the charge vs. voltage-curve is non-zero), but the capacity for
salt storage will be zero. This effect implies that CDI is inherently a non-linear process [21]: voltages
are required across the diffuse part of the EDL that are at least a few times the thermal voltage (VT,
which is ~25.7 mV at room temperature) to have water desalination by porous electrodes.
The equilibrium ratio of salt removal (in a 1:1 salt solution) vs. charge using a two-electrode set-
up, is called the charge efficiency, . Experiments reported in Ref. [58] show that at low cell voltages
(the applied voltage between the two electrodes), the charge efficiency approaches zero, and only
approaches unity, which is the theoretical maximum, at cell voltages well above Vcell=1.0 V, and only
at low enough ionic strength (see Figure 11 for csalt=20 mM). Note that “charge” in this definition is the
charge expressed in the same dimension as salt removal, either in moles, moles/area, or
moles/gram electrode, etc. To convert from charge F in the more common dimension of C (Coulomb)
per area or per gram, to we must divide by Faraday’s number, F = 96485 C/mol. In the sections
below, both and F are used. Also the pore charge density, to be discussed below, mi, is expressed
in mol/m3=mM, and can likewise be derived from the volumetric charge density in C/m
3 by dividing by
Faraday’s number.
Several of the above concepts, such as the difference between ion adsorption and charge stor-
age, are depicted in Figure 12, conceptually based on a classical figure that was first presented by
Soffer and Oren in 1983 [34], see also Ref. [82]. In Figure 12 we show the adsorption into the carbon
pores of cations and anions from a monovalent (NaCl) solution, as a function of the electrode charge.
Ion concentrations are defined per unit carbon micropore volume which is estimated for the activated
porous carbon tested to be ~0.75 mL/g. The data are calculated from the measured charge and salt
adsorption in a two-electrode setup [12, 58]. To construct Figure 12 both theoretically (here based on
the modified Donnan-model to be discussed in section 5.1.3), and experimentally, the assumption of
symmetry is made, which implies that the anion adsorption (cation desorption) in the anode equals
the cation adsorption (anion desorption) in the cathode; this also implies that the applied cell voltage
is assumed to be equally divided over both electrodes. Our experimental work reported in Ref. [57]
suggests that this assumption is very appropriate, at least for electrodes based on activated carbon
powders that have not undergone modifications to introduce specific chemical groups. Figure 12
shows that when we increase the micropore charge from zero, that the counterion adsorption in-
creases at the same rate as the co-ion desorption, and thus the net salt adsorption in the micropores
will be zero. With further increasing charge the co-ion desorption levels off and does not increase fur-
ther and we reach the limit that for each increment in charge, an equal increment in counterion ad-
sorption can be expected. This is the ideal situation that for each (additional) electron transferred be-
tween the electrodes, an (additional) full salt molecule is removed from solution. Consequently, Fig-
ure 12 suggests that it may be favorable to operate CDI not by discharging from a charge of say 100
C/mL back to 0 before starting a new cycle, but that a cycle where we go from, for instance, +100
C/mL charge back to +50 C/mL charge (with reversed numbers in the opposite electrode) may be ad-
vantageous.

30
Figure 12 (a, b) Typical curves for anion and cation equilibrium adsorption in the micropores of activated
carbon electrodes, based on data from Ref. [12], expressed as moles of ions adsorbed per vol-
ume of micropores. Theoretical lines are based on the modified-Donnan model. Note that the mi-
cropore charge is always higher than the salt adsorption. (* Salt adsorption relative to the situa-
tion of zero charge).
A large range of models are available to describe the structure of the EDL at planar surfaces and
in the pores of charged materials and electrodes. The literature is extensive and we will not attempt a
review. In the context of CDI and supercapacitors, advanced EDL-models describing ion removal and
charge have been set up [83-88]. In the next two sections we will summarize two more simple mean-
field approaches that can be used in two important limits, namely (1) the limit that the typical pore size
(radius) is much larger than the Debye length, where we use the Gouy-Chapman-Stern (GCS) theory,
and (2) the opposite limit where the pore size is small relative to the Debye length. For the latter, the
EDLs overlap strongly and we can use a “modified Donnan” (mD) approach. These two models have
the important property that they are mathematically sufficiently tractable to be implemented readily in
larger-scale transport models, as we will show in Sections 5.2 and 5.3. More complicated EDL models
may not allow one to do this easily.
Thus, in case we have a porous material with pores sufficiently large compared to the EDL-
thickness, we can assume that the EDLs do not overlap and we can use the classical Gouy-
Chapman-Stern (GCS) theory developed for a single (“isolated”), planar (flat) electrode. This limit is
approached both in high salt concentration (short Debye length), or for very large pores (macropores).
In that case the general Boltzmann relationship gives the ion concentration at position x away from
the carbon surface, as function of , the dimensionless potential relative to that in the neutral
macropores, where the ion (salt) concentration is csalt,mA, as
j salt,mA jexpc x c z x (1)

31
with zj the ionic charge number (ion valence), and defined as the dimensional voltage V divided by
VT. Eq. 1 is valid for ions as point-charges in the mean-field approximation, and can be integrated
across the diffuse layer to obtain for the surface charge density, , in mol/m2,
1D salt,mA d2
4 sinhc (2)
where D is the Debye length, given by D=1/, with the inverse Debye length, , given by
2
salt,mA2
B salt,mA av
r 0
28
F cc N
RT
(3)
with r0 the dielectric permittivity of water (= 78·8.85410-12
C/Vm), R the universal gas constant, T
temperature, B the Bjerrum length, given by 2
B r 0 av/ 4F RT N , and Nav Avogadro’s number.
The Bjerrum length is B=0.72 nm at room temperature. The surface charge density, , is defined in
moles of charges per unit area of the electrolyte/carbon interface and can be multiplied by F to obtain
the surface charge density in C/m2.
From Eq. 1 we can also derive the total concentration of ions stored in the EDL, given by
Ref. [58, 81]
2 1D salt,mA d4
8 sinhw c (4)
Next we define the charge efficiency, , as an experimentally accessible parameter for any CDI
cell geometry, as given by Ref. [58, 81]
salt
(5)
where salt is the removed amount of salt upon applying a cell voltage (e.g., in moles per gram of all
electrodes together) and is the total charge transferred (obtained from F in C/gram divided by F).
This equation can be used for any CDI experiment, as long as the current (which can be integrated in
time to obtain F) and the salt removal are measured (see Section 3.5 for a description of various
methods). Thus, Eq. 5 is equally valid for symmetric as for asymmetric CDI cells, and likewise is valid
for electrodes where redox reactions play a role.
The charge efficiency is an equilibrium property; thus, measurements require sufficient time for
desalination to come to an end after a certain cell voltage has been applied. To adequately describe
the salt/charge ratio while the CDI-process is continuing, one option is to use the term “dynamic
charge efficiency” [14]. Typically, we define charge efficiency for an experiment where we step up the
cell voltage from zero to a certain value. However, it is also possible to go from a certain non-zero cell
voltage Vcell,1 to a second value, Vcell,2 and base on the resulting change in and [34]. One can
also develop alternative definitions, such as a differential charge efficiency, which can be defined in
many different ways, for example, as the slope in a plot of vs. Vcell, or the slope in vs. , and so
on. In a transport model one can use a differential charge efficiency to relate the ions flux into an elec-
trode, to the current, as in Ref. [89]. In the present work we focus on the equilibrium charge efficiency
and use it to describe an experiment with a cell voltage of zero, Vcell = 0, as reference.
The charge efficiency cannot only be measured, but can also be predicted based on EDL-
theories. In this section we do this on the basis of the “single-plane” GCS-theory. Additional to the
assumptions underlying the GCS-theory we will also assume that we describe an experiment with two
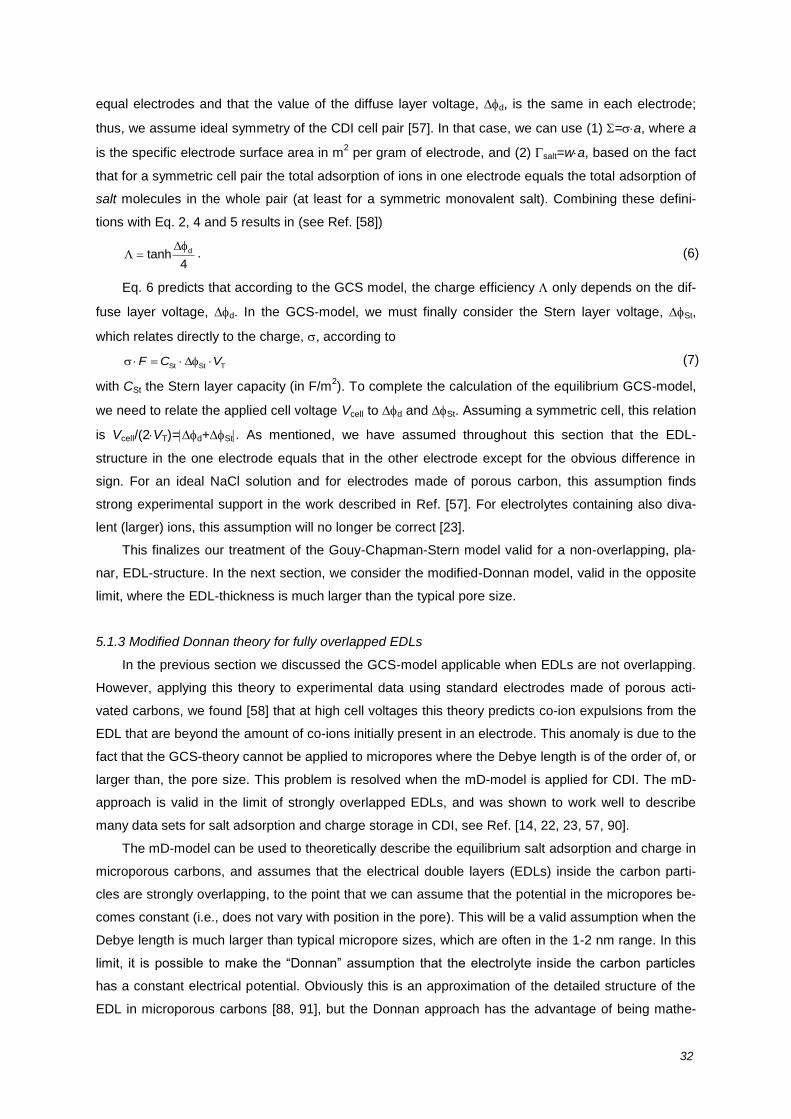
32
equal electrodes and that the value of the diffuse layer voltage, d, is the same in each electrode;
thus, we assume ideal symmetry of the CDI cell pair [57]. In that case, we can use (1) =a, where a
is the specific electrode surface area in m2 per gram of electrode, and (2) salt=wa, based on the fact
that for a symmetric cell pair the total adsorption of ions in one electrode equals the total adsorption of
salt molecules in the whole pair (at least for a symmetric monovalent salt). Combining these defini-
tions with Eq. 2, 4 and 5 results in (see Ref. [58])
dtanh4
. (6)
Eq. 6 predicts that according to the GCS model, the charge efficiency only depends on the dif-
fuse layer voltage, d. In the GCS-model, we must finally consider the Stern layer voltage, St,
which relates directly to the charge, , according to
St St TF C V (7)
with CSt the Stern layer capacity (in F/m2). To complete the calculation of the equilibrium GCS-model,
we need to relate the applied cell voltage Vcell to d and St. Assuming a symmetric cell, this relation
is Vcell/(2VT)=d+St. As mentioned, we have assumed throughout this section that the EDL-
structure in the one electrode equals that in the other electrode except for the obvious difference in
sign. For an ideal NaCl solution and for electrodes made of porous carbon, this assumption finds
strong experimental support in the work described in Ref. [57]. For electrolytes containing also diva-
lent (larger) ions, this assumption will no longer be correct [23].
This finalizes our treatment of the Gouy-Chapman-Stern model valid for a non-overlapping, pla-
nar, EDL-structure. In the next section, we consider the modified-Donnan model, valid in the opposite
limit, where the EDL-thickness is much larger than the typical pore size.
5.1.3 Modified Donnan theory for fully overlapped EDLs
In the previous section we discussed the GCS-model applicable when EDLs are not overlapping.
However, applying this theory to experimental data using standard electrodes made of porous acti-
vated carbons, we found [58] that at high cell voltages this theory predicts co-ion expulsions from the
EDL that are beyond the amount of co-ions initially present in an electrode. This anomaly is due to the
fact that the GCS-theory cannot be applied to micropores where the Debye length is of the order of, or
larger than, the pore size. This problem is resolved when the mD-model is applied for CDI. The mD-
approach is valid in the limit of strongly overlapped EDLs, and was shown to work well to describe
many data sets for salt adsorption and charge storage in CDI, see Ref. [14, 22, 23, 57, 90].
The mD-model can be used to theoretically describe the equilibrium salt adsorption and charge in
microporous carbons, and assumes that the electrical double layers (EDLs) inside the carbon parti-
cles are strongly overlapping, to the point that we can assume that the potential in the micropores be-
comes constant (i.e., does not vary with position in the pore). This will be a valid assumption when the
Debye length is much larger than typical micropore sizes, which are often in the 1-2 nm range. In this
limit, it is possible to make the “Donnan” assumption that the electrolyte inside the carbon particles
has a constant electrical potential. Obviously this is an approximation of the detailed structure of the
EDL in microporous carbons [88, 91], but the Donnan approach has the advantage of being mathe-
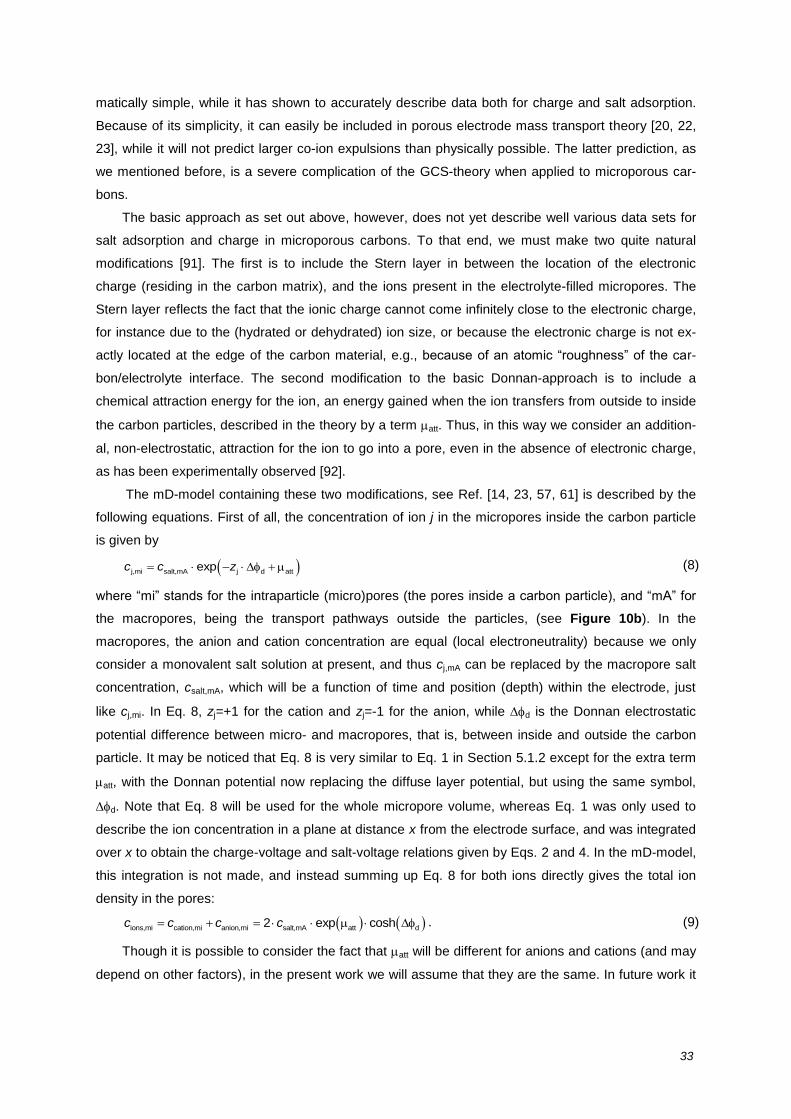
33
matically simple, while it has shown to accurately describe data both for charge and salt adsorption.
Because of its simplicity, it can easily be included in porous electrode mass transport theory [20, 22,
23], while it will not predict larger co-ion expulsions than physically possible. The latter prediction, as
we mentioned before, is a severe complication of the GCS-theory when applied to microporous car-
bons.
The basic approach as set out above, however, does not yet describe well various data sets for
salt adsorption and charge in microporous carbons. To that end, we must make two quite natural
modifications [91]. The first is to include the Stern layer in between the location of the electronic
charge (residing in the carbon matrix), and the ions present in the electrolyte-filled micropores. The
Stern layer reflects the fact that the ionic charge cannot come infinitely close to the electronic charge,
for instance due to the (hydrated or dehydrated) ion size, or because the electronic charge is not ex-
actly located at the edge of the carbon material, e.g., because of an atomic “roughness” of the car-
bon/electrolyte interface. The second modification to the basic Donnan-approach is to include a
chemical attraction energy for the ion, an energy gained when the ion transfers from outside to inside
the carbon particles, described in the theory by a term att. Thus, in this way we consider an addition-
al, non-electrostatic, attraction for the ion to go into a pore, even in the absence of electronic charge,
as has been experimentally observed [92].
The mD-model containing these two modifications, see Ref. [14, 23, 57, 61] is described by the
following equations. First of all, the concentration of ion j in the micropores inside the carbon particle
is given by
j,mi salt,mA j d attexpc c z (8)
where “mi” stands for the intraparticle (micro)pores (the pores inside a carbon particle), and “mA” for
the macropores, being the transport pathways outside the particles, (see Figure 10b). In the
macropores, the anion and cation concentration are equal (local electroneutrality) because we only
consider a monovalent salt solution at present, and thus cj,mA can be replaced by the macropore salt
concentration, csalt,mA, which will be a function of time and position (depth) within the electrode, just
like cj,mi. In Eq. 8, zj=+1 for the cation and zj=-1 for the anion, while d is the Donnan electrostatic
potential difference between micro- and macropores, that is, between inside and outside the carbon
particle. It may be noticed that Eq. 8 is very similar to Eq. 1 in Section 5.1.2 except for the extra term
att, with the Donnan potential now replacing the diffuse layer potential, but using the same symbol,
d. Note that Eq. 8 will be used for the whole micropore volume, whereas Eq. 1 was only used to
describe the ion concentration in a plane at distance x from the electrode surface, and was integrated
over x to obtain the charge-voltage and salt-voltage relations given by Eqs. 2 and 4. In the mD-model,
this integration is not made, and instead summing up Eq. 8 for both ions directly gives the total ion
density in the pores:
ions,mi cation,mi anion,mi salt,mA att d2 exp coshc c c c . (9)
Though it is possible to consider the fact that att will be different for anions and cations (and may
depend on other factors), in the present work we will assume that they are the same. In future work it
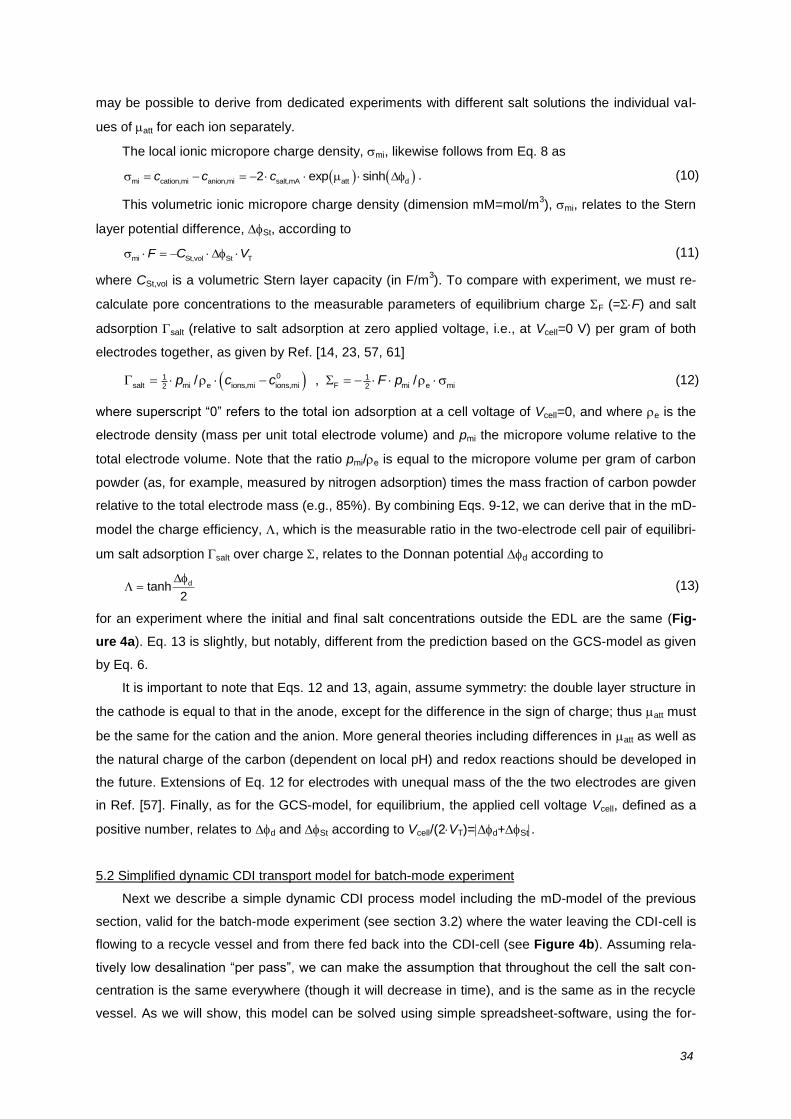
34
may be possible to derive from dedicated experiments with different salt solutions the individual val-
ues of att for each ion separately.
The local ionic micropore charge density, mi, likewise follows from Eq. 8 as
mi cation,mi anion,mi salt,mA att d2 exp sinhc c c . (10)
This volumetric ionic micropore charge density (dimension mM=mol/m3), mi, relates to the Stern
layer potential difference, St, according to
mi St,vol St TF C V (11)
where CSt,vol is a volumetric Stern layer capacity (in F/m3). To compare with experiment, we must re-
calculate pore concentrations to the measurable parameters of equilibrium charge F (=F) and salt
adsorption salt (relative to salt adsorption at zero applied voltage, i.e., at Vcell=0 V) per gram of both
electrodes together, as given by Ref. [14, 23, 57, 61]
01 1salt mi e ions,mi ions,mi F mi e mi2 2
/ , /p c c F p (12)
where superscript “0” refers to the total ion adsorption at a cell voltage of Vcell=0, and where e is the
electrode density (mass per unit total electrode volume) and pmi the micropore volume relative to the
total electrode volume. Note that the ratio pmi/e is equal to the micropore volume per gram of carbon
powder (as, for example, measured by nitrogen adsorption) times the mass fraction of carbon powder
relative to the total electrode mass (e.g., 85%). By combining Eqs. 9-12, we can derive that in the mD-
model the charge efficiency, , which is the measurable ratio in the two-electrode cell pair of equilibri-
um salt adsorption salt over charge , relates to the Donnan potential d according to
dtanh2
(13)
for an experiment where the initial and final salt concentrations outside the EDL are the same (Fig-
ure 4a). Eq. 13 is slightly, but notably, different from the prediction based on the GCS-model as given
by Eq. 6.
It is important to note that Eqs. 12 and 13, again, assume symmetry: the double layer structure in
the cathode is equal to that in the anode, except for the difference in the sign of charge; thus att must
be the same for the cation and the anion. More general theories including differences in att as well as
the natural charge of the carbon (dependent on local pH) and redox reactions should be developed in
the future. Extensions of Eq. 12 for electrodes with unequal mass of the the two electrodes are given
in Ref. [57]. Finally, as for the GCS-model, for equilibrium, the applied cell voltage Vcell, defined as a
positive number, relates to d and St according to Vcell/(2VT)=d+St.
5.2 Simplified dynamic CDI transport model for batch-mode experiment
Next we describe a simple dynamic CDI process model including the mD-model of the previous
section, valid for the batch-mode experiment (see section 3.2) where the water leaving the CDI-cell is
flowing to a recycle vessel and from there fed back into the CDI-cell (see Figure 4b). Assuming rela-
tively low desalination “per pass”, we can make the assumption that throughout the cell the salt con-
centration is the same everywhere (though it will decrease in time), and is the same as in the recycle
vessel. As we will show, this model can be solved using simple spreadsheet-software, using the for-

35
ward Euler method, see box 1. This model assumes symmetry at several points, namely that the
EDL-structure in the anode is the same as that in the cathode, except for the obvious difference in
sign. The presented model describes CDI and does not include the membranes, required for a de-
scription of membrane-assisted CDI (MCDI).
We will develop this transport model on the basis of the modified Donnan (mD) model (Section
5.1.3) as this seems to be the most suitable EDL-model for CDI. When desired, it can also be set up
based on the GCS-model.
The model is based on a cell balance for the ionic charge density in the intraparticle micropores,
mi, which relates to the current density J running from electrode to electrode, as given by
mimi
d
dv J A
t
, (14)
where J is defined in mol/m2/s, and where A is the electrode area (that is, the area of the spacer
channel covered by the porous electrode, either anode or cathode), and vmi is the micropore volume
in all electrodes of the same sign (i.e., all anodes, or all cathodes). The volume vmi excludes the vol-
ume of the interparticle macropores in the electrode, which is included in vtot. To obtain the current as
measured externally in A (Ampère), we can multiply JA by Faraday’s constant, F. The current J de-
pends on the driving force for transport, tr, which is the applied cell voltage minus the voltages in
the EDLs in both electrodes, and it will depend on the resistance, to which there are contributions
both in the spacer channel and within the electrode. The resistance in the spacer is a linear resistance
as all charge effectively has to transfer from one electrode across the channel to the other. Within the
electrode, however, the situation is very different because charge will be stored in a distributed fash-
ion, and the ion concentration profile increasingly penetrates into the electrode (see Sections 5.3 and
6.3): initially there is hardly any resistance in the electrode as ions will be stored right next to the inter-
face with the spacer. It is only with the passing of time that the ions will need to travel a constantly
increasing distance to reach unsaturated pores. To describe all these effects, porous electrode theory
is required which will be treated in the next section.
In a simplified transport model, the macropore concentration is assumed constant across the
electrode and an ionic electrode resistance is included [12, 93]. Without membranes, we combine this
resistance inside the electrode with that in the spacer channel. To describe the current-voltage rela-
tion, we will not assume a constant resistance but include how the resistance increases when the salt
concentration goes down. We assume that at each moment in time the salt concentration within the
electrode macropores (the transport pathways in the electrode) is the same as in the spacer channel.
Therefore, we can use a single relation between J, tr, and c (with c being the salt concentration,
assumed equal in spacer channel, macropores, and recycle vessel), resulting for J in
trJ k c , (15)
where k is an effective total transport coefficient (in m/s) and tr is the dimensionless voltage drop
that drives transport, that is, the voltage between the outer region of the EDLs in the one electrode
and in the other electrode. This voltage drop, tr, relates to the cell voltage, Vcell, and the EDL-
voltages according to
cell T St d tr St d tr St danode cathode/ 2V V , (16)
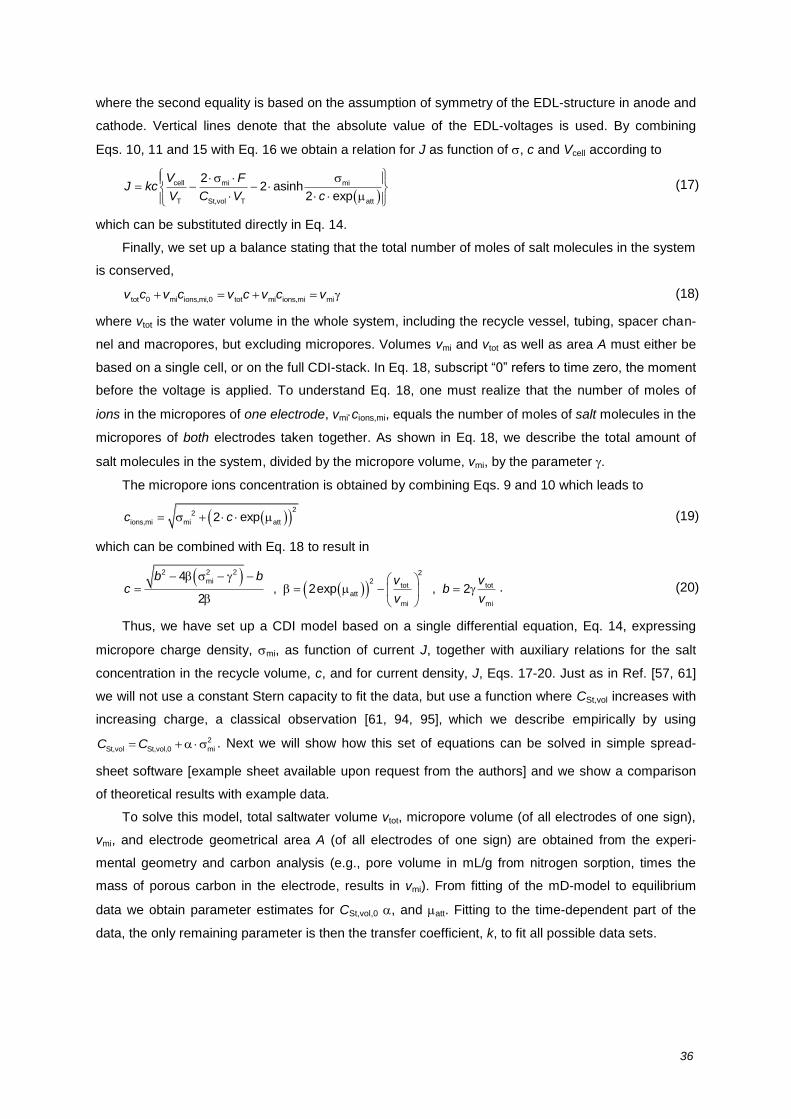
36
where the second equality is based on the assumption of symmetry of the EDL-structure in anode and
cathode. Vertical lines denote that the absolute value of the EDL-voltages is used. By combining
Eqs. 10, 11 and 15 with Eq. 16 we obtain a relation for J as function of , c and Vcell according to
cell mi mi
T St,vol T att
22 asinh
2 exp
V FJ kc
V C V c
(17)
which can be substituted directly in Eq. 14.
Finally, we set up a balance stating that the total number of moles of salt molecules in the system
is conserved,
tot 0 mi ions,mi,0 tot mi ions,mi miv c v c v c v c v (18)
where vtot is the water volume in the whole system, including the recycle vessel, tubing, spacer chan-
nel and macropores, but excluding micropores. Volumes vmi and vtot as well as area A must either be
based on a single cell, or on the full CDI-stack. In Eq. 18, subscript “0” refers to time zero, the moment
before the voltage is applied. To understand Eq. 18, one must realize that the number of moles of
ions in the micropores of one electrode, vmicions,mi, equals the number of moles of salt molecules in the
micropores of both electrodes taken together. As shown in Eq. 18, we describe the total amount of
salt molecules in the system, divided by the micropore volume, vmi, by the parameter .
The micropore ions concentration is obtained by combining Eqs. 9 and 10 which leads to
2
2
ions,mi mi att2 expc c (19)
which can be combined with Eq. 18 to result in
2 2 2 22mi
tot totatt
mi mi
4 , 2exp , 2
2
b b v vc b
v v
. (20)
Thus, we have set up a CDI model based on a single differential equation, Eq. 14, expressing
micropore charge density, mi, as function of current J, together with auxiliary relations for the salt
concentration in the recycle volume, c, and for current density, J, Eqs. 17-20. Just as in Ref. [57, 61]
we will not use a constant Stern capacity to fit the data, but use a function where CSt,vol increases with
increasing charge, a classical observation [61, 94, 95], which we describe empirically by using
2
St,vol St,vol,0 miC C . Next we will show how this set of equations can be solved in simple spread-
sheet software [example sheet available upon request from the authors] and we show a comparison
of theoretical results with example data.
To solve this model, total saltwater volume vtot, micropore volume (of all electrodes of one sign),
vmi, and electrode geometrical area A (of all electrodes of one sign) are obtained from the experi-
mental geometry and carbon analysis (e.g., pore volume in mL/g from nitrogen sorption, times the
mass of porous carbon in the electrode, results in vmi). From fitting of the mD-model to equilibrium
data we obtain parameter estimates for CSt,vol,0 , and att. Fitting to the time-dependent part of the
data, the only remaining parameter is then the transfer coefficient, k, to fit all possible data sets.
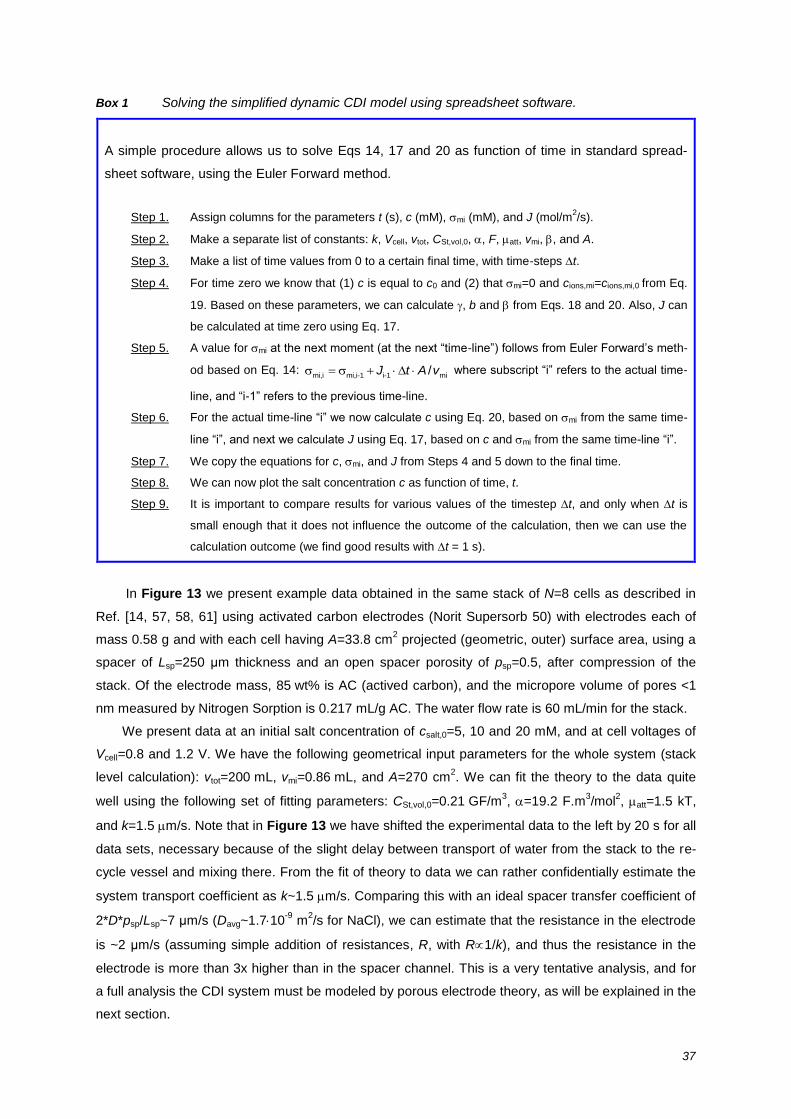
37
Box 1 Solving the simplified dynamic CDI model using spreadsheet software.
A simple procedure allows us to solve Eqs 14, 17 and 20 as function of time in standard spread-
sheet software, using the Euler Forward method.
Step 1. Assign columns for the parameters t (s), c (mM), mi (mM), and J (mol/m2/s).
Step 2. Make a separate list of constants: k, Vcell, vtot, CSt,vol,0, , F, att, vmi, , and A.
Step 3. Make a list of time values from 0 to a certain final time, with time-steps t.
Step 4. For time zero we know that (1) c is equal to c0 and (2) that mi=0 and cions,mi=cions,mi,0 from Eq.
19. Based on these parameters, we can calculate , b and from Eqs. 18 and 20. Also, J can
be calculated at time zero using Eq. 17.
Step 5. A value for mi at the next moment (at the next “time-line”) follows from Euler Forward’s meth-
od based on Eq. 14: mi,i mi,i-1 i-1 mi/J t A v
where subscript “i” refers to the actual time-
line, and “i-1” refers to the previous time-line.
Step 6. For the actual time-line “i” we now calculate c using Eq. 20, based on mi from the same time-
line “i”, and next we calculate J using Eq. 17, based on c and mi from the same time-line “i”.
Step 7. We copy the equations for c, mi, and J from Steps 4 and 5 down to the final time.
Step 8. We can now plot the salt concentration c as function of time, t.
Step 9. It is important to compare results for various values of the timestep t, and only when t is
small enough that it does not influence the outcome of the calculation, then we can use the
calculation outcome (we find good results with t = 1 s).
In Figure 13 we present example data obtained in the same stack of N=8 cells as described in
Ref. [14, 57, 58, 61] using activated carbon electrodes (Norit Supersorb 50) with electrodes each of
mass 0.58 g and with each cell having A=33.8 cm2 projected (geometric, outer) surface area, using a
spacer of Lsp=250 µm thickness and an open spacer porosity of psp=0.5, after compression of the
stack. Of the electrode mass, 85 wt% is AC (actived carbon), and the micropore volume of pores <1
nm measured by Nitrogen Sorption is 0.217 mL/g AC. The water flow rate is 60 mL/min for the stack.
We present data at an initial salt concentration of csalt,0=5, 10 and 20 mM, and at cell voltages of
Vcell=0.8 and 1.2 V. We have the following geometrical input parameters for the whole system (stack
level calculation): vtot=200 mL, vmi=0.86 mL, and A=270 cm2. We can fit the theory to the data quite
well using the following set of fitting parameters: CSt,vol,0=0.21 GF/m3, =19.2 F.m
3/mol
2, att=1.5 kT,
and k=1.5 m/s. Note that in Figure 13 we have shifted the experimental data to the left by 20 s for all
data sets, necessary because of the slight delay between transport of water from the stack to the re-
cycle vessel and mixing there. From the fit of theory to data we can rather confidentially estimate the
system transport coefficient as k~1.5 m/s. Comparing this with an ideal spacer transfer coefficient of
2*D*psp/Lsp~7 µm/s (Davg~1.710-9
m2/s for NaCl), we can estimate that the resistance in the electrode
is ~2 µm/s (assuming simple addition of resistances, R, with R1/k), and thus the resistance in the
electrode is more than 3x higher than in the spacer channel. This is a very tentative analysis, and for
a full analysis the CDI system must be modeled by porous electrode theory, as will be explained in the
next section.
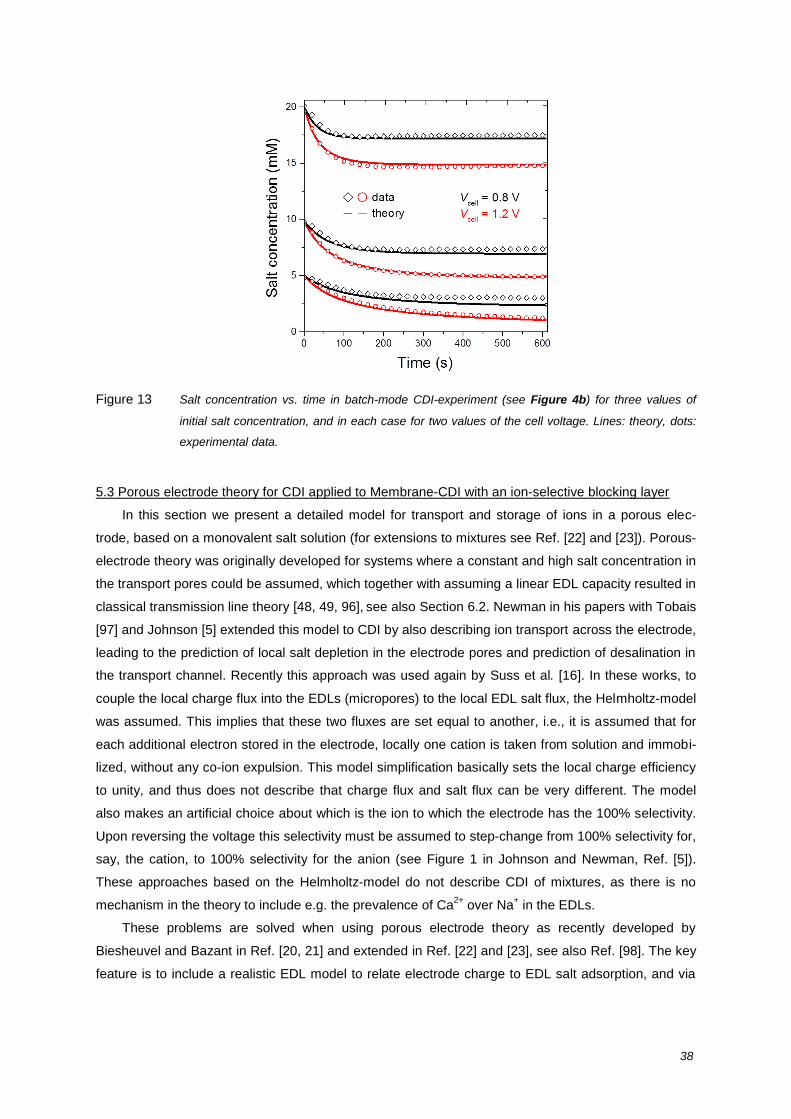
38
Figure 13 Salt concentration vs. time in batch-mode CDI-experiment (see Figure 4b) for three values of
initial salt concentration, and in each case for two values of the cell voltage. Lines: theory, dots:
experimental data.
5.3 Porous electrode theory for CDI applied to Membrane-CDI with an ion-selective blocking layer
In this section we present a detailed model for transport and storage of ions in a porous elec-
trode, based on a monovalent salt solution (for extensions to mixtures see Ref. [22] and [23]). Porous-
electrode theory was originally developed for systems where a constant and high salt concentration in
the transport pores could be assumed, which together with assuming a linear EDL capacity resulted in
classical transmission line theory [48, 49, 96], see also Section 6.2. Newman in his papers with Tobais
[97] and Johnson [5] extended this model to CDI by also describing ion transport across the electrode,
leading to the prediction of local salt depletion in the electrode pores and prediction of desalination in
the transport channel. Recently this approach was used again by Suss et al. [16]. In these works, to
couple the local charge flux into the EDLs (micropores) to the local EDL salt flux, the Helmholtz-model
was assumed. This implies that these two fluxes are set equal to another, i.e., it is assumed that for
each additional electron stored in the electrode, locally one cation is taken from solution and immobi-
lized, without any co-ion expulsion. This model simplification basically sets the local charge efficiency
to unity, and thus does not describe that charge flux and salt flux can be very different. The model
also makes an artificial choice about which is the ion to which the electrode has the 100% selectivity.
Upon reversing the voltage this selectivity must be assumed to step-change from 100% selectivity for,
say, the cation, to 100% selectivity for the anion (see Figure 1 in Johnson and Newman, Ref. [5]).
These approaches based on the Helmholtz-model do not describe CDI of mixtures, as there is no
mechanism in the theory to include e.g. the prevalence of Ca2+
over Na+ in the EDLs.
These problems are solved when using porous electrode theory as recently developed by
Biesheuvel and Bazant in Ref. [20, 21] and extended in Ref. [22] and [23], see also Ref. [98]. The key
feature is to include a realistic EDL model to relate electrode charge to EDL salt adsorption, and via

39
surface conservation laws relate these to the EDL charge flux and ion (salt) fluxes respectively. We
will discuss this model in the present section.
The porous electrode theory describes as a function of the depth in the electrode (x) and time (t)
the following coupled variables: the concentration in the interparticle macropores, cmA, the potential
there, mA, the charge density in the intraparticle micropores, mi, and the net salt adsorption in the
micropores. The latter variable will be described using an effective salt concentration, ceff, which is a
summation over all pores of the total ion concentration (divided by 2 to get a salt concentration), de-
fined per unit total electrode volume, thus
1eff mA mA mi ions,mi2
c p c p c . (21)
where pmA is the macroporosity of the electrode and pmi is the microporosity (per volume unit of total
electrode). All these parameters depend on depth x and time t, and only after sufficient time they level
off to their final, equilibrium, value when gradients through the electrode become zero. Equilibrium
properties are described by the set of equations given for the mD-model in Section 5.1.3.
In the following one-dimensional example calculation, we consider a monovalent salt with both
ions having the same diffusion coefficient, D. This D is an effective diffusion coefficient for transport in
the macropores, which contains a contribution of pore tortuosity. We will not consider transport out-
side the electrode, but we will consider the presence of an ion-selective membrane layer between
spacer and electrode to simulate membrane-CDI.
Outside the membrane, we assume a constant salt concentration, csp. The membrane in front of
the electrode is assumed to be 100% permselective, that is, only counterions can go through; we also
neglect a transport resistance within the membrane. In that case the total potential drop from spacer
across the membrane (including the two EDL Donnan edges of the membrane) to a point in the
macropores located at the edge with the membrane is
sp
mem
mA
lnc
c
(22)
which is based on a cation-exchange membrane (otherwise a minus-sign must be added), with cmA
the macropore salt concentration in the electrode, right next to the membrane. Within the electrode
the salt mass balance is given by
2
eff mAmA 2
c cp D
t x
(23)
with x the position across the electrode, 0<x<L, where L is the electrode thickness, and D the ion dif-
fusion coefficient in the interparticle macropores. Furthermore, the micropore charge balance is given
by
mi mAmi mA mA2p p D c
t x x
. (24)
At each position in the electrode, the macropore potential mA is related to that in the carbon ma-
trix, 1, according to
d St 1 mA , (25)
with expressions for d and St given by Eqs. 10 and 11. Boundary conditions are as follows: at the
backside of the electrode (closed off for ion and water flow) we have dcmA/dx=0 and dmA/dx=0. Initial
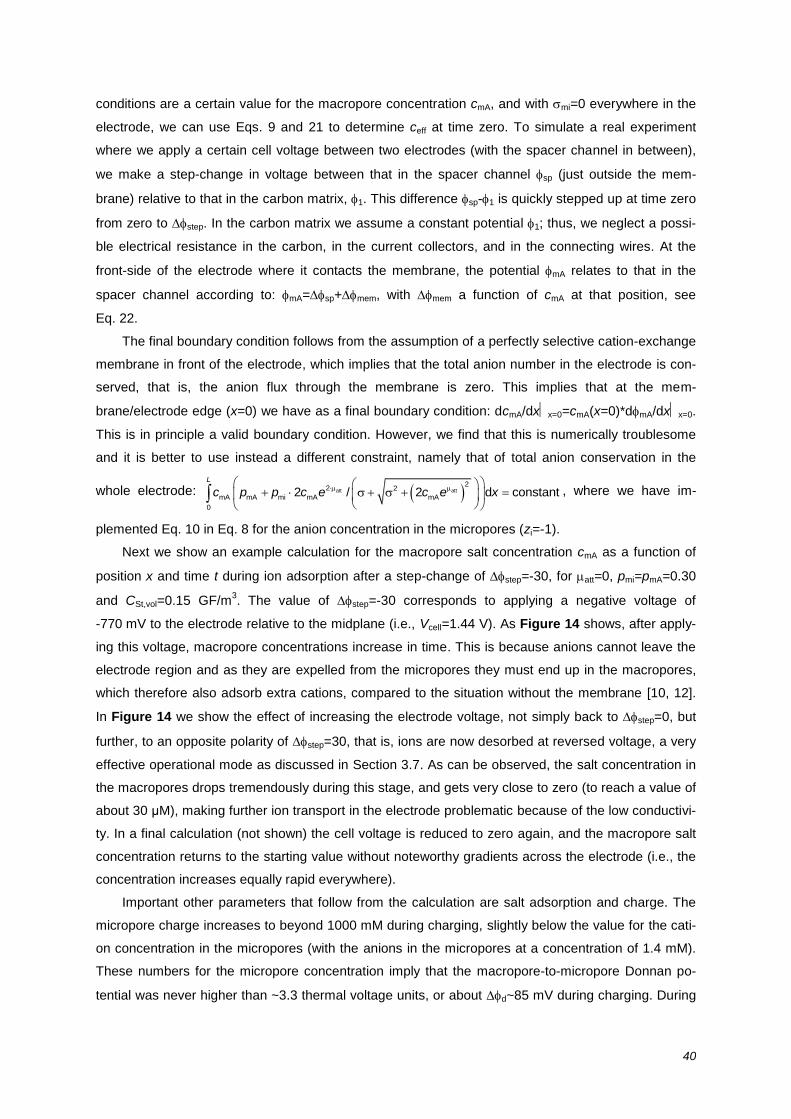
40
conditions are a certain value for the macropore concentration cmA, and with mi=0 everywhere in the
electrode, we can use Eqs. 9 and 21 to determine ceff at time zero. To simulate a real experiment
where we apply a certain cell voltage between two electrodes (with the spacer channel in between),
we make a step-change in voltage between that in the spacer channel sp (just outside the mem-
brane) relative to that in the carbon matrix, 1. This difference sp-1 is quickly stepped up at time zero
from zero to step. In the carbon matrix we assume a constant potential 1; thus, we neglect a possi-
ble electrical resistance in the carbon, in the current collectors, and in the connecting wires. At the
front-side of the electrode where it contacts the membrane, the potential mA relates to that in the
spacer channel according to: mA=sp+mem, with mem a function of cmA at that position, see
Eq. 22.
The final boundary condition follows from the assumption of a perfectly selective cation-exchange
membrane in front of the electrode, which implies that the total anion number in the electrode is con-
served, that is, the anion flux through the membrane is zero. This implies that at the mem-
brane/electrode edge (x=0) we have as a final boundary condition: dcmA/dxx=0=cmA(x=0)*dmA/dxx=0.
This is in principle a valid boundary condition. However, we find that this is numerically troublesome
and it is better to use instead a different constraint, namely that of total anion conservation in the
whole electrode: att att2
2 2
mA mA mi mA mA
0
2 / 2 d constantL
c p p c e c e x
, where we have im-
plemented Eq. 10 in Eq. 8 for the anion concentration in the micropores (zi=-1).
Next we show an example calculation for the macropore salt concentration cmA as a function of
position x and time t during ion adsorption after a step-change of step=-30, for att=0, pmi=pmA=0.30
and CSt,vol=0.15 GF/m3. The value of step=-30 corresponds to applying a negative voltage of
-770 mV to the electrode relative to the midplane (i.e., Vcell=1.44 V). As Figure 14 shows, after apply-
ing this voltage, macropore concentrations increase in time. This is because anions cannot leave the
electrode region and as they are expelled from the micropores they must end up in the macropores,
which therefore also adsorb extra cations, compared to the situation without the membrane [10, 12].
In Figure 14 we show the effect of increasing the electrode voltage, not simply back to step=0, but
further, to an opposite polarity of step=30, that is, ions are now desorbed at reversed voltage, a very
effective operational mode as discussed in Section 3.7. As can be observed, the salt concentration in
the macropores drops tremendously during this stage, and gets very close to zero (to reach a value of
about 30 µM), making further ion transport in the electrode problematic because of the low conductivi-
ty. In a final calculation (not shown) the cell voltage is reduced to zero again, and the macropore salt
concentration returns to the starting value without noteworthy gradients across the electrode (i.e., the
concentration increases equally rapid everywhere).
Important other parameters that follow from the calculation are salt adsorption and charge. The
micropore charge increases to beyond 1000 mM during charging, slightly below the value for the cati-
on concentration in the micropores (with the anions in the micropores at a concentration of 1.4 mM).
These numbers for the micropore concentration imply that the macropore-to-micropore Donnan po-
tential was never higher than ~3.3 thermal voltage units, or about d~85 mV during charging. During
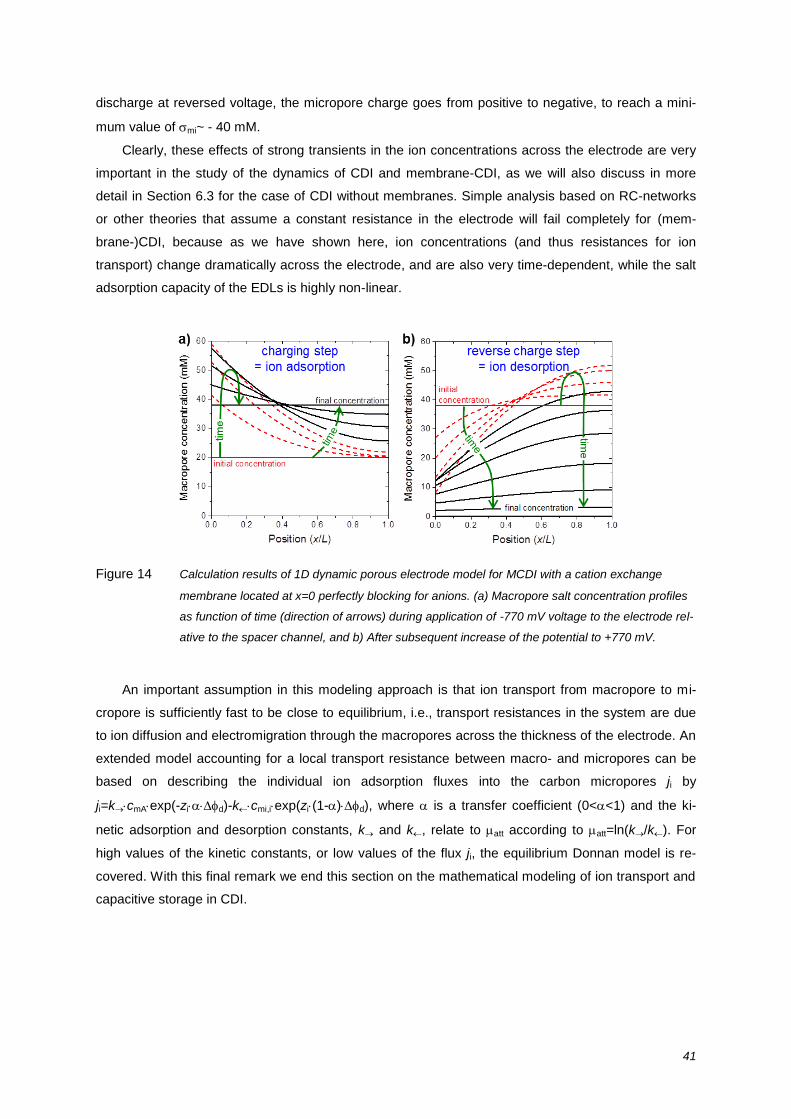
41
discharge at reversed voltage, the micropore charge goes from positive to negative, to reach a mini-
mum value of mi~ - 40 mM.
Clearly, these effects of strong transients in the ion concentrations across the electrode are very
important in the study of the dynamics of CDI and membrane-CDI, as we will also discuss in more
detail in Section 6.3 for the case of CDI without membranes. Simple analysis based on RC-networks
or other theories that assume a constant resistance in the electrode will fail completely for (mem-
brane-)CDI, because as we have shown here, ion concentrations (and thus resistances for ion
transport) change dramatically across the electrode, and are also very time-dependent, while the salt
adsorption capacity of the EDLs is highly non-linear.
Figure 14 Calculation results of 1D dynamic porous electrode model for MCDI with a cation exchange
membrane located at x=0 perfectly blocking for anions. (a) Macropore salt concentration profiles
as function of time (direction of arrows) during application of -770 mV voltage to the electrode rel-
ative to the spacer channel, and b) After subsequent increase of the potential to +770 mV.
An important assumption in this modeling approach is that ion transport from macropore to mi-
cropore is sufficiently fast to be close to equilibrium, i.e., transport resistances in the system are due
to ion diffusion and electromigration through the macropores across the thickness of the electrode. An
extended model accounting for a local transport resistance between macro- and micropores can be
based on describing the individual ion adsorption fluxes into the carbon micropores ji by
ji=kcmAexp(-zid)-kcmi,iexp(zi(1-)d), where is a transfer coefficient (0<<1) and the ki-
netic adsorption and desorption constants, k and k, relate to att according to att=ln(k/k). For
high values of the kinetic constants, or low values of the flux ji, the equilibrium Donnan model is re-
covered. With this final remark we end this section on the mathematical modeling of ion transport and
capacitive storage in CDI.
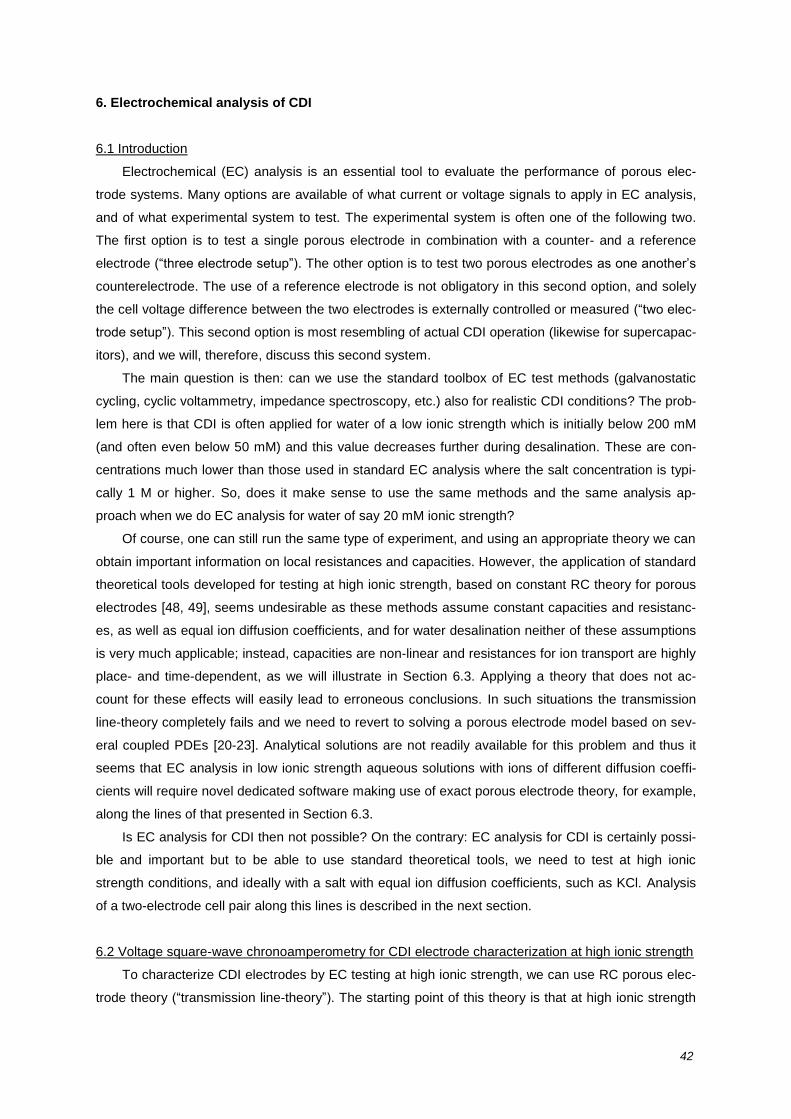
42
6. Electrochemical analysis of CDI
6.1 Introduction
Electrochemical (EC) analysis is an essential tool to evaluate the performance of porous elec-
trode systems. Many options are available of what current or voltage signals to apply in EC analysis,
and of what experimental system to test. The experimental system is often one of the following two.
The first option is to test a single porous electrode in combination with a counter- and a reference
electrode (“three electrode setup”). The other option is to test two porous electrodes as one another’s
counterelectrode. The use of a reference electrode is not obligatory in this second option, and solely
the cell voltage difference between the two electrodes is externally controlled or measured (“two elec-
trode setup”). This second option is most resembling of actual CDI operation (likewise for supercapac-
itors), and we will, therefore, discuss this second system.
The main question is then: can we use the standard toolbox of EC test methods (galvanostatic
cycling, cyclic voltammetry, impedance spectroscopy, etc.) also for realistic CDI conditions? The prob-
lem here is that CDI is often applied for water of a low ionic strength which is initially below 200 mM
(and often even below 50 mM) and this value decreases further during desalination. These are con-
centrations much lower than those used in standard EC analysis where the salt concentration is typi-
cally 1 M or higher. So, does it make sense to use the same methods and the same analysis ap-
proach when we do EC analysis for water of say 20 mM ionic strength?
Of course, one can still run the same type of experiment, and using an appropriate theory we can
obtain important information on local resistances and capacities. However, the application of standard
theoretical tools developed for testing at high ionic strength, based on constant RC theory for porous
electrodes [48, 49], seems undesirable as these methods assume constant capacities and resistanc-
es, as well as equal ion diffusion coefficients, and for water desalination neither of these assumptions
is very much applicable; instead, capacities are non-linear and resistances for ion transport are highly
place- and time-dependent, as we will illustrate in Section 6.3. Applying a theory that does not ac-
count for these effects will easily lead to erroneous conclusions. In such situations the transmission
line-theory completely fails and we need to revert to solving a porous electrode model based on sev-
eral coupled PDEs [20-23]. Analytical solutions are not readily available for this problem and thus it
seems that EC analysis in low ionic strength aqueous solutions with ions of different diffusion coeffi-
cients will require novel dedicated software making use of exact porous electrode theory, for example,
along the lines of that presented in Section 6.3.
Is EC analysis for CDI then not possible? On the contrary: EC analysis for CDI is certainly possi-
ble and important but to be able to use standard theoretical tools, we need to test at high ionic
strength conditions, and ideally with a salt with equal ion diffusion coefficients, such as KCl. Analysis
of a two-electrode cell pair along this lines is described in the next section.
6.2 Voltage square-wave chronoamperometry for CDI electrode characterization at high ionic strength
To characterize CDI electrodes by EC testing at high ionic strength, we can use RC porous elec-
trode theory (“transmission line-theory”). The starting point of this theory is that at high ionic strength
43
conditions, the diffuse (or, Donnan) layer potential is sufficiently low such that we are in the low-
potential limit where we have no net salt (electro-)adsorption in the EDLs, see Eq. 4. This, together
with the assumptions of equal ion diffusion coefficients and that of a perfectly dissociated 1:1 salt,
leads to the prediction that we have no gradients in salt concentration inside and outside the elec-
trode. For the effect of unequal ion diffusion coefficients, see Eqs. 2 and 4 in Ref. [22]. Making these
assumptions allows us to modify Eq. 24 to
2
mi mA mA
2
mi
2p cD
t p x
(26)
where c is the constant salt concentration in macropores and outside the electrode. Implementing
mi St,vol St TF C V and d St 1 mA( ) and assuming 1 (the electrode potential) not to vary in
time, we can rewrite Eq. 26 to
2
mA mA
20RC
tx
(27)
which is the classical equation for the transmission-line model, where according to our porous elec-
trode theory the dimensionless group RC is given as the product ofT mA/ 2R V Fp cD for the resistance
per unit length (in .m), and St,vol miC C p for the volumetric capacitance (in F/m
3). Eq. 27 can be
solved analytically for all kinds of applied voltage or current-signal [48].
In the present work, we will use Eq. 27 for an experiment where we perform a step-change in ap-
plied voltage between two equal porous electrodes, and measure the resulting current signal (abbre-
viated here as SW-CAM, for “square-wave chronoamperometry”) for porous electrodes made by a
standard casting technique, see Ref. [61] from Norit Supersorb-50 activated carbon (Norit B.V., The
Netherlands). We will analyze a two porous-electrode setup, with a spacer layer in between the elec-
trodes (electrode thickness L=340 m, electrode mass density e=0.50 g/mL). Assuming symmetry,
we only need to solve Eq. 27 for one electrode, while across the half-spacer layer we then have a
constant resistance, Rtot,ext.
Boundary conditions for Eq. 27 are that at the inner edge of the electrode (x=L) we have
dmA/dx=0 while at the electrode/spacer interface we have
e tot,ext * mAmA 0
T 0Bix
x
I R L
V x
(28)
where Ie is the current density (in A/m2) and the Biot-number describes the ratio in electrode re-
sistance over external resistance, given by Bi=RL/Rtot,ext, where the electrode resistance per unit
length, R (in .m), is given above, and Rtot,ext is the external resistance over half of the channel (in
.m2). In Eq. 28, * is the dimensionless voltage step-change applied to the half-cell. The analytical
solution for the current density Ie as function of time after applying a step-change in voltage is [48],
2 2
e e,0 n2 2n 0 n
2 Biexp /
Bi BiI t I t RCL
. (29)
where the values of n are the roots of the transcendental equation ntann=Bi, and where the initial
current density is
e,0 cell tot,ext/ 2I V R (30)

44
where Vcell is the voltage applied between the two electrodes.
The advantage of the SW-CAM technique is that based on a set of curves at various values of
Vcell we obtain a data set which can be analyzed in various ways to make several “checks and bal-
ances” to analyze step-by-step whether the assumptions underlying the analysis are correct. We will
discuss these various steps next. As we show, using SW-CAM we can independently and robustly
derive values for R, C and Bi, and we can analyze these numbers to evaluate the system.
First of all, the starting data of current density Ie vs. time t, see Figure 15a, must fulfill several
properties, namely that Ie starts off high and must drop to zero, both in the first step where we apply a
voltage difference between the two electrodes (charging step), as well as in the second step where
the voltage is reduced to zero again (discharging). At each switching moment, the current must in-
stantly step up or down, as indeed observed in Figure 15a. The higher the voltage, the higher cur-
rents must be.
Next we integrate the current signal with time, and after dividing by the electrode thickness we
obtain the charge * (per unit total electrode volume), as plotted in Figure 15b versus cell voltage.
Two requirements can here be checked for validity: first of all whether the charge increases in propor-
tion to voltage, implying that the capacity, C, does not depend on voltage, a basic requirement in the
transmission line theory. Secondly, the total charge, *, transported in the one direction during the
charging step must be close to the total charge transported back in the discharging step, and thus the
two values derived for charge * at each voltage must be the same. Both these requirements can be
observed in Figure 15b to hold true. Taking the slope of * vs Vcell and multiplying by a factor 2, we
obtain the value for the capacity C required in the transmission line theory, which in this case is
C=34.7 MF/m3. We can also multiply this number by the electrode mass density e and obtain for the
capacity ~70 C/g, which is a fairly standard number for the single-electrode capacity. This number can
be divided by 4 to get the actual system capacity such as reported e.g., in Ref. [58, 99]. For 500 mM
NaCl solution and a different electrode material, a value of 23 C/g system capacity was measured in
Ref. [99], while for the same system C=19 C/g was reported for a salinity of 20 mM salt.
Next we can analyze the initial current Ie,0. As Eq. 30 shows, we expect Ie,0 to be proportional to
Vcell, and indeed Figure 15c shows this to be true. From the slope of Ie,0 vs Vcell we can derive the ex-
ternal resistance to be Rtot,ext=0.972 m.m2. This linear resistance, derived from the initial current, can
be due to an ionic resistance (spacer channel) or an electrical resistance (wires, current collector,
etc.), but in each case it must be outside the porous electrode. The analysis does not lead to the iden-
tification where the resistance is located, which can be due to a resistance in the outer electrolyte or
due to an electronic effect such as a contact resistance, or a resistance in the wires or current collec-
tor. The analysis given below suggests that the ionic resistance in the spacer channel cannot account
for the observed value of the linear resistance Rtot,ext and thus it is likely due to an electronic effect.
Having established these two numbers, Rtot,ext and C, the only parameter yet to derive is the vol-
umetric resistance R of the porous electrode. But, first, as shown in Figure 15d, we test a final predic-
tion of the theory, namely that we can collapse all curves of Ie vs. t onto a mastercurve by dividing the
current Ie by the initial current Ie,0, see Eq. 29. This renormalization has been made in Figure 15d and
shows that both for the charging and the discharging step a perfect collapse of all data sets for Ie(t) is
45
obtained. Now, fitting the theory, Eq. 29, to this collapsed set of data-curves gives the following result.
Namely, that for Bi above 0.15 we do not get a good fit, with the theoretical curve first dropping too
quickly and around 10-30 s, dropping off too slowly [not shown]. For Bi0.15 the fit is actually quite
good, but not perfect. There is no further influence of the value of Bi on the theoretical curve (and thus
neither on the quality of the fit) when Bi0.15 because for such low Bi-numbers, the resistance in the
system is now completely in the linear part (described by Rext,tot). This has the consequence that also
a simple exponential curve, Ie(t)/Ie,0=exp(-t/), describes the data just as well, with =Rext,totCL=11.5 s.
The choice for Bi=0.15 is interesting (a lower value would describe the data just as well) because this
value follows exactly when we take ideal ionic conductivities in the macropores and neglect tortuosity
effects; that is, we apply T mA/ 2R V Fp cD with pmA=0.30, c=500 mM, and D=210
-9 m
2/s, which results
in an electrode volumetric resistance of R=0.44 .m. It is difficult to imagine that R can theoretically
be even lower, because we already assumed perfect equilibration of the voltage through the carbon
matrix, i.e., zero electrical resistance in the porous electrode. Thus, the only remaining volumetric re-
sistance is in the electrolyte-filled pores and R=0.44 .m must then be the lowest possible resistance,
unless unaccounted for effects of enhanced ion transport play a role [100].
If indeed, apparently, the ionic resistance in the electrode can be described by the theoretical
formula based on the free diffusion coefficient, then for the spacer channel we may expect the same,
and thus we can calculate the spacer layer contribution to Rtot,ext as tot,ext,th T half-spacer spacer/ 2R V L Fp cD ,
which assuming pspacer~0.50 results in Rtot,ext,th~0.066 m.m2 (Lhalf-spacer is 250 m) which is about 15
times below the experimental value of Rext,tot, suggesting that in this particular experiment the linear
external resistance is in the electrical circuit/current collector, not in the ionic solution in between the
electrodes.
In conclusion, SW-CAM allows us to accurately test the properties of capacitive porous carbon
electrode cells and calculate the electrode capacity and the various contributions to the observed re-
sistance. In the present case the linear (external) resistance is determining the total resistance and
analysis suggests that we can assign this resistance to an electric (not ionic) effect, while we can also
tentatively conclude that the distributed (volumetric) resistance within the electrode may be close to
the ideal value based on an ion transport resistance only determined by the free solution ion diffusion
coefficients. This finalizes our exposition of the derivation of the various constants in the transmission
line theory based on the SW-CAM technique. In conclusion, the SW-CAM technique is a robust, pre-
cise and very informative method to perform EC-analysis on two-electrode capacitive cells in aqueous
solutions. To demonstrate that under conditions of lower ionic strength, strong concentration gradients
develop in CDI electrodes, we make a theoretical analysis in the next section for realistic parameter
settings.
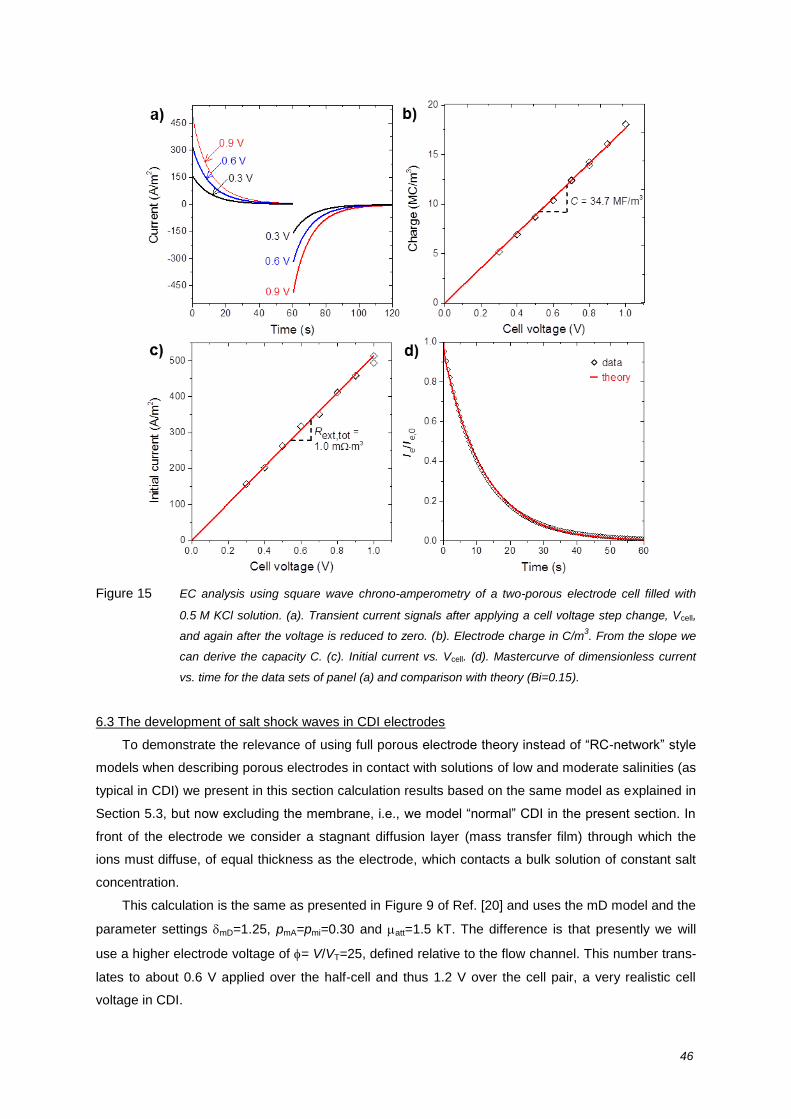
46
Figure 15 EC analysis using square wave chrono-amperometry of a two-porous electrode cell filled with
0.5 M KCl solution. (a). Transient current signals after applying a cell voltage step change, Vcell,
and again after the voltage is reduced to zero. (b). Electrode charge in C/m3. From the slope we
can derive the capacity C. (c). Initial current vs. Vcell. (d). Mastercurve of dimensionless current
vs. time for the data sets of panel (a) and comparison with theory (Bi=0.15).
6.3 The development of salt shock waves in CDI electrodes
To demonstrate the relevance of using full porous electrode theory instead of “RC-network” style
models when describing porous electrodes in contact with solutions of low and moderate salinities (as
typical in CDI) we present in this section calculation results based on the same model as explained in
Section 5.3, but now excluding the membrane, i.e., we model “normal” CDI in the present section. In
front of the electrode we consider a stagnant diffusion layer (mass transfer film) through which the
ions must diffuse, of equal thickness as the electrode, which contacts a bulk solution of constant salt
concentration.
This calculation is the same as presented in Figure 9 of Ref. [20] and uses the mD model and the
parameter settings mD=1.25, pmA=pmi=0.30 and att=1.5 kT. The difference is that presently we will
use a higher electrode voltage of = V/VT=25, defined relative to the flow channel. This number trans-
lates to about 0.6 V applied over the half-cell and thus 1.2 V over the cell pair, a very realistic cell
voltage in CDI.
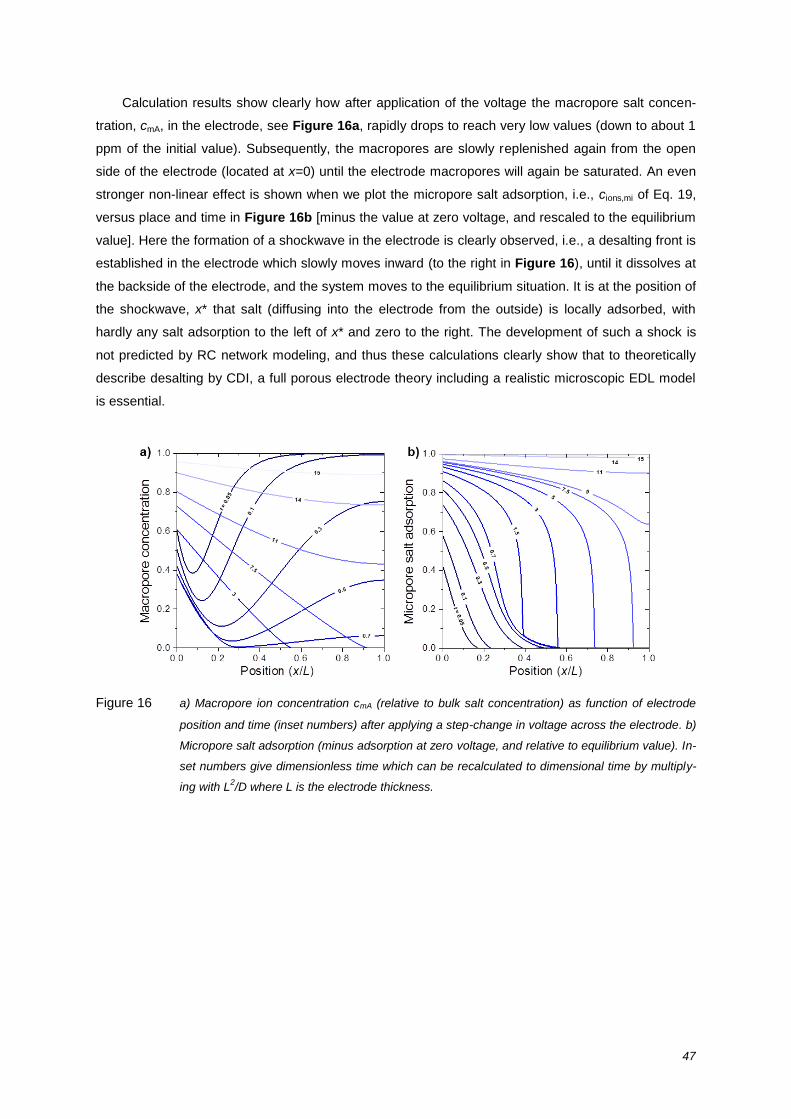
47
Calculation results show clearly how after application of the voltage the macropore salt concen-
tration, cmA, in the electrode, see Figure 16a, rapidly drops to reach very low values (down to about 1
ppm of the initial value). Subsequently, the macropores are slowly replenished again from the open
side of the electrode (located at x=0) until the electrode macropores will again be saturated. An even
stronger non-linear effect is shown when we plot the micropore salt adsorption, i.e., cions,mi of Eq. 19,
versus place and time in Figure 16b [minus the value at zero voltage, and rescaled to the equilibrium
value]. Here the formation of a shockwave in the electrode is clearly observed, i.e., a desalting front is
established in the electrode which slowly moves inward (to the right in Figure 16), until it dissolves at
the backside of the electrode, and the system moves to the equilibrium situation. It is at the position of
the shockwave, x* that salt (diffusing into the electrode from the outside) is locally adsorbed, with
hardly any salt adsorption to the left of x* and zero to the right. The development of such a shock is
not predicted by RC network modeling, and thus these calculations clearly show that to theoretically
describe desalting by CDI, a full porous electrode theory including a realistic microscopic EDL model
is essential.
Figure 16 a) Macropore ion concentration cmA (relative to bulk salt concentration) as function of electrode
position and time (inset numbers) after applying a step-change in voltage across the electrode. b)
Micropore salt adsorption (minus adsorption at zero voltage, and relative to equilibrium value). In-
set numbers give dimensionless time which can be recalculated to dimensional time by multiply-
ing with L2/D where L is the electrode thickness.

48
7. Energy requirements of CDI
7.1 Thermodynamic minimum energy consumption of desalination
Desalination of water is a process in which the ionic content of the water is demixed, and thus the
entropy of the system decreases. This implies that we always needs an energy input. Desalination
goes always from a single starting solution (feed water, volume flow rate v,feed, salt concentration
cfeed) to at least two separate product streams, one being the fresh (dilute) water (v,fresh, cfresh), and
the other being the concentrate (v,conc, cconc), with v,feed=v,fresh+v,conc and cfeedv,feed= cfreshv,fresh+
cconcv,conc. Desalination performance is often defined by the freshwater concentration and by the wa-
ter recovery (WR), which is the ratio of v,fresh over v,feed.
Water desalination leads to an increase of the system free energy, G. This requires an energy
input which is at least equal to this value G. This is the minimum energy input for desalination, inde-
pendent of the chosen process. In practice the energy requirements will be significantly higher. The
objective of material and engineering studies in water desalination is to design a process for which the
energy input is as close as possible to G, see Figure 17.
Figure 17 Schematic representation of thermodynamics in an ideal water desalination technology. G de-
notes Gibbs free energy in each stream. The difference, ∆G=Gfresh+Gconc-Gfeed, is the minimum
energy required for desalination to take place.
To describe G as a function of the desalination performance (recovery and freshwater concen-
tration), the general equation, valid for ideal thermodynamics for the ions in the water, is
fresh conc feed i v,i i i , lnG G G G G RT c c (31)
where c is the total dissociated ion concentration in the water. For instance, for a monovalent fully
dissociated salt like NaCl, c is twice the salt concentration, csalt. For water, ideal thermodynamics quite
closely describes the exact energy consumption, even up to the concentration of sea water
(csalt~500 mM). Eq. 31 predicts that for the desalination of seawater with WR=0.6, we need exactly
1 kWh per m3 of produced freshwater when csalt,fresh = 5 mM.
Instead of Eq. 31 there are several equivalent expressions, perhaps the most elegant being
v,fresh feed fresh
ln ln
1 1G RT c c
(32)

49
where =cfeed/cfresh and =cfeed/cconc [101, 102]. The water recovery, WR, relates to concentrations ac-
cording to WR =(cconc-cfeed)/(cconc-cfresh). For example, if the objective is to desalinate a 100 mM NaCl
solution (brackish water) to 5 mM freshwater with WR=0.8, then cconc=480 mM, which consequently
gives =20, and =0.208. As a result, making use of equation 32, the minimum energy required is
0.12 kWh/m3 freshwater, which is much lower than the energy consumption of the state-of the-art de-
salination technique, e.g., Reverse Osmosis at this salinity, see Figure 19.
7.2 Energy consumption of MCDI and CDI in CC-ZVD and CC-RCD modes
The previous section outlined the thermodynamic minimum energy consumption of desalination.
In this section, closer inspection of energy consumption of actual CDI and MCDI operation is dis-
cussed. As example, we give results for constant-current (CC) operation of MCDI and CDI both in the
ZVD and RCD mode, as will be explained next, and is plotted in Figure 18. Here we present data for
desalination of a series of NaCl-solutions from 10 mM up to 200 mM. For the adsorption step, an elec-
trical current of 1 A is applied to the whole stack (~37 A/m2) until the cell voltage reaches 1.6 V; for the
desorption step, in the ZVD mode, a zero voltage is applied for 500 s, while in the RCD mode, a re-
versed current (-1 A) is applied until the cell voltage drops to 0 V again.
In Figure 18 we present data for the energy consumption per ion removed for MCDI-CC, which is
calculated from the electrical energy input during desalination (ion adsorption step), obtained from
multiplying the current in Ampère with the cell voltage in V, integrating over the duration of the adsorp-
tion step, and dividing by the total ion removal, as explained in Section 3.5. Note that this is the ener-
gy input during charging, part of which can be recovered from the energy release during discharging
the cell (but only in RCD mode, not in ZVD mode). Interestingly, we see in Figure 18 that for MCDI
the energy consumption is lower than for CDI in both operational modes, and energy consumption for
MCDI does not vary much with regard to the inlet salt concentration. In our setup, for MCDI a typical
number for energy consumption is ~20 kT per ion removed for the ZVD mode, and ~30 kT per ion
removed for the RCD mode. Once again, let it be stated that this is the energy per cycle without ener-
gy recovery.
Figure 18 Energy consumption per ion removed as function of salt concentration of MCDI and CDI in CC-
ZVD and CC-RCD modes, see Ref. [14].
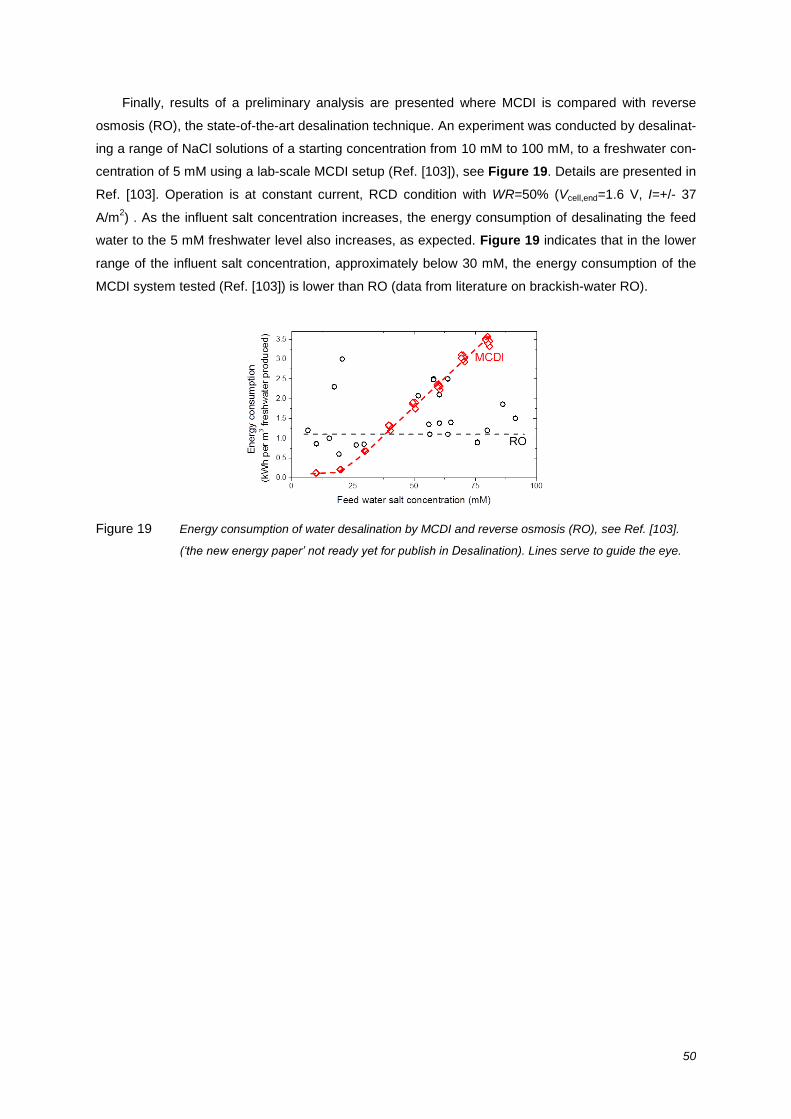
50
Finally, results of a preliminary analysis are presented where MCDI is compared with reverse
osmosis (RO), the state-of-the-art desalination technique. An experiment was conducted by desalinat-
ing a range of NaCl solutions of a starting concentration from 10 mM to 100 mM, to a freshwater con-
centration of 5 mM using a lab-scale MCDI setup (Ref. [103]), see Figure 19. Details are presented in
Ref. [103]. Operation is at constant current, RCD condition with WR=50% (Vcell,end=1.6 V, I=+/- 37
A/m2) . As the influent salt concentration increases, the energy consumption of desalinating the feed
water to the 5 mM freshwater level also increases, as expected. Figure 19 indicates that in the lower
range of the influent salt concentration, approximately below 30 mM, the energy consumption of the
MCDI system tested (Ref. [103]) is lower than RO (data from literature on brackish-water RO).
Figure 19 Energy consumption of water desalination by MCDI and reverse osmosis (RO), see Ref. [103].
(‘the new energy paper’ not ready yet for publish in Desalination). Lines serve to guide the eye.
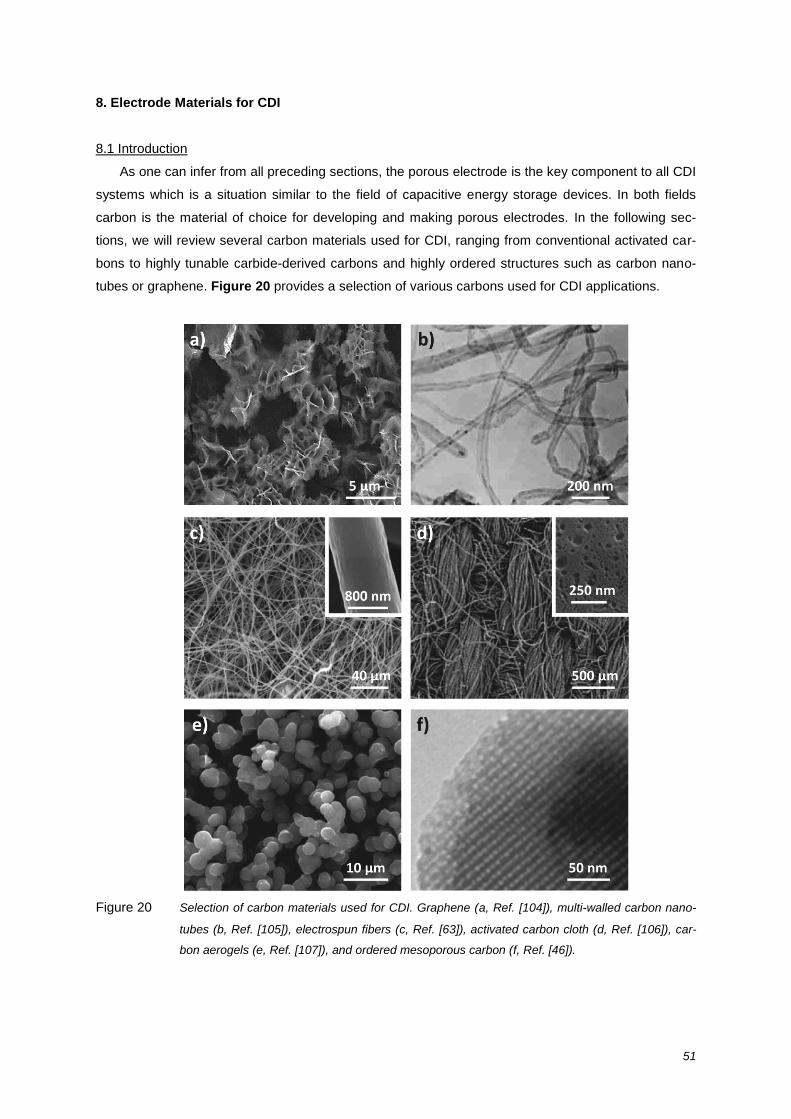
51
8. Electrode Materials for CDI
8.1 Introduction
As one can infer from all preceding sections, the porous electrode is the key component to all CDI
systems which is a situation similar to the field of capacitive energy storage devices. In both fields
carbon is the material of choice for developing and making porous electrodes. In the following sec-
tions, we will review several carbon materials used for CDI, ranging from conventional activated car-
bons to highly tunable carbide-derived carbons and highly ordered structures such as carbon nano-
tubes or graphene. Figure 20 provides a selection of various carbons used for CDI applications.
Figure 20 Selection of carbon materials used for CDI. Graphene (a, Ref. [104]), multi-walled carbon nano-
tubes (b, Ref. [105]), electrospun fibers (c, Ref. [63]), activated carbon cloth (d, Ref. [106]), car-
bon aerogels (e, Ref. [107]), and ordered mesoporous carbon (f, Ref. [46]).

52
CDI performance is not only related the total pore volume, the pore size, and the pore con-
nectivity, but are also related with electronic conductivity, electrochemical stability, and cost consider-
ations. The following list summarizes the most important requirements for CDI electrode materials and
their bearing on the CDI performance based on Ref. [36]:
1. Large ion-accessible specific surface area
The salt electrosorption capacity is related to the surface area
However, not the entire surface area calculated from experimental methods may be ac-
cessible to ions.
2. High (electro)chemical stability over the used pH and voltage range (no oxidation etc.)
Important to ensure longevity and system stability.
3. Fast ion mobility within the pore network
Bottlenecks or very small pores pose diffusional limitations and limit the kinetics.
This not only concerns the porosity within carbon particles, but also the pore structure of
the entire CDI electrode considering, for example, interparticle distances and electrode
thickness.
4. High electronic conductivity
Metallic or metal-like electronic conductivity ensures that the entire electrode surface of
all particles is charged without large voltage gradients within the carbon.
Only a high electronic conductivity ensures a low energy dissipation and low heating.
5. Low contact resistance between the porous electrode and the current collector
A low interfacial resistance is required to avoid a large voltage drop from the electrode to
the current collector.
6. Good wetting behavior
Hydrophilicity ensures that the entire pore volume is participating in the CDI process.
7. Low costs and scalability
Cost considerations are important for large-scale applications.
8. Good processability
Shapeable into film electrodes: either based on compacted powders, fibers, or monoliths
9. Large (natural) abundance and low CO2 footprinting
Availability and environmental impact considerations not only affect cost considerations,
but also sustainability concerns.
10. High bio-inertness
Biofouling needs to be avoided for long-term applications to surface or brackish water.
Particular important yet difficult to accomplish is combining a very high specific surface area
(#1) and high ion mobility (#3). A smaller pore size and a larger total number of small pores translates
to a larger specific surface area (SSA; defined as surface area per mass). However, more small pores
bring along transportation limitations and steric hindrance as also the number of constrictions in-
creases and the pore walls become more curved. The final and ultimate limit to the pore size is the

53
bare ion size, for example, 1.16 Å for Na+ and 1.67 Å for Cl
-. These numbers increase for solvated
ions with 3.58 Å for sodium and 3.31 Å for chloride [108]. Commonly, the majority of pores of most
porous carbons are still significantly larger. Larger pores provide better transport pathways; however,
they also decrease the total specific surface area.
With the great importance of the pore structure and its bearing on the desalination perfor-
mance, we first have to clarify the pore size terminology. The International Union of Pure and Applied
Chemistry (IUPAC) defines pores strictly according to their size as follows (Ref. [24, 109]; see also
Figure 21):
Macropores: larger than 50 nm
Mesopores: between 2 and 50 nm
Micropores: smaller than 2 nm
Since the term “micro”pores may incorrectly be associated with “micrometer”sized pores, some au-
thors have preferred the term “nanopores” for pore diameters smaller than 2 nm (e.g., Ref. [110]). It is
important to note that the IUPAC classification is independent of the choice of the porous material
(e.g., carbon, metal, metal oxide), the kind of pores (e.g., closed-pore, open pore), or where the pore
is actually located (inside a particle versus between particles). As schematically shown in Figure 21,
open pores may be dead-end-pores (also called semi-open; that is a pore with only one open end
which cannot contribute to percolation), interconnected (that is connected with another pore but not
necessarily to the entire pore volume), or passing – and only closed pores cannot contribute to desal-
ination.
It is important to note that the commonly used term “average pore size” is insufficient to de-
scribe a complex pore structure and it is even misleading for many porous materials because it does
not reflect (i) the magnitude, and (ii) the modality of the pore size dispersion; that is, how narrow the
pore size distribution centers around one or several maxima. Only carbons with a very narrow pore
size distribution, such as carbon nanotubes (CNTs), some carbide-derived carbons (CDCs) [111], and
many template-produced carbons [112], exhibit a meaningful pore size “average”, whereas most acti-
vated carbons or hierarchic porous materials exhibit a much broader distribution of pore sizes.
We now have reviewed different kinds, sizes, and distributions of pores. However, it is also
important to understand that pores occur in different shapes. These strongly depend on the carbon
material, the synthesis conditions, and the post-synthesis procedure. Abstracted, the pore shapes
may be approximated as spherical, cylindrical, or slit shaped as the simplest geometries. Indeed,
many templated carbons exhibit highly ordered cylindrical pores [113] and for most activated carbons
we assume slit-shaped pores. We also note that more advanced structures are possible. One exam-
ple for more complex pore shapes is the space between dense nanoparticles which shows pore walls
with a positive curvature [114].
Compared to the IUPAC definition, the literature on transport modeling in porous electrodes
employs a very different definition of the terms micro- and macropores (cf. Sections 3-7): Here, mi-
cropores are any pores inside the porous particles that constitute the electrode, and macropores are
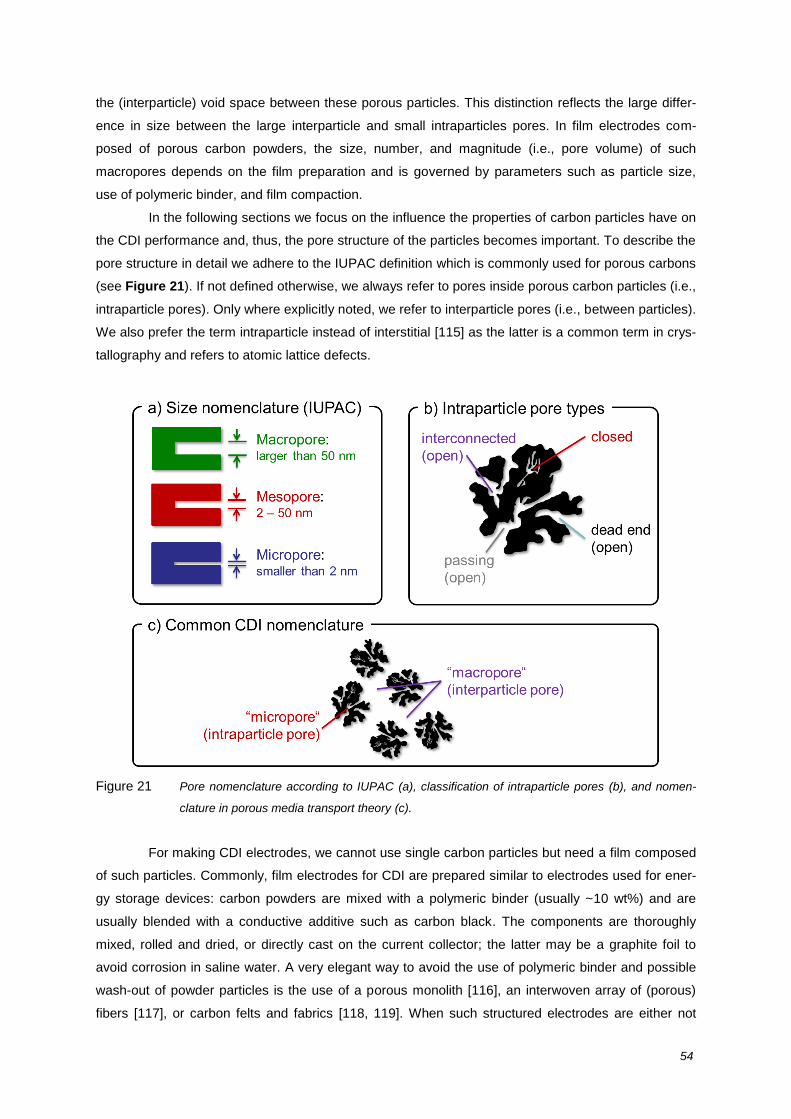
54
the (interparticle) void space between these porous particles. This distinction reflects the large differ-
ence in size between the large interparticle and small intraparticles pores. In film electrodes com-
posed of porous carbon powders, the size, number, and magnitude (i.e., pore volume) of such
macropores depends on the film preparation and is governed by parameters such as particle size,
use of polymeric binder, and film compaction.
In the following sections we focus on the influence the properties of carbon particles have on
the CDI performance and, thus, the pore structure of the particles becomes important. To describe the
pore structure in detail we adhere to the IUPAC definition which is commonly used for porous carbons
(see Figure 21). If not defined otherwise, we always refer to pores inside porous carbon particles (i.e.,
intraparticle pores). Only where explicitly noted, we refer to interparticle pores (i.e., between particles).
We also prefer the term intraparticle instead of interstitial [115] as the latter is a common term in crys-
tallography and refers to atomic lattice defects.
Figure 21 Pore nomenclature according to IUPAC (a), classification of intraparticle pores (b), and nomen-
clature in porous media transport theory (c).
For making CDI electrodes, we cannot use single carbon particles but need a film composed
of such particles. Commonly, film electrodes for CDI are prepared similar to electrodes used for ener-
gy storage devices: carbon powders are mixed with a polymeric binder (usually ~10 wt%) and are
usually blended with a conductive additive such as carbon black. The components are thoroughly
mixed, rolled and dried, or directly cast on the current collector; the latter may be a graphite foil to
avoid corrosion in saline water. A very elegant way to avoid the use of polymeric binder and possible
wash-out of powder particles is the use of a porous monolith [116], an interwoven array of (porous)
fibers [117], or carbon felts and fabrics [118, 119]. When such structured electrodes are either not
55
available or undesired (e.g., because of cost considerations), a film electrode made from individual
particles can either be protected by a membrane (see Section 3.7) or mechanically stabilized by a
porous separator which enables saline water flow.
8.2 Carbon Materials
8.2.1 Activated Carbons and Activated Carbon Cloths
Among porous carbons, activated carbons (ACs) stand out, because they are by far the most
commonly used and usually the most cost efficient materials for many applications. Today, AC is the
most common material found in water treatment systems and its use is already documented in early
studies on CDI in the 1960/1970s (see Section 2). ACs are derived from natural sources like coconut
shells, wood, coal, starch, or synthetic sources like resins or other organic precursors. The combina-
tion of a high SSA (1000 – 3500 m2/g) and low costs (~0.50 €/kg) makes this material particularly at-
tractive for widespread commercial applications [120]. Resin-derived AC can be synthesized as
beads, fibers, or monoliths while most other ACs are usually powders composed of micrometer sized
particles. For example, polyacrylonitrile (PAN) can be electrospun to form submicrometer thin carbon
fibers with good desalination properties after being blended with 5 wt% of a conductive additive (car-
bon black) and activation in CO2 (to increase the pore volume) [121]. The variety of precursor materi-
als and synthesis conditions translates to an equally great variety in pore structures and surface
chemistry of the resulting AC material. Thus, a detailed description of the properties, most importantly
the pore structure, is important for any comprehensive understanding and comparison of the desalina-
tion capacity of AC electrodes [122]. As a general trend, an increase in the total pore volume / specific
surface area results in a higher salt adsorption capacity.
A detailed study on ACs was presented by Zou et al. [123] where conventional AC, KOH ac-
tivated AC, and TiO2/AC composites were compared. The starting material was mesoporous AC with
a SSA of 932 m2/g and an average pore size of 4.2 nm. KOH activation was carried out so that the
wetting behavior of the hydrophobic AC was improved by introducing hydrophilic surface groups to
the system; this procedure yielded AC with a SSA of 889 m2/g and an average pore size of 4.2 nm so
that the SSA and pore size average remained largely unchanged after the activation compared to the
starting material. TiO2 coating resulted in a slightly lower SSA (851 m2/g) and a somewhat smaller
average pore diameter (4.1 nm). Both, KOH activated and TiO2 infiltrated / coated samples had a
slightly higher CDI performance compared to the starting material. For KOH-treated materials, the
improved performance was explained by the more hydrophilic nature of the material resulting in im-
proved wetting. This is in line with a study by Ahn et al. [124] which indicates that charge transfer re-
lated to the surface functional groups may also contribute to the improved performance. It is still an
open question if this aspect can explain the measured performance and how long-term stability will be
affected by the presence of such surface functional groups which, over time, may chemically degrade.
The influence of Ti-O modification of activated carbon cloth (ACC) has been investigated by
Ryoo et al. [125, 126]. For these studies, ACC was derived from a phenolic precursor and the SSA of
the material decreased from 1980 to 1180 m2/g after loading with titanium(IV)-butoxide. After synthe-
56
sis, chemical analysis confirmed the presence of titanium and oxygen groups, possibly in a tetrahedral
configuration as indicated by X-ray photoelectron spectroscopy. Such Ti-O decorated ACC was found
to show a higher salt electrosorption which was explained by the additional charge transfer during the
change of the oxidation state of titanium. In contrast, no significant change in the CDI capacity was
found for metal-oxide coatings of Si-O, Zr-O, and Al-O [54]. Myint et al. [127] used seeded ZnO nano-
rods to decorate ACC electrodes for CDI applications, and Anderson et al. [128] used sol-gel method
to obtain SiO2 and/or Al2O3 nanoparticles on carbon electrodes.
Instead of utilizing metal oxide coatings, it is possible to modify the surface of ACC with a
SSA of 1440 m2/g by oxidation with HNO3 or reduction by hydrogen annealing [71]. To mitigate the
charge efficiency limiting effect of co-ion desorption around the potential of zero charge (PZC), the
anode and cathode were chemically treated so that both electrodes would have a different PZC.
While a reduced carbon electrode was found to be unstable and quickly re-oxidized in saline water,
an asymmetric three electrode cell with one oxidized electrode, one untreated electrode, and one ref-
erence electrode showed a higher charge efficiency of the asymmetric cell compared to the symmetric
cell consisting of two untreated ACC electrodes.
A symmetric CDI cell with chemically modified ACC was studied by Oh et al. [106]. Oxidation
of the carbon material with KOH or HNO3 slightly decreased the specific surface area (-16% and -5%
for KOH and HNO3 treatment, respectively). In these experiments, the average pore size remained
almost unchanged (±1 Å) compared to the untreated samples but still a higher salt electrosorption
capacity was observed. This difference may be related to the activation of carbon via opening closed
pores and, hence, new small pores were created inside the particles. The chemical treatment also
improved the electrosorption kinetics.
8.2.2 Ordered Mesoporous Carbons
In contrast to the disordered arrangement of micropores in most ACs, ordered mesoporous
carbons (OMC) show a highly periodic hexagonal or cubic arrangement of mesopores which may im-
prove the transport of salt ions through the pore network. OMCs can be derived via soft or hard tem-
plating and the literature on OMCs is extensive including several review articles (e.g., Ref. [112, 129]).
For hard templating, a template, such as a zeolite or ordered mesoporous silica, is infiltrated with a
carbon precursor which then is carbonized. Then, in the final step, the initial template is chemically
removed (e.g., with hydrofluoric acid) and OMC is obtained. The other approach, soft templating, is a
relatively new method for the synthesis of OMC materials and it involves, for example, the self-
assembly of triblock copolymers and the thermal removal of the latter; hence, the only solid phase left
in the end is carbon which retains the ordered porous feature of the template. Depending on the syn-
thesis conditions and possible activation, OMCs can have a very high SSA (> 3000 m2/g), but more
typical SSA values are in the range between 750 and 1500 m2/g. Thus, while the pore arrangement is
very different, the SSA of OMC is comparable to many ACs.
OMCs synthesized from a modified sol-gel process with a SSA between 950 and 1594 m2/g
and an average pore size between 3.3 and 4.0 nm were studied by Li et al. [130]. Compared to AC,
these OMCs had a significantly better CDI performance. Even the OMC with the lowest SSA

57
(950 m2/g) showed a much better desalination capacity than AC with a comparably large SSA
(845 m2/g). This is in agreement with a study by Zou et al. [17] which showed that AC with a SSA of
968 m2/g performs not as well as OMC with a SSA of 844 m
2/g. It is also possible that the disordered
arrangement of small AC micropores obstructs fast ion transport so that a certain percentage of the
total SSA may not fully contribute to the dynamic process of salt electrosorption; in contrast, almost
the entire SSA of OMCs with their transport-optimized pore network may participate in the salt immo-
bilization which results in an improved CDI performance. Now, when comparing different OMCs with
little differences in the porosity (1491 versus 1594 m2/g and 3.7 versus 3.3 nm average pore size), the
sample with the lower SSA had a significantly higher desalination capacity[130]. This may be related
to differences in the carbon structure and the electrical conductivity because the OMC with lower re-
sistance also gave the better CDI performance. As an alternative way for 3D structuring or hierarchic
porosity and to increase desalination rates, Wen et al. used a double-templating approach where
macropores were created by an ordered assembly of silica spheres while triblock co-polymers were
used as soft templates for OMC formed between the SiO2 particles [131].
8.2.3 Carbide-Derived Carbons
Unlike ACs, carbide-derived carbons (CDCs) can be synthesized to only exhibit extremely
narrowly distributed micropores and no mesopores; but, unlike OMCs, pores in CDC are not arranged
in an ordered fashion. CDCs are most commonly produced by etching of carbide powders in dry chlo-
rine gas at elevated temperatures (200 – 1200 °C) but they can also be derived from monoliths, fi-
bers, or thin films. The chlorine treatment followed by a subsequent hydrogen annealing to remove
residual chlorine compounds yields a SSA typically between 1200 and 2000 m2/g but activation may
increase the SSA to values of up to 3200 m2/g (cf. Ref. [111] for a review). Recently, the CDI capacity
of CDCs derived from titanium carbide (i.e., TiC-CDC) has been investigated as a purely microporous
model system with pores smaller than ~1 nm [61]. This study suggests that the limiting factor for CDI
is in fact the pore volume associated with ion accessible micropores and not, as it may be implied
from the studies on OMC, the volume of mesopores.
8.2.4 Carbon Aerogels
Another group of carbons are carbon aerogels (CA) [132] which combine a rather moderate
SSA (typically 400 – 1100 m2/g, but also up to 1700 m
2/g) [133]
with very high electrical conductivity
(25 – 100 S/cm) and a very low total density (< 0.1 g/cm3; see review Ref. [36]). So far, CAs have
been synthesized in the form of powders, small beads, thin films, or monoliths and they are composed
of a network of rather dense carbon nanoparticles; thus, the very low density is not related to a low
skeletal density of the carbon particles but to their very spacious arrangement. Most of the total SSA
is usually related to interparticles pores (mesopores), but depending on the synthesis conditions there
may also be micropores that are related to intraparticle porosity [134]. The latter may range from only
10 m2/g or less, to more than 600 m
2/g [135]. Typical diameters of the rather round carbon nanoparti-
cles range from 3 to 30 nm. Compared to CA, CDI electrodes based on carbon xerogels (CX) show
after the synthesis a significant decrease of the initial porosity which can be used to achieve smaller
58
pore sizes at lower cost [136]. The pore network for CA and CX is formed between dense particles
shows pore walls with a positive curvature (also called exohedral pore structure). Such a pore geome-
try is different from most other porous carbons which show an internal pore volume with pores having
a predominantly negative surface curvature. We note that materials with a positive surface curvature
have been shown to improve the charge storage capacity per unit area compared to carbons with a
negative pore curvature [114, 137, 138].
A number of publications on CAs are dedicated to the electrosorption from mixed ionic solu-
tions rather than investigating a single salt solution (such as NaCl). For instance, Farmer et al. [39, 40]
have studied CAs with a SSA of 600 – 800 m2/g for CDI in mixed ionic solutions and a decay in salt
electrosorption capacity of only ~5% over a period of several months was observed when using de-
aerated electrolytes. The electrosorption of several anions and cations (Na+, K
+, Mg
2+, Rb
+, Br
-, Cl
-,
SO42-
, NO3-) from natural river water was studied in Ref. [115]
for CA with a SSA of 400 – 590 m
2/g
and average pore sizes between 4 and 9 nm. It was found that monovalent ions with smaller (hydrat-
ed) ion size were preferentially electrosorbed by CA electrodes. Farmer et al. also show that organic
components reduce the lifetime of CA CDI electrodes.
Considering the low mechanical stability of CA as a result of the very low bulk density, paste-
rolling of CA with silica gel was studied by Yang et al. [133] as a method to improve the mechanical
properties. Different carbon-to-silica mass ratios (100:0, 75:25, 50:50, 25:75) were investigated and a
slight increase in CDI performance was observed when adding the silica gel.
8.2.5 Carbon Nanotubes and Graphene
Two of the latest additions to the carbon family, carbon nanotubes (CNTs; described by
Sumio Iijima in 1991) and graphene (synthesized Geim and co-workers in 2005) have also already
been investigated as materials for CDI electrodes. Both are characterized by having only (graphene)
or mostly (CNTs) an external surface area which is ion accessible. This is in contrast to, for example,
AC, where almost the entire surface area is within the particles. However, even when composed of 1D
(CNT) or 2D (graphene) nanomaterials, the resulting CDI electrodes are still by nature three-
dimensional and will also have a significant interparticle porosity; graphene flakes may also be wrin-
kled to form slit pores even within one sheet. We also note that the presence of metal catalysts in the
CNT material may be a detriment to the electrochemical stability of the resulting CDI electrodes and
parasitic side-reactions can occur.
The most commonly found CNTs are multi-walled CNTs. Zhang et al. [105] studied multi-
walled CNTs from catalytic decomposition of methane with surface areas between 50 and 129 m2/g
and the sample with the highest SSA had the largest CDI capacity. In contrast to other porous car-
bons, these SSA values are very moderate and as a result, the CDI performance is much smaller
compared to AC as shown by Wang et al. [139]. Electrodes for CDI composed of multi-walled CNTs
(SSA: 47 – 129 m2/g)
[52] and multi-walled CNT / AC composites [140] have been studied and for
pure CNTs, the CDI capacity increased with the amount of SSA. A series of CNT/AC ratios (from 1:0
to 0:1) were studied and it was shown that the CDI capacity continuously decreased as the CNT con-

59
tent was increased. Yet, the energy efficiency improved at high CNT loadings as the device conductiv-
ity benefits from a high CNT content considering the moderate conductivity of AC.
Single-walled CNTs (455 m2/g, average pore size: 4.8 nm) have a higher CDI capacity than
double-wall CNTs (415 m2/g, average pore size: 5.1 nm) [141] and both CNT varieties show a better
desalination performance compared to AC with a significantly larger SSA (999 m2/g, average pore
size: 2.1 nm); yet, they are inferior to OMCs (SSA: 1491 m2/g, average pore size: 3.7 nm). This may
be explained by the better ion transport in the interparticles pores of CNT electrodes compared to AC.
Freestanding electrodes composed of either multiwall CNTs or composites of multiwall CNTs
and polyacrylic acid (PAA) were obtained by Nie et al. [44] via electrophoretic deposition. Employing
PAA was shown to improve the CDI performance as it acts as a cation exchange membrane (see
Section 3.6 on membrane-CDI). Another composite electrode composed of PANI (polyaniline) and
single-walled CNTs showed a slight increase in CDI performance (~10%) compared to films com-
posed of pure single-walled CNTs. This improvement in desalination was explained by the increase in
the mesopore volume but may also be related with the different electrochemical properties of the
PANI-CNT composite material [42].
Pure graphene electrodes have been investigated by Wang et al. [142] and Li et al. [55]. In
the latter study, CDI electrodes consisted of graphene flakes (or AC for comparison) added to graph-
ite powder and polymeric binder in a 72:20:8 weight ratio. Initially, the graphene SSA was 222 m2/g,
but this value decreased to ≤50 m2/g after treatment with sulfuric / nitric acid (for comparison: the AC
had a SSA of 990 m2/g). Graphene shows also differences in the kinetics of salt removal compared to
other carbon materials. A study by Zhang et al. compared electrodes made from AC, mesoporous
carbon, and mesoporous carbon/graphene composite electrodes [143] and it was reported that the
latter had both, a higher salt adsorption capacity and faster ion immobilization rates. This is also in
agreement with another study by Zhang et al. on CNT/graphene composites [144].
8.2.6 Carbon Black
Carbon blacks (CBs) are usually dense carbon nanoparticles with a low SSA (usually below
120 m2/g) [145] and because of their high electrical conductivity, they are a common conductive addi-
tive to film electrodes composed of porous carbons. Indeed, as shown in Ref. [56] [146], adding CB to
CDI film electrodes made from AC significantly improves the salt removal in saline electrolytes with
670, and 1000 ppm NaCl. The very low SSA, however, limits the CDI performance of electrodes pure-
ly composed of CB particles, as shown in Ref. [6, 34, 35].
8.2.7 Overview of performance data of carbon electrodes for CDI
In Table 1 we summarize reported data from the literature for the important CDI property of salt
adsorption per gram of electrode material. Here, data are given as function of salinity and cell voltage,
per gram of both electrodes combined. The experiment in all cases is done in a symmetric cell with
the two electrodes of the same mass and material. As can be read off from Table 1, reported num-
bers vary in a large range between ~0.7 and ~15 mg/g of adsorbed salt per gram of both electrodes
combined. For scientific studies on CDI electrodes, our suggestion is to always report the measured
60
value of salt adsorption either in mg/g or in mol/g. We suggest that a proper CDI electrode should
have an adsorption of at least 8 mg/g NaCl at a cell voltage of 1.2 V.
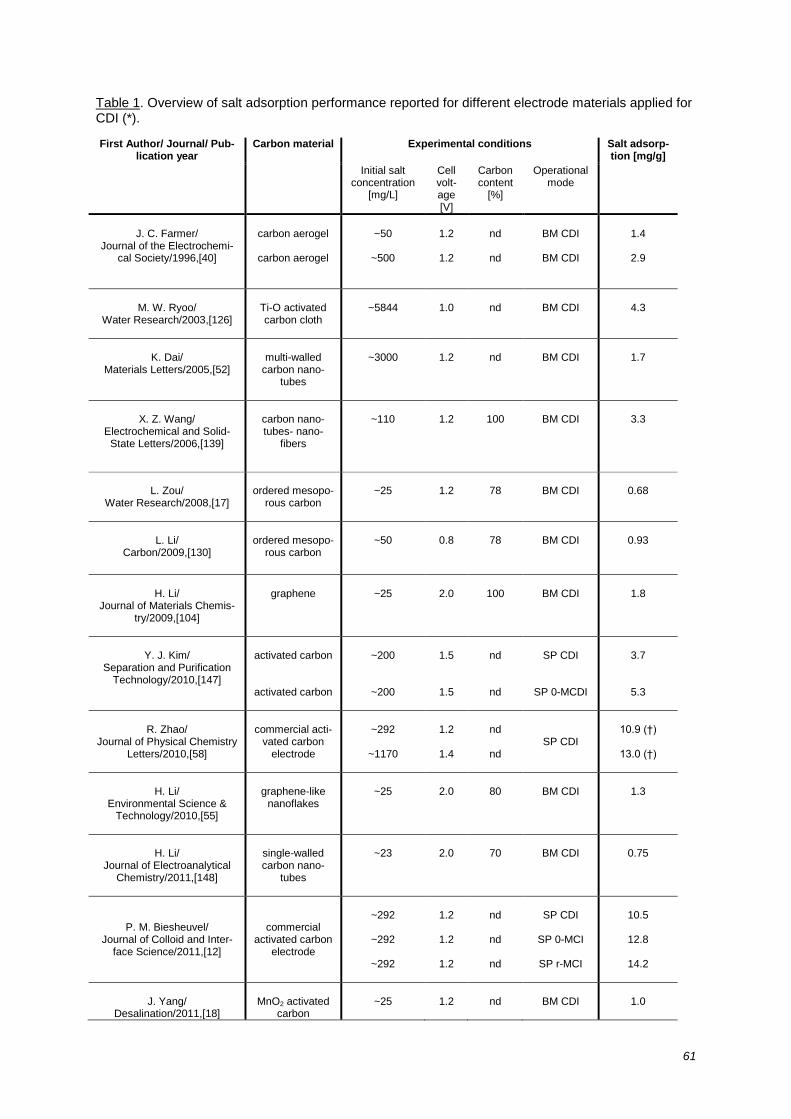
61
Table 1. Overview of salt adsorption performance reported for different electrode materials applied for CDI (*). First Author/ Journal/ Pub-
lication year Carbon material
Experimental conditions
Salt adsorp-tion [mg/g]
Initial salt concentration
[mg/L]
Cell volt-age [V]
Carbon content
[%]
Operational mode
J. C. Farmer/
Journal of the Electrochemi-cal Society/1996,[40]
carbon aerogel
carbon aerogel
~50
~500
1.2
1.2
nd
nd
BM CDI
BM CDI
1.4
2.9
M. W. Ryoo/
Water Research/2003,[126]
Ti-O activated carbon cloth
~5844
1.0
nd
BM CDI
4.3
K. Dai/
Materials Letters/2005,[52]
multi-walled
carbon nano-tubes
~3000
1.2
nd
BM CDI
1.7
X. Z. Wang/
Electrochemical and Solid-State Letters/2006,[139]
carbon nano-tubes- nano-
fibers
~110
1.2
100
BM CDI
3.3
L. Zou/
Water Research/2008,[17]
ordered mesopo-
rous carbon
~25
1.2
78
BM CDI
0.68
L. Li/
Carbon/2009,[130]
ordered mesopo-
rous carbon
~50
0.8
78
BM CDI
0.93
H. Li/
Journal of Materials Chemis-try/2009,[104]
graphene
~25
2.0
100
BM CDI
1.8
Y. J. Kim/
Separation and Purification Technology/2010,[147]
activated carbon
activated carbon
~200
~200
1.5
1.5
nd
nd
SP CDI
SP 0-MCDI
3.7
5.3
R. Zhao/
Journal of Physical Chemistry Letters/2010,[58]
commercial acti-
vated carbon electrode
~292
~1170
1.2
1.4
nd
nd
SP CDI
10.9 (†)
13.0 (†)
H. Li/
Environmental Science & Technology/2010,[55]
graphene-like
nanoflakes
~25
2.0
80
BM CDI
1.3
H. Li/
Journal of Electroanalytical Chemistry/2011,[148]
single-walled carbon nano-
tubes
~23
2.0
70
BM CDI
0.75
P. M. Biesheuvel/ Journal of Colloid and Inter-
face Science/2011,[12]
commercial activated carbon
electrode
~292
~292
~292
1.2
1.2
1.2
nd
nd
nd
SP CDI
SP 0-MCI
SP r-MCI
10.5
12.8
14.2
J. Yang/
Desalination/2011,[18]
MnO2 activated
carbon
~25
1.2
nd
BM CDI
1.0
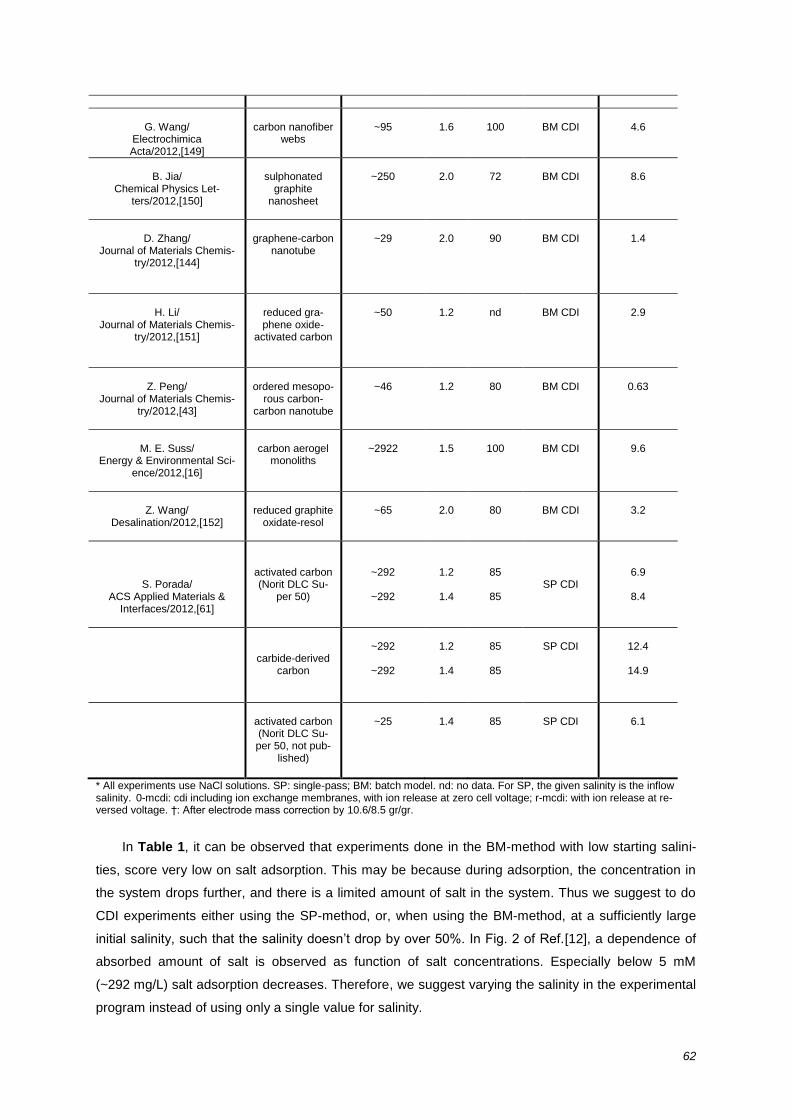
62
G. Wang/
Electrochimica Acta/2012,[149]
carbon nanofiber
webs
~95
1.6
100
BM CDI
4.6
B. Jia/
Chemical Physics Let-ters/2012,[150]
sulphonated
graphite nanosheet
~250
2.0
72
BM CDI
8.6
D. Zhang/
Journal of Materials Chemis-try/2012,[144]
graphene-carbon
nanotube
~29
2.0
90
BM CDI
1.4
H. Li/
Journal of Materials Chemis-try/2012,[151]
reduced gra-phene oxide-
activated carbon
~50
1.2
nd
BM CDI
2.9
Z. Peng/
Journal of Materials Chemis-try/2012,[43]
ordered mesopo-
rous carbon-carbon nanotube
~46
1.2
80
BM CDI
0.63
M. E. Suss/
Energy & Environmental Sci-ence/2012,[16]
carbon aerogel
monoliths
~2922
1.5
100
BM CDI
9.6
Z. Wang/
Desalination/2012,[152]
reduced graphite
oxidate-resol
~65
2.0
80
BM CDI
3.2
S. Porada/ ACS Applied Materials &
Interfaces/2012,[61]
activated carbon (Norit DLC Su-
per 50)
~292
~292
1.2
1.4
85
85
SP CDI
6.9
8.4
carbide-derived carbon
~292
~292
1.2
1.4
85
85
SP CDI
12.4
14.9
activated carbon (Norit DLC Su-per 50, not pub-
lished)
~25
1.4
85
SP CDI
6.1
* All experiments use NaCl solutions. SP: single-pass; BM: batch model. nd: no data. For SP, the given salinity is the inflow salinity. 0-mcdi: cdi including ion exchange membranes, with ion release at zero cell voltage; r-mcdi: with ion release at re-versed voltage. †: After electrode mass correction by 10.6/8.5 gr/gr.
In Table 1, it can be observed that experiments done in the BM-method with low starting salini-
ties, score very low on salt adsorption. This may be because during adsorption, the concentration in
the system drops further, and there is a limited amount of salt in the system. Thus we suggest to do
CDI experiments either using the SP-method, or, when using the BM-method, at a sufficiently large
initial salinity, such that the salinity doesn’t drop by over 50%. In Fig. 2 of Ref.[12], a dependence of
absorbed amount of salt is observed as function of salt concentrations. Especially below 5 mM
(~292 mg/L) salt adsorption decreases. Therefore, we suggest varying the salinity in the experimental
program instead of using only a single value for salinity.
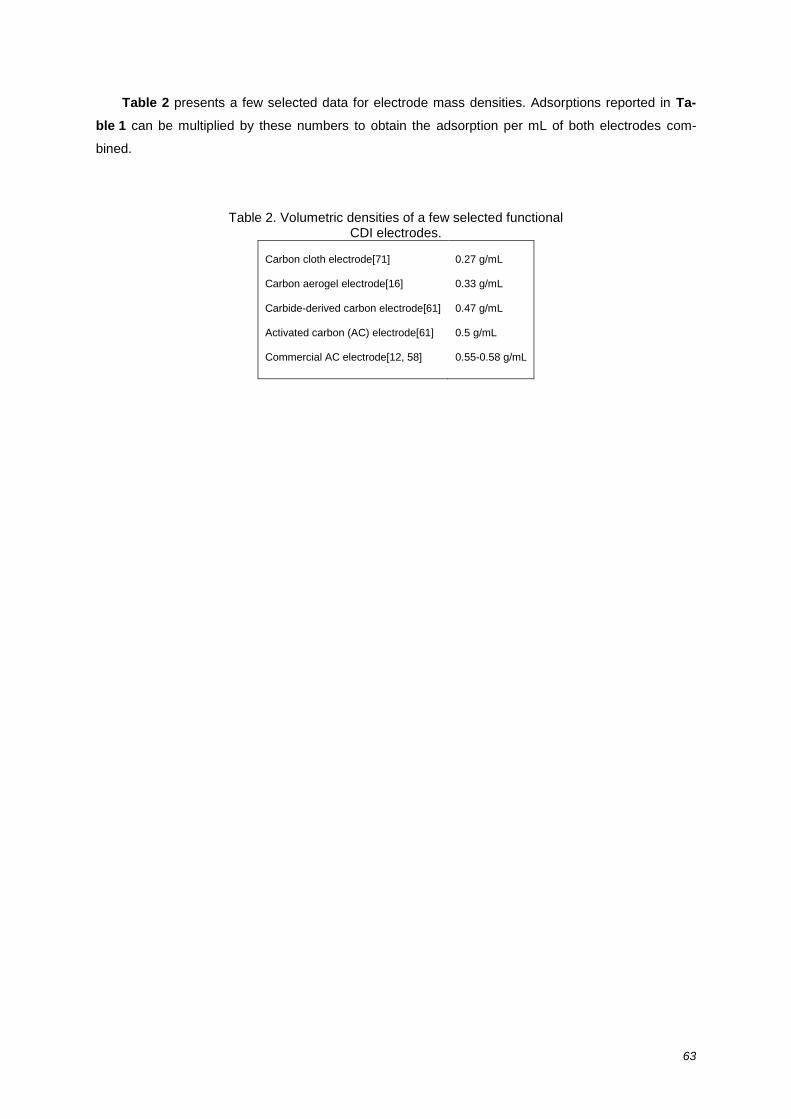
63
Table 2 presents a few selected data for electrode mass densities. Adsorptions reported in Ta-
ble 1 can be multiplied by these numbers to obtain the adsorption per mL of both electrodes com-
bined.
Table 2. Volumetric densities of a few selected functional CDI electrodes.
Carbon cloth electrode[71]
Carbon aerogel electrode[16]
Carbide-derived carbon electrode[61]
Activated carbon (AC) electrode[61]
Commercial AC electrode[12, 58]
0.27 g/mL 0.33 g/mL
0.47 g/mL 0.5 g/mL 0.55-0.58 g/mL
64
9. Outlook: Advanced CDI Electrode Materials and Predictive Modeling
The coming years will see the further development of CDI towards a mature technology with
many applications also beyond “just” water desalination. It is beyond the scope of review to go into
the details of such examples, like the recovery of lithium from seawater, phosphate from agricultural
sources, and valuable metal ions in metallurgical operations. The basic concept is either to capture
and harvest valuable ions from a solution or to remove undesired ions which may be harmful or poi-
sonous.
Economic optimization of CDI requires the minimization of electrical energy usage and invest-
ment costs related to stack assembly and materials. To make this a rational optimization, a robust,
reliable, and predictive CDI process model is required. Such a comprehensive model is not yet avail-
able but can be based on the elements laid out in this review. Particularly, a fully two-dimensional
model should be developed that includes both the direction of flow through the CDI device, and the
opposite direction of ion electrodiffusion into the electrode, and which can handle both constant volt-
age and constant current operation. Such a numerical tool can also be used to identify which of the
various process options is the best (choosing for instance between flow-by CDI, flow-through, electro-
static ion pumping, or membrane-CDI).
Available CDI process models include the capacitive nature of ion storage but do not yet consider
chemical (Faradaic) effects. It is important to develop theoretical methods that also address transport
and adsorption of protons and hydroxyl ions (and the ongoing equilibration of H2O ↔ H+ + OH
-). This
is important because a difference in removal of these ions leads to pH fluctuations in the spacer
channel and, thus, in the pH of the freshwater produced. Also, these ions play a role in several of the
Faradaic chemical effects in the electrode that were outlined before. Finally, understanding of pH-
changes is important because pH fluctuations may play a role in possible scaling, for example, as a
result of CaCO3 precipitation.
On the materials side, further research will have to identify the most appropriate pore size and
pore size distribution. Desalination with a high salt sorption capacity obtained with microporous car-
bons has revised the textbook wisdom that only mesopores would yield a high CDI performance.
However, transport limitations are commonly encountered in purely microporous particles. Ultimately,
the goal is to create materials that show a combination of a large number of micropores for ion-
immobilization and an intelligently designed hierarchical network of mesopores which act as optimized
transport channels. Finally, we have to consider the porosity and pore architecture of entire CDI elec-
trodes rather than only the pore characteristics of individual porous particles. CDI, after all, is a dy-
namic fluidic process and both, materials science and system engineering needs to develop CDI de-
vices that consider that fact.
The choice of porous carbon or dense carbon nanomaterials for CDI electrodes is, as we have
seen, well substantiated by the high CDI performance, the high tunability of carbon materials, the
large abundance and availability, and the moderate or low costs. However, it should also be noted
that other materials, like polymers, ceramics, or metals, can also be used as CDI electrodes. Ad-
vanced engineering of such materials, would potentially enable the manufacturing of transparent, flex-
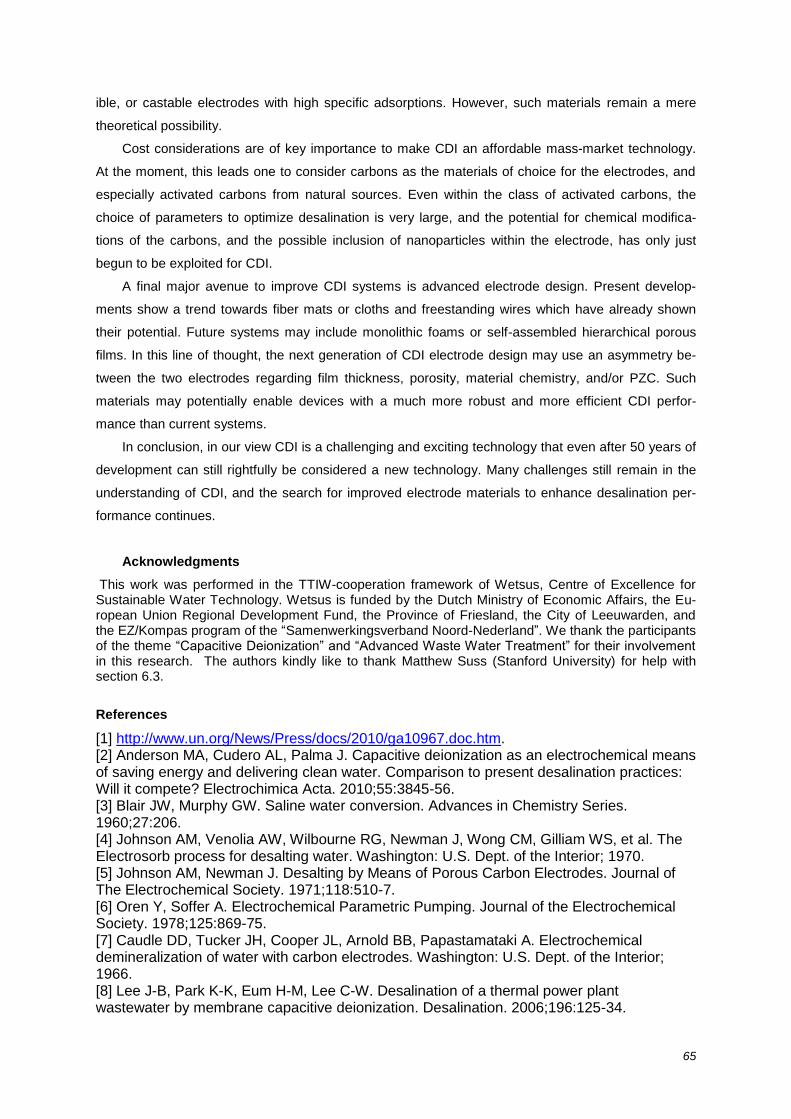
65
ible, or castable electrodes with high specific adsorptions. However, such materials remain a mere
theoretical possibility.
Cost considerations are of key importance to make CDI an affordable mass-market technology.
At the moment, this leads one to consider carbons as the materials of choice for the electrodes, and
especially activated carbons from natural sources. Even within the class of activated carbons, the
choice of parameters to optimize desalination is very large, and the potential for chemical modifica-
tions of the carbons, and the possible inclusion of nanoparticles within the electrode, has only just
begun to be exploited for CDI.
A final major avenue to improve CDI systems is advanced electrode design. Present develop-
ments show a trend towards fiber mats or cloths and freestanding wires which have already shown
their potential. Future systems may include monolithic foams or self-assembled hierarchical porous
films. In this line of thought, the next generation of CDI electrode design may use an asymmetry be-
tween the two electrodes regarding film thickness, porosity, material chemistry, and/or PZC. Such
materials may potentially enable devices with a much more robust and more efficient CDI perfor-
mance than current systems.
In conclusion, in our view CDI is a challenging and exciting technology that even after 50 years of
development can still rightfully be considered a new technology. Many challenges still remain in the
understanding of CDI, and the search for improved electrode materials to enhance desalination per-
formance continues.
Acknowledgments
This work was performed in the TTIW-cooperation framework of Wetsus, Centre of Excellence for Sustainable Water Technology. Wetsus is funded by the Dutch Ministry of Economic Affairs, the Eu-ropean Union Regional Development Fund, the Province of Friesland, the City of Leeuwarden, and the EZ/Kompas program of the “Samenwerkingsverband Noord-Nederland”. We thank the participants of the theme “Capacitive Deionization” and “Advanced Waste Water Treatment” for their involvement in this research. The authors kindly like to thank Matthew Suss (Stanford University) for help with section 6.3.
References
[1] http://www.un.org/News/Press/docs/2010/ga10967.doc.htm. [2] Anderson MA, Cudero AL, Palma J. Capacitive deionization as an electrochemical means of saving energy and delivering clean water. Comparison to present desalination practices: Will it compete? Electrochimica Acta. 2010;55:3845-56. [3] Blair JW, Murphy GW. Saline water conversion. Advances in Chemistry Series. 1960;27:206. [4] Johnson AM, Venolia AW, Wilbourne RG, Newman J, Wong CM, Gilliam WS, et al. The Electrosorb process for desalting water. Washington: U.S. Dept. of the Interior; 1970. [5] Johnson AM, Newman J. Desalting by Means of Porous Carbon Electrodes. Journal of The Electrochemical Society. 1971;118:510-7. [6] Oren Y, Soffer A. Electrochemical Parametric Pumping. Journal of the Electrochemical Society. 1978;125:869-75. [7] Caudle DD, Tucker JH, Cooper JL, Arnold BB, Papastamataki A. Electrochemical demineralization of water with carbon electrodes. Washington: U.S. Dept. of the Interior; 1966. [8] Lee J-B, Park K-K, Eum H-M, Lee C-W. Desalination of a thermal power plant wastewater by membrane capacitive deionization. Desalination. 2006;196:125-34.

66
[9] Li H, Gao Y, Pan L, Zhang Y, Chen Y, Sun Z. Electrosorptive desalination by carbon nanotubes and nanofibres electrodes and ion-exchange membranes. Water Research. 2008;42:4923-8. [10] Biesheuvel PM, van der Wal A. Membrane capacitive deionization. Journal of Membrane Science. 2009;346:256-62. [11] Kim Y-J, Choi J-H. Improvement of desalination efficiency in capacitive deionization using a carbon electrode coated with an ion-exchange polymer. Water Research. 2010;44:990-6. [12] Biesheuvel PM, Zhao R, Porada S, van der Wal A. Theory of membrane capacitive deionization including the effect of the electrode pore space. Journal of Colloid and Interface Science 2011;360:239-48. [13] Bouhadana Y, Ben-Tzion M, Soffer A, Aurbach D. A control system for operating and investigating reactors: The demonstration of parasitic reactions in the water desalination by capacitive de-ionization. Desalination. 2011;268:253-61. [14] Zhao R, Biesheuvel PM, Van der Wal A. Energy Consumption and Constant Current Operation in Membrane Capacitive Deionization. Energy & Environmental Science. 2012;5:9520-7. [15] Bouhadana Y, Avraham E, Noked M, Ben-Tzion M, Soffer A, Aurbach D. Capacitive Deionization of NaCl Solutions at Non-Steady-State Conditions: Inversion Functionality of the Carbon Electrodes. The Journal of Physical Chemistry C. 2011;115:16567-73. [16] Suss ME, Baumann TF, Bourcier WL, Spadaccini CM, Rose KA, Santiago JG, et al. Capacitive desalination with flow-through electrodes. Energy & Environmental Science. 2012;5:9511-9. [17] Zou L, Li L, Song H, Morris G. Using mesoporous carbon electrodes for brackish water desalination. Water Research. 2008;42:2340-8. [18] Yang J, Zou L, Song H, Hao Z. Development of novel MnO2/nanoporous carbon composite electrodes in capacitive deionization technology. Desalination. 2011;276:199-206. [19] Lee JW, Kim HI, Kim HJ, Park SG. Electrosorption Behavior of TiO2/Activated Carbon Composite for Capacitive Deionization. Appl Chem Eng. 2010;21:265-71. [20] Biesheuvel PM, Fu YQ, Bazant MZ. Diffuse charge and Faradaic reactions in porous electrodes. Physical Review E: Statistical, Nonlinear, and Soft Matter Physics. 2011;83:031507. [21] Biesheuvel PM, Bazant MZ. Nonlinear dynamics of capacitive charging and desalination by porous electrodes. Physical Review E: Statistical, Nonlinear, and Soft Matter Physics. 2010;81:031502. [22] Biesheuvel PM, Fu Y, Bazant MZ. Electrochemistry and capacitive charging of porous electrodes in asymmetric multicomponent electrolytes. Russian Journal of Electrochemistry. 2012;48:580-92. [23] Zhao R, van Soestbergen M, Rijnaarts HHM, van der Wal A, Bazant MZ, Biesheuvel PM. Time-dependent ion selectivity in capacitive charging of porous electrodes. Journal of Colloid and Interface Science. 2012;384:38-44. [24] Rouquerol J, Avnir D, Fairbridge CW, Everett DH, Haynes JM, Pernicone N, et al. Recommendations for the characterization of porous solids (Technical Report). Pure and Applied Chemistry. 1994;66:1739-58. [25] Blair JW, Murphy GW. Electrochemical Demineralization of Water with Porous Electrodes of Large Surface Area. SALINE WATER CONVERSION: American Chemical Society; 1960. p. 206-23. [26] Arnold BB, Murphy GW. Studies on electrochemistry of carbon and chemically modified carbon surfaces. Journal of Physical Chemistry. 1961;65:135-8. [27] Murphy GW, Caudle DD. Mathematical theory of electrochemical demineralization in flowing systems. Electrochimica Acta. 1967;12:1655-64. [28] Murphy GW, Cooper JL, Hunter JA. Activated carbon used as Electrodes in Electrochemical Demineralization of Saline Water. Washington: U.S. Dept. of the Interior; 1969.
67
[29] Evans S, Hamilton WS. The Mechanism of Demineralization at Carbon Electrodes. Journal of the Electrochemical Society. 1966;113:1314-9. [30] Evans S, Accomazzo MA, Accomazzo JE. Electrochemically Controlled Ion Exchange. Journal of the Electrochemical Society. 1969;116:307-9. [31] Accomazzo MA, Evans S. Electrochemically Controlled Ion Exchange. Journal of the Electrochemical Society. 1969;116:309-11. [32] Reid GW, Townsend FM, Stevens AM. Filed operation of a 20 gallons per day pilot plant unit for electrochemical desalination of brackish water. Washington: U.S. Dept. of the Interior; 1968. [33] Soffer A, Folman M. The electrical double layer of high surface porous carbon electrode. Journal of Electroanalytical Chemistry and Interfacial Electrochemistry. 1972;38:25-43. [34] Oren Y, Soffer A. Water desalting by means of electrochemical parametric pumping. I. The equilibrium properties of a batch unit cell. Journal of Applied Electrochemistry. 1983;13:473-87. [35] Oren Y, Soffer A. Water desalting by means of electrochemical parametric pumping. II. Separation properties of a multistage column. Journal of Applied Electrochemistry. 1983;13:489-505. [36] Oren Y. Capacitive delonization (CDI) for desalination and water treatment - past, present and future (a review). Desalination. 2008;228:10-29. [37] Avraham E, Bouhadana Y, Soffer A, Aurbach D. Limitation of Charge Efficiency in Capacitive Deionization. I. On the Behavior of Single Activated Carbon. Journal of the Electrochemical Society. 2009;156:P95-P9. [38] Avraham E, Noked M, Bouhadana Y, Soffer A, Aurbach D. Limitations of Charge Efficiency in Capacitive Deionization. II. On the Behavior of CDI Cells Comprising Two Activated Carbon Electrodes. Journal of the Electrochemical Society. 2009;156:P157-P62. [39] Farmer JC, Fix DV, Mack GV, Pekala RW, Poco JF. The Use of Capacitive Deionization with Carbon Aerogel Electrodes to Remove Inorganic Contaminants from Water. Low Level Waste Conference. Orlando1995. [40] Farmer JC, Fix DV, Mack GV, Pekala RW, Poco JF. Capacitive Deionization of NaCl and NaNO3 Solutions with Carbon Aerogel Electrodes. Journal of the Electrochemical Society. 1996;143:159-69. [41] Farmer JC, Bahowick SM, Harrar JE, Fix DV, Martinelli RE, Vu AK, et al. Electrosorption of Chromium Ions on Carbon Aerogel Electrodes as a Means of Remediating Ground Water. Energy & Fuels. 1997;11:337-47. [42] Yan C, Zou L, Short R. Single-walled carbon nanotubes and polyaniline composites for capacitive deionization. Desalination. 2012;290:125-9. [43] Peng Z, Zhang D, Shi L, Yan T. High performance ordered mesoporous carbon/carbon nanotube composite electrodes for capacitive deionization. Journal of Materials Chemistry. 2012;22:6603-12. [44] Nie C, Pan L, Liu Y, Li H, Chen T, Lu T, et al. Electrophoretic deposition of carbon nanotubes–polyacrylic acid composite film electrode for capacitive deionization. Electrochimica Acta. 2012;66:106-9. [45] Tsouris C, Mayes R, Kiggans J, Sharma K, Yiacoumi S, DePaoli D, et al. Mesoporous Carbon for Capacitive Deionization of Saline Water. Environmental Science & Technology. 2011;45:10243-9. [46] Peng Z, Zhang DS, Shi LY, Yan TT, Yuan SA, Li HR, et al. Comparative Electroadsorption Study of Mesoporous Carbon Electrodes with Various Pore Structures. J Phys Chem C. 2011;115:17068-76. [47] Bard J, Faulkner R. Excess charge and capacitance. In: Harris D, editor. Electrochemical methods: fundamentals and applications. New York: John Wiley & Sons, Inc.; 2001. [48] Posey FA, Morozumi T. Theory of Potentiostatic and Galvanostatic Charging of the Double Layer in Porous Electrodes. Journal of the Electrochemical Society. 1966;113:176-84.
68
[49] de Levie R. On porous electrodes in electrolyte solutions: I. Capacitance effects. Electrochimica Acta. 1963;8:751-80. [50] Jung-Ae L, Nam-Soo P, Jin-Soo P, Jae-Hwan C. Fabrication and characterization of a porous carbon electrode for desalination of brackish water. Desalination. 2009;238:37-42. [51] Chang LM, Duan XY, Liu W. Preparation and electrosorption desalination performance of activated carbon electrode with titania. Desalination. 2011;270:285-90. [52] Dai K, Shi L, Fang J, Zhang D, Yu B. NaCl adsorption in multi-walled carbon nanotubes. Materials Letters. 2005;59:1989-92. [53] Lee J-B, Park K-K, Yoon S-W, Park P-Y, Park K-I, Lee C-W. Desalination performance of a carbon-based composite electrode. Desalination. 2009;237:155-61. [54] Leonard KC, Genthe JR, Sanfilippo JL, Zeltner WA, Anderson MA. Synthesis and characterization of asymmetric electrochemical capacitive deionization materials using nanoporous silicon dioxide and magnesium doped aluminum oxide. Electrochimica Acta. 2009;54:5286-91. [55] Li H, Zou L, Pan L, Sun Z. Novel Graphene-Like Electrodes for Capacitive Deionization. Environmental Science & Technology. 2010;44:8692-7. [56] Park K-K, Lee J-B, Park P-Y, Yoon S-W, Moon J-S, Eum H-M, et al. Development of a carbon sheet electrode for electrosorption desalination. Desalination. 2007;206:86-91. [57] Porada S, Bryjak M, van der Wal A, Biesheuvel PM. Effect of electrode thickness variation on operation of capacitive deionization. Electrochimica Acta. 2012;75:148-56. [58] Zhao R, Biesheuvel PM, Miedema H, Bruning H, van der Wal A. Charge Efficiency: A Functional Tool to Probe the Double-Layer Structure Inside of Porous Electrodes and Application in the Modeling of Capacitive Deionization. Journal of Physical Chemistry Letters. 2010;1:205-10. [59] Bourcier WL, Aines RD, Haslam JJ, Schaldach CM, O'Brien KC, Cussler E. Deionization and Desalination Using Electrostatic Ion Pumping. United States: Lawrence Livermore National Security, LLC, Livermore, CA; 2011. [60] Porada S, Sales BB, Hamelers HVM, Biesheuvel PM. Water Desalination with Wires. The Journal of Physical Chemistry Letters. 2012:1613-8. [61] Porada S, Weinstein L, Dash R, van der Wal A, Bryjak M, Gogotsi Y, et al. Water Desalination Using Capacitive Deionization with Microporous Carbon Electrodes. ACS Applied Materials & Interfaces. 2012;4:1194-9. [62] Lee J-H, Bae W-S, Choi J-H. Electrode reactions and adsorption/desorption performance related to the applied potential in a capacitive deionization process. Desalination. 2010;258:159-63. [63] Wang M, Huang Z-H, Wang L, Wang M-X, Kang F, Hou H. Electrospun ultrafine carbon fiber webs for electrochemical capacitive desalination. New Journal of Chemistry. 2010;34:1843-5. [64] Li H, Pan L, Zhang Y, Zou L, Sun C, Zhan Y, et al. Kinetics and thermodynamics study for electrosorption of NaCl onto carbon nanotubes and carbon nanofibers electrodes. Chemical Physics Letters. 2010;485:161-6. [65] Huang Z-H, Wang M, Wang L, Kang F. Relation between the Charge Efficiency of Activated Carbon Fiber and Its Desalination Performance. Langmuir. 2012;28:5079-84. [66] Kim Y-J, Choi J-H. Selective removal of nitrate ion using a novel composite carbon electrode in capacitive deionization. Water Research. 2012;46:6033-9. [67] Li H, Zou L. Ion-exchange membrane capacitive deionization: A new strategy for brackish water desalination. Desalination. 2011;275:62-6. [68] Humplik T, Lee J, O'Hern SC, Fellman BA, Baig MA, Hassan SF, et al. Nanostructured materials for water desalination. Nanotechnology. 2011;22:292001. [69] Avraham E, Noked M, Bouhadana Y, Soffer A, Aurbach D. Limitations of charge efficiency in capacitive deionization processes III: The behavior of surface oxidized activated carbon electrodes. Electrochimica Acta. 2010;56:441-7. [70] Avraham E, Noked M, Cohen I, Soffer A, Aurbach D. The Dependence of the Desalination Performance in Capacitive Deionization Processes on the Electrodes PZC. Journal of the Electrochemical Society. 2011;158:168-73.
69
[71] Cohen I, Avraham E, Noked M, Soffer A, Aurbach D. Enhanced Charge Efficiency in Capacitive Deionization Achieved by Surface-Treated Electrodes and by Means of a Third Electrode. J Phys Chem C. 2011;115:19856-63. [72] Jeon BG, No HC, Lee JI. Development of a two-dimensional coupled-implicit numerical tool for the optimal design of CDI electrodes. Desalination. 2011;274:226-36. [73] Andersen MB, van Soestbergen M, Mani A, Bruus H, Biesheuvel PM, Bazant MZ. Current-Induced Membrane Discharge. Physical Review Letters. 2012;109:108301. [74] Kamran K, van Soestbergen M, Huinink HP, Pel L. Inhibition of electrokinetic ion transport in porous materials due to potential drops induced by electrolysis. Electrochimica Acta. 2012;78:229-35. [75] Mani A, Bazant MZ. Deionization shocks in microstructures. Physical Review E: Statistical, Nonlinear, and Soft Matter Physics. 2011;84:061504. [76] Biesheuvel PM. Two-fluid model for the simultaneous flow of colloids and fluids in porous media. Journal of Colloid and Interface Science. 2011;355:389-95. [77] von Helmholtz HLF. Ann Phys Chem 1853;89:211. [78] Gouy G. J Phys. 1910;9:45. [79] Chapman DL. Philos Mag. 1913;25:475. [80] Stern O. Z Elektrochem Angew Phys Chem. 1924;30:508. [81] Bazant MZ, Thornton K, Ajdari A. Diffuse-charge dynamics in electrochemical systems. Physical Review E: Statistical, Nonlinear, and Soft Matter Physics. 2004;70:021506. [82] Kastening B, Heins M. Electrolyte composition and ionic mobility in micropores. Physical Chemistry Chemical Physics. 2001;3:372-3. [83] Yang K-L, Ying T-Y, Yiacoumi S, Tsouris C, Vittoratos ES. Electrosorption of Ions from Aqueous Solutions by Carbon Aerogel:  An Electrical Double-Layer Model. Langmuir. 2001;17:1961-9. [84] Ying T-Y, Yang K-L, Yiacoumi S, Tsouris C. Electrosorption of Ions from Aqueous Solutions by Nanostructured Carbon Aerogel. Journal of Colloid and Interface Science. 2002;250:18-27. [85] Hou C-H, Liang C, Yiacoumi S, Dai S, Tsouris C. Electrosorption capacitance of nanostructured carbon-based materials. Journal of Colloid and Interface Science. 2006;302:54-61. [86] Yang K-L, Yiacoumi S, Tsouris C. Monte Carlo simulations of electrical double-layer formation in nanopores Journal of Chemical Physics. 2002;117:8499. [87] Huang J, Sumpter BG, Meunier V. A Universal Model for Nanoporous Carbon Supercapacitors Applicable to Diverse Pore Regimes, Carbon Materials, and Electrolytes. Chemistry – A European Journal. 2008;14:6614-26. [88] Feng G, Qiao R, Huang J, Sumpter BG, Meunier V. Ion Distribution in Electrified Micropores and Its Role in the Anomalous Enhancement of Capacitance. ACS Nano. 2010;4:2382-90. [89] Biesheuvel PM, van Limpt B, van der Wal A. Dynamic Adsorption/Desorption Process Model for Capacitive Deionization. J Phys Chem C. 2009;113:5636-40. [90] Kamran K, van Soestbergen M, Pel L. Electrokinetic Salt Removal from Porous Building Materials Using Ion Exchange Membranes. Transport in Porous Media. 2012:DOI 10.1007/s11242-012-0083-0. [91] Kastening B, Heins M. Properties of electrolytes in the micropores of activated carbon. Electrochimica Acta. 2005;50:2487-98. [92] Arafat HA, Franz M, Pinto NG. Effect of Salt on the Mechanism of Adsorption of Aromatics on Activated Carbon†. Langmuir. 1999;15:5997-6003. [93] Zhao R, Satpradit O, Rijnaarts HHM, Biesheuvel PM, van der Wal A. Optimization of salt adsorption rate in membrane capacitive deionization. Water Research. 2013. [94] Grahame DC. The electrical double layer and the theory of electrocapillarity. Chemical Reviews. 1947;41:441-501. [95] Bazant MZ, Chu KT, Bayly BJ. Current-Voltage Relations for Electrochemical Thin Films. SIAM Journal on Applied Mathematics. 2005;65:1463-84.
70
[96] de Levie R. On porous electrodes in electrolyte solutions—IV. Electrochimica Acta. 1964;9:1231-45. [97] Newman JS, Tobias CW. Theoretical Analysis of Current Distribution in Porous Electrodes. Journal of the Electrochemical Society. 1962;109:1183-91. [98] Rica RA, Brogioli D, Ziano R, Salerno D, Mantegazza F. Ions Transport and Adsorption Mechanisms in Porous Electrodes During Capacitive-Mixing Double Layer Expansion (CDLE). The Journal of Physical Chemistry C. 2012. [99] Brogioli D, Zhao R, Biesheuvel PM. A prototype cell for extracting energy from a water salinity difference by means of double layer expansion in nanoporous carbon electrodes. Energy & Environmental Science. 2011;4:772-7. [100] Mani A, Zangle TA, Santiago JG. On the Propagation of Concentration Polarization from Microchannel−Nanochannel Interfaces Part I: Analytical Model and Characteristic Analysis. Langmuir. 2009;25:3898-908. [101] Wilson JR. Demineralization by electrodialysis. London: Butterworths; 1960. [102] Biesheuvel PM. Thermodynamic cycle analysis for capacitive deionization. Journal of Colloid and Interface Science. 2009;332:258-64. [103] Zhao R, Porada S, Biesheuvel PM, van der Wal A. Energy Use in Constant-Current Membrane Capacitive Ceionization and Comparison with Reverse Osmosis. Desalination. 2013 [104] Li HB, Lu T, Pan LK, Zhang YP, Sun Z. Electrosorption behavior of graphene in NaCl solutions. Journal of Materials Chemistry. 2009;19:6773-9. [105] Zhang D, Shi L, Fang J, Dai K, Li X. Preparation and desalination performance of multiwall carbon nanotubes. Materials Chemistry and Physics. 2006;97:415-9. [106] Oh HJ, Lee JH, Ahn HJ, Jeong Y, Kim YJ, Chi CS. Nanoporous activated carbon cloth for capacitive deionization of aqueous solution. Thin Solid Films. 2006;515:220-5. [107] Li J, Wang X, Huang Q, Gamboa S, Sebastian PJ. Studies on preparation and performances of carbon aerogel electrodes for the application of supercapacitor. Journal of Power Sources. 2006;158:784-8. [108] Nightingale ER. Phenomenological Theory of Ion Solvation. Effective Radii of Hydrated Ions. The Journal of Physical Chemistry. 1959;63:1381-7. [109] Sing KSW, Everett DH, Haul RAV, L. Moscou, Pierotti RA, Rouquerol J, et al. Reporting physisorption data for gas/solid systems with special reference to the determination of surface area and porosity (Recommendations 1984). Pure and Applied Chemistry. 1985;57:603-19. [110] Nikitin A, Gogotsi Y. Nanostructured Carbide-Derived Carbon. In: Nalwa HS, editor. Encyclopedia of Nanoscience and Nanotechnology. CA: American Scientific Publishers; 2004. p. 553-74. [111] Presser V, Heon M, Gogotsi Y. Carbide-Derived Carbons – From Porous Networks to Nanotubes and Graphene. Advanced Functional Materials. 2011;21:810-33. [112] Zhai Y, Dou Y, Zhao D, Fulvio PF, Mayes RT, Dai S. Carbon Materials for Chemical Capacitive Energy Storage. Advanced Materials. 2011;23:4828-50. [113] Korenblit Y, Rose M, Kockrick E, Borchardt L, Kvit A, Kaskel S, et al. High-Rate Electrochemical Capacitors Based on Ordered Mesoporous Silicon Carbide-Derived Carbon. Acs Nano. 2010;4:1337 - 44. [114] Huang J, Sumpter BG, Meunier V, Gogotsi YG, Yushin G, Portet C. Curvature effects in carbon nanomaterials: Exohedral versus endohedral supercapacitors. Journal of Materials Research. 2010;25:1525-31. [115] Gabelich CJ, Tran TD, Suffet IHM. Electrosorption of Inorganic Salts from Aqueous Solution Using Carbon Aerogels. Environ Sci Technol. 2002;36:3010-9. [116] Chmiola J, Largeot C, Taberna PL, Simon P, Gogotsi Y. Monolithic Carbide-Derived Carbon Films for Micro-Supercapacitors. Science. 2010;328:480 - 3. [117] Hung K, Masarapu C, Ko T, Wei B. Wide-temperature range operation supercapacitors from nanostructured activated carbon fabric. Journal of Power Sources. 2009;193:944-9. [118] Jost K, Perez CR, McDonough JK, Presser V, Heon M, Dion G, et al. Carbon coated textiles for flexible energy storage. Energy and Environmental Science. 2011;4:5060-7.
71
[119] Presser V, Zhang L, Niu JJ, McDonough J, Perez C, Fong H, et al. STORAGE MATERIALS: Flexible Nano-felts of Carbide-Derived Carbon with Ultra-high Power Handling Capability (Adv. Energy Mater. 3/2011). Advanced Energy Materials. 2011;1:422-. [120] Marsh H. Activated carbon. 1st ed. Boston, MA: Elsevier; 2006. [121] Wang G, Dong Q, Ling Z, Pan C, Yu C, Qiu J. Hierarchical activated carbon nanofiber webs with tuned structure fabricated by electrospinning for capacitive deionization. Journal of Materials Chemistry. 2012;22:21819-23. [122] Wang G, Qian B, Dong Q, Yang J, Zhao Z, Qiu J. Highly mesoporous activated carbon electrode for capacitive deionization. Separation and Purification Technology. 2013;103:216-21. [123] Zou L, Morris G, Qi D. Using activated carbon electrode in electrosorptive deionisation of brackish water. Desalination. 2008;225:329-40. [124] Ahn H-J, Lee J-H, Jeong Y, Lee J-H, Chi C-S, Oh H-J. Nanostructured carbon cloth electrode for desalination from aqueous solutions. Materials Science and Engineering: A. 2007;449-451:841-5. [125] Ryoo MW, Kim JH, Seo G. Role of titania incorporated on activated carbon cloth for capacitive deionization of NaCl solution. Journal of Colloid and Interface Science. 2003;264:414-9. [126] Ryoo MW, Seo G. Improvement in capacitive deionization function of activated carbon cloth by titania modification. Water Research. 2003;37:1527-34. [127] Myint MTZ, Dutta J. Fabrication of zinc oxide nanorods modified activated carbon cloth electrode for desalination of brackish water using capacitive deionization approach. Desalination. 2012;305:24-30. [128] Han L, Karthikeyan KG, Anderson MA, Gregory K, Wouters JJ, Abdel-Wahab A. Mechanistic Insights into the Use of Oxide Nanoparticles Coated Asymmetric Electrodes for Capacitive Deionization. Electrochimica Acta. 2013. [129] Kyotani T, Chmiola J, Gogotsi Y. Carbide Derived Carbon and Templated Carbons. In: Beguin F, Frackowiak E, editors. Carbon Materials for Electrochemical Energy Storage Systems. Boca Raton: CRC Press/Taylor and Francis; 2009. p. 77 - 113. [130] Li L, Zou L, Song H, Morris G. Ordered mesoporous carbons synthesized by a modified sol–gel process for electrosorptive removal of sodium chloride. Carbon. 2009;47:775-81. [131] Wen X, Zhang D, Shi L, Yan T, Wang H, Zhang J. Three-dimensional hierarchical porous carbon with a bimodal pore arrangement for capacitive deionization. Journal of Materials Chemistry. 2012;22:23835-44. [132] Pekala RW, Alviso CT, Kong FM, Hulsey SS. Aerogels derived from multifunctional organic monomers. Journal of Non-Crystalline Solids. 1992;145:90-8. [133] Yang C-M, Choi W-H, Na B-K, Cho BW, Cho WI. Capacitive deionization of NaCl solution with carbon aerogel-silicagel composite electrodes. Desalination. 2005;174:125-33. [134] Moreno-Castilla C, Maldonado-Hódar FJ. Carbon aerogels for catalysis applications: An overview. Carbon. 2005;43:455-65. [135] Yoshizawa N, Hatori H, Soneda Y, Hanzawa Y, Kaneko K, Dresselhaus MS. Structure and electrochemical properties of carbon aerogels polymerized in the presence of Cu2+. Journal of Non-Crystalline Solids. 2003;330:99-105. [136] Landon J, Gao X, Kulengowski B, Neathery JK, Liu K. Impact of Pore Size Characteristics on the Electrosorption Capacity of Carbon Xerogel Electrodes for Capacitive Deionization. Journal of the Electrochemical Society. 2012;159:A1861-A6. [137] Feng G, Qiao R, Huang J, Dai S, Sumpter BG, Meunier V. The importance of ion size and electrode curvature on electrical double layers in ionic liquids. Physical Chemistry Chemical Physics. 2011;13:1152-61. [138] Pech D, Brunet M, Durou H, Huang P, Mochalin V, Gogotsi Y, et al. Ultrahigh-power micrometre-sized supercapacitors based on onion-like carbon. Nature Nanotechnology. 2010;5:651-4.
72
[139] Wang XZ, Li MG, Chen YW, Cheng RM, Huang SM, Pan LK, et al. Electrosorption of NaCl Solutions with Carbon Nanotubes and Nanofibers Composite Film Electrodes. Electrochemical and Solid-State Letters. 2006;9:E23-E6. [140] Dai K, Shi L, Zhang D, Fang J. NaCl adsorption in multi-walled carbon nanotube/active carbon combination electrode. Chemical Engineering Science. 2006;61:428-33. [141] Zou L. Developing Nano-Structured Carbon Electrodes for Capacitive Brackish Water Desalination. In: Ning RY, editor. Expanding Issues in Desalination. INTECH2011. [142] Wang H, Zhang D, Yan T, Wen X, Shi L, Zhang J. Graphene prepared via a novel pyridine-thermal strategy for capacitive deionization. Journal of Materials Chemistry. 2012;22:23745-8. [143] Zhang D, Wen X, Shi L, Yan T, Zhang J. Enhanced capacitive deionization of graphene/mesoporous carbon composites. Nanoscale. 2012;4:5440-6. [144] Zhang D, Yan T, Shi L, Peng Z, Wen X, Zhang J. Enhanced capacitive deionization performance of graphene/carbon nanotube composites. Journal of Materials Chemistry. 2012;22:14696-704. [145] Stoeckli F, Guillot A, Slasli AM, Hugi-Cleary D. Microporosity in carbon blacks. Carbon. 2002;40:211-5. [146] Nadakatti S, Tendulkar M, Kadam M. Use of mesoporous conductive carbon black to enhance performance of activated carbon electrodes in capacitive deionization technology. Desalination. 2011;268:182-8. [147] Kim Y-J, Choi J-H. Enhanced desalination efficiency in capacitive deionization with an ion-selective membrane. Separation and Purification Technology. 2010;71:70-5. [148] Li H, Pan L, Lu T, Zhan Y, Nie C, Sun Z. A comparative study on electrosorptive behavior of carbon nanotubes and graphene for capacitive deionization. Journal of Electroanalytical Chemistry. 2011;653:40-4. [149] Wang G, Pan C, Wang L, Dong Q, Yu C, Zhao Z, et al. Activated carbon nanofiber webs made by electrospinning for capacitive deionization. Electrochimica Acta. 2012;69:65-70. [150] Jia B, Zou L. Wettability and its influence on graphene nansoheets as electrode material for capacitive deionization. Chemical Physics Letters. 2012;548:23-8. [151] Li H, Pan L, Nie C, Liu Y, Sun Z. Reduced graphene oxide and activated carbon composites for capacitive deionization. Journal of Materials Chemistry. 2012;22:15556-61. [152] Wang Z, Dou B, Zheng L, Zhang G, Liu Z, Hao Z. Effective desalination by capacitive deionization with functional graphene nanocomposite as novel electrode material. Desalination. 2012;299:96-102.