review prediction of formation pressure gradients of nc98
TRANSCRIPT

11
Journal of Management Science & Engineering Research | Volume 01 | Issue 01 | 2018
Journal of Management Science & Engineering Researchhttp://ojs.bilpublishing.com/index.php/jmser
Distributed under creative commons license 4.0 DOI: https://doi.org/10.30564/jmser.v1i1.346
*Corresponding Author: Ahmed TunnishPetroleum Systems Engineering, Faculty of Engineering and Applied Science, University of Regina, Regina, CanadaE-mail: [email protected]
AbstrAct
The prediction of formation pore pressure and fracture pressure gradients is a significant step towards the drilling plan. In this study, the formation pressures of twelve wells from Nc98 field-Sirte Basin (Waha Oil Company) were calculated by employing empirical methods, Ea-ton's equations, that depend on the real drilling and well-logging data. Regarding the results, the normal pore pressure in the NC98 field in Sirte basin is 9.89 kPa/m (0.437 Psi/ft), and it is extending from the top of the wells in the investigated area to 2134 m (7,000 ft). A subnormal to normal pore pressure zone is noticed in the interval of 2134 m to 2743 m (7,000 ft. - 9,000 ft). Then, slightly subnormal to somewhat abnormal (overpressure) region is seen from 2743 – 3414 (9,000 ft. - 11,200 ft). Beyond to that depth and down to the top of the reservoir, the overpressure zone was clearly observed. based on the results, the casing seating depth and the equivalent mud weight were simply determined for the area of study.
ARTICLE INFO
Article history:received: 26th November 2018Accepted: 27th December 2018 Published: 31th December 2018
Keywords:Pore pressureFracture pressureOverburden pressureEaton's methodcasing seating depths
Review
Prediction of Formation Pressure Gradients of NC98 Field-Sirte Basin-Libya
Ahmed Tunnish1* Mohammed Nasr2 Mahmoud Salem3
1. Petroleum Systems Engineering Department, Faculty of Engineering, University of Regina, Canada.2. Petroleum Engineering Department, Faculty of Engineering, Tripoli University, Tripoli, Libya3. Waha Oil Company, Tripoli, Libya.
1. introduction
One of the most significant factors for drilling preparation is the formation pore pressure. the pressure formed in pore spaces due to the pres-
ence of the fluids is known as formation pore pressure. Pore pressure is classified as subnormal (less than hy-
drostatic pressure "9.8 kPa/m or 0.433 psi/ft"), normal (equal to hydrostatic pressure), and overpressure (slightly more than hydrostatic pressure and less than overburden pressure). Thermal expansion, under compaction, mineral transformations, hydrocarbon generation,..., etc. are some of the reasons for having formation pore overpressure
12
Journal of Management Science & Engineering Research | Volume 01 | Issue 01 | 2018
Distributed under creative commons license 4.0 DOI: https://doi.org/10.30564/jmser.v1i1.346
zones. the abnormal compaction results in disequilibrium compaction, which concludes with the changing trend of the overburden pressure (probably decreasing) with the depth, more pore spaces, and overpressure[1]. Where the rapid sedimentation process and the presence of a no per-meable system are the main reasons for creating overpres-sure zone[2]. the ratio of the pore volume of the formation decreases with depth in the case of regular compacted or pressurized zones[3]. Finally, the precise prediction of formation pore pressure is crucial to prevent drilling well blowouts, pressure kicks, and fluid influx.
Accurate prediction of formation pressures can benefit even the geologists historically to analyze the migration of the fluids from the mother rock (source rock) to the trap[4]. the precise prediction of the overpressure zone can be proved by the alteration in the overburden pressure gradient curve. According to the results, the predicted pore pressure is inversely related to the overburden pres-sure and linearly related to the fracture pressure; however, fracture pressure is straightly linked with both of them. Also, it was noticed that the overburden pressure mainly affected by the depth of the formation. Where it is directly proportional to the depth[5]. In the Gulf of Mexico, about 24 % of the drilling processes were ended up with loss circulation and flowing of water/gas, due to the wrong pre-drilling data[6].
the common methods to predict the formation pres-sures depend on pre-drilling information (seismic data), during drilling information (well-logging/drilling data), and history information (known data data)[7]. For wildcat wells, only seismic data may be available. For the devel-opment wells, the prediction of the formation pressure gradients depends on the well-logging and drilling data in the investigated area. the prediction of formation pressures in complicated geological regions raises the un-certainty of the applied prediction models[8]. A long time ago, before the application of well-logging data to predict formation pore and fracture pressures, the characteristics of shale (mudrock) was employed. The predicted pressure from this technique represents pore pressure in shale. Al-ternatively, different ways included the centroid method introduced by Dickinson (1953)[9], Bowers (2001)[10] and the different models suggested by Yardley and Swarbrick (2000)[11] as well as Meng et al., (2011)[12] were employed.
In this study, Eaton's drilling and well logging methods are employed to predict formation pore pressure and frac-ture pressure gradients for NC98 field-Waha-Sirte Basin. the predicted formation pressure gradients were applied to determine the equivalent mud circulation, casing seat-ing depths, and the number of required casings in this area. Besides, figuring out the most appropriate source of
data (drilling or well logging data) that can be used to pre-dict pore and fracture pressure gradients.
The goals of this study are: (1) studying the applicabil-ity of Eaton's methods in the studied area, (2) determining of the proper source of data (well logging or drilling raw data) to predict formation pressure gradients, (3) pre-dicting the minimum and maximum pore pressure, and fracture pressure gradients and (4) establishing one plot of the collective formation pressure results for the future development projects in this area.
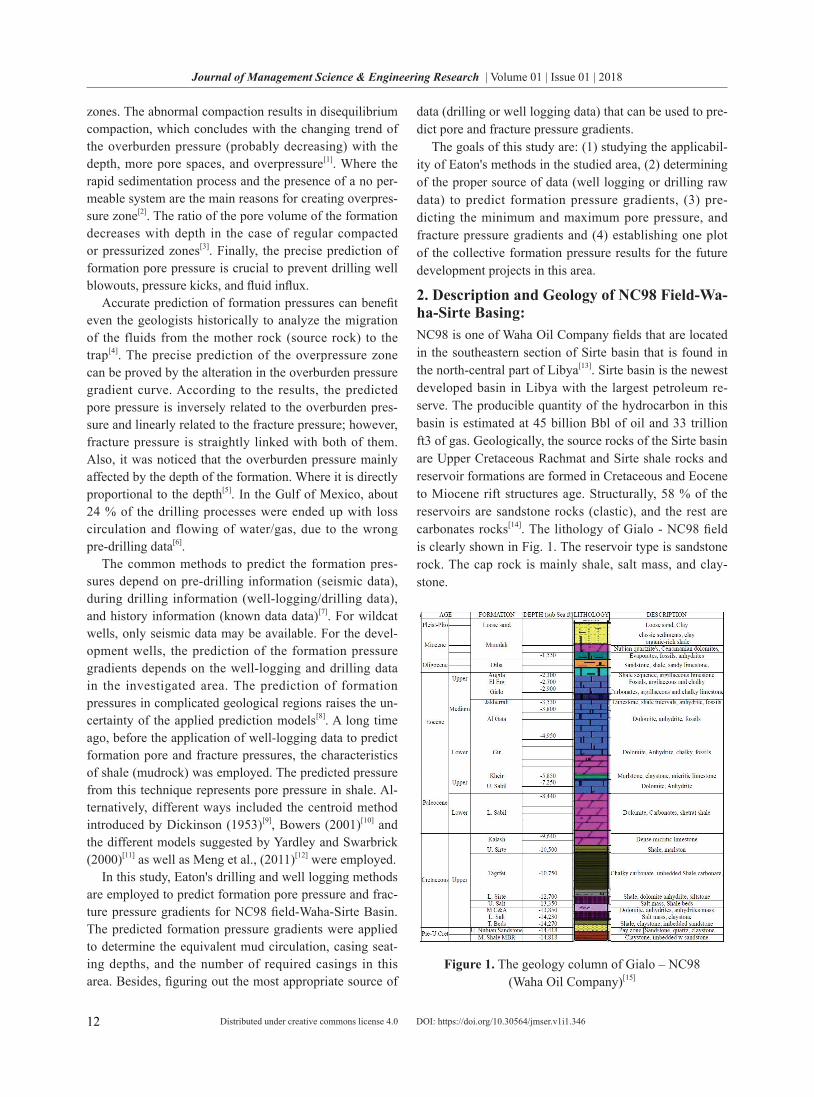
2. Description and Geology of NC98 Field-wa-ha-Sirte Basing:NC98 is one of Waha Oil Company fields that are located in the southeastern section of sirte basin that is found in the north-central part of Libya[13]. sirte basin is the newest developed basin in Libya with the largest petroleum re-serve. the producible quantity of the hydrocarbon in this basin is estimated at 45 billion bbl of oil and 33 trillion ft3 of gas. Geologically, the source rocks of the Sirte basin are Upper Cretaceous Rachmat and Sirte shale rocks and reservoir formations are formed in Cretaceous and Eocene to Miocene rift structures age. structurally, 58 % of the reservoirs are sandstone rocks (clastic), and the rest are carbonates rocks[14]. The lithology of Gialo - NC98 field is clearly shown in Fig. 1. The reservoir type is sandstone rock. The cap rock is mainly shale, salt mass, and clay-stone.
Figure 1. the geology column of Gialo – Nc98 (Waha Oil Company)[15]

13
Journal of Management Science & Engineering Research | Volume 01 | Issue 01 | 2018
Distributed under creative commons license 4.0 DOI: https://doi.org/10.30564/jmser.v1i1.346
3. Methodsthis procedure is applied in the drilling application to pre-dict formation pore pressure, fracture pressure and over-burden pressure gradients for the formation. Monitoring the well-logging data, drilling data, drilling fluid, and rock particles, can be employed to indicate the transition zone between normal and overpressure areas.
3.1 Overburden Pressure Predictionthe precise prediction of formation pressures is essential in terms of the cost and safety during the drilling process. Overburden pressure can be determined based on the pore pressure data [16] by employing equation (1):σob= σν+ ∝ Pp (1)It is obvious from Equation (1) that the values of po-
roelasticity, vertical effective stress, and overburden pres-sure should be known to calculate formation pore pres-sure. the poroelasticity factor was experimentally proved as a constant ( ∝ = 1) by Terzaghi[17]. As can be noticed in Equation (2), in addition, the calculation of the overbur-den pressure mainly depends on the formation bulk densi-ty.σob= ∫ ρb dD (2)Gardner and coworkers (1974) found that the calcu-
lation of formation bulk density could be done through some empirical correlation based on seismic and well logging data[18]. Equation (3), as shown below, is directly employed to calculate the formation overburden pressure:σob= 0.433 ρb D (3)
3.2 Pore Pressure PredictionOne of the important steps to prevent the possibility of having blowouts or mud loss during drilling step is the accurate prediction of formation pore pressure[2]. since there is no straightforward method to measure formation pore pressure in some formations such as shales, plan-ning, and execution of new boreholes depends on indirect ways[19]. Many methods such as bowers[20], and d-expo-nent [21] are applied to predict the pore pressure in shales from indirect methods. the fundamental of the indirect techniques that are used to predict the abnormal pressure is based on the compaction of the studied formation. the abnormally pressured formations are less compacted and higher porous in comparison to formations of uniform lithology at the equivalent depth. so, formations with high porosity may be signified as overpressure areas. The indirect method proposed by Bingham (1969) depends on the hardness of the formation is known as the d-exponent method[22]. The d-exponent equation was modified based on drilling raw data to d-corrected-exponent (dc-exponent) to standardize the calculated drilling rate of penetration. Jorden's and shirley's model was modified to include the
term of mud weight[23], as presented in equation (4):
𝑑𝑑𝑑𝑑 − 𝑒𝑒𝑒𝑒𝑒𝑒𝑒𝑒𝑒𝑒𝑒𝑒𝑒𝑒𝑒𝑒 = log� 𝑅𝑅𝑅𝑅𝑅𝑅
60 𝑅𝑅𝑅𝑅𝑅𝑅�
log�12 𝑊𝑊𝑅𝑅𝑊𝑊103 𝑑𝑑𝑏𝑏𝑏𝑏𝑒𝑒
� ∗ �
𝜌𝜌𝑒𝑒𝑒𝑒𝑛𝑛𝑛𝑛𝑛𝑛𝑛𝑛𝜌𝜌𝑛𝑛𝑑𝑑𝑒𝑒𝑎𝑎𝑛𝑛𝑛𝑛
� (4)
In 1975, Eaton proposed a predictive method of pore pressure depending on the drilling data (dc-exponent) and well logging (sonic compressional transit time) data, re-spectively, as presented in equations (5) and (6) [24]:
𝑅𝑅𝑒𝑒𝐷𝐷 =
𝑅𝑅𝑒𝑒𝐷𝐷 − ��𝜎𝜎𝑒𝑒𝑏𝑏 −
𝑅𝑅𝑒𝑒𝑒𝑒𝑒𝑒𝑛𝑛𝑛𝑛𝑛𝑛𝑛𝑛𝐷𝐷 � �
𝑑𝑑𝑑𝑑 ,𝑒𝑒𝑏𝑏𝑜𝑜𝑒𝑒𝑛𝑛𝑜𝑜𝑒𝑒𝑑𝑑
𝑑𝑑𝑑𝑑 ,𝑒𝑒𝑒𝑒𝑛𝑛𝑛𝑛𝑛𝑛𝑛𝑛�
1.2
� (5)
𝑅𝑅𝑒𝑒𝐷𝐷 =
𝑅𝑅𝑒𝑒𝐷𝐷 − ��𝜎𝜎𝑒𝑒𝑏𝑏 −
𝑅𝑅𝑒𝑒𝑒𝑒𝑒𝑒𝑛𝑛𝑛𝑛𝑛𝑛𝑛𝑛𝐷𝐷 � �
Δt𝑒𝑒𝑒𝑒𝑛𝑛𝑛𝑛𝑛𝑛𝑛𝑛Δt �
3
� (6)
3.3 Fracture Pressure PredictionFormation fracture pressure (PF) is the pressure at which the formation starts cracking and the mud loss circulation occurs. For an appropriate mud weight design, it is crucial to accurately predict fracture pressure gradient. there are different methods to determine fracture gradient. In practice, fracture pressure is calculated from leak-off tests (LOT). From the literature review, the most popularly applied method is the Ben Eaton's fracture gradient pre-diction approach (Eaton 1975), as shown in equation (7). Yoshida et al. (1996) announced that Eaton's pore and fracture pressure gradient equations are applicable world-wide. This examination showed Eaton's fracture gradient prediction approach is one of the best techniques to use[19].
𝑅𝑅𝐹𝐹𝐷𝐷 =
𝑜𝑜1 − 𝑜𝑜 �
𝜎𝜎𝑒𝑒𝑏𝑏𝐷𝐷 −
𝑅𝑅𝑅𝑅𝐷𝐷 �+
𝑅𝑅𝑅𝑅𝐷𝐷 (7)
the accurate prediction of overburden pressure gradi-ent, pore pressure gradient and Poisson's ratio (Supple-mentary File-Poisson's Ratio calculation) of the studied area was essential to successfully apply Eaton's equation to calculate the fracture pressure gradient.
4. Results and DiscussionAccording to the combined dc-exponent results of the 12 investigated wells in the NC98 field, as shown in Fig. 2, we probably can say that the overpressure zone occurs. Where it starts with slightly decreasing in the dc-expo-nent data from 2,202 m to 3,048 m (7,223 ft - 10,000 ft), remarkably decreasing from 3,048 m to 3,658 m (10,000 ft to 12,000 ft), no deviation in the trend between 3,658 m and 4,572 m (12,000 ft and ~ 15,000 ft), and the data of dc-exponent is getting increased to the normal trend from 4,572 m to 4,952 m (15,000 ft - 16,250 ft). After that, the trend line reaches the equilibrium at the total depth (TD) 5,221.2 m (17,130 ft).

14
Journal of Management Science & Engineering Research | Volume 01 | Issue 01 | 2018
Distributed under creative commons license 4.0 DOI: https://doi.org/10.30564/jmser.v1i1.346
Figure 2. Modified dc-exponent values for the wells in the study area.
Similarly to dc-exponent, the deviation in the sonic log trend of one of the studied wells starts from 2,164 m (7,100 ft), which is increasing with depth, as can be seen in Fig. 3, opposite to the dc-exponent trend manner, which approves the presence of the overpressure zone. In details, the slight increasing begins from 2,164 m to 3,828 m (7,100 ft to 12,558 ft), notably increasing from 3,828 m to 4,797 m (12,558 ft - 15,738 ft), and the trend line is decreasing from 4,797 m to 4,907 m (15,738 - 16,100 ft). After that, the trend line is almost not changeable up to the Total Depth (TD). Up to now, drilling and logging data are matching and mostly approving the existence of the abnormal pressure (overpressure) zone.
Figure 3. sonic log records values for the wells in the study area.
the predicted pore pressure, fracture pressure, and overburden pressure gradients values from drilling raw data and well-logging records are presented in Fig. 4 and Fig. 5, respectively. Regarding the results, the overpres-sure zone can be clearly depicted from both drilling and
logging source of data. The drilling data, as shown in Fig. 4, reveals that the normal pore pressure in the NC98 field at Sirte basin is 9.89 kPa/m, and it is extending from the top of the well to 2,134 m (7,000 ft). After that, subnormal to normal pore pressure zone was noticed in the interval of 2,134 m to 2,743 m (7,000 ft. - 9,000 ft). Then, the mar-ginally subnormal to relatively abnormal (overpressure) zone was seen from 2,743 m to 3,414 m (9,000 ft. - 11,200 ft). At the cap rock, the overpressure zone was apparently detected. For the well-logging source of data, as repre-sented in Fig. 5 for one of the studied wells in the area of study, almost similar results to the drilling data were ob-served from the top to 2,919 m (9,578 ft). Slightly subnor-mal to marginal overpressure zone was noticed from 2,919 m to 3592 m (9,578 ft - 11,786 ft). However, beyond that depth to 3,749 m (12,300 ft), it became impossible to differentiate between pore pressure and fracture pressure gradients, which will make it difficult to determine the casing seating depth and equivalent mud weight (EMW) for this region based on well-logging data. Once before, the formation pore pressure of Nc202, sirte basin was estimated by applying both Eaton's and Bowers Methods. It was found that the bowers method was more accurate than the Eaton's method. Because Eaton's technique used in that study depended on the well-logging data, which is affected by the shale content and the shale content cannot typically be determined for the carbonate rock. The shale content does not influence the bowers method, as it de-pends on the pre-drill data[25]. these outcomes agree with our results, as Eaton's drilling data formula concluded with better results than Eaton's well-logging method.
In general, the salt tectonics can change the formation compaction state, generating normal compaction pattern variations[7]. the abnormal compaction results with dis-equilibrium compaction, which concludes with the chang-ing trend of the overburden pressure (probably decreas-ing) with the depth, more pore spaces, and overpressure[1]. Geologically, the subnormal to regular pore pressure inter-val in this area of study is mainly composed of Limestone, Chalky Limestone, Sandy Limestone, Dolomite, and evaporates. These formations are known with their total and effective porosity, which might be one of the reasons of having low to normal pore pressure area. However, the overpressure zone that is present in upper sirte formation all the way down to lower salt formation T. beds (the cap rock) consists of shale and salt mass formations. These formations have high-disconnected porosity ratio that causes a noticeable increase in the pore pressure gradient. Proper prediction of pore and fracture gradient pressures is significant toward precise casing design[26]. Overall, the results of the dc-exponent, sonic log, formation logging,

15
Journal of Management Science & Engineering Research | Volume 01 | Issue 01 | 2018
Distributed under creative commons license 4.0 DOI: https://doi.org/10.30564/jmser.v1i1.346
and drilling pore and fracture pressures are matched, which confirms that we have a high-pressure zone in the abovementioned interval depth.
Figure 4. Predicted formation pressure gradients from drilling data
Figure 5. Predicted formation pressure gradients from well logging data
5. Casing Setting Depthbesides formation pressure gradients, the seating depths and the number of casing strings also depend on geolog-ical conditions and the stability of freshwater aquifers. In deep wells, the principal concern is given to the control of abnormal pressure and of salt formations, which will tend to flow plastically[26]. the objective of placing the casing in the borehole is to inhibit the collapse while drilling. It is also employed to prevent the contact between the drilling fluids and formation fluid; reduce damage to the subsurface environment from the drilling operation and extreme subsurface conditions. besides, it provides a great
strength and safe flow of the fluids through the well. In the determination of casing places, monitoring the maximum pore pressure and minimum fracture pressure gradients of the formation related to the depth of the studied area are needed, as shown in Fig. 6.
Figure 6. Estimating the minimum and maximum predict-ed formation pressure gradients from the drilling dataIt is reasonable to employ the smallest fracture pressure
trend line for casing depth design. After determining the minimum and maximum formation pressure gradients, the casing seating depth, the number of strings, and the EMW were easy to predict, as can be depicted from Fig. 7. Five casing strings are needed to prepare a casing design for this area. Besides, five mud weights are required to drill the wells appropriately in the studied field.
Figure 7. Estimating casing seating depths

16
Journal of Management Science & Engineering Research | Volume 01 | Issue 01 | 2018
Distributed under creative commons license 4.0 DOI: https://doi.org/10.30564/jmser.v1i1.346
6. validation of Predicted and Real Field DataIn this section, the predicted and real Equivalent Mud Weight (EMW) and casing seating depths employing Ea-ton's Drilling results were compared, as can be seen in ta-ble 1. Waha Company used about 1,379 kPa to 2,758 kPa (200 psi - 400 psi) as sustained pressure to ensure overbal-ance-drilling process. The gathered predicted results of 12 well were compared with the actual results of the deepest studied well in this research. both the predicted and actual data show that five casing strings and drilling fluids are needed to drill a well in this area. It is evident that the pre-dicted and real results are comparable, which confirms the accuracy of applying Eaton's drilling method to predict the formation pore and fracture pressure gradients, drilling fluid weight and casing seating depths.
7. Conclusionthe range of the formation pore pressure value is from less than hydrostatic pressure (normal pore pressure) to critically abnormal pressure (up to 90 % of the overbur-den pressure). The overall results provided that the drill-ing data are more reliable to be employed for predicting formation pressure gradients than the well-logging data. the predicted formation pressure gradients graph clearly shows the casing seating depths as well as the maximum and the minimum mud weight gradients that can be em-ployed. So, the figure of the gathered data can be used as a reference for future drilling processes in the NC98 field-Sirte basin. Finally, all of the goals of this study were clearly addressed.
Acknowledgement: The authors would like to acknowl-edge the help of the Reservoir and Exploration depart-ments at Waha Oil Company, Tripoli, Libya for providing us with the required data to accomplish our goal.
NomenclatureCr = rock matrix compressibility, Cb = bulk compressibility of rock.D = depth (m)dbit = bit diameter, (cm),dc,normal = normalized dc-exponent value.
dc,observed = actual dc-exponent value.Ppnormal = normal formation pore pressure (kPa).PF = formation fracture pressure (kPa).ROP = Penetration Rate (m/h),RPM = Round per minute,WOB = Weight on the bit (lb),σob = overburden stress, kPa ρnormal = Normal Hydrostatic Gradient (g/cm3),ρactual = Current mud Weight (g/cm3).Δtnormal = normalized sonic transit time. Δt = the actual obtained sonic transit time using sonic
log tool.σν= effective vertical stress, kPa∝ = Biot's constant, (0< ∝ <1) = (1- Cr/Cb)
v = Poisson's ratio = 𝜈𝜈 = 0.5 × �∆𝑒𝑒𝑜𝑜∆𝑒𝑒𝑑𝑑�
2− 1
�∆𝑒𝑒𝑜𝑜∆𝑒𝑒𝑑𝑑�2− 1
References
[ 1 ] Swarbrick, R.E., Osborne, M.J., Yardley, G.S.. Compar-ison of overpressure magnitude resulting from the main generating mechanisms. In: Huffman, A.R., Bowers, G.L. (Eds.), Pressure regimes in sedimentary basins and their prediction: AAPG Memoir. 2002, 76, 1–12.
[ 2 ] Bourgoyne (Jr), A.T., Millheim K.K., Chenevert M.E., Young (Jr), F.S. Applied drilling engineering. Richardson, Texas: revised 2nd printing. 1991, 246-250. (In United States of America)
[ 3 ] Jwngsar, B., Sircar, A, Karmakar, G. P. Pre-drill pore pressure prediction using seismic velocities data on flank and synclinal part of Atharamura anticline in the Eastern Tripura, India. J. Pet. Expl. Prod. Technol. https://doi.org/10.1007/s13202-013-0055-0.
[ 4 ] Helset, H. M., Lthje, M., Ojala, I., Lothe, A., Jordan, M., Berg, K., Nilssen, I. R. Improved pore pressure prediction from seismic data. In: Geopressure (EAGE), 2010, Pre-sented at 72nd EAGE Conference and Exhibition incorpo-rating SPE EUROPEC 10 June 2010, Barcelona, Spain.
[ 5 ] Akinbinu, V.A. Prediction of fracture gradient from for-mation pressures and depth using correlation and stepwise
Table 1. Predicted and actual mud weight and casing seating depths from drilling data
casing # Predicted Casing Depth
Predicted drilling fluid density
Actual drilling fluid density
Actual bit size used
Actual casing seating depth
m g/cm3 g/cm3 in (cm) m
1 500 1.01 1.03 26 (66.04) 315
2 3703 1.37 1.04 17.5 (44.45) 2400
3 3917 1.82 2.15 12.25 (31.115) 3993
4 4644 1.88 1.88 8.5 (21.59) 4484
5 5224 1.71 1.62 5.9375 (15.08) 5224

17
Journal of Management Science & Engineering Research | Volume 01 | Issue 01 | 2018
Distributed under creative commons license 4.0 DOI: https://doi.org/10.30564/jmser.v1i1.346
multiple regression techniques. J. Pet. Sci. Eng. 2010, 72, 10-17. https://doi.org/10.1016/j.petrol.2010.02.003
[ 6 ] Dodson, J.K. Gulf of Mexico ‘trouble time' creates major drilling expenses. Offshore. 2004, 64 (1).
[ 7 ] Zhang, J. Pore pressure prediction from well logs: meth-ods, modifications, and new approaches. Earth-Science reviews, 2011, 108, 50–63. https://doi.org/10.1016/j.ear-scirev.2011.06.001
[ 8 ] Green, S., Swarbrick, R., O'Connor, S., Clegg, P., Scott, D. T., Pindar, B. Pore pressure prediction in challenging ar-eas-Reducing uncertainty by understanding rock behavior. In: AAPG Annual Convention, 2010, adapted from poster presentation at AAPG Annual Convention, New Orleans, Louisiana, 2010, 11-14 April.
[ 9 ] Dickinson, G. Geological aspects of abnormal reservoir pressures in Gulf Coast Louisiana. AAPG Bulletin.1953, 37, 410-432.
[10] Bowers, G. L. Determining an appropriate pore-pressure estimation strategy. In: Offshore technology conference, 2001, Offshore Technology Conference 30, April-3 May 2001, Houston, Texas, Paper OTC 13042. https://doi.org/10.4043/13042-MS
[11] Yardley, G.S., Swarbrick, R.E. Lateral transfer: a source of additional overpressure? Marine Pet. Geol.2000,17, 523-537. https://doi.org/10.1016/S0264-8172(00)00007-6
[12] Meng, Z., Zhang, J., Wang, R. In-situ stress, pore pressure and stress-dependent permeability in the Southern Qinshui Basin. Int. J. Rock Mech. Min. Sci. 2011, 48, 122-131. https://doi.org/10.1016/j.ijrmms.2010.10.003
[13] Saheel, A. S., Bin-Samsudin, A-R., Bin-Hamzah, U. regional geological and tectonic structures of the sirt basin from potential field data. Am J sceint Indust res.doi:10.5251/ajsir.2010.1.3.448.462
[14] Kendall, C., Alnaji, N., McCarney-Castle. Sirte Basin. (n.d.). Available at: http://www.sepmstrata.org/page.aspx? pageid=145. Accessed on: 15 February 2014. (In Canada)
[15] Waha Oil Company. The Geology Column of Gialo – NC98. Personal Communication. March 1st, 2007.
[16] Terzaghi, K., Peck R.B. Soil Mechanics In Engineering Practice. New York: J. Wiley, 1948. 87. (In United States of America)
[17] Baker Hughes INTEQ. Formation pressure evalua-tion-Reference Guide Houston: Baker Hughes INTEQ
Training and Development. 1996, 5-9. (In United States of America)
[18] Gardner, G.H.W., Gardner, L.W., Gregory, A.R. Formation velocity and density-A diagnostic basics for stratigraphic traps. Geophysics.1974, 39, 770-780.
[19] Yoshida, C., Ikeda, Eaton, B.A. An investigative study of recent technologies used for prediction, detection, and evaluation of abnormal formation pressure and fracture pressure in north and South America. In: Asia Pacific Drilling Technology, 1996, SPE/IADC Asia Pacific Drill-ing Technology, 9-11 September 1996, Kuala Lumpur, Malaysia. IADC/SPE 36381.
[20] Bowers, G.L. Pore pressure estimation from velocity data: accounting for overpressure mechanisms besides under-compaction. SPE Drill. Completions. 1995,10, 89-95.
[21] Jorden, J. r., shirley, O. J. Application of drilling per-formance data to overpressure detection. J. Pet. Technol. 1966,18, 1387-1394. http://dx.doi.org/10.2118/1407-PA
[22] Bingham, M.G. A new approach to interpreting rock drillability. re-printed from Oil Gas J. 1965, 93.
[23] rehm, b., Mcledon, r. Measurement of formation pres-sure from drilling data. In: Fall Meeting of the Society of Petroleum Engineers, 1971, Fall Meeting of the Society of Petroleum Engineers of AIME, 3-6 October 1971, New Orleans, Louisiana, SPE 3601.
[24] Eaton, B.A. The equation for geopressure prediction from well logs. In: Society of Petroleum Engineers, 1975, Fall Meeting Society of Petroleum Engineers of AIME, 28 September – 1 October 1975, Dallas, Texas, SPE 5544.
[25] Gruenwald, R. M., Buitrago, J., Dessay, J., Huffman, A., Moreno, C., Munoz, J. M. G., Diaz, C., Tawengi, K. S. Pore pressure prediction based on high resolution velocity Inversion in carbonate rocks, Offshore Sirte Basin, Lib-ya. In: AAPG Annual Convention and Exhibition, 2010, Adapted from oral presentation at AAPG Annual Conven-tion and Exhibition, April 11-14, New Orleans, Louisiana. DOI: 10.3997/2214-4609.201401145
[26] Kankanamge, T. Pore pressure and fracture pressure modelling with- OFFSET WELL DATA AND ITS APPLI-CATION TO-SURFACE casing design of a development well, deep Panuke gas pool offshore Nova Scotia. Master of Engineering. Dalhousie University Halifax, Nova Sco-tia, 2013. (In Canada)