reviewing trap rate of current density in the sinusoidal ...textroad.com/pdf/jaebs/j. appl. environ....
TRANSCRIPT

J. Appl. Environ. Biol. Sci., 5(9S)370-377, 2015
© 2015, TextRoad Publication
ISSN: 2090-4274 Journal of Applied Environmental
and Biological Sciences
www.textroad.com
* Corresponding Author: Nader Barahmand, Department of Civil Paper Engineering, Larestan Branch, Islamic Azad University, Larestan, Iran. [email protected]
Reviewing trap rate of current density in the sinusoidal channels with
regard to obstacle and using FLUENT software
Mohamad Jafar Jafari Shabankareh, Nader Barahmand*
Deparartment of civil paper engineering, lrestan branch, islamic azad university, larestan, iran. Received: April 20, 2015
Accepted: June 15, 2015
ABSTRACT
Current density refers to currents that main factor of their movement be attributed to the difference in density
between two or more fluid. Density Flow include large group of currents in nature, the density difference may be
due to difference of temperature, soluble salts and fine Suspended particles. In this study, we tried to evaluate the
behavior and properties of Density Flow in the sinusoidal shape channels with respect to the effect of dam along
to pathway using software of Computational Fluid Dynamics (Fluent). In this research, studies of Hosseini
(2013) that based on model results of Imran et al (2004) used, which validated on the basis of tests conducted by
Li and Yu (1997), has been used. The model is one sinusoidal channel limited of 8.3 m in length, 0.3 in Width
and 1 m in Height that simulated in 20 different states by changing the concentration, bottom slope, Froude
number and barrier height. according to the results of numerical modeling demonstrated that average
concentration of density flow decreased after the obstacle or In other words trap efficiency is also increased, at
the same time, the amount of Sediment Trap increased directly proportional by increasing obstacle height and
deceased inversely by increasing Froude number of density flow, as well as With increasing distance obstacle
from the valve demonstrated that trapping efficiency increased.
KEY WORDS: current density, obstacl, limited sinusoidal channels, FLUENT software.
1. INTRODUCTION
One of the main problems that affects in reducing of useful life obstacl, is deposition and accumulation of
sediments into Reservoirs behind dams that this phenomenon has caused loss of national and capital massive
resources of a country.in Iran, This problem is also More critical due to drought and climatic conditions. input
and output amount of River sediments in an interval of river is approximately Equal and balanced, but problem
begins when Human intervention in nature and construction of artifacts and human components in river
bed(dams and barrages) is causing the collapse of the equilibrium balance, as noted, deposition and accumulation
of sediments into Reservoirs behind obstacles decreases useful volume of the reservoir Over Tim and increases
to dead and unused volume of reservoir and volume as well as sediment influence on water quality causing many
problems in facilities part and valves of obstacle. At the same time, during flood, annealing increases in upstream
of river. One of the most effective approaches to reduce the accumulation of sediments near the obstacl bodies, is
establishing submerged obstacles in the flow path upstream into river bed.It should be noted that the density flow
is current that its main factor of movement is the difference in density between Two or more fluid. There is a
group of dense flow which it carries a fine-grained suspended sediment and is known to muddy flow. Regarding
to gradient and material of bed river, volume and speed of muddy flow may be increased during pathway or may
be stop the movement. By making obstacles along the way, one can control sediment behind the barrier and
consequently with reduction of slope (by accumulation of sediments in the behind barrier to upstream, slope of
flow is More gentle than before dam), flow velocity is decreased and destructive power of dense flow is also
decreased and flow becomes to sedimentary state, and even eventually dense flow may dissolve by
Sedimentation in bed river.
2. Background of Studies and Research
So far, Extensive research has conducted on density flows in laboratory, field, and study of software that
can be mentioned following. The first investigations of density follows containing fine grained material(muddy
flows) conducted by Farrell on Lake Geneva, Switzerland, in the late nineteenth century pentin and parker in the
eighty century, quotes Ghomeshi and omidi (2009) done Researches in relation to power, speed, concentration
and Sedimentation or erosion by dense flow, they together provide relationships that studied changes the flow
velocity and concentration of dense flow In time. Altinakar and colleagues (1990) studied the effect of slope bed
and sediment grain size on forehead height and speed of the muddy flows and they compared the results to salt
water flow in the same conditions. The experimental results showed that the in the same slope, growth rate in the
forehead height in muddy flows moved faster than flow of salt water.
370

Shabankareh and Barahmand, 2015
Garcia (1992) provide a model for the dense flow with fine particle size, by conducting evaluation a series
of experiments to test Several assumptions about development model and the underlying data related to such
flows and sedimentation resulting from their study. Garcia also found that the dense flows with high-speed has
High erosion power. These flows must be provide its acceleration of momentum, while maintained of its
stability.
Imran and kassem (2004) with simulating the density flows in sinusoidal channels, evaluated characteristics
and the behavior of this flow including velocity and density under different hydraulic condition in canal
curvature. Validation based on study results of Li Wei (1997). Hosseini(1392) studied characteristics of dense
flow in limited and unlimited sinusoidal channels, as well as Curved channel 180º using a numerical model.
according to their results, model of RNG was the best turbulence model. Also, they Determined that in height of
the bed, when concentration increases, the density of dense flow increases and its flow velocity decreases and
density, and velocity of dense flow and thickness of flow increased by increasing Froude number at the curved
sites, also appears that Lang (1954,1970) was first researcher on establishing obstacle along flow pathway which
he studied characteristics of muddy flow along flow pathway with establishing obstacle, it should be noted that
Span and Viang(1974) assessment density flow in Collision with Obstacle in different angles.
Woods et al (1998) studied Different flow regimes gray and Volcanic when Collision with Obstacle
obstacles using the theory and experimental approaches. The results show that the barrier will block the upstream
flow As well as reduce the speed of flow, Subsequently sedimentation occurs behind barrier.
Oehy, Ch., and Schleiss (2007) with making a barrier along the path of dense flow, concluded that in the
subcritical condition, 90% of density flow Will stay behind of dense and in supercritical conditions, this amount
reach 20 to 50 percent, so they advised that establishing obstacle will be effective Just in subcritical, also barrier
should be twice the height of the dense flow.
Asghari pari et al (1388) studied effect concentration of dense flow in collision with an obstacle. making in
vitro model, they made Density flow at different concentrations and gradients and without obstacle, measured
input conditions of flow velocity and height Body During flume and flow measurement and appropriation to the
input conditions and according to the results of previous research theories, they determined range the required
height to block of flow. Then, with construction of a barrier along the channel with different height, they studied
behavior of dense flows similar to obstacle. This study attempted to Seek assistance of the conducted research
and studies in this area by doing method, Numerical and Computational (software Gambit and Fluent) to make
upstream dams in the path of the sinusoidal channels in different sites And by changing the height of the barrier,
calculate the maximum efficiency of trapping sediments and the results will provide in the block diagrams and
Tables compiled, as well as to the accuracy of the survey results, total loss research results Hosseini(92) be used.
GOALS HAIR
The overall objectives:
Reviewing trap rate of current density in the sinusoidal channels with regard to obstacl and using FLUENT
software
Equations
- Dense flow equations
continuity equation and nervier-Stokes averaged equations for an incompressible flow as well as diffusion
equation is obtained as follows, respectively.
T is time, μ Fluid Dynamics viscosity, ρ dense fluid density,U1 and U2 Components of the mean velocity vector
– Reynolds of dense flow in Cartesian coordinates and xi, xj and Pi mean pressure -Reynolds in Cartesian
coordinates xi, and g is the reduced gravity acceleration, and Ui U j are Reynolds stresses.
371

J. Appl. Environ. Biol. Sci., 5(9S)370-377, 2015
in this formula, V velocity vector, ρ fluid density, Γ dispersion coefficient, sø spring semester and ø is
Public variable. For determination the flow regime is used from two parameters, densiometeric Froude number
and Richardson Number in following relations. Fr, Froude number of Primary dense flow, u inlet flow velocity,
h the height of dense flow, g ' the reduced gravity acceleration, Re Reynolds number of inlet flow, Ri, is
Richardson number of inlet flow Where ρ and ρa are dense fluid density and density of Environmental water,
respectively.
Reduced gravity acceleration (g ') and initial Richardson Number are as follows:
For determination of trap efficiency (Te) and sediment amounts behind obstacle, also is used following
formula, where c1 and c2 are flow concentration Before and After obstacle, Respectively.
3. MATERIALS AND METHOD
There is no specific laboratory model of sinusoidal channels, so as mentioned previously in this study
Research of Mr. Hosseini (2013) that used results based on model of Imran et al (2004), so it is the basis for the
validation Based on tests conducted by Li and Yu (1997). In vitro, the kaolin is used as suspended solid (thick
material) with 2/56 its density and 0/0068 mm particle size and the rate of flow and concentration of sediment
are and respectively.
4. REVIEWING TRAP RATE OF CURRENT DENSITY
The water density and dense flow density and velocity are and , respectively. Also Froude number of
flow is 1/22 and bottom slope is 0/00139. Flow in a limited sinusoidal shape channel with curved radius of 0/684
m is placed at an angle of 40 °. At the junction with the canal curvature, channel length at upstream and
downstream of flow, is 1/5 m. The total length of the channel 8/3 m, its width in all situations 30 cm, and the
depth of the channel is 1m. obstacle has 3 heights, 5/4,13/5 and 25 cm which, respectively Equivalent to one, one
and a half, two and a half, Almost is five times longer than inlet density flow and is placed 2/825 m distance
from valve . It should be noted that this model is simulated with 4 different Longitudinal slopes 0/002, 0/005,
0/008and 0/02 and also is used from 3 different concentrations of 0/00,667, and 0/01 and 3 different Froude
number 3/2, 3 and 5.
Also according to the numerical results Hosseini(1392),the best model for sinusoidal channel has been
turbulence model k-ɛ from RNG type of the meshed model with a number of divisions 45 *15* 105 which from
left indicating directions of x, y and z,respectively. For this reason, The use of other variety of turbulence and
meshed models is avoided. Meanwhile, the triangular barrier is same both the shape and width as the channel.
For modeling, theses number 1,3,15 and 20 (Hosseini 1392) is used, Table 1 is numbered sequentially from 1 to
20. in Figure 1 is given an example of modeling, in Figure 2 is displayed the mesh style and boundary conditions
in the software Gambit, Figures 3 and 4 is depicted contour lines of the density flow 15 seconds and 235 seconds
after the entrance in Fluent software.
372

Shabankareh and Barahmand, 2015
Figure 1. Plan and cross-section of model.
Figure 2. The mesh style and imposing boundary conditions
Table 1 - Initial conditions for the numerical simulation
In Table 1, C0 initial concentration, Fr0 Froude number for Initial dense flow, U0 velocity of Input flow, h0
flow, height valves of Input dense flow, g0' reduced gravity acceleration and Re0 is Reynolds number of flow.
373

J. Appl. Environ. Biol. Sci., 5(9S)370-377, 2015
3- contour lines of dense flow 15 seconds after movement from the inlet valve in the FLUENT program
Figure 4. The density contour lines at 235 seconds after entering the dense flow
PARAMETERS OF AVERAGE DEPTH OF THE DENSE FLOW (VELOCITY, HEIGHT AND CONCENTRATION):
in this part of study, the calculated variables of average depth of the dense flow through the 20 cases
presented in Table has been tested. parameters of average depth of the dense flow (h), average speed (u), average
concentration(C) are Computable Using profiles of vertical velocity and concentration. The following,
relationships of average depth is presented (Parker et al. 1986). It should be noted that in all cases, velosity
contour profile, concentration, etc. at position 17/5 cm before and after obstacle (Beginning and end obstacle)
will be examined.
In these relations, cz and uz are values of Local concentration and Longitudinal velocity in vertical distance
from the base level respectively.ht is vertical distance from the baseline to To the place where local velocity is
zero again,i= 1 is the first point that it consider close to zero. r also is number of data measured on the vertical
profiles. Meanwhile, r wil be Calculated to hr.
In Tables 2 and 3, with respect to 20 different states, software models have been separated in terms of
different conditions, and in program, values of average depth of the dense flow have been calculated and
compared with base model. Measured index in this section, is Comparison Richardson number in Hosseini model
(92) with other models.
Table 2. parameters of average depth of the dense flow before obstacle considering the 20 cases
before obstacle
Average speed deep of dense flow
Average height deep of dense flow
Average concentration deep of dense flow
initial Richardson Number
Richardson Number of Fluent Average depth
Richardson Percent error
374

Shabankareh and Barahmand, 2015
Table 3. parameters of average depth of the dense flow after obstacle considering the 20 cases
Maximum value
Minimum value
ASSESMENT OF NUMERICAL MODEL IN TERMS OF DEPOSITION BEHIND BARRIER: In this part of the study, sedimentation rate is determined on effect Obstacle using of calculated variables for
Average speed deep of dense flow of the 20 states that have been tested and using of laboratory results, Trap
375
J. Appl. Environ. Biol. Sci., 5(9S)370-377, 2015
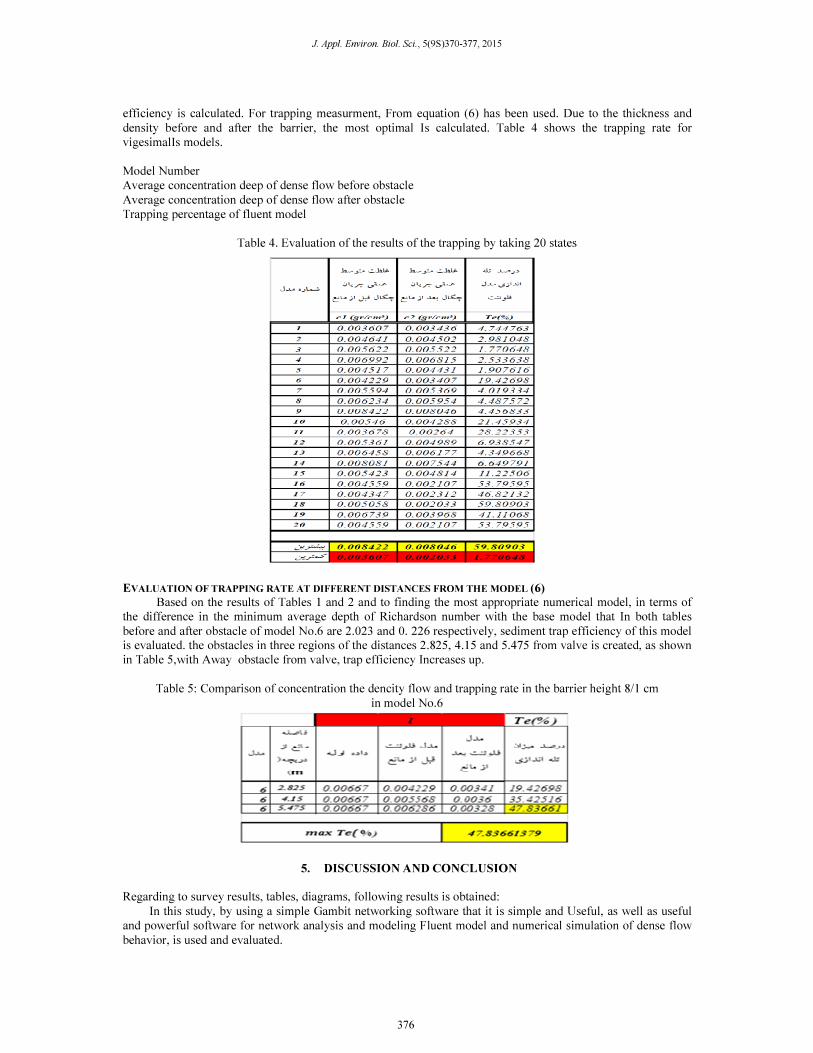
efficiency is calculated. For trapping measurment, From equation (6) has been used. Due to the thickness and
density before and after the barrier, the most optimal Is calculated. Table 4 shows the trapping rate for
vigesimalIs models.
Model Number
Average concentration deep of dense flow before obstacle
Average concentration deep of dense flow after obstacle
Trapping percentage of fluent model
Table 4. Evaluation of the results of the trapping by taking 20 states
EVALUATION OF TRAPPING RATE AT DIFFERENT DISTANCES FROM THE MODEL (6)
Based on the results of Tables 1 and 2 and to finding the most appropriate numerical model, in terms of
the difference in the minimum average depth of Richardson number with the base model that In both tables
before and after obstacle of model No.6 are 2.023 and 0. 226 respectively, sediment trap efficiency of this model
is evaluated. the obstacles in three regions of the distances 2.825, 4.15 and 5.475 from valve is created, as shown
in Table 5,with Away obstacle from valve, trap efficiency Increases up.
Table 5: Comparison of concentration the dencity flow and trapping rate in the barrier height 8/1 cm
in model No.6
5. DISCUSSION AND CONCLUSION
Regarding to survey results, tables, diagrams, following results is obtained:
In this study, by using a simple Gambit networking software that it is simple and Useful, as well as useful
and powerful software for network analysis and modeling Fluent model and numerical simulation of dense flow
behavior, is used and evaluated.
376

Shabankareh and Barahmand, 2015
2. With regard to the evidence of the numerical model from Mr. Hosseini (92) in terms of networking and
type of tolerance, he used network optimization with dimensions
45 *15* 105 which from left indicating directions of x, y and z, respectively, and optimal model of
turbulence is model k-ɛ from RNG type. We refused from choosing of mesh and turbulence types that increases
computing time.
3. Dense flow behavior after obstacle is almost similar to dense flow behavior without obstacle except that
the concentration and speed power of Material is reduced.
4- In height near bottom, whatever the concentration increases, velocity of dense flow decreases and dense
flow density increases.
5- according to Tables 2 and 3 Concerned with average depth parameters in terms of minimum difference
between Richardson number and Richardson number of base model (Hosseini 2013) In either case before and
after obstacle of model no. 6, minimum difference and most ideal state be conceded. Barrier model, the primary
difference is Tryn
Accordingly, by changing place of obstacle in 3 distance in the model no.6, highest level trapping is Within
5.475 meters from the valve (Farthest distance) and is 47.83 % (Table 5). The reason is also more volume of
sediment accumulated with respect to its distance to valve.
6- According to Table 4 and Comparison of 20Model, the most trapping rate in all twenty models, Model
No.18 with a maximum value of trapping 59.8 is best and Model No.3 with 1.77 percent is Worst Model.
however, in review and analysis results of all the models, the slope values, the concentration, Froude number and
the barrier height have been Constantly impressive, but one can note to Constantly effectiveness of the barrier
height and more gentle slope at higher trapping rate in model no. 18 than other models And also Reducing the
barrier height in Froude decreased number trapping in Model 3.
REFERENCES
1. Asgar pary & Colleagues. 2009. Effect of the concentration of the concentrated flow control to prevent the
tanks Sdha.hshtmyn International Seminar on River Engineering February 1388, Ahvaz, martyr Chamran
University.
2. Hosseini. Mohammad. 2013 shbyh numerical density of the sinusoidal channel by considering various
turbulence models using FLUENT software. Master of hydraulic structures LARESTAN Branch.
3. Ghomeishi. omedi. M. A. 2009 Ahvaz Islamic Azad University, Science and Research .brrsy thick stream
of Karun 3 T thirtieth using SPSS software. Water and Power Authority Budget and the Office of Research
and Standards Development dam and power station dam and powerhouse. July 2009
4. 4- Altinakar M.S., Graf W.H., Hopfinger E.J.: Weakly depositing turbidity current on a small slope,Journal
of Hydraulic Research, Vol. 28, No. 1, 1990
5. García,M.; “Hydraulic jumps in sediment-driven bottom currents” J. Hydraul. Res.,Vol.119(10), pp.1094–
1117,1993
6. Imran, J and and Kassem, A., (2004). “Three-dimensional modeling of density current. II. Flow in sinuous
confined unconfined channels.” J. Hydraul. Res., 42(6), 591–602.
7. Lee H.Y., Yu W.S. 1997. Experimental Study of
8. Reservoir Turbidity Current, J. Hydr. Eng, ASCE, 123 (6):520-
9. Oehy, Ch., and Schleiss, A. (2007)."Control of turbidity currents in reservoirs by solid and permeable
obstacles". J. Hydraul. Eng., 133_6_637–648
10. Self-accelerating turbidity currents."Journal of [3] Parker, G; Fukushima, Y. and Pantin, H.M. Fluid
Mechanics; 171, 1986, 145-181; 528.
11. Woods A. W. , Bursik M. I., Dyke.” J. Fluid Mech., 87_1_, 179–192 ]). Kurbatov A. V. (1998). "The
interaction of ash flows with ridges". Bull
12. Volcanol (1998) 60 : 38–51
377