revised 7.6 - university of hawaii · revised 7.6.2012 pacific places the ... power, such as the...
TRANSCRIPT

Revised 7.6.2012
PACIFIC PLACES The Pacific Places curriculum unit addresses three Hawai‘i Department of Education (DOE) benchmarks for the seventh-grade Pacific Islands Studies course: the World in Spatial Terms (PI.7.1) benchmark and two Human and Physical Characteristics in Spatial Terms benchmarks (PI.7.2 and PI.7.3). The unit is designed as a self-contained package that can be used by teachers who are new to the Pacific Islands as well as by those who are familiar with the Pacific. The unit, which contains four lessons and takes twelve classroom periods, includes procedures/activities, resources/tools, and assessment instruments. The website for this curriculum unit is: http://www.hawaii.edu/cpis/resources_7.html Pacific Places draws on the skills and experience of curriculum development specialists (Donna Mills and Pauahi Baldomero-Kazunaga), classroom teachers (Nino Murray and Peter Wagner), and Pacific specialists (Julie Walsh and Tisha Hickson). Donna Mills was the coordinator for the project, which was made possible by a US Department of Education Title VI National Resource Center grant to the Center for Pacific Islands Studies (CPIS) at the University of Hawai‘i at Mānoa (www.hawaii.edu/cpis). Teachers Renee Adams (Kalama Intermediate, Maui), Tracy Palmgren (Ilima Intermediate, O‘ahu), and Sean Johnston (Washington Middle, O‘ahu), in addition to Murray and Wagner (Waiakea Intermediate, Hawai‘i) pilot tested the lessons. THE “BIG IDEAS” ADDRESSED BY THE BENCHMARKS The World in Spatial Terms benchmark (PI.7.1) and the Human and Physical Characteristics in Spatial Terms benchmarks (PI.7.2 and PI.7.3) specify that students will come to understand that
a) geographic representations (such as maps, graphs, diagrams, photographs, and satellite-produced images) can supply information about the physical and human characteristics of a place
b) the geographic makeup of coral, continental, and volcanic islands directly affects the Pacific region’s resource base, which in turn affects the region’s potential for economic development
This unit includes Pacific Island Economies, a resource developed by James Mak, emeritus professor of economics at University of Hawai‘i at Mānoa, is essential reading for teachers. Designed as a classroom reading for students, it is useful in understanding how the physical characteristics of Pacific Island entities affect their economic resources and their potential for economic development. This resource can be downloaded from the CPIS website at www.hawaii.edu/cpis/resources_1.html. NATIONAL GEOGRAPHY STANDARD 4 The Pacific Places unit explores National Geography Standard 4: The Physical and Human Characteristics of Place (see http://www.learner.org/series/powerofplace/standards.html#standard4). According to this standard, the physical characteristics of a place include climate, landforms, soils, hydrology, vegetation, and animal life, while the human characteristics of a place include language, religion, political systems, economic systems, population distribution, and quality of life. The ways in which physical and human processes interact over time are very complex. Because the three Hawai‘i DOE

Revised 7.6.2012
benchmarks highlight the economics and demographics of Pacific places and their interaction with other characteristics of places, the terminology of this unit differs slightly than that of the National Geography Standard 4. The Pacific Places unit uses the term “human characteristics” to refer to selected elements of the built environment, such as bridges, man-made waterways, roads, cities and towns, and buildings, and contrasts these with the human characteristics of a place that pertain to economic activities and demographics. DESCRIPTION OF LESSONS
• Lesson one is designed to hook students’ interest. It introduces them to the physical characteristics of islands in the Pacific region, also known as Oceania. It also introduces them to the ways that the physical characteristics of an island might influence its inhabitants’ daily activities and the ways they go about obtaining, and going beyond, the basic necessities of life.
• Lesson two is the centerpiece of the unit. It uses a matrix to guide students in gathering information about the physical and human characteristics of a particular place, or location. Students work in groups to research an assigned Pacific Island entity, with particular attention to how economic activities are related to its physical and human characteristics, including demographics.
• Lesson three asks the students to create a product or performance that compares a high-island entity and a low-island entity, with particular emphasis on the relationship between the physical and human characteristics of a location, including its demographics and economic activities.
• Lesson four is an optional extension activity. CHOICE OF ISLAND ENTITIES The six island entities for the study unit—Papua New Guinea, Fiji, the Republic of the Marshall Islands (RMI), Chuuk State (one of the four states that make up the Federated States of Micronesia), Guam, and Tuvalu—were chosen with the following characteristics in mind:
• Low islands vs high islands. The Pacific Islands region is very diverse, both geographically and culturally. One way of understanding this diversity is by contrasting low islands (coral islands and atolls) with high islands (continental and volcanic islands). Low and high islands offer contrasts in terms of land area, population, climate, and economic resources. Our study matrix includes two Island entities that are primarily coral atolls and can be characterized as low islands—RMI and Tuvalu—and four entities that feature high islands, sometimes in combination with coral atolls
• Connections to the United States. Our set of six Island entities is heavily oriented toward
entities that have political connections with the United States. Our choice of Guam, RMI, and Chuuk State reflects, in part, the Hawai‘i DOE Pacific Islands Studies benchmarks’ focus on the cultural and political relations the United States has with selected islands. It also reflects the presence in Hawai‘i of a number of migrants from the Republic of the Marshall Islands and Chuuk State. These two entities are linked to the United States through compacts of free association, which specify that the citizens of these entities may work and live in the United States without having to obtain a visa. Including these two entities gives the growing number of Marshallese and Chuukese students in Hawai‘i an opportunity to see themselves

Revised 7.6.2012
in the curriculum, and it gives other students the opportunity to see their Marshallese and Chuukese peers as part of the broad Pacific Islands region.
• Culture areas. Although there is some debate in academic circles about whether the
partitioning of the Pacific Islands into three culture areas—Melanesia, Micronesia, and Polynesia—is useful or meaningful, it is still a common way of describing the entire Pacific Islands region. Our selection includes two Melanesian entities (Papua New Guinea, Fiji), three Micronesian entities (RMI, Chuuk State, Guam), and one Polynesian entity (Tuvalu).
• Size. Although Papua New Guinea is much larger than any other Island entity, and therefore
is atypical in many respects, it is included as a further illustration of the diversity of the region.
RESOURCES Each lesson is accompanied by resources that are needed for the lesson. In addition, there is a separate Resources web page (http://www.hawaii.edu/cpis/resources_7a.html) for lesson two that contains
• a list of resources on the Pacific Islands region as a whole • a page for each of the six Island entities containing images and a list of resources
Although the list of resources for the region as a whole has been prepared with teachers in mind, the students may be given this general list, as well as hard copies of the resources for their particular Island entity. Each resource list contains links to online maps. These may be printed and given to each group, or students can access them from the lists and print the maps themselves. In designing the unit, it was assumed that most, if not all, Hawai‘i DOE seventh-grade teachers have a classroom set of Reilly Ridgell’s Pacific Nations and Territories, third or fourth edition. Students using the third edition may have to rely on the online resources more than students using the fourth edition, which is more comprehensive. DATA GATHERING A few notes regarding data gathering and comparison:
• Because the entities selected represent different levels of political sovereignty, comparing and contrasting them is not as straightforward as it might seem. For example, it may not be easy for the students researching Chuuk, one of the four states that compose the Federated States of Micronesia, to find data just for Chuuk, as distinct from the Federated States of Micronesia.
• All of the Island entities that were selected (with the exception of Guam) consist of more
than one island or atoll. Because the data are more readily available for the main island/atoll in each entity, we have focused on these main islands, which are in parentheses, following the name of the entity in the data-gathering matrix. However, economic and other activities on the main or capital island/atoll are not necessarily reflected in life on the outlying islands, just as O‘ahu offers a number of contrasts with its neighbor islands in Hawai‘i.

Revised 7.6.2012
• While the physical characteristics of an entity affect its economic base, there are other
factors that influence an entity’s economy and demographics, such as its political status. For example, the political status of free association, which links an entity to a metropolitan power, such as the United States or New Zealand, may convey certain economic advantages and/or migration opportunities for an entity’s citizens. In our sample, Papua New Guinea, Fiji, and Tuvalu are independent nations; Guam is a territory of the United States; RMI is a self-governing nation in free association with the United States; and Chuuk is a one of the states that form the Federated States of Micronesia, another self-governing nation in free association with the United States. (For a concise representation of the different kinds of political association in the region, see the Political Statuses of Pacific Islands chart at www.hawaii.edu/cpis/PoliticalStatuses11.pdf.)
Because the wording of the three benchmarks does not refer to political association, the unit, as written, does not address the third “big idea” that is linked with the target benchmarks: migration from rural to urban areas resulted in large Polynesian communities in metropolitan areas. Political status is a very important aspect of Pacific Island entities, however, and teachers (and students) may want to add it as a category on the data-gathering matrix.

June 2012
Title of Unit: Pacific Places Course: Pacific Island Studies Duration: 12 class periods (@50 minutes ea.) Grade: 7 Hawaii Content and Performance Standards III Benchmarks (http://165.248.30.40/hcpsv3/index.jsp): 7PI.7.1 World in Spatial Terms Use geographic representations such as maps or models to explain population distribution and the physical and human characteristics of places in Oceania, including landforms, natural resources, climate, rivers, lakes, bridges, dams, roads, and buildings. 7PI.7.2 Human and Physical Characteristics in Spatial Terms Describe demographic patterns and how they affect places. 7PI.7.3 Human and Physical Characteristics in Spatial Terms Analyze important economic activities and explain the relationship between these activities and the physical (including natural resources, land forms, and waterways) and human (including bridges, canals and roads) characteristics of places in Oceania.
Content Addressed:
• population settlement/distribution • demographics (eg, population
increases, decreases, growth and decline, birth and death rates, race, ethnicity, patterns of movement over time)
• economic activity (eg, providing for basic needs, making a living, trading, land and sea resources)
• geographic theme of place: physical characteristics of places (eg, waterways, landforms, natural resources, climate, rivers, lakes) and human characteristics of places (eg, bridges, dams, roads, canals, buildings)
Skills Addressed:
• using maps and other geographic representations
• describing, explaining, and analyzing • making cause-and-effect connections
Lesson Title and Duration Notes/comments 1 Where Would You Live? (one class
period)
This introductory lesson includes • whole-class map reading and discussion
activity • small-group activity addressing the best
place to live and why • individual activity that provides each
student a chance to design an island community based on his/her own needs/interests
The intent is to have students begin to understand the difference between the physical and human characteristics of a place.

June 2012
2 Our Pacific Islands (eight class periods) A. Introduction (one class period) B. Hawai`i: Our State (one class period) C. Group Research (three class periods) D. Group Presentation (two class periods) E. Group Debriefing (one class period)
Four corners activity in which students begin to classify topics into four categories: physical characteristics, human characteristics, demographics, and economics. Teacher models and includes whole class in using maps, charts, and other resources to glean information and place it on a matrix. Categories on the matrix are clarified and skills such as using a map key are practiced. Class discussion should include the relationship between economic activity and other characteristics of places. Assign students to one of six Island entities. Have students give same information as modeled in 2A and apply what they learned in 2A. They complete matrix after research and prepare for presentations. Groups share their findings with the entire class. Groups submit their matrix to teacher for duplication and distribution to other students who should formulate some questions. (Teachers may want to prepare their own matrix to compare to student submissions.) Presentations should include relationship between economic activity and other characteristics of places. Debrief in small groups using questions provided in Additional Questions to Consider.
3 Comparing Places - Conclusions and Generalizations (two class periods) A. Review (one class period) B. Assessment Task (one class period)
Whole class with teacher: compare and contrast gathered information to identify patterns and offer generalizations. Examine characteristics in detail. Complete final assessment task.

June 2012
4 Projecting the Future (Optional) This is an extension home-play lesson that takes the student beyond the benchmarks. It may be used for students who are ahead of others and/or be given as extra credit.
Students address the following questions: • In ten years where would I like to be and
what do I need to do to get there? • What skills do I project I will need. • What will this place be like in ten years? • Would I like to live here? Why or why
not? • What can I do now to make sure this is a
place I will want to live? • In addition to the things we looked at,
what other things influence my decision to live in a particular place?

Pacific Island Economies
James Mak Emeritus Professor of Economics
University of Hawai‘i at Mānoa
Illustrations by Julianne Walsh
January 2001 (rev July 2012) Center for Pacific Islands Studies
School of Pacific and Asian Studies University of Hawai‘i at Mānoa

2
Dr James Mak is an emeritus professor of economics at the University of Hawai‘i at Mānoa. Dr Julianne Walsh is an anthropologist with longtime experience in the Marshall Islands.
The Center for Pacific Islands Studies is a National Resource Center for the Pacific, partially supported by funds from the US Department of Education Title VI Program. It is part of the School of Pacific & Asian Studies at the University of Hawai‘i at Mānoa. The center offers a bachelor’s degree and a master’s degree in Pacific Islands studies and has an active publishing program, including two book series, a journal on the contemporary Pacific (The Contemporary Pacific: A Journal of Island Affairs), an Occasional Paper series, and a quarterly newsletter. It also has an active outreach program to the community, including teachers. The center may be contacted at:
Center for Pacific Islands Studies School of Pacific and Asian Studies University of Hawai‘i at Mānoa 1890 East-West Road, Moore 215 Honolulu, Hawai‘i 96822 Fax: (808) 956-7053 Telephone: (808) 956-7700 Email: [email protected] Website: http://www.hawaii.edu/cpis

3
Contents
Chapters: Chapter 1: What is an Economy?
3 Chapter 2: How Big are Pacific Island economies? 5 Chapter 3: Do Pacific Island Peoples Live Poorly? 10 Chapter 4: What are “Economic Resources”? 12 Chapter 5: Marine Resources 15 Chapter 6: Land Resources 16 Chapter 7: Managing Economic Resources 20 Chapter 8: Human Resources 24 Chapter 9: Tourism Resources 26 Chapter 10: Imports and Exports 28 Glossary 32 Appendix: Additional Resources 34
Figures:
Local motion t-shirt sales
4
Population totals 6 Land area in square miles 8 Land area in square kilometers 9 Subsistence photos 10 Urban/rural photos 11 Photo of Cook Islands – low island 14 High and low island photos 16 Uses of the coconut tree 17 Forestry rates 21 Greenhouse effect chart 22 Tourism rates in the Pacific 26 Flow chart of aid and trade 30

4
Chapter 1
What Is An Economy?
An economy is made up of buyers and sellers. In fact, when you buy a Local
Motion t-shirt, or a pizza, or a ticket to the movies, you are a buyer and therefore
you are part of Hawai‘i’s economy.
The Local Motion store that sells you the t-shirt is also part of Hawai‘i’s
economy. The store uses your money to rent the store space, hire employees, pay
for merchandise, utilities, and other expenses.
The store employees spend their wages on groceries, cars, clothes, movies,
and other things they want. They too are part of Hawai‘i’s economy.
Also, when you buy the t-shirt, you pay a sales tax to the state government,
which uses that money to hire your teachers, buy textbooks, maintain parks and
libraries, and provide other public services. Thus, our state government is also part
of Hawai‘i’s economy.
Together, you (and other individual buyers like you), businesses, and our
state and county governments make up Hawai‘i’s economy.
People who do not live in Hawai‘i are also part of Hawai‘i’s economy. For
example, when tourists spend money, they too contribute to Hawai‘i’s economy.
The United States government spends money to hire workers to deliver our mail
and run our Post Offices and to maintain our military bases like Pearl Harbor,
Hickam Air Force Base, and Fort Shafter. The United States government is also
part of Hawai‘i’s economy.
In this learning unit, we study the economies of the Pacific Island Countries
(PICs). While we also study Hawai‘i’s economy for purpose of comparison, the
center of attention will be the Pacific Island economies outside Hawai‘i.

5
When you buy a Local Motion t-shirt . . .
Your taxes help the Hawai‘i State Government provide services.
When you spend your money on a Local Motion t-shirt, the money that you pay in state taxes helps Hawai‘i provide services to the public. Public schools, playgrounds, and libraries are just a few of the services provided by Hawai‘i to its residents.

6
Chapter 2
How Big Are Pacific Island Economies?
If you were asked, “How big is Hawai‘i compared to the other Pacific Island
states?” what information would you use to compare their relative size? Some
people use population as a measure of size.
According the US Census Bureau, about 1.3 million people live in Hawai‘i.
By comparison, according to the Secretariat of the Pacific Community (see
htt p:/ / w w w . s pc. i nt/ s dp/), the country with the largest population in the Pacific,
Papua New Guinea (PNG), has about 5 million people. Niue has fewer than 2,000
people. Except for Papua New Guinea, Hawai‘i, is larger than all the other Pacific
island countries if we use population as a measure of relative size.
Some people use land area as a measure of size. Using this information,
Hawai‘i has nearly 6,400 square miles of land area. By comparison, Papua New
Guinea has more than 179,000 square miles. Nauru has only 8 square miles. The
uninhabited Hawaiian island of Kaho‘olawe is five times the size of Nauru.
When it comes to comparing the size of countries’ economies, people who
study economies use the total amount of goods and services produced (and sold)
in an economy as a measure of its size.
If Hawai‘i’s economy produces more t-shirts, houses, and other things than
Guam’s economy, then Hawai‘i has a bigger economy.

7
Haw
aii
Wallis and Futuna
Tuvalu
Tonga
Tokelau
Sam
oa
Niue
French Polynesia
Cook Islands
American S
amoa
Palau
Northern M
arianas
Nauru
Marshall Islands
K
iribati
Guam
FSM
Vanuatu
New
Caledonia
Fiji
Solom
on Islands
Papua N
ew G
uinea
Pacific Island Nations' Population Estimates for Mid-2000
5000000
4750000
4500000
4250000
4000000
3750000
3500000
3250000
3000000
2750000
2500000
2250000
2000000
1750000
1500000
1250000
1000000
750000
500000
250000
0
Melanesia Micronesia Polynesia
Source: Secretariat of the Pacific Community. (Figures from 10/30/2000)

8
Gross Domestic Product (GDP)
One figure that economists use to compare the size of different economies is
called the gross domestic product, or GDP. Gross domestic product is simply
the money value of the total amount of goods and services produced in an economy
in one year.
Hawai‘i’s gross domestic product was approximately $35 billion dollars in
1998. That represents a lot of goods and services we produced in Hawai‘i in that
year. Hawai‘i’s GDP is much larger than the GDP of all the other Pacific island
economies combined. In other words, Hawai‘i may not have the largest land area or
the largest population, but it has, by far, the largest economy among Pacific island
economies.
If Hawai‘i is left out, Papua New Guinea has the largest economy among
Pacific island countries, with a GDP of nearly $5 billion. Tuvalu has a GDP of less
than $4 million. Overall, Pacific island countries generally produce few goods and
thus have small economies when compared to the world’s other nations.
Gross Domestic Product Per Person
Another important economic figure is the gross domestic product per person or,
GDP per person. It is simply the amount of goods and services produced for
each person in the economy. It is calculated by dividing gross domestic product by
the total population of the country.
In 1998, GDP per person was nearly $29,000 in Hawai‘i. This is calculated
by dividing Hawai‘i’s $35 billion GDP in 1998 by the 1.2 million people living in
Hawai‘i in that year. In other words, Hawai‘i’s economy produced an average of
$29,000 worth of goods and services that year for every man, woman, and child
living in Hawai‘i.
9
Haw
aii
Wallis and Futuna
Tuvalu
Tonga
Tokelau
Sam
oa
Niue
French Polynesia
Cook Islands
American S
amoa
Palau
Northern M
arianas
Nauru
Marshall Islands
Kiribati
Guam
FSM
Vanuatu
New
Caledonia
Fiji
Solom
on Is.
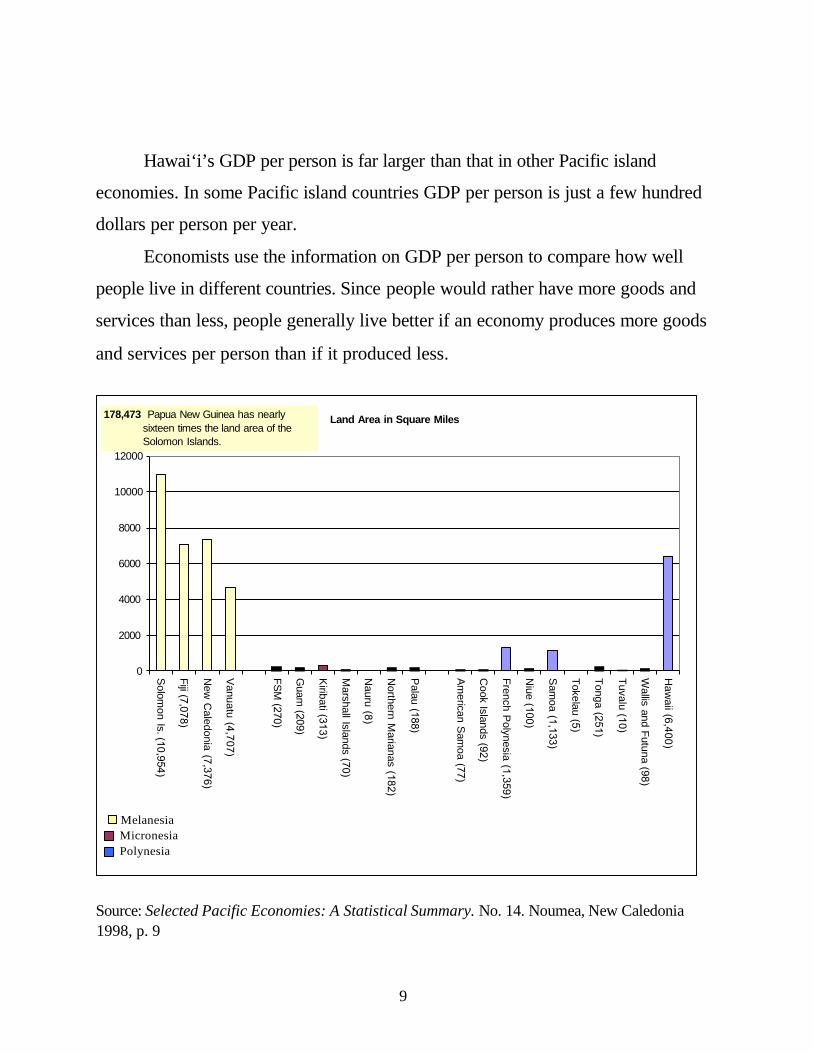
Hawai‘i’s GDP per person is far larger than that in other Pacific island
economies. In some Pacific island countries GDP per person is just a few hundred
dollars per person per year.
Economists use the information on GDP per person to compare how well
people live in different countries. Since people would rather have more goods and
services than less, people generally live better if an economy produces more goods
and services per person than if it produced less.
178,473 Papua New Guinea has nearly sixteen times the land area of the Solomon Islands.
Land Area in Square Miles
12000
10000
8000
6000
4000
2000
0
Melanesia Micronesia Polynesia
Source: Selected Pacific Economies: A Statistical Summary. No. 14. Noumea, New Caledonia 1998, p. 9

10
Haw
aii
Wallis and Futuna
Tuvalu
Tonga
Tokelau
Sam
oa
Niue
French Polynesia
Cook Islands
American S
amoa
Palau
Northern M
arianas
Nauru
Marshall Islands
Kiribati
Guam
FSM
Vanuatu (12,
New
Caledonia
Fiji
Solom
on Islands
462, 243 Papua New Guinea has nearly sixteen times the land area of the Solomon Islands.
Land Area in Square Kilometers
30000
25000
20000
15000
10000
5000
0
Melanesia Micronesia Polynesia
Source: Selected Pacific Economies: A Statistical Summary. No. 14. Noumea, New Caledonia 1998, p. 9

11
Chapter 3
Subsistence in the Pacific
Compared to most Americans, Pacific Island peoples have access to far
fewer goods and services. But they are not poor compared to people who live in
parts of Africa or Asia or even the United States.
Many Americans are truly poor because they have no place to live or enough
to eat. In the Pacific Island Countries there is limited poverty because many people
can still depend on a subsistence lifestyle.
Subsistence is when you produce items that you need for yourself.
In the Pacific, many people subsist by fishing, raising pigs, and growing their
own food like bananas, taro, breadfruit, and coconuts. They can make tools,
utensils, clothing, and homes from available native materials like wood, shell, stone,
bone, banana fibers, coconut palms, and pandanas leaves.
This young girl helps her family prepare Making copra, dried coconut meat, is hard work breadfruit by removing the skin with a that requires many steps. After the coconuts are cowrie-shell scraper. (Wotje Atoll, gathered and then husked, they must be split open Marshall Islands) and left to dry in the sun. (Wotje Atoll, Marshall
Islands)

12
One government official from Niue said that “There's no such thing as
‘unemployment’ in Niue. A Niuean can ‘go bush’ or ‘can go sea’ to survive.” Going
“bush” means farming a small garden. A person with a garden trades the products
with a fisher for fish.
Subsistence is still an important way of livelihood in many Pacific Island
countries even as more and more people, especially those living in urban centers,
are working for private businesses and governments for wages that enable them to
buy the food, clothing, and housing that they need.
In Tuvalu, nearly three out of four people of working age are in subsistence
or fishing activities. In Fiji, two out of five people are engaged in subsistence
activities. The subsistence lifestyle has virtually disappeared in highly developed
Pacific Island economies like Hawai‘i and Guam. Highly developed economies are
defined as economies with high GDP per person.
The Marshall Islands Capitol building reflects life in A fisherman catches small fish from this lagoon in an urban center. the Marshall Islands.

13
Chapter 4 What Are “Economic Resources”?
Hawai‘i is famous for its delicious chocolate-covered macadamia nuts.
Imagine what it takes to make those chocolates. Most important, you need
macadamia nuts. Most of the macadamia nuts that go into the chocolates are grown
in Hawai‘i. To grow these nuts you need land and the right climate for the
macadamia trees. You will not find those trees growing in Alaska or Michigan.
You also need workers to plant, care for, and harvest the nuts. The workers
need machinery to help them harvest and shell the nuts. In addition to the nuts, you
need chocolate, machinery to make the chocolate candies, boxes for the chocolates,
and cellophane to wrap the boxes. Most of those ingredients have to be shipped
into Hawai‘i. Of course, you also need a chocolate factory and workers.
To produce our famous macadamia chocolates, we need to have resources.
Resources are the land, the workers, the machinery, the right growing
environment for the nuts, and supplies; in other words, all the necessary ingredients
to make a box of chocolate-covered macadamia nuts.
Since the most important ingredient is the macadamia nut, which is grown
right here in Hawai‘i, we produce the candies right here. We make high quality
macadamia chocolates at a reasonable cost, even if we have to pay shipping costs
to bring in boxes, cellophane paper, and chocolate.

14
The story would be different if we were to consider the production of
automobiles. Hawai‘i does not have the resources to produce steel, glass, paint,
plastics, and other things used in the manufacture of cars. It would be too
expensive to produce automobiles in Hawai‘i if we had to bring in all the required
resources and then ship the cars out again to customers on the mainland and
elsewhere. That is why we in Hawai‘i buy cars from Michigan, Japan, Germany,
and other places more suited to car manufacturing.
People from Japan, Germany, and Michigan come to Hawai‘i to vacation
because we have better beaches and climate, resources that are important in tropical
vacations.
It is now easy to understand that the kinds of resources an economy has are
important in determining what are most likely to be produced. In Hawai‘i our
resources are best used to produce chocolate-covered macadamia nuts and tropical
vacations.
In Michigan, the resources there enable it best to produce cars; Oregon
produces lumber from its abundant forestry resources (Hawai‘i also gets a lot of
trees each year from Oregon); Idaho is famous for potatoes, Florida for oranges,
Washington for apples, Colorado for skiing, and so forth.
Among the Pacific Island countries, there are big differences in the economic
resources available to produce the goods and services that make up their gross
domestic product.
The countries that are blessed with the most abundant resources are the
larger, high-island countries in the Western Pacific: Papua New Guinea, the
Solomon Islands, Fiji, and New Caledonia. These countries have agricultural and
forestry resources, fisheries, minerals, and tourist attractions. New Caledonia has

15
the world’s third largest nickel deposit. Papua New Guinea has copper and gold
deposits as well as oil and gas. Fiji produces large quantities of raw sugar from
sugar cane and is also one of the most popular tourist destinations in the South
Pacific. It also has some gold deposits. Solomon Islands produces logs and fish
products (frozen, canned, and smoked), in addition to small amounts of gold
and palm oil. Though tiny, Nauru is one of the richest countries in the Pacific due to
phosphate mining; phosphate is used in making agricultural fertilizers.
The main resources of the remaining countries are the sea and the resources
of the sea. What are some of the marine resources that you can think of?
Majuro Atoll, Republic of the Marshall Islands

16
Chapter
Marine Resources
The amount of ocean the Pacific island countries control is very large
compared to their small land mass. In addition to the nearshore lagoons and reefs,
international law allows Pacific Island countries the exclusive control of economic
resources in the ocean lying within 200 miles of their land. This huge area of the
ocean--called the Exclusive Economic Zone-- is nearly six times their total land
mass. Within these deep waters, fisheries resources are abundant, especially the
valuable migratory tuna.
The Pacific has nearly 90 percent of the world’s commercially catchable fish
stocks and 70 percent of the world’s tuna. So the next time you eat a tuna sandwich,
it was most likely made from tuna caught and even canned in the Pacific.
Since the skilled labor needed to catch tuna in open ocean and the money to
build ships and canneries are scarce in the Pacific Islands, fishing in the deep ocean
and fish processing and canning are mainly done by large foreign fishing companies
from countries such as Japan and the United States.
Pacific Island countries receive money from some nations in exchange for
permission to enable their fishing fleets to fish in the waters of Pacific exclusive
economic zones. Some fishing fleets fish illegally. It is very difficult for Pacific
Island countries to patrol the huge Pacific Ocean to catch illegal fishing boats.
Other valuable products from the sea include pearls to make jewelry and
Trochus shells to make high quality buttons. In the future, undersea mining may also
be possible.

17
Chapter
Land Resources
Except for Papua New Guinea, Pacific Island countries have small amounts
of land. Some countries are only a few square miles. The amount of land suitable to
grow food crops is much smaller. Thus, differences in land resources are great
among Pacific Island countries. While Fiji can raise cattle and grow a sizable range
of crops, including sugar, coconuts, rice, cassava, and kava, the tiny atoll
communities can grow little, due to lack of topsoil, exposure to salt-laden winds,
and lack of fresh water. Copra, a product of the coconut used to make coconut oil,
is the main cash crop in many Pacific atoll communities and in other islands as well.
Sokehs Rock, Pohnpei, Federated States of Micronesia Ujelang Atoll, Republic of the Marshall Islands
HIGH ISLANDS LOW ISLANDS
Coconuts/Copra
Agriculture
Coconuts/Copra
Forestry Fisheries Minerals
Cassava Cattle Tourism
Fisheries Tourism

18
Coconut trees are found in many Hawai‘i parks and yards. Here we pay
people to cut down the coconuts and throw them away before they can fall and hurt
people or damage property. In the Pacific, the coconut is the most useful plant and
a very valuable economic resource with many uses.
Some Uses of the Coconut Tree
Roots: medicine, fertilizer Trunk: furniture, construction, simple bridges Bark: (cloth-like material near leaves) strainer, rag, clothing, sandals Blossom: tapped for tuba, a beverage made from sap, which can be either
sweet, alcoholic, vinegar, or syrup Nut stems: decoration, firewood, fertilizer Baby Nut: eaten, used as a toy Immature Nut:
husk: fiber rope, mosquito smoker, toilet paper, fertilizer, and firewood shell: eaten (if young enough) meat: eaten (is very soft), make soup water: drink
Mature Nut: husk: same as for immature nut, plus carving decoration, cork for bottle stopper shell: cup, scraper, various spoons and utensils, decoration, bra, firewood meat: make copra (cash crop), make cooking sauce, eaten, candy, soap, coconut oil water: can be drunk
Sprouting Nut: husk and shell: same as above. meat: eaten, but thinner and drier spongy center: eaten as candy
Leaf: mid-rib (stem): paddle, stirring utensils, rollers under a canoe ribs (veins): toothpicks, brooms individual leaf: decoration, folded into a spoon, magic, body squeegee whole frond: woven into thatch, mats, baskets, hats, fans.
Heart: eaten (removing the heart kills the tree)
Source: Reilly Ridgell, Pacific Nations and Territories, fourth edition (Honolulu: Bess Press, 2006), p. 44.

19
The next time you see people throwing away coconuts, you might want to
take a few home. Leave them out to dry until just before Christmas. Then you can
write addresses and holiday messages on the coconuts and mail them (unwrapped!)
at the local post office to a friend on the mainland. In this way, you have turned
trash into a valuable economic product: an exotic, combination holiday card and
present for a mainland friend.
+ =
Who Owns the Land in the Pacific
An unusual feature of Pacific Islands land resources is who owns the land.
In Hawai‘i, land is mostly owned by private individuals and businesses. A person
who owns a piece of land can sell it to anyone. That is not the way it is in most of
the Pacific Islands, where land is a scarce resource.
Most of the land in the Pacific is owned by community groups such as a
village, and not by individuals. Community groups also make the rules for its use. A
businessperson who wants to build a hotel on land owned by a village must negotiate
with the entire village for the right to build a hotel on the community’s land. Getting
everyone in the village to agree to allow the businessman to build a hotel on their
land may not be easy.

20
Furthermore, Pacific Island countries (Hawai‘i and Guam are the exceptions)
have laws that do not allow non-native people (foreigners) to buy land in their
countries. For example, if you and your family moved to Saipan in the Northern
Mariana Islands, you could not buy a piece of land on which to build a house. Your
parents could not buy a piece of land to start a business. Because you are non-
native, you are permitted only to lease (rent) the land and not own it. Your parents
can buy a house, but can only rent the land on which the house sits.
One result of not allowing land to be sold to non-natives is that land in the
Pacific Islands is still largely owned by the native people. Hawai‘i is an exception;
Native Hawaiians own very little of the land in Hawai‘i today.
As Pacific Island countries become more popular as international tourist
destinations and their economies grow, the demand for land in the Pacific has
grown. As a result, land has become an increasingly valuable resource. Many want
to own their own piece of land rather than share it with large groups of people.
More land in the Pacific is becoming individually owned. If this practice becomes
widespread, it could bring big economic and social changes to Pacific Island
societies, as some people would own and have exclusive use of a piece of land
while others would have none.
In subsistence communities and in more highly developed economies, land is
an important part of the economy. It provides food, living space, and other
resources; if people do not own land they must pay money to those who do own
land.

21
Chapter 7
Managing Economic Resources Renewable and Non-Renewable Resources
Economists describe resources such as gold, copper, nickel, and phosphate
as non-renewable resources. In other words they become depleted and cannot be
replaced. Once you remove them from the ground, they are gone. Indeed, Nauru's
phosphate reserves are expected to be gone in a few years, and the people there will
have to find another way to make a living other than from mining.
Even though forestry and fishery resources are renewable resources
because they can be replenished, they can also be over harvested. If you cut too
many trees to harvest logs before you can replace the trees, soon you will be unable
to produce any logs. Also, if you catch too many fish from the ocean before they
have an opportunity to reproduce themselves, soon you find that there are fewer
fish to be caught.
An important economic decision facing people in those countries is whether
to harvest as many logs and fish they can. If they do, their children and
grandchildren might have nothing left to harvest. Alternatively, they can harvest
more slowly today so their children and grandchildren will also have logs and fish to
harvest.
In Solomon Islands, the government presently allows 800,000 cubic meters
of logs to be cut each year from the country's forests. At this rate of harvest, the
country's forest resources will be depleted in about 15 years because there is not
enough time for new trees to grow to replace the ones that have been cut.

22
Cub
ic M
eter
s of
Log
s
A sustainable rate of harvest that will enable continuous and steady
production of logs in the future is around 325,000 cubic meters per year.
Forestry Rates in the Solomon Islands
14,000,000 12,000,000 10,000,000
8,000,000 6,000,000 4,000,000 2,000,000
0
Resources depleted, 2017. Current Rate Sustainable Rate
Year
In the lagoons and reefs of the Pacific Islands, over harvesting of fisheries
resources is common because of rapid population growth in several countries.
Mangrove crabs in Pohnpei State (Federated States of Micronesia) are a popular
delicacy. Because they are delicious, they would disappear quickly if limits were not
placed on their harvesting. The government does not allow mangrove crabs to be
exported. If you ever visit Pohnpei, you might be able to eat mangrove crabs there,
but you cannot buy Pohnpeian mangrove crabs in the supermarkets in Hawai‘i.
In the Pacific, people are beginning to talk about the need to practice
behavior that results in sustainable use of their valuable economic resources.

23
Global Warming
Governments of Pacific Island countries can do little themselves to protect
their countries and economic resources from the effects of global warming.
Global warming is when the earth’s temperature rises.
When people drive their cars or burn oil, gas, and coal to generate power to
run industries and businesses, they generate carbon dioxide gases, often called
“greenhouse gases,” that envelop the earth.
The earth then becomes a greenhouse. When the heat of the sun hits the
earth, the greenhouse gases slow the escape of the heat from the earth,
trapping the warm air beneath the atmosphere.
Source: http://www.epa.gov.

24
The rising earth temperature melts the ice caps at the North and South Poles
causing the earth’s oceans to rise. Some scientists believe that by the year 2050, the
sea level could be one meter, or approximately three feet, higher than in 1980.
Global warming is expected to have important effects on the world’s food
production, as agriculture is sensitive to weather and temperature changes. Some
areas of the world will have more rain; some less. Rising temperatures could also
change marine life in the oceans, an important source of food for Pacific Island
countries. Pacific Islanders get about 60 percent of their protein from marine
animals.
For some Pacific Island countries, there is a more direct concern. As the
Pacific Ocean rises, the coastal areas of islands will be submerged under water.
People living on atolls barely a few feet above the ocean will become homeless as
parts of their islands are submerged or washed away. With so little land and fragile
resources, the Pacific Island countries are especially at risk of becoming
environmentally and economically harmed by the high-income, industrialized
countries that produce most of the greenhouse gases. Pacific Island countries need
co-operation from these rich countries to limit the emission of these gases into the
atmosphere.

25
Chapter 8
Human Resources
People are important resources because they produce goods and services,
and one resource that is not scarce in the Pacific Island countries is people. The
populations in some Pacific Island countries grow quite rapidly because birthrates
are high, that is, families have many children: more than twice the rate of the United
States and other industrialized countries. Tonga, Cook Islands, and Samoa have
slower population growth only because many of their people have moved to foreign
countries like Australia, New Zealand, and the United States. The number of people
in Niue and Tokelau has actually declined due to emigration. Emigration occurs
when people move out of their own countries to live in other countries.
In Hawai‘i, the population growth is due to immigration, not a high birthrate,
like other Pacific islands. Rapid population growth means that the Pacific Island
countries have a high proportion of young people. In most Pacific Island countries,
about 4 out of every 10 people are children under the age of 15. By comparison,
only about 2 out of 10 people in Hawai‘i are children under the age of 15.
Both the very young and the very old depend upon middle-aged people to
support them because they are unable to support themselves. Countries with larger
populations of children require one person of working age to support many non-
working family members, especially young children and the elderly. Money earned
in these economies does not go as far as money received by workers who have
fewer people on whom to spend their wages. Also, with so many children, the cost
of raising and educating them is very high, and growing rapidly.

26
Unlike in Hawai‘i and the rest of the United States, children in most Pacific
Island countries are not required to remain in school until they reach the age of 16 or
18.
In Fiji, one of the most developed countries in the Pacific with relatively high
GDP per person, elementary school is free but not required. Beginning at age 6,
more than 9 out of 10 elementary age students go to school. High school is not
free. Only half of the 16-year-old Fijian youths are still in school at that age.
In Kiribati, only 3 out of 10 students who finish elementary school go on to
secondary school, and only half of those complete their education. Schools are
expensive and competitive and not available for everyone.
In countries where the youth population is rising rapidly and many leave
school early, the governments face a difficult economic challenge to keep more of
the youth in school longer as well as to find jobs for those who finish school.
Labor is not a scarce resource in most Pacific Island countries, but educated
and highly trained workers are scarce. In many Pacific Island countries, many of the
jobs requiring higher skills are filled by foreign workers even though large numbers
of young people cannot find wage-earning jobs.
Unlike most Pacific Island countries, Saipan, in the Northern Mariana Islands,
has had a scarcity of workers. Saipan has brought in large numbers of foreign
workers to work in its tourist and clothing-manufacturing industries. Today, there
are more foreign workers in Saipan than domestic workers.

27
Cook
French
Tuvalu
Northern
Papua N
ew
Solomon
New
Chapter 9
Tourism Resources
If their land resources are generally poor, some Pacific Island countries have
excellent resources for tourism. Tourism is an activity in which people travel
primarily for sightseeing and fun. Hollywood movies have portrayed Pacific Island
countries as tropical paradises with excellent beaches, a warm climate, beautiful
oceans, and few modern world cares and problems.
Tourism is still a relatively new industry in the Pacific. Widely scattered over
the vast Pacific Ocean, these small islands are difficult places to reach except by air
travel. Airfares to these countries are expensive, and transportation connections are
often not very good, so few tourists can get there. The countries with lots of
tourists are French Polynesia (Tahiti), New Caledonia, Guam, the Northern Mariana
Islands (Saipan), and Fiji. Even so, the number of tourists visiting those destinations
is small compared to the 6,743,140 tourists who come to Hawai‘i each year!
Number of Tourist Arrivals in Pacific Destinations: 1998
450,000 400,000 350,000 300,000 250,000 200,000 150,000 100,000
50,000 0
Melanesia Micronesia Polynesia
6,743,140 tourists come to Hawaii each year (18 times the number to Guam).
Source: World Tourism Organization, Barometer of Travel and Tourism. (Madrid, February, 1999)

28
Tourism is considered a desirable industry by many Pacific Island
governments because it is a growing industry around the world. As people’s
incomes rise everywhere in the world, more and more people can afford, and want,
to travel overseas on vacations. In the Pacific, where the population of working age
is growing very rapidly but jobs are not, tourism creates wage-paying jobs for young
people who would otherwise have little to do once they leave school. Unable to find
jobs at home, many Islanders have migrated to foreign countries like the United
States, Australia, and New Zealand to work. While the money they send home is
welcomed, families are broken up and the people who are left behind are largely the
very young and the elderly. The tourist industry offers jobs that could keep many
Islanders at home.
Some people in the Pacific are not enthusiastic supporters of the tourist
industry. They fear that tourists could help to spread AIDS in their countries,
increase crime, raise the prices of things local people buy, and destroy their
traditional cultures. Thus, tourism can be both good and bad for Pacific Island
countries.

29
Chapter 10
Imports and Exports
Like people all over the world, people who live in the Pacific Island countries
would like to buy more things than the few products that they themselves produce.
They want to eat rice and canned foods, wear Western clothing, drive cars, watch
television, and have modern conveniences like piped water, sewage and garbage
disposal, paved roads, electricity in their homes, modern medicines and medical
care, school books and supplies, and many other things. These goods, or the
machinery, equipment, and supplies to produce them, have to be purchased from
the United States, Japan, Australia, and other countries. Items that countries buy
from abroad are called imports.
Most of the money that Pacific Islanders spend is used to buy imports of
automobiles; fuel for cooking, electricity generation, and transportation; food items
like rice, canned fish, and soda pop; and machinery and other manufactured goods.
Pacific Island countries spend a lot of money on fuel imports because most have no
fossil fuel, such as gasoline, diesel, or kerosene. However, they do have plenty of
sunshine and the ocean to produce energy.
To pay for their imports, Pacific Islanders sell some of their products abroad
to earn money. Items that countries sell abroad are called exports. Since they have
so little to sell (a few primary products, such as fish and copra; handicrafts, such as
mats, baskets, and hats; and tourism, namely their beaches and ocean environment),
and they want to buy so much from abroad, they have to find other sources of
money to pay for their imports. This is especially important when the prices they
receive for most of the primary products they sell abroad are falling.

30
Where does this additional money come from? Kiribati and Tuvalu have
schools that train sailors to work on foreign ships, and the sailors bring their wages
back to their country’s economy. Tuvalu also sends people to work in Nauru’s
phosphate mines.
For Samoa, the Cook Islands, and other nations, an important source of
money is money that their citizens who live abroad send home to relatives each
year. Money sent home is called a remittance. For example, more than 150,000
Pacific islanders live in the United States today, many of them in Hawai‘i. They send
nearly $70 million each year to their relatives back home, with Samoans and
Tongans receiving the largest amounts. American churches and private charitable
organizations also send goods and large sums of money each year to Pacific Island
countries.
Many Pacific Island governments also receive large sums of money from
foreign governments such as Japan, Australia, France, and the United States. This
money not only pays for imports but also hires large numbers of local people to
work in government offices and government-owned businesses. In a few countries
like Tuvalu, Niue, and the Cook Islands, the government is the biggest employer,
providing more than half of the wage-earning jobs. Governments in most Pacific
Island countries play much larger roles as buyers and sellers in their economies than
governments in the United States and Hawai‘i. Thus, governments make up a bigger
part of the Pacific Island economies.
Palau’s (Belau’s) government has an unusual way to get money to pay for
the cost of its prisons. It requires inmates to pay part of the cost of feeding and

31
caring for them in jail. Inmates make money for their upkeep by carving beautiful
storyboards to sell to tourists. Local legends and stories are carved into these
wooden boards. You can see samples of Palauan storyboards at the Bishop
Museum. Japan USA Taiwan
AID
Aid and Trade Pacific Island Nations
Large nations contribute funds to Pacific island nations’ economies.
In many cases, the money
Australia France
Trade
Local stores import items from abroad
Government Jobs
Employees buy goods
helps the nations to offer jobs in the government to their citizens. The employees use their wages to buy goods for their families from local stores. The local stores buy supplies from companies in the large donor nations. In this way, Pacific Island
nations also contribute to the economies of larger nations.

32
In summary, with generally few economic resources, Pacific Island countries
produce few things. Most of what they produce are primary products, which are
goods from agriculture, fishing, forestry, and mining.
Pacific Island countries produce few manufactured goods; most of what is
manufactured, like bakery goods, for example, are produced by small businesses
and sold locally. Large and economically important manufacturing activities for
export include tuna canning in American Samoa and Solomon Islands and
clothing manufacturing in Fiji and in the Commonwealth of the Northern Mariana
Islands.
Pacific Islands contain many types of land, as well as marine and human
resources. While they may have fewer resources than other nations, they also find
ways of sharing these limited natural resources to improve life in their communities.

33
Glossary
Domestic: Of, or pertaining to, the services, products, resources, labor, etc. inside
a particular nation. Economic resources: The land, the workers, the machinery, equipment, buildings,
and other ingredients used in production.
Emigration: When people leave their own countries to live in other countries.
Exclusive Economic Zone (EEZ): The area of the ocean within 200 miles of land,
in which the resources are reserved exclusively for the use and control of the land’s
inhabitants. Exports: Goods and services sold outside one’s country.
Global warming: The rise in the Earth's temperature due to pollution caused by
the burning of oil, gas, and coal. Gross domestic product (GDP): The value of goods and services produced in an
economy in one year. It is used to measure the size of an economy.
Gross domestic product per person: The value of goods and services produced
in an economy per person. It is used to compare how well people live in different
countries. It is also used to compare how well people in one country live in one
year and earlier or later years.

34
Imports: Goods and services purchased from other countries.
Non-renewable resources: Economic resources, such as gold, copper, nickel
and phosphates, which cannot be replaced once they are taken out of the ground. Primary products: Goods produced from agriculture, fishing, mining, and
forestry. Remittances: Money sent home by family members abroad.
Renewable resources: Economic resources, such as trees and fish, which can be
replaced after they are harvested. Subsistence: A way of living in which people produce items that they need for
themselves, such as food, clothing, and shelter. Sustainable rate of harvest: The use of resources in a way that allows for their
replacement and will not diminish the amount of resources for future use. Tourism: An activity in which people travel primarily for sightseeing and fun.

36
Appendix
Other resources: I Had A Dollar in Hawai‘i. By Jodi Endicott, illustrated by Hans Loffel. Palila Books. (Age 5–8)
Movies: Ocean of Dreams, Currents of Change. Series produced in 1989 by Juniper Films. In this ten-part series, viewers are shown the dazzling diversity of cultures and traditions of the South Pacific islands. Presented are ten island nations: Tuvalu, Fiji, Kiribati, Western Samoa, Papua New Guinea, Vanuatu, Solomon Islands, Niue, Cook Islands, and Tonga. These 26-minute films depict the way the people of these islands see modernization influencing their world. All except Tuvalu are available in the Hawai’i State Public Library System.
Producing Black Pearls This 22-minute film describes the farming of black pearls in the South Pacific and offers tips on maximizing the size and quality of cultured pearls. Produced in 1997 by Michael Ogden and Anne Bailey for the Pacific Aquaculture Development Program, University of Hawai’i at Mānoa Sea Grant.
Rising Waters: Global Warming and the Fate of the Pacific Islands Tracing the impacts of climate change from the tropical Pacific to the island of Manhattan, this 57-minute film examines international policies and the lives of those most urgently affected by the global warming debate. See http://www.itvs.org/risingwaters/ for more details.
Web sites:
Pacific Island News
Pacific Island Report http://pidp.eastwestcenter.org/pireport/ Environmental Problems
Global Warming http://epa.gov/climatechange/index.html Climate Change http://www.sprep.org/factsheets/climate/index.htm
General Center for Pacific Islands Studies, University of Hawai‘i at Mānoa
http://www.hawaii.edu/cpis

June 2012 Lesson One: Where Would You Live?
Title of Unit: Pacific Places
Duration: 1 class period (50 minutes)
Course/Grade: Pacific Island Studies/Grade 7
Goal(s): To engage students and introduce them to the unit through activity related to the geographic theme of place.
Procedure/Activities
Resources/tools Assessment
Project maps of Niʽihau (1A and 1B) on the screen. Map reading/discussion with entire class Questions might include
• What do you see? • What is shown on this map? • What is the size of the island? • How do you know the size of the
island? • Where is the island located? • What features does this island have? • How might the map key help us learn
more about this island? Teacher records responses on a T-Chart, separating answers into physical and human characteristics. Consider the physical characteristics (mountains, water) and human characteristics (towns and roads). Ask students what they notice about the chart. What are the commonalities of the items under each category? Teacher explains that physical characteristics are those characteristics from nature, whereas human characteristics are man-made.
Maps of Niʽihau (Attachments 1A, 1B) projector Blank T-Chart http://ulukau.org
Formative assessment – conversation recorded in T-chart to show understanding of geographic theme of place
Place students in groups of three to five. Provide hard copy of map 1C for students. Use group-learning strategy to have students respond to the following: Your group is stranded on the island that we have just described. If no settlements are there, where would you live and why?” Mark where you would live on your map and give reasons for your decision. Share group responses.
Strategy – Group Learning Outline map of Niʽihau (Attachment 1C), chart paper, color markers
Completed chart paper and map by each student group, which identifies the site on the map where they would live, with justification.


June 2012 Lesson Two: Our Pacific Islands
Title of Unit: Pacific Places
Duration: 8 class periods (@50 minutes each) Course/Grade: Pacific Island Studies/Grade 7 Goal(s):
Students acquire content and skills needed to successfully complete summative assessment task.
Procedure/Activities Resources/tools Assessment A. Introduction (one class period) Prepare four signs: Physical Characteristics, Human Characteristics, Demographics, Economics (see Attachment 2A-2). Create slips of vocabulary/terminology (see Attachment 2A-3). Students participate in active learning strategy, Four Corners (see Attachment 2A-1). Discuss reflection/debrief questions from the strategy with the whole class. B. Hawai‘i: Our State (one class period) Teacher introduces State of Hawai‘i Data Chart (see Attachment 2B-1) and reviews or instructs students on skills needed for reading/use of maps and other geographic representations. Note: Answer Sheet (Attachment 2B-2) is provided. Teacher may choose to focus on an individual island instead of the state as a whole. Teacher models/guides students in understanding categories for matrix, terms used, and information to be gathered. Teacher uses inquiry questions to show relationship of place to economics and demographics. For example: Look at your island of study. Is tourism a prominent industry? Where are the hotels located? Why? Exit Pass – How might place affect how people live?
Attachment 2A-1: Active Learning Strategy (Four Corners) Attachment 2A-2: Signs Attachments 2A-3: Vocabulary Slips http://www.una.edu/geography/statedepted/themes.html Five Themes of Geography http://www.hawaii.edu/cpis/paceconomies.pdf Pacific Island Economies Attachment 2B-1: Hawaii Data - Student Worksheet Attachment 2B-2: Hawaii Data - Answer Sheet Teaching Strategy – I Do (model) Teaching Strategy – We Do (guided) http://www.lib.utexas.edu/maps/hawaii.html maps of Hawaii http://hawaii.gov/dbedt/info/economic/databook/db2010 State of Hawaii Data Book
Four Corners Reflection Questions Exit Pass Exit passes are like “tickets out the door.” Students are given just one to three minutes to write their responses and passes are collected as they leave.

June 2012 C. Group Research (three class periods) Display a printed copy of Our Pacific Island Matrix (Attachment 2C-1). Separate students into learning groups and assign each group a Pacific Island entity to gather information on as modeled. Distribute Student Worksheet (Attachment 2C-2). Explain to students that the information they gather will be shared with the whole class and may be used to help in their final assessment task. Each student group completes a matrix. Teacher guides students and provides students with additional resources as needed. If desired, students and/or teacher may add categories to the matrix. For example, natural attractions (a physical characteristic, such as Waimea Canyon, Kilauea Volcano, or Pipeline) or events (an activity that may add to the economy, such as the Pro Bowl, Sony Open, or Merry Monarch Festival). Blank cells are provided on the student worksheet for this purpose.
Attachment 2C-1: Our Pacific Islands Matrix Attachment 2C-2: Student Worksheet Teaching Strategy – You Do (independent) http://www.lonelyplanet.com user-friendly, searchable site with maps, photos, basic information http://maps.google.com/ Satellite maps showing main roads, rivers, bays, and harbors https://www.cia.gov/library/publications/the-world-factbook/index.html CIA World Factbook http://www.athaia.org/cgi-bin/tools/get-traffic.pl?link=http://www.lib.utexas.edu/maps/guam.html Select Guam relief map Student Atlas of Guam, by Danko Taborosi and David T Vann. Honolulu: Bess Press. 2006 http://www.hawaii.edu/cpis/resources_7a.html See Pacific Places Resources for additional general materials and specific resources for each of the Island entities.
Formative Assessment: Completed matrix and teacher observations and conversations

June 2012 D. Group Presentation (two class periods) Groups plan presentation to whole class of gathered information. Each group prepares a completed matrix to give to teacher. Presentations must include a description of the relationship between economic activity and other characteristics of place for their Pacific Island entity. Note: Attachment 2C-1 may be used by the teacher to record information for students to compare, side by side, the different Island entities studied. Presentation may include use of graphic organizers, posters, PowerPoint, and other visuals such as maps and photographs. Exit Pass – Provide two examples to explain how place might impact economic activity.
Attachment 2D: Sample Rubric for Presentation
Exit Pass
E. Group Debriefing (one class period) Whole class looks at completed matrix. Teacher guides discussion to encourage students to notice commonalities and differences in order to form some generalizations about low and high islands. Distribute Student Question Slips (Attachment 2E-1). Allow students time to Pause and Think, in order to formulate their responses. Conduct active learning strategy Milling to Music (see Attachment 2E-2) for students to share their responses. Whole class reflection asking, What similar things did you share? What did you learn?
Attachment 2E-1: Additional Questions to Consider Attachment 2E-2: Active Learning Strategy: Milling to Music
Milling to Music Question Slips Reflection Questions

June 2012
Attachment 2A-1 Four Corners 1. Prepare signs of main characteristics of places (physical characteristics, human characteristics, demographics, and economics) and post in four corners of the classroom. 2. Prepare vocabulary/terminology slips and distribute one per student. 3. Have students stand in the corner under the sign that they think best describes their vocabulary word. 4. Have students share their individual word within their group. As a group do they agree on the grouping? Does anyone feel they need to move? Why? 5. In each of the four groups, have students decide on a definition/explanation of their main characteristic and share with entire class. 6. Class may want to fine-tune the definitions/explanations and may also want to check other resources to gain clarification.

June 2012 Attachment 2A-2
PHYSICAL
CHARACTERISTICS
DEMOGRAPHICS

June 2012 Attachment 2A-2
HUMAN
CHARACTERISTICS
ECONOMICS

June 2012 Attachment 2A-2

June 2012 Attachment 2A-3
LANDFORM
(high-low, continental-volcanic-atoll)
BRIDGES
LAND AREA
MAN-MADE
CANALS
ELEVATION
DAMS
NATURAL
RESOURCES (renewable, nonrenewable)
ROADS (paved, unpaved)
CLIMATE
(temperature, weather, rainfall)
BUILDINGS
NATURAL
WATERWAYS (rivers, lakes, ponds)

June 2012 Attachment 2A-3
TOTAL
POPULATION
INDUSTRY
POPULATION SETTLEMENT
/DISTRIBUTION
GROSS DOMESTIC PRODUCT
(value of total goods and services produced annually)
ETHNICITY/RACE
TRADE (import, export)
BIRTH/DEATH
RATES
WAY OF LIFE
(subsistence/commercial, occupations)
POPULATION
CHANGES (immigration, emigration)

June 2012
Attachment 2B-1 State of Hawai‘i Data
Student Worksheet
Descriptors
State of Hawai‘i Source and Year
Atlas of HI (1998) from http://ulukau.org
Geog
raph
ic T
hem
e of
Pla
ce
Phys
ical
Cha
ract
eris
tics
Landform (high-low,
continental-volcanic-atoll)
Land Area (in sq. miles/km)
Elevation (in ft/meters)
Natural Resources List
(renewable, nonrenewable)
Climate (including avg. temperature in Fahrenheit, avg.
annual rainfall in inches, seasonal
weather conditions)
Natural Waterways
(rivers, bays)
Hum
an C
hara
cter
isti
cs
Bridges
Man-made Waterways
(canals, dams, harbors/ports)
Roads (paved-unpaved)
Cities/Towns (eg, names,
capitals)

June 2012
Types of Buildings (eg, materials, structure, use)
D
emog
raph
ics
Total Population
Population Settlement
(population density,
distribution in cities & towns-Where do most
live?)
Ethnicity/Race
Life Expectancy/ Median Age
Population Changes
(immigration, emigration)
Eco
nom
ic
Industry (agriculture,
manufacturing, tourism, fishing,
etc)
Gross Domestic Product
(GDP—value of total goods and
services produced annually)
Trade (import/export)
Way of Life (subsistence/ commercial, occupations)

June 2012
Attachment 2B-2 State of Hawaii Data
Answer Sheet
Descriptors
State of Hawaii Year
Atlas of HI (1998) from http://ulukau.org
Pac Nations & . . . (Ridgell 4th ed.)
Geog
raph
ic T
hem
e of
Pla
ce
Phys
ical
Cha
ract
eris
tics
Landform (high-low, continental-
volcanic-atoll)
8 large volcanic islands 124 small islands, reefs,
shoals
19 islands and atolls 8 main - volcanic is.
11=northwestern Hawn Is.- Small is. and atolls.
Volcanic islands have large valleys and coastal lowlands
Land Area in sq. mile/km
6,423.4 sq. miles/ 16,636.5 sq. km
Inland water 25 sq miles
6,423 sq mi
Elevation in ft/meter
Varies from sea level to highest peak of Maunakea at
13,796 f/4,205 m. Percentage of state area
w/elevation less than 500 ft is 20.8 %. Percentage of state
area w/elevation greater than 2000 ft is 50.9 %.
Map p. 249 has elevation but difficult to see.
Mauna Kea 14,000 feet (430 meters)
Natural Resources List (renewable, non-
renewable):
Geothermal resources Fresh water supply
*sustainable groundwater via rainfall and aquifers.
Isolation provided for many native land and marine
fauna/life.
Climate (including ave. temperature in
Fahrenheit, ave. annual rainfall in inches, seasonal weather
conditions)
Earthquakes, tropical climate, windward and leeward
systems of rainfall W/coastal areas drier. Avg
annual rainfall changes with elevation and location (eg,
Waikiki 20 in vs Tantalus 160 in). Island topography leads to diversity in trade, clouds,
temp, rain etc, Humidity norm 60-80%
Highest recorded temp 100 F(1951), but monthly
variations is only about 9 degrees

June 2012
Two seasons – kau (warm May-Sept) and ho’oilo (cooler Oct-April). May be one of most hazardous areas on earth; subject to hurricanes, droughts, rainstorms, flooding, eruptions, earthquakes, tsunamis, erosion, sea level change.
Natural Waterways (Rivers, Lakes/Ponds,
Bays)
Perennial streams on windward side, major streams include Wailuku River (Hawaii), Waihe’e and Palikea Stream (Maui), Kahana and Kaukonahua Stream (Oahu), Wailua and Waimea River (Kauai), Pelekumu and Wailau Streams (Molokai). Natural Ponds include Waikea (Hawaii), Kanalu (Maui), Halulu Lake (Niihau). Channels include Kaulakaki, Kauai, Kaiwi, Kalohi.
Hum
an C
hara
cter
istic
s
Bridges No significant bridges Man-made Waterways
(Canals, Dams, Harbors/Ports )
Harbors on 4 largest islands - Honokohau (Hawaii). Honolulu (Oahu), Nawiliwili (Kauai) as well as numerous small boat harbors. No significant dams. Commercial inter-island air transport began 1920s. Artificial ponds/lakes include reservoirs-Kualapuu (Molokai), Wahiawa (Oahu), Waimea (Kauai).
Roads (paved-unpaved)
Land transportation intra-island, freeways (three interstates on Oahu-H1, H2, H3) to single lane highways (highways on six largest islands), Oahu only island with major mass transit system.
Cities/Towns 4 counties (Hawaii, Maui, Oahu, Kauai.) Towns (of 1000+ pop) on six largest islands

June 2012
Types of Buildings Museums, libraries,
colleges/universities. Varying architecture from western and eastern influence.
De
mog
raph
ics
Total Population 1,183,700 1,211,537 (2000 census) Population Settlement/
Distribution in Cities/Towns
75% live on Oahu w/ concentration in Honolulu (45%). 90% live in urban areas.
Ethnicity/Race One of most cosmopolitan states – no single majority, but important minorities include: Hawaiian and other pacific island peoples, Chinese, Japanese, Korean, Filipino, Caucasian.
Japanese, Caucasian, Chinese, Filipinos, Portuguese,
Hawaiians, part-Hawaiians, other Pacific Islanders,
Vietnamese, Koreans, Hispanics, African-Americans, American
Indians Birth and Death Rate Life expectancy – 75.9 m/
80.06 f – w/median age 33.7 in 1993 and 104 males for every 100 females. Birth rate 16.5 per 1000 (1994), death rate 6.0 per 1000 (1993). Heart disease leading cause of death.
Population Changes (immigration, emigration)
Sharp decline Hawaiians mid to late 1800’s due to disease epidemics. Acceleration early to mid 1900’s due to immigration, military, mortality drop, Mid 1990s # leaving exceeded new arrivals due to economic slowdown.
Eco
nom
ic
Industry (agriculture, manufacturing, tourism,
fishing, etc)
Tourism (6 mil. Visitors annually), Federal Defense Spending, Agriculture
Agriculture=sugar/pineapple being replaced by, taro,
coffee, mac nuts, cocoa flowers, live-stock
Aquaculture=shellfish/algae Tourism, military (occupies 25 percent of land on Oahu/more than 40,000 military personnel
and families), motion pictures/TV, retail, food/bev,
construction/housing Gross Domestic Product
(GDP--value of total goods and services produced annually)
33.5 bil
1989 median family income $43.176. $25,159 per person
capita income (1996).

June 2012
Trade
(import/export) 90% imported petroleum. 93% beef/veal and 14% pork imported. Export of tourism related services and re-export of merchandise to tourists. Export “made in Hawaii” items such as Kona coffee, aloha and surf wear, chocolate macadamia nuts. Export non-tourism services such as engineering, financial and medical throughout the Pacific.
Hawaii imports heavily making cost of living one of the highest
in the U.S.
Way of Life (subsistence/commerci
al, occupation)
Plantations dominated for 100 yrs prior to WWII but continues to decline, then military influence increased, Leading occupations is now tourism related, state/county/city agencies, military related. Urbanization seen as engine for economic growth.

June 2012 Attachment 2C-1 Our Pacific Islands Matrix (formatted for legal-sized paper)
Our Pacific Islands
Descriptors
Pacific island entity * State of Hawai’i
(or island) Tuvalu
(Funafuti) Chuuk
(Weno) Marshall Islands
(Majuro) Guam Papua New
Guinea (New Guinea)
Fiji (Viti Levu)
Geog
raph
ic T
hem
e of
Pla
ce
Phys
ical
Cha
ract
eris
tics
Landform (high-low, continental-volcanic-
atoll)
Land Area (in sq. miles/km)
Elevation (in ft/meters)
Natural Resources List (renewable, nonrenewable)
Climate (including avg. temperature in Fahrenheit, avg. annual rainfall
in inches, seasonal weather conditions)
Natural Waterways (rivers, lakes/ponds, bays)
Hum
an C
hara
cter
isti
cs Bridges
Man-made Waterways (canals, dams, harbors/ports)
Roads (paved, unpaved)
Cities/Towns
Types of Buildings (eg, material, structure, use)
* Note for each Pacific island entity, should gather information from two separate data-point years and/or sources. This will assist students in seeing changes and/or patterns.

June 2012
Dem
ogra
phic
s
Total Population
Population Settlement (population density, distribution
in cities & towns – Where do most live?)
Ethnicity/Race
Life Expectancy / Median Age
Population Changes (immigration, emigration)
Eco
nom
ic
Industry (agriculture, manufacturing, tourism, fishing
etc.)
Gross Domestic Product (GDP—value of total goods and
services produced annually)
Trade (import/export)
Way of Life (subsistence/commercial,
occupation)
* Note for each Pacific island entity, should gather information from two separate data-point years and/or sources. This will assist students in seeing changes and/or patterns.
Descriptors
Pacific island entity * State of Hawai’i
(or island) Tuvalu
(Funafuti) Chuuk
(Weno) Marshall Islands
(Majuro) Guam Papua New
Guinea (New Guinea)
Fiji (Viti Levu)

June 2012
Attachment 2D Sample Rubric for Presentation (based on ELA CCSS for speaking and listening) GRADE 7
Indicator Exceeds Meets Approaches Well Below Present claim* and supporting evidence in a focused, meaningful, and coherent way * A claim, or thesis, is a sentence that states the writer’s opinion on the topic. It can attempt to inform, persuade, reflect, or come to a decision.
• Presents claims and supporting evidence in a clearly logical manner
• Evidence and line of reasoning are highly relevant, exceptionally clear and thoughtful
• Presentation is clearly focused and adequate to purpose and task
• Presents claims and supporting evidence in a generally logical manner
• Evidence and line of reasoning are generally relevant, clear and thoughtful
• Presentation is generally focused and adequate to purpose and task
• Presents claims and supporting evidence in a manner that begins to interfere with understanding
• Evidence and line of reasoning are somewhat clear
• Presentation is somewhat focused and adequate to purpose and task
• Has no clear claim and/or weak supporting evidence
• Line of reasoning is not clear
• Presentation is inadequately focused as to purpose and task
Use digital media
• Makes exceptional and strategic use of digital media (graphics, audio, visual and interactive elements)
• Media choices clearly enhance the presentation; choices reflect thought
• Makes adequate use of digital media (graphics, audio, visual and interactive elements)
• Media choices generally enhance the presentation; choices reflect some thought
• Makes some use of digital media (graphics, audio, visual and interactive elements)
• Media choices marginally enhance the presentation; choices reflect little thought
• Makes little use of digital media (graphics, audio, visual and interactive elements)
• Media choices do not enhance the presentation
Deliver a presentation
• Introduction engages the audience and clearly sets the “plan” for the presentation
• Aids are clearly relevant, error-free, organized and clearly guide the audience through the presentation
• Exceptionally strong in articulation, use of standard English, posture, eye contact, word choice, speaking rate and volume
• Introduction engages the audience and generally sets the “plan” for the presentation
• Aids are generally relevant, error-free, organized and guide the audience through the presentation
• Adequate in articulation, use of standard English, posture, eye contact, word choice, speaking rate and volume
• Basic introduction introduces the topic; it marginally sets the “plan” for the presentation
• Aids are somewhat relevant, error-free, and organized, and begin to interfere with understanding
• Inconsistently adequate in articulation, use of standard English, posture, eye contact, word choice, speaking rate and volume
• Weak to no introduction; it does not set the “plan” for the presentation
• Aids are not relevant and might contain errors
• Inadequate in articulation, use of standard English, posture, eye contact, word choice, speaking rate and volume

June 2012
Attachment 2E-1 Additional Questions to Consider Student Question Slips:
• What is the difference between the physical and human characteristics of places? • How do physical characteristics of a place impact population settlement? • How might characteristics of places impact our Pacific Islands? • How does population settlement impact the human characteristics of places? • In any given Pacific Island entity, were there any patterns of population movement
over time? • How might characteristics of places impact our Pacific Islands? • How might the physical and human characteristics of places affect demographics? • How do physical characteristics of places impact a given Pacific island’s economy? • How might the physical and human characteristics of places impact our Pacific
Islands?
• How does a given Pacific island’s economy impact the human characteristics of
place? • How might the physical and human characteristics of places affect an island’s
economy? • How might the characteristics of places impact our Pacific Islands?

June 2012
Attachment 2E-2 Active Learning Strategy: Milling to Music Time: 15 minutes Materials: slips with numbered topics or questions, music player, and lively music OBJECTIVES 1. To build community inclusion 2. To review curriculum topic INSTRUCTIONS 1. Prepare for each student a slip in which there are three to four numbered questions. Example:
• Describe three cities, towns or houses in which you have lived. • Share your favorite way to relax or spend vacation time. • Describe what your house, apartment, or living space is like. • If you were given $100,000 tomorrow, what would you do with it?
2. Give the students their slips with the topics and ask them to stand up. 3. Explain that when the music starts they are to begin milling around silently but greeting each other as they pass by. 4. Explain that when the music stops (or when you give the hand signal), each student is to stop and discuss question #1 with a student standing close by for 1 minute. Explain that when the music begins again, they are to repeat the process until they have discussed all four questions. SUGGESTED REFLECTION QUESTIONS Content (cognitive learning)
• What kind of greetings did you use? • What similar things did you share?
Collaborative (social learning) • What skills did you, as community members, use to make this activity successful?
(suggest some: listening, speaking clearly, sharing time, respecting differences) • How has the atmosphere changed in the room? • How do you feel about the community now?
Discovering Gifts (personal learning) • What did you learn about yourself? • How are you a unique individual in the community? What special strengths are you proud of?
APPRECIATION Invite statements of appreciation:
• “I liked it when…” “Reaching All by Creating Tribes Learning Communities,” by Jeanne Gibbs. Centersource Systems: 2006.

June 2012 Lesson Three: Comparing “Places” - Conclusions and Generalizations
Title of Unit: Pacific Places
Duration: two class periods (@50 minutes each)
Course/Grade: Pacific Island Studies/Grade 7
Goal: Students will complete a summative assessment task showing that they have accomplished the selected benchmarks.
Procedure/Activities
Resources/tools Assessment
A. Review (one class period) Review the previous lesson. What were some of the commonalities we noticed about low islands? High islands? What conclusions might we now make? Students Think/Pair/Share two things that are important to remember and one question they might still have. Popcorn share with the whole class.
B. Assessment Task (one class period) Distribute summative assessment task to students. Students will create product which includes a narrative that answers the following: “Explain the relationship and impact of the physical and human characteristics on population settlement, demographics, and economic activity by comparing two (one high island and one low island) of the Pacific Islands studied.”
Attachment 3B-1: Summative Assessment Task Attachment 3B-2: Rubric
Summative Assessment Task

June 2012
Attachment 3B-1 Summative Assessment Task
Explain the relationship and impact of the physical and human characteristics on population settlement, demographics, and economic activity by comparing two (one high island and one low island) of the Pacific Islands studied. Instruction to Students: You are a delegate to the Asia-Pacific Economic Cooperation forum. You are asked to report back to your peers on your visit to several Pacific Island countries. Prepare a narrative that explains how physical and human characteristics impact • population • demographics • economic activity The explanation should provide comparison examples of one high-island and one low-island Pacific entity for each impact shared.
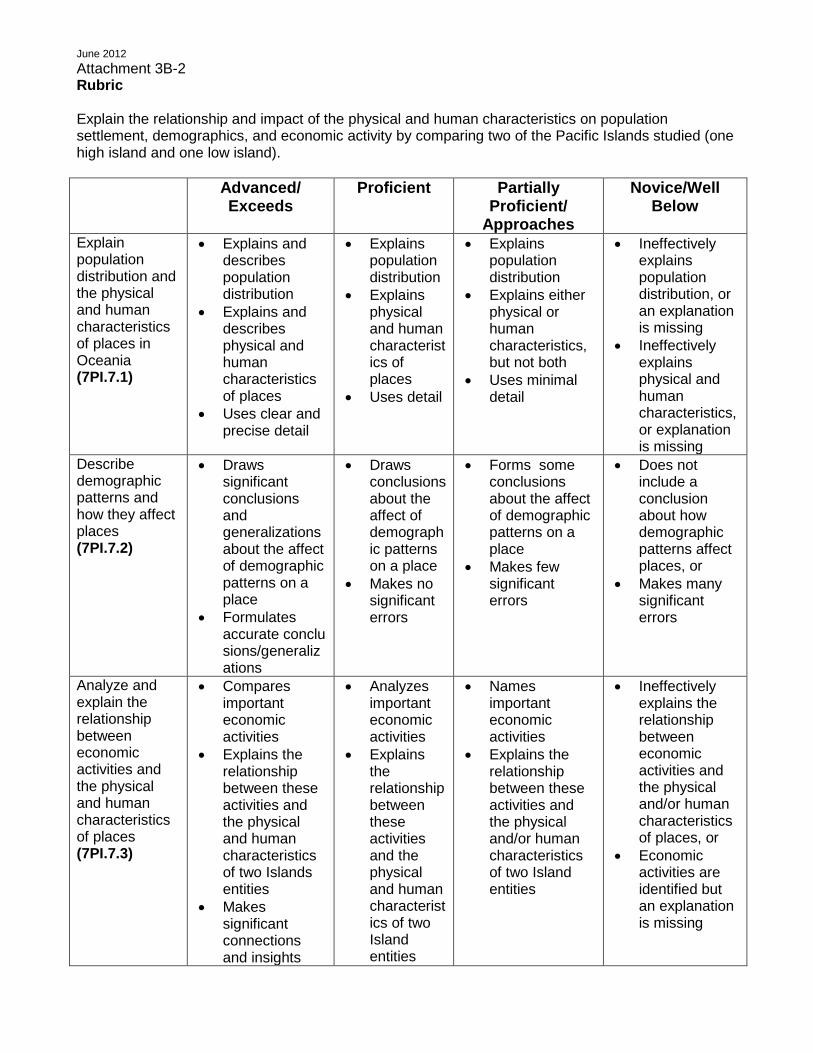
June 2012 Attachment 3B-2 Rubric Explain the relationship and impact of the physical and human characteristics on population settlement, demographics, and economic activity by comparing two of the Pacific Islands studied (one high island and one low island). Advanced/
Exceeds Proficient Partially
Proficient/ Approaches
Novice/Well Below
Explain population distribution and the physical and human characteristics of places in Oceania (7PI.7.1)
• Explains and describes population distribution
• Explains and describes physical and human characteristics of places
• Uses clear and precise detail
• Explains population distribution
• Explains physical and human characteristics of places
• Uses detail
• Explains population distribution
• Explains either physical or human characteristics, but not both
• Uses minimal detail
• Ineffectively explains population distribution, or an explanation is missing
• Ineffectively explains physical and human characteristics, or explanation is missing
Describe demographic patterns and how they affect places (7PI.7.2)
• Draws significant conclusions and generalizations about the affect of demographic patterns on a place
• Formulates accurate conclusions/generalizations
• Draws conclusions about the affect of demographic patterns on a place
• Makes no significant errors
• Forms some conclusions about the affect of demographic patterns on a place
• Makes few significant errors
• Does not include a conclusion about how demographic patterns affect places, or
• Makes many significant errors
Analyze and explain the relationship between economic activities and the physical and human characteristics of places (7PI.7.3)
• Compares important economic activities
• Explains the relationship between these activities and the physical and human characteristics of two Islands entities
• Makes significant connections and insights
• Analyzes important economic activities
• Explains the relationship between these activities and the physical and human characteristics of two Island entities
• Names important economic activities
• Explains the relationship between these activities and the physical and/or human characteristics of two Island entities
• Ineffectively explains the relationship between economic activities and the physical and/or human characteristics of places, or
• Economic activities are identified but an explanation is missing

June 2012 Lesson Four: Projecting the Future This is an optional lesson, designed as an extension to take students beyond the benchmarks. It may be used for students who are ahead of others and/or may be given as extra credit.
Title of Unit: Pacific Places
Duration: Intended as home play.
Course/Grade: Pacific Island Studies/Grade 7
Goal(s): Students will identify their ideal place. They will describe factors that may contribute towards making it the ideal place and the measures that must be taken to sustain it as such.
Procedure/Activities
Resources/tools Assessment
Teacher directs students to refer to their Pacific Island matrix and think about their interests and the career they might like to have in ten years. They should consider what they know about the different locations shared in class and choose one location that best suits where they want to be in ten years. Student describes his/her ideal “place.” Using a Thinking Map, student identifies the characteristics that contribute towards and characterize his/her ideal place (eg, influences such as potential career choices, economic advantages, location, physical characteristics) and the benefits of living there.
Pacific Island matrix from Lesson 2. Attachment 4A: Thinking Map
Thinking Map – visualizing contributing factors and benefits
Students will write essays in which they project themselves into the future. Their essays should respond to the following: -What will my ideal place be like in ten years? -Would I like to live there? Why or why not? -What can I do now to make sure this is a place where I will want to live? How does/can a place shape my life? Student may use their thinking map to assist them in their reasoning.
Attachment 4B: Sample Rubric for Writing an Essay
Essay

June 2012
Attachment 4A Thinking Maps Thinking Maps are visual tools you can use to map your thoughts. Use them to help organize your thoughts. They are useful when taking notes, studying, brainstorming, or developing ideas.
http://www.scoe.org/files/AH_maps.pdf

June 2012
Attachment 4B Sample Rubric for Writing an Essay Pacific Island Studies - Geography (Places) Standard: Human and Physical Characteristics in Spatial Terms Benchmark (7PI.7.2): Describe demographic patterns and how they affect places.