revisiting valuation methods of tech companies: a case study of tesla · tesla’s business profile...
TRANSCRIPT

REVISITING VALUATION METHODS OF TECH COMPANIES:
A CASE STUDY OF TESLA
By
Dilshod Davronov
Submitted to Central European University
Department of Economics and Business
In partial fulfilment of the requirements for the degree of Master of Art in
Economic Policy in Global Markets
Supervisor: professor Peter Szilagyi
Budapest, Hungary
2019
CE
UeT
DC
olle
ctio
n
2
Executive Summary
The share price of Tesla, Inc., the world’s all-electric vehicle manufacturer, has increased by
roughly 19 times in value from its IPO on June 29, 2010 (with start price of $17 per share) to
December 31, 2018 ($318). The purpose of this thesis is to estimate the value of the
company’s stock as of December 31, 2018, determine if the market price is fairly valued and
also figure out the main drivers of such value.
In this thesis we analyse fundamental concepts of valuation and its importance. In addition,
the key valuation methods and, their advantages and drawbacks are also discussed. The thesis
moves on with the analysis of Tesla’s business profile and historical operational and financial
performance, as well as its comparison to key peer group companies. The industry outlook
and the market’s expectation on the future performance of Tesla are also reviewed through
industry reports by international agencies and equity research papers issued by global
investment banks and equity research firms.
Based on our findings from the above-mentioned analyses we forecast the future cash flow of
the company and carry out its valuation using three methods, followed by the discussions
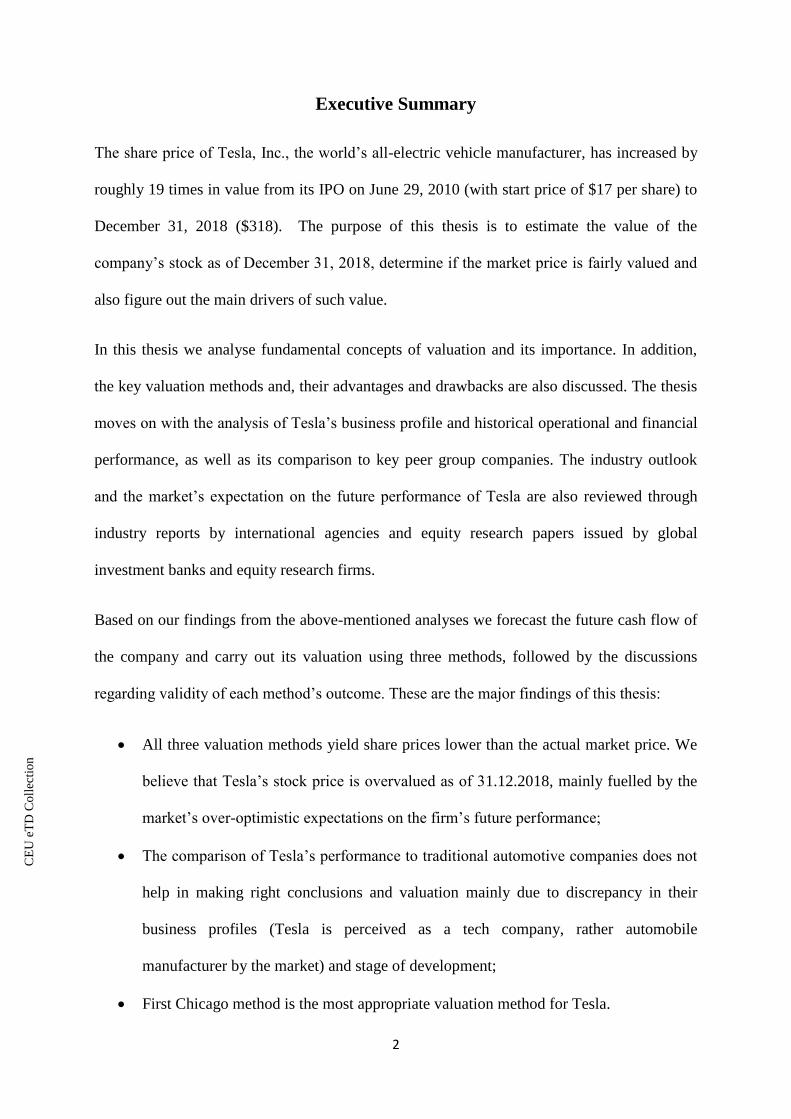
regarding validity of each method’s outcome. These are the major findings of this thesis:
All three valuation methods yield share prices lower than the actual market price. We
believe that Tesla’s stock price is overvalued as of 31.12.2018, mainly fuelled by the
market’s over-optimistic expectations on the firm’s future performance;
The comparison of Tesla’s performance to traditional automotive companies does not
help in making right conclusions and valuation mainly due to discrepancy in their
business profiles (Tesla is perceived as a tech company, rather automobile
manufacturer by the market) and stage of development;
First Chicago method is the most appropriate valuation method for Tesla.
CE
UeT
DC
olle
ctio
n

3
Table of Contents
Introduction ................................................................................................................................ 4
Chapter 1. Basic Concepts of Valuations ................................................................................... 5
1.1 Importance And Understanding of Valuation .................................................................. 5
1.2 Theoretical Overview Of Valuation Methods .................................................................. 7
1.2.1 Discounted Cash Flow Method .................................................................................. 8
1.2.2 Relative Valuation Method ...................................................................................... 11
1.2.3 First Chicago Method .............................................................................................. 13
Chapter 2. Introduction to Tesla ............................................................................................... 15
2.1 Tesla’s Business Description .......................................................................................... 15
2.2 Tesla’s Stock Price Performance Analysis ..................................................................... 18
2.3 Analysis of Financial Performance ................................................................................. 20
2.4 Peer Comparison Analysis.............................................................................................. 24
Chapter 3. Valuation Of Tesla .................................................................................................. 28
3.1 Discounted Cash Flow Model (DCF) ............................................................................. 28
3.1.1 WACC Calculation .................................................................................................. 29
3.1.2 DCF Model Projections Assumptions ..................................................................... 33
3.1.2 DCF Model Result ................................................................................................... 37
3.2 Relative Valuation .......................................................................................................... 39
3.3 First Chicago Method of Valuation ................................................................................ 43
Conclusion ................................................................................................................................ 45
Bibliography ............................................................................................................................. 46
Appendix .................................................................................................................................. 48
CE
UeT
DC
olle
ctio
n

4
Introduction
The valuation of tech and early stage growth companies has been a hot topic among experts in
finance industry and scholars for a while, and still remains as an interesting question. There
are a lot of discussions and disagreements on the most appropriate and universal method of
valuation for such companies that can estimate their true value as accurate as possible. Tesla
is one of such cases that has been the object of many discussions and researches in the last
several years. According to Cornell and Damodaran (2014), it is due to the difficulties in
measuring how market sentiment affects the firm’s stock price. The market sentiment is
investors’ expectations regarding the company’s future cash flows and risks that cannot be
justified by available data1.
In this thesis we give another try to valuation of Tesla and attempt to define the true value of
the company’s stock price. This is done by the review of certain valuation methods, analysis
of Tesla’s business profile and historical financial performance, and its comparison to the
selected group of peer companies, followed by valuations carried out using chosen methods
based on the above-mentioned analysis. One of the main outcomes of of the thesis is that
traditional methods of valuation are not good fit in case of Tesla and situation specific
approach is required for its valuation. Additionally, we also believe that the company’s stock
price is overvalued as of December 31, 2018, and the main reason for that is the over-
optimistic expectations of investors regarding the firm’s future growth perspectives.
The thesis consists of three chapters. The first chapter discusses basic concepts and
importance of valuation from theoretical perspective. The second chapter is an overview of
Tesla’s business profile and financial performance. The final chapter is an empirical one and
it includes valuation of Tesla using three methods.
1 M.Baker & J.Wurgler (2007), Investor sentiment in the stock market, Journal of Economic Perspectives, 21.
p.129-151
CE
UeT
DC
olle
ctio
n

5
Chapter 1. Basic Concepts of Valuations
1.1 Importance And Understanding of Valuation
Every asset, financial or non-financial, tangible or intangible, has a value and can be valued.
The valuation has been of a great importance in finance world for centuries. With the
development of financial systems, markets and its players, role of valuation has been growing
over time, as investors do not want to pay for an asset than its true value.
Valuation has different applications in a wide variety of areas, including, but not limited to,
the followings2:
Valuation in portfolio management: the use of valuation in portfolio management is
based on the investment philosophy of the investor(s). Different valuation methods are
used by portfolio managers for different purposes depending on their type of activity.
However, in general, investors try to include undervalued stocks in their portfolios
with hope that in long-term those stocks perform better and reach their true value, thus
create a wealth for their stock holders. However, we note that valuation methods are
used rarely by active portfolio managers (e.g. information traders) as their investment
horizon is normally very-short term and expectation on price/value movement is not
based on an invested firm’s growth perspectives, cash flow generation and etc.
Valuation in acquisition analysis: valuation plays an important role in acquisition
transactions as bidding party does the valuation of a target firm before making an
offer, meanwhile target party carries out valuation for itself before accepting or
rejecting the offer. Valuation in acquisition analysis has its own specific aspects such
as synergy. The target party should also count on the additional value creation as a
result of combination of firms due to the impact of synergy, which is normally quite
2 Aswath Damodaran (2012), Investment Valuation, p.8-10
CE
UeT
DC
olle
ctio
n

6
difficult to measure. Another compelling point about the valuation in acquisition
analysis is over-optimism bias by target firms.
Valuation in corporate finance: as known, maximizing the firm’s value is the main
objective of corporate finance. Hence, all financial decisions and corporate strategies
should be screened from the prism of valuation. Therefore, understanding the
relationship between corporate finance decisions (e.g. which source, debt or equity
capital, of funding capex creates more value) and valuation is of great importance.
As mentioned earlier, valuation has been the centre of attention in finance experts and
scholars and, especially, with the development/change of financial systems and markets,
as well as market players, its importance has kept growing. There have been a great
number of valuation methods developed to date. However, there still many disagreements
on which method is the best in estimating the true value of an asset and how long its takes
for asset prices to adjust to the true value, or if it does at all.
According to Damodaran (2012), there have been several myths identified over time
based on empirical analysis and observations regarding valuation that market players
often confuse3:
Myth 1. Quantitative valuation methods result in objective valuation. Despite the fact that
value is sometimes driven from quantitative analysis, the inputs and assumptions taken in
such quantitative methods are usually formed based on subjective judgements. Actually,
in many cases the valuation is biased by the actual market price from the very beginning
of the process.
Myth 2. A well-researched and well-done valuation is timeless. Any valuation is based on
market-wide and company-specific information. Thus, no matter how accurate the
valuation is, the value will change as soon as new information appears. Since at current
3 Aswath Damodaran (2012), Investment Valuation, p.6-7
CE
UeT
DC
olle
ctio
n

7
information-technology advanced times, new information reveals constantly and gets
reflected on prices quickly, the valuation get older very soon and should be updated
regularly.
Myth 3. The more quantitative a model, the more accurate the result. Complex models
usually comprise of higher number of inputs. Hence, the probability of error and biases
also increase accordingly. In fact, historically simpler models performed better than
complex ones.
Myth 4. The outcome of valuation is what matter; The process is not important. Many
analysts mainly focus on the outcome of the valuation, on if an asset is over- or under-
valued, and ignore the process itself. However, understanding the process inside out can
tell a lot about how the value is driven and what exactly is fuelling the price.
In general there are two contradictory believes regarding the valuations: one saying that
no model can estimate the value of an asset with 100% accuracy, however, well-done
valuation results in as accurate value as possible; the other says that the actual market
price is a true value and the discrepancy in the market price and the outcome of valuation
model is because of the drawbacks of the valuation methods.
1.2 Theoretical Overview Of Valuation Methods
As mentioned above there are a great number of valuation methods available for different
purposes and situations. In general they can be classified into two categories: classic (or
traditional) methods and situation specific methods (non-traditional)4:
4 Achleitner & Nathasius (2004), Venture Valuation, p.12.
CE
UeT
DC
olle
ctio
n

8
Figure 1.Simplified Charts of Valuation Methods
In this chapter we discuss some of the popular valuations methods and, especially, focus on
those that will be used by for Tesla’s valuation in later chapters.
1.2.1 Discounted Cash Flow Method
Discounted cash flow valuation has been one of the most popular and best methods for a long
time, according to Luehman (1997). Though other methods are being more frequently used
currently, DCF is believed to be the foundation for most of other methods. Therefore,
understanding the fundamentals of discounted cash flow model is very important for proper
application of other methods, as well.
As name speaks for itself, DCF methods tries to estimate the intrinsic value of an asset by
discounting its future cash flows. Here, being able to accurately predict the future cash flows
and applying a correct discount rate is of great significance.
CE
UeT
DC
olle
ctio
n
9
There are three ways of discounting cash flow valuations in general: valuing equity value of a
company, valuing the entire firm, i.e. enterprise value, and valuing a firm in pieces, i.e.
adjusted present value (valuing a company starting from its operations and adding the value
created by debt and other non-equity claims). The appropriate discount rate is defined based
on what is being valued.
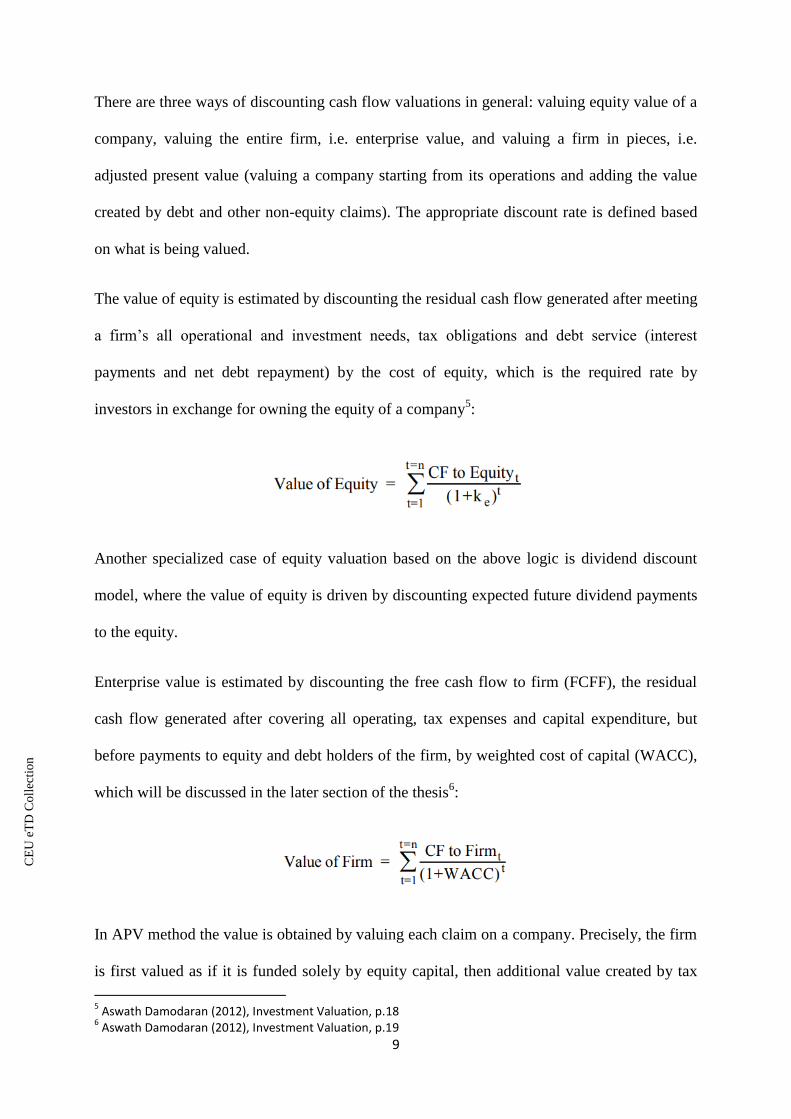
The value of equity is estimated by discounting the residual cash flow generated after meeting
a firm’s all operational and investment needs, tax obligations and debt service (interest
payments and net debt repayment) by the cost of equity, which is the required rate by
investors in exchange for owning the equity of a company5:
Another specialized case of equity valuation based on the above logic is dividend discount
model, where the value of equity is driven by discounting expected future dividend payments
to the equity.
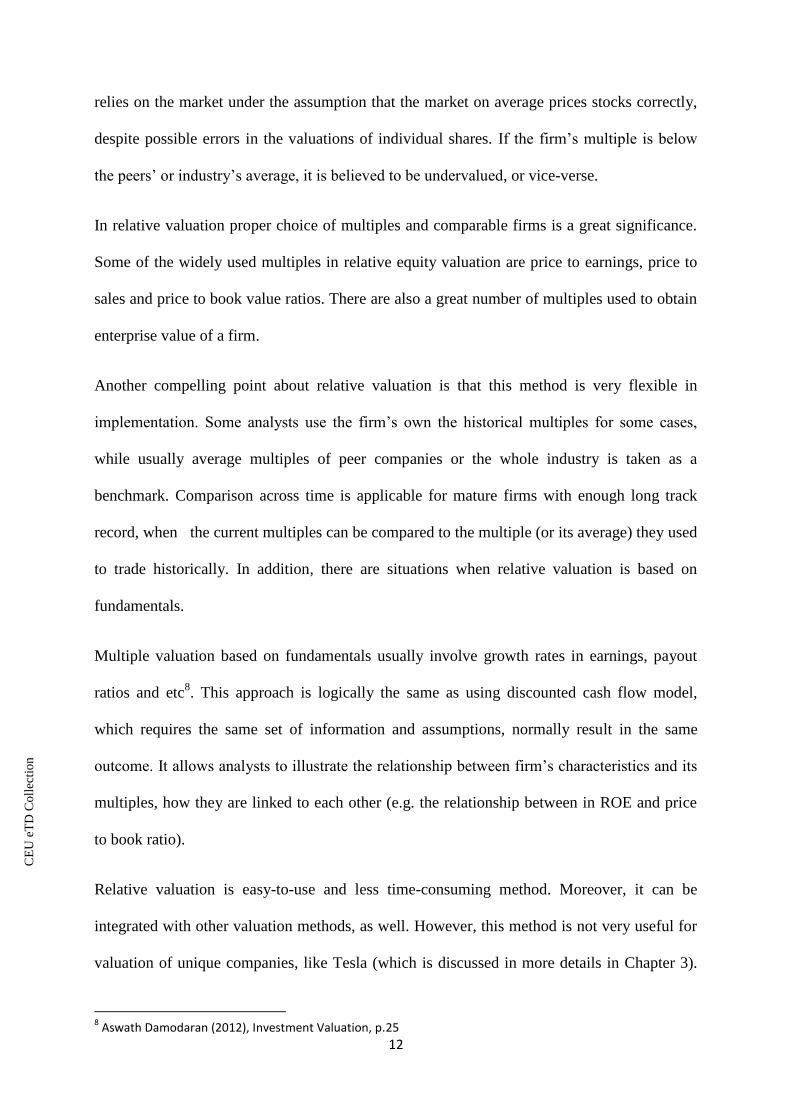
Enterprise value is estimated by discounting the free cash flow to firm (FCFF), the residual
cash flow generated after covering all operating, tax expenses and capital expenditure, but
before payments to equity and debt holders of the firm, by weighted cost of capital (WACC),
which will be discussed in the later section of the thesis6:
In APV method the value is obtained by valuing each claim on a company. Precisely, the firm
is first valued as if it is funded solely by equity capital, then additional value created by tax
5 Aswath Damodaran (2012), Investment Valuation, p.18
6 Aswath Damodaran (2012), Investment Valuation, p.19
CE
UeT
DC
olle
ctio
n

10
benefit of raising debt capital is added. In addition, assumed bankruptcy cost should be
deducted from the result.
Despite the fact that the above three methods use different discount rates, they should result in
consistent values as long as the same assumptions are used for the forecast of future cash
flows.
Discounted cash flow model can be used in cases when a firm is generating positive cash
flows currently and its future cash flow is predictable, as well as, appropriate risk proxy for
estimating discount rate is available. However, there are certain cases, where implementation
of DCF method is challenging. Below we count some of such situations:
Distressed firms: such firms usually generate negative cash flows and it is very
difficult to predict their future cash flows. In addition, discounted cash flow model is
build based on an assumption that the valued company is going concern, while
distressed firms have high probability of bankruptcy.
Cyclical firms: the performance of such firms tend to move in line with the
development of the economy, generating high cash flows during economic growth
period and, lower or negative cash flows during down-cycles. Hence, the forecast of
cyclical firms’ cash flows should be correlated by development of the economy and its
extent. Usually an analyst’s expectations on the evolution of the economy are biased,
which in turn gets reflected in the valuation.
Firms with un/underutilized assets: DCF model estimates the value of assets of a firm
that generate cash. If a company has unutilized or underutilized assets, which do
produce relatively low or no cash flow, then the value of such assets will be
CE
UeT
DC
olle
ctio
n

11
underestimated or ignored in the valuation process by the model. In such cases, the
value of unutilized assets are estimated separately and added to the result of the DCF
model.
Firms being restructured: such firms often dispose some of their assets, alter their
capital structure, change some financial strategy and policies (e.g. dividend policy,
cost structure and etc.) which in turn impact the company’s future cash flow
generation ability and riskiness. As a result, predicting future cash flows and defining
appropriate discount rate for such firms becomes challenging.
Acquisitive firms: forecasting future cash flow of such firms is difficult even in case
when the target firm and acquisition value are known, as it is hard to estimate
compatibility of those companies, as well as their potential synergies.
Private firms: the estimation of discount rate for such firms is challenging as the
measurement of risk usually requires estimations based on historical price data.
However, private firms are not traded, the risk parameters are measured by
benchmarking to similar public companies, which brings about some biases in
estimations.
1.2.2 Relative Valuation Method
Relative valuation is one of the most widely used valuation methods in the market7. This
method purports valuation of an asset based comparison to the prices of other similar assets.
The relative valuation is also called multiple valuation, since it often involves comparison of
the asset being valued and its benchmark group based on some multiples. One of the
implication of this method is valuation of a firm comparing its some ratios with the industry
averages. Unlike DCF which relied of a firm’s future cash flows, multiple valuation mostly
7 Aswath Damodaran (2012), Investment Valuation, p.25
CE
UeT
DC
olle
ctio
n
12
relies on the market under the assumption that the market on average prices stocks correctly,
despite possible errors in the valuations of individual shares. If the firm’s multiple is below
the peers’ or industry’s average, it is believed to be undervalued, or vice-verse.
In relative valuation proper choice of multiples and comparable firms is a great significance.
Some of the widely used multiples in relative equity valuation are price to earnings, price to
sales and price to book value ratios. There are also a great number of multiples used to obtain
enterprise value of a firm.
Another compelling point about relative valuation is that this method is very flexible in
implementation. Some analysts use the firm’s own the historical multiples for some cases,
while usually average multiples of peer companies or the whole industry is taken as a
benchmark. Comparison across time is applicable for mature firms with enough long track
record, when the current multiples can be compared to the multiple (or its average) they used
to trade historically. In addition, there are situations when relative valuation is based on
fundamentals.
Multiple valuation based on fundamentals usually involve growth rates in earnings, payout
ratios and etc8. This approach is logically the same as using discounted cash flow model,
which requires the same set of information and assumptions, normally result in the same
outcome. It allows analysts to illustrate the relationship between firm’s characteristics and its
multiples, how they are linked to each other (e.g. the relationship between in ROE and price
to book ratio).
Relative valuation is easy-to-use and less time-consuming method. Moreover, it can be
integrated with other valuation methods, as well. However, this method is not very useful for
valuation of unique companies, like Tesla (which is discussed in more details in Chapter 3).
8 Aswath Damodaran (2012), Investment Valuation, p.25
CE
UeT
DC
olle
ctio
n

13
Also, multiple valuation can be easily biased due to its simplicity. For example, an analyst can
form the peer group or choose ratios in a way to confirm its biased value perception regarding
the company being valued.
1.2.3 First Chicago Method
The above-mentioned valuation methods do not work well with early stage growth companies
or firms with a unique business profile due tot variety of factors, including, but not limited to
difficulty of predicting future cash flows, lack of historical data and absence of enough
comparable firms with similar characteristics. There are varieties of situation specific
valuation methods that are used in such cases. One of them is first Chicago method (FCM) of
valuation. This method is very popular among venture capital and private equity funds and
widely used to value early stage growth companies.
FCM combines the aspects of both fundamental analysis and market-oriented methods9. The
method usually requires creation of valuations in three scenarios (optimistic case, base case
and pessimistic case). An analyst builds separate forecasts for each scenario with different
assumptions. FCM requires detailed analysis of the industries current and past performance,
as well as future potentials. Based on these analyses, optimistic scenario is usually built based
on “winner takes all or most” philosophy.
Usually financial forecasts are done for explicit period using DCF method and terminal value
(or exit value as funds usually plan to sell the asset at higher price at some point) is estimated
using multiple valuation method. Unlike DCF model, in first Chicago model venture
capital/private equity fund use their own internal required rate, instead of WACC, as a
discount factor in many cases.
9 https://www.venionaire.com/first-chicago-method-valuation/
CE
UeT
DC
olle
ctio
n

14
Once the values of each scenario are obtained, the analyst assigns probabilities to each of
them based on his/her view on the expected occurrence of the cases. Obviously, prediction of
exact probabilities for each scenario is impossible. However, analysts try to base their
consensus on the extensive industry research, peer companies’ performances and etc. The sum
of probabilities should add up to one hundred percent.
Once the expected probabilities are defined, the weighted average value of each case’s
outcomes is calculated.
First Chicago method is relatively complex and requires additional efforts. However, it is
believed to be one of the best methods of valuation for tech companies at their early stage of
growth.
CE
UeT
DC
olle
ctio
n

15
Chapter 2. Introduction to Tesla
2.1 Tesla’s Business Description
Tesla Inc, established in July 2003, is the world’s first company solely specialized in
development, design, production and sale of all-electric vehicles. In addition, the company
also manufactures, installs and maintains solar and energy storage systems. Thus, Tesla
operates in two segments: i) automotive, and ii) energy generation and storage.
In automotive segment Tesla currently offers three models: the Model S sedan (introduced in
June 2012), the Model X sport utility vehicle (in September 2015) and the Model 3 sedan (in
July 2017), a budget-friendly vehicle for mass market. In addition, the company is planning to
commence the production of a new model, the Model Y, a compact crossover utility vehicle,
in late 2020/early 2021.
At the moment the company has only one fully operational manufacturing plant located in
California, the USA. The construction of another one, Gigafactory Shanghai, has started in
early 2019 in Shanghai, China. The factory will be specialized mainly in the production of
Model 3, a lower-priced model, for Chinese market and it is aimed to reach 500 thousand
vehicles per year production in five years once the manufacturing process fully ramped up.
Tesla has stepped in the growth phase of its business life cycle a few years ago with the
introduction of its new EV models, thus ramping up its revenue generation. However, the
company is still at its early stage with relatively high costs of production and cash burning
nature of its business, which is typical for such capital intensive companies.
During FY2018 Tesla delivered 245 thousand EVs, which is 138% higher as compared to 103
thousand deliveries in FY2017. The growth was mainly driven by the start of Model 3 sales
that accounted for 57% (or 140 thousand units) of the total sale volume. The company is
CE
UeT
DC
olle
ctio
n

16
forecasting to deliver from 360 thousand to 400 thousand units of EVs in 2019, or 45% to
65% higher sales, according to First Quarter 2019 Update published by Tesla10
.
Figure 2. Tesla’s quarterly vehicle production and delivery
Recent ramp-up in sales has also driven the company’s revenue in the last couple of years.
Tesla generated $21.5 billion of total revenue in FY2018, about 83% higher compared to
FY2017 revenue.
10
https://ir.tesla.com/static-files/b2218d34-fbee-4f1f-ac95-050eb29dd42f
CE
UeT
DC
olle
ctio
n

17
Figure 3. Tesla's revenue from FY2008 to FY2018 (in million U.S. dollar
Source: www.statista.com (https://www.statista.com/statistics/272120/revenue-of-tesla/
In addition to manufacture and sale of electric vehicles, Tesla has also established global
network of Supercharger stations, vehicle service centers, Mobile Service technicians and
body shops to support its existing and potential customers. As of March 31, 2019, the
company had approximately 1.5 million Supercharger stations installed in North America,
Europe and Asia, and the management is dedicated to significantly increase the number of
such stations in coming years to accelerate the adoption of its vehicles.
In energy generation and storage segment Tesla develops and sells energy storage hardware
and solutions for home use and commercial properties, such as Powerwall 2, a 14-kWh
rechargeable lithium-ion battery intended for storing energy at residential properties, and
Powerpack 2, a 210-kWh rechargeable lithium-ion battery designed for commercial facilities.
Both offer a functionality of being combined with renewable energy generation sources.
CE
UeT
DC
olle
ctio
n

18
In addition, the segment’s portfolio comprises of solar panels, inventers that convert the
electrical output from the panels to a usable current compatible with the electric grid, and
other functional hardware components. In 2016 the company introduced its Solar Roof system
that combines solar energy production with durable glass roofing tiles. The project is expected
to ramp up in the second half of 2019. Currently, energy generation and storage segment does
not have meaningful weight in Tesla’s overall operations with just 7% share in FY2018 total
revenue.
We note that despite the rapidly growing sales volume and revenue of the company, Tesla’s
production costs are still relatively high and its net income has not turned into positive yet
since the establishment of the company. One of the main reasons is the fact that Tesla
purchases majority of the components for its products from third-party vendors.
2.2 Tesla’s Stock Price Performance Analysis
Tesla’s stock price has shown a nineteen-fold increase since the IPO till December 31, 2018,
despite the fact that the firm has been generating negative cash flow and has paid no dividend
historically.
Analyzing the historical stock price movement and its drivers, we note that the main drivers
of such share price performance have been the market’s over-reaction to the new information
appeared in the market, rather than fundamental analysis. The first sharp increase in Tesla’s
stock price was observed during 2013, when the share price soared by about 570% increased
up to $193 from $34. It was driven by the company’s earnings releases, when it generated
very low, but positive earnings for the first time in its history beating the investors’
expectations, and the CEO’s tweets saying that Tesla became a profitable firm from that
time11
. However, it turned out to be wrong.
11
https://www.mercurynews.com/2013/04/01/2013-tesla-soars-to-all-time-high-after-ceo-says-company-is-now-profitable/
CE
UeT
DC
olle
ctio
n

19
Other share price spike events were mainly followed by the announcement of new EV models
and future projects in energy generation and storage segment that was supported by
speculative announcements of Elon Musk.
Figure 4. Tesla Stock Price Movement from January 2013 to December 2018
Source: Capital IQ
We compare the stock price performance of Tesla to the share price movement of its
automobile manufacturer peers and the industry index. As it can be seen from the blow graph,
Tesla largely outperformed its peers and the industry in general despite the fact has been
generating negative cash flow and producing significantly lower number of cars compared to
the peers.
CE
UeT
DC
olle
ctio
n

20
This situation once again proves that Tesla is not perceived as car producing company by the
market. Now we compare the firm’s stock price performance with the selected group of peers
from tech industry. As can been seen from the below chart, Tesla’s stock price moved
somewhat in line with the performance of tech companies’ share prices and industry index.
Figure 5. Tesla’s and Selected Tech Companies’ Stock Price Performance
2.3 Analysis of Financial Performance
Prior to moving to the forecast of Tesla’s cash flow for valuation purposes, we need to
analyse its current financial position and historical performance. The financial performance
analysis also gives us an idea about how the company created value for its shareholders and
how it has performed compared to peers. The below we provide brief analysis of the
company’s financial statements.
CE
UeT
DC
olle
ctio
n

21
Table 1. Tesla’s Income Statement, 2012-2018
Tesla’s revenue has been growing rapidly (CAGR of 93%) since FY2012 as the company’s
operations started ramping up with the introduction of new model. In addition, the growth was
supported by the installation of new Supercharge stations worldwide and establishment of
financial services offerings such as direct leasing and financial arrangement primarily in
cooperation with financial institutions. Solid revenue growth in FY2018 was due to the
introduction of Model 3, a budget-friendly model of the company, which became the best-
selling luxury car in the US in 2018. Tesla’s revenue growth is expected to slow down to low
double-digit rates from high double-digit rates in next few years due to absence of new
product offers (except Model Y) and high competition from increasing number of peers in EV
segment with lower priced models.
Income Statement, $m 2012 2013 2014 2015 2016 2017 2018
Total Revenue 413 2,013 3,198 4,046 7,000 11,759 21,461
Growth 387% 59% 27% 73% 68% 83%
COGS (383) (1,557) (2,317) (3,123) (5,401) (9,536) (17,419)
Gross Profit 30 456 882 924 1,599 2,222 4,042
Selling, General & Admin Expenses (122) (179) (372) (500) (463) (815) (947)
R&D Expenses (274) (232) (465) (718) (834) (1,378) (1,460)
EBITDA (365) 45 45 (294) 301 30 1,635
Depreciation & Amortization (29) (106) (232) (423) (947) (1,636) (1,888)
EBIT (394) (61) (187) (717) (646) (1,606) (253)
Net Interest Expense 0 (33) (100) (117) (183) (458) (629)
Other Expenses (2) (43) (198) (276) (284) (1,060) (1,381)
EBT (396) (71) (285) (876) (746) (2,209) (1,005)
Tax Expense (0) (3) (9) (13) (27) (32) (58)
Net Income (396) (74) (294) (889) (773) (2,241) (1,063)
Common-Size Income Statement 2012 2013 2014 2015 2016 2017 2018
Total Revenue 100% 100% 100% 100% 100% 100% 100%
COGS (93%) (77%) (72%) (77%) (77%) (81%) (81%)
Gross Profit 7% 23% 28% 23% 23% 19% 19%
Selling, General & Admin Expenses (29%) (9%) (12%) (12%) (7%) (7%) (4%)
R&D Expenses (66%) (12%) (15%) (18%) (12%) (12%) (7%)
EBITDA (88%) 2% 1% (7%) 4% 0% 8%
Depreciation & Amortization (7%) (5%) (7%) (10%) (14%) (14%) (9%)
EBIT (95%) (3%) (6%) (18%) (9%) (14%) (1%)
EBT (96%) (4%) (9%) (22%) (11%) (19%) (5%)
Net Income (96%) (4%) (9%) (22%) (11%) (19%) (5%)
Source: Capital IQ
CE
UeT
DC
olle
ctio
n

22
Despite the increase in the scale of sales in the last several years, the company’s cost structure
and profit margins have not improved much, and has remained somewhat instable. It can be
explained by the fact Tesla purchases majority of component parts for it vehicles from third-
party suppliers which makes the cost of production higher and more sensible to changes in
market prices for such parts. On the other side, the company’s fixed costs (with elements of
variable costs) such as SG&A and R&D has decreased as a % of revenue over the last several
years. Subsequently, Tesla has been generating negative net income since its inception.
Table 2. Tesla’s Balance Sheet, 2012-2018
Tesla’s balance sheet has been increasing rapidly in line with the business development.
PP&E accounts for majority of the company’s assets (66% in FYE2018). Tesla’s assets are
mainly (79% in FYE2018) financed by liabilities leading to high debt-to-equity ratio of 3.7x.
Balance Sheet, $m 2012 2013 2014 2015 2016 2017 2018
Cash&Cash Equivalents 202 846 1,906 1,197 3,393 3,368 3,686
Accounts Receivable 27 49 227 169 499 515 949
Inventory 269 340 954 1,278 2,067 2,264 3,113
Other Current Assets 28 31 94 138 300 424 558
Total Current Assets 525 1,266 3,180 2,782 6,260 6,571 8,306
PP&E 562 1,121 2,596 5,195 15,037 20,492 19,691
Other Non-Current Assets 27 30 55 91 1,367 1,593 1,742
Total Non-Current Assets 589 1,151 2,651 5,286 16,404 22,085 21,433
Total Assets 1,114 2,417 5,831 8,068 22,664 28,655 29,740
Accounts Payable 303 304 778 916 1,860 2,390 3,404
Other Current Liabilities 236 371 1,387 1,942 3,975 5,284 6,588
Total Current Liabilities 539 675 2,165 2,858 5,836 7,675 9,992
LT Debt (excl. ST portion) 411 599 1,850 2,222 7,377 11,152 11,116
Other Non-Current Liabilities 39 476 903 1,903 3,546 4,196 2,318
Total Non-Current Liabilities 450 1,075 2,754 4,126 10,923 15,348 13,434
Total Liabilities 989 1,750 4,919 6,984 16,759 23,023 23,426
Total Equity 125 667 912 1,084 5,905 5,632 6,314
Balance Sheet Key Ratios 2012 2013 2014 2015 2016 2017 2018
Current Ratio 1.0x 1.9x 1.5x 1.0x 1.1x 0.9x 0.8x
Quick Ratio 0.5x 1.4x 1.0x 0.5x 0.7x 0.6x 0.5x
Net Total Debt/EBITDA (0.7x) (5.3x) 14.0x (5.8x) 17.2x 294.9x 6.2x
Debt-to-Equity Ratio 7.9x 2.6x 5.4x 6.4x 2.8x 4.1x 3.7x
DSO 16 7 16 18 17 16 12
DIO 152 71 102 130 113 83 56
DPO 109 68 67 90 82 80 58
CCC 59 10 50 59 49 19 11
CE
UeT
DC
olle
ctio
n

23
However, we note that this level debt-to-equity ratio is typical for automotive industry (see
peer comparison section for details).
The company’s balance sheet is relatively illiquid, that being said Tesla’s ability to meet
obligations is limited. Especially, its short-term liquidity position has worsened in recent
years with current and quick ratios having declined to 0.8x and 0.5x in FYE2018 from 1.5x
and 1.0x in FYE2014, respectively. However, Tesla’s working capital management has
meaning fully improved in the last couple of years, due to ramp-up of sales, bringing about
decline in cash conversation cycle from 11 days in FY2018 from 49 days in FY2016.
We note that low liquidity and high leverage profile of Tesla’s balance sheet may result in
difficulties with raising additional debt capital and have a negative impact on its share price in
near future.
Table 3. Tesla’s Cash Flow Statement
Tesla’s cash flow generation has been negative historically as the company is at its early stage
of development and performs in capital intensive industry. Even cash flow from operations
has been negative until 2018, mainly due to high cost of production. In addition, Tesla has
generated negative cash flow to firm (FCFF) every year, except 2016, during the period of
2012-2018, as a result of high production cost and capital expenditures. That being said the
company has not been able to generate extra cash by itself for debt service and shareholder
Cash Flow Statement, $m 2012 2013 2014 2015 2016 2017 2018
Funds from Operations (309) 116 200 (31) 570 436 2,040
Change in NWC 45 149 (257) (493) (694) (497) 58
Cash from Operating Activities (264) 265 (57) (525) (124) (61) 2,098
Cash from Investing Activities (207) (249) (990) (1,674) (1,081) (4,196) (2,337)
Cash from Financing Activities 420 635 2,143 1,524 3,744 4,415 574
Impact of FX Rate Change (2) (7) (36) (34) (7) 40 (23)
Net Change in Cash (53) 644 1,060 (709) 2,532 198 311
Cash BoP 255 202 846 1,906 1,197 3,393 3,368
Cash EoP 202 846 1,906 1,197 3,393 3,368 3,686
FCFF (336) (27) (745) (1,066) 599 (1,248) (674)
Source: Capital IQ
CE
UeT
DC
olle
ctio
n

24
compensation. Contrary, Tesla has been funding its expansion via equity and debt capital. The
company’s FCFF is expected to turn into positive starting from 2020.
2.4 Peer Comparison Analysis
We have analysed the financial performance of Tesla in the last several years. However, it is
difficult to see the full picture of the company’s financial position just by analysing its current
and historical performance on a standalone basis. Comparison with the selected group of
peers in the same industry provides more clear idea on the financial health of the firm.
In this section we compare Tesla’s key financial metrics in FY2018 with its peers that consist
of the largest global automakers. All of these companies have relatively mature business.
Another compelling point is that all of these firms, possessing extensive industry experience
and in-house know-how as well as financial resource, are engaged in the production of
electric vehicles and expected to ramp-up their EV production, thus representing significantly
increased competition in this segment of the market.
The below table represents the key financials of Tesla and its selected peers that enables us to
conduct comparison analysis of their revenue generation, profit margins, cash generation
ability, as well as leverage and liquidity positions. Summary of these analysis will later be
used in relative valuation of Tesla in the following section of the thesis.
CE
UeT
DC
olle
ctio
n

25
Table 3. Key Financial Metrics of Tesla and Selected Group of Peers, FY2018
Despite the fact that Tesla has the lowest revenue among the peers, its enterprise value is
relatively high, yielding Revenue/EV ratio of 0.3x, or generating 0.3 dollar cents per dollar of
enterprise value, while the average of peers stand at 1.4x (or medium of 1.0x).
The company’s gross margin is higher than its US peers and roughly in line with European
and Asian peers. GM and Ford report all production expenses (both variable and fixed costs)
under COGS, while Tesla and Asian peers mainly refer to cost of materials (mainly variable
costs). In the annual reports the American peers state that material costs account roughly two
third of COGS. However, their adjusted (out for fixed costs) gross margins are still lower than
Tesla that can be explained by Tesla’s more centralized manufacturing and ability to sell its
products at relatively high price due to uniqueness and currently low competition. Asian peers
have lower material and labour costs that enable them to yield higher profit margins.
Key Financial Metrics Tesla Ford GM Audi Daimler Nissan Toyota BMW
Market Capital (31.12.2018) 57,153 30,431 47,212 37,308 54,774 31,203 166,058 51,228
Enterprice Value (31.12.2018) 69,094 160,385 133,728 17,538 190,148 96,303 308,499 145,482
Total Revenue 21,461 160,338 147,049 66,073 186,642 108,307 266,251 108,710
Gross Profit 4,042 14,879 14,278 10,749 34,442 19,368 49,756 19,062
EBITDA 1,635 12,727 11,908 8,497 15,804 8,738 37,463 14,033
Net Income (976) 3,677 8,014 3,772 8,084 6,769 22,602 7,937
Total Assets 29,740 256,540 227,339 73,155 314,062 169,894 455,918 233,055
Total Liabilities 23,426 220,474 184,562 40,036 240,399 118,339 279,833 168,275
Total Equity 6,314 36,066 42,777 33,119 73,662 51,554 176,085 64,780
Total Net Debt 10,142 154,213 104,951 476 161,595 70,129 177,091 113,663
Cash from Operating Activities 2,098 15,022 15,256 7,821 383 9,708 38,153 5,633
Cash from Investing Activities (2,337) (16,261) (20,763) (7,995) (11,064) (10,401) (33,170) (8,211)
Cash from Financing Activities 574 (122) 11,454 (2,859) 14,750 334 (4,070) 4,791
Net Change in Cash 311 (1,731) 5,648 (3,017) 4,217 (318) 518 2,163
FCFF (674) 4,187 (5,068) 1,150 (156) (10,476) 194 (4,566)
Revenue/EV 0.3x 1.0x 1.1x 3.8x 1.0x 1.1x 0.9x 0.7x
Gross Margin 18.8% 9.3% 9.7% 16.3% 18.5% 17.9% 18.7% 17.5%
EBITDA Margin 7.6% 7.9% 8.1% 12.9% 8.5% 8.1% 14.1% 12.9%
Net Income Margin (4.5%) 2.3% 5.4% 5.7% 4.3% 6.2% 8.5% 7.3%
Dilluted EPS (5.72) 0.92 5.53 87.7 7.56 1.73 7.55 12.07
Payout Ratio 0.0% 73.6% 28.0% 71.1% 53.9% 26.5% 25.1% 37.0%
Net Debt/EBITDA 6.2x 12.1x 8.8x 0.1x 10.2x 8.0x 4.7x 8.1x
EBITDA/Interest Expense 2.5x 10.4x 18.2x 112.0x 21.6x 76.1x 149.9x 40.6x
Debt-to-Equity Ratio 3.7x 6.1x 4.3x 1.2x 3.3x 2.3x 1.6x 2.6x
Current Ratio 0.8x 1.2x 0.9x 1.6x 1.2x 1.7x 1.0x 1.2x
Quick Ratio 0.5x 1.0x 0.7x 1.1x 0.9x 1.4x 0.8x 0.8x
CCC 11 ( 11) ( 19) 42 77 12 27 41
Source: Capital IQ
CE
UeT
DC
olle
ctio
n

26
On the other side, Tesla’s net income margin has historically been negative and meaningfully
lower than peers level because of its higher SG&A and R&D expenditures that is attributable
to high-tech business model and early stage of development of the firm. Subsequently, the
company’s EPS is also negative. Unlike its peers, Tesla has not paid dividends historically,
that being said the only source of return for equity investors of the company has been share
price growth (capital gain).
The company’s cash flow generation has starting stabilizing with the ramp-up of sales
recently. However, it is more sensible to the firm’s future growth compared to the peers’
ability to generate cash.
Leverage and short term liquidity profile of Tesla are within the peer average currently.
However, given significantly smaller size of the firm, this level is considered to be high.
Especially, the company’s long term liquidity position is not as stable as the peers’ liquidity,
which also reflected in its credit rating. We will compare their credit ratings in the following
section while calculation WACC.
In general Tesla’s ability to create value for shareholders is meaningfully worse compared to
the peer group. It also reflected in the company’s return in invested capital (ROIC), one of the
important indicators of a firm that measures how much return investors in a company are
earning from their investments, or how effectively the invested funds are being utilized by a
firm. In other words, this ratio demonstrates if (how much) excess return is being generated
above its debt and equity capital costs. ROIC is calculated by using the below formula:
𝑅𝑂𝐼𝐶 = 𝑁𝑒𝑡 𝑂𝑝𝑒𝑟𝑎𝑡𝑖𝑛𝑔 𝑃𝑟𝑜𝑓𝑖𝑡 𝐴𝑓𝑡𝑒𝑟 𝑇𝑎𝑥 (𝑁𝑂𝑃𝐴𝑇)
𝐼𝑛𝑣𝑒𝑠𝑡𝑒𝑑 𝐶𝑎𝑝𝑖𝑡𝑎𝑙
Normally, companies with ROIC of above 2% are considered to be value creators, while
value destroyers are defined by ROIC of less than 2%. As can be seen from the below figure,
CE
UeT
DC
olle
ctio
n

27
Tesla has historically had negative and somewhat fluctuating ROIC. However, it improved
(became less negative) in 2018 due to the ramp-up of sales. The company’s ROIC is expected
to keep improving in line with its high revenue growth and lowering cost of revenue, which
is, on the other side, subject to its WACC change.
Figure 6. Historical ROIC of Tesla and its peers, 2013-2018
Despite negative ROIC, Tesla’s share price has been increasing in value and is more
expensive compared to its peers with positive ROIC. It can be explained by the market’s quite
optimistic expectations regarding the firm’s future performance.
CE
UeT
DC
olle
ctio
n
28
Chapter 3. Valuation Of Tesla
In this chapter we estimate fundamental value of Tesla’s share price as of 31.12.2018 and
compare it to the market price in order to analyse how much the market price is justified,
and/or figure out what is the rationale behind the discrepancy in the prices, if any. As
mentioned earlier, we use three equity valuation methods to obtain Tesla’s share price. The
two of these methods (discounted cash flow model and relative/multiple valuation) are
traditional and most popular methods used by majority of the market participants, while the
third method (first Chicago method) is non-traditional one used widely by venture capitals to
value private equity and early stage high-growth companies. Theoretical background of the
first two methods is discussed in the first chapter of the thesis. We decided not to use
economic value added (EVA) method of equity valuation, as it would yield almost the same
result due to the fact that we would have to use the same inputs and assumptions as in the
DCF.
3.1 Discounted Cash Flow Model (DCF)
As stock value is a forward-looking measure and driven by the company’s future earnings,
most valuation methods, including DCF model, are based on a company’s future cash flows.
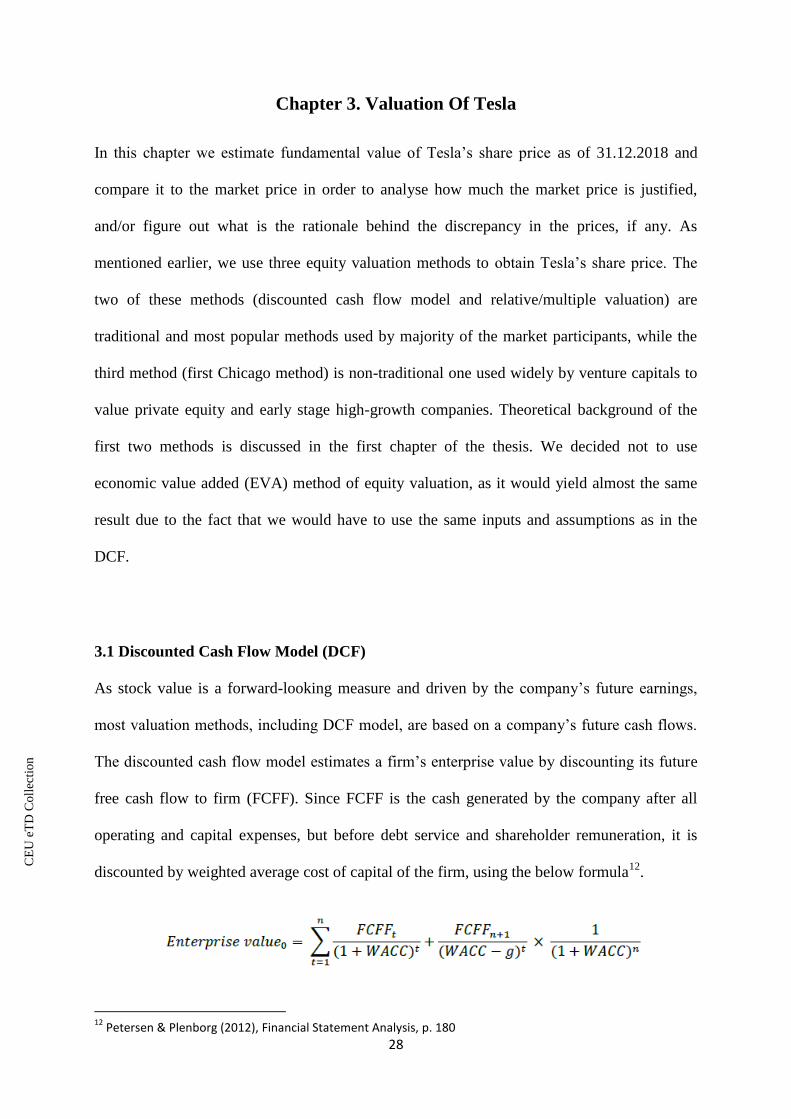
The discounted cash flow model estimates a firm’s enterprise value by discounting its future
free cash flow to firm (FCFF). Since FCFF is the cash generated by the company after all
operating and capital expenses, but before debt service and shareholder remuneration, it is
discounted by weighted average cost of capital of the firm, using the below formula12
.
12
Petersen & Plenborg (2012), Financial Statement Analysis, p. 180
CE
UeT
DC
olle
ctio
n

29
As a firm’s future cash flow is uncertain, the DCF model requires projections of future cash
flows based on assumptions reflecting wide variety of analysis starting from market’s
expectations, corresponding industry outlook, to pure company specific analysis.
3.1.1 WACC Calculation
The weighted average cost of capital reflects debt and equity investors’ expected
compensation for the time value of money and variety of risks attributable to the
corresponding asset13
. WACC is calculated using the below formula:
From this point we start calculating each component of WACC.
The cost of equity (Re), is equity investors’ required return on a share as a compensation for
bearing certain risks by owning this asset and giving up an alternative investment options. We
calculate the cost of equity based on the CAPM-model14
, which is one of the widely used
models that reflects the relationship between equity’s return and market risk, as well as the
equity-specific risks such as liquidity. The below table illustrates the result of our CAPM
calculation:
Table 7. Cost of Equity Calculation
13
Petersen & Plenborg (2012), Financial Statement Analysis, p. 245 14
𝑅𝑒 = 𝑅𝑓 + 𝛽 × (𝑅𝑚 − 𝑅𝑓)
Cost of Equity (CAPM) as of 31.12.2018
Risk Free Rate 2.67%
Beta 0.45
Expected Market Return 10.71%
Other Risk Premiums 2.0%
CAPM 8.31%
CE
UeT
DC
olle
ctio
n
30
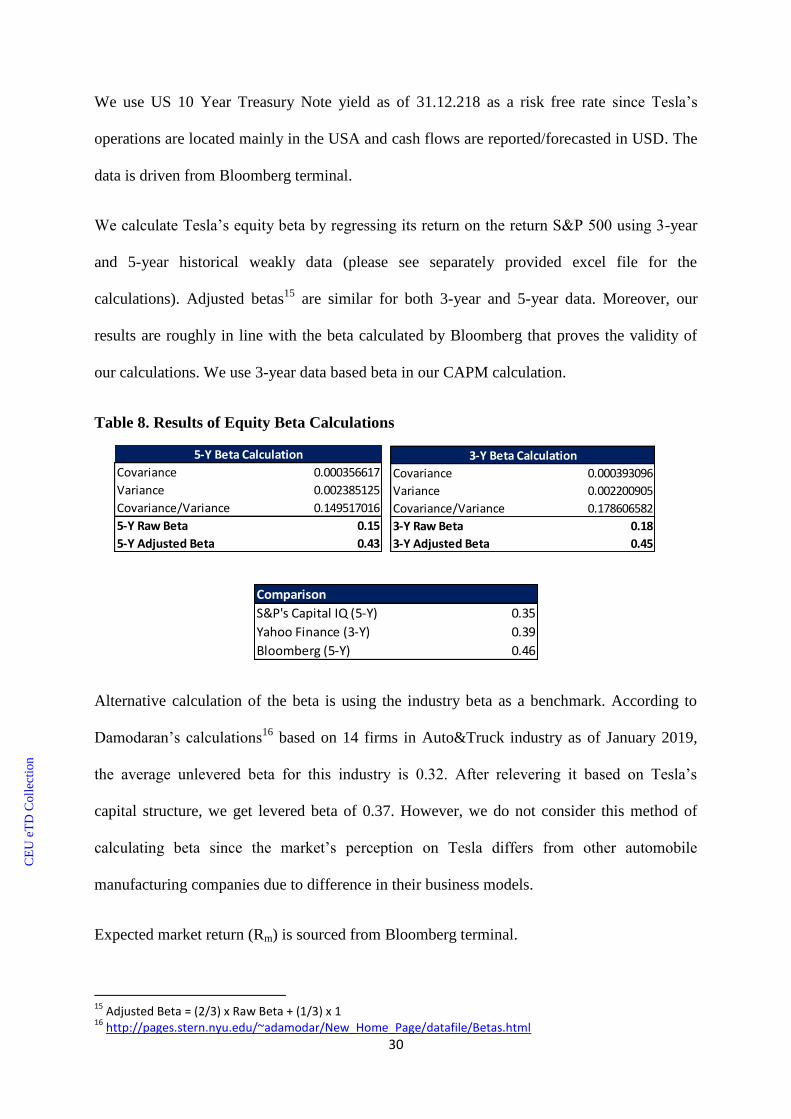
We use US 10 Year Treasury Note yield as of 31.12.218 as a risk free rate since Tesla’s
operations are located mainly in the USA and cash flows are reported/forecasted in USD. The
data is driven from Bloomberg terminal.
We calculate Tesla’s equity beta by regressing its return on the return S&P 500 using 3-year
and 5-year historical weakly data (please see separately provided excel file for the
calculations). Adjusted betas15
are similar for both 3-year and 5-year data. Moreover, our
results are roughly in line with the beta calculated by Bloomberg that proves the validity of
our calculations. We use 3-year data based beta in our CAPM calculation.
Table 8. Results of Equity Beta Calculations
Alternative calculation of the beta is using the industry beta as a benchmark. According to
Damodaran’s calculations16
based on 14 firms in Auto&Truck industry as of January 2019,
the average unlevered beta for this industry is 0.32. After relevering it based on Tesla’s
capital structure, we get levered beta of 0.37. However, we do not consider this method of
calculating beta since the market’s perception on Tesla differs from other automobile
manufacturing companies due to difference in their business models.
Expected market return (Rm) is sourced from Bloomberg terminal.
15
Adjusted Beta = (2/3) x Raw Beta + (1/3) x 1 16
http://pages.stern.nyu.edu/~adamodar/New_Home_Page/datafile/Betas.html
Covariance 0.000356617
Variance 0.002385125
Covariance/Variance 0.149517016
5-Y Raw Beta 0.15
5-Y Adjusted Beta 0.43
5-Y Beta Calculation
Covariance 0.000393096
Variance 0.002200905
Covariance/Variance 0.178606582
3-Y Raw Beta 0.18
3-Y Adjusted Beta 0.45
3-Y Beta Calculation
Comparison
S&P's Capital IQ (5-Y) 0.35
Yahoo Finance (3-Y) 0.39
Bloomberg (5-Y) 0.46
CE
UeT
DC
olle
ctio
n

31
We also apply 2.0% “other risk premium” that reflects our view on Tesla’s liquidity, survival
and country (i.e. opening a new manufacturing factory in China) risks.
Our CAPM model results 8.31% cost of equity.
The cost of debt (Rd), is the required rate of return by debt investors for providing funds to a
firm. The rate reflects the firm’s operational and financials risks and therefore requires a
premium over risk free rate. Thus, cost of debt can be calculated by applied credit risk spread
above risk free rate based on a firm’s credit rating/health. Currently, Tesla is rated at B- and
B3 by S&P and Moody’s, respectively, with a negative outlook from the both agencies. The
company’s credit rating is significantly lower compared to the ratings of its peers in the
respective industry.
Table 9. Credit Ratings of Tesla and Its Peers from Automotive Industry
Damodaran suggests to apply a credit spread of 6.60% for large manufacturing firms (with
market capital of above $5bn) in developed markets with B-/B3 credit rating17
. It yields the
cost of debt of 9.27% after adjusting for risk free rate, which is meaningfully higher than
Tesla’s historical cost of debt.
17
http://pages.stern.nyu.edu/~adamodar/New_Home_Page/datafile/ratings.htm
Credit Ratings S&P Moody's
Tesla Motor B-/Negative B3/Negative
Ford Motor Company BBB/Negative Baa3/Negative
Peugeot S.A. BBB-/Stable Baa3/Stable
General Motors Company BBB/Stable Baa3/Stable
BAIC Motor Corporation Limited NR NR
AUDI AG BBB+/Stable A3/Stable
Hyundai Motor Company BBB+/Stable Baa1/Negative
Daimler AG A/Stable A2/Stable
Honda Motor Co., Ltd. A/Stable A2/Stable
Nissan Motor Co., Ltd. A-/Stable A2/Stable
Bayerische Motoren Werke (BWM) A+/Stable A1/Stable
Sources: www.standardandpoors.com and www.moodys.com
CE
UeT
DC
olle
ctio
n

32
Tesla’s lower cost of debt can be explained by the fact that the company uses a wide variety
of debts, starting from bank loans, convertible and non-convertible bonds, to asset backed
debt securities (e.g. Solar Bonds). We believe that the company keeps maintaining such a
complex debt portfolio going forward. Therefore, we use the average of the company’s
historical cost of debt for the last two years, rather than using the first-mentioned method (i.e.
credit spread plus risk free rate).
Corporate tax rate (Tc) in the USA is 21.0% and no changes are expected for the short-to-
medium term perspective. Effective tax rates may differ from the standalone rate due to many
reasons. According to the Reuters18
, the effective tax rate in the industry where Tesla operates
is 20.9%, which in line with the above-mentioned rate. We use 21.0% tax rate for Tesla in our
WACC calculation and DCF model projections.
Tesla’s capital structure has been dominated by equity capital (83% share in total capital in
2018) historically.
Table 10. Tesla’s Capital Structure
Meanwhile, the capital structure of the company’s peers somewhat evenly distributed with a
slight higher share of debt capital. However, we do not expect the share of debt to increase
meaningfully increase in Tesla’s capital structure due to the company’s relatively poor access
18
https://www.reuters.com/finance/stocks/financial-highlights/TSLA.OQ
Tesla's Historical Cost of Debt
Interest Expense/Total Debt in 2018 4.6%
Interest Expense/Total Debt in 2017 5.5%
Average 5.1%
Capital Structure as of 31.12.2018 Share in TC as of 31.12.2017 Share in TC
MV of Equity (Market Cap) 57,442 83% 59,805 85%
MV of Debt 11971 17% 10,315 15%
Total Capital 69,414 100% 70,120 100%
Source: Compiled by author based on the company's financial reports
CE
UeT
DC
olle
ctio
n

33
to debt market (as a result of low credit rating) and long-term liquidity position. Therefore, in
our WACC calculation we use 75%:25% (debt:equity) long term capital structure.
Table 11. Capital Structure of Tesla’s Peers in Automotive Industry
Based on the below calculations and analysis, now we can calculate the weighted cost of
capital for Tesla, which yields the rate of 7.2%, as shown in the below summary table.
Table 12. Result of WACC Calculation.
3.1.2 DCF Model Projections Assumptions
DCF model requires projection of a company’s future cash flows, which, in turn, the result of
operating and investing activities of the firm, being valued. Our projections are based on
analysis of Tesla’s future plans, industry outlook, expectations of some market players and
etc. Our assumptions are also reflect the view of rating agencies’, global international banks,
Mar.Cap Total Debt Mar.Cap Total Debt
Ford Motor Company 30,431 154,213 16% 84%
Peugeot S.A. 18,668 8,699 68% 32%
General Motors Company 47,212 104,951 31% 69%
BAIC Motor Corporation Limited 4,218 3,518 55% 45%
AUDI AG 37,488 479 99% 1%
Hyundai Motor Company 21,627 62,634 26% 74%
Daimler AG 55,038 162,373 25% 75%
Honda Motor Co., Ltd. 46,237 61,725 43% 57%
Nissan Motor Co., Ltd. 31,258 70,253 31% 69%
Bayerische Motoren Werke (BWM) 51,475 114,211 31% 69%
Average 42% 58%
Median 31% 69%
*as of 31.12.2018
Source: Capital IQ data
PeersValue* Share
WACC Calculation as of 31.12.2018
Long-Term MV of Equity/MV of Total Capital 75%
Cost of Equity 8.3%
Cost of Debt 5.1%
Corporate Tax Rate 21.0%
WACC 7.2%
CE
UeT
DC
olle
ctio
n

34
as well as equity research firms that has an extensive expertise both in valuation and
respective industry. Our projections are divided into three periods: explicit projection period –
2019-2024, fade period – 2025-2029, terminal period – from 2030 to eternity. Below we
provide a brief description of our assumptions for key financial metrics of Tesla:
Revenue: Tesla’s revenue growth is expected to slow down in coming years, despite
the higher growth in the sales volume, however, remain at double digit rate. The
anticipated deceleration is justified by i)increase share of budget-friendly vehicles that
cost twice as low as the premium class cars of the company, and ii) increased
competition in the market, both in low end and high end segments.
Profit margins: The gross margin is expected to improve moderately over the next
several years (from 23% in 2019 to 28% in 2024) as a result of decreased COGS as %
of revenue driven by positive impact of economies of scale, as well as localization of
some spare parts production that are currently purchased from third-party vendors.
The company’s EBITDA margin is projected to show even faster improvement due to
expected decline in SG&A and R&D expenses as % of revenue.
Tax expenses: Tax expenses are projected under the assumption that effective tax rate
will be consistent with US corporate income tax rate (21%).
Net income: As a result of the above, Tesla’s net income is expected to turn into
positive starting from 2020.
Operating assets: The company’s accounts receivable, accounts payable and
inventories are projected under the assumption that days of sales, inventories and
payables outstanding will remain at 2018 level on average throughout the projection
period.
CE
UeT
DC
olle
ctio
n

35
Depreciation and amortization: D&A is projected under the assumption that
D&A/Fixed asset ratio will remain roughly flat at the level of the average of the last
three years.
Capital expenditures: we expect Tesla to spend higher capex in coming years driven
by i) the new manufacturing plant projects in China and Europe, ii) expansion of
Supercharger stations network globally and iii) other several projects in energy
generation and storage segment. Despite the higher capex projections in absolute
terms, the Capex/Revenue ratio is anticipated to remain roughly in line with 2018
level during 2019-2020 and start declining very smoothly thereafter (from 14% in
2019 to 12% in 2024).
Equity issuance: We project $1.0bn equity issuance each year for 2019-2024 period
which is consistent with the issuance in the last two years.
Dividend payments: We project zero dividend payments for 2019-2024 period as the
company’s net income and free cash flow to equity will still likely be very low.
Debt repayment/issuance: Tesla’s debt repayment projections are based on maturity
schedule of the currently outstanding debt. We project additional debt capital issuance
based on the company’s liquidity needs to cover its working capital needs, capital
expenditures and service of maturing debt, after cash generated from operations and
net equity capital issuance.
Interest expenses: Interest expenses are projected under the assumption that the
current cost of debt will remain unchanged on average during the projection period.
We build all three financial statements of Tesla for the explicit projection period (2019-
2024) based on the above discussed assumptions. Then, FCFF is calculated based on the
CE
UeT
DC
olle
ctio
n
36
financials for explicit projection period. For face and terminal periods we project only
FCFF.
We expect the company’s FCFF to grow at 5% rate during the fade period (2025-2029)
which, in our view, is stable rate of growth, but lower than growth rates in the earlier
periods. It reflects our view (based on market research) that EV market will be highly
competitive with the start of mass EV productions by big players and “aggressive”
Chinese low-cost automobile manufacturers.
For terminal (long-term) period we assume growth rate of 3.0%. According to HIS
Markit19
, global light vehicle production will grow at 1.5%-2.0% (0% in North America)
rate annually in 2019-2026 period. Asia-Pacific region is anticipated to be the main driver
of the growth. Global light vehicle industry is projected to see zero growth in the period
after 2026. However, electric vehicle segment of the industry will most likely keep
growing as its share in total automobile production is expected to increase. Hence,
considering the EV sub-segment outlook and Tesla’s being a pioneer in the sector, we
consider 3% of growth rate to be an appropriate long-term (terminal) growth rate for our
DCF model.
19
“Automotive Industry Outlook: Managing Volatility and Leveraging Opportunities in a Dynamic Market Environment”, a report by IHS Markit dated February 2019.
CE
UeT
DC
olle
ctio
n

37
3.1.2 DCF Model Result
Table 13. Summary of DCF Model Result
Model Summary
$m 2018A 2019F 2020F 2021F 2022F 2023F 2024F LT1 V in 2024 TV in 2024 TV in 2030
Revenue 21,461 25,128 30,451 33,696 37,065 40,772 44,849
EBITDA 1,648 1,633 2,885 3,912 5,139 6,322 7,652
D&A (1,901) (1,823) (2,088) (2,404) (2,712) (3,012) (3,305)
EBIT (253) (190) 797 1,509 2,427 3,311 4,346
Tax (58) 142 (45) (185) (388) (577) (797)
NOPAT (311) (49) 752 1,324 2,039 2,733 3,549
D&A 1,901 1,823 2,088 2,404 2,712 3,012 3,305
CAPEX (3,133) (3,518) (4,111) (4,380) (4,633) (4,893) (5,158)
Change in NWC (269) 44 (135) (83) (88) (97) (108)
Other Adjustments 994 877 982 1,042 1,098 1,154 1,210
FCFF (818) (822) (424) 306 1,127 1,909 2,799 13,148 59,599 84,487
Discount Factor 0.93 0.87 0.81 0.76 0.71 0.66 0.66 0.66
Discounted FCFF (767) (369) 248 853 1,346 1,842 8,649 39,208
Equity Valuation, in $m FYE2018 5.0%
FCFF NPV 3,154 3.0%
LT1 Value NPV 8,649 7.2%
Terminal Value NPV 39,208
Total EV 51,011
Less: Net Debt 8,286
Less: Minority Interest 1,390
Equity Value, in $m 41,335
Number of outstanding shares, in m 172.6
Implied Share Price 239.5
Market Share Price 317.7
Difference, $ 78.2
Difference, % 33%
LT1 (2025-2029) Growth Rate
TV (since 2030) Growth rate
WACC
CE
UeT
DC
olle
ctio
n

38
Our DCF model results $51.0bn of enterprise value (i.e. sum of discounted value of all future
FCFFs) for Tesla, as of 31.12.2018. After deducting net debt and minority interest we get the
equity value of the company, $41.3bn. Then we calculate the price of a stock by dividing the
number of outstanding common shares as of 31.12.2018. Implied price of a Tesla share is
$240, per our DCF model, which is 33% lower than the market price at that point in time.
We compare our result with the consensus of different sources (i.e. investment banks and
equity research firms) that have been found by the author. As can be seen from the below
table, the consensuses of all sources in the below list are below market price and close to the
result of our model. In our opinion the discrepancy between our result and the below given
consensuses is can be explained by slight difference in WACCs used (e.g. due to different
long-tem capital structure and/or risk premiums) and possible different views on long-term
growth rate.
Table 14. Comparison of Consensuses Issued by Different Sources
We note that terminal value makes up a large part (78%) of Tesla’s implied enterprise value,
as per the results of our DCF model, that being said Tesla’s value is highly sensitive to the
market’s perception of the company’s long-term growth rates. It may explain the difference
between our implied price and the market price. However, large share of TV in a company’s
EV also means the firm’s stock price may be very sensitive and fluctuating, as any small
Source Consensus Report Issuance Date
Our DCF Model $240 31.03.2019
JP Morgan $200 23.04.2019
Wolfe Research LLC $265 05.04.2019
Rose Capital Partners LLC $238 25.04.2019
Norddeutsche Landesbank Girozentrale $250 01.02.2019
Wedbush Securities Inc. $275 25.04.2019
Morningstar Inc. $240 26.02.2019
Source: Bloomberg, CapitalIQ
CE
UeT
DC
olle
ctio
n

39
change in market’s expectation can have significant impact on the share price. The below
table illustrates the sensitivity analysis of Tesla’s stock price to long-term growth rate, based
on our DCF model. As can be seen, implied stock price under the assumption of 4.0% long-
term (terminal) growth rate is roughly in line with the market price.
3.2 Relative Valuation
Despite the fact multiples valuation does not have a strong theoretical background, this
method is widely used by the market participants, such as investment banks, venture capitals
(especially, in M&A deals). The choice of multiples and peers is very important in relative
valuation. We can estimate either enterprise value, or equity value of the firm directly subject
to what multiple is chosen. However, given in many cases a company being valued and its
peers have different capital structure, as in our case, EV estimation is more appropriate
decision.
There is a great deal of multiples available. In our valuation we stop in two of them:
EV/EBITDA and EV/Sale. According to Koller et.al. (2010), EV/EBIT is one of the most
appropriate multiples, as it reflects the company’s ROIC, tax, cost of debt, as well as growth
rates20
. However, we use EV/EBITDA, very similar multiple, to avoid the impact of
discrepancy in depreciation schemes of Tesla and its peers. Also, the company’s EBIT is
negative, unlike EBITDA. EV/Sales is also good fit for the valuation of Tesla, as the company
has negative and volatile earnings due to its being at early growth stage. In addition, at this
point the firm’s earnings do not fully represent its long-term potential.
20
Koller, T. Goedhart, M. And Wessels, D. (2010), Valuation. p. 305
LT Growth Rate 2.0% 2.5% 3.0% 3.5% 4.0%
Implied Stock Price $196 $216 $240 $270 $310
CE
UeT
DC
olle
ctio
n

40
As mentioned above, picking up right peers is vital in relative valuation. We carry out two
multiple valuation cases with different peer groups. In the first case we use Tesla’s peers in
automotive and, solar energy generation and storage industries. Since a firm’s value
represents its future cash generation/wealth creation prospects, we use forward-looking
multiples for 2019 in our relative valuation. This approach is believed to result more accurate
estimates, as empirical evidence suggests.
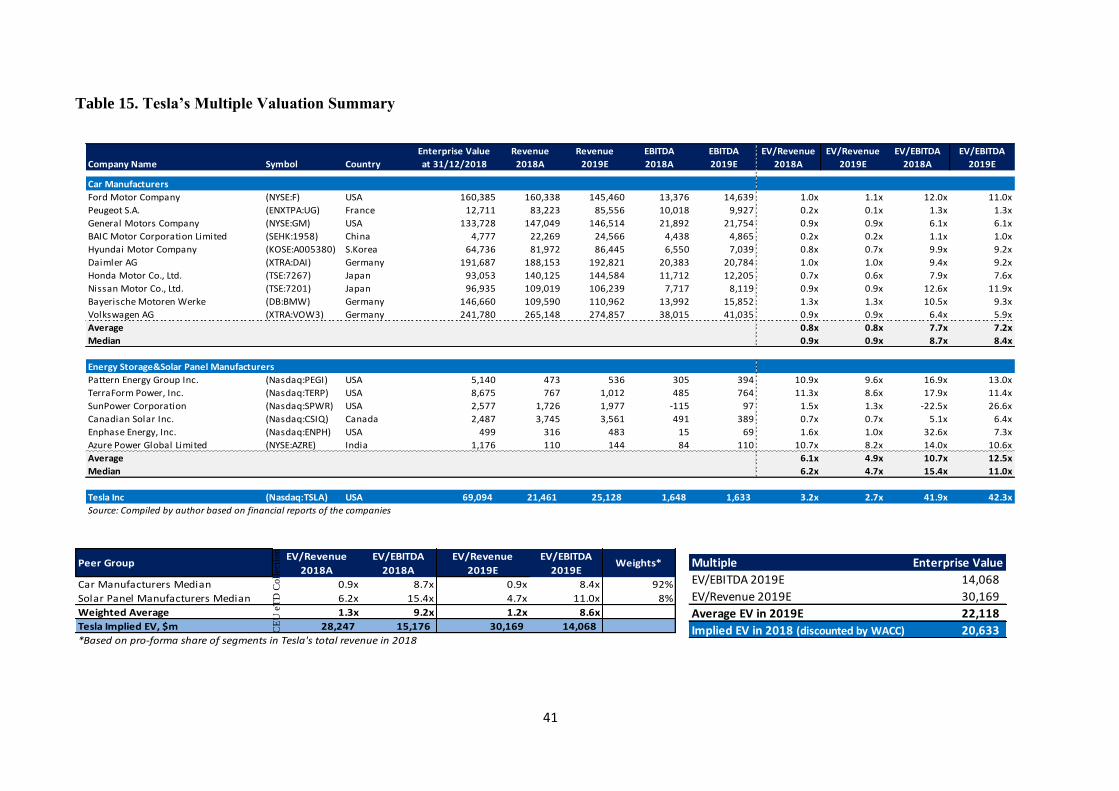
As illustrated in the below table, the first case of multiple valuation resulted in roughly three
times as low EV as the actual market EV as of 31.12.2018. We consider it unrealistic (most
likely due to the fact that market’s perceptions on Tesla and other automanufacturers vary
from each other) and therefore ignore this result.
CE
UeT
DC
olle
ctio
n
41
Table 15. Tesla’s Multiple Valuation Summary
Company Name Symbol Country
Enterprise Value
at 31/12/2018
Revenue
2018A
Revenue
2019E
EBITDA
2018A
EBITDA
2019E
EV/Revenue
2018A
EV/Revenue
2019E
EV/EBITDA
2018A
EV/EBITDA
2019E
Car Manufacturers
Ford Motor Company (NYSE:F) USA 160,385 160,338 145,460 13,376 14,639 1.0x 1.1x 12.0x 11.0x
Peugeot S.A. (ENXTPA:UG) France 12,711 83,223 85,556 10,018 9,927 0.2x 0.1x 1.3x 1.3x
General Motors Company (NYSE:GM) USA 133,728 147,049 146,514 21,892 21,754 0.9x 0.9x 6.1x 6.1x
BAIC Motor Corporation Limited (SEHK:1958) China 4,777 22,269 24,566 4,438 4,865 0.2x 0.2x 1.1x 1.0x
Hyundai Motor Company (KOSE:A005380) S.Korea 64,736 81,972 86,445 6,550 7,039 0.8x 0.7x 9.9x 9.2x
Daimler AG (XTRA:DAI) Germany 191,687 188,153 192,821 20,383 20,784 1.0x 1.0x 9.4x 9.2x
Honda Motor Co., Ltd. (TSE:7267) Japan 93,053 140,125 144,584 11,712 12,205 0.7x 0.6x 7.9x 7.6x
Nissan Motor Co., Ltd. (TSE:7201) Japan 96,935 109,019 106,239 7,717 8,119 0.9x 0.9x 12.6x 11.9x
Bayerische Motoren Werke (DB:BMW) Germany 146,660 109,590 110,962 13,992 15,852 1.3x 1.3x 10.5x 9.3x
Volkswagen AG (XTRA:VOW3) Germany 241,780 265,148 274,857 38,015 41,035 0.9x 0.9x 6.4x 5.9x
Average 0.8x 0.8x 7.7x 7.2x
Median 0.9x 0.9x 8.7x 8.4x
Energy Storage&Solar Panel Manufacturers
Pattern Energy Group Inc. (Nasdaq:PEGI) USA 5,140 473 536 305 394 10.9x 9.6x 16.9x 13.0x
TerraForm Power, Inc. (Nasdaq:TERP) USA 8,675 767 1,012 485 764 11.3x 8.6x 17.9x 11.4x
SunPower Corporation (Nasdaq:SPWR) USA 2,577 1,726 1,977 -115 97 1.5x 1.3x -22.5x 26.6x
Canadian Solar Inc. (Nasdaq:CSIQ) Canada 2,487 3,745 3,561 491 389 0.7x 0.7x 5.1x 6.4x
Enphase Energy, Inc. (Nasdaq:ENPH) USA 499 316 483 15 69 1.6x 1.0x 32.6x 7.3x
Azure Power Global Limited (NYSE:AZRE) India 1,176 110 144 84 110 10.7x 8.2x 14.0x 10.6x
Average 6.1x 4.9x 10.7x 12.5x
Median 6.2x 4.7x 15.4x 11.0x
Tesla Inc (Nasdaq:TSLA) USA 69,094 21,461 25,128 1,648 1,633 3.2x 2.7x 41.9x 42.3x
Source: Compiled by author based on financial reports of the companies
Peer GroupEV/Revenue
2018A
EV/EBITDA
2018A
EV/Revenue
2019E
EV/EBITDA
2019EWeights*
Car Manufacturers Median 0.9x 8.7x 0.9x 8.4x 92%
Solar Panel Manufacturers Median 6.2x 15.4x 4.7x 11.0x 8%
Weighted Average 1.3x 9.2x 1.2x 8.6x
Tesla Implied EV, $m 28,247 15,176 30,169 14,068
*Based on pro-forma share of segments in Tesla's total revenue in 2018
Multiple Enterprise Value
EV/EBITDA 2019E 14,068
EV/Revenue 2019E 30,169
Average EV in 2019E 22,118
Implied EV in 2018 (discounted by WACC) 20,633 CE
UeT
DC
olle
ctio
n

42
In the second case we carry out relative valuation based on the same multiples, but compare
Tesla to the selected group of high tech companies. As we have seen in previous chapter,
Tesla’s share price performance has been somewhat close to the movement of high-tech
companies in the last several years. In addition, the company is classified as a high-tech
company by the market. Hence, we consider tech companies to be more appropriate
benchmark for valuing Tesla.
Our relative valuation in the case resulted in $55bn EV, or share price of $263. We assume it
is more accurate value compared to the consensus in the first case. Of note, the result of
multiple valuation is relatively high than the value estimated by the DCF model, however,
still lower than the actual market price.
Table 16. Tesla’s Multiple Valuation Summary
Company Name SymbolEV/Revenue
2018A
EV/Revenue
2019E
EV/EBITDA
2018A
EV/EBITDA
2019E
Tech Companies
Apple Inc. (Nasdaq:AAPL) 3.7x 3.5x 12.1x 11.6x
Amazon.com Inc. (Nasdaq:AMZN) 3.8x 3.2x 35.5x 21.0x
Alphabet (Nasdaq:GOOG.L) 5.1x 4.2x 16.6x 11.4x
Alibaba Group (NYSE:BABA) 8.7x 6.1x 40.0x 19.5x
Microsoft Corporation (Nasdaq:MSFT) 6.8x 6.1x 16.6x 14.5x
Intel Corporation (Nasdaq:INTC) 3.4x 3.2x 7.5x 6.7x
Average 4.6x 4.4x 21.4x 14.1x
Median 3.8x 3.9x 16.6x 13.1x
Tesla Inc (Nasdaq:TSLA) 21,461 25,128 1,648 1,633
Source: Compiled by author based on financial reports of the companies
Peer GroupEV/EBITDA
2018A
EV/Revenue
2018A
EV/EBITDA
2019E
EV/Revenue
2019E
Tech Companies Median 16.6x 3.8x 13.1x 3.9x
Tesla Implied EV 27,357 81,552 21,308 96,744
CE
UeT
DC
olle
ctio
n

43
3.3 First Chicago Method of Valuation
First Chicago method (FCM) is widely used by venture capital funds for valuation of private
equity and early stage growth firms. As discussed in the first chapter of the thesis, the method
is by nature a hybrid method that uses elements of both DCF, for projection of cash flow for
explicit period (usually 5 to 7 years), and relative valuation to derive terminal value. FCM
requires projection of cash flows in three scenarios: base case, optimistic case and pessimistic
case. Then results of each case are multiplied by anticipated probabilities by investor(s) that
should add-up to one hundred percent. This method is believed to somewhat smooth out the
biases of each scenario’s results.
We build our First Chicago method valuation based on discounted cash flow model that we
used earlier. As it has been observed in the previous section, there is no particular multiple or
peer group that perfectly fits Tesla for relative valuation. Therefore, in our FCM we predict
terminal value in the same way as in the DCF model, rather than based on some multiples.
The result of our DCF valuation from the previous section is taken as a base case scenario.
For optimistic and pessimistic scenarios we use different assumptions with higher/lower
growth rates, profit margins, different fade and long-term (terminal) period growth rates, and
etc., accordingly (for more details please refer to excel file provided together with the thesis).
Multiple Enterprise Value
EV/EBITDA 2019E 21,308
EV/Revenue 2019E 96,744
Average EV in 2019E 59,026
Implied EV in 2018 (discounted by WACC) 55,047
Less: Net Debt 8,286
Less: Minority Interest 1,390
Equity Value, in $m 45,371
Number of outstanding shares, in m 172.6
Implied Share Price 262.9
Market Share Price 317.7
Difference, $ 54.8
Difference, % 21%
CE
UeT
DC
olle
ctio
n

44
We assume that the probability of optimistic case is 50%, as market seems bullish regarding
Tesla’s future perspectives. For base and pessimistic cases we assign 30% and 20%
probabilities, respectively. Below the results of each case are given. Based on the above-
mentioned probabilities we obtain the weighted-average value of the results.
Table 17. Summary of FCM Valuation
First Chicago method results in a stock price of $281 for per Tesla’s share, which is closer to
the actual market price than the results of previously used valuation methods.
Optimistic Case
Equity Valuation, in $m FYE2018
FCFF NPV 3,177
LT1 Value NPV 10,603
Terminal Value NPV 55,569
Total EV 69,349
Less: Net Debt 8,286
Less: Minority Interest 1,390
Equity Value, in $m 59,673
Number of outstanding shares, in m 172.6
Implied Share Price 345.7
Market Share Price 317.7
Difference, $ (28.0)
Difference, % (8.1%)
Base Case
Equity Valuation, in $m FYE2018
FCFF NPV 3,154
LT1 Value NPV 8,649
Terminal Value NPV 39,208
Total EV 51,011
Less: Net Debt 8,286
Less: Minority Interest 1,390
Equity Value, in $m 41,335
Number of outstanding shares, in m 172.6
Implied Share Price 239.5
Market Share Price 317.7
Difference, $ 78.2
Difference, % 33%
Pessimistic Case
Equity Valuation, in $m FYE2018
FCFF NPV 2,391
LT1 Value NPV 6,918
Terminal Value NPV 31,361
Total EV 40,670
Less: Net Debt 8,286
Less: Minority Interest 1,390
Equity Value, in $m 30,995
Number of outstanding shares, in m 172.6
Implied Share Price 179.6
Market Share Price 317.7
Difference, $ 138.1
Difference, % 77%
Scenarios Weight Result
Optimistic 50% 345.7
Base 30% 239.5
Pessimistic 20% 179.6
Consensus 280.6
Market Share Price 317.7
Difference, $ 37.1
Difference, % 13%
CE
UeT
DC
olle
ctio
n

45
Conclusion
The object of this thesis was to estimate the fair value of Tesla’s stock price using the most
appropriate method and identify the reasons behind the discrepancy between the outcomes of
our valuation and the actual market price.
Following our analyses and valuations carried out in the thesis, we come up with the
following outcomes:
Tesla is a tech-like company, as perceived by the market, rather than traditional
automobile manufacturing firm, due to the results of the peer comparison analysis and
relative valuation.
First Chicago method is the most appropriate method of valuation for Tesla, followed
by discounted cash flow method. Valuing the company using relative valuation
method is challenging due to absence/lack of similar companies.
Tesla’s stock price as of December 31, 2018 is overvalued as the results of all three
valuation models yielded a lower value.
The discrepancy in the fair value and actual market price can be explained by the
market’s over-optimistic expectation on Tesla’s future growth.
The company’s value is mainly fuelled with its long-term growth perspectives and
very sensitive to growth rates, i.e. market’s expectation on future success of the firm.
Therefore, we believe that the company’s stock price become more volatile going
forward subject to changes in investors’ mood that is easily impacted by Tesla’s
current operations as it is entering the positive earnings & cash generation stage with
the recent ramp-up of its sales.
CE
UeT
DC
olle
ctio
n

46
Bibliography
Books
Achleitner, A. Nathasius E (2004), Venture Valuation – Valuation of growth companies,
Schaffer Poeschel.
Damodaran, A. (2012), Investment valuation – Tools and techniques for determining the
value of any asset., 3rd edition. John Wiley & Sons Ltd.
Damodaran, A. (2012), Damodaran on valuation: Security analysis for investment and
corporate finance., 2nd edition. John Wiley & Sons Ltd.
Koller, T. Goedhart, M. And Wessels, D. (2010), Valuation: Measuring and Managing the
Value of Companies. 5th edition. New Jersey. Wiley & Sons Ltd.
Plenborg, T. & Petersen, C. V. (2012), Financial Statement Analysis, Harlow.
Research Papers
Cornell, B. Damodaran, A (2014), Tesla: Anatomy of a Run-up. Value creation or investor
sentiment?, The Journal of Portfolio Management, 41. P.139-151.
Damodaran, A (2014), Returning to the firing line: Revisiting Tesla.
(http://aswathdamodaran.blogspot.com/2014/03/return-to-firing-line-revisiting-tesla.html)
Baker, M. Wurgler, J (2007), Investor sentiment in the stock market, Journal of Economic
Perspectives, 21. p.129-151.
Annual Reports
Tesla, Inc. – Annual Reports 2013, 2014, 2015, 2016, 2017, 2018
General Motors Company – Annual Reports 2013, 2014, 2015, 2016, 2017, 2018
Ford Motor Company – Annual Reports 2013, 2014, 2015, 2016, 2017, 2018
AUDI AG – Annual Reports 2013, 2014, 2015, 2016, 2017, 2018
CE
UeT
DC
olle
ctio
n

47
Hyundai Motor Company – Annual Reports 2013, 2014, 2015, 2016, 2017, 2018
Daimler AG – Annual Reports 2013, 2014, 2015, 2016, 2017, 2018
Bayerische Motoren Werke (BWM) – Annual Reports 2013, 2014, 2015, 2016, 2017, 2018
Toyota Motor Corporation – Annual Reports 2013, 2014, 2015, 2016, 2017, 2018
Agency Reports
S&P Global Ratings – Credit rating report on Tesla dated May 2019
Moody’s – Credit Opinion Update report on Tesla dated March 2019
IHS Markit - Automotive Industry Outlook: Managing Volatility and Leveraging
Opportunities in a Dynamic Market Environment, a report by dated February 2019
Equity Research Reports
JP Morgan – Tesla Inc, issued in April 2019
Wolfe Research LLC – Tesla Inc, issued in April 2019
Rose Capital Partners LLC – Tesla Inc, issued in April 2019
Norddeutsche Landesbank Girozentrale – Tesla Inc, issued in February 2019
Morningstar Inc. – Tesla Inc, issued in February 2019
Zacks Investment Research – Tesla Inc, issued in November 2018
Online Databases
https://ir.tesla.com/investor-relations
S&P’s Capital IQ
Bloomberg
Reuters
CE
UeT
DC
olle
ctio
n

48
Appendix
Appendix 1. Summary of Tesla’s Key Metrics
Source : Tesla First Quarter 2019 Update (https://ir.tesla.com/static-files/b2218d34-fbee-4f1f-
ac95-050eb29dd42f)
CE
UeT
DC
olle
ctio
n

49
Appendix 2. Tesla Income Statement Projections
Income statement, $m 2017A 2018A 2019F 2020F 2021F 2022F 2023F 2024F
Total Revenue 11,759 21,461 25,128 30,451 33,696 37,065 40,772 44,849
Revenue Growth 68% 83% 17% 21% 11% 10% 10% 10%
Automotive Sales 9,641 18,515 21,662 26,212 28,833 31,716 34,888 38,376
Energy Generation and Storage 1,116 1,555 1,866 2,239 2,463 2,710 2,981 3,279
Services and Other 1,001 1,391 1,600 2,000 2,399 2,639 2,903 3,194
COGS (9,536) (17,419) (20,290) (24,169) (26,454) (28,703) (31,136) (33,770)
Automotive Sales (7,433) (14,174) (16,680) (19,921) (21,625) (23,470) (25,468) (27,631)
Energy Generation and Storage (875) (1,365) (1,642) (1,948) (2,119) (2,303) (2,504) (2,721)
Services and Other (1,229) (1,880) (1,968) (2,299) (2,711) (2,930) (3,165) (3,417)
Of which: Depreciation&Amortization (1,636) (1,901) (1,823) (2,088) (2,404) (2,712) (3,012) (3,305)
Gross Profit 2,223 4,042 4,838 6,282 7,241 8,362 9,635 11,079
Automotive Sales 2,209 4,341 4,982 6,291 7,208 8,246 9,420 10,745
Energy Generation and Storage 242 190 224 291 345 406 477 557
Services and Other (228) (489) (368) (300) (312) (290) (261) (224)
Gross Profit Margin 18.9% 18.8% 19.3% 20.6% 21.5% 22.6% 23.6% 24.7%
Automotive Sales 22.9% 23.4% 23.0% 24.0% 25.0% 26.0% 27.0% 28.0%
Energy Generation and Storage 21.7% 12.2% 12.0% 13.0% 14.0% 15.0% 16.0% 17.0%
Services and Other (22.8%) (35.2%) (23.0%) (15.0%) (13.0%) (11.0%) (9.0%) (7.0%)
R&D Expenses (1,378) (1,460) (1,710) (1,768) (1,788) (1,781) (1,959) (2,155)
SG&A (2,477) (2,835) (3,319) (3,717) (3,945) (4,154) (4,366) (4,578)
Other Operating Expenses 0 (135) 0 0 0 0 0 0
EBIT (1,632) (388) (190) 797 1,509 2,427 3,311 4,346
EBITDA 4 1,513 1,633 2,885 3,912 5,139 6,322 7,652
Adjustments for unusual items
Add:Other Operating Expenses (Restructuring Costs) 0 135 0 0 0 0 0 0
Add: Incentive Compensation Arrangement re Grohman Acquisition 26 0 0 0 0 0 0 0
Add: Transaction Costs re SolarCity Acquisition 0 0 0 0 0 0 0 0
Adjusted EBITDA 30 1,648 1,633 2,885 3,912 5,139 6,322 7,652
EBITDA Margin 0.3% 7.7% 6.5% 9.5% 11.6% 13.9% 15.5% 17.1%
Interest Income 20 25 34 41 45 50 55 60
Interest Expense (471) (663) (522) (627) (676) (630) (618) (614)
Other Income/(Expense) (125) 22 3 3 3 3 3 3
EBT (2,209) (1,005) (676) 214 880 1,850 2,750 3,795
Tax benefit/(expense) (32) (58) 142 (45) (185) (388) (577) (797)
Net Income/(Loss) (2,241) (1,063) (534) 169 695 1,461 2,172 2,998
CE
UeT
DC
olle
ctio
n

50
Appendix 3. Tesla Balance Sheet Projections
Balance Sheet, $m 2017A 2018A 2019F 2020F 2021F 2022F 2023F 2024F
Cash&Cash Equivalents 3,368 3,686 2,000 2,000 2,000 2,000 3,111 5,065
Restricted Cash (Current Portion) 155 193 193 193 193 193 193 193
Accounts Receivable 515 949 857 1,039 1,150 1,265 1,391 1,530
Inventory 2,264 3,113 3,131 3,730 4,083 4,430 4,806 5,212
Prepaid Expenses and Other Current Assets 268 366 366 366 366 366 366 366
Total Current Assets 6,571 8,306 6,547 7,327 7,791 8,253 9,866 12,366
Operating Lease Vehicles 4,117 2,090 2,090 2,090 2,090 2,090 2,090 2,090
Solar Energy Systems, leases and to be leased 6,348 6,271 6,271 6,271 6,271 6,271 6,271 6,271
PP&E 10,028 11,330
Intangible Assets (excl.Goodwill) 362 283
Goodwill 60 68
MyPower Customer Notes Receivable 457 422 422 422 422 422 422 422
Restricted Cash (Non-Current Portion) 442 398 398 398 398 398 398 398
Other Non-Current Assets 273 572 572 572 572 572 572 572
Total Non-Current Assets 22,085 21,433 23,128 25,151 27,128 29,049 30,930 32,782
Total Assets 28,655 29,740 29,675 32,479 34,919 37,302 40,796 45,148
Accounts Payable 2,390 3,405 3,375 4,020 4,400 4,774 5,179 5,617
Accrued Liabilities and Other 1,731 2,094 2,094 2,094 2,094 2,094 2,094 2,094
Current Portion of Long-Term Debt and Capital Leases 797 2,568
Current Portion of Solar Bonds Issued to Related Parties 100 0
Other Current Liabilities 2,657 1,926 1,926 1,926 1,926 1,926 1,926 1,926
Total Current Liabilities 7,675 9,992 9,996 10,857 10,610 9,782 9,282 9,721
Long-Term Debt and Capital Leases 9,418 9,404 8,870 9,643 10,635 11,385 12,206 12,120
Other Long-Term Liabilities 5,930 4,030 4,030 4,030 4,030 4,030 4,030 4,030
Total Non-Current Liabilities 15,348 13,434 12,900 13,673 14,665 15,415 16,236 16,150
Total Liabilities 23,023 23,426 22,895 24,530 25,275 25,197 25,518 25,872
Preferred Stocks 0 0 0 0 0 0 0 0
Common Stocks 0 0 0 0 0 0 0 0
Additional Paid-in Capital 9,178 10,249 11,249 12,249 13,249 14,249 15,249 16,249
Accumulated Other Comprehensive Income/(Loss) 33 (8) (8) (8) (8) (8) (8) (8)
Accumulated Deficit (4,974) (5,318) (5,852) (5,683) (4,987) (3,526) (1,354) 1,645
Noncontrolling Interests 1,395 1,390 1,390 1,390 1,390 1,390 1,390 1,390
Convertible Senior Notes 0 0 0 0 0 0 0 0
Total Equity 5,632 6,314 6,780 7,949 9,644 12,105 15,278 19,276
Check 0 0 0 0 0 0 0 0
84
13,376 15,399 17,376 19,297 21,177 23,029
2,601 2,817 2,189 987 83
CE
UeT
DC
olle
ctio
n

51
Appendix 4 Tesla Cash Flow Statement Projections
Cash Flow Statement, $m 2017A 2018A 2019F 2020F 2021F 2022F 2023F 2024F
Net income (2,241) (1,063) (534) 169 695 1,461 2,172 2,998
Add: D&A 1,636 1,901 1,823 2,088 2,404 2,712 3,012 3,305
Add: Interest expense 471 663 522 627 676 630 618 614
Change in other assets (1,714) 1,748 0 0 0 0 0 0
Change in other liabilities 2,548 (2,268) 0 0 0 0 0 0
Change in accounts receivable (16) (434) 92 (182) (111) (115) (126) (139)
Change in accounts payable 530 1,014 (30) 645 380 374 405 438
Change in inventory (196) (850) (18) (599) (353) (347) (376) (406)
Change in net working capital 318 (269) 44 (135) (83) (88) (97) (108)
Operating cash flow 1,018 713 1,855 2,748 3,692 4,715 5,705 6,810
Adjustments (for non-cash items in Income Statement)
Add: Stock-based compensation (included in SG&A) 467 749 877 982 1,042 1,098 1,154 1,210
Add: Inventory write-downs (Included in COGS) 132 85 0 0 0 0 0 0
Add: Loss on disposals of fixed assets (Inc.in other expenses) 106 161 0 0 0 0 0 0
Foreign currency transaction (gains) losses (Other expenses) 52 (2) 0 0 0 0 0 0
Loss (gain) related to SolarCity acquisition (Other expenses) 58 0 0 0 0 0 0 0
Normalized OCF 1,832 1,707 2,732 3,731 4,734 5,813 6,859 8,020
Net Capex (5,726) (3,133) (3,518) (4,111) (4,380) (4,633) (4,893) (5,158)
Cash Flow from Investing Activities (5,726) (3,133) (3,518) (4,111) (4,380) (4,633) (4,893) (5,158)
Debt drawdown/ (repayment) 3,195 1,657 (501) 989 365 (452) (83) (84)
Interest (471) (663) (522) (627) (676) (630) (618) (614)
Proceeds from Share Issuance/(Expenses for Share Repurchase) 1,404 1,071 1,000 1,000 1,000 1,000 1,000 1,000
Cash Dividend Distributions 0 0 0 0 0 0 0 0
Other Change in Equity 554 673 0 0 (0) 0 0 (0)
Cash Flow from Financing Activities 4,683 2,738 (23) 1,363 688 (82) 298 302
Net Change in Cash (25) 318 (1,686) 0 0 0 1,111 1,954
Cash&Cash Equivalents BoP 3,393 3,368 3,686 2,000 2,000 2,000 2,000 3,111
Net Change in Cash (25) 318 (1,686) 0 0 0 1,111 1,954
Cash&Cash Equivalents EoP 3,368 3,686 2,000 2,000 2,000 2,000 3,111 5,065
Check (0) (0) 0 0 0 0 0 0
CE
UeT
DC
olle
ctio
n