reward presentation university of cape town – 29 september 2008
DESCRIPTION
TRANSCRIPT

Reward presentation Reward presentation University of Cape Town – 29 September 2008University of Cape Town – 29 September 2008
Kobus du PlessisKobus du Plessis
Area Reward ManagerArea Reward Manager
British American TobaccoBritish American Tobacco

the bigger picture
Business Strategy
Employee Benefits & Non-
financialRewards
Market surveys
Job Evaluation/
Job Profiling
PerformanceManagement &
Employee Development/Structure
Pay levels & relatives
Pay structures
Total remuneratio
n
Performance pay
Reward
Strategy
Improved Improved performancperformanc
ee
Foundation
Market and pay
Organisational processes

agenda
• reward foundation• job profiling and evaluation
• market & pay• market surveys• pay levels• variable pay
• organisational processes• employee benefits• non-monetary benefits• performance management & employee development • pay for performance
Total R
eward

job evaluation
T h e U n d e r l y i n g P r i n c i p l e
A c c o u n t a b i l i t y
J o b s e x i s t t o a c h i e v e a n e n d r e s u l t
A c c o u n t a b i l i t y A c c o u n t a b i l i t y
P r o b l e m S o l v i n g
T h e r e f o r e , t h e j o b h o l d e r r e q u i r e s a l e v e l o f k n o w l e d g e
a n d e x p e r i e n c e c o m m e n s u r a t e w i t h t h e s c a l e a n d c o m p l e x i t y
o f t h e d e l i v e r a b l e s
K n o w - H o w
P r o b l e m S o l v i n g
T o a c h i e v e t h i s e n dr e s u l t , j o b h o l d e r s m u s t
a d d r e s s p r o b l e m s , c r e a t e , a n a l y s e a n d a p p l y j u d g e m e n t
1 32
OUTPUT PROCESS INPUT
Job evaluation measures the OUTPUT, PROCESS and INPUTrequirements of the JOB and NOT the performance
of the individual in the job relative to these job requirements

job evaluation
TopManagement
Senior Management
Professionally qualified specialists and middle
management
Skilled workers andjunior management
Clerical, equipmentoperating, juniorsupervisory staff
Staff with narrowrange of basic skills
HayJE ManagerPaterson
F
E
D
C
B
A
1801+
735 - 1800
371- 734
192 - 370
0 - 24
25 - 74
75 - 124
125 - 174
175 - 224
225 - 275
85 - 191
Up to 84

example - BATSA
A
B
C
Y
N
Q.2
Q.3
Y
N
Q.7
Q.6
Q.5
Q.4
YN
BA
N
YN
1
2
3
5
6
7
Q.1
4
The JE Manager system uses standardised questions and decision trees to arrive at JE Manager points
Example:Acquisition and Application of Theoretical Knowledge
• X - Minimum level of knowledge required

example - BATSA
Division Job Title Grade Date Time
SUPPORT SERVICE SECRETARY B4 1-Apr-97 3.30 pm
Factor Weight X Y Score Basic Pts. Wtd Pts.
Acquisition & Application of Knowledge 1.4 4 3 F 9 13
Skills Acquisition and Practice 1.1 3 4 F 9 10
Judgement 1.9 4 3 F 9 17
Planning and Leadership 1.6 2 2 C 3 5
Communication 1.6 2 3 D 5 8
Job Impact 2.4 3 3 E 7 17
Total 42 70
Job evaluation result produced by JE Manager…

example - BATSA
Employee / Manager
JE Facilitator
JE Audit Committee
NotificationJob evaluation request
& actual evaluation
Job evaluation results reviewed
Job evaluationresults approved
The job evaluation process in BAT SA…

agenda
• reward foundation• job profiling and evaluation
• market & pay• market surveys• pay levels• variable pay
• organisational processes• employee benefits• non-monetary benefits• performance management & employee development • pay for performance
Total R
eward

What do we need from salary surveys and how does this relate to job grades….
JEManager
Salary Surveys
BySurvey
Company
Job Grade34
Job Grade33
Job Grade32
Job Grade31
Job Grade30
More complex job
Less complex job
We need:• Lower quartile• Median• Upper quartile• 90th percentiledetails per job grade
salary surveys

Defining the lower quartile, median, upper quartile and 90th percentile…
Highest salary
Lowest Salary
Rank order ofALL salaries ofALL companiesat a particular job grade
Lower Quartile
25% ofsalariesexceeded
Median
50% ofsalariesexceeded
Upper Quartile
75% ofsalariesexceeded
90th Percentile
90% ofsalariesexceeded
salary surveys

Intelligence Report 2007
example - BATSA
38 760 85,561 100,737 118,593 134,367
37 6,179 58,637 68,458 78,747 90,412
36A 13,740 40,833 47,818 54,568 61,690
36B 28,833 30,228 35,424 41,226 47,250
35 22,596 21,906 27,119 32,469 37,791
34 19,179 19,666 22,861 26,520 30,485
9 37,702 16,051 20,167 24,119 27,278
8 19,909 14,099 17,158 20,397 23,764
7 108,050 10,600 12,844 15,793 18,349
6 18,753 8,198 9,344 11,550 13,933
5 54,495 7,362 8,788 10,711 12,678
4 16,433 6,109 7,276 8,852 10,210
3 31,173 5,376 6,297 7,144 7,774
2 59,352 4,990 5,556 6,467 7,353
1 55,308 4,492 4,798 5,027 5,331
25th 75thGradesMarket Ranges Excluding BATSA
Sample Size
Median 90th

pay levels & relatives
• Market position
• Which market – national, regional, sector, etc.
• Date of data

pay levels & relatives
• Pay scale principles• Number of grades• Number of different pay scales• Pay ranges, pay slope and pay overlap
Different norms in different countries

pay levels & relatives
• A successful pay structure……..
• reflects the company’s business strategy and culture• reflects the culture and pay practices of the country• rewards adequately for higher levels of job responsibilities, skills or
competencies• reflects the target market• is affordable• adheres to sound design principles• provides a structure to reward performance

BATSA example
Job Grade X
90th
percentile
Median
75th
Percentile
MarketCompanySelectedPay range
Marketanchor
+40%
-10%
Comparatios
100
140
90
High skillsHigh
performance
On standardskills and
performance
Low skillsLow
performance

variable pay
Best Practice: Most Successful Incentives
• Cascade/Aligned with important business goals to clarify how value is created
• Measure what counts not what can easily be measured• Goal setting: Top-Down - Participants involved in ‘How To?’• Results, not activity accomplishment• As measurement improves, performance focus shifts to more individual
and less team, group, organisation-wide• Organisation: Did we get value? (ROI)• Participants: Were awards consistent with what I/we contributed?
REGULAR COMMUNICATION

variable pay …alternative design options
Primary Corporate ObjectivesNet turnover target
Profit targetSales volume target
Cash flow target
Supportive Business unit
Objectives
Business UnitIncentive
Table
Corporate Incentive
Table
Supportive Individual Performance
Objectives
IndividualIncentive
Table
CORP C + BU C + BU + Ind.
100% 70% 50%
- 30% 30%
- - 20%

variable pay….share participation schemes
Threshold
Target
Budget
Target
Stretch
Target
Override
Target
0% 10% 20% 40%
% of Salary Converted to Share Allocation
Share allocation transferred to individual following a vesting period
Typically limited to senior executive teams and senior professional staff:Retention ability of scheme results from fact that employee would be
leaving a monetary entitlement behind should he/she resign…
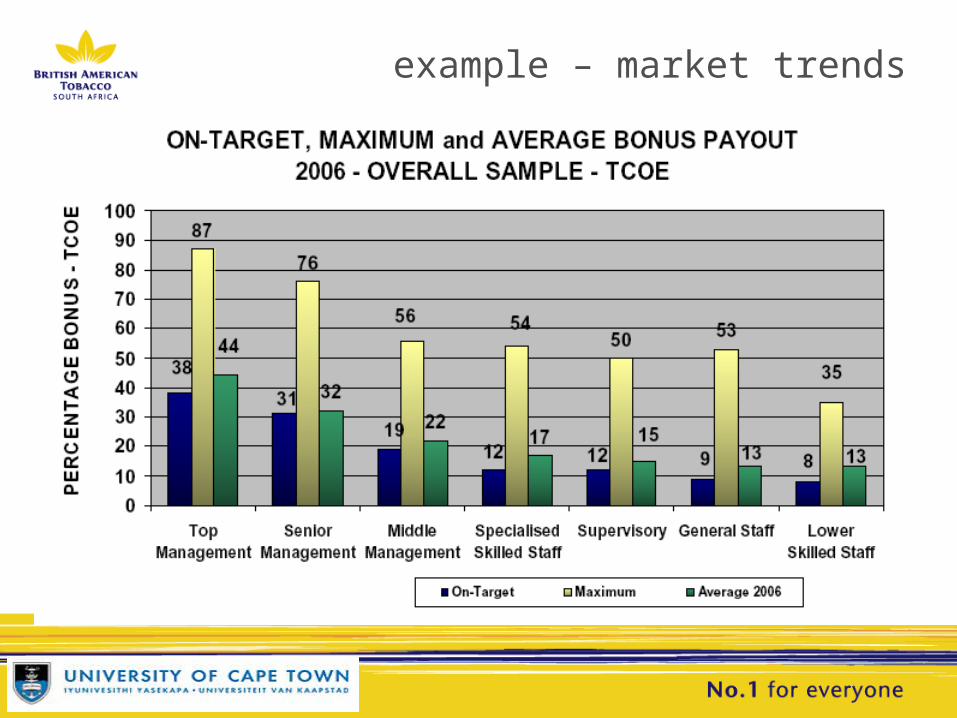
example – market trends

example - BATSA
• Inclusiveness:• “Include everyone.”
• Reward team results as opposed to individual results:• “In the emerging world of work, business success is increasingly determined by
team effort rather than individual effort”
• Line of sight:• “Ensure that employees see a link between what is required of them and the
incentive payments.”
• Simplicity:• “Keep it simple.”
• Incentives must become part of the daily business agenda:• “Incentive targets and achievements against these targets must be common
knowledge for employees and a source of daily inspiration for behaviour”

example - BATSA
CompanyCharter
FunctionalCharter
IndividualPerformance
Contract
5 Bonusable Objectives
Line of Sight Objectives
Functional Line of Sight Objectives
Individual Performance Objectives
IndividualPerformance
Rating
Individual Salary
CompanyScore Card& Ratings
FunctionalScore Card
Annual IncentivePayments
Ensure employees see link between what is required of them and
incentive pay

25%
25%
25%
25%
Incentive Payment
Year-to-date
Cash Flow
Sales Volume
Profit
Net Turnover
Threshold Target Stretch Override
30%
example - BATSA

agenda
• reward foundation• job profiling and evaluation
• market & pay• market surveys• pay levels• variable pay
• organisational processes• employee benefits• non-monetary benefits• performance management & employee development • pay for performance
Total R
eward

employee benefits
In deciding which benefits to offer, it is very important to understand the difference between the following two mayor benefit classes:
• Core Benefits:
• These are benefits where participation is a condition of employment for all employees. A core benefit is therefore compulsory for all employees and the core benefit offering by the company is largely determined by:
• The company’s social responsibility view.• The social security benefits available from the state.
• Non-Core benefits:
• These are the balance of the benefits a company elects to offers to all staff or certain categories of staff.
• The benefit selection offered is determined by the company’s need to be competitive on benefits relative to its key competitors for talent.
• Where practical, the company would allow the employee to exchange a non-core benefit (partially or fully) for cash or another non-core benefit.

employee benefits
Traditional Design
Salary * #
+
Benefits
=
Total (fixed) Package *
+Incentives
=
Total Cost of Employment*
* = Benchmark points to labour market# = Pensionable and incentive basis
Modern Design
Flexible Package #
+
Core Benefits
=
Total (fixed) Package *
+Incentives
=
Total Cost of Employment*
Salary
Car benefit
Medical benefit
Contribution to retirement fund
In-service life cover
Disability cover
Annual incentivescheme
Benefit design trend

Benefit selection and designModel design for medical benefits…
Company pays
Employee pays
Full or significant portion ofpremium
No or insignificantportion of premium
SingleMedicalBenefit
Plan
Fixed monthly amountas core benefit
contribution,($80)
irrespective of plan chosen by employee and
number ofemployee
dependants
Balance of premiumrequired for
chosen benefitplan:
Gold ($120)Silver ($40)Bronze ($0)
Choice ofMedicalPlans:
Gold ($200)Silver ($120)Bronze ($80)
Traditional Design Modern Design

non-monetary benefits
Proposed recognition channels within recognition mandate
• Simple “thank you” cards that can be sent by anyone to anyone in the organisation
• Small “thank you” gifts (e.g. book, music CD, flowers, etc.) with a capped maximum value – expenditure to be approved at management level
• Achievement certificate / trophy presented at some form of awards ceremony.
• Development opportunity – i.e. attendance of an innovation conference

BATSA example
Employee to Employee Manager to
EmployeeOpCo /
Clusters Area Region Global
Thank You Cards
(to individuals)Yes Yes
Token Gifts
(to individuals) Yes
Awards
(to teams incl. project teams)
GM / MD Awards
Area Directors
Awards
Regional
Director
Awards
Golden
Leaf
Awards
Development
Opportunities
(to teams incl
project teams)
OpCo Sponsored
Development Opportunity
(i.e. Local Conference in field
of work)
Area Sponsored
Development Opportunity
(i.e. Above market BAT Conference on specific topic like innovation)
Regionally Sponsored Development Opportunity(i.e. international conference on area of interest)

pay for performance – BATSA example
Individual
BAT SASkills
with market
value
Performance
Competitive
Comparatio
100Market
Anchor
95
125
Succeed
110
140Exceed
100
90
Inadequate
115
Reward for skills with
high demand in market
Market 90th Percentile
Market Upper Quartile
75th Percentile
Nearly There
+
Job evaluation(JE Manager)
+Salary surveys
Tools
Performancemanagementsystem (PerForm)
MarketMaximum
10% of employeesin SA market
Up to 15% of BAT SA employees in order

pay for performance
Target performance distributions per performance rating….
Exceed SucceedNearly there &
Inadequate
<10%65% - 80%15% - 25%
The reality is that if more that 25 % of employees achieve exceed ratings,OUR STANDARDS ARE TOO LOW !

Battlefield bonuses…
• When should they be used…• Where performance of an individual/team goes well beyond an ‘exceeds’
performance.• Where an individual/team has contributed to a significant activity or project which was
not in the work plan. They have delivered successfully on this significant unplanned item as well as delivering their agreed work plan.
• They have made a significant personal sacrifice to manage a workload well above that normally expected, usually in the situation where significant unplanned activity appears during the year.
• In other words, battlefield bonuses are there to recognise truly exceptional performance that goes significantly beyond the exceed benchmark
• Quantum of Battlefield bonuses• In most circumstances the payment of 1 month’s salary would be appropriate• In very exceptional cases the payment of up to 3 month’s salary can be made

reward governance and communication
Decision maker:
• Board Compensation Committee (BCC)
• Human Resources
• Line Management
• Employee
Decision mandate:
• Remuneration strategy and policy decisions
• Research remuneration best practices in market and:• Motivate appropriate remuneration practices and levels for
organisation to BCC• Train and guide line managers in application of approved
remuneration practices.
• Application of approved remuneration practices within constraints of an approvals framework.
• Make-up of his/her total remuneration package within the constraint of his/her own total remuneration package value.
Issue: who should make which remuneration decision in the company…

reward governance and communication
Advantages and disadvantages of communication alternatives:
• Written communication+ Accessibility – can reach everyone with written communication.+ Relatively cheap medium.- Information in written communication can get outdated very quickly.- When updated communication gets distributed, difficulty in recovering/disposing of outdated version.
• Electronic medium+ Information can easily be kept relevant and up to date at all times.+ Easily facilitates add-on services – electronic payslips, decision support tools, etc. as well as e-mail question
and answer facility for line managers and employees.- Access to information can be more difficult - not everyone might have access to a computer and even if
computers are available (through for example employee computer kiosks), employees might still have difficulty in accessing information due to lack in basic computer skills.
- Technology investment costs to put these facilities in place, could be significant.
• R&B training:+ Caters for personal interaction which can greatly facilitate learning and understanding.- Relatively expensive due to travelling.- Increases “down-time” in company - Have to take line managers and employees out of their jobs for the
duration of the training.
No ideal medium - Going forward, the role of the electronic medium is likely increase and grow in prominence.

BATSA exampleGeneral reward
communication on standard policies,
procedures and practices.
Ideally issue resolution 50% to 60 %
Line manager education and
issue resolution up to 70%
HR SC & BP - issue resolution 80% to 90%
Reward CoE - issue resolution up to 100%
Reward CoE to provide framework
and content of interventions to ensure
all stakeholders have access to appropriate
information and support. This will include strategy,
policies, procedures, appropriate guidelines
and applicable training, education and information material.

BATSA example
Channel Target Audience Frequency
Company Intranet All employees Ongoing
Company newsletter All employees Quarterly
Classroom training Line managers 2 x per annum & Ad hoc
HR Business partners 2 x per annum
“Upskilling” sessions HR Community 6 x per annum
Induction All new employees 2-3 x per annum
Information sessions All employees Ad hoc

Road show – “Meet & greet”

Road show – “Meet & greet”

Road show – “It’s my life Movie 1 ”

Road show – “It’s my life Movie 1 ”


Road show – “Board game 2”

Favourable Scores
Pay and Benefits
Information and Communication
Structure
Learning
Alignment
Culture
Corporate Responsibility
Team Working
Survey Follow Up
Enterprising Spirit
Respect for our Employees
Talent
Freedom through Responsibility
Open Minded
Leadership
Strength from Diversity Insufficient Items for Category Score Computation
Supplementary items AME Insufficient Items for Category Score Computation
Supplementary items South Africa Insufficient Items for Category Score Computation
Coloured Difference Bars indicate a statistically significant difference
Differences From Benchmark
British American TobaccoCategory Scores Ranked By Difference From Benchmark
SOUTH AFRICA END MARKET (1603) vs. ISR SOUTH AFRICA NATIONAL NORM (38582)
50
75
63
66
85
77
76
71
61
54
60
50
58
50
61
4
0
0
-1
-3
-3
-3
-4
-4
-4
-5
-5
-6
-8
-10
-20 -10 0 10 200 25 50 75 100

Category Scores Ranked By Difference From Benchmark Favourable Scores
Pay and Benefits
Enterprising Spirit
Information and Communication
Alignment
Culture
Learning
Corporate Responsibility
Leadership
Team Working
Respect for our Employees
Talent
Structure
Freedom through Responsibility
Open Minded
Strength from Diversity Insufficient Items for Category Score Computation
Survey Follow Up Insufficient Items for Category Score Computation
AME Supplementary Items Insufficient Items for Category Score Computation
Coloured Difference Bars indicate a statistically significant difference
Differences From Benchmark
British American TobaccoSOUTH AFRICA 2007 (1343)
vs. TP-ISR SOUTH AFRICA NATIONAL NORM (36274)
56
52
80
90
81
69
79
70
69
66
60
70
63
60
10
5
4
3
3
3
2
1
1
1
1
0
-1
-2
-20 -10 0 10 200 25 50 75 100

agenda
• reward foundation• job profiling and evaluation
• market & pay• market surveys• pay levels• variable pay
• organisational processes• employee benefits• non-monetary benefits• performance management & employee development • pay for performance
Total R
eward

total rewardBATSA example
Transparent &
Delivered
Effectively
Empowering & Flexible
Train
ing &
Devel
opmen
t
Opportuniti
es
Ope
n M
inde
d
Fre
edo
m
Th
rou
gh
R
esp
on
sib
ility
Enterprising
Spirit
Strength from Diversity
Co
ach
ing
&
Men
tori
ng
Career
Managem
ent
Peo
ple &
Strateg
ic
Lead
ership
Great Place toWork with
OutstandingPeople
Fair &
Co
mpetitive

BATSA example – reward architecture
Salary Incentives
Battle Field Bonus
BenefitsNon-monetary
recognition
Reward Channels
RewardingIndividual
Performance
RewardingGroup
Performance
RewardingOrganisationalMembership &
IndividualPerformance
RewardingBahaviour
Reward Channel Objectives
Governance EnablerBCC Footprint - governs reward strategy & policy
Control Environment - governs reward practice
BenchmarkingEnabler
Survey FootprintDelivers marketintelligence &
facilitatesreward insights
Job EvaluationEnables
internal &external reward
comparisons
Technology EnablerFacilitates flawless execution
EngagementEnabler
CommunicationDelivers internal
feedback on reward & facilitates
buy-in on rewardstrategy, policies &
practices
TrainingBuilds reward
capabilitywhere required

questions ?????????