r.g. barry corporationfilecache.drivetheweb.com/ir1_rgbarry/86/download/2004...1 message to...
TRANSCRIPT

2004Annual Report
R.G. Barry Corporation
CORPORATE OVERVIEW
Table of Contents
Message to Shareholders 1
Financials
Six Year Review of Selected Financial Data 5
Market & Dividend Information 6
Quarterly Financial Data 6
Management’s Discussion & Analysis ofFinancial Condition & Results of Operations 7
Consolidated Balance Sheets 19
Consolidated Statements of Operations 20
Consolidated Statements of Shareholders’ Equityand Comprehensive Income 21
Consolidated Statements of Cash Flows 22
Notes to Consolidated Financial Statements 23
Report of Independent Registered Public Accounting Firm 42
Directors & Officers 43
Corporate Information 44
R.G. Barry Corporation, the Dearfoams® company, is among the world’s leading developers and marketers of comfort footwearfor at- and around-the-home, controlling an estimated 40% of the U.S. slipper market. The Company’s footwear products aresold worldwide through traditional, promotional and national chain department stores, discount stores, warehouse clubs,supermarkets, drug chains and specialty catalogs. The Dearfoams® family of footwear brands includes Angel Treads®, BarryComfort®, Dearfoams®, EZfeet®, Fargeot™, Madye’s®, Royal Comfort®, Snug Treds®, Soft Notes®, Solé™ and Terrasoles®. Wemarket Liz Claiborne®, Claiborne® and Villager® slippers under license granted by L.C. Licensing, Inc.; NASCAR Track Striders®
footwear under licenses granted by the National Association For Stock Car Auto Racing, Inc., Dale Earnhardt, Inc., RustyWallace, Inc., Penske Racing South, Inc., JG Motorsports, Inc. and Redline Sports Marketing, Inc.; and Mushrooms® slippersunder a license granted by AmAsia International LTD. We also supply our customers with footwear under a variety of their own private label brands.
1
MESSAGE TO SHAREHOLDERS
Dear Fellow Shareholder:
2004 was a new beginning for R.G. Barry Corporation, the Dearfoams® Company. Wesuccessfully launched our new business model and financially reengineered the Company. The many difficult decisions and dramatic and costly actions taken during 2004 were necessary to position us for a return to profitability.
The fourth quarter of 2004 was the best indication to date that the changes implemented during the past year are beginning towork. Although our quarterly net sales of $36.9 million weredown $6.8 million from $43.7 million reported for the fourthquarter of 2003, we recorded quarterly net earnings of $4.3million, or $0.44 cents per basic and diluted share, up from a net loss of $16.5 million, or $1.68 loss per share, in the fourthquarter of 2003. Earning from continuing operation beforeincome taxes and minority interest in the fourth quarter of 2004 amounted to $4.2 million, contrasted with a loss on acomparable basis of $3.0 million during the fourth quarter of 2003.
For the full year, net sales were $104.4 million down $18.7million from $123.1 million for the full year 2003. We reported
a net loss of $19.9 million, or $2.02 loss per share, for full-year 2004 compared to a net loss of$21.7 million, or $2.21 loss per share, for full-year 2003.
Among the significant factors influencing our 2004 results were:
■ Decreased net sales principally as a result of strategic withdrawal from some unprofitablemarkets, the negative impact of customer concerns about our liquidity during the first quarterof 2004, adverse retailer reaction to a more restrictive return policy and competition from in-store private label programs.
■ Restructuring and asset impairment charges for the full year of approximately $17.3 million,substantially all of which were related to implementation of our new business model. In 2003,we reported restructuring and asset impairment charges of $2.6 million for the full year, $2.4million of which were recorded in the fourth quarter of 2003.
FINANCIAL RECAP
R.G. Barry Corporation and Subsidiaries
2004 2003* 2002 2001
(in thousands of dollars, except per share data)
Net sales $104,404 $123,137 $119,024 $129,361Earnings (loss) before income taxes, continuing operations (20,075) (9,283) (12,316) 3,021Net earnings (loss) from continuing operations (20,199) (19,396) (8,150) 1,826Net earnings (loss) from discontinued operations 334 (2,310) (3,730) (894)Net earnings (loss) (19,865) (21,706) (11,880) 932Basic earnings (loss) per share (2.02) (2.21) (1.23) 0.10Diluted earnings (loss) per share (2.02) (2.21) (1.23) 0.10Working capital 14,873 25,846 40,927 55,205Net shareholders’ equity 4,978 26,387 47,188 60,385Book value per share 0.51 2.58 4.81 6.44Return on beginning shareholders’ equity (78.2)% (46.0)% (19.7)% 1.6%Pretax return on net sales (19.2)% (7.5)% (10.3)% 2.3%
*Fiscal year includes fifty-three weeks
All amounts have been retroactively restated to give effect to the change in costing method.
2004 On Target
Thomas M. Von LehmanPresidentChief Executive Officer

2
■ An approximate $9 million decrease in 2004 selling, general and administrative expensescompared to the prior year, principally as a result of our new business model; and
■ Tax expense of $123 thousand recognized in 2004 primarily related to foreign taxes incurredby our subsidiaries in Mexico. In 2003, our tax expense was approximately $10.1 million andwas mostly related to the valuation allowance established in that year against our deferred taxassets. As a result of our cumulative losses in five of the last six years, we have fully reservedthe value of our deferred tax assets in the amount of $21.3 million as of the end of 2004,compared with $13.8 million as of the end of 2003. In addition, as of the end of 2004, wehad approximately $30.2 million of net operating loss carry-forwards for U.S. federal incometax purposes and approximately $2.1 million of net operating loss carry-forwards for Mexicanincome tax purposes.
When we distill a year’s worth of arduous work into a statement like, “We have successfully simplified andredefined our business model,” it truly diminishes thehard work and sacrifice of our Associates. The R.G. Barry team successfully executed a huge amount of change in a very short time—essentially from the end of the firstquarter through year-end 2004.
Some of our most significant achievements in 2004 include the following:
■ Closing our Mexican manufacturing operations and relatedsupport facilities and moving to a 100 percent outsourcingmodel under which we imported about 18 millions pairs ofslippers with virtually no significant delivery or quality issues;
■ Closing the distribution and warehousing facilities in Laredo,Texas, and Nuevo Laredo, Mexico, before year-end and distributing about 10 million pairs of slippers through third party logistics facilities on the West Coast;
■ Selling about $8 million worth of closeout merchandise andreducing our inventory by approximately 3 million pairs fromyear-end 2003; and
■ Streamlining our management structure.
All of these initiatives were accomplished on or ahead ofschedule, and all were implemented while our businessoperated basically on plan throughout 2004.
We are pleased that on March 31, 2005, the Company entered into a new two-year, $35 millionasset-based lending facility with The CIT Group/Commercial Services. This new facility replaces our previous discretionary factoring and financing arrangement with CIT.
Unlike our former facility, this new agreement obligates CIT to advance us funds, provided thatwe meet financial performance covenants. While our previous financing arrangement with CITprovided us with sufficient liquidity and allowed us the necessary flexibility to radically changeour business model very quickly during 2004, lending under the facility was subject to thediscretion of CIT. Our previous factoring and financing arrangement also carried higher coststhan the new agreement.
One year ago, the discretionary nature of our former financing arrangement and our recurringlosses from operations were cited by our independent public accountants as the principalreasons for their inclusion of a going concern uncertainty paragraph in their report on our 2003 financial statements. We are pleased to note that no such modification is included in their report on our 2004 financial statements.
A Year of SignificantAccomplishments
New FinancingAgreement
Late last year, the Dearfoams® companylaunched a significant trade advertising and public relations campaign to letretailers know that we remain theirleading resource in at- and around-the-home comfort footwear.
The financial reengineering and changing of our fundamental businessmodel during 2004 was primarily an internally focused process. Whilewe were successful with the implementation of those changes last year,we still have a great deal to accomplish to fully implement our newbusiness model and ensure our transformation creates sustainable,profitable growth.
Toward that end, we are focusing on the externals in2005. We actually began shifting our attention to ourconsumers and retailing partners during the second half of last year with several key initiatives focused on rebuilding our brands and image.
The first involved refreshing the Dearfoams® product line. In the past, we often deferred implementing designchanges to our products because of our need to sellproducts carried over from the previous year. With our new total outsourcing model, better sales planningand better management of product sell-through, weshould be able to reduce seasonal product carryover inthe future and have a greater ability to introduce freshnessto our product lines. In addition, we are now movingmore overstocked products into closeout channels ratherthan carrying them over for sale through our primarychannels of distribution during the next year. We arebeginning to see the benefit of this change in the reactionfrom our customers as we work this spring to developtheir fall 2005 sales programs.
Another piece of our rebuilding program is a major brandenhancement initiative. This initiative includes the firstconsumer research the company has done in a number
of years. The research revealed some exciting things, including the fact that among domesticslipper purchasers during the past 18 months, Dearfoams® is the most recognizable name in theslipper category. The research also showed that our brand awareness among consumers who buyslippers for themselves or as gifts exceeds 75 percent overall and approaches 90 percent amongupper tier shoppers. That is brand power on a scale that few products have achieved, and it iseven more impressive when you realize that until the second half of 2004 Dearfoams® had notbeen supported by advertising or any significant marketing efforts in some time.
We plan to build upon the high brand recognition of Dearfoams® in a variety of ways. We are using the consumer research findings to help guide product development efforts and theredesign of our packaging and point of sale presentations. The changes we are making will better serve the consumer market segments we have identified as important growth drivers. In the future, you also will see us using “the Dearfoams® company” tagline in various corporateinitiatives. Our goal is to solidify R.G. Barry and the Dearfoams® family of brands as theunquestioned leaders in at-home, comfort footwear.
Our attention to consumers and retailers goes well beyond efforts to enhance our brands and also includes:
■ Refining and improving our order fulfillment processes to become an easy-to-work-with,hassle-free vendor in the eyes of our retailer customers;
■ Continuing to improve our inventory management through better forecasting; and
■ Fulfilling the expectations of our customers and consumers with fresh, innovative thinkingand great products.
3
The Brand Power of Dearfoams®
Focusing on theCustomer
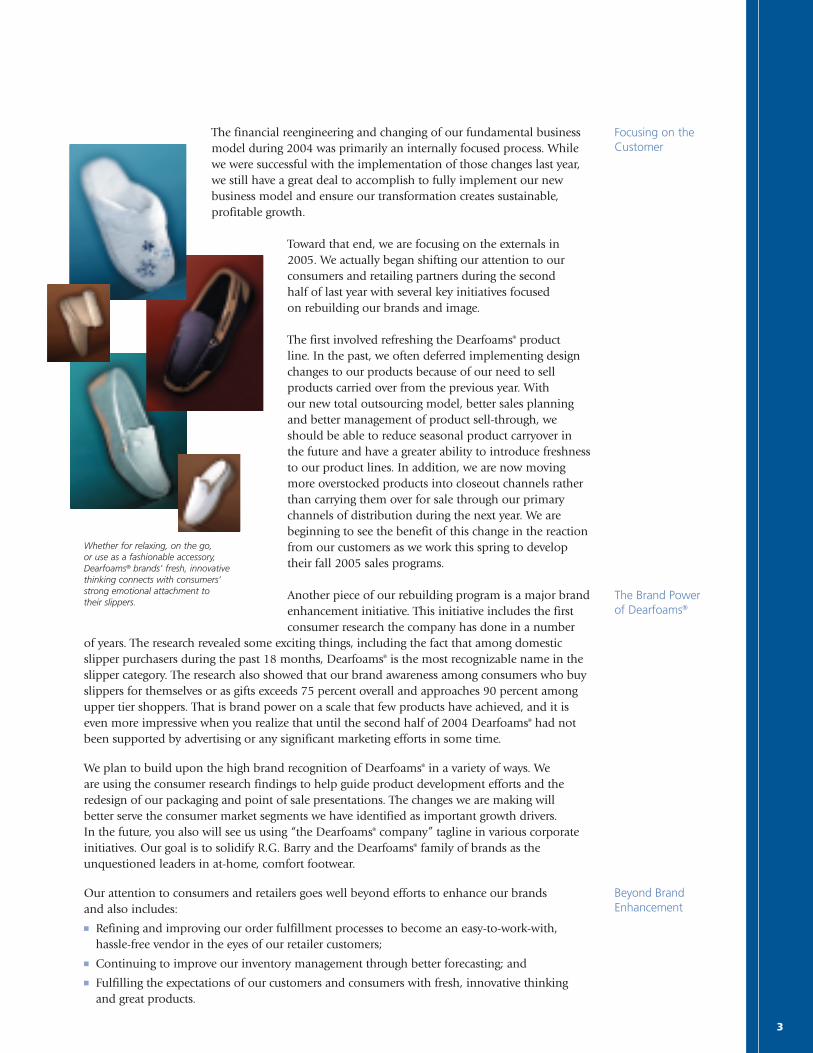
Whether for relaxing, on the go, or use as a fashionable accessory,Dearfoams® brands’ fresh, innovativethinking connects with consumers’strong emotional attachment to their slippers.
Beyond BrandEnhancement

4
We have found a great deal of receptivity to these externally focused initiatives among ourretailing partners. Based upon our performance in the past several years, understandably we also have found some skepticism among certain retailers. It will not be easy for us to win backthe market share we have lost over the past few years, and it is premature to predict a significantupturn in revenue this year. We believe 2005 will be a year of stabilization and positioning ourbusiness for future sustainable, profitable growth.
My desire to see the Company’s new business model fully and successfully implemented is a key reason that I recently extended my employment contract with the company through March 2006.
As you may know, trading in our common shares was suspended by the New York StockExchange in June 2004 when it became apparent we could no longer meet or maintain theirminimum standards for continued listing. R.G. Barry Corporation’s common shares currently are being dually quoted on the Over the Counter Bulletin Board and The Pink Sheets under thetrading symbol RGBC. Price quotations and trading information is readily available from manybroker/dealers and at various Internet sites including www.pinksheets.com, www.otcbb.com and www.nasdaq.com.
Since 2005 is the first full year under our new business model, we expect to see continuedimprovement in gross profit as a percent of sales, a lower cost of sales, lower SG&A expenses, and no significant new restructuring and asset impairment charges. We believe that theseimprovements will lead to positive earnings for full 2005, however, since so much of ourbusiness takes place in the second half of the year, we expect to report a loss in the first twoquarters of this year.
To paraphrase a popular television sports show, our goal this year is to begin make R.G. BarryCorporation, the Dearfoams® company, “The best slipper company in North America, period.”We will measure best by our return to shareholders, the value we deliver to customers and con-sumers, our level of profitable growth and overall profitability, and the quality of the workplacewe create for our Associates. Having made 2004 the successful first step on this journey, we lookforward to taking it to the next level in 2005.
Thank you for your interest and support.
Thomas M. Von LehmanPresidentChief Executive Officer
Improvement Expected
Our Trading Venue Changes
Among the first and most visible steps in a major brandrevitalization effort is the revamping of our packaging to align the in-store appearance of Dearfoams® brandswith the ways consumers have told us they buy and use their slippers.

5
SIX YEAR REVIEW OF SELECTED FINANCIAL DATA
R.G. Barry Corporation and Subsidiaries 2004
2003
*20
0220
0120
0019
99
Sum
mar
y of
Ope
rati
ons
(tho
usan
ds)
Net
sal
es$1
04,4
04$1
23,1
37$1
19,0
24$1
29,3
61$1
31,0
02$1
23,5
33C
ost
of s
ales
67,0
6580
,427
77,5
9780
,182
88,0
2177
,932
Gro
ss p
rofi
t37
,339
42,7
1041
,427
49,1
7942
,981
45,6
01G
ross
pro
fit
as p
erce
nt
of n
et s
ales
35.8
%34
.7%
34.8
%38
.0%
32.8
%36
.9%
Selli
ng,
gen
eral
an
d ad
min
istr
ativ
e ex
pen
ses
39,2
0048
,163
50,3
6045
,973
45,5
6851
,651
Rest
ruct
urin
g an
d as
set
impa
irm
ent
char
ges
(adj
ustm
ents
)17
,341
2,56
32,
837
(118
)1,
886
5,62
4O
pera
tin
g in
com
e (l
oss)
(19,
202)
(8,0
16)
(11,
770)
3,32
4(4
,473
)(1
1,67
4)O
ther
inco
me
(exp
ense
)41
915
180
080
081
050
2In
tere
st e
xpen
se, n
et(1
,292
)(1
,418
)(1
,346
)(1
,103
)(1
,711
)(1
,347
)Ea
rnin
gs (
loss
) be
fore
inco
me
taxe
s, c
onti
nui
ng
oper
atio
ns
(20,
075)
(9,2
83)
(12,
316)
3,02
1(5
,374
)(1
2,51
9)In
com
e ta
x (e
xpen
se)
ben
efit
(123
)(1
0,09
6)4,
191
(1,1
53)
616
2,41
1M
inor
ity
inte
rest
, net
of
tax
(1)
(17)
(25)
(42)
(52)
(20)
Net
ear
nin
gs (
loss
) fr
om c
onti
nui
ng
oper
atio
ns
(20,
199)
(19,
396)
(8,1
50)
1,82
6(4
,810
)(1
0,12
8)N
et e
arn
ings
(lo
ss)
from
dis
con
tin
ued
oper
atio
ns
334
(2,3
10)
(3,7
30)
(894
)4,
004
(4,4
97)
Net
ear
nin
gs (
loss
)(1
9,86
5)(2
1,70
6)(1
1,88
0)93
2(8
06)
(14,
625)
Addi
tion
al D
ata
Bas
ic e
arn
ings
(lo
ss)
per
shar
e$
(2.0
2)$
(2.2
1)$
(1.2
3)$
0.10
$(0
.09)
$(1
.55)
Dilu
ted
earn
ings
(lo
ss)
per
shar
e$
(2.0
2)$
(2.2
1)$
(1.2
3)$
0.10
$(0
.09)
$(1
.55)
Boo
k va
lue
per
shar
e$
0.51
$2.
58$
4.81
$6.
44$
6.34
$6.
46A
nn
ual %
ch
ange
in n
et s
ales
(15.
2)%
3.5%
(8.0
)%(1
.3)%
6.0%
(6.8
)%A
nn
ual %
ch
ange
in n
et e
arn
ings
(lo
ss)
8.5%
(82.
7)%
(137
4.7)
%21
5.6%
94.5
%(2
57.1
)%Pr
etax
ret
urn
on
net
sal
es(1
9.2)
%(7
.5)%
(10.
3)%
2.3%
(4.1
)%(1
0.1)
%N
et e
arn
ings
(lo
ss)
as a
per
cen
tage
of
begi
nn
ing
shar
ehol
ders
’ equ
ity
(78.
2)%
(46.
0)%
(19.
7)%
1.6%
(1.3
)%(1
8.5)
%B
asic
ave
rage
num
ber
of s
har
es o
utst
andi
ng
(in
th
ousa
nds
)9,
839
9,82
39,
641
9,37
99,
399
9,45
5D
ilute
d av
erag
e n
umbe
r of
sh
ares
out
stan
din
g (i
n t
hou
san
ds)
9,83
99,
823
9,64
19,
577
9,39
99,
455
Fin
anci
al S
umm
ary
(tho
usan
ds)
Cur
ren
t as
sets
$33
,082
$44
,379
$61
,068
$69
,676
$70
,268
$71
,678
Cur
ren
t lia
bilit
ies
18,2
0918
,533
20,1
4114
,471
14,7
1517
,705
Wor
kin
g ca
pita
l14
,873
25,8
4640
,927
55,2
0555
,553
53,9
73Lo
ng-
term
deb
t47
92,
141
5,76
05,
162
7,63
78,
571
Net
sh
areh
olde
rs’ e
quit
y4,
978
25,3
8747
,188
60,3
8559
,452
60,3
84N
et p
rope
rty,
pla
nt
and
equi
pmen
t2,
718
9,36
910
,910
10,9
1711
,741
14,4
08To
tal a
sset
s39
,092
61,2
8087
,638
88,6
1289
,549
93,1
64C
apit
al e
xpen
ditu
res
122
1,66
22,
373
1,18
665
33,
381
Dep
reci
atio
n a
nd
amor
tiza
tion
of
prop
erty
, pla
nt
and
equi
pmen
t1,
336
1,76
21,
779
1,67
42,
109
2,24
3
See
also
Man
agem
ent’s
Dis
cuss
ion
& A
nal
ysis
of
Fin
anci
al C
ondi
tion
& R
esul
ts o
f O
pera
tion
s
*Fis
cal y
ear
incl
udes
fif
ty-t
hre
e w
eeks
Effe
ctiv
e in
200
0, t
he
Com
pany
ch
ange
d it
s in
ven
tory
cos
tin
g m
eth
od f
rom
LIF
O t
o FI
FO. A
ll am
oun
ts h
ave
been
ret
roac
tive
ly r
esta
ted
to g
ive
effe
ct t
o th
e ch
ange
in c
osti
ng
met
hod
.
Cer
tain
am
oun
ts f
rom
pri
or y
ears
hav
e be
en r
ecla
ssif
ied
to c
onfo
rm w
ith
cur
ren
t ye
ar’s
pres
enta
tion

6
MARKET AND DIVIDEND INFORMATION
R.G. Barry Corporation and Subsidiaries
Market ValueQuarter High Low Close
2004 First $4.75 $1.43 $2.59
Second 2.90 1.53 1.62
Third 2.80 1.51 2.55
Fourth 4.00 2.30 3.52
2003 First $4.49 $2.10 $2.30
Second 4.76 2.25 4.60
Third 5.38 4.35 5.24
Fourth 6.39 4.18 4.40
Since June 2004, R.G. Barry Corporation common shares are dually quoted on the OTC Bulletin Board and The Pink Sheets under trading symbol RGBC.
Stock Ticker Symbol: RGBC
Approximate Number of Registered Shareholders: 1,000
QUARTERLY FINANCIAL DATA
R.G. Barry Corporation and Subsidiaries
2004 Fiscal Quarters in thousands, except basic and diluted earnings (loss) per share
First Second Third Fourth
Net sales $ 18,430 $ 14,516 $34,573 $36,885
Gross profit 5,513 4,033 12,835 14,958
Net earnings (loss) – continuing (14,159) (8,929) (1,426) 4,315
Net earnings – discontinued — 16 314 4
Net earnings (loss) (14,159) (8,913) (1,112) 4,319
Basic earnings (loss) per share – continuing $ (1.44) $ (0.91) $ (0.14) $ 0.44
Diluted earnings (loss) per share – continuing $ (1.44) $ (0.91) $ (0.14) $ 0.44
Basic earnings per share – discontinued $ 0.00 $ 0.00 $ 0.03 $ 0.00
Diluted earnings per share – discontinued $ 0.00 $ 0.00 $ 0.03 $ 0.00
Basic earnings (loss) per share – total $ (1.44) $ (0.91) $ (0.11) $ 0.44
Diluted earnings (loss) per share – total $ (1.44) $ (0.91) $ (0.11) $ 0.44
2003 Fiscal QuartersFirst Second Third Fourth
Net sales $ 20,378 $ 19,016 $40,001 $43,742
Gross profit 7,085 6,453 16,234 12,938
Net earnings (loss) – continuing (2,954) (2,395) 1,456 (15,503)
Net earnings (loss) – discontinued (918) (390) 3 (1,005)
Net earnings (loss) (3,872) (2,785) 1,459 (16,508)
Basic earnings (loss) per share – continuing $ (0.30) $ (0.24) $ 0.14 $ (1.57)
Diluted earnings (loss) per share – continuing $ (0.30) $ (0.24) $ 0.14 $ (1.57)
Basic earnings (loss) per share – discontinued $ (0.09) $ (0.04) $ 0.00 $ (0.11)
Diluted earnings (loss) per share – discontinued $ (0.09) $ (0.04) $ 0.00 $ (0.11)
Basic earnings (loss) per share – total $ (0.39) $ (0.29) $ 0.15 $ (1.68)
Diluted earnings (loss) per share – total $ (0.39) $ (0.29) $ 0.15 $ (1.68)
See also Management’s Discussion & Analysis of Financial Condition & Results of Operations.
7
MANAGEMENT’S DISCUSSION & ANALYSIS OF
FINANCIAL CONDITION & RESULTS OF OPERATIONS
R.G. Barry Corporation and Subsidiaries
The following discussion and analysis is intended to provide investors and others with informationwe believe is necessary to understand the Company’s financial condition, changes in financialcondition, results of operations and cash flows. This discussion and analysis should be read inconjunction with the Company’s consolidated financial statements, the notes to the consolidatedfinancial statements and other information contained in this report.
The preparation of financial statements in accordance with accounting principles generally acceptedin the United States of America requires that we make certain estimates. These estimates can affectour reported revenues, expenses and results of operations, as well as the reported values of certainof our assets and liabilities. We make these estimates after gathering as much information from as many resources, both internal and external, as are available to us at the time. After reasonablyassessing the conditions that exist at the time, we make these estimates and prepare our consoli-dated financial statements accordingly. These estimates are made in a consistent manner fromperiod to period, based upon historical trends and conditions and after review and analysis ofcurrent events and circumstances. We believe these estimates reasonably reflect the current assess-ment of the financial impact of events that may not become known with certainty until some time in the future.
A summary of the critical accounting policies requiring management estimates follows:
(a) We recognize revenue when goods are shipped from our warehouse and other third-partydistribution locations, at which point our customers take ownership and assume risk of loss.In certain circumstances, we sell products to customers under special arrangements, whichprovide for return privileges, discounts, promotions and other sales incentives. At the time werecognize revenue, we reduce our measurement of revenue by an estimated cost of potentialfuture returns and allowable retailer promotions and incentives, recognizing as well a corre-sponding reduction in our reported accounts receivable. These estimates have traditionallybeen sensitive to and dependent on a variety of factors including, but not limited to, quantitiessold to our customers and the related selling and marketing support programs; channels ofdistribution; retail sale rates; acceptance of the styling of our product by consumers; overalleconomic environment; consumer confidence leading towards and through the holidayseason; and other factors. Allowances for returns established at the end of 2004 and 2003 were approximately $4.1 million and $7.8 million, respectively. Furthermore, allowances for promotions and other sales incentives established at the end of 2004 and 2003 wereapproximately $8.0 million and $10.5 million, respectively. The decrease in the dollar amount of both return and promotion allowances is mainly due to the change in our business model, which includes a more customer-specific sell-in approach. The decrease alsoreflects our initiatives of being more responsive to our customers by assisting in promotinggoods in season and attempting to reduce returns accordingly. During 2004, 2003 and 2002,we recorded approximately $4.0 million, $8.1 million, and $11.6 million as the sales value of merchandise returned by our customers. During 2004, 2003, and 2002, we recorded approx-imately $10.7 million, $11.4 million, and $13.6 million in charges to earnings in those yearsfor consumer promotion activities undertaken with our customers. As our business model isfurther implemented in 2005, and given the continuously changing retail environment, andour short experience with the new operating model, it is possible that allowances for returns,promotions and other sales incentives, and the related charges reported in our consolidatedresults of operations for these activities could be different than those estimates noted above.
(b) We value inventories using the lower of cost or market, based upon the first-in, first-out(“FIFO”) costing method. We evaluate our inventories for any impairment in realizable valuein light of our prior selling season, the overall economic environment, and our expectationsfor the upcoming selling seasons, and we record the appropriate write-downs under thecircumstances. At the end of 2004, we estimated that the FIFO cost of our inventory exceededthe estimated net realizable value of that inventory by $1.6 million, compared with a similarestimate of $5.9 million made at the end of 2003. This decrease is mainly due to the change in our business model, which resulted in a more customer-targeted product offering in the fallof 2004 and included more aggressive initiatives to reduce our inventory investment. Inventorywrite-downs, recognized as part of cost of sales for continuing operations, amounted to $2.1million during 2004, $5.4 million during 2003, and $1.7 million during 2002. Inventorywrite-downs, recognized as part of cost of sales for discontinued operations, totaled $7thousand during 2004, $1.2 million during 2003, and $1.2 million during 2002. As noted above, given our short experience with the new business model and considering
Introduction
Critical AccountingPolicies and Use ofSignificant Estimates
8
MANAGEMENT’S DISCUSSION & ANALYSIS OF
FINANCIAL CONDITION & RESULTS OF OPERATIONS
R.G. Barry Corporation and Subsidiaries (continued)
the ever-changing retail landscape, it is possible that our estimates to represent our inventory at the net realizable value could be different than those reported in previous years.
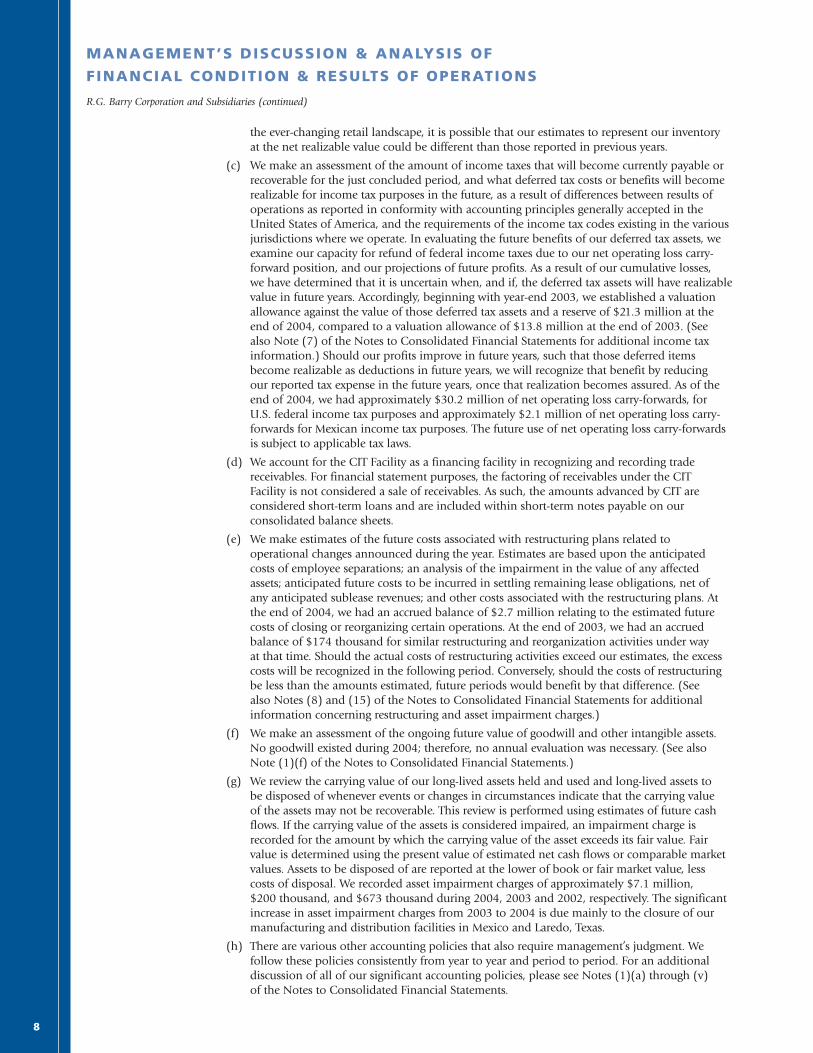
(c) We make an assessment of the amount of income taxes that will become currently payable orrecoverable for the just concluded period, and what deferred tax costs or benefits will becomerealizable for income tax purposes in the future, as a result of differences between results ofoperations as reported in conformity with accounting principles generally accepted in theUnited States of America, and the requirements of the income tax codes existing in the variousjurisdictions where we operate. In evaluating the future benefits of our deferred tax assets, weexamine our capacity for refund of federal income taxes due to our net operating loss carry-forward position, and our projections of future profits. As a result of our cumulative losses, we have determined that it is uncertain when, and if, the deferred tax assets will have realizablevalue in future years. Accordingly, beginning with year-end 2003, we established a valuationallowance against the value of those deferred tax assets and a reserve of $21.3 million at theend of 2004, compared to a valuation allowance of $13.8 million at the end of 2003. (See also Note (7) of the Notes to Consolidated Financial Statements for additional income taxinformation.) Should our profits improve in future years, such that those deferred itemsbecome realizable as deductions in future years, we will recognize that benefit by reducing our reported tax expense in the future years, once that realization becomes assured. As of theend of 2004, we had approximately $30.2 million of net operating loss carry-forwards, for U.S. federal income tax purposes and approximately $2.1 million of net operating loss carry-forwards for Mexican income tax purposes. The future use of net operating loss carry-forwardsis subject to applicable tax laws.
(d) We account for the CIT Facility as a financing facility in recognizing and recording tradereceivables. For financial statement purposes, the factoring of receivables under the CIT Facility is not considered a sale of receivables. As such, the amounts advanced by CIT areconsidered short-term loans and are included within short-term notes payable on ourconsolidated balance sheets.
(e) We make estimates of the future costs associated with restructuring plans related to operational changes announced during the year. Estimates are based upon the anticipatedcosts of employee separations; an analysis of the impairment in the value of any affectedassets; anticipated future costs to be incurred in settling remaining lease obligations, net of any anticipated sublease revenues; and other costs associated with the restructuring plans. Atthe end of 2004, we had an accrued balance of $2.7 million relating to the estimated futurecosts of closing or reorganizing certain operations. At the end of 2003, we had an accruedbalance of $174 thousand for similar restructuring and reorganization activities under way at that time. Should the actual costs of restructuring activities exceed our estimates, the excesscosts will be recognized in the following period. Conversely, should the costs of restructuringbe less than the amounts estimated, future periods would benefit by that difference. (See also Notes (8) and (15) of the Notes to Consolidated Financial Statements for additionalinformation concerning restructuring and asset impairment charges.)
(f) We make an assessment of the ongoing future value of goodwill and other intangible assets.No goodwill existed during 2004; therefore, no annual evaluation was necessary. (See alsoNote (1)(f) of the Notes to Consolidated Financial Statements.)
(g) We review the carrying value of our long-lived assets held and used and long-lived assets to be disposed of whenever events or changes in circumstances indicate that the carrying value of the assets may not be recoverable. This review is performed using estimates of future cashflows. If the carrying value of the assets is considered impaired, an impairment charge isrecorded for the amount by which the carrying value of the asset exceeds its fair value. Fairvalue is determined using the present value of estimated net cash flows or comparable marketvalues. Assets to be disposed of are reported at the lower of book or fair market value, less costs of disposal. We recorded asset impairment charges of approximately $7.1 million, $200 thousand, and $673 thousand during 2004, 2003 and 2002, respectively. The significantincrease in asset impairment charges from 2003 to 2004 is due mainly to the closure of ourmanufacturing and distribution facilities in Mexico and Laredo, Texas.
(h) There are various other accounting policies that also require management’s judgment. Wefollow these policies consistently from year to year and period to period. For an additionaldiscussion of all of our significant accounting policies, please see Notes (1)(a) through (v) of the Notes to Consolidated Financial Statements.

9
MANAGEMENT’S DISCUSSION & ANALYSIS OF
FINANCIAL CONDITION & RESULTS OF OPERATIONS
R.G. Barry Corporation and Subsidiaries (continued)
Actual results may vary from these estimates as a consequence of activities after the period-endestimates have been made. These subsequent activities will have either a positive or negative impactupon the results of operations in a period subsequent to the period when we originally made theestimate.
In early 2004, we developed and implemented a new business model in order to respond to thesignificant operating losses that we experienced in prior years. This new model focuses primarily on reducing our operating costs by simplifying our product offerings and streamlining the overheadmanagement structure throughout all areas of our Company.
In summary, the following are key actions taken in 2004 related to our new business model andother events that impacted our 2004 operating results. These accomplishments and events arediscussed in further detail below.
New Business Model ■ In January 2004, we engaged The Meridian Group (“Meridian”), a turnaround consulting firm,
to assist us in developing a new business model.
■ On March 10, 2004, Mr. Thomas M. Von Lehman, former principal with Meridian, was hired as President and CEO. On February 24, 2005, Mr. Von Lehman’s employment agreement wasextended through March 31, 2006.
■ On March 29, 2004, we entered into a three-year financing agreement (the “CIT Facility”) withThe CIT Group/Commercial Services, Inc. (“CIT”). Following the closing of the CIT facility, weretired all outstanding indebtedness with The Huntington National Bank. In addition, on thatdate, we repaid all outstanding indebtedness under our Note Agreement with Metropolitan LifeInsurance Company. See “Liquidity and Capital Resources” below.
■ We transitioned to a 100 percent outsourcing model that supported our fall 2004 business,relying on third party contract manufacturers in China, without significant delivery or qualityissues.
■ During the year, we sold approximately $8.0 million of slow-moving and closeout type products and, in combination with other initiatives, reduced our finished goods inventories by approximately 3 million pairs.
■ We completed the closure of our manufacturing and distribution facilities in Mexico and Laredo,Texas in late September 2004. Distribution of our goods is now done primarily through ourdistribution center in San Angelo, Texas and a third-party logistics supplier located on the West Coast of the United States.
■ With the assistance of an auctioning firm, in early August 2004, we sold all of our machinery and equipment located in our former manufacturing facilities in Mexico.
■ We streamlined our management structure and reduced our selling, general and administrativeexpenses, consistent with our simplified business model. This initiative involved personnelreductions at our headquarters in Ohio and the closure of our operations support office in San Antonio, Texas in late December 2004.
Other Events ■ As a result of the closure of our manufacturing and distribution facilities in Mexico and Laredo,
Texas, the cessation of support activities in San Antonio, Texas, and other reductions in overheadexpenses at our Ohio headquarters, we recorded restructuring and asset impairment charges in2004 of $17.4 million. These charges were a major component of our operating loss of $19.2million for 2004.
■ As a result of our cumulative losses in five of the last six years, we have fully reserved the value of our deferred tax assets in the amount of $21.3 million as of the end of 2004. In addition, as of the end of 2004, we had approximately $30.2 million of net operating loss carry-forwards for U.S. federal income tax purposes and approximately $2.1 million of net operating loss carry-forwards for Mexican income tax purposes. Net operating loss carry-forwards in the United Statesare generally available for up to twenty years, while net operating loss carry-forwards in Mexicoare available for up to ten years.
The results of our operations are discussed later in this narrative.
Summary of Results for 2004

10
MANAGEMENT’S DISCUSSION & ANALYSIS OF
FINANCIAL CONDITION & RESULTS OF OPERATIONS
R.G. Barry Corporation and Subsidiaries (continued)
Refining Our Business Model in 2005
As previously discussed, during the first quarter of 2004, we successfully developed and beganimplementation of a new business model. Although the consequences of adopting this model were costly, as reflected in our consolidated results of operations, we believe the actions taken were necessary to stabilize and position our Company for a return to profitability. The 2004 fourthquarter results evidence the positive impact of the changes made to our business model. Whencompared to the same period a year earlier, we reported higher gross profit as a percent of net sales, lower operating costs, and our best fourth quarter earnings performance since 2001.
Going forward, we expect to aggressively focus on refining the new business model and formalizingrelated processes; revitalizing the image of our Company as well as the Dearfoams family of brands;and meeting or exceeding the expectations of our customers and consumers with fresh, innovatingthinking. We believe our future business and operating models will result in fewer significantchanges than those experienced during 2004. However, due to the seasonality of our business, theremay still be significant inherent risk in our model that we have not yet recognized. See the “RiskFactors” section below.
Historically, we have utilized numerous types of assets in the development, sourcing, marketing,warehousing, distribution, and sale of our products. Most of our assets are current assets, such ascash, trade receivables, inventory, and prepaid expenses.
At the end of 2004, current assets amounted to 85 percent of total assets, compared with 72 percentat the end of 2003. As of the end of 2004, we had $14.9 million in net working capital, made up of $33.1 million in current assets, less $18.2 million in current liabilities. As of the end of 2003, wehad net working capital of $25.8 million, made up of $44.4 million in current assets, less $18.5million in current liabilities. The $10.9 million decline in net working capital from 2003 to 2004 is primarily attributable to the net effect of a reduction in net inventories of approximately $12.6million and an increase of approximately $3.8 million in net trade receivables. The reduction ininventories is consistent with the change in our operating model, which includes a shift to 100percent outsourcing of products from third-party manufacturers, combined with a more consumer-focused product offering and sell-in approach for the fall season of 2004. The increase in net tradereceivables was mainly due to a lower returns allowance reported at the end of 2004 versus 2003.Lower returns resulted primarily from a combination of better than expected retail sale rates insome of our product lines, the initiatives to assist our customers in promoting certain productsduring the holiday season, and our more restrictive returns policy.
We ended 2004 with $958 thousand in cash, $9.2 million in trade receivables, net of allowances,and $20.2 million in inventory. By comparison, at the end of 2003, we had $2.0 million in cash,$5.4 million in net trade receivables, and $32.8 million in inventory. The increase in ending tradereceivables, net of returns and promotions allowances, is primarily due to a lower returns reserverecorded in 2004 as compared to the previous year. As noted above, this is consistent with our new business model that includes a more customer-focused sell-in approach and a more restrictivereturns policy. The reduction in inventories is a clear reflection of the changes in our supply chainprocesses and other changes to our business model implemented during 2004 as we transitionedour supply of goods to 100 percent outsourcing and sold a significant amount of closeout-typeproducts.
A key element of our new operating model is the reduction of our finished goods inventory. As noted above, during 2004, we made significant progress in establishing processes to align ourinventory investment with the expected demand for our products. As a result of this initiative, we were successful in selling slow-moving, closeout-type products, generating approximately $8.0million in cash. As in previous years, we have evaluated our on-hand inventory and have takenappropriate write-downs in 2004 to value our inventory at the expected net realizable value. (Seealso the discussion above regarding critical accounting policies relating to inventory and Note (2)of the Notes to Consolidated Financial Statements for more information regarding our inventory.)
Liquidity and Capital Resources

11
MANAGEMENT’S DISCUSSION & ANALYSIS OF
FINANCIAL CONDITION & RESULTS OF OPERATIONS
R.G. Barry Corporation and Subsidiaries (continued)
We reported $6.4 million in accrued expenses at the end of 2004 compared to $5.2 million at the end of 2003. The increase in accrued expenses is due primarily to the increase in restructuringcharges related to the closure of our operations in Mexico and Laredo and San Antonio, Texas,which includes accruals for employee separation and noncancelable lease costs.
During 2004, we had capital expenditures of approximately $122 thousand and received proceedsof approximately $965 thousand from the disposition of assets. The disposition of assets wasrelated to the closing of our manufacturing and distribution activities in Mexico and Laredo, Texas. Capital expenditures during 2003 were approximately $1.7 million, while proceeds from thedisposition of assets totaled approximately $1.2 million. The capital expenditures in 2003 reflectthe level of capital investment, which had been reflective of our prior operating and manufacturingmodel. The proceeds from the disposition of assets in 2003 related to the sale of our warehouse inGoldsboro, North Carolina.
Based on the changes made during 2004 to create a lower-cost, more- efficient business model, andthe CIT ABL Facility, as discussed below, we believe there should be sufficient liquidity and capitalresources to fund our operations through fiscal 2005, including our anticipated restructuring costsaccrued for at the end of 2004.
CIT Credit Facilities
For many years, we relied on unsecured credit agreements to satisfy our seasonal and long-termcapital liquidity needs. Our former primary lending institutions, The Huntington National Bank(“Huntington”) and Metropolitan Life Insurance Company (“Metropolitan”) accommodated ourborrowing requirements and provided us with needed liquidity, occasionally modifying provisionsof the loan agreements as necessary. During 2002, we entered into a Revolving Credit Agreement(“Revolver”) with Huntington to refinance the previous revolving credit agreement. As part of theRevolver, we granted Huntington and Metropolitan a security interest in substantially all of ourassets to secure our obligations to Huntington under the Revolver and our obligations under ourNote Agreement dated July 5, 1994, as amended, with Metropolitan (“Loan Agreement”). Largely,as a result of our significant continuing losses in 2003 and 2002, we were unable to meet a numberof the financial covenants included in both the Loan Agreement and the Revolver, as amended.
On March 29, 2004, we entered into the CIT Facility. On March 30, 2004, we borrowed approx-imately $10.3 million under the CIT Facility to repay all outstanding indebtedness and relatedcharges under the Revolver and terminated that agreement. In addition, on that date we borrowedapproximately $2.3 million under the CIT Facility to repay all outstanding indebtedness under ourLoan Agreement with Metropolitan and terminated that agreement as well.
The CIT Facility provided us with advances in a maximum amount equal to the lesser of (i) $35million or (ii) a Borrowing Base (as defined in the CIT Facility). The CIT Facility was a discretionaryfacility, meaning that CIT was not contractually obligated to advance us funds.
Our obligations under the CIT Facility were secured by a first priority lien and mortgage onsubstantially all of our assets, including accounts receivable, inventory, intangibles, equipment,intellectual property and real estate. In addition, we pledged to CIT the stock in our U.S. wholly-owned subsidiaries and the subsidiaries guaranteed our indebtedness under the CIT Facility.
On March 31, 2005, we entered into a new asset-based financing agreement (the “CIT ABLFacility”) with CIT. The CIT ABL Facility replaces the CIT Facility. The CIT ABL Facility is a two-yearcommitted facility under which CIT is obligated to advance us funds so long as we comply with theCIT financing agreement, including satisfying covenants requiring that we meet various financialcondition and financial performance requirements.
Under the CIT ABL Facility, we are required to meet various financial covenants including: (a) minimum Tangible Net Worth at the end of each fiscal quarter of 2005 and 2006; (b) negativeEarnings Before Income Taxes, Depreciation, and Amortization (excluding certain extraordinary or nonrecurring gains and losses), for the two fiscal quarters ended June 30, 2005, not exceeding a specified level; (c) Minimum Net Availability at the end of each fiscal year beginning in 2005; and (d) a minimum Fixed Charge Coverage Ratio test at the end of fiscal 2005 and each 12-monthperiod ending at the end of each fiscal quarter thereafter. The foregoing capitalized terms aredefined in the CIT ABL Facility. We currently believe we can meet these financial covenants in 2005.
2005 Liquidity

The CIT ABL Facility provides us with advances in a maximum amount equal to the lesser of (a) $35 million or (b) a Borrowing Base (as defined in the CIT ABL Facility). The Borrowing Base is determined by the agreement and is based primarily on the sum of (i) the amount of 80% of thereceivables due under the factoring agreement, if any, and 80% of our total eligible accounts receiv-able; (ii) the amount of our eligible inventory; (iii) a $3.5 million overformula availability duringour peak borrowing season from April through October; and (iv) a $4.0 million allowance on our eligible intellectual property from January 1 to October 31. The CIT ABL Facility includes a $3 million subfacility for CIT’s guarantee of letters of credit that is counted against the maximumborrowing amount noted above.
Interest on the CIT ABL Facility is initially at a rate per annum equal to the JPMorgan Chase Bankprime rate plus 1%. In the event that we satisfy various requirements as of the end of fiscal 2005,the rate per annum may be reduced to the JPMorgan Chase Bank prime rate plus 0.5%. Eachmonth, when our borrowing needs require inclusion of the $3.5 million overformula in theBorrowing Base, the interest rate will be increased by 0.5%.
As part of the CIT Facility, we entered into a factoring agreement with CIT, under which CITpurchased accounts receivable that met CIT’s eligibility requirements. Although the CIT ABL Facilityis intended to replace our current factoring arrangement with CIT, the factoring agreement willremain in effect for all accounts currently being factored under that agreement. However, goingforward, the CIT ABL Facility will be the exclusive loan facility between us and CIT and noadditional accounts will be factored and no further advances will be made by CIT under thefactoring agreement.
The liens and mortgage that secured the original CIT Facility remain in place and have beenamended and modified to secure the new CIT ABL Facility. In addition, the pledge agreement andthe subsidiary guarantees entered into in connection with the original CIT Facility have also beenamended to secure the new CIT ABL Facility.
Other Short-term Debt
Early in March 2004, we borrowed $2.2 million against the cash surrender value of the lifeinsurance policies insuring our non-executive chairman. This $2.2 million indebtedness is classified as short-term notes payable in the consolidated balance sheets. At the end of 2003, ourother short-term debt was $2.0 million, represented by the amount outstanding under the Revolver.
Off-Balance Sheet Arrangements
We have traditionally leased facilities under operating lease transactions for varying term lengths,ranging generally from three years to fifteen years, often with options for renewal. On occasion, we have also leased certain equipment utilizing operating leases. These leasing arrangements have allowed us to pay for the facilities and equipment over the time that they are utilized, ratherthan committing our resources initially to acquire the facilities or equipment. All leases have been accounted for as operating leases, consistent with the provisions of Statement of FinancialAccounting Standards (“SFAS”) No. 13, Accounting for Leases, as amended. Our future off-balancesheet non-cancelable operating lease obligations are discussed in Note (6) of the Notes toConsolidated Financial Statements.
12
MANAGEMENT’S DISCUSSION & ANALYSIS OF
FINANCIAL CONDITION & RESULTS OF OPERATIONS
R.G. Barry Corporation and Subsidiaries (continued)
Other MattersImpacting Liquidity
and Capital Resources
13
MANAGEMENT’S DISCUSSION & ANALYSIS OF
FINANCIAL CONDITION & RESULTS OF OPERATIONS
R.G. Barry Corporation and Subsidiaries (continued)
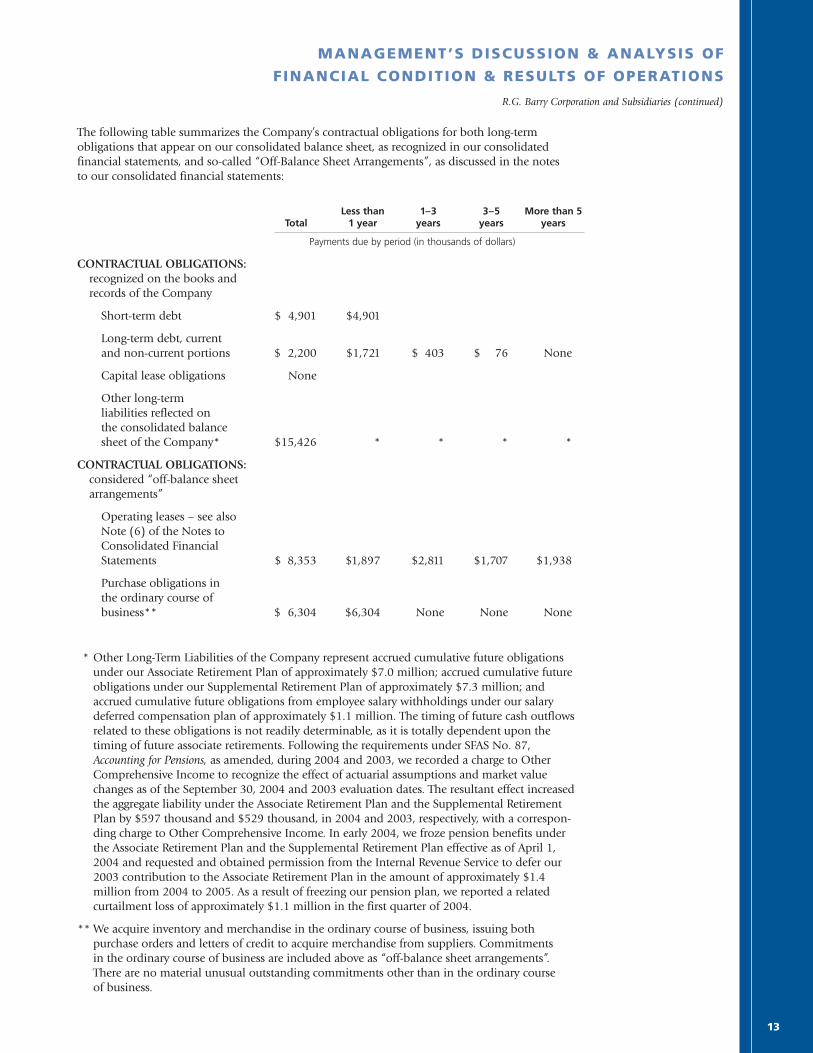
The following table summarizes the Company’s contractual obligations for both long-termobligations that appear on our consolidated balance sheet, as recognized in our consolidatedfinancial statements, and so-called “Off-Balance Sheet Arrangements”, as discussed in the notes to our consolidated financial statements:
Less than 1–3 3–5 More than 5Total 1 year years years years
Payments due by period (in thousands of dollars)
CONTRACTUAL OBLIGATIONS:recognized on the books and records of the Company
Short-term debt $ 4,901 $4,901
Long-term debt, currentand non-current portions $ 2,200 $1,721 $ 403 $ 76 None
Capital lease obligations None
Other long-termliabilities reflected onthe consolidated balancesheet of the Company* $15,426 * * * *
CONTRACTUAL OBLIGATIONS:considered “off-balance sheet arrangements”
Operating leases – see also Note (6) of the Notes to Consolidated Financial Statements $ 8,353 $1,897 $2,811 $1,707 $1,938
Purchase obligations in the ordinary course of business** $ 6,304 $6,304 None None None
* Other Long-Term Liabilities of the Company represent accrued cumulative future obligationsunder our Associate Retirement Plan of approximately $7.0 million; accrued cumulative futureobligations under our Supplemental Retirement Plan of approximately $7.3 million; andaccrued cumulative future obligations from employee salary withholdings under our salarydeferred compensation plan of approximately $1.1 million. The timing of future cash outflowsrelated to these obligations is not readily determinable, as it is totally dependent upon thetiming of future associate retirements. Following the requirements under SFAS No. 87,Accounting for Pensions, as amended, during 2004 and 2003, we recorded a charge to OtherComprehensive Income to recognize the effect of actuarial assumptions and market valuechanges as of the September 30, 2004 and 2003 evaluation dates. The resultant effect increasedthe aggregate liability under the Associate Retirement Plan and the Supplemental RetirementPlan by $597 thousand and $529 thousand, in 2004 and 2003, respectively, with a correspon-ding charge to Other Comprehensive Income. In early 2004, we froze pension benefits underthe Associate Retirement Plan and the Supplemental Retirement Plan effective as of April 1,2004 and requested and obtained permission from the Internal Revenue Service to defer our2003 contribution to the Associate Retirement Plan in the amount of approximately $1.4million from 2004 to 2005. As a result of freezing our pension plan, we reported a relatedcurtailment loss of approximately $1.1 million in the first quarter of 2004.
** We acquire inventory and merchandise in the ordinary course of business, issuing both purchase orders and letters of credit to acquire merchandise from suppliers. Commitments in the ordinary course of business are included above as “off-balance sheet arrangements”. There are no material unusual outstanding commitments other than in the ordinary course of business.

14
MANAGEMENT’S DISCUSSION & ANALYSIS OF
FINANCIAL CONDITION & RESULTS OF OPERATIONS
R.G. Barry Corporation and Subsidiaries (continued)
We last paid cash dividends in 1981. We have no current plans to resume payment of cashdividends or to acquire common shares for treasury. We anticipate continuing to use our cashresources to fund the operating needs of the business.
At times we have entered into foreign currency contracts, as noted in the discussion below underthe heading “Other Matters Relevant to Financial Condition and Results of Operations – ForeignCurrency Risk,” to hedge currency risk exposures that we have identified. However, as of the end of 2004 and 2003, we had no foreign currency contracts outstanding. If outstanding, currencycontracts utilized as hedges would be included as “off-balance sheet arrangements” as well.
Discontinued Operations
In June 2003, we sold substantially all of our thermal products assets to a corporation formed by investors headed by a co-founder and former chief executive officer of RGB Technology, Inc., our subsidiary formerly known as Vesture Corporation (“RGB Technology”). This sale involved our Company selling certain assets and the buyer assuming certain liabilities. As partial payment for amounts owing from the buyer, the buyer delivered to us a promissory note in the principalamount of $334 thousand. The promissory note was due and payable in full on December 1, 2004. As of the end of 2003, we had reserved the full amount of this note for doubtful collection.During 2004, we received from the buyer $334 thousand mainly related to this promissory note.We recorded this payment as part of earnings from discontinued operations in the consolidatedstatements of operations.
As additional consideration for the assets transferred, the buyer has agreed to pay us through theyear 2007 annual royalties based on a percentage of the buyer’s annual sales of certain products inexcess of specific thresholds. We do not expect future royalty payments, if any, to be material to ourCompany’s overall results of operations or financial position.
With the disposal of the thermal products related assets, we have discontinued the thermal prod-ucts business segment. The disposition of these assets represents a disposal of a business segmentunder SFAS No. 144, Accounting for the Impairment or Disposal of Long-Lived Assets. Accordingly, theresults of this operation have been classified as discontinued and financial data for all periods hasbeen reclassified as discontinued operations.
Selected financial data relating to the discontinued operations has been included in Note (16) ofthe Notes to Consolidated Financial Statements.
Restructuring Activities
As discussed above, during 2004 we developed and implemented a new operating model thatcaused us to undertake certain significant restructuring initiatives. These initiatives primarilyincluded closing our manufacturing and distribution facilities in Mexico, closing our cross-docklocation in Laredo, Texas, closing our operations support office in San Antonio, Texas, and reducingoverhead costs in our Columbus, Ohio headquarters. As a result of these initiatives, we reduced our total number of associates by approximately 1,800. We believe the results of these initiativeshave so far met the objectives of what we set out to do as part of our business plan to return toprofitability. The benefits of these initiatives are evident in our 2004 fourth quarter results as wereported higher gross profit as a percent of net sales and lower operating costs as compared to thesame period a year earlier, and posted our best fourth quarter earnings performance since 2001.
Prior to 2004, we undertook a number of actions designed to improve our operating performance.These actions spanned a variety of operations affecting the manufacturing and distribution ofproducts for our domestic and international customers. As reflected in previous years’ results and discussed below in the comparison of results of operations from 2003 to 2002, these actionsproved to be inadequate and fell short of achieving the desired results, which gave rise to the needto implement a new business model in 2004.
Results of Operations
15
MANAGEMENT’S DISCUSSION & ANALYSIS OF
FINANCIAL CONDITION & RESULTS OF OPERATIONS
R.G. Barry Corporation and Subsidiaries (continued)
2004 Sales and Continuing Operations Compared with 2003
We operate in two different business segments: “Barry Comfort North America”, which manufac-tures and markets at- and around-the-home comfort footwear for sale in North America; and “BarryComfort Europe”, which markets footwear principally in Western Europe. See also Note (14) of theNotes to Consolidated Financial Statements for a breakdown of net sales by geographic region andby segment of our operations.
During 2004, net sales from continuing operations totaled $104.4 million, a decrease of approxi-mately 15.2 percent from 2003. Net sales for Barry Comfort North America decreased 15.5 percentin 2004 to $96.3 million from $113.9 million in 2003. The decrease in net sales for Barry ComfortNorth America occurred principally among our department store customers and reflects in part theinitiatives undertaken in 2004 to build a new operating model by simplifying our product offeringand servicing a core of key customers profitably. The decrease in net sales was also due to thenegative impact of customer concerns regarding our liquidity challenges in early 2004, their adverse reaction to our more restrictive returns policy, and competition from in-store private labelprograms. We intend to continue to examine our internal processes and undertake the necessaryinitiatives to provide new styling of our comfort footwear, with continued focus on fresh product,delivered complete and on-time to our customers.
Net sales for Barry Comfort Europe decreased to $8.1 million in 2004 from $9.3 million in 2003.The decrease in net sales in Europe was primarily due to a reduction of business within the exportchannels of our Fargeot subsidiary. This decrease primarily resulted from the strengthening of theEuro currency as compared to the dollar and other world currencies.
Gross profit in 2004 decreased to approximately $37.3 million from $42.7 million in 2003. Grossprofit as a percent of net sales increased to 35.8 percent in 2004, compared to 34.7 percent in 2003.The increase in gross profit as a percent of net sales is due primarily to the benefit of lower costpurchases from third-party suppliers of outsourced goods. The benefit of lower cost purchasesbegan to reflect itself during the second half of the year and even more so in the last quarter of2004. As a result of our closing operations in Mexico, we became dependent upon third-partymanufacturers and now outsource 100 percent of our product needs. As part of the new model, we expect to be more cost competitive and to improve our gross profit percent performance in the future.
Selling, general and administrative (“SG&A”) expenses declined significantly by $9 million in 2004to $39.2 million, compared with $48.2 million in 2003. The decrease occurred primarily in three of our key business expense areas noted as follows. First, approximately $3.6 million of the totalyear-on-year reduction in SG&A expenses occurred in our selling and marketing expense areas andwas consistent with our new operating business model to be more customer-specific in our sellingactivities. Second, approximately $3.4 million of the decline in SG&A expenses from 2003 wasrelated to our closing of the support operations office in San Antonio, Texas. Lastly, approximately$1.8 million of the reduction in SG&A expenses was in shipping expenses and was also the result of our overall decision to exit manufacturing, distribution, and operations support activities inMexico and Laredo, Texas.
Restructuring and asset impairment charges recognized in 2004 amounted to $17.3 millioncompared with $2.6 million recognized in 2003. The significant increase in restructuring and asset impairment charges resulted primarily from the initiatives undertaken in 2004 to close allmanufacturing and distribution facilities in Mexico and Laredo, Texas. These charges primarilyinclude about $7.1 million in asset impairment charges, of which $4.2 million were impairmentcharges on our property, plant and equipment and approximately $2.7 million were impairmentcosts related to the unamortized duty acceleration balance, as discussed under the Acceleration ofNAFTA Tariff Reduction section below. Furthermore, the 2004 restructuring and asset impairmentcharges include about $4.2 million for employee separation costs; approximately $3.3 million innon-cancelable lease costs; and approximately $2.7 million reported in other exit costs. See alsoNote (15) of the Notes to Consolidated Financial Statements. In 2005, we do not expect to incursignificant restructuring and asset impairment charges related to new activities.
Results of ContinuingOperations

Net interest expense decreased slightly in 2004 to $1.3 million from $1.4 million in 2003. Thedaily average seasonal borrowings outstanding under the CIT Facility and the Revolver decreased to $16.3 million in 2004 from $19.5 million in 2003 under the Revolver. The weighted-averageinterest rate on short-term borrowings in 2004 increased to 5.2 percent from 3.9 percent in 2003,reflecting a general increase in market rates and the change in our lending arrangements with CIT.
Our operating results from continuing operations for 2004 reflect the results of several initiatives todevelop and establish a new operating model. Our business model transformation clearly came at asubstantial cost in both dollars and human resources. The pre-tax loss from continuing operationsincreased to $20.1 million in 2004 from a pre-tax loss of $9.3 million a year earlier. We recognizeda tax expense of $123 thousand, primarily foreign taxes incurred by our subsidiaries in Mexicothrough most of 2004. In 2003, our tax expense was approximately $10.1 million and was mostlyrelated to the valuation allowance established in that year against the deferred tax assets. See alsoNote (7) of the Notes to Consolidated Financial Statements.
Our net loss from continuing operations was $20.2 million in 2004 as compared to $19.4 millionloss from continuing operations a year earlier.
During 2004, we received from Vesture’s buyer $334 thousand mainly related to the promissorynote as final payment on the earlier sale of that business. During 2003, we reported a net loss fromdiscontinued operations of approximately $2.3 million. Including earnings from discontinuedoperations, we reported a total net loss of $19.9 million in 2004 compared with a total net loss of $21.7 million in 2003.
2003 Sales and Continuing Operations Compared with 2002
During 2003, net sales totaled $123.1 million, an increase of 3.4 percent from net sales of $119.0 million in 2002. Net sales in Barry Comfort North America increased in 2003 to $113.9million from $109.2 million in 2002, while net sales in Barry Comfort Europe decreased in 2003 to $9.3 million from $9.8 million in 2002. The increase in Barry Comfort North America occurredprincipally among our mass merchandising customers, with about one-third of that increase attrib-utable to our largest customer - Wal-Mart Stores, Inc. The decrease in Barry Europe was primarilydue to the change in our method of operations in Europe in early 2003 to a distributor/licenseagreement with a British footwear and apparel firm.
Gross profit increased slightly in 2003 to $42.7 million from $41.4 million a year earlier. As apercentage of net sales, gross profit remained relatively constant at 34.7 percent in 2003 and 34.8percent a year earlier. The benefits realized in 2003 as a result of the restructuring activities over theprior several years were offset by increased manufacturing variances incurred during 2003, and theneed to increase inventory write-downs recorded at the end of 2003. As noted in Note (2) of theNotes to the Consolidated Financial Statements, total inventory write-downs increased by $2.3million during 2003.
Selling, general and administrative expenses decreased during 2003 by approximately $2.2 millionto $48.2 million from $50.4 million a year earlier. Most of this decrease was represented in themarketing and administrative areas. Selling expenses in 2003 were relatively flat when compared tothose incurred in 2002. We estimate that expenses incurred in shipping and distribution increasedduring the third and fourth quarters of 2003 by approximately $2.0 million due to the additionalamount of inventory on-hand during the second half of that year.
Restructuring expenses and asset impairment charges recognized in 2003 reported as part ofcontinuing operations amounted to approximately $2.6 million compared to approximately $2.8 million in 2002. The charges recognized in 2003 were related primarily to the goodwillimpairment loss on our Fargeot subsidiary. The 2002 restructuring expenses and impairmentcharges were principally employee separation costs resulting from several reorganization actionsincluding reduction in sewing operations in Nuevo Laredo, Mexico, reduction in our sales andoperations staff; and closure of our distribution facility in Goldsboro, North Carolina.
Net interest expense increased to $1.4 million in 2003 from $1.3 million in 2002. During 2003, werelied more heavily on the Revolver to fund the daily operations of the business. The daily averageseasonal borrowings outstanding under the Revolver increased to $19.5 million in 2003 from $11.9million a year earlier. The weighted-average interest rate on short-term bank borrowings in 2003decreased slightly to 3.9 percent from 4.1 percent in 2002, reflecting the general decline in short-term market related interest rates year-on-year.
16
MANAGEMENT’S DISCUSSION & ANALYSIS OF
FINANCIAL CONDITION & RESULTS OF OPERATIONS
R.G. Barry Corporation and Subsidiaries (continued)

17
MANAGEMENT’S DISCUSSION & ANALYSIS OF
FINANCIAL CONDITION & RESULTS OF OPERATIONS
R.G. Barry Corporation and Subsidiaries (continued)
Our pre-tax loss from continuing operations decreased to $9.3 million in 2003 from $12.3 milliona year earlier. Even though we were unprofitable in 2003, we recorded a tax expense of $10.1million, primarily as a consequence of providing a valuation allowance of $13.8 million againstour deferred tax assets. Our total net loss for 2003 and 2002 was approximately $21.7 million and approximately $12.0 million, respectively.
Acceleration of NAFTA Tariff Reductions
Effective January 1, 2002, the 15% duties imposed by the United States on slippers coming fromMexico were eliminated. The duties had been scheduled for reduction at the rate of 2.5% per year,until the scheduled complete elimination on January 1, 2008. With the assistance of two consultingfirms, we were successful in accelerating the elimination of these duties and agreed to pay an aggre-gate amount of approximately $6.3 million, most of which is payable quarterly through 2005.
We computed the discounted cost associated with these future payments to be approximately $5.3million, which was to be recognized through cost of sales, proportionately over the years 2002 to2007. This recognition was based on the estimated benefit of duty elimination on our products asproduced and projected to be produced in Mexico over this six-year period. Consistent with ourmethod, in the first quarter of 2004, the year 2003 and the year 2002, we recognized approximately$251 thousand, $1.5 million and $873 thousand, respectively, of these costs and reported themwithin cost of sales. The unamortized balance of approximately $2.9 million and $4.4 million wasreported at the end of 2003 and 2002, respectively, and included in the “Other Assets” section ofour consolidated balance sheet. This asset classification was consistent with projected realization of the duty elimination benefits and expected recognition of those costs over the remaining yearsthrough 2007. As a result of our decision to discontinue manufacturing operations during the firstquarter 2004, the remaining unamortized balance of these costs, or approximately $2.7 million,was recognized as an impairment loss and reported within restructuring and asset impairmentcharges in the consolidated statements of operations reported for that period.
Foreign Currency Risk
A substantial portion of our sales were conducted in North America and denominated in USDollars during 2004. For any significant sales transactions denominated in other than US Dollars,our established policy guidelines require us to hedge against currency exposure on a short-termbasis, using foreign exchange contracts as a means to protect ourselves from fluctuations. At the end of fiscal 2004 and 2003, there were no such foreign exchange contracts outstanding.
Most of our product is purchased from third party manufacturers in China. While our business is conducted in US Dollars, should there be a change in the valuation of the Chinese Renminbi, the cost structure of our suppliers could change. A revaluation of the Renminbi could result in an increase in the costs of our products, depending upon the competitive environment and theavailability of alternative suppliers.
License Agreement for European Distribution
Early in January 2003, we entered into a five-year licensing agreement for the sale and marketing of our slipper products with a British footwear and apparel firm. This distributor-type licenseagreement allows us to continue servicing the soft washable footwear market in Europe withoutincurring overhead costs in support of our own selling, warehousing, and distribution operations as we once had in the mid-1990’s. We do not expect the annual royalty fees resulting from thisagreement to be significant to the overall operations of our business. We continue to maintain our Fargeot footwear subsidiary, which operates in southern France. Fargeot is not part of thislicense agreement.
Other MattersRelevant to FinancialCondition and Resultsof Operations

“30-day Letter” from the Internal Revenue Service
On June 8, 2004, we received a “30-day letter” from the Internal Revenue Service (“IRS”) proposing certain adjustments which, if sustained, would result in an additional tax obligationapproximating $4.0 million plus interest. The proposed adjustments relate to the years 1998through 2002. Substantially all of the proposed adjustments relate to the timing of certaindeductions taken during that period. On July 7, 2004, we submitted to the IRS a letter protestingthe proposed adjustments, and reiterating our position. We intend to vigorously contest theproposed adjustments by the IRS. In our opinion, the resolution of these matters is not expected to have a material adverse effect on our Company’s financial position or results of operations.
Some of the information in this Annual Report to Shareholders contains forward-lookingstatements that involve substantial risks and uncertainties. You can identify these statements byforward-looking words such as “may,” “will,” “expect,” “anticipate,” “believe,” “estimate,” or similarwords. These statements, which are forward-looking statements as that term is defined in thePrivate Securities Litigation Reform Act of 1995, are based upon our current plans and strategiesand reflect our current assessment of the risks and uncertainties related to our business. You shouldread statements that contain forward-looking statements carefully because they (1) discuss ourfuture expectations; (2) contain projections of our future results of operations or of our futurefinancial conditions; or (3) state other “forward-looking” information. The risk factors describedbelow, as well as any other cautionary language in this Annual Report to Shareholders, give exam-ples of the types of uncertainties that may cause our actual performance to differ materially fromthe expectations we describe in our forward-looking statements. You should know that if the eventsdescribed in this section and elsewhere in this Annual Report to Shareholders occur, they couldhave a material adverse effect on our business, operating results and financial condition.
The following are the most significant risk factors in our business.
Risk Factors ■ The Company’s ability to continue sourcing products from outside North America without
negatively impacting delivery times or product quality under its new business model.
■ The ability of the Company to meet certain minimum covenants regarding its financialcondition and financial performance requirements as described in the CIT ABL Facility. While we believe we can comply with such covenants in 2005, our ability to do so assumes that (i) thecost benefits of our new business model continue in 2005; (ii) we experience no major loss ofcustomers; and (iii) the Company continues to be able to source products without incurringsubstantial unplanned costs.
■ The Company’s ability to maintain its inventory levels in accordance with its plans and achieveadequate levels of working capital.
■ The continued demand for the Company’s products by its customers and consumers, especiallyduring the critical holiday season.
■ The ability of the Company to successfully compete on quality, fashion, service, selection, and price.
■ The ability of the Company to finalize the exiting of certain lease obligations related to ourdistribution facilities in Nuevo Laredo, Mexico and Laredo, Texas and our former office in San Antonio, Texas without incurring substantial unplanned costs or experiencing unforeseendifficulties.
■ The Company’s ability to resolve its dispute with the IRS, as described above, without incurringsubstantial liability.
■ The impact of competition on the Company’s market share.
■ The ability of the Company to retain key executives and successfully manage a succession planfor members of its senior management.
18
MANAGEMENT’S DISCUSSION & ANALYSIS OF
FINANCIAL CONDITION & RESULTS OF OPERATIONS
R.G. Barry Corporation and Subsidiaries (continued)
Forward-lookingStatements

19
CONSOLIDATED BALANCE SHEETS
R.G. Barry Corporation and Subsidiaries
January 1, 2005 January 3, 2004
(in thousands, except per share data)
ASSETSCurrent assets:
Cash and cash equivalents $ 958 $ 2,012Accounts receivable:
Trade (less allowance for doubtful receivables, returns andpromotions of $12,095 and $18,494, respectively) 9,244 5,403
Other 897 1,715Inventory 20,192 32,797Prepaid expenses 1,791 2,452
Total current assets 33,082 44,379
Property, plant and equipment, at cost 13,705 35,274Less accumulated depreciation and amortization 10,987 25,905
Net property, plant and equipment 2,718 9,369
Other assets 3,292 7,532
Total assets $39,092 $61,280
LIABILITIES AND SHAREHOLDERS’ EQUITYCurrent liabilities:
Short-term notes payable $ 4,901 $ 2,000Current installments of long-term debt 1,721 3,869Accounts payable 5,200 7,484Accrued expenses 6,387 5,180
Total current liabilities 18,209 18,533
Accrued retirement cost, excluding current liability 14,304 13,619Long-term debt, excluding current installments 479 2,141Other 1,122 1,222
Total liabilities 34,114 35,515
Minority interest — 378Shareholders’ equity:
Preferred shares, $1 par value per share. Authorized 3,775 Class A shares,225 Series I Junior Participating Class A shares, and 1,000 Class B shares; none issued — —
Common shares, $1 par value per share. Authorized 22,500 shares; issued and outstanding 9,836 and 9,834 shares(excluding treasury shares of 910 and 912) 9,836 9,834
Additional capital in excess of par value 12,851 12,851Deferred compensation (19) (84)Accumulated other comprehensive loss (3,981) (3,370)Retained earnings (deficit) (13,709) 6,156
Net shareholders’ equity 4,978 25,387
Total liabilities and net shareholders’ equity $39,092 $61,280
See accompanying notes to consolidated financial statements.
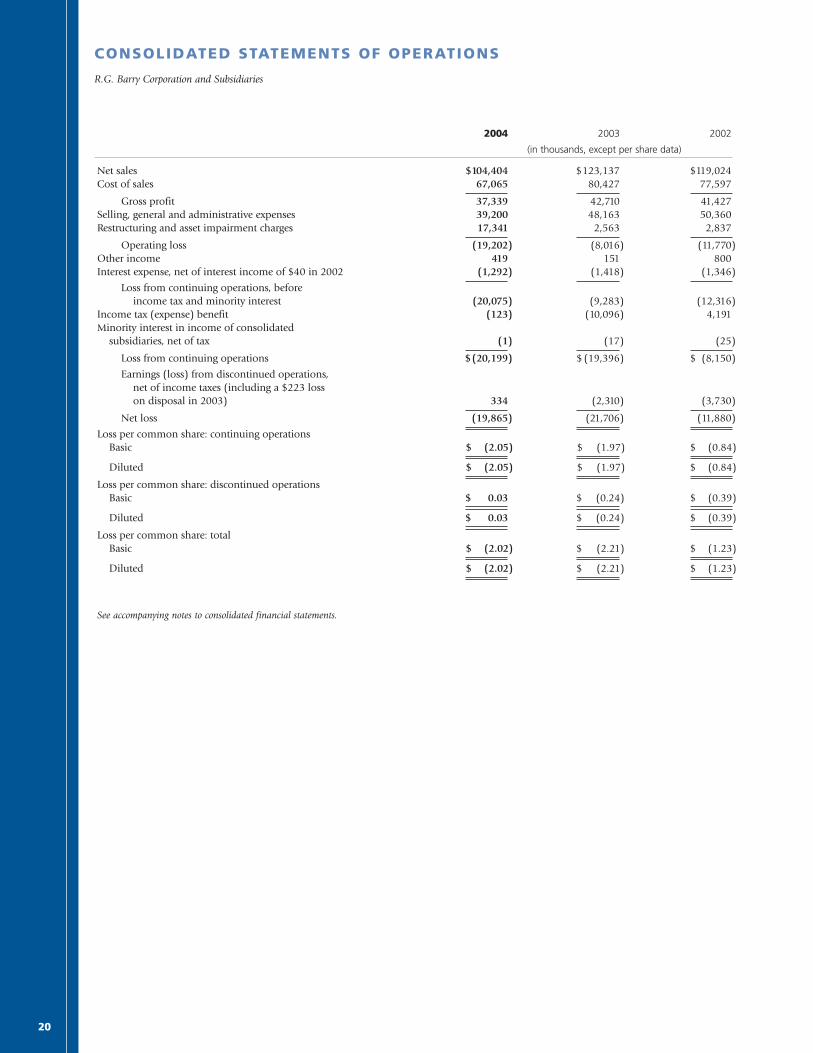
20
CONSOLIDATED STATEMENTS OF OPERATIONS
R.G. Barry Corporation and Subsidiaries
2004 2003 2002
(in thousands, except per share data)
Net sales $104,404 $123,137 $119,024Cost of sales 67,065 80,427 77,597
Gross profit 37,339 42,710 41,427Selling, general and administrative expenses 39,200 48,163 50,360Restructuring and asset impairment charges 17,341 2,563 2,837
Operating loss (19,202) (8,016) (11,770)Other income 419 151 800Interest expense, net of interest income of $40 in 2002 (1,292) (1,418) (1,346)
Loss from continuing operations, beforeincome tax and minority interest (20,075) (9,283) (12,316)
Income tax (expense) benefit (123) (10,096) 4,191Minority interest in income of consolidated
subsidiaries, net of tax (1) (17) (25)
Loss from continuing operations $(20,199) $ (19,396) $ (8,150)
Earnings (loss) from discontinued operations,net of income taxes (including a $223 losson disposal in 2003) 334 (2,310) (3,730)
Net loss (19,865) (21,706) (11,880)
Loss per common share: continuing operationsBasic $ (2.05) $ (1.97) $ (0.84)
Diluted $ (2.05) $ (1.97) $ (0.84)
Loss per common share: discontinued operationsBasic $ 0.03 $ (0.24) $ (0.39)
Diluted $ 0.03 $ (0.24) $ (0.39)
Loss per common share: totalBasic $ (2.02) $ (2.21) $ (1.23)
Diluted $ (2.02) $ (2.21) $ (1.23)
See accompanying notes to consolidated financial statements.

21
CONSOLIDATED STATEMENTS OF SHAREHOLDERS’ EQUITYAND COMPREHENSIVE INCOME
R.G. Barry Corporation and Subsidiaries
Additional Accumulatedcapital in Deferred other Retained Net
Common excess of compen- comprehensive earnings shareholders’shares par value sation income (loss) (deficit) equity
(in thousands)
Balance at December 29, 2001 $9,376 $12,093 $(331) $ (495) $ 39,742 $ 60,385Comprehensive loss:
Net loss — — — — (11,880) (11,880)Other comprehensive income (loss):
Foreign currency translationadjustment — — — 559 — 559
Pension liability charge, net of$(1,878) deferred income taxes — — — (3,135) — (3,135)
Total comprehensive loss — — — — — (14,456)Amortization of deferred compensation — — 131 — — 131Stock options and warrants exercised 430 698 1,128
Balance at December 28, 2002 $9,806 $12,791 $(200) $(3,071) $ 27,862 $ 47,188Comprehensive loss:
Net loss — — — — (21,706) (21,706)Other comprehensive income (loss):
Foreign currency translationadjustment — — — 231 — 231
Pension liability charge — — — (530) — (530)
Total comprehensive loss — — — — — (22,005)Amortization of deferred compensation — — 116 — — 116Stock options exercised 28 60 — — — 88
Balance at January 3, 2004 $9,834 $12,851 $ (84) $(3,370) $ 6,156 $ 25,387Comprehensive loss:
Net loss — — — — (19,865) (19,865)Other comprehensive loss:
Foreign currency translationadjustment — — — (14) — (14)
Pension liability charge — — — (597) — (597)
Total comprehensive loss — — — — — (20,476)Amortization of deferred compensation — — 65 — — 65Stock options exercised 2 — — — — 2
Balance at January 1, 2005 $9,836 $12,851 $ (19) $(3,981) $(13,709) $ 4,978
See accompanying notes to consolidated financial statements.
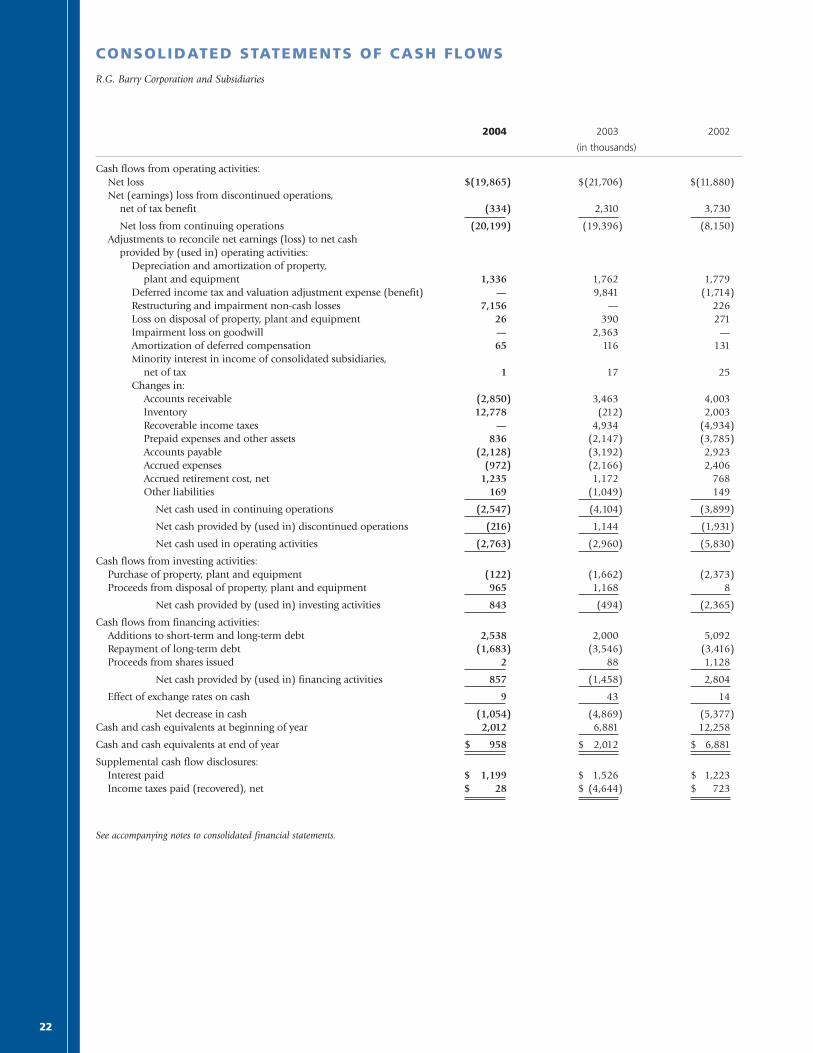
22
CONSOLIDATED STATEMENTS OF CASH FLOWS
R.G. Barry Corporation and Subsidiaries
2004 2003 2002
(in thousands)
Cash flows from operating activities:Net loss $(19,865) $(21,706) $(11,880)Net (earnings) loss from discontinued operations,
net of tax benefit (334) 2,310 3,730
Net loss from continuing operations (20,199) (19,396) (8,150)Adjustments to reconcile net earnings (loss) to net cash
provided by (used in) operating activities:Depreciation and amortization of property,
plant and equipment 1,336 1,762 1,779Deferred income tax and valuation adjustment expense (benefit) — 9,841 (1,714)Restructuring and impairment non-cash losses 7,156 — 226Loss on disposal of property, plant and equipment 26 390 271Impairment loss on goodwill — 2,363 —Amortization of deferred compensation 65 116 131Minority interest in income of consolidated subsidiaries,
net of tax 1 17 25Changes in:
Accounts receivable (2,850) 3,463 4,003Inventory 12,778 (212) 2,003Recoverable income taxes — 4,934 (4,934)Prepaid expenses and other assets 836 (2,147) (3,785)Accounts payable (2,128) (3,192) 2,923Accrued expenses (972) (2,166) 2,406Accrued retirement cost, net 1,235 1,172 768Other liabilities 169 (1,049) 149
Net cash used in continuing operations (2,547) (4,104) (3,899)
Net cash provided by (used in) discontinued operations (216) 1,144 (1,931)
Net cash used in operating activities (2,763) (2,960) (5,830)
Cash flows from investing activities:Purchase of property, plant and equipment (122) (1,662) (2,373)Proceeds from disposal of property, plant and equipment 965 1,168 8
Net cash provided by (used in) investing activities 843 (494) (2,365)
Cash flows from financing activities:Additions to short-term and long-term debt 2,538 2,000 5,092Repayment of long-term debt (1,683) (3,546) (3,416)Proceeds from shares issued 2 88 1,128
Net cash provided by (used in) financing activities 857 (1,458) 2,804
Effect of exchange rates on cash 9 43 14
Net decrease in cash (1,054) (4,869) (5,377)Cash and cash equivalents at beginning of year 2,012 6,881 12,258
Cash and cash equivalents at end of year $ 958 $ 2,012 $ 6,881
Supplemental cash flow disclosures:Interest paid $ 1,199 $ 1,526 $ 1,223Income taxes paid (recovered), net $ 28 $ (4,644) $ 723
See accompanying notes to consolidated financial statements.

23
NOTES TO CONSOLIDATED FINANCIAL STATEMENTS
R.G. Barry Corporation and Subsidiaries
(Dollar amounts in thousands, except for per share data)
(1) Summary of Significant Accounting Policies
a) OperationsR.G. Barry Corporation (the “Company”) is primarily a United States-based corporation with a small operation inFrance. The Company’s principal line of business is the design, purchase, and distribution of comfort products for at- and around-the-home. The predominant market for the Company’s products is North America. Products are soldprimarily to department stores, chain stores, and mass merchandisers.
The Company owns a French company, Escapade S.A. and its Fargeot et Compagnie, S.A. subsidiary (collectively,“Fargeot”). An 80% ownership interest in the Fargeot was purchased in 1999 and the underlying purchase agreementincluded put and call options for the purchase of the remaining 20% of the Fargeot shares. The minority interestowner could put his shares to the Company for a period of five years after July 22, 2004 at a fair value determined by the purchase agreement. Similarly, the Company could call the remaining shares through July 22, 2009 on the same basis. During November 2004, the minority interest owner exercised his put option, and the Companyacquired the remaining 20% ownership interest. As a result of this action, the fair value of Fargeot’s assets acquiredless the liabilities assumed exceeded the acquisition cost (“negative goodwill”) by $100 on the elimination of theminority interest. After determining that no impairment loss existed based on estimates using projected net presentvalue of cash flows, negative goodwill was applied as an proportional offset to the carrying book basis of property,plant and equipment assets of the subsidiary. The treatment of negative goodwill on this step acquisition is pursuantto provisions of Statement of Financial Accounting Standard (“SFAS”) No. 141, Business Combinations.
b) Principles of ConsolidationThe consolidated financial statements include the accounts of the Company and its subsidiaries. All significantintercompany balances and transactions have been eliminated in consolidation. Minority interest of 20% in Fargeotexisted up to end of November 2004, when that interest was purchased by the Company. Through November 2004,the minority interest was presented on an after-tax basis in the Company’s consolidated financial statements.
The Company maintains its accounts on a 52–53 week fiscal year ending on the Saturday nearest December 31.
c) Cash EquivalentsInvestments with maturities of three months or less at the date of acquisition are considered cash equivalents. There were no balances maintained in such investments as of the end of fiscal 2004 or fiscal 2003.
d) InventoryInventory is valued at the lower of cost or market as determined on the first-in, first-out (FIFO) basis (see Note 2).
e) Depreciation and AmortizationDepreciation and amortization expense has been provided substantially using the straight-line method over theestimated useful lives of the assets.
f) GoodwillGoodwill, which represents the excess of purchase price over fair value of net assets acquired, is governed by SFASNo. 142, Goodwill and Other Intangible Assets. SFAS No. 142 mandated the discontinuance of goodwill amortizationeffective with the 2002 year and requires an annual evaluation of goodwill to determine and recognize what, if any,impairment of goodwill should be recorded. The annual evaluation for impairment was done in the second quarterof each year and updated in the event of any major events or changes should they occur later in the year. The evalua-tion of goodwill was made with no impairment adjustment required for the 2002 year.
As a consequence of changes occurring throughout the Company, management determined that it was appropriateto reassess the value of these assets as of the end of 2003. Based on its reassessment at the end of 2003 of the presentand projected long-term business environment for its then 80% owned Fargeot subsidiary, the Company determinedthat the goodwill value related to its purchase of the 80% ownership was impaired. In making this determination,the Company approximated fair value through the use of projected future cash flows and net present value analysisfor this business unit. Accordingly, an impairment loss of $2,363 was recorded in 2003.
No Goodwill existed during 2004, and, accordingly, no annual evaluation was necessary.
g) Trademarks and PatentsThe Company incurs costs in obtaining and perfecting trademarks and patents related to the Company’s productsand production related processes. These costs are generally amortized over a period subsequent to acquisition not toexceed 5 years and are evaluated for impairment on an annual basis as required by SFAS No. 144, Accounting for theImpairment or Disposal of Long-Lived Assets.

24
NOTES TO CONSOLIDATED FINANCIAL STATEMENTS
R.G. Barry Corporation and Subsidiaries (continued)
(Dollar amounts in thousands, except for per share data)
h) Revenue RecognitionThe Company recognizes revenue when the goods are shipped to customers and customers take ownership,assuming risk of loss, with adequate allowance made for anticipated sales returns. The Company bases its allowancefor sales returns on current and historical trends and experience. Any promotional allowances granted to customersare accrued and recognized at the time when the underlying goods are shipped.
i) Distribution and Warehousing CostsDistribution and warehousing costs for finished product, including occupancy, are classified within selling, generaland administrative expenses in the consolidated statements of operations. These costs amounted to $11,328, $13,481and $13,113, respectively, for the fiscal years ended January 1, 2005, January 3, 2004 and December 28, 2002.
j) Assignment of Customer ReceivablesThe Company entered into an agreement with its principal lender during fiscal 2004, under which the Companyassigned and transferred customer receivables to its lender, with limited exceptions, and for which the lender effec-tively guaranteed collection in the event of subsequent customer bankruptcy. All customer claims or deductionsagainst these assigned accounts are with recourse to the Company for ultimate resolutions.
This transaction was evaluated using criteria under SFAS No. 140, Accounting for Transfers and Servicing of FinancialAssets and Extinguishment of Liabilities, and the assignment of accounts was deemed not to be a sale of financial assets,and has been accounted for as a secured borrowing.
k) Advertising and PromotionThe Company has certain programs in place to advertise and promote the sale of its products. The Companyexpenses the costs of advertising and promotion as incurred. For the fiscal years ended January 1, 2005, January 3,2004, and December 28, 2002, advertising and promotion expenses in continuing operations of $1,928, $2,677, and$3,540, respectively, are included in selling, general and administrative expenses in the consolidated statements ofoperations as required by accounting principles generally accepted (“GAAP”) in the United States.
l) Income TaxesIncome taxes are accounted for under the asset and liability method. Deferred tax assets and liabilities are recognized for the future tax consequences attributable to differences between the financial statement carryingamounts of existing assets and liabilities and their respective tax bases and operating loss and tax credit carry-forwards. Deferred tax assets and liabilities are measured using enacted tax rates expected to apply to taxable incomein the years in which those temporary differences are expected to be recovered or settled. The effect on deferred taxassets and liabilities of a change in tax rates is recognized in income in the period that includes the enactment date.
In assessing the realizability of deferred tax assets, management considers whether it is more likely than not thatsome portion or all of the deferred tax assets will be realized. The ultimate realization of deferred tax assets isdependent on the generation of future taxable income or with any applicable net operating loss carryforward periodthereafter, during periods in which temporary differences become deductible. Management considers the scheduledreversal of deferred items, projected future taxable income, and tax planning strategies in making this assessment.
m) Per-Share InformationThe computation of basic loss per common share is based on the weighted average number of outstanding commonshares during the period. Diluted earnings per common share includes those weighted average common shares aswell as, when their effect is dilutive, potential common shares consisting of certain common shares subject to stockoptions and the stock purchase plan. Diluted loss per common share does not include the impact of potentialcommon shares due to their antidilutive effect.
n) Comprehensive IncomeComprehensive income (loss) consists of net loss, foreign currency translation adjustments and pension liabilityadjustments and is presented in the consolidated statements of shareholders’ equity and comprehensive income.
o) Translation of Foreign Currency Financial StatementsAssets and liabilities of foreign operations have been translated into United States dollars at the applicable rates of exchange in effect at the end of each period. Revenues, expenses, and cash flows have been translated at theapplicable weighted average rates of exchange in effect during each period.
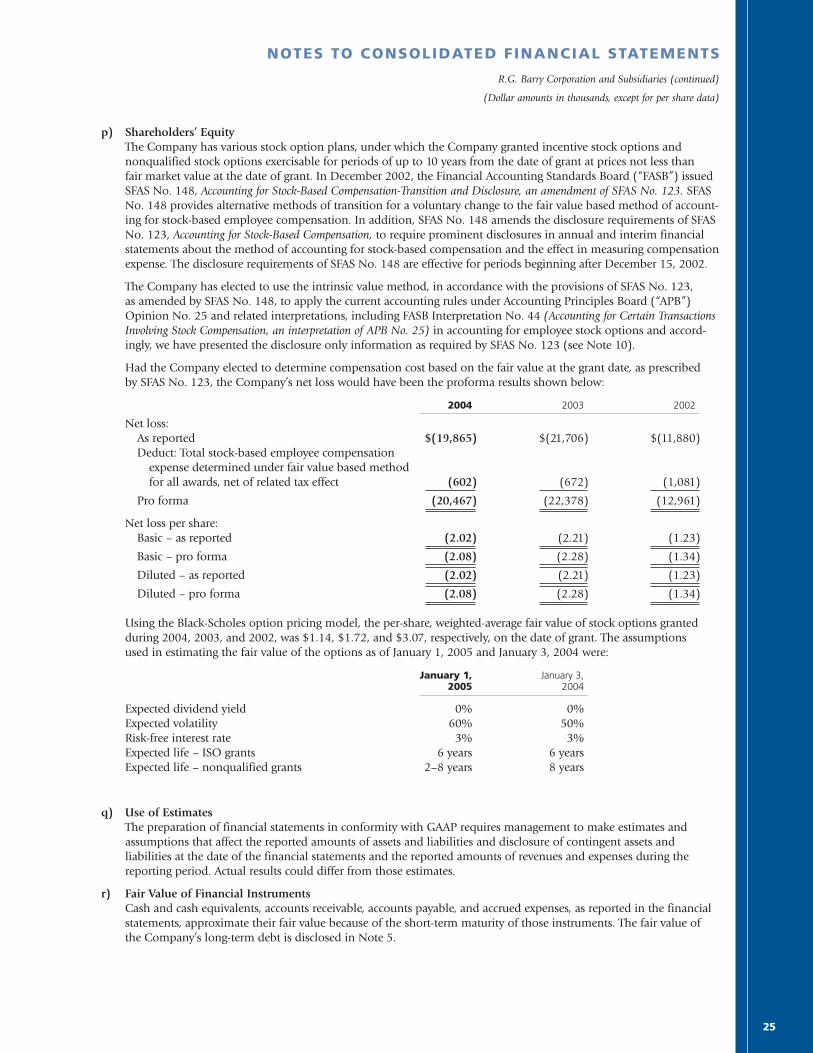
25
NOTES TO CONSOLIDATED FINANCIAL STATEMENTS
R.G. Barry Corporation and Subsidiaries (continued)
(Dollar amounts in thousands, except for per share data)
p) Shareholders’ EquityThe Company has various stock option plans, under which the Company granted incentive stock options and nonqualified stock options exercisable for periods of up to 10 years from the date of grant at prices not less than fair market value at the date of grant. In December 2002, the Financial Accounting Standards Board (“FASB”) issuedSFAS No. 148, Accounting for Stock-Based Compensation-Transition and Disclosure, an amendment of SFAS No. 123. SFASNo. 148 provides alternative methods of transition for a voluntary change to the fair value based method of account-ing for stock-based employee compensation. In addition, SFAS No. 148 amends the disclosure requirements of SFAS No. 123, Accounting for Stock-Based Compensation, to require prominent disclosures in annual and interim financialstatements about the method of accounting for stock-based compensation and the effect in measuring compensationexpense. The disclosure requirements of SFAS No. 148 are effective for periods beginning after December 15, 2002.
The Company has elected to use the intrinsic value method, in accordance with the provisions of SFAS No. 123, as amended by SFAS No. 148, to apply the current accounting rules under Accounting Principles Board (“APB”)Opinion No. 25 and related interpretations, including FASB Interpretation No. 44 (Accounting for Certain TransactionsInvolving Stock Compensation, an interpretation of APB No. 25) in accounting for employee stock options and accord-ingly, we have presented the disclosure only information as required by SFAS No. 123 (see Note 10).
Had the Company elected to determine compensation cost based on the fair value at the grant date, as prescribed by SFAS No. 123, the Company’s net loss would have been the proforma results shown below:
2004 2003 2002
Net loss:As reported $(19,865) $(21,706) $(11,880)Deduct: Total stock-based employee compensation
expense determined under fair value based method for all awards, net of related tax effect (602) (672) (1,081)
Pro forma (20,467) (22,378) (12,961)
Net loss per share:Basic – as reported (2.02) (2.21) (1.23)
Basic – pro forma (2.08) (2.28) (1.34)
Diluted – as reported (2.02) (2.21) (1.23)
Diluted – pro forma (2.08) (2.28) (1.34)
Using the Black-Scholes option pricing model, the per-share, weighted-average fair value of stock options grantedduring 2004, 2003, and 2002, was $1.14, $1.72, and $3.07, respectively, on the date of grant. The assumptions used in estimating the fair value of the options as of January 1, 2005 and January 3, 2004 were:
January 1, January 3,2005 2004
Expected dividend yield 0% 0%Expected volatility 60% 50%Risk-free interest rate 3% 3%Expected life – ISO grants 6 years 6 yearsExpected life – nonqualified grants 2–8 years 8 years
q) Use of EstimatesThe preparation of financial statements in conformity with GAAP requires management to make estimates andassumptions that affect the reported amounts of assets and liabilities and disclosure of contingent assets andliabilities at the date of the financial statements and the reported amounts of revenues and expenses during thereporting period. Actual results could differ from those estimates.
r) Fair Value of Financial InstrumentsCash and cash equivalents, accounts receivable, accounts payable, and accrued expenses, as reported in the financialstatements, approximate their fair value because of the short-term maturity of those instruments. The fair value ofthe Company’s long-term debt is disclosed in Note 5.
26
NOTES TO CONSOLIDATED FINANCIAL STATEMENTS
R.G. Barry Corporation and Subsidiaries (continued)
(Dollar amounts in thousands, except for per share data)
s) Impairment of Long-Lived Assets and Long-Lived Assets to Be Disposed OfThe Company accounts for long-lived assets in accordance with the provisions of SFAS No. 144. SFAS No. 144requires that long-lived assets held and used and long-lived assets held for disposal be measured at the lower ofbook value or fair market value less costs of disposal. Fair value is determined using the present value of estimatednet cash flows or comparable market values. In addition, SFAS No. 144 expands the scope of discontinued opera-tions to include all operations of an entity with operations that can be separated from the rest of the business andthat will be eliminated in a disposal transaction.
t) Allowances Granted to Resellers In April 2001, the Emerging Issues Task Force (“EITF”) reached a consensus on issues 2 and 3 within EITF 00-25,Vendor Income Statement Characterization of Consideration Paid to a Reseller of the Vendor’s Products. This EITF is codifiedas EITF 01-9, Accounting for Consideration given by a Vendor to a Customer (including a Reseller of the Vendor’s Products).This EITF addresses whether consideration from a vendor to a reseller of the vendor’s products is an adjustment ofthe selling prices of the vendor’s products and, therefore, a reduction of sales or a cost incurred by the vendor forassets or services received from the reseller and, therefore, a cost or an expense. This EITF was effective in 2002 andupon adoption, prior periods presented for comparative purposes were reclassified. Application of this EITF resultedin a reduction of Company’s net sales of approximately $10,534, $11,055, and $13,195 for fiscal years 2004, 2003,and 2002, respectively.
u) Duty Acceleration Costs RecognitionEffective January 1, 2002, the 15% duties imposed by the United States on slippers coming from Mexico wereeliminated. The duties had been scheduled for reduction at the rate of 2.5% per year until elimination on January 1,2008. With the assistance of two firms, the Company was successful in accelerating the elimination of these dutiesand agreed to pay an aggregate of about $6,250, most of which is payable in quarterly installments through 2005.
The discounted cost associated with these future payments was $5,291 and was being recognized through cost ofsales proportionately over the years 2002 to 2007 based on the estimated benefit of duty elimination on Companyproduct as produced and projected to be produced in Mexico over this six-year period. In the first quarter of fiscal2004, fiscal years 2003 and 2002, $251, $1,473 and $873, respectively, of these costs have been recognized withincost of sales. The unamortized balance of $2,945 and $4,418 was included in the consolidated balance sheet in otherassets for 2003 and 2002, respectively, and this asset classification was consistent with projected realization of theduty elimination benefits and expected recognition of those costs over the remaining years through 2007.
With its decision to discontinue manufacturing operations during the first quarter 2004, the remaining unamortizedbalance of these costs was recognized as an impairment loss of $2,694.
v) Recently Issued Accounting StandardsIn late 2004, the FASB issued SFAS No. 151, Inventory Costs—an Amendment of ARB No. 43, Chapter 4, and SFAS No.153, Exchanges of Nonmonetary Assets, an amendment of APB Opinion 29. Both standards go into effect for fiscal yearsbeginning after July 15, 2005. With both of these issued but not yet effective pronouncements, the Company doesnot anticipate any material impact in adopting these standards in its reporting results of operations or of the state-ment of financial position.
SFAS No. 151 provides specific definition to the term “abnormal costs”, as used in previous accounting standards in inventory reporting under Accounting Research Bulletin 43. Such abnormal costs, with specific definitions nowprovided under the standard, must be recognized in period expense and not included in the valuation of inventory.
SFAS No. 153 modifies APB Opinion No. 129 to require the use of fair value of assets exchanged involved in anexchange of productive use assets, and limits the exception to the use of fair value only to situations involving asset exchanges that do not have commercial substance.
SFAS No. 123R (Revised), Share Based Payments, has been issued to take effect in the first interim period after July 15,2005. This standard will incorporate into reported results, a measure of expense for share based compensation. Thisstandard effectively requires the same reporting approach for all companies in this area. The Company under thisstandard has alternative implementation options as to how to present prior period information, either as restatedresults on prior interim period, and/or restatement of prior years, or by reference to prior period proforma footnotedisclosures. The Company intends to implement this Standard prospectively, with reference to prior period proformadisclosures. The Company has not determined what the impact of implementation of this Standard will be on itsresults of operations.
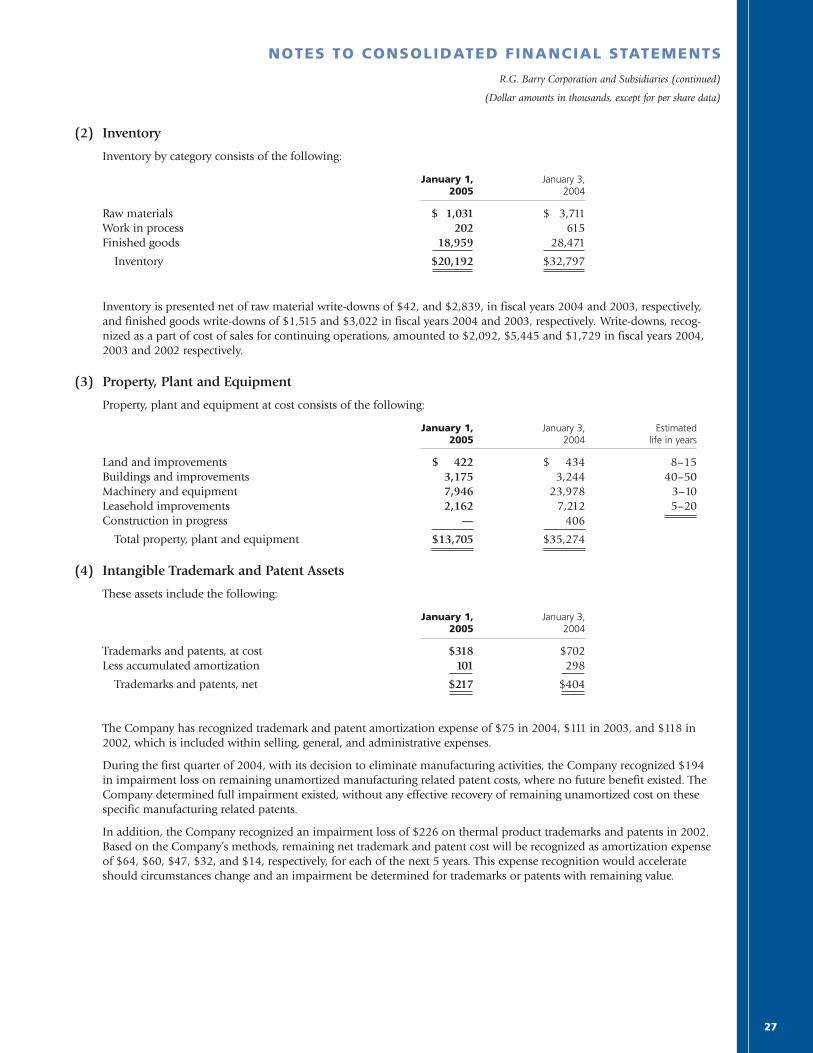
27
NOTES TO CONSOLIDATED FINANCIAL STATEMENTS
R.G. Barry Corporation and Subsidiaries (continued)
(Dollar amounts in thousands, except for per share data)
(2) Inventory
Inventory by category consists of the following:
January 1, January 3,2005 2004
Raw materials $ 1,031 $ 3,711Work in process 202 615Finished goods 18,959 28,471
Inventory $20,192 $32,797
Inventory is presented net of raw material write-downs of $42, and $2,839, in fiscal years 2004 and 2003, respectively,and finished goods write-downs of $1,515 and $3,022 in fiscal years 2004 and 2003, respectively. Write-downs, recog-nized as a part of cost of sales for continuing operations, amounted to $2,092, $5,445 and $1,729 in fiscal years 2004,2003 and 2002 respectively.
(3) Property, Plant and Equipment
Property, plant and equipment at cost consists of the following:
January 1, January 3, Estimated2005 2004 life in years
Land and improvements $ 422 $ 434 8–15Buildings and improvements 3,175 3,244 40–50Machinery and equipment 7,946 23,978 3–10Leasehold improvements 2,162 7,212 5–20Construction in progress — 406
Total property, plant and equipment $13,705 $35,274
(4) Intangible Trademark and Patent Assets
These assets include the following:
January 1, January 3,2005 2004
Trademarks and patents, at cost $318 $702Less accumulated amortization 101 298
Trademarks and patents, net $217 $404
The Company has recognized trademark and patent amortization expense of $75 in 2004, $111 in 2003, and $118 in2002, which is included within selling, general, and administrative expenses.
During the first quarter of 2004, with its decision to eliminate manufacturing activities, the Company recognized $194 in impairment loss on remaining unamortized manufacturing related patent costs, where no future benefit existed. TheCompany determined full impairment existed, without any effective recovery of remaining unamortized cost on thesespecific manufacturing related patents.
In addition, the Company recognized an impairment loss of $226 on thermal product trademarks and patents in 2002.Based on the Company’s methods, remaining net trademark and patent cost will be recognized as amortization expenseof $64, $60, $47, $32, and $14, respectively, for each of the next 5 years. This expense recognition would accelerateshould circumstances change and an impairment be determined for trademarks or patents with remaining value.
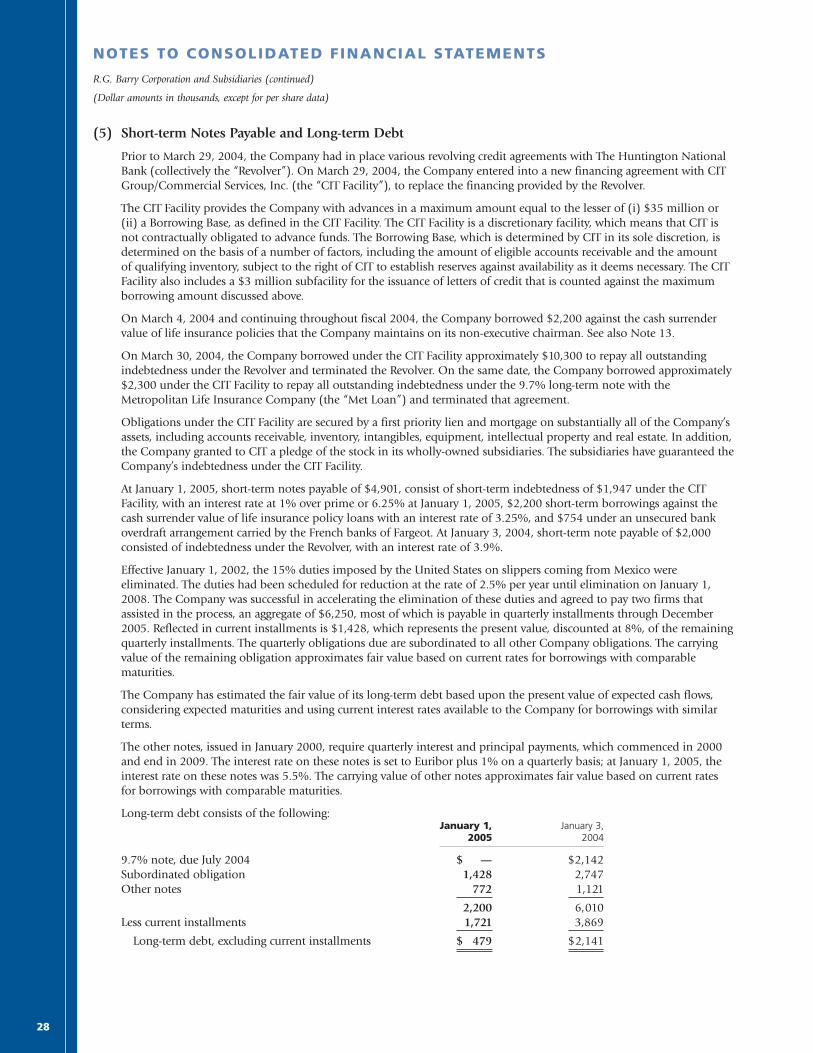
28
NOTES TO CONSOLIDATED FINANCIAL STATEMENTS
R.G. Barry Corporation and Subsidiaries (continued)
(Dollar amounts in thousands, except for per share data)
(5) Short-term Notes Payable and Long-term Debt
Prior to March 29, 2004, the Company had in place various revolving credit agreements with The Huntington NationalBank (collectively the “Revolver”). On March 29, 2004, the Company entered into a new financing agreement with CITGroup/Commercial Services, Inc. (the “CIT Facility”), to replace the financing provided by the Revolver.
The CIT Facility provides the Company with advances in a maximum amount equal to the lesser of (i) $35 million or (ii) a Borrowing Base, as defined in the CIT Facility. The CIT Facility is a discretionary facility, which means that CIT is not contractually obligated to advance funds. The Borrowing Base, which is determined by CIT in its sole discretion, isdetermined on the basis of a number of factors, including the amount of eligible accounts receivable and the amount of qualifying inventory, subject to the right of CIT to establish reserves against availability as it deems necessary. The CITFacility also includes a $3 million subfacility for the issuance of letters of credit that is counted against the maximumborrowing amount discussed above.
On March 4, 2004 and continuing throughout fiscal 2004, the Company borrowed $2,200 against the cash surrendervalue of life insurance policies that the Company maintains on its non-executive chairman. See also Note 13.
On March 30, 2004, the Company borrowed under the CIT Facility approximately $10,300 to repay all outstandingindebtedness under the Revolver and terminated the Revolver. On the same date, the Company borrowed approximately$2,300 under the CIT Facility to repay all outstanding indebtedness under the 9.7% long-term note with theMetropolitan Life Insurance Company (the “Met Loan”) and terminated that agreement.
Obligations under the CIT Facility are secured by a first priority lien and mortgage on substantially all of the Company’sassets, including accounts receivable, inventory, intangibles, equipment, intellectual property and real estate. In addition,the Company granted to CIT a pledge of the stock in its wholly-owned subsidiaries. The subsidiaries have guaranteed theCompany’s indebtedness under the CIT Facility.
At January 1, 2005, short-term notes payable of $4,901, consist of short-term indebtedness of $1,947 under the CITFacility, with an interest rate at 1% over prime or 6.25% at January 1, 2005, $2,200 short-term borrowings against thecash surrender value of life insurance policy loans with an interest rate of 3.25%, and $754 under an unsecured bankoverdraft arrangement carried by the French banks of Fargeot. At January 3, 2004, short-term note payable of $2,000consisted of indebtedness under the Revolver, with an interest rate of 3.9%.
Effective January 1, 2002, the 15% duties imposed by the United States on slippers coming from Mexico were eliminated. The duties had been scheduled for reduction at the rate of 2.5% per year until elimination on January 1,2008. The Company was successful in accelerating the elimination of these duties and agreed to pay two firms thatassisted in the process, an aggregate of $6,250, most of which is payable in quarterly installments through December2005. Reflected in current installments is $1,428, which represents the present value, discounted at 8%, of the remainingquarterly installments. The quarterly obligations due are subordinated to all other Company obligations. The carryingvalue of the remaining obligation approximates fair value based on current rates for borrowings with comparablematurities.
The Company has estimated the fair value of its long-term debt based upon the present value of expected cash flows,considering expected maturities and using current interest rates available to the Company for borrowings with similarterms.
The other notes, issued in January 2000, require quarterly interest and principal payments, which commenced in 2000and end in 2009. The interest rate on these notes is set to Euribor plus 1% on a quarterly basis; at January 1, 2005, theinterest rate on these notes was 5.5%. The carrying value of other notes approximates fair value based on current rates for borrowings with comparable maturities.
Long-term debt consists of the following:January 1, January 3,
2005 2004
9.7% note, due July 2004 $ — $2,142Subordinated obligation 1,428 2,747Other notes 772 1,121
2,200 6,010Less current installments 1,721 3,869
Long-term debt, excluding current installments $ 479 $2,141
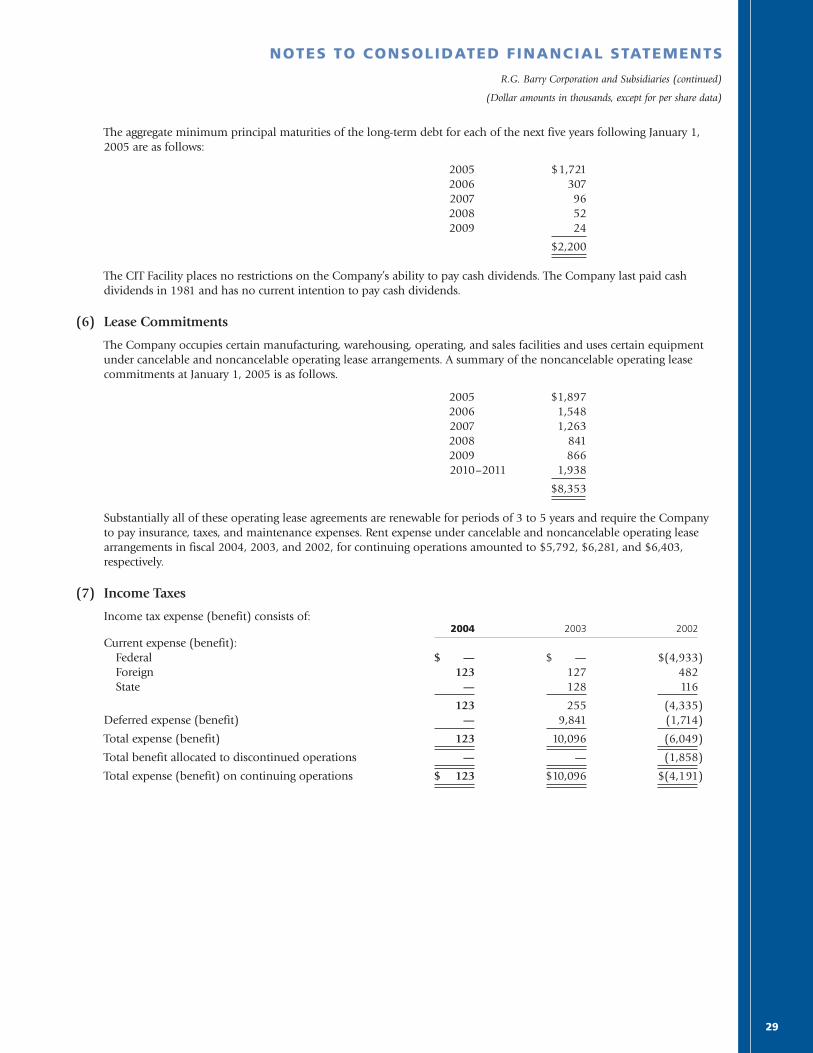
29
NOTES TO CONSOLIDATED FINANCIAL STATEMENTS
R.G. Barry Corporation and Subsidiaries (continued)
(Dollar amounts in thousands, except for per share data)
The aggregate minimum principal maturities of the long-term debt for each of the next five years following January 1,2005 are as follows:
2005 $1,7212006 3072007 962008 522009 24
$2,200
The CIT Facility places no restrictions on the Company’s ability to pay cash dividends. The Company last paid cashdividends in 1981 and has no current intention to pay cash dividends.
(6) Lease Commitments
The Company occupies certain manufacturing, warehousing, operating, and sales facilities and uses certain equipmentunder cancelable and noncancelable operating lease arrangements. A summary of the noncancelable operating leasecommitments at January 1, 2005 is as follows.
2005 $1,8972006 1,5482007 1,2632008 8412009 8662010–2011 1,938
$8,353
Substantially all of these operating lease agreements are renewable for periods of 3 to 5 years and require the Companyto pay insurance, taxes, and maintenance expenses. Rent expense under cancelable and noncancelable operating leasearrangements in fiscal 2004, 2003, and 2002, for continuing operations amounted to $5,792, $6,281, and $6,403,respectively.
(7) Income Taxes
Income tax expense (benefit) consists of:2004 2003 2002
Current expense (benefit):Federal $ — $ — $(4,933)Foreign 123 127 482State — 128 116
123 255 (4,335)Deferred expense (benefit) — 9,841 (1,714)
Total expense (benefit) 123 10,096 (6,049)
Total benefit allocated to discontinued operations — — (1,858)
Total expense (benefit) on continuing operations $ 123 $10,096 $(4,191)
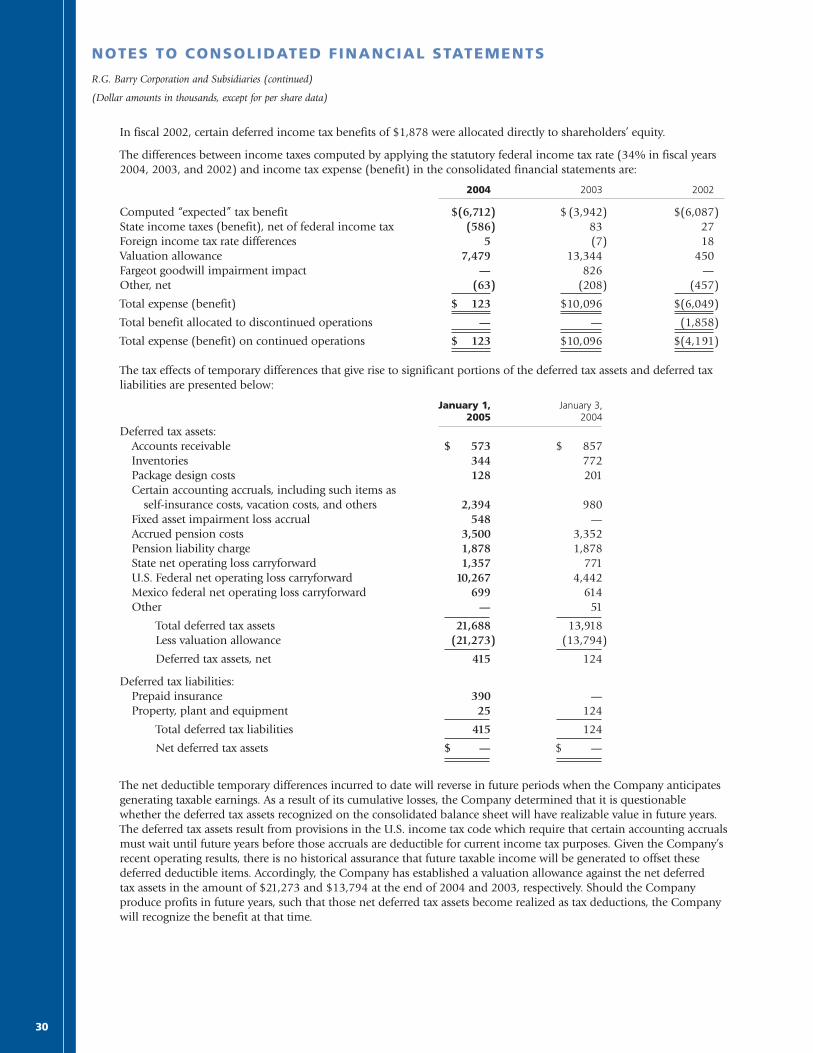
30
NOTES TO CONSOLIDATED FINANCIAL STATEMENTS
R.G. Barry Corporation and Subsidiaries (continued)
(Dollar amounts in thousands, except for per share data)
In fiscal 2002, certain deferred income tax benefits of $1,878 were allocated directly to shareholders’ equity.
The differences between income taxes computed by applying the statutory federal income tax rate (34% in fiscal years2004, 2003, and 2002) and income tax expense (benefit) in the consolidated financial statements are:
2004 2003 2002
Computed “expected” tax benefit $(6,712) $ (3,942) $(6,087)State income taxes (benefit), net of federal income tax (586) 83 27Foreign income tax rate differences 5 (7) 18Valuation allowance 7,479 13,344 450Fargeot goodwill impairment impact — 826 —Other, net (63) (208) (457)
Total expense (benefit) $ 123 $10,096 $(6,049)
Total benefit allocated to discontinued operations — — (1,858)
Total expense (benefit) on continued operations $ 123 $10,096 $(4,191)
The tax effects of temporary differences that give rise to significant portions of the deferred tax assets and deferred taxliabilities are presented below:
January 1, January 3,2005 2004
Deferred tax assets:Accounts receivable $ 573 $ 857Inventories 344 772Package design costs 128 201Certain accounting accruals, including such items as
self-insurance costs, vacation costs, and others 2,394 980Fixed asset impairment loss accrual 548 —Accrued pension costs 3,500 3,352Pension liability charge 1,878 1,878State net operating loss carryforward 1,357 771U.S. Federal net operating loss carryforward 10,267 4,442Mexico federal net operating loss carryforward 699 614Other — 51
Total deferred tax assets 21,688 13,918Less valuation allowance (21,273) (13,794)
Deferred tax assets, net 415 124
Deferred tax liabilities:Prepaid insurance 390 —Property, plant and equipment 25 124
Total deferred tax liabilities 415 124
Net deferred tax assets $ — $ —
The net deductible temporary differences incurred to date will reverse in future periods when the Company anticipatesgenerating taxable earnings. As a result of its cumulative losses, the Company determined that it is questionable whether the deferred tax assets recognized on the consolidated balance sheet will have realizable value in future years.The deferred tax assets result from provisions in the U.S. income tax code which require that certain accounting accrualsmust wait until future years before those accruals are deductible for current income tax purposes. Given the Company’srecent operating results, there is no historical assurance that future taxable income will be generated to offset thesedeferred deductible items. Accordingly, the Company has established a valuation allowance against the net deferred tax assets in the amount of $21,273 and $13,794 at the end of 2004 and 2003, respectively. Should the Companyproduce profits in future years, such that those net deferred tax assets become realized as tax deductions, the Companywill recognize the benefit at that time.
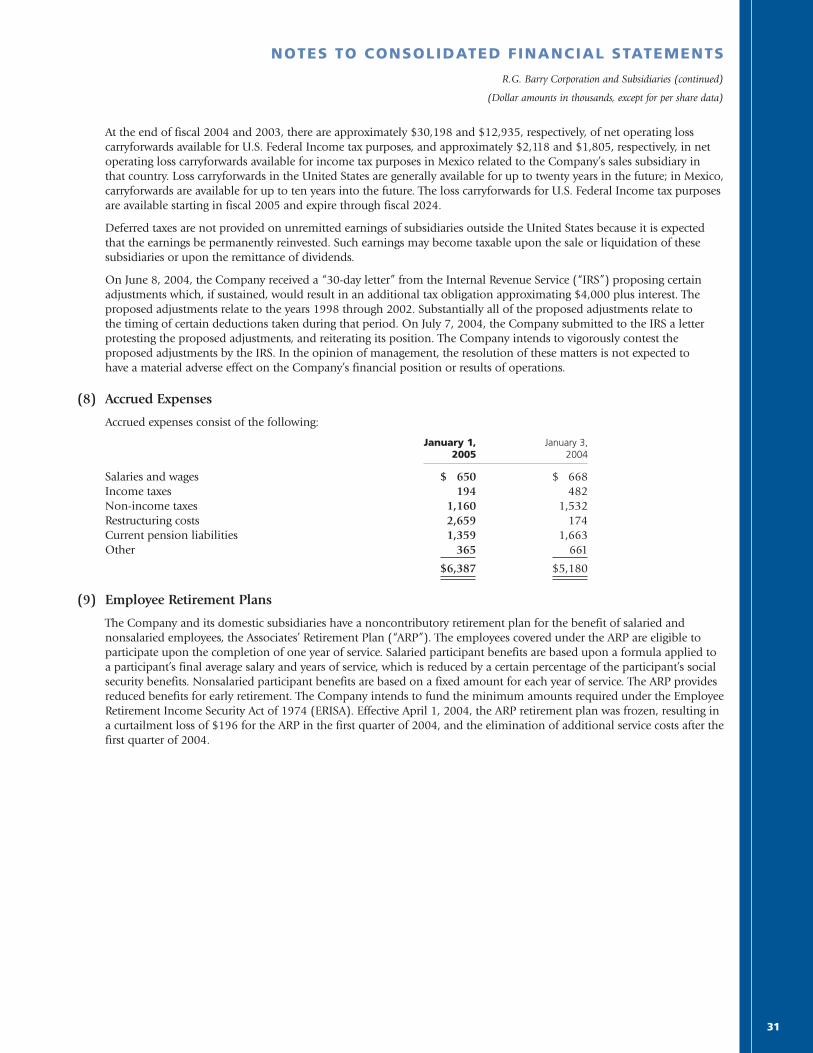
31
NOTES TO CONSOLIDATED FINANCIAL STATEMENTS
R.G. Barry Corporation and Subsidiaries (continued)
(Dollar amounts in thousands, except for per share data)
At the end of fiscal 2004 and 2003, there are approximately $30,198 and $12,935, respectively, of net operating losscarryforwards available for U.S. Federal Income tax purposes, and approximately $2,118 and $1,805, respectively, in netoperating loss carryforwards available for income tax purposes in Mexico related to the Company’s sales subsidiary in that country. Loss carryforwards in the United States are generally available for up to twenty years in the future; in Mexico,carryforwards are available for up to ten years into the future. The loss carryforwards for U.S. Federal Income tax purposesare available starting in fiscal 2005 and expire through fiscal 2024.
Deferred taxes are not provided on unremitted earnings of subsidiaries outside the United States because it is expectedthat the earnings be permanently reinvested. Such earnings may become taxable upon the sale or liquidation of thesesubsidiaries or upon the remittance of dividends.
On June 8, 2004, the Company received a “30-day letter” from the Internal Revenue Service (“IRS”) proposing certainadjustments which, if sustained, would result in an additional tax obligation approximating $4,000 plus interest. Theproposed adjustments relate to the years 1998 through 2002. Substantially all of the proposed adjustments relate to the timing of certain deductions taken during that period. On July 7, 2004, the Company submitted to the IRS a letterprotesting the proposed adjustments, and reiterating its position. The Company intends to vigorously contest theproposed adjustments by the IRS. In the opinion of management, the resolution of these matters is not expected to have a material adverse effect on the Company’s financial position or results of operations.
(8) Accrued Expenses
Accrued expenses consist of the following:
January 1, January 3,2005 2004
Salaries and wages $ 650 $ 668Income taxes 194 482Non-income taxes 1,160 1,532Restructuring costs 2,659 174Current pension liabilities 1,359 1,663Other 365 661
$6,387 $5,180
(9) Employee Retirement Plans
The Company and its domestic subsidiaries have a noncontributory retirement plan for the benefit of salaried and nonsalaried employees, the Associates’ Retirement Plan (“ARP”). The employees covered under the ARP are eligible toparticipate upon the completion of one year of service. Salaried participant benefits are based upon a formula applied toa participant’s final average salary and years of service, which is reduced by a certain percentage of the participant’s socialsecurity benefits. Nonsalaried participant benefits are based on a fixed amount for each year of service. The ARP providesreduced benefits for early retirement. The Company intends to fund the minimum amounts required under the EmployeeRetirement Income Security Act of 1974 (ERISA). Effective April 1, 2004, the ARP retirement plan was frozen, resulting ina curtailment loss of $196 for the ARP in the first quarter of 2004, and the elimination of additional service costs after thefirst quarter of 2004.

32
NOTES TO CONSOLIDATED FINANCIAL STATEMENTS
R.G. Barry Corporation and Subsidiaries (continued)
(Dollar amounts in thousands, except for per share data)
The funded status of the ARP and the accrued retirement costs (measured on September 30, 2004 and 2003) asrecognized at January 1, 2005 and January 3, 2004 were:
2004 2003
Change in projected benefit obligation:Benefit obligation at the beginning of the year $30,971 $28,993Service cost 196 854Interest cost 1,792 1,857Plan amendments (1,743) —Actuarial loss 442 721Benefits paid (1,722) (1,454)
Benefit obligation at year-end $29,936 $30,971
Change in plan assets:Fair value of plan assets at the beginning of the year $21,142 $19,073Actual return on plan assets 2,786 3,818Contributions 289 —Expenses (340) (295)Benefits paid (1,722) (1,454)
Fair value of plan assets at year-end $22,155 $21,142
Funded status $ (7,781) $(9,829)Contributions made in the fourth quarter 145 —Unrecognized actuarial loss 4,613 6,390Unrecognized prior service cost — 202
Net amount recognized in the consolidated balance sheets $(3,023) $(3,237)
Amounts recognized in the consolidated balance sheets consist of:Accrued retirement costs, (including $767 and $1,443 in 2004
and 2003, respectively, classified as current accrued liability for retirement costs) $(7,780) $ (7,915)
Intangible asset — 202Accumulated other comprehensive expense 4,757 4,476
Net amount recognized in the consolidated balance sheets $(3,023) $(3,237)
The accumulated benefit obligation for the ARP was $29,936 and $29,058 as of January 1, 2005 and January 3, 2004,respectively.
At January 1, 2005, expected benefit payments to plan participants from the ARP for each of the next five years, and thenext 5 year period in aggregate, are projected as:
2005 $1,7392006 1,8012007 1,8852008 1,9702009 2,0672010–2014 11,152
The Company also has a Supplemental Retirement Plan (“SRP”) for certain officers and other key employees of theCompany as designated by the Board of Directors. The SRP is unfunded, noncontributory, and provides for the paymentof monthly retirement benefits. Benefits are based on a formula applied to the recipients’ final average monthly compen-sation, reduced by a certain percentage of their social security. For certain participants, the Plan provides an alternativebenefit formula for years worked past the normal retirement age assumed by the plan. Effective April 1, 2004, the SRPretirement plan was frozen, resulting in a curtailment loss of $932 for the SRP in the first quarter of 2004, and theelimination of additional service costs after the first quarter of 2004.

33
NOTES TO CONSOLIDATED FINANCIAL STATEMENTS
R.G. Barry Corporation and Subsidiaries (continued)
(Dollar amounts in thousands, except for per share data)
The funded status of the SRP and the accrued retirement cost (measured on September 30, 2004 and 2003) recognized atJanuary 1, 2005 and January 3, 2004 are:
2004 2003
Change in projected benefit obligation:Benefit obligation at the beginning of the year $ 7,532 $ 4,833Service cost 18 69Interest cost 459 407Curtailment/Plan Amendment (154) —Actuarial loss 287 2,434Benefits paid (343) (211)
Benefit obligation at year-end $ 7,799 $ 7,532
Change in plan assets:Fair value of plan assets at the beginning of the year $ — $ —Employer contributions 343 211Benefits paid (343) (211)
Fair value of plan assets at year-end $ — $ —
Funded status $(7,799) $(7,532)Contribution during the fourth quarter 148 55Unrecognized actuarial loss 1,214 1,171Unrecognized prior service cost — 1,014
Net amount recognized in the consolidated balance sheets $(6,437) $(5,292)
Amounts recognized in the consolidated balance sheets consist of:Accrued retirement cost, including current liability of
$592 and $220, respectively $(7,882) $(7,366)Intangible asset — 945Accumulated other comprehensive expense 1,445 1,129
Net amount recognized in the consolidated balance sheets $(6,437) $(5,292)
The accumulated benefit obligation for the SRP was $7,799 and $7,532 as of January 1, 2005 and January 3, 2004,respectively.
At January 1, 2005, expected benefit payments to plan participants from the SRP for each of the next five years, and thenext 5 year period in aggregate, are projected as:
2005 $ 5972006 6142007 6372008 6492009 6552010–2014 3,387
Weighted average assumptions to determine net costs for both the ARP and the SRP for the years ended January 1, 2005and January 3, 2004 were:
2004 2003
Discount rate 6.25% 6.60%Rate of compensation increase 4.00% 4.50%Expected return on plan assets 9.00% 9.00%
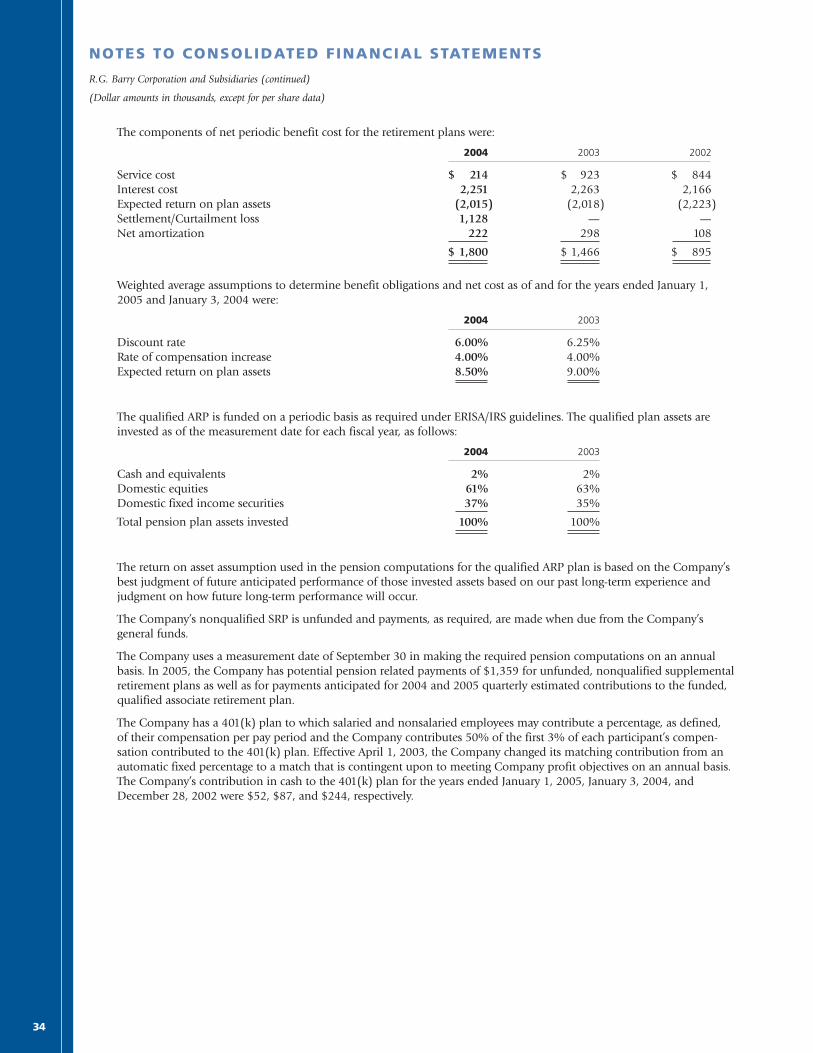
34
NOTES TO CONSOLIDATED FINANCIAL STATEMENTS
R.G. Barry Corporation and Subsidiaries (continued)
(Dollar amounts in thousands, except for per share data)
The components of net periodic benefit cost for the retirement plans were:
2004 2003 2002
Service cost $ 214 $ 923 $ 844Interest cost 2,251 2,263 2,166Expected return on plan assets (2,015) (2,018) (2,223)Settlement/Curtailment loss 1,128 — —Net amortization 222 298 108
$ 1,800 $ 1,466 $ 895
Weighted average assumptions to determine benefit obligations and net cost as of and for the years ended January 1,2005 and January 3, 2004 were:
2004 2003
Discount rate 6.00% 6.25%Rate of compensation increase 4.00% 4.00%Expected return on plan assets 8.50% 9.00%
The qualified ARP is funded on a periodic basis as required under ERISA/IRS guidelines. The qualified plan assets areinvested as of the measurement date for each fiscal year, as follows:
2004 2003
Cash and equivalents 2% 2%Domestic equities 61% 63%Domestic fixed income securities 37% 35%
Total pension plan assets invested 100% 100%
The return on asset assumption used in the pension computations for the qualified ARP plan is based on the Company’sbest judgment of future anticipated performance of those invested assets based on our past long-term experience andjudgment on how future long-term performance will occur.
The Company’s nonqualified SRP is unfunded and payments, as required, are made when due from the Company’sgeneral funds.
The Company uses a measurement date of September 30 in making the required pension computations on an annualbasis. In 2005, the Company has potential pension related payments of $1,359 for unfunded, nonqualified supplementalretirement plans as well as for payments anticipated for 2004 and 2005 quarterly estimated contributions to the funded,qualified associate retirement plan.
The Company has a 401(k) plan to which salaried and nonsalaried employees may contribute a percentage, as defined, of their compensation per pay period and the Company contributes 50% of the first 3% of each participant’s compen-sation contributed to the 401(k) plan. Effective April 1, 2003, the Company changed its matching contribution from anautomatic fixed percentage to a match that is contingent upon to meeting Company profit objectives on an annual basis.The Company’s contribution in cash to the 401(k) plan for the years ended January 1, 2005, January 3, 2004, andDecember 28, 2002 were $52, $87, and $244, respectively.

35
NOTES TO CONSOLIDATED FINANCIAL STATEMENTS
R.G. Barry Corporation and Subsidiaries (continued)
(Dollar amounts in thousands, except for per share data)
(10) Shareholders’ Equity
The Company has various stock option plans, under which have been granted incentive stock options (“ISOs”) andnonqualified stock options (“NQs”) exercisable for periods of up to 10 years from date of grant at prices not less than fairmarket value at date of grant. Information with respect to options under these plans follows:
Number of shares Number of shares Weighted-averagesubject to ISOs subject to NQs exercise price
Outstanding at December 29, 2001 819,700 586,200 $ 6.04Granted 265,300 30,700 5.74Exercised (188,700) (21,300) 2.70Expired/Cancelled (30,200) (150,000) 6.39
Outstanding at December 28, 2002 866,100 445,600 6.46Granted 202,500 59,200 3.43Exercised (7,700) (20,000) 3.19
` Expired/Cancelled (156,600) (39,900) 6.64
Outstanding at January 3, 2004 904,300 444,900 5.91Granted 75,000 150,000 2.52Exercised (800) — 3.01Expired/Cancelled (266,200) (142,600) 6.50
Outstanding at January 1, 2005 712,300 452,300 $ 5.05
Options exercisable at January 1, 2005 362,800 452,300
Options outstanding Options exercisable
Number Weighted averageRange of outstanding at remaining contractual Weighted average Number exercisable Weighted average
exercise prices January 1, 2005 life (years) exercise price at January 1, 2005 exercise price
$ 2.50 and under 115,000 1.8 $ 2.21 112,000 $ 2.212.51 – 5.00 731,900 7.2 3.66 459,800 3.875.01 – 10.00 191,700 6.3 6.46 117,300 7.07
10.01 – 15.00 126,000 2.8 13.58 126,000 13.58
1,164,600 815,100
At January 1, 2005, the remaining number of common shares available for grant of ISOs and NQs was 319,900, of which163,000 are available pursuant to the 1997 Incentive Stock Plan and 156,900 are available pursuant to the 2002 StockIncentive Plan.
At January 1, 2005, January 3, 2004, and December 28, 2002, the options outstanding under these plans were held by 65,80, and 85 employees respectively, and had expiration dates ranging from 2005 to 2014.
Stock appreciation rights may be issued subject to certain limitations. No such rights have been issued or are outstandingat January 1, 2005, January 3, 2004, and December 28, 2002.
The Company has an employee stock purchase plan, with approximately 506,000 shares available for subscription, in which approximately 175 employees are eligible to participate. Under the terms of the plan, employees receive optionsto acquire common shares at 85% of the lower of the fair market value on their enrollment date or at the end of eachtwo-year plan term. No shares were subscribed and no shares were purchased during the three year period ending January 1, 2005.
Year ended:
January 1, 2005 January 3, 2004 December 28, 2002
Total compensation cost recognized in income for stock-based employee compensation awards $ 65 $ 116 $ 131
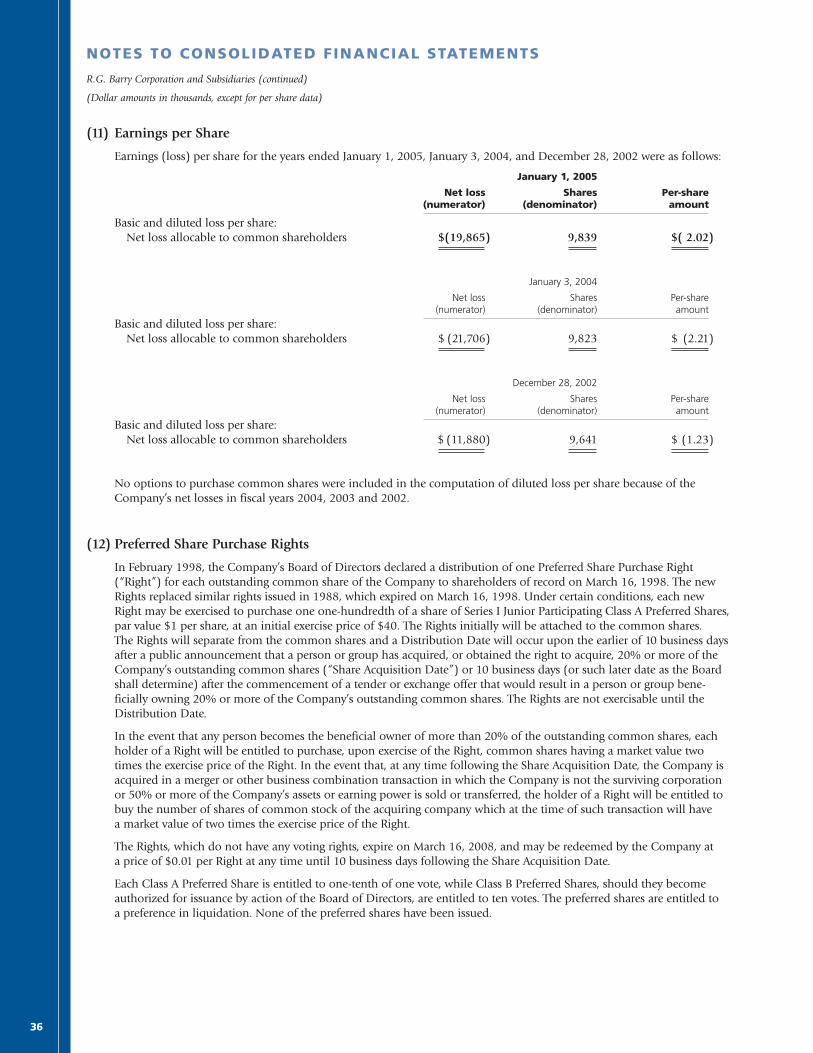
36
NOTES TO CONSOLIDATED FINANCIAL STATEMENTS
R.G. Barry Corporation and Subsidiaries (continued)
(Dollar amounts in thousands, except for per share data)
(11) Earnings per Share
Earnings (loss) per share for the years ended January 1, 2005, January 3, 2004, and December 28, 2002 were as follows:
January 1, 2005
Net loss Shares Per-share(numerator) (denominator) amount
Basic and diluted loss per share:Net loss allocable to common shareholders $(19,865) 9,839 $( 2.02)
January 3, 2004
Net loss Shares Per-share(numerator) (denominator) amount
Basic and diluted loss per share:Net loss allocable to common shareholders $ (21,706) 9,823 $ (2.21)
December 28, 2002
Net loss Shares Per-share(numerator) (denominator) amount
Basic and diluted loss per share:Net loss allocable to common shareholders $ (11,880) 9,641 $ (1.23)
No options to purchase common shares were included in the computation of diluted loss per share because of theCompany’s net losses in fiscal years 2004, 2003 and 2002.
(12) Preferred Share Purchase Rights
In February 1998, the Company’s Board of Directors declared a distribution of one Preferred Share Purchase Right(“Right”) for each outstanding common share of the Company to shareholders of record on March 16, 1998. The newRights replaced similar rights issued in 1988, which expired on March 16, 1998. Under certain conditions, each newRight may be exercised to purchase one one-hundredth of a share of Series I Junior Participating Class A Preferred Shares,par value $1 per share, at an initial exercise price of $40. The Rights initially will be attached to the common shares. The Rights will separate from the common shares and a Distribution Date will occur upon the earlier of 10 business daysafter a public announcement that a person or group has acquired, or obtained the right to acquire, 20% or more of theCompany’s outstanding common shares (“Share Acquisition Date”) or 10 business days (or such later date as the Boardshall determine) after the commencement of a tender or exchange offer that would result in a person or group bene-ficially owning 20% or more of the Company’s outstanding common shares. The Rights are not exercisable until theDistribution Date.
In the event that any person becomes the beneficial owner of more than 20% of the outstanding common shares, eachholder of a Right will be entitled to purchase, upon exercise of the Right, common shares having a market value twotimes the exercise price of the Right. In the event that, at any time following the Share Acquisition Date, the Company isacquired in a merger or other business combination transaction in which the Company is not the surviving corporationor 50% or more of the Company’s assets or earning power is sold or transferred, the holder of a Right will be entitled tobuy the number of shares of common stock of the acquiring company which at the time of such transaction will have a market value of two times the exercise price of the Right.
The Rights, which do not have any voting rights, expire on March 16, 2008, and may be redeemed by the Company at a price of $0.01 per Right at any time until 10 business days following the Share Acquisition Date.
Each Class A Preferred Share is entitled to one-tenth of one vote, while Class B Preferred Shares, should they becomeauthorized for issuance by action of the Board of Directors, are entitled to ten votes. The preferred shares are entitled to a preference in liquidation. None of the preferred shares have been issued.
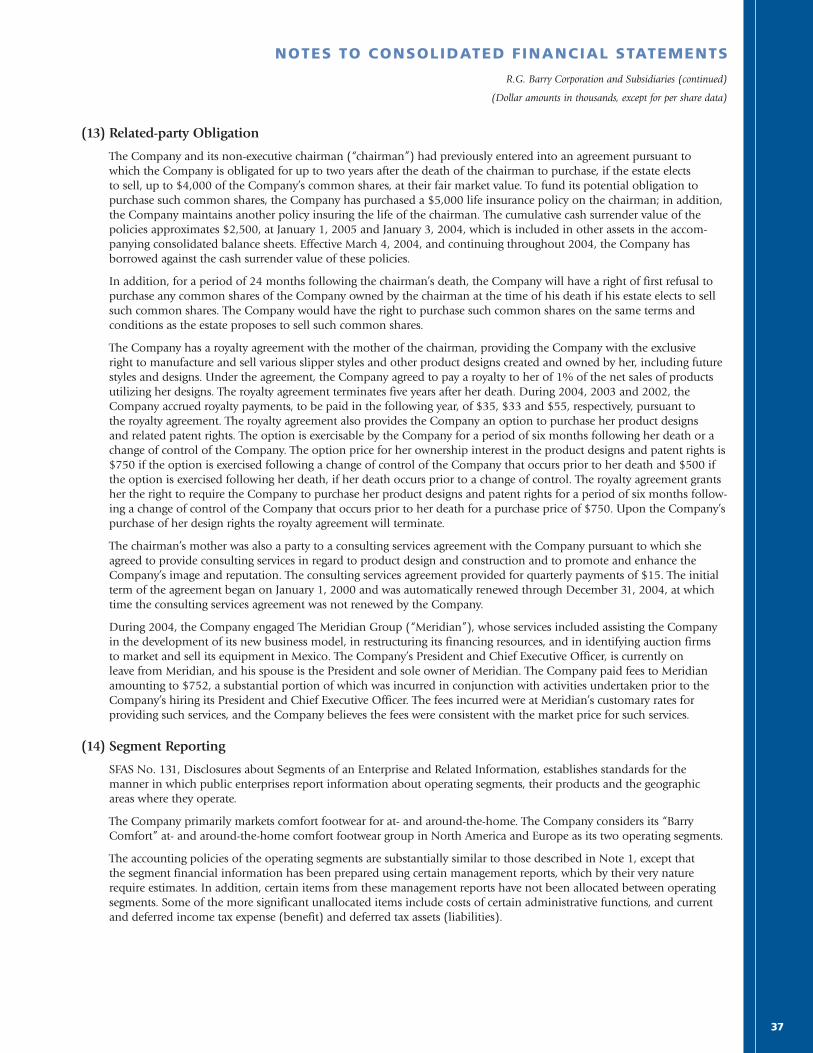
37
NOTES TO CONSOLIDATED FINANCIAL STATEMENTS
R.G. Barry Corporation and Subsidiaries (continued)
(Dollar amounts in thousands, except for per share data)
(13) Related-party Obligation
The Company and its non-executive chairman (“chairman”) had previously entered into an agreement pursuant to which the Company is obligated for up to two years after the death of the chairman to purchase, if the estate elects to sell, up to $4,000 of the Company’s common shares, at their fair market value. To fund its potential obligation topurchase such common shares, the Company has purchased a $5,000 life insurance policy on the chairman; in addition,the Company maintains another policy insuring the life of the chairman. The cumulative cash surrender value of thepolicies approximates $2,500, at January 1, 2005 and January 3, 2004, which is included in other assets in the accom-panying consolidated balance sheets. Effective March 4, 2004, and continuing throughout 2004, the Company hasborrowed against the cash surrender value of these policies.
In addition, for a period of 24 months following the chairman’s death, the Company will have a right of first refusal topurchase any common shares of the Company owned by the chairman at the time of his death if his estate elects to sellsuch common shares. The Company would have the right to purchase such common shares on the same terms andconditions as the estate proposes to sell such common shares.
The Company has a royalty agreement with the mother of the chairman, providing the Company with the exclusive right to manufacture and sell various slipper styles and other product designs created and owned by her, including futurestyles and designs. Under the agreement, the Company agreed to pay a royalty to her of 1% of the net sales of productsutilizing her designs. The royalty agreement terminates five years after her death. During 2004, 2003 and 2002, theCompany accrued royalty payments, to be paid in the following year, of $35, $33 and $55, respectively, pursuant to the royalty agreement. The royalty agreement also provides the Company an option to purchase her product designs and related patent rights. The option is exercisable by the Company for a period of six months following her death or achange of control of the Company. The option price for her ownership interest in the product designs and patent rights is$750 if the option is exercised following a change of control of the Company that occurs prior to her death and $500 ifthe option is exercised following her death, if her death occurs prior to a change of control. The royalty agreement grantsher the right to require the Company to purchase her product designs and patent rights for a period of six months follow-ing a change of control of the Company that occurs prior to her death for a purchase price of $750. Upon the Company’spurchase of her design rights the royalty agreement will terminate.
The chairman’s mother was also a party to a consulting services agreement with the Company pursuant to which sheagreed to provide consulting services in regard to product design and construction and to promote and enhance theCompany’s image and reputation. The consulting services agreement provided for quarterly payments of $15. The initialterm of the agreement began on January 1, 2000 and was automatically renewed through December 31, 2004, at whichtime the consulting services agreement was not renewed by the Company.
During 2004, the Company engaged The Meridian Group (“Meridian”), whose services included assisting the Companyin the development of its new business model, in restructuring its financing resources, and in identifying auction firms to market and sell its equipment in Mexico. The Company’s President and Chief Executive Officer, is currently on leave from Meridian, and his spouse is the President and sole owner of Meridian. The Company paid fees to Meridianamounting to $752, a substantial portion of which was incurred in conjunction with activities undertaken prior to theCompany’s hiring its President and Chief Executive Officer. The fees incurred were at Meridian’s customary rates forproviding such services, and the Company believes the fees were consistent with the market price for such services.
(14) Segment Reporting
SFAS No. 131, Disclosures about Segments of an Enterprise and Related Information, establishes standards for themanner in which public enterprises report information about operating segments, their products and the geographicareas where they operate.
The Company primarily markets comfort footwear for at- and around-the-home. The Company considers its “BarryComfort” at- and around-the-home comfort footwear group in North America and Europe as its two operating segments.
The accounting policies of the operating segments are substantially similar to those described in Note 1, except that the segment financial information has been prepared using certain management reports, which by their very naturerequire estimates. In addition, certain items from these management reports have not been allocated between operatingsegments. Some of the more significant unallocated items include costs of certain administrative functions, and currentand deferred income tax expense (benefit) and deferred tax assets (liabilities).
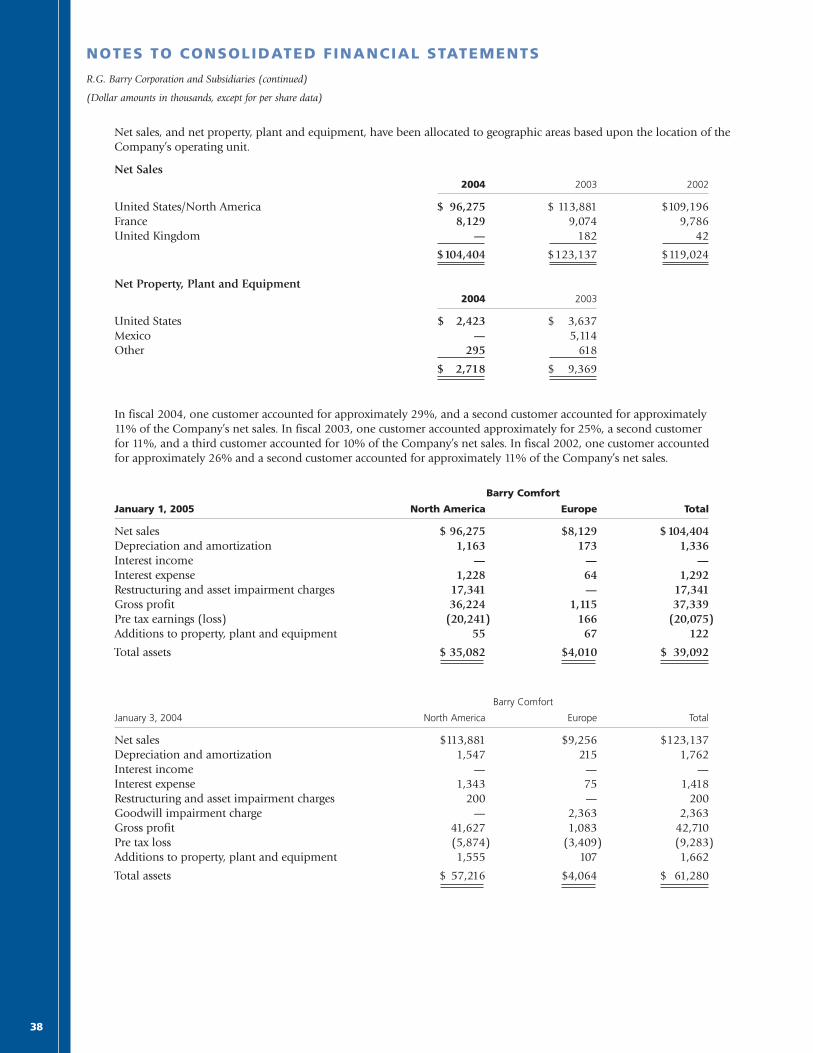
38
NOTES TO CONSOLIDATED FINANCIAL STATEMENTS
R.G. Barry Corporation and Subsidiaries (continued)
(Dollar amounts in thousands, except for per share data)
Net sales, and net property, plant and equipment, have been allocated to geographic areas based upon the location of theCompany’s operating unit.
Net Sales2004 2003 2002
United States/North America $ 96,275 $ 113,881 $109,196France 8,129 9,074 9,786United Kingdom — 182 42
$104,404 $123,137 $119,024
Net Property, Plant and Equipment2004 2003
United States $ 2,423 $ 3,637Mexico — 5,114Other 295 618
$ 2,718 $ 9,369
In fiscal 2004, one customer accounted for approximately 29%, and a second customer accounted for approximately 11% of the Company’s net sales. In fiscal 2003, one customer accounted approximately for 25%, a second customer for 11%, and a third customer accounted for 10% of the Company’s net sales. In fiscal 2002, one customer accounted for approximately 26% and a second customer accounted for approximately 11% of the Company’s net sales.
Barry Comfort
January 1, 2005 North America Europe Total
Net sales $ 96,275 $8,129 $104,404Depreciation and amortization 1,163 173 1,336Interest income — — —Interest expense 1,228 64 1,292Restructuring and asset impairment charges 17,341 — 17,341Gross profit 36,224 1,115 37,339Pre tax earnings (loss) (20,241) 166 (20,075)Additions to property, plant and equipment 55 67 122
Total assets $ 35,082 $4,010 $ 39,092
Barry Comfort
January 3, 2004 North America Europe Total
Net sales $113,881 $9,256 $123,137Depreciation and amortization 1,547 215 1,762Interest income — — —Interest expense 1,343 75 1,418Restructuring and asset impairment charges 200 — 200Goodwill impairment charge — 2,363 2,363Gross profit 41,627 1,083 42,710Pre tax loss (5,874) (3,409) (9,283)Additions to property, plant and equipment 1,555 107 1,662
Total assets $ 57,216 $4,064 $ 61,280
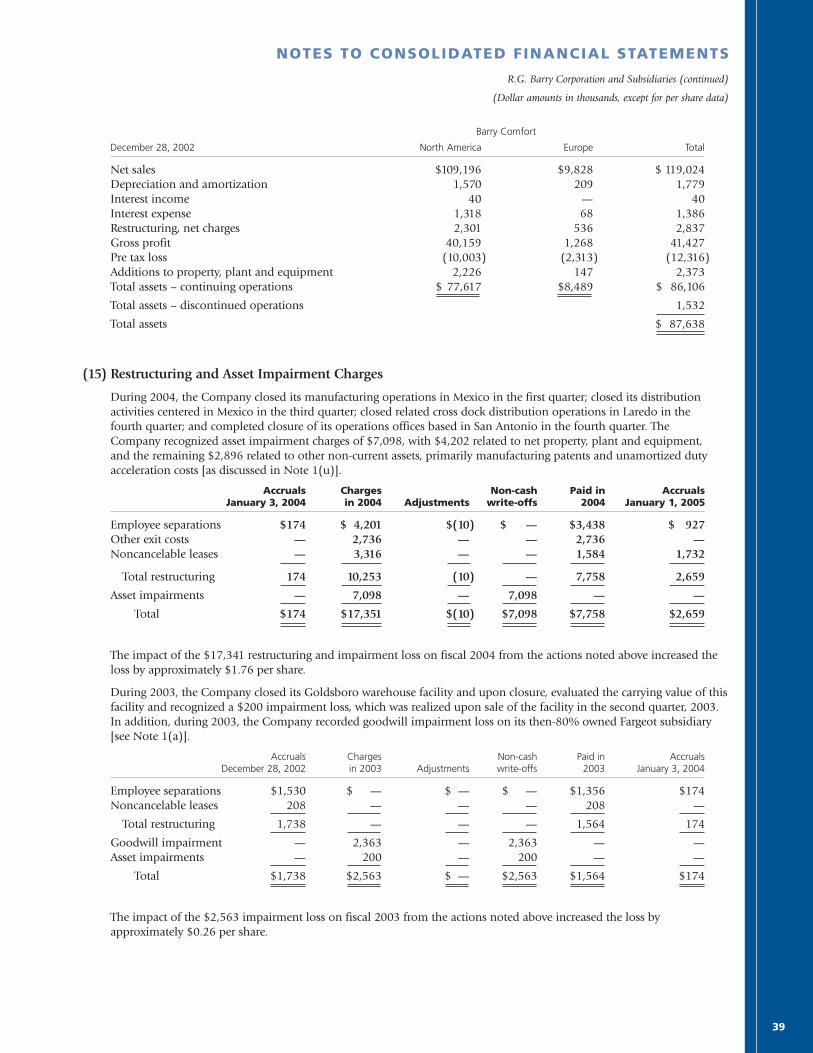
39
NOTES TO CONSOLIDATED FINANCIAL STATEMENTS
R.G. Barry Corporation and Subsidiaries (continued)
(Dollar amounts in thousands, except for per share data)
Barry Comfort
December 28, 2002 North America Europe Total
Net sales $109,196 $9,828 $ 119,024Depreciation and amortization 1,570 209 1,779Interest income 40 — 40Interest expense 1,318 68 1,386Restructuring, net charges 2,301 536 2,837Gross profit 40,159 1,268 41,427Pre tax loss (10,003) (2,313) (12,316)Additions to property, plant and equipment 2,226 147 2,373Total assets – continuing operations $ 77,617 $8,489 $ 86,106
Total assets – discontinued operations 1,532
Total assets $ 87,638
(15) Restructuring and Asset Impairment Charges
During 2004, the Company closed its manufacturing operations in Mexico in the first quarter; closed its distributionactivities centered in Mexico in the third quarter; closed related cross dock distribution operations in Laredo in the fourth quarter; and completed closure of its operations offices based in San Antonio in the fourth quarter. The Company recognized asset impairment charges of $7,098, with $4,202 related to net property, plant and equipment, and the remaining $2,896 related to other non-current assets, primarily manufacturing patents and unamortized dutyacceleration costs [as discussed in Note 1(u)].
Accruals Charges Non-cash Paid in AccrualsJanuary 3, 2004 in 2004 Adjustments write-offs 2004 January 1, 2005
Employee separations $174 $ 4,201 $(10) $ — $3,438 $ 927Other exit costs — 2,736 — — 2,736 —Noncancelable leases — 3,316 — — 1,584 1,732
Total restructuring 174 10,253 (10) — 7,758 2,659
Asset impairments — 7,098 — 7,098 — —
Total $174 $17,351 $(10) $7,098 $7,758 $2,659
The impact of the $17,341 restructuring and impairment loss on fiscal 2004 from the actions noted above increased theloss by approximately $1.76 per share.
During 2003, the Company closed its Goldsboro warehouse facility and upon closure, evaluated the carrying value of thisfacility and recognized a $200 impairment loss, which was realized upon sale of the facility in the second quarter, 2003.In addition, during 2003, the Company recorded goodwill impairment loss on its then-80% owned Fargeot subsidiary[see Note 1(a)].
Accruals Charges Non-cash Paid in AccrualsDecember 28, 2002 in 2003 Adjustments write-offs 2003 January 3, 2004
Employee separations $1,530 $ — $ — $ — $1,356 $174Noncancelable leases 208 — — — 208 —
Total restructuring 1,738 — — — 1,564 174
Goodwill impairment — 2,363 — 2,363 — —Asset impairments — 200 — 200 — —
Total $1,738 $2,563 $ — $2,563 $1,564 $174
The impact of the $2,563 impairment loss on fiscal 2003 from the actions noted above increased the loss byapproximately $0.26 per share.

40
NOTES TO CONSOLIDATED FINANCIAL STATEMENTS
R.G. Barry Corporation and Subsidiaries (continued)
(Dollar amounts in thousands, except for per share data)
During 2002, the Company engaged in several actions related to reorganization efforts to improve profitability. One action in the first quarter resulted in the coordinated transfer of cutting operations from the U.S. to Mexico and a reduction in sewing operations in Nuevo Laredo, Mexico. This action resulted in the reduction of 354 positions at a payroll severance cost of $727. Other actions in the third and fourth quarters were taken to restructure staff support of sales and operations, which impacted 9 employees at a payroll severance cost of $938. In the fourth quarter, theCompany announced the decision to close the Goldsboro distribution center in early 2003, impacting 53 positions at a payroll severance cost of $601. In the same year, the Company closed the Wales distribution center in early 2003,impacting 22 positions at a payroll severance cost of $178, recognition of $208 in future lease obligation losses, and$150 in asset impairment losses. The closure of the Wales distribution center ended direct selling activities in Europe. At year-end 2002, the Company also recognized an asset impairment loss for $523 on net property, plant and equipmentand on non-current assets, trademarks, and patents, associated with its discontinued operations.
Accruals Charges Non-cash Paid in AccrualsDecember 29, 2001 in 2002 Adjustments write-offs 2002 December 28, 2002
Employee separations $346 $2,444 $34 $ — $1,294 $1,530Noncancelable leases — 208 — — — 208
Total restructuring 346 2,652 34 — 1,294 1,738
Asset impairment — 673 — 673 — —
Total $346 $3,325 $34 $673 $1,294 $1,738
After an income tax benefit of $131, 2002 actions increased the loss by $2,228, or approximately $0.23 per share.
(16) Sale of Vesture Net Assets
In 2003, the Company sold certain assets of its Vesture thermal product subsidiary. Vesture assets sold in the transactionincluded furnishings, trade fixtures, equipment; raw material and finished products inventories; books and records,including supplier and customer lists; Vesture’s rights under certain contracts and agreements; patents and trademarksused by Vesture; and trade accounts receivable of Vesture arising after March 29, 2003. The Company retained Vesture’saccount receivables as of March 29, 2003. As consideration, the purchaser assumed specific liabilities and obligations of Vesture and paid the Company a nominal sum of cash, and provided the Company with a promissory note in theamount of $334, due in December 2004. In 2003, the Company provided a full reserve for the balance due on the note.As additional consideration for the assets sold, the purchaser committed to remit a specified sum in December, 2004 andmake annual payments, through 2007, based upon a percentage of purchaser’s annual sales of certain products in excessof specific sales thresholds. Beyond the provisions involved in the sale, the Company has no continuing involvement inthis business.
At the time of the sale, the particular assets and liabilities involved in this sale included:
Accounts receivable, net $ 783Inventory 253Other Assets 108Accounts payable (475)Other liabilities (304)
Net assets involved in sale $ 365
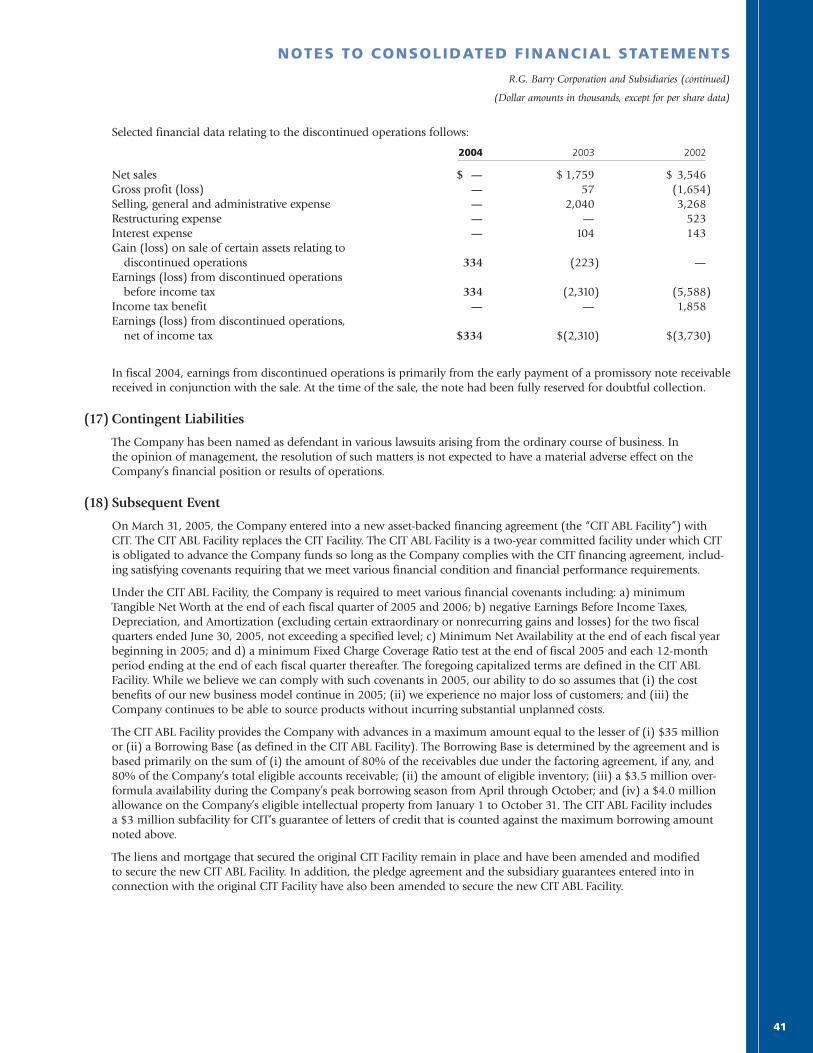
41
NOTES TO CONSOLIDATED FINANCIAL STATEMENTS
R.G. Barry Corporation and Subsidiaries (continued)
(Dollar amounts in thousands, except for per share data)
Selected financial data relating to the discontinued operations follows:
2004 2003 2002
Net sales $ — $ 1,759 $ 3,546Gross profit (loss) — 57 (1,654)Selling, general and administrative expense — 2,040 3,268Restructuring expense — — 523Interest expense — 104 143Gain (loss) on sale of certain assets relating to
discontinued operations 334 (223) —Earnings (loss) from discontinued operations
before income tax 334 (2,310) (5,588)Income tax benefit — — 1,858Earnings (loss) from discontinued operations,
net of income tax $334 $(2,310) $(3,730)
In fiscal 2004, earnings from discontinued operations is primarily from the early payment of a promissory note receivablereceived in conjunction with the sale. At the time of the sale, the note had been fully reserved for doubtful collection.
(17) Contingent Liabilities
The Company has been named as defendant in various lawsuits arising from the ordinary course of business. In the opinion of management, the resolution of such matters is not expected to have a material adverse effect on theCompany’s financial position or results of operations.
(18) Subsequent Event
On March 31, 2005, the Company entered into a new asset-backed financing agreement (the “CIT ABL Facility”) withCIT. The CIT ABL Facility replaces the CIT Facility. The CIT ABL Facility is a two-year committed facility under which CITis obligated to advance the Company funds so long as the Company complies with the CIT financing agreement, includ-ing satisfying covenants requiring that we meet various financial condition and financial performance requirements.
Under the CIT ABL Facility, the Company is required to meet various financial covenants including: a) minimumTangible Net Worth at the end of each fiscal quarter of 2005 and 2006; b) negative Earnings Before Income Taxes,Depreciation, and Amortization (excluding certain extraordinary or nonrecurring gains and losses) for the two fiscalquarters ended June 30, 2005, not exceeding a specified level; c) Minimum Net Availability at the end of each fiscal yearbeginning in 2005; and d) a minimum Fixed Charge Coverage Ratio test at the end of fiscal 2005 and each 12-monthperiod ending at the end of each fiscal quarter thereafter. The foregoing capitalized terms are defined in the CIT ABLFacility. While we believe we can comply with such covenants in 2005, our ability to do so assumes that (i) the costbenefits of our new business model continue in 2005; (ii) we experience no major loss of customers; and (iii) theCompany continues to be able to source products without incurring substantial unplanned costs.
The CIT ABL Facility provides the Company with advances in a maximum amount equal to the lesser of (i) $35 millionor (ii) a Borrowing Base (as defined in the CIT ABL Facility). The Borrowing Base is determined by the agreement and isbased primarily on the sum of (i) the amount of 80% of the receivables due under the factoring agreement, if any, and80% of the Company’s total eligible accounts receivable; (ii) the amount of eligible inventory; (iii) a $3.5 million over-formula availability during the Company’s peak borrowing season from April through October; and (iv) a $4.0 millionallowance on the Company’s eligible intellectual property from January 1 to October 31. The CIT ABL Facility includes a $3 million subfacility for CIT’s guarantee of letters of credit that is counted against the maximum borrowing amountnoted above.
The liens and mortgage that secured the original CIT Facility remain in place and have been amended and modified to secure the new CIT ABL Facility. In addition, the pledge agreement and the subsidiary guarantees entered into inconnection with the original CIT Facility have also been amended to secure the new CIT ABL Facility.
42
REPORT OF INDEPENDENT REGISTERED PUBLIC ACCOUNTING FIRM
R.G. Barry Corporation and Subsidiaries
The Board of Directors and ShareholdersR.G. Barry Corporation:
We have audited the accompanying consolidated balance sheets of R.G. Barry Corporation and subsidiaries as of January 1,2005 and January 3, 2004 and the related consolidated statements of operations, shareholders’ equity and comprehensiveincome, and cash flows for each of the years in the three-year period ended January 1, 2005. These consolidated financialstatements are the responsibility of the Company’s management. Our responsibility is to express an opinion on theseconsolidated financial statements based on our audits.
We conducted our audits in accordance with the standards of the Public Company Accounting Oversight Board (UnitedStates). Those standards require that we plan and perform the audit to obtain reasonable assurance about whether the financialstatements are free of material misstatement. An audit includes examining, on a test basis, evidence supporting the amountsand disclosures in the financial statements. An audit also includes assessing the accounting principles used and significant estimates made by management, as well as evaluating the overall financial statement presentation. We believe that our audits provide a reasonable basis for our opinion.
In our opinion, the consolidated financial statements referred to above present fairly, in all material respects, the financialposition of R.G. Barry Corporation and subsidiaries as of January 1, 2005 and January 3, 2004 and the results of theiroperations and their cash flows for each of the years in the three-year period ended January 1, 2005 in conformity with U.S. generally accepted accounting principles.
KPMG LLP
Columbus, OhioFebruary 25, 2005,
except as to Note 18, which is as of March 31, 2005
43
DIRECTORS & OFFICERS
R.G. Barry Corporation and Subsidiaries
BOARD OF DIRECTORS
Gordon Zacks,Chairman of the Board, R.G. Barry Corporation
Christian Galvis,Former Executive Vice President Operations,R.G. Barry Corporation
David P. Lauer,Former President & Chief Operating Officer,Bank One, Columbus, NA
Roger E. Lautzenhiser,Managing Partner – Cincinnati Office,Vorys, Sater, Seymour and Pease LLP(attorneys at law)
Janice E. Page,Former Senior Group Vice President,Sears Roebuck and Co.
Edward M. Stan,President,Edward M. Stan and Associates(importers)
Harvey A. Weinberg,Former Chairman of the Board, Chief Executive Officer,Hartmarx Corporation
AUDIT COMMITTEE
Harvey A. Weinberg, ChairmanDavid P. LauerJanice E. PageEdward M. Stan
COMPENSATION COMMITTEE
Janice E. Page, ChairmanDavid P. LauerEdward M. StanHarvey A. Weinberg
NOMINATING & GOVERNANCECOMMITTEE
Edward M. Stan, ChairmanDavid P. LauerJanice E. PageHarvey A. Weinberg
CORPORATE OFFICERS
Thomas M. Von Lehman,President & Chief Executive Officer
Harry Miller,Vice President Human Resources
Daniel D. Viren,Senior Vice President Finance, Chief Financial Officer & Secretary
DIVISIONAL & SUBSIDIARY OFFICERS
Greg Ackard,Vice President Sales – National Accounts
John Black,Vice President Distribution
Tommy Bray,Vice President Product
Thierry Civetta,President – Fargeot et Compagnie S.A.
Bob Dickey,Senior Vice President Sales
Glenn Evans,Senior Vice President Creative Services &Sourcing
James L. Faulkner,Vice President Field Sales
Pam Gentile,Senior Vice President Sales – National Accounts
Tom Hollister,Vice President Sales
José G. Ibarra,Vice President Treasurer
Michael S. Krasnoff,Vice President Assistant Treasurer
Michael Schatz,Vice President Sourcing
Matthew J. Sullivan,Senior Vice President Integrated Supply Chain
GENERAL COUNSEL
Vorys, Sater, Seymour and Pease LLP,Columbus, Ohio
AUDITORS
KPMG LLP,Columbus, Ohio
REGISTRAR & TRANSFER AGENT
The Bank of New York,New York, New York
COMMON STOCK
Since June 2004, R.G. Barry Corporationcommon shares are dually quoted on theOTC Bulletin Board and The Pink Sheetsunder trading symbol RGBC.

44
CORPORATE INFORMATION
R.G. Barry Corporation and Subsidiaries (continued)
LOCATIONS
CORPORATE OFFICE
13405 Yarmouth Road NW,Pickerington, Ohio 43147Telephone 614.864.6400Websites www.rgbarry.com
www.dearfoams.com
ADMINISTRATIVE & SALES OFFICES
Bentonville, ArkansasHong KongNew York CityThiviers, France
DISTRIBUTION CENTER
San Angelo, Texas
TRADEMARKS
The following are the principaltrademarks of the Company registeredwith or registration applied for with theUnited States Department of Commerceand Trademark Office or with theappropriate foreign registration authority:
Angel Treads®
Barry Comfort®
Dearfoams®
EZfeet®
Fargeot™
Madye’s®
Royal Comfort®
Snug Treds®
Soft Notes®
Solé™
Terrasoles®
Zizi®
R.G. Barry Corporation also sources and sells Liz Claiborne®, Claiborne®, andVillager® slippers under license granted by L.C. Licensing, Inc.; NASCAR® slippersunder licenses granted by the NationalAssociation For Stock Car Auto Racing,Inc.; Dale Earnhardt, Inc., Rusty Wallace,Inc., Penske Racing South, Inc., JGMotorsports, Inc. and Redline SportsMarketing, Inc.; and Mushrooms®
slippers under a license granted byAmAsia International LTD.
SUBSIDIARIES
The Dearfoams CompanyBarry Comfort de Mexico, S.A. de C.V.Barry de Acuña, S.A. de C.V.Barry de Mexico, S.A. de C.V.Barry de Zacatecas, S.A. de C.V.Barry Distribution Center de Mexico,
S.A. de C.V.Escapade, S.A.Fargeot et Compagnie, S.A.Procesadora de Nuevo Laredo, S.A. de
C.V.R.G. Barry International, Inc.RGB Technology, Inc.
(formerly Vesture Corporation)
EQUAL EMPLOYMENT OPPORTUNITY
R.G. Barry Corporation is an equalopportunity employer, offering theopportunity of equal employment to all individuals without regard to their race, color, religion, sex, national origin or age.
SHAREHOLDER INFORMATION
For information regarding Shareholderaccounts, call The Bank of New York at 800.524.4458 or write them atShareholder Relations Department – 11W,P.O. Box 11258, Church Street Station,New York, NY 10286.
Stock certificates for transfer and addresschange should be sent to The Bank of New York, Receive and DeliverDepartment – 11W, P.O. Box 11002,Church Street Station, New York, NY10286.
FORMS 10-K, 10-Q & 8-K
The Company’s annual report to theSecurities and Exchange Commission,Form 10-K, its quarterly reports, Form 10-Q, and other current reports, Form 8-K, are available without charge at theCompany Website at www.rgbarry.com or may be obtained by writing to theCompany at Investor Relations, R.G. BarryCorporation, 13405 Yarmouth Road NW,Pickerington, OH 43147.
ANNUAL SHAREHOLDERS MEETING
The Annual Shareholders Meeting will be held at 11:00 a.m. EDT Friday, May 20, 2005, at the Company’sCorporate Offices, 13405 Yarmouth Road NW, Pickerington, OH 43147.

OUR BASIC PURPOSE
The basic purpose of R.G. Barry Corporation is to operate profitably a dynamic, progressive,growing, investor-owned company within the framework of high ethical standards of conduct which:
Creates and sells quality products which serve the comfort needs of people.
Provides superior service to our customers who distribute, sell and display our products to the consumer.
Creates a climate that stimulates, challenges and channels the human intelligence, ingenuity, anddesire of our Associates to work together safely and effectively for the fulfillment of our purposeand provides them with a sense of achievement, equitable compensation plus participation in the results of success.
Makes a contribution to our society by demonstrating how people of all races, nationalities, creeds and genders can work together cooperatively to the benefit of each and all.
Increases the value of all assets (tangible and intangible) of the company and improves thestockholders’ equity and/or return on investment over the long and short period of time.
Strengthens the community, the country and the free enterprise system.

R.G. Barry Corporation
13405 Yarmouth Road N.W.
Pickerington, Ohio 43147
614.864.6400
www.rgbarry.com