rheological, mechanical and transport properties of blown …ve4ep.com/a/19june/статьи...
TRANSCRIPT

Available online at www.sciencedirect.comEUROPEAN
MA
CR
OM
OL
EC
UL
AR
NA
NO
TE
CH
NO
LO
GY
European Polymer Journal 44 (2008) 1346–1357
www.elsevier.com/locate/europolj
POLYMERJOURNAL
Macromolecular Nanotechnology
Rheological, mechanical and transport properties of blownfilms of high density polyethylene nanocomposites
Cybele Lotti a, Claudia S. Isaac a, Marcia C. Branciforti a, Rosa M.V. Alves b,Susana Liberman c, Rosario E.S. Bretas a,*
a Universidade Federal de Sao Carlos, Departamento de Engenharia de Materiais, Rod. Washington Luis, Km 235, C.P. 676,
Sao Carlos, SP 13565-905, Brazilb Centro de Pesquisa e Desenvolvimento de Embalagens (CETEA), Campinas, SP 13070-178, Brazil
c Braskem S.A., III Polo Petroquimico,Via Oeste, Passo Raso, Triunfo, RS, 95853-000, Brazil
Received 6 July 2007; received in revised form 6 February 2008; accepted 13 February 2008Available online 21 February 2008
Abstract
In this work, high density polyethylene (HDPE) was mixed in a twin screw extruder with organophilic treated clay,Cloisite 20A, and a compatibility agent, a HDPE grafted with maleic anhydride (PEMA). The screw profile was changedfrom a less dispersive (Profile 1) to a high dispersive configuration (Profile 2). A masterbatch procedure was used to obtaina final organoclay concentration of 5 wt.%. Both profiles allowed the intercalation of the HDPE into the clay, increasingthe clay’s gallery distance to 3.7 nm. However, the samples produced with Profile 2 (Nano 2 samples) were more elastic andhad a more stable structure than the samples produced with Profile 1. Therefore, two kind of blown films of Nano 2 sam-ples were made: FN1 and FN2. The last one was blown at a higher screw velocity than the FN1. Both films had an increaseof 95% in the elastic modulus and a reduction of 60% and 45% in O2 and water vapor permeability rates, respectively,compared to the film of pure HDPE. However, the FN2 structure was more unstable than the FN1 structure. It was con-cluded that both screw profiles gave the same level of HDPE intercalation in the clay; however, the more dispersive profileproduced more time-stable and elastic structures. The increase in the elongation rate during the film blowing process pro-duced also more time-stable morphologies; however, this higher orientation created matrix/filler interfacial defects.� 2008 Elsevier Ltd. All rights reserved.
Keywords: Nanocomposites; Blown films; HDPE; Rheological properties; Transport properties
1. Introduction
The packaging industry plays a significant role ina nation economic development; thus, its improve-
0014-3057/$ - see front matter � 2008 Elsevier Ltd. All rights reserved
doi:10.1016/j.eurpolymj.2008.02.014
* Corresponding author. Tel.: +55 16 3351 8510; fax: +55 163361 5404.
E-mail address: [email protected] (R.E.S. Bretas).
ment can help the economic growth by increasingthe efficiency of food marketing and other products,and by adding value to exports, for example [1]. Inthis context, nanocomposites, a new class of materi-als, have a fundamental role in this improvement,because they have better mechanical, thermal andbarrier properties than the pure polymer [2]. Thenanocomposites are characterized by the use of a
.
C. Lotti et al. / European Polymer Journal 44 (2008) 1346–1357 1347
MA
CR
OM
OL
EC
UL
AR
NA
NO
TE
CH
NO
LO
GY
reinforcement agent with nano dimensions, which isadded in small quantities compared to the tradi-tional composites. When these materials are pro-cessed by film blowing, better properties areexpected, besides the improvement in the ability towithstand the tensions during the blowing.
The ability of a polymer to be blown depends onits melt strength or an equivalent rheological prop-erty, like the elongational viscosity, the zero shearviscosity or the storage modulus. The higher theseproperties are, the higher the bubble stability is.
The rheological properties of a nanocomposite aredependent on molecular weight, molecular weightdistribution, branches amount, nanofiller concentra-tion and dispersion. During the mixing and filmblowing processes, the polymer and the nanofillerare submitted to an intense thermo-mechanical his-tory in order to intercalate/exfoliate and dispersethe filler; however, this thermo-mechanical historycan also degraded the polymer. Thus, the measure-ment of the rheological properties before and afterthe processing can give indication of the type and sta-bility of the formed structures.
The literature shows few works which evaluatethe influence of the film blowing process on thenanocomposites final morphology. Shah et al. [3]demonstrated that the increase of draw down ratioreduced the gas permeability of an ionomer-nanoclay film due to a higher biaxial orientation ofthe clay platelets in the plane of the film, but thevariation of blow-up ratio did not interfere. Theexfoliated film had an increase of 50% in tensilemodulus, without any significant reduction in tearstrength and film extensibility. In another work,Ranadea et al. [4] showed that polyethylene graftedwith maleic anhydride improved the nanoclay dis-persion in the polyethylene matrix, which resultedin improved tensile and creep properties of the nano-composites films. Min et al. [5] also studied theinfluence of a polyethylene grafted with maleicanhydride on the development of intercalated/exfoliated morphologies of blown films of highdensity polyethylene nanocomposites. A high com-patibility agent content (PEMA/organoclay 20/1ratio) improved exfoliation and, consequently, themechanical and thermal properties. A 70% increasein tensile strength was obtained, even with the reduc-tion in crystallinity due to the high amounts of com-patibility agent. Nevertheless, none of these studiesevaluated the effect of the processing conditions ofthe film blowing process in the morphology andproperties of the nanocomposites.
In this work, some parameters of the mixing andfilm blowing processes were changed in order tostudy their influence on the intercalation/exfoliationlevel of films of a HDPE/clay nanocomposite [6].The influence of these parameters on the rheologi-cal, mechanical and transport properties of the filmswas also analyzed.
2. Experimental
2.1. Materials
A HDPE (film blowing grade), HF0150 fromBraskem S.A., with melt flow index of 10 g/10 min(190 �C, 2.16 kg), weight average molecular weight,Mw, of 420,907 g/mol and molecular weight distribu-tion of 20.89 was chosen as matrix. An antioxidantwas added by the supplier to avoid extensive thermaldegradation. A HDPE grafted with maleic anhy-dride (1%), PEMA, trade name Polybond 3009 fromChemtura, with melt flow index of 5 g/10 min(190 �C, 2.16 kg) and melting temperature of127 �C was used as compatibility agent. The nano-clay was montmorillonite, MMT, trade name Cloi-site 20A from Southern Clay, organically modifiedwith a dimethyl-dihydrogenated tallow-ammoniumchloride salt and with less than 2% of moisture.The heat stability of the clay was measured by highresolution thermo-gravimetrical analysis, TGA,using a Hi-Res TGA 2950 equipment from TAInstruments, at a heating rate of 20 �C/min, undernitrogen atmosphere.
2.2. Mixing
It is known [7] that during mixing of a polymerwith powder filler, the higher the polymer viscosityis the higher the stresses and the higher the dispersivemixing. On the other hand, the lower the polymerviscosity is, the higher the distributive mixing is.Thus, it is expected that in order to exfoliate the claythe temperatures should be the lowest, but in orderto distribute the clay, the temperatures should beraised. Following this assumption, masterbatchesof PEMA and MMT (75/25 wt.%) were producedin a co-rotating twin screw extruder, from Werner& Pfleiderer, model ZSK30, with D = 30 mm andL = 1065 mm. Mixing temperatures between 160and 230 �C were tested. However, at the lowest tem-peratures, no extrusion was done because of theextremely high torques developed by the extruder.The optimal temperature range (moderate to low
1348 C. Lotti et al. / European Polymer Journal 44 (2008) 1346–1357
MA
CR
OM
OL
EC
UL
AR
NA
NO
TE
CH
NO
LO
GY
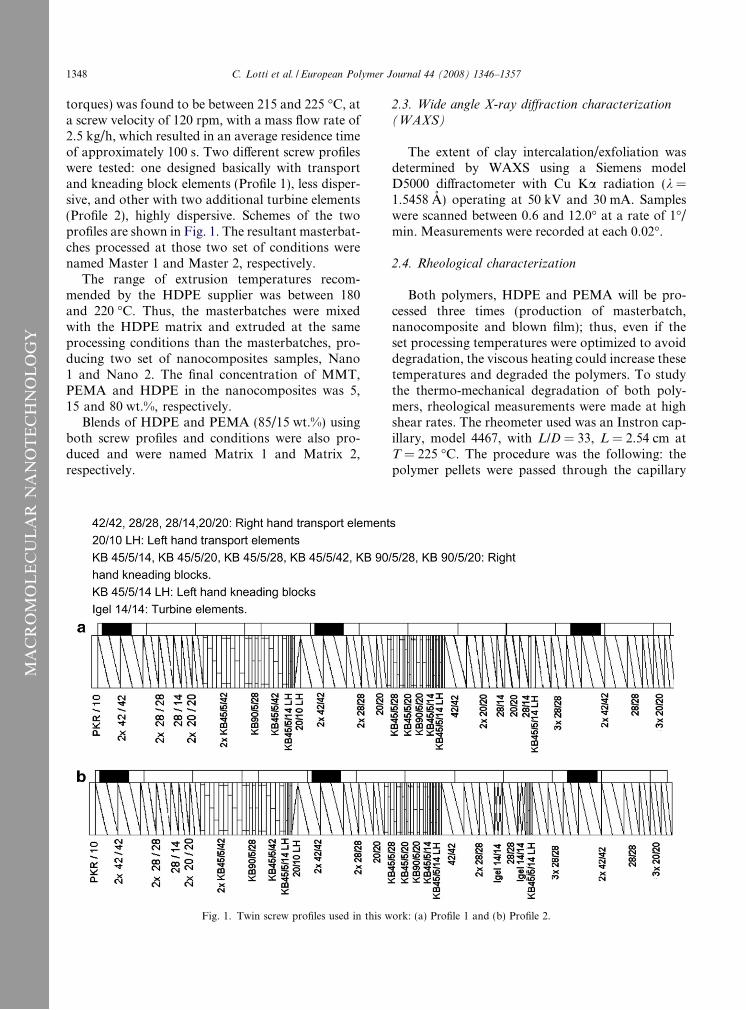
torques) was found to be between 215 and 225 �C, ata screw velocity of 120 rpm, with a mass flow rate of2.5 kg/h, which resulted in an average residence timeof approximately 100 s. Two different screw profileswere tested: one designed basically with transportand kneading block elements (Profile 1), less disper-sive, and other with two additional turbine elements(Profile 2), highly dispersive. Schemes of the twoprofiles are shown in Fig. 1. The resultant masterbat-ches processed at those two set of conditions werenamed Master 1 and Master 2, respectively.
The range of extrusion temperatures recom-mended by the HDPE supplier was between 180and 220 �C. Thus, the masterbatches were mixedwith the HDPE matrix and extruded at the sameprocessing conditions than the masterbatches, pro-ducing two set of nanocomposites samples, Nano1 and Nano 2. The final concentration of MMT,PEMA and HDPE in the nanocomposites was 5,15 and 80 wt.%, respectively.
Blends of HDPE and PEMA (85/15 wt.%) usingboth screw profiles and conditions were also pro-duced and were named Matrix 1 and Matrix 2,respectively.
Fig. 1. Twin screw profiles used in this w
2.3. Wide angle X-ray diffraction characterization
(WAXS)
The extent of clay intercalation/exfoliation wasdetermined by WAXS using a Siemens modelD5000 diffractometer with Cu Ka radiation (k =1.5458 A) operating at 50 kV and 30 mA. Sampleswere scanned between 0.6 and 12.0� at a rate of 1�/min. Measurements were recorded at each 0.02�.
2.4. Rheological characterization
Both polymers, HDPE and PEMA will be pro-cessed three times (production of masterbatch,nanocomposite and blown film); thus, even if theset processing temperatures were optimized to avoiddegradation, the viscous heating could increase thesetemperatures and degraded the polymers. To studythe thermo-mechanical degradation of both poly-mers, rheological measurements were made at highshear rates. The rheometer used was an Instron cap-illary, model 4467, with L/D = 33, L = 2.54 cm atT = 225 �C. The procedure was the following: thepolymer pellets were passed through the capillary
ork: (a) Profile 1 and (b) Profile 2.

Table 1Set conditions for the nanocomposites film blowing process
Set conditions FHDPE FN1 FN2
C. Lotti et al. / European Polymer Journal 44 (2008) 1346–1357 1349
CR
OM
OL
EC
UL
AR
NA
NO
TE
CH
NO
LO
GY
once; the extrudate was collected and passedthrough the capillary twice, at the same conditions.
The high resolution TGA curve of the nanoclay isgiven in Fig. 2. It is observed an initial loss mass atapproximately 50 �C, which can be attributed towater loss, and a second and extensive loss mass,between 231.8 and 450 �C, which is attributedmainly to organic surfactant degradation [8]. Thatis, the quaternary ammonium salt will be stable upto approximately 231 �C, which is higher than theprocessing temperatures. It is also worthwhile tomention that the residence time for the preparationof the masterbatches was very small; thus, in thiswork, it was assumed that surfactant loss or polymerdegradation were minimal during the processing.
All the rheological measurements at low shearrates and low frequencies were made in a controlledstrain rheometer ARES from Rheometric Scientific,using 25 mm plate-plate geometry, temperature of225 �C, gap of 1 mm and nitrogen atmosphere.Measurements of steady state shear viscosity gðc _Þwere made between 0.01 and 100 s�1; delay beforemeasurement input was determined from stress-overshoot experiments. Measurements of thestorage modulus G0, the loss modulus G00 and thecomplex viscosity g* as a function of frequencyand time were also done. The strain was set at 1%.The time sweep test was done at 1 rad/s during4000 s. Stress growth experiments were made at ashear rate of 0.01 s�1 during 450 s; the shear ratewas withdrawn and the relaxation tensions weremeasured during another 450 s.
The steady state shear viscosity at high shearrates was measured in an Instron Capillary rheom-eter, with L/D = 33 also at T = 225 �C.
Fig. 2. Thermogravimetric analysis of MMT (Cloisite 20A).
2.5. Films blowing
The films blowing of the nanocomposites wasmade in a film blowing machine with annularmatrix, from Collin, model ECS30, with screwlength L = 500 mm and L/D = 25. The temperaturerange was set between 190 and 235 �C. After stableprocessing conditions were obtained for HDPE(FHDPE), the nanocomposite was processed atthe same conditions (FN1) and at a higher screwvelocity (FN2) than the FHDPE film. The filmsthickness varied between 39 and 55 lm. Table 1shows the set conditions used for the film blowing,while Table 2 shows the nomenclature and descrip-tion of the samples developed in this study.
2.6. Films mechanical characterization
Tensile tests of the blown films were made in anInstron Tensile Testing Machine model 5569 atroom temperature, following ASTM-889, atmachine direction. The elastic modulus was deter-mined at 25 mm/min crosshead speed, while allother tensile characteristics were measured at500 mm/min. At least five measurements for eachsample were done.
2.7. Films permeability rates
The water vapor permeability rate (WPTR) wasmeasured following ASTM F1249-016 standard test
T1 (�C) (Temperature ofextruder screw zone 1)
190 190 190
T2 (�C) (Temperature ofextruder screw zone 2)
210 210 210
T3 (�C) (Temperature ofextruder screw zone 3)
209–210 208 208
T4 (�C) (Temperature ofextruder screw zone 4)
220 220 221
T5 (�C) (Temperature ofextruder screw zone 5)
220 220 220
T6 (�C) (Temperature ofextruder screw zone 6)
220 220 220
T7 (�C) (Temperature ofextruder die zone 1)
230 230 230
T8 (�C) (Temperature ofextruder die zone 2)
235 235 235
N1 (rpm) (Extruder screw velocity) 62 62 73N2 (m/min) (Nip rolls velocity) 2.1 2.1 2.1P1 (bar) (Die pressure) 379 362 379E1 (�C) (Bulk mass temperature) 210 208 209
MA

Table 2Nomenclature and description of the samples developed in thisstudy
Samples Composition Preparation
HDPE Pure high densitypolyethylene
–
PEMA HDPE grafted with 1% ofmaleic anhydride
–
MMT Montmorillonite claymodified with a quaternaryammoniumsalt (Cloisite 20A)
–
Matrix 1 Blends of HDPE andPEMA (85/15 wt.%)
Extruded with Profile 1
Matrix 2 Blends of HDPE andPEMA (85/15 wt.%)
Extruded with Profile 2
Master 1 Masterbatches of PEMAand MMT (75/25 wt.%)
Extruded with Profile 1
Master 2 Masterbatches of PEMAand MMT (75/25 wt. %)
Extruded with Profile 2
Nano 1 Nanocomposite ofHDPE, PEMA and MMT(80/15/5 wt.%)
Extruded with Profile 1
Nano 2 Nanocomposite ofHDPE, PEMA and MMT(80/15/5 wt.%)
Extruded with Profile 2
FHDPE Pure high densitypolyethylene
Blown film
FN1 Nano 2 Blown film processedat the same conditionsthan FHDPE
FN2 Nano 2 Blown film processedat a higher screwvelocity than the FN1
1350 C. Lotti et al. / European Polymer Journal 44 (2008) 1346–1357
MA
CR
OM
OL
EC
UL
AR
NA
NO
TE
CH
NO
LO
GY
on Permatran equipment, model W3/31 with infra-red sensor, from MOCON at 38 �C and relativehumidity of 90%. The oxygen permeability rate(OTR) was measured following ASTM D3985-06standard test using the coulometric method, inOxtran equipment, model ST, from MOCON, withpure oxygen, at 23 �C and pressure of 1 atm. Forthese tests the films thickness was measured with amicrometer of planar nib, model 732, from STAR-RETT, with resolution of 0.001 mm. Each test wasperformed on three samples.
2.8. Films surface characterization
To analyze the films roughness, their surface wasanalyzed by Atomic Force Microscopy (AFM),using a NanoScope IIIa equipment from VEECOInstruments, with head of 100 lm, in the contactmode. The mean surface roughness of the films Ra
was determined in a 50 lm � 50 lm area using thefollowing equation [9]:
Ra ¼1
LxLy
Z Lx
0
Z Ly
0
jf ðx; yÞdxdyj ð1Þ
where f(x,y) = surface relative to a center plane,which is a flat surface parallel to the mean plane(the volume enclosed by the image surface aboveand below the center plane are equal) and Lx,Ly = dimensions of the surface.
The standard deviation Rq of the measured Z
values within the given area is calculated by [9]
Rq ¼
ffiffiffiffiffiffiffiffiffiffiffiffiffiffiffiffiffiffiffiffiffiffiffiffiffiffiffiffiffiPðZi � ZaveÞ2
N
sð2Þ
where Zave = average of the Z values within the gi-ven area, Zi = current Z value and N = number ofpoints within the given area.
2.9. Films clay distribution
To analyze qualitatively the clay distribution, themapping of some of the clay chemical elements (Si,Al, Mg and Fe) was done using a scanning electronmicroscope Philips model XL30, equipped withenergy-dispersive X-ray spectroscopy (EDS), fromOxford Instruments, model 6650. It must be pointedout that the EDS mapping will not differentiatebetween clay aggregates, tactoids or lamellae, butit will map the clay distribution within the matrix.This is important to assure that after the film blow-ing, the clay is not accumulated in a preferentialregion.
3. Results and discussion
3.1. Pure polymers thermo-mechanical degradation
Fig. 3 shows the steady state shear viscosity gðc _Þat high shear rates of the pure polymers. It isobserved that even after three runs, the HDPE vis-cosity did not change; thus, it is expected that thispolymer will not suffer extensive thermo-mechanicaldegradation after continuous processing. On theother hand, the PEMA showed a slight increase inits shear viscosity after the second running. Thisincrease might be credited [10] to the formation ofa reversible physical network due to intermoleculardipole–dipole and/or hydrogen bonding interac-tions between the pendant maleic acid functionalgroups. The formation of the reversible networkcan be triggered by tension and/or temperature.

100 1000 1000010
100
1000
visc
osity
(P
a-s)
shear rate (s-1)
1st run2nd run3rd run
HDPE degradation
100 100010
100
1000
visc
osity
(P
a-s)
shear rate (s-1)
1st run2nd run 3rd run
PEMA degradationb
a
Fig. 3. Steady state shear viscosity of the pure polymers aftervarious runs in a capillary rheometer at T = 225 �C: (a) HDPEand (b) PEMA.
0 2 4 6 8 10 12
Inte
nsity
(a.
u.)
2θ (degree)
NANO1 NANO2
2.4
3.5 MMT
Fig. 4. WAXS diffraction patterns of the MMT (Closite 20A)and nanocomposites.
1E-3 0.01 0.1 1 10 100 1000 10000100
1000
10000
100000V
isco
sity
(P
a-s)
shear rate (s-1)
HDPEMATRIX1MATRIX2NANO1NANO2
high shear rates
low shear rates
slopeNano1, Nano2=-0.62
slope Matrix1,Matrix2=-0.38
0.01 0.1 1 10 100
1000
10000
100000
MATRIX1MATRIX2NANO1NANO2
G' (
Pa)
frequency (rad/s)
b
a
Fig. 5. (a) Steady state shear viscosity of the mixtures atT = 225 �C; (b) Storage modulus G0 of the mixtures.
C. Lotti et al. / European Polymer Journal 44 (2008) 1346–1357 1351
MA
CR
OM
OL
EC
UL
AR
NA
NO
TE
CH
NO
LO
GY
3.2. Characterization of the mixtures
3.2.1. Wide angle X-ray diffractionFig. 4 shows the diffraction pattern of the MMT
and the nanocomposites. The MMT displayed twomain peaks, at 3.5� and 7�, which corresponds tothe diffraction of its (001) planes and to a gallerydistance of 2.5 nm. It can be observed that in theNano 1 and Nano 2 samples, the MMT main peakat 3.5� dislocated to 2.4�, that is, both twin screwprofiles allowed the intercalation of the HDPE intothe MMT, increasing the clay gallery distance to3.7 nm.
3.2.2. Rheological characterization
The results of the steady state shear viscosity gðc _Þof the mixtures are shown in Fig. 5a. It is observed,at low shear rates, that none of the samples, includ-ing the HDPE, displayed a Newtonian plateau; at
the measured shear rates range, they behave asBingham fluids (with an apparent yield stress). ABingham fluid behavior is characteristic of highlyfilled polymers in which a percolated structure ora pseudo-solid behavior is observed. Also, highlylinear polymers with high molecular weights in

0 500 1000 1500 2000 2500 3000 3500 400020000
30000
40000
50000
60000
70000HDPEMATRIX1MATRIX2NANO1NANO2
Com
plex
vis
cosi
ty (
Pa-
s)
time (s)
Fig. 6. Complex viscosity g* as a function of time for themixtures at T = 225 �C and x = 1 rad/s.
1352 C. Lotti et al. / European Polymer Journal 44 (2008) 1346–1357
MA
CR
OM
OL
EC
UL
AR
NA
NO
TE
CH
NO
LO
GY
which the amount of entanglements is elevated, asthe HDPE used in this work, can behave as Bing-ham fluids at low shear rates, attaining the Newto-nian plateau at extremely low rates. Therefore, theslope of the gðc _Þ curve at low shear rates can bean indicative of clay dispersion/exfoliation [11,12].A purely viscous fluid has a Newtonian viscosity(the slope of the gðc _Þ curve will be zero, correspond-ing to 180�); a purely elastic solid has infinite viscos-ity (the slope tends to infinity, corresponding to90�). The closer the slope is to �1 (correspondingto 135�) the higher the apparent yield stress will beand more solid-like behavior the material will have.It can be observed that the slope increased from�0.38 (HDPE and blends) to �0.62 (nanocompos-ites). Thus, the nanocomposites had a higher yieldstress and were more solid-like than the HDPEand the blends due to the presence of the nanoclay.However, no difference in viscosity between theNano 1 and Nano 2 samples was observed; thus,from these results nothing can be inferred aboutthe effectiveness of the different screw profiles inthe clay dispersion.
At high shear rates all the mixtures were highlypseudoplastic, with a Power law index n = 0.42; allhad lower viscosity than the pure HDPE, that is,both the PEMA and the MMT plasticized theHDPE at high shear rates.
The dynamic rheological properties of the mix-tures can provide useful information for the filmsblowing process. Fig. 5b shows these propertiesfor the samples. It is observed at low frequenciesthat Nano 2 was the more elastic of the sampleswhile Matrix 2 was the least one; at high frequen-cies, Nano 1 was the more elastic of the samples,while Matrix 2 still was the least one. That is, theMMT increased the polymer matrix elasticity atall frequencies. This result is important for the filmblowing process, because it is known that the higherthe G0, the more stable the inflated bubble of theprocess will be [13,14]. Thus, it is expected that com-position Nano 2 will present the more stable bubbleduring blowing if the extrusion velocities are low,while Nano 1 will present the more stable bubbleif the extrusion velocities are high.
The slope of the G0 vs. x curves, at low frequen-cies, can also give an indication of the state of dis-persion (or miscibility) of the samples. For moltenhomopolymers, this slope is 2.0 (G0 � x2), whilefor solid homopolymers, this slope is 0 (G0 � x0)[15]. The curves of the Matrix 1 and Matrix 2 sam-ples have a slope of 0.70 (G0 � x0.70); therefore, this
behavior can be an indication of immiscibilitybetween HDPE and PEMA. On the other hand,the curves of the Nano 1 and Nano 2 samples havea slope of 0.58, which can be an indication of theformation of a disperse pseudo-solid structure.
Therefore, from the WAXS and the steady stateand dynamic rheological tests, it was concluded thatboth screw profiles produced similar clay intercala-tion and dispersion.
To test the time stability of both structures, thecomplex viscosity g* was measured as a function oftime, at x = 1 rad/s and at 225 �C. Fig. 6 shows thisparameter for the mixtures. The HDPE had almostno change in viscosity with time; both, Matrix 2and Nano 2 samples had a very small increase in theirviscosities with time (9% and 4% increase, respec-tively). However, Matrix 1 and Nano 1 sampleshad a high increase (30% and 85%, respectively) indi-cating that reactions or interactions were taken placeduring the rheological test. Therefore, the structuresformed with Profile 1 were highly instable; in the caseof Matrix 1, the screw profile probably allowed theformation of a reversible physical network withinthe PEMA [10], while Profile 2 disrupted the forma-tion of this physical network due to the presence ofthe turbine elements. In the case of Nano 1, the screwprofile did not allow that all the interactions andreactions between the clay, the PEMA and theHDPE would take place.
Thus, it was concluded that even if both screwprofiles produced the same clay intercalation leveland dispersion, the samples produced with Profile2 (Nano 2 samples) were more elastic (at low extru-sion rates) and had more time-stable structures; thusthis composition was chosen to produce the blownfilms.

C. Lotti et al. / European Polymer Journal 44 (2008) 1346–1357 1353
HN
OL
OG
Y
3.3. Film blowing and characterization
Two kind of blown films of the Nano 2 sample wereproduced, at the conditions described in Table 1. TheFN2 film was blown at a 17% higher flow rate.Because the freeze line height was the same for bothconditions, the elongation rate during blowing ofthe FN1 film was higher than of the FN2 [16,17].The clay intercalation was analyzed by WAXS, asshown in Fig. 7. It is observed that both films hadthe same MMT gallery distance than the nanocom-posite, showing that the film blowing process didnot increase this distance.
In order to analyze the stability of the nanocom-posites structure, measurements of the complex vis-cosity as a function of time of the blown films weremade. The results are shown in Fig. 8.
The FN1 film had no change in complex viscositywith time; however, its viscosity was lower than ofthe Nano 2 mixture, probably because of the higher
0 2 4 6 8 10 12
Inte
nsity
(a.
u.)
2θ (degree)
FN1FN2NANO2
2.4
2.4
4.3
MMT3.5
Fig. 7. WAXS diffraction patterns of the blown films.
0 1000 2000 3000 400015000
20000
25000
30000
35000
40000
Com
plex
vis
cosi
ty (
Pa-
s)
time (s)
NANO2 FN1 FN2
Fig. 8. Complex viscosity as a function of time of the blown filmsat T = 225 �C, x = 1 rad/s.
CR
OM
OL
EC
UL
AR
NA
NO
TE
C
orientation promoted by the higher elongation rate;on the other hand, the FN2 had a slightly higher vis-cosity than the Nano 2 mixture and an increase ofapproximately 24% in the complex viscosity withtime, showing that its structure was instable. Thatis, the FN2 extruder residence time was not enoughto disrupt the formation of the reversible physicalnetwork of the PEMA and consequently additionalinteractions between the clay, the PEMA and theHDPE took place during the rheological test.
In order to evaluate this time/temperature effecton the morphology of the FN2 films, samples werecollected at the end of the complex viscosity vs. timetest and were analyzed by WAXS. The results areshown in Fig. 9. It can be observed that after3600 s of rheological test, the clay’s diffraction peakof the FN2 sample disappeared, indicating the for-mation of an exfoliated morphology. That is, anadditional frequency (or shear rate) of 1 s�1 atT = 225 �C during 3600 s was necessary to obtainan exfoliated morphology. This behavior shows thatinstable morphologies were formed during the FN2extrusion; however, if the extruder residence timewere highly increased, even at low shear rates, thisformulation could exfoliate.
Fig. 10 shows the transient rheological propertiesof the blown films. The FN2 blown film displayed astress-overshoot, not shown by the FN1 or theFHDPE blown films. The emersion of a stress-over-shoot in a filled polymer can be interpreted as a con-sequence of higher polymer/filler interfacialinteractions or to stress accumulation. That is, theFN2 film had either stronger (or without defects)polymer/filler interactions or accumulated stressesdue to its unstable morphology.
0 2 4 6 8 10 12
FN1 FN2 FN2 after 3600s at rheometer
Inte
nsity
(a.
u.)
2θ (degree)
MMT3.5
2.4
Fig. 9. WAXS patterns before and after complex viscosity vs.time test of FN2 samples.
MA

0 200 400 600 800 10001
10
100
1000
She
ar te
nsio
n (P
a)
time (s)
FHDPE FN1 FN2
shear rate = 0.01s-1
Fig. 10. Stress-overshoot and relaxation after stop of shearing ofthe blown films at T = 225 �C, shear rate = 0.01 s�1.
Table 3Permeability rates and roughness of the blown films
Blownfilm
WPTR(g water/m2 day/lm)
OTR(mL/m2 day/lm)
Ra
(nm)Rq
(nm)
FHDPE 0.127 ± 0.018 67.25 ± 1.50 390.4 ±10.1FN1 0.053 ± 0.005 23.92 ± 2.63 270.8 ±7.5FN2 0.072 ± 0.005 23.54 ± 2.88 268.3 ±6.3
1354 C. Lotti et al. / European Polymer Journal 44 (2008) 1346–1357
MA
CR
OM
OL
EC
UL
AR
NA
NO
TE
CH
NO
LO
GY
3.4. Films mechanical properties
The elastic modulus of the HDPE blown film andthe nanocomposites films FN1 and FN2 and othertensile properties are shown in Fig. 11. There wasan increase of about 95% of the Young modulus
FHDPE FN1 FN2400
500
600
700
800
900
1000
1100
1200
1300
1400
1500
You
ng M
odul
us (
MP
a)
FHDPE FN1 FN20
10
20
30
40
50
0
100
200
300
400
500
600
700
800
yiel
d st
ress
, ulti
mat
e st
ress
(M
Pa)
yiel
d st
rain
(%
)
yield stress yield strain ultimate stress
ultimate strain (%
)
ultimate strain
a
b
Fig. 11. (a) Young modulus and (b) tensile properties of theblown films.
Fig. 12. Atomic force micrographs of the blown films surface: (a)FHDPE, (b) FN1 and (c) FN2.
C. Lotti et al. / European Polymer Journal 44 (2008) 1346–1357 1355
TE
CH
NO
LO
GY
of the nanocomposites films in comparison with thepure HDPE film. The ultimate strain and the yieldstress were also slightly higher in the nanocompos-ites films. On the other hand, the ultimate stresswas slightly lower in the nanocomposites films,and the yield strain decreased approximately 50%in comparison with the pure HDPE blown film.Comparing both nanocomposites films, it isobserved that the FN1 film had higher elastic mod-ulus, similar yield stress but lower yield strain, ulti-mate tensile stress and ultimate strain than the FN2film.
Jordan et al. in their excellent review about nano-composites [18] concluded that the elastic modulusin nanocomposites seems not to be dependent ofthe interactions between the filler and the polymer.However, the yield stress, yield strain, ultimatestress and ultimate strain have a different trend thanthe elastic modulus; the addition of nanoparticleswith poor interaction with the matrix causes theyield stress, the yield strain and the ultimate stressto decrease, compared to the neat matrix. That is,
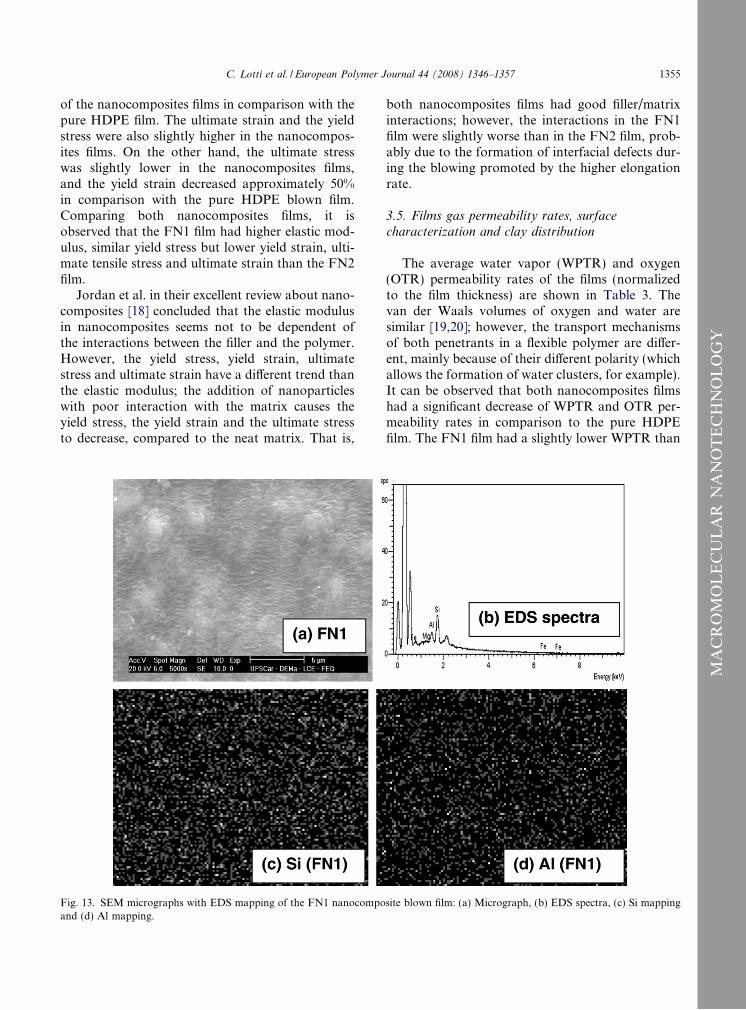
Fig. 13. SEM micrographs with EDS mapping of the FN1 nanocompoand (d) Al mapping.
both nanocomposites films had good filler/matrixinteractions; however, the interactions in the FN1film were slightly worse than in the FN2 film, prob-ably due to the formation of interfacial defects dur-ing the blowing promoted by the higher elongationrate.
3.5. Films gas permeability rates, surface
characterization and clay distribution
The average water vapor (WPTR) and oxygen(OTR) permeability rates of the films (normalizedto the film thickness) are shown in Table 3. Thevan der Waals volumes of oxygen and water aresimilar [19,20]; however, the transport mechanismsof both penetrants in a flexible polymer are differ-ent, mainly because of their different polarity (whichallows the formation of water clusters, for example).It can be observed that both nanocomposites filmshad a significant decrease of WPTR and OTR per-meability rates in comparison to the pure HDPEfilm. The FN1 film had a slightly lower WPTR than
site blown film: (a) Micrograph, (b) EDS spectra, (c) Si mapping
MA
CR
OM
OL
EC
UL
AR
NA
NO

1356 C. Lotti et al. / European Polymer Journal 44 (2008) 1346–1357
MA
CR
OM
OL
EC
UL
AR
NA
NO
TE
CH
NO
LO
GY
the FN2 film. This behavior can be attributed to ahigher orientation of the nanoclay’s tactoids in theFN1 film, which would form a more tortuous pathfor water diffusion than in the FN2 film. Due tothe formation of water clusters (which increase thepenetrant volume) the main transport controllingmechanism could be the diffusion thru the polymer.On the other hand, the FN1 and FN2 films had sim-ilar OTR. In this case, considering absence of oxy-gen clusters, the penetrant volume is smaller thanthe water clusters and the main transport control-ling mechanism could be thru the polymer/clayinterfaces; thus, the FN1 film had more defects inthe polymer/clay interfaces (weaker interface) thanthe FN2 film, confirming the stress overshootingand tensile properties tests.
The surface films texture and roughness of theblown films were also analyzed by AFM; Fig. 12shows AFM micrographs of the surface films whileTable 3 shows the roughness as calculated fromthe micrographs. The surface morphology of the
Fig. 14. SEM micrographs with EDS mapping of the FN2 nanocompoand (d) Al mapping.
FHDPE film was composed of larger structuresthan the surface of the nanocomposites films; how-ever, the roughness of the FHDPE is higher than ofthe nanocomposites films. The lower roughness ofthe nanocomposites will affect the surface opacityof the films, as verified in other works of our lab[14,21]; the higher the roughness is, the higher thesurface opacity is. Therefore it is expected that thenanocomposites films will be less opaque than thepure HDPE film.
Figs. 13 and 14 show SEM/EDS micrographs ofthe films surface, with the mapping of some of theclay elements. EDS mapping analysis was carriedout at the same magnification than the SEM images.From the elemental Si and Al mappings it can beobserved that the clay is well distributed withinthe HDPE matrix in both films. Elemental mappingreveals that the various elements are distributed fairevenly throughout the samples. Typical EDS spec-tra of MMT are shown in Figs. 13b and 14b. It mustbe pointed out that EDS results should be analyzed
site blown film: (a) Micrograph, (b) EDS spectra, (c) Si mapping
C. Lotti et al. / European Polymer Journal 44 (2008) 1346–1357 1357
MA
CR
OM
OL
EC
UL
AR
NA
NO
TE
CH
NO
LO
GY
carefully because errors can arise due to experimen-tal factors as poor detection ability for elementswith atomic percentages below five and anomaliesthat can originate from surface heterogeneity. Nev-ertheless, the mapping is a good indicative that theclay is well distributed thorough the polymermatrix.
4. Conclusions
Two nanocomposites were produced by varyingthe profile of a twin screw extruder: Nano 1 (less dis-persive profile) and Nano 2 (more dispersive profile).By WAXS measurements, both compositions showedthat intercalation of the HDPE into the clay occurred;however, by measuring the dynamic rheological prop-erties as a function of time it was observed that theNano 1 composition was not time-stable. It was alsofound that the Nano 1 composition was less elasticthan the Nano 2 composition at low frequencies.Thus, blown films of Nano 2 composition were pro-duced: FN1 and FN2. The FN1 film was blown at ahigher elongation rate than the FN2 film. It wasobserved that the FN2 blown film had also an instablemorphology and displayed a high stress overshooting.Both blown films, however, had an increase of 95% inthe Young modulus, and a decrease on water vaporand oxygen permeability rates of 45% and 60%,respectively, compared to the pure HDPE film. Bothfilms also had lower roughness than the pure HDPEfilm, which will influence their surface opacity.
Acknowledgements
The authors are grateful to CNPq, FAPESP andBraskem S.A., for the financial aid, to Prof. P.I.Paulin F for the AFM analysis, to Prof. A. RuvoloF for the transport phenomena discussions and to J.Gonc�alves and L.G. Brunetto for the screw profilesdrawings.
References
[1] Brosy AL, Marsh KS. Encyclopedia of packaging technol-ogy. NY: John Wiley and Sons; 1997.
[2] Alexandre M, Dubois P. Polymer-layered silicate nanocom-posites: preparation, properties and uses of a new class ofmaterials. Mater Sci Eng 2000;28:1–63.
[3] Shah RK, Krishnaswamy RK, Takahashi S, Paul DR.Blown films of nanocomposites prepared from low-densitypolyethylene and a sodium ionomer of poly (ethylene-co-methacrylic acid). Polymer 2006;47:6187–201.
[4] Ranadea A, Nayakb K, Fairbrotherc D, D’Souza NA.Maleated and non-maleated polyethylene–montmorillonitelayered silicate blown films: creep, dispersion and crystallin-ity. Polymer 2005;46:7323–33.
[5] Min KD, Kim MY, Choi K-Y, Lee JH, Lee S-G. Effect oflayered silicates on the crystallinity and mechanical proper-ties of HDPE/MMT nanocomposite blown films. PolymBull 2006;57:101–8.
[6] Isaac CS. Master Thesis. Universidade Federal de SaoCarlos; 2006.
[7] Manas I, Tadmor Z, editors. Mixing and compounding ofpolymers: theory and practice. NY: Hanser Publishers; 1994[chapter 3].
[8] Xie W, Gao Z, Pan W-P, Hunter D, Singh A, Vaia R.Thermal degradation chemistry of alky quaternary ammo-nium montmorillonite. Chem Mater 2001;13:2979–90.
[9] Command Reference Manual, Digital Instruments, Califor-nia; 1996.
[10] Lee JA, Kontopoulou M, Parent JS. Time and sheardependent rheology of maleated polyethylene and its nano-composites. Polymer 2004;45:6595–600.
[11] Favaro MM, Branciforti CB, Bretas RES. Processing andcharacterization of PBT/MMT and PTT/MMT nanocom-posites. In: Proceedings of the 9� congresso brasileiro depolımeros-CBPol, Campina Grande, Brazil; 2007.
[12] Wagener R, Reisinger TJG. A rheological method tocompare the degree of exfoliation of nanocomposites.Polymer 2003;44:7513–8.
[13] Fang Y, Carreau PJ, Lafleur PG. Rheological effects in filmblowing. In: Seventeenth annual meeting of the polymerprocessing society, CD-ROM, Montreal; 2001.
[14] Guerrini L, Paulin Filho PI, Bernardi A, Bretas RES.Polımeros: Ciencia e Tecnologia 2004;14(1):38–45.
[15] Aubry T, Razafinimaro T, Mederic EP. Rheological inves-tigation of the melt state elastic and yield properties of apolyamide-12 layered silicate nanocomposite. J Rheol2005;49(2):425–40.
[16] Branciforti MC, Pimentel R, Bernardi A, Bretas RES.Correlations between processing parameters, morphologyand properties of blown films of linear low-density polyeth-ylene/low-density polyethylene blends. I. Crystalline biaxialorientation by IR and mechanical properties. J Appl PolymSci 2006;101:3161–7.
[17] Branciforti MC, Guerrini L, Machado R, Bretas RES.Correlations between processing parameters, morphologyand properties of blown films of linear low-density polyeth-ylene/low-density polyethylene blends. II. Crystalline andamorphous biaxial orientation by WAXD pole figures. JAppl Polym Sci 2006;102:2760–7.
[18] Jordan J, Jacob KI, Tannenbaum R, Sharaf MA, Jasiuk I.Experimental trends in polymer nanocomposites – a review.Mater Sci Eng 2005;A393:1–11.
[19] Koros WJ, Hellums MW. Transport properties, encyclope-dia of polymer science and engineering, supplement vol-ume. NY: John Wiley and Sons; 1989.
[20] Osmar MA, Rupp JEP, Suter UW. Gas permeation prop-erties of polyethylene-layered silicate nanocomposites. JMater Chem 2005;15:1298–304.
[21] Marques Jr GB, Paulin Filho PI, Bernardi A, Bretas RES.Polımeros: Ciencia e Tecnologia 2006;16(2):149–58.