richard c. webster, jr. an exelon company - pennsylvania · richard c. webster, jr. vice president...
TRANSCRIPT

Richard C. Webster, Jr. Vice President
Regulatory Policy and Strategy
PECO
2301 Market Street, Sis Philadelphia, PA 19103
Telephone 215.841.4000 ext 5777 Fax 215.841.6208 www.peco.com [email protected]
An Exelon Company
January 15, 2013
Via Federal Express Rosemary Chiavetta, Secretary Pennsylvania Public Utility Commission Commonwealth Keystone Building 400 North Street Second Floor Harrisburg, Pennsylvania 17120
1 1 3
IAN 1 5 2013
PA PUBLIC UTILITY COMMISSION SECRETARY'S BUREAU
Re: PUC Docket NorlW=2O085266§88?~ Energy Efficiency and Conservation Program Quarterly Report for September 1, 2012 through November 30, 2012
Dear Secretary Chiavetta;
In accordance with the Commission's Secretarial Letter dated May 25, 2011, enclosed is PECO's Quarterly Energy Efficiency & Conservation Report for the period September 1, 2012 through November 30, 2012.
PECO is providing a copy of the report to the Act 129 Statewide Evaluator (GDS Associates, Inc.) and is also posting the report on the PECO website.
Please acknowledge receipt of the foregoing on the enclosed copy of this letter.
If you have any further questions regarding this matter, please call me at 215-841-5777.
cc: C. Walker-Davis, Director, Office of Special Assistants P. Diskin, Director, Bureau of Technical Utility Services M. C. Lesney, Director, Bureau of Audits J. E. Simms, Director, Bureau of Investigation & Enforcement Office of Consumer Advocate Office of Small Business Advocate McNees, Wallace & Nurick
enclosures

Quarterly Report to the
Pennsylvania Public Utility Commission
JAN 1 5 2013
PA PUBLIC UTILHY COMMISSION SECRETARY'S BUREAU
For the Period
September through November 2012
Program Year 4, Quarter 2
For Pennsylvania Act 129 of 2008
Energy Efficiency and Conservation Plan

Prepared by Navigant Consulting, Inc.
For
PECO Energy Company
January 15,2013

January 15, 2013 | Quarterly Report to the PA PUC - Program Year 4 Quarter 2
Table of Contents ACRONYMS II
1 OVERVIEW OF PORTFOLIO 4
1.1 SUMMAKY OI : ACHIEVEMENTS 4
1.2 PROGRAM UPDATES AND FINDINGS 7
1.3 EVALUATION UPDATES AND FINDINGS 9
2 SUMMARY OF ENERGY IMPACTS BY PROGRAM 13
3 SUMMARY OF DEMAND IMPACTS BY PROGRAM 18
4 SUMMARY OF FINANCES 23
4.1 PORTFOLIO-LEVEL EXPENDITURES 23
4.2 PROGRAM-LEVEL EXPENDITURES 24
PECO Energy Company I Page i

January 15, 2013 | Quarterly Report to the PA PUC - Program Year 4 Quarter 2
Acronyms
C&I Commercial and Industrial CATI Computer-Aided Telephone Interview CFL Compact Fluorescent Lamp CPITD Cumulative Program/Portfolio Inception to Date CPITD-Q Cumulative Program/Portfolio Inception through Current Quarter CVR Conservation Voltage Reduction CVRf Conservation Voltage Reduction factor DCU Digital Control Units DLC Direct Load Control DRA Demand Response Aggregator DRMS Demand Response Management System EDC Electric Distribution Company EE&C Energy Efficiency and Conservation EM&V Evaluation, Measurement, and Verification EISA Energy Independence and Security Act of 2007 GNI Government, Nonprofit, and Institutional HVAC Heating, Ventilating, and Air Conditioning IQ Incremental Quarter kW Kilowatt kWh Kilowatt-hour LED Light-Emitting Diode LEEP Low-Income Energy Efficiency Program LIURP Low-Income Usage Reduction Program M&V Measurement and Verification MW Megawatt MWh Megawatt-hour NTG Net-to-Gross PUC Public Utility Commission PY1 Program Year 2009 PY2 Program Year 2010 PY3 Program Year 2011 PY4 Program Year 2012 PY4TD Program/Portfolio Year Four to Date SCI Smart Construction Incentives SEER Seasonal Energy Efficiency Rating
SEI Smart Equipment Incentives
PECO Energy Company I Page ii

January 15, 2013 | Quarterly Report to the PA PUC - Program Year 4 Quarter 2
SLD Smart Lighting Discounts SSMVP Site-Specific Measurement and Verification Plan
SWE Statewide Evaluator TRC Total Resource Cost TRM Technical Reference Manual
PECO Energy Company I Page iii

January 15, 2013 | Quarterly Report to the PA PUC - Program Year 4 Quarter 2
1 Overview of Portfolio
Pennsylvania Act 129 of 2008, signed on October 15, 2008, mandated energy savings and demand reduction goals for the largest electric distribution companies (EDCs) in Pennsylvania. Each EDC submitted energy efficiency and conservation (EE&C) plans—which were approved by the Pennsylvania Public Utility Commission (PUC)—pursuant to these goals. This report documents the progress and effectiveness of the EE&C accomplishments for PECO in the second quarter (Q2) of Program Year Four (PY4), defined as September 1, 2012, through November 30, 2012, as well as the cumulative accomplishments of the programs since inception.
Navigant Consulting, Inc. (Navigant) is evaluating the programs, which includes measurement and verification (M&V) of the savings. The verified savings for PY4 will be reported in the annual report, to be filed November 15, 2013.
1.1 Summary of Achievements
PECO has achieved 100 percent of the energy savings compliance target for May 31, 2013, based on cumulative program inception to date (CPITD) reported gross energy savings,1 and 98 percent of the energy savings compliance target, based on CPITD-QZ, gross energy savings through PY4 Q2 as shown in Figure 1-1.
' CPITD Reported Cross Savings = CPITD Reported Cross Savings through PY3 + PYTD Reported Cross Savings. All savings reported as CPITD reported gross savings are computed this way. 2 CPITD-Q Cross Savings = CPITD Verified Cross Savings through PY3 + PYTD Reported Cross Savings. All savings reported as CPITD-Q gross savings are computed this way. CPITD-Q savings provide the best available estimate of savings achieved through the current quarter. CPITD Verified Gross Savings will be reported in the annual report.
PECO Energy Companyf Page 4

January 15, 2013 | Quarterly Report to the PA PUC - Program Year 4 Quarter 2
Figure 1-1. Cumulative Portfolio Inception to Date Energy Impacts
120% .100% 98%. .100%
0% -CPITD Reported
Gross CPITD-Q Gross May ".U. 2013
Compl iance Target
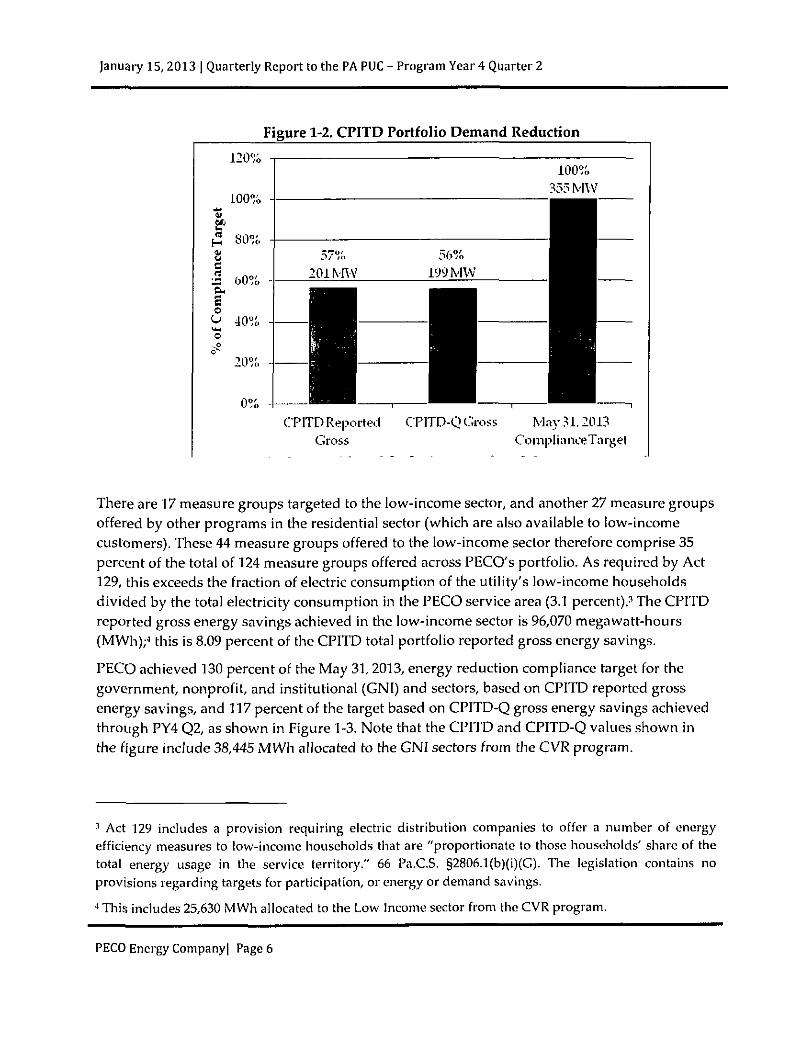
PECO has achieved 57 percent of the May 31, 2013, demand reduction compliance target, based on CPITD reported gross demand reduction and 56 percent of CPITD-Q of the demand reduction compliance target as shown in Figure 1-2. This reduction is a result of the demand impact from the energy efficiency and conservation voltage reduction (CVR) programs.
PECO has contracted for 170 megawatts (MW) of demand reduction through its Demand Response Aggregators program, an additional 16.5 MW through its Distributed Energy Resources program, and through its AC Savers program has installed load control switches on 92,530 residential and 3,949 commercial air conditioners. Although these resources represent well over half of the Act 129 demand reduction goal, PECO is not reporting any demand reduction from these resources in this report, because additional data collection and analysis remains before PECO can identify its top 100 load hours and the average demand reduction during these hours by participants in each demand reduction program. PECO does report demand reduction from its CVR program, as CVR demand savings are continuous across all hours.
PECO Energy Company! Page 5
January 15,2013 | Quarterly Report to the PA PUC - Program Year 4 Quarter 2
Figure 1-2. CPITD Portfolio Demand Reduction
120%
CPITD Reported CPITD-Q Cross May 31.2013 Gross Compliance Target
There are 17 measure groups targeted to the low-income sector, and another 27 measure groups offered by other programs in the residential sector (which are also available to low-income customers). These 44 measure groups offered to the low-income sector therefore comprise 35 percent of the total of 124 measure groups offered across PECO's portfolio. As required by Act 129, this exceeds the fraction of electric consumption of the utility's low-income households divided by the total electricity consumption in the PECO service area (3.1 percent).^ The CPITD reported gross energy savings achieved in the low-income sector is 96,070 megawatt-hours (MWh);4 this is 8.09 percent of the CPITD total portfolio reported gross energy savings.
PECO achieved 130 percent of the May 31, 2013, energy reduction compliance target for the government, nonprofit, and institutional (GNI) and sectors, based on CPITD reported gross energy savings, and 117 percent of the target based on CPITD-Q gross energy savings achieved through PY4 Q2, as shown in Figure 1-3. Note that the CPITD and CPITD-Q values shown in the figure include 38,445 MWh allocated to the GNI sectors from the CVR program.
3 Act 129 includes a provision requiring electric distribution companies to offer a number of energy efficiency measures to low-income households that are "proportionate to those households' share of the total energy usage in the service territory." 66 Pa.C.S. §2806.1 (b)(i)(C). The legislation contains no provisions regarding targets for participation, or energy or demand savings. 4 This includes 25,630 MWh allocated to the Low Income sector from the CVR program.
PECO Energy Company] Page 6

January 15, 2013 | Quarterly Report to the PA PUC - Program Year 4 Quarter 2
Figure 1-3. Government Nonprofit and Institutional Sectors
140% -T
120% -
.130% 154.119MWh
100% 118,155MWh
CPITD Reported CPITD-Q Gross May 31.2013 Gross ComplianceTarget
1.2 Program Updates and Findings
The following are updates and findings from each program:
• Low-Income Energy Efficiency Program: There were no significant changes to LEEP in PY4 Q2. Program participation remains steady and the majority of participants continue to receive basic measures and compact fluorescent lamp (CFL) light bulbs.
• Smart Lighting Discounts: While the program continues to reflect the large reduction in program size that took place during the end of PY2 and throughout PY3, the average monthly sales for the second quarter of PY4 were 23,000 bulbs, compared with 17,800 per month in PY4 Ql and an average of 13,100 per month across the last 9 months of PY3. As with PY3, the focus remains on specialty CFLs, with approximately 90 percent of PY4 Q2 bulbs being specialty CFLs.
• Smart Appliance Recycling Program: There were no significant changes made to the program in PY4 Q2. Participation remains low for PY4 Q2, a trend that started in PY3 Q3 following the significant reduction in the program incentive. There were approximately
PECO Energy Company) Page 7

January 15,2013 | Quarterly Report to the PA PUC - Program Year 4 Quarter 2
732 participants this quarter, which is somewhat lower than the previous two quarters (where participation averaged 900-1,100 new participants). Overall, participation levels since the incentive was reduced are approximately one-third of the level seen prior to this. This is a strong indication of just how sensitive customers in this market are to the program incentive level.
Smart Home Rebates: PECO made no significant programmatic changes in the first half of PY4. This program continues to offer ENERGY STAR® Most Efficient, models with the greatest efficiency within each product category. The program also continues to focus on heating, ventilating, and air conditioning (HVAC) equipment. The preponderance of (non-lighting) installed measures was air source heat pumps and central air conditioning units. Air source heat pumps constituted 24 percent of overall participation, 41 percent of energy savings, and 28 percent of demand savings. Central air conditioning accounted for 47 percent of participation, 21 percent of energy savings, and 59 percent of demand savings.
Smart Equipment Incentives Commercial and Industrial Program: A total of 49 projects received rebates from the SEI C&I program in PY4 Q2. This value is lower than previous quarters due to the fact that the program has been placing all new applications on a wait list since October 1, 2011. Therefore, the applications that are completing in this quarter were accepted prior to October I , 2011, and the total pool of projects is reducing over time as projects complete.
Smart Equipment Incentives Government, Nonprofit, and Institutional Program: A total of 45 projects received rebates from the SEI GNI program in PY4 Q2. This value is lower than previous quarters due to the fact that the program has been placing all new applications on a wait list since October 1, 2011. The applications that are being completed in this quarter were accepted prior to the inception of the waitlist, and that total pool of projects is reducing over time as projects are completed.
Smart Construction Incentives Program: The SCI program paid a total of 14 projects in PY4 Q2. Of thesel4, four projects were in the C&I sector and ten were in the GNI sector. One of the C&I projects used the whole building track, and design incentives were tracked correctly. To date, the program has claimed a larger number of projects (16), kilowatt-hours (kWh) and kilowatts (kW) in the GNI sector than in the C&I sector. Participation to date is lower than in PY3, when the program reported a total of 39 projects by the end of Q2. The program has claimed a total of five whole building projects so far. In PY3, the program paid on a total of ten whole building projects over the course of the year.
PECO Energy Companyl Page 8
January 15, 2013 | Quarterly Report to the PA PUC - Program Year 4 Quarter 2
• Residential Smart AC Saver Program: PECO has completed the installation of digital control units (DCUs) and had 78,975 active participants representing 91,644 active devices at the end of PY4 Q2. PY4 will be the first year PECO will claim savings for the program. PECO called curtailment events totaling 51.5 hours during PY4 Ql but did not call any events in the final month of the program in PY4 Q2.
• Commercial Smart AC Saver Program: PECO has completed installing the new programmable thermostats, which now total 2,247 active participants representing 3,924 active devices at the end of PY4 Q2. PECO called curtailment events totaling 51.5 hours during the PY4 Ql but did not call any events in the final month of the program in PY4 Q2.
• Permanent Load Reduction: There was a single PLR project recorded in the tracking system in PY4 Q2. Although the project was not recorded as complete until after the close of the first quarter, the commercial date of operation for this absorption chiller project is June 1, 2012. As such, this project did contribute demand reduction during Ql and PECO's top 100 hours.
• Demand Response Aggregator: The Demand Response Aggregator program was dispatched only in PY4 Ql to assist in PECO's achievement of its PY4 demand reduction compliance target. The program was discontinued at the end of PY4 Ql .
• Distributed Energy Resources: Similar to the Demand Response Aggregator program, the Demand Energy Response program was dispatched only in PY4 Ql to assist in PECO's achievement of its PY4 demand reduction compliance target. The program was discontinued at the end of PY4 Ql .
1.3 Evaluation Updates and Findings
Each program's evaluation updates and findings are as follows:
• Low-Income Energy Efficiency Program: PY4 savings for Component 1 of LEEP will be determined using a four-year average of billing analysis results from the 2008-2009 Low-Income Usage Reduction Program (LIURP) and PY1 and PY2 LEEP data. Impacts for Components 2 through 5 will be verified via a review of the tracking system database. Process evaluation activities will include in-depth interviews with utility and implementation contractor staff and telephone surveys of participants. These activities will commence in PY4 Q3.
PECO Energy Companyl Page 9
January 15, 2013 | Quarterly Report to the PA PUC - Program Year 4 Quarter 2
Smart Lighting Discounts: The M&V completed for PYQ2 report consisted of reviewing the tracking data provided to the evaluation team by PECO program staff, as well as reviewing all of the manufacturer invoices received and approved by PECO and Ecova through the end of November 2012. The data used to estimate the PY4 PYTD savings for this report was based upon the manufacturer invoices.
Smart Appliance Recycling: The M&V completed for this quarterly report consisted of reviewing the PY4 Q2 tracking data provided to the evaluation team by PECO program staff. The PY4 PYTD savings in this report were estimated by applying the technical reference manual (TRM) specified savings algorithm to this quarterly and program year-to-date tracking data provided by PECO, and verified by the evaluation team.
Smart Home Rebates: In PY4 Q3, the evaluation team will conduct staff, contractor, and trade ally interviews. Data collection from participants and trade allies will begin in PY4 Q4.
Smart Equipment Incentives Commercial and Industrial Program: The evaluation of the SEI C&I program will align closely with the PY3 evaluation in terms of approaches and tasks. In PY4, the team will complete an initial sample design based on Ql and Q2 completed project files as well as any available pipeline project information. The team plans to re-visit the sample design and strata based on the findings from PY3. The sample will be designed to achieve an 85/15 or better level of confidence and relative precision at the program level. Based on the initial sample design, the team will choose projects to sample from the project population and request project files from PECO/KEMA.
Smart Equipment Incentives Government, Nonprofit, and Institutional Program: Consistent with the evaluation of the SEI C&I program, the PY4 evaluation of the SEI GNI Program will align closely with the PY3 evaluation in terms of approaches and tasks. In PY4, the evaluation team will complete an initial sample design based on Ql and Q2 completed project files as well as any available pipeline project information. The sample will be designed to achieve an 85/15 or better level of confidence and relative precision at the program level. The team plans to re-visit the sample design and strata based on the findings from PY3, particularly the wide range of gross realization rates and the precision achieved with the PY3 sample. The sample will be designed to achieve an 85/15 or better level of confidence and relative precision at the program level. Based on the initial sample design, the team will choose projects to sample from the project population and request project files from PECO/KEMA.
PECO Energy Companyl Page 10

January 15, 2013 | Quarterly Report to the PA PUC - Program Year 4 Quarter 2
Smart Construction Incentives: Navigant is preparing to launch the PY4 program evaluation in the upcoming weeks. As in PY3, Navigant will conduct in-depth interviews with staff members at the beginning of the evaluation. The process evaluation will also include participant surveys and trade ally interviews. The impact evaluation will include file reviews and on-site verification of a sample of projects. Navigant may use billing data to calibrate modeled savings from whole building projects in the sample. Navigant will draw an initial sample after PY4 Q3 and draw additional projects as needed from Q4. The sample size and design will be based on the number and types of completed projects at the end of Q3 and the remaining pipeline projects for Q4.
Residential Smart AC Saver Program: Navigant utilized the "Deemed Savings Estimates for Legacy Air Conditioning and Water Heating Direct Load Control Programs in PJM Region" report in conjunction with the PECO tracking database of residential customers to predict reduction by connected air conditioning load. PECO is in the process of additional data collection and analysis to identify its top 100 load hours. The average demand reduction during these hours by participants in the AC Saver Program and the predicted savings values will be utilized to calculate residential load reductions for PY4.
A final survey of participants will be conducted to understand customer demographics, how customers learned of the program, satisfaction with the program, how the customers handled their AC on a typical summer day and during heat waves, if they noticed load control events, and how they and their homes responded to these events.
Commercial Smart AC Saver Program: Navigant has utilized the data from the M&V group (a sample of participants that had additional metering equipment installed on their air conditioners) to calculate load reduction for the commercial direct load control population.
PECO is in the process of additional data collection and analysis to identify its top 100 load hours. The average demand reduction during these hours.by participants in the AC Saver Program and the calculated savings values will be utilized to determine commercial load reductions for PY4.
A final survey of participants will be conducted to understand customer demographics, how customers learned of the program, satisfaction with the program, how the customers handled their AC on a typical summer day and during heat waves, if they noticed load control events, and how they and their businesses responded to these events.
PECO Energy Companyl Page 11
January 15, 2013 | Quarterly Report to the PA PUC - Program Year 4 Quarter 2
Permanent Load Reduction: Only one project has been completed in the PLR program. Given this very low participation, the project will be evaluated in conjunction with the Smart Equipment Incentives program.
Demand Response Aggregator: Navigant is currently analyzing the data from participants in the Demand Response Aggregator program to determine customer baselines and demand impacts during hours of dispatch. Once this effort is complete, Navigant will work with PECO to reconstruct the load curve, identify the top 100 hours, and calculate the average demand reduction over the top 100 hours. This information will be provided to the PUC and the statewide evaluator (SWE) in the Preliminary Demand Reduction Compliance report, due in March 2013.
Distributed Energy Resources: Similar to the Demand Response Aggregator program, Navigant is currently analyzing the data from participants in the Demand Energy Resources program to determine customer baselines and demand impacts during hours of dispatch. Once this effort is complete, Navigant will work with PECO to reconstruct the load curve, identify the top 100 hours, and calculate the average demand reduction over the top 100 hours. This information will be provided to the PUC and the SWE in the Preliminary Demand Reduction Compliance report, due in March 2013.
PECO Energy Companyl Page 12
January 15, 2013 | Quarterly Report to the PA PUC - Program Year 4 Quarter 2
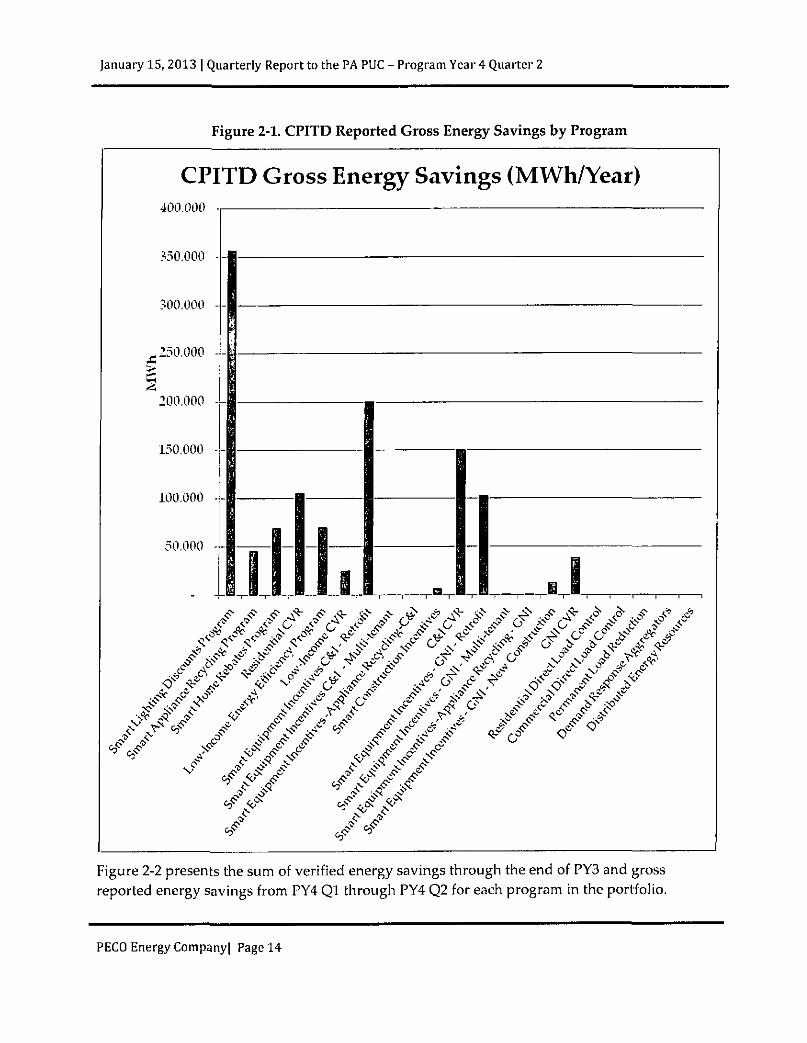
2 Summary of Energy Impacts by Program A summary of the reported energy savings by program is presented in Figure 2-1.
PECO Energy Companyl Page 13
January 15, 2013 | Quarterly Report to the PA PUC - Program Year 4 Quarter 2
Figure 2-1. CPITD Reported Gross Energy Savings by Program
CPITD Gross Energy Savings (MWh/Year) 400.000
350.000
300.000
250.000
200,000
150,000
100,000
50,000
| _Q
O*- vN O*-
^ 0 .0.° <fr c * ^ : ^ ^ i f ^
^ ^ ^
s-' ^ y-
S & & ^ 0 °
5 ^
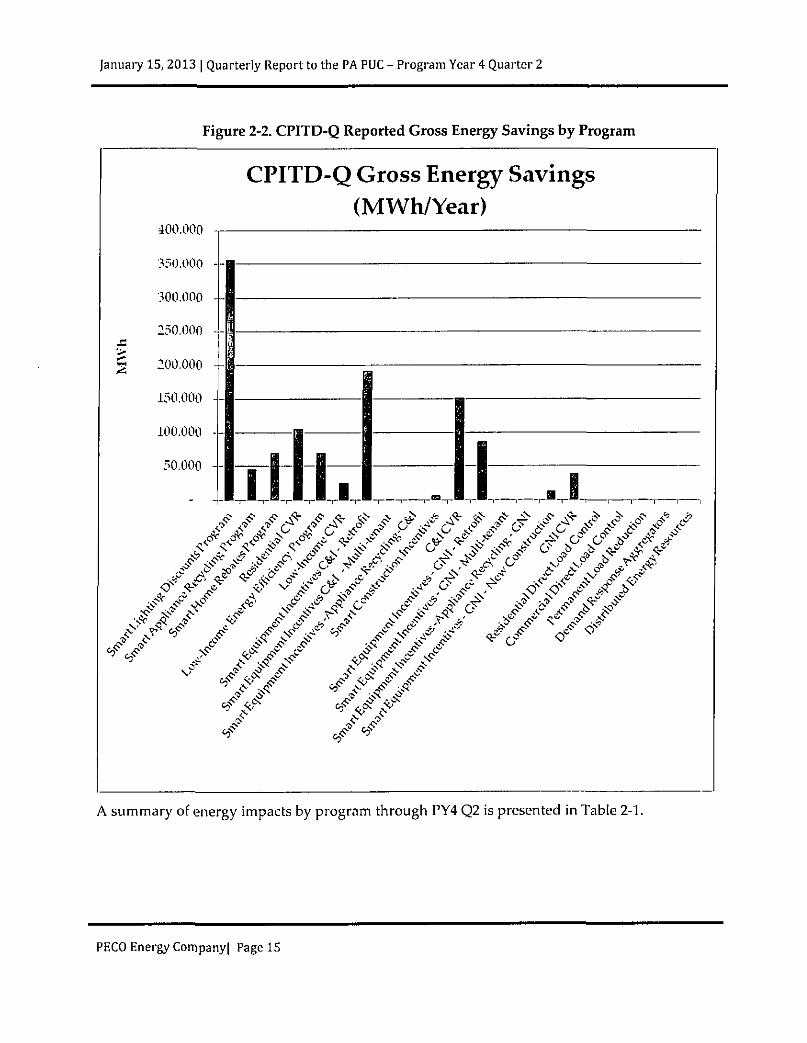
Figure 2-2 presents the sum of verified energy savings through the end of PY3 and gross reported energy savings from PY4 Ql through PY4 Q2 for each program in the portfolio.
PECO Energy Companyl Page 14
January 15, 2013 | Quarterly Report to the PA PUC - Program Year 4 Quarter 2
Figure 2-2. CPITD-Q Reported Gross Energy Savings by Program
CPITD-Q Gross Energy Savings (MWh/Year)
f ^ ^ Kit ^ ^ ^ x& r ^ ^
^ # A C
v 3
^ ^ ^
A summary of energy impacts by program through PY4 Q2 is presented in Table 2-1.
PECO Energy Companyl Page 15

January 15, 2013 | Quarterly Report to the PA PUC - Program Year 4 Quarter 2
Table 2-1. EDC Reported Participation and Gross Energy Savings by Program
Program
Participants Reported Gross Impact (MWh/Year)
Preliminary Realization
Rate1
Program IQ PYTU CPUD IQ PYTU CPITD CPITD-
Q PYTU Residential 2,690 7,233 317,390 6,967 13,579 578,262 578,133 N/A
Smart Lighting Discounts Program2 69,274 122,598 7,539,137 3,305 5,822 356,862 356,861 1
Smart Appliance Recycling Program 732 1,802 29,545 1,051 2,601 45,895 45,894 1
Smart Home Rebates Program3 1,958 5,431 287,845 2,611 5,155 69,783 69,654 N/A
Residential Conservation Voltage Reduction N/A N/A N/A - - 105,723 105,723 1
Low-Income Energy Efficiency Program Total4 2,390 4,784 26,918 7,532 16,703 96,070 94,866 N/A
Low-Income Energy Efficiency Program 2,390 4,784 26,918 7,532 16,703 70,440 69,236 N/A
Low-Income Conservation Voltage Reduction N/A N/A N/A - - 25,630 25,630 1
Non-Residential 117 308 4,402 39,162 59,794 512,677 488,818 N/A
Commercial and Industrial Total 60 170 3,460 25,588 36,805 358,558 350,064 N/A
Smart Equipment Incentives - Retrofit 49 135 3,009 24,507 34,929 200,722 192,611 N/A
Smart Equipment Incentives - Multi-tenant5 7 28 389 262 287 426 426 N/A
Smart Equipment Incentives -Appliance Recycling - 1 10 - 2 18 17 N/A
Smart Construction Incentives 4 6 52 818 1,587 6,818 6,435 N/A
C&I Conservation Voltage Reduction N/A N/A N/A - - 150,575 150,575 1
Government, Nonprofit Institutional Total 57 138 942 13,574 22,989 154,119 138,754 N/A
Smart Equipment Incentives - Retrofit 45 115 817 10,632 19,363 102,904 86,782 N/A
Smart Equipment Incentives - Multi-tenant5 2 7 81 0 1 145 145 N/A
Smart Equipment Incentives -Appliance Recycling - - 5 - - 33 32 N/A
Smart Equipment Incentives - New Construction 10 16 39 2,942 3,625 12,592 13,351 N/A
GNI Conservation Voltage Reduction N/A N/A N/A - - 38,445 38,445 1
PECO Energy Companyl Page 16

January 15, 2013 | Quarterly Report to the PA PUC - Program Year 4 Quarter 2
Participant s Reported Gross Impact
(MWh/Year)
Preliminary Realization
Rate1
Program IQ PYTD CPITD
IQ PYTD CPITD CPITD-
Q PYTD
Demand Reduction (820) 126 81,418 201 201 201 201 N/A
Residenrial Smart AC Saver (802) 324 78,975 - - - 0 N/A
Commercial Smart AC Saver (19) (199) 2,247 - - - 0 N/A
Permanent Load Reduction 1 1 1 201 201 201 201 N/A
Demand Response Aggregators - - 193 - - - 0 N/A
Distributed Energy Resources - - 2 - - - 0 N/A
Total Portfolio 4,377 12,451 430,128 53,862 90,277 1,187,210 1,162,018 N/A NOTES: 1 Preliminary Realization Rates are based on evaluation activities and findings conducted on a partial sample set. These realization rates are not based on a statistically significant sample and are subject to change until the full evaluation is complete at the end of the program year Participation numbers shown are the numbers of discounted lamps sold. These are excluded from total portfolio participation numbers. The CPI 1D participant value reported here includes 17,856 lamps that were inadvertently removed from PY2 cumulative participation values, although their costs and savings were reported correctly in all previous reports.
Participant values exclude sales of Energy Star lighting fixtures and LED lamps, for which upstream rebates are provided. 4Act 129 includes a provision requiring electric distribution companies to offer a number of energy efficiency measures to low-income households that are "proportionate to those households' share of the total energy usage in the service territory." 66 Pa.CS. §2806.1(b)(i)(G). The legislation contains no provisions regarding targets for participation, or energy or demand savings. Participation includes only those receiving the Weatherization Audit. 5The participation values shown here reflect the number of project IDs reported in the tracking data, rather than the number of billing account IDs. The values reported here better reflect the number of participatihg households, rather than the number of multi-family buildings in which the participants live.
PECO Energy Company] Page 17

January 15, 2013 | Quarterly Report to the PA PUC - Program Year 4 Quarter 2
3 Summary of Demand Impacts by Program
A summary of the reported demand reduction by program is presented in Figure 3-1.
Figure 3-1. Reported Demand Reduction by Program
CPITD Gross Demand Savings (MW)
^ <
Figure 3-2 presents the sum of verified demand savings through the end of PY3 and gross reported demand savings from PY4 Ql through PY4 Q2 for each program in the portfolio.
PECO Energy Companyl Page 18

January 15, 2013 | Quarterly Report to the PA PUC - Program Year 4 Quarter 2
Figure 3-2. CPITD-Q Reported Demand Reduction by Program
CPITD-Q Gross Demand Savings (MW) 100.0
^ ^ ^ «r # >x ̂ ,^ ^ ^ ^ ^
A .c f* \.'
PECO Energy Companyl Page 19

January 15, 2013 | Quarterly Report to the PA PUC - Program Year 4 Quarter 2
A summary of demand reduction impacts5 by program through PY4 Q2 is presented in
Table 3-1
5 In previous quarterly reports, demand savings impact calculations included an average line-loss factor. Starting with the PY3 Annual Report, the demand savings impact calculations included a peak line-loss factor. The average line-loss factor used in previous reports was 1.076. Peak line-loss factors used in this report vary by sector: 1.1916 for Residential programs; 1.111 for Commercial and Industrial programs; 1.117 for Government, Non-Profit and Institutional; and 1.113 for new construction. All quarterly and cumulative MW values presented in this report have been calculated by applying peak line-loss factors for all program activity since program inception.
PECO Energy Companyl Page 20

January 15, 2013 | Quarterly Report to the PA PUC - Program Year 4 Quarter 2
Table 3-1. Participation and Reported Gross Demand Reduction by Program
Program Participants
Reported Gross Impact (MW)
Preliminary Realization
Rate1 Program
IQ PYTD CPITD IQ PYTU CPITD CPITD-Q PYTD
Residential 2,690 7,233 317,390 1.2 2.6 52.7 523 N/A
Smart Lighting Discounts Program2 69,274 122,598 7,539,137 0.2 0.3 23.1 23.1 1
Smart Appliance Recycling Program 732 1,802 29,545 0.2 0.4 9.4 9.3 1
Smart Home Rebates Program3 1,958 5,431 287,845 0.8 1.9 20.1 20.1 N/A
Low-Income Energy Efficiency Program Total4 2,390 4,784 26,918 0.4 1.0 6.0 5.1 N/A
Low-Income Energy Efficiency Program 2,390 4,784 26,918 0.4 1.0 6.0 5.1 N/A
Non-Residential 117 308 4,402 6.4 9.8 53.3 525 N/A
Commercial and Industrial Total 60 170 3,460 4.6 6.7 36.0 38.1 N/A
Smart Equipment Incentives - Retrofit 49 135 3,009 4.5 6.3 34.6 35.7 N/A
Smart Equipment Incentives - Multi-tenant5 7 28 389 0.0 0.0 0.2 0.2 N/A
Smart Equipment Incentives -Appliance Recycling - 1 10 0.0 0.0 0.0 0.0 N/A
Smart Construction Incentives 4 6 52 0.1 0.3 1.2 2.3 N/A
Government, Nonprofit, and Institutional Total 57 138 942 1.7 3.1 17.3 14.4 N/A
Smart Equipment Incentives - Retrofit 45 115 817 1.3 2.6 15.5 11.7 N/A
Smart Equipment Incentives - Multi-tenant5 2 7 81 0.0 0.0 0.0 0.0 N/A
Smart Equipment Incentives -Appliance Recycling - - 5 0.0 0.0 0.0 0.0 N/A
Smart Equipment Incentives - New Construction 10 16 39 0.4 0.6 1.8 2.6 N/A
PECO Energy Company] Page 21

January 15, 2013 | Quarterly Report to the PA PUC - Program Year 4 Quarter 2
Program Participants
Reported Gross Impact (MW)
Preliminary Realization
Rate1 Program
CFYTO CPYTD cpni>-Q FY I D
Demand Reduction (820) 126 81,418 0 0 89.4 89.4 N/A
Conservation Voltage Reduction - - N/A 0.0 0.0 89.3 89.3 N/A
Residential Smart AC Saver (802) 324 78,975 0.0 0.0 0.0 0.0 N/A
Commercial Smart AC Saver (19) (199) 2,247 0.0 0.0 0.0 0.0 N/A
Permanent Load Reduction 1 1 1 0.1 0.1 0.1 0.1 N/A
Demand Response Aggregators - - 193 0.0 0.0 0.0 0.0 N/A
Distributed Energy Resources - - 2 0.0 0.0 0.0 0.0 N/A
Total Portfolio 4,377 12,451 430,128 8.1 13.4 201.4 199.4 N/A NOTES:
'Preliminary realization rates are based on evaluation activities and findings conducted on a partial sample set. These realization rates are not
based on a statistically significant sample and are subject to change until the full evaluation is complete following the end of the program year.
Participation numbers shown are the numbers of discounted lamps sold. These are excluded from total portfolio participation numbers. The
CPI 1D participant value reported here includes 17,856 lamps that were inadvertently removed from PY2 cumulative participation values, although
their costs and savings were reported correctly in all previous reports.
Participant values exclude sales of ENERGY STAR lighting fixtures and LED lamps, for which upstream rebates are provided. 4 Act 129 includes a provision requiring electric distribution companies to offer a number of energy efficiency measures to low-income households
that are "proportionate to those households' share of the total energy usage in the service territory." 66 Pa.C.S. §2806.1(b)(i)(G). The legislation
contains no provisions regarding targets for participation, or energy or demand savings. Participation includes only those receiving the
Weatherization Audit. 5The participation values shown here reflect the number of project IDs reported in the tracking data, rather than the number of billing account IDs. The values reported here better reflect the number of participating households, rather than the number of multi-faihily buildings in which the participants live.
PECO Energy Companyl Page 22

January 15, 2013 | Quarterly Report to the PA PUC - Program Year 4 Quarter 2
4 Summary of Finances
4.1 Portfolio-Level Expenditures
A breakdown of the portfolio finances is presented in Table 4-1.
Table 4-1. Summary of Portfolio Finances
Quarter 2 ($000)
PYTD ($000)
CPITD ($000)
EDC Incentives to Participants $9,904 $18,137 $69,863
EDC Incentives to Trade Allies $122 $221 $8,541
Subtotal EDC Incentive Costs $10,027 $18,359 $78,405
Design & Development $0 $0 $0
Administration"1 $6,105 $13,724 $59,461
Management121 $899 $2,423 $25,530
Marketing $687 $1,401 $9,912
Technical Assistance $914 $1,909 $11,836
Subtotal EDC Implementation Costs $8,605 $19,457 $106,739
EDC Evaluation Costs $588 $'1/114 $6,451
SWE Audit Costs N/A N/A N/A
Total EDC Costs'3' N/A N/A N/A
Participant Costs'4! N/A N/A N/A
Total TRC Costs N/A N/A N/A
NOTES Per PUC dircclion, TRC inputs and calculations are mjuimi in the Annual Report only and should comply with the 2011 Total Resource Cost Test Order appmvd July 28, 2011.
1 Irnplomuntation contractor costs. 1 EDC costs olhor than those identified explicitly. M'tr the 2011 Total Resource Cost Test Order-Total EDC Costs refer lo EDC incurred expenses only. 1 Per the 2011 Total Resource Cost Test Order-Net participant costs refer to the costs of the end-use customer.
PECO Energy Companyl Page 23

January 15, 2013 | Quarterly Report to the PA PUC - Program Year 4 Quarter 2
4.2 Program-Level Expenditures
Program-specific finances are shown in the following tables.
Table 2-2. Low-Income Energy Efficiency Program
Quarter 2 ($000)
PYTD ($000)
CPITD ($000)
EDC Incentives to Participants $0 $0 $0
EDC Incentives to Trade Allies $0 $0 $0
Subtotal EDC Incentive Costs $0 $0 $0
Design & Development $0 $0 $0
Administration111 $208 $471 $2,452
Management121 $66 $133 $1,124
Marketing $172 $337 $709
Technical Assistance $914 $1,909 $11,836
Subtotal EDC Implementation Costs $1,360 $2,850 $16,121
EDC Evaluation Costs $37 $70 $425
SWE Audit Costs N/A N/A N/A
Total EDC CostsPi N/A N/A N/A
Participant CostsW N/A N/A N/A
Total TRC Costs N/A N/A N/A
NOTES Per PUC dirt'ctitm, TRC inputs and calrutationa are required in the Annual Rejwrt only and should comply with the 20/7 Total Resource Cost Test Order appntoed }uly 28, 2(111.
1 Implementation contractor costs. 1 EDC costs other than those identified explicitly. 1 Per the 2011 Total Resource Cost Test Order - Totnl EDC Cost refer to EDC incurred expenses only. 1 Per the 2011 Total Resource Cost Test Order-Net participant costs refer to the costs of the end-use customer.
PECO Energy Company) Page 24

January 15,2013 | Quarterly Report to the PA PUC - Program Year 4 Quarter 2
Table 4-3. Smart Lighting Discounts Program
Quarter 2 ($000)
PYTD ($000)
CPITD ($000)
EDC Incentives to Participants $0 $0 $0
EDC Incentives to Trade Allies $97 $177 $8,283
Subtotal EDC Incentive Costs $97 $177 $8,283
Design & Development $0 $0 $0
Administration!1' $108 $227 $2,341
Management121 $70 $143 $925
Marketing $173 $327 $3,561
Technical Assistance $0 $0 $0
Subtotal EDC Implementation Costs $351 $698 $6,828
EDC Evaluation Costs $69 $131 $825
SWE Audit Costs N/A N/A N/A
Total EDC Costs'3' N/A N/A N/A
Participant Costsi1'' N/A N/A N/A
Total TRC Costs N/A N/A N/A
NOTES Per PUC directum, TRC inputs and calculations are required hi the Annual Report only and should comply with the 2011 Total Resource Cost Test Order approved }uly 28, 2011.
1 Irnplomuntation contractor costs. 1 EDC costs other than those identified explicitly. 1 Per the 2011 Total Resource Cost Test Order - Total EDC Costs refer to EDC incurred expenses only. 1 Per the 2011 Total Resource Cost Test Order-Net participant costs refer to, the costs of the end-use customer.
PECO Energy Company) Page 25

January 15, 2013 | Quarterly Report to the PA PUC - Program Year 4 Quarter 2
Table 4-4. Smart Appliance Recycling Program
Quarter 2 ($000)
PYTD ($000)
CPITD ($000)
EDC Incentives to Participants $12 $28 $1,060
EDC Incentives to Trade Allies $0 $0 $0
Subtotal EDC Incentive Costs $12 $28 $1,060
Design & Development $0 $0 $0
Administration111 $66 $160 $2,695
Management121 $60 $112 $858
Marketing $40 $76 $635
Technical Assistance $0 $0 $0
Subtotal EDC Implementation Costs $166 $348 $4,188
EDC Evaluation Costs $21 $39 $217
SWE Audit Costs N/A N/A N/A
Total EDC Costsi1' N/A N/A N/A
Participant Costs'4' N/A N/A N/A
Total TRC Costs N/A N/A N/A
NOTES Per PUC direction, TRC inputs and calculations are required in the Annual Report only and should comply with the 2011 Total Resource Cost Test Order appnmed July 28, 2011.
1 [mplomcnUition contractor costs. 1 EDC costs other than those identified explicitly. 1 Per the 2011 Total Resource Cost Test Order - Total EDC Costs refer to EDC incurred expenses only. 1 Per the 2011 Total Resource Cost Test Order-Net participant costs refer to the costs of the end-use customer.
PECO Energy Companyl Page 26

January 15,2013 | Quarterly Report to the PA PUC - Program Year 4 Quarter 2
Table 4-5. Smart Home Rebates Program
Quarter 1 ($000)
PYTD ($000)
CPITD ($000)
EDC Incentives to Participants $557 $1,195 $21,605
EDC Incentives to Trade Allies $0 $0 $0
Subtotal EDC Incentive Costs $557 $1,195 $21,605
Design & Development $0 $0 $0
Administration!'! $315 $613 $7,394
Management'21 $153 $300 $2,376
Marketing $153 $299 $2,716
Technical Assistance $0 $0 $0
Subtotal EDC Implementation Costs $620 $1,212 $12,486
EDC Evaluation Costs $77 $147 $825
SWE Audit Costs N/A N/A N/A
Total EDC Costs'1' N/A N/A N/A
Participant Costs'1' N/A N/A N/A
Total TRC Costs N/A N/A N/A
NOTES Per PUC directum, TRC inputs and calculations are required in the Annual Report only and should comply with the 2011 Total Resource Cost Test Order approved July 28, 2011.
1 Implumcntatinn contractor costs. ! EDC costs other than those identified explicitly. J Per the 2011 Total Resource Cost Test Order - Total EDC Costs refer to EDC incurred expenses only. 4 Per tho 2011 Total Resource Cost Test Order-Net participant costs refer to the costs of the end-use customer.
PECO Energy Company] Page 27

January 15, 2013 | Quarterly Report to the PA PUC - Program Year 4 Quarter 2
Table 4-6. Smart Equipment Incentives C&I
Quarter 2 ($000)
PYTD ($000)
CPITD ($000)
EDC fncentives to Participants $2,222 $3,022 $14,989
EDC Incentives to Trade Allies $0 $0 $0
Subtotal EDC Incentive Costs $2,222 $3,022 $14,989
Design & Development $0 $0 $0
Administration1" $874 $1,501 $8,167
Management12' $109 $233 $1,930
Marketing $59 $153 $1,159
Technical Assistance $0 $0 $0
Subtotal EDC Implementation Costs $1,042 $1,886 $11,255
EDC Evaluation Costs $170 $323 $1,678
SWE Audit Costs N/A N/A N/A
Total EDC Costs'3' N/A N/A N/A
Participant Costsi'i N/A N/A N/A
Total TRC Costs N/A N/A N/A
NOTES Per PUC dircclion, TRC ittputs nnd calculation arc required in the Annual Rqwrt only and should comply with the 2011 Total Resource Cost Test Order approved luly 28, 2011.
1 Implementation contractor costs. ! EDC costs other than those identified explicitly. 3 Per the 2011 Total Resource Cost Test Order - Total EDC Costs refer to EDC incurred expenses only. 1 Per the 2011 Total Resource Cost Test Order-Net participant costs refer to the costs of the end-use customer.
PECO Energy Companyl Page 28
January 15, 2013 | Quarterly Report to the PA PUC - Program Year 4 Quarter 2
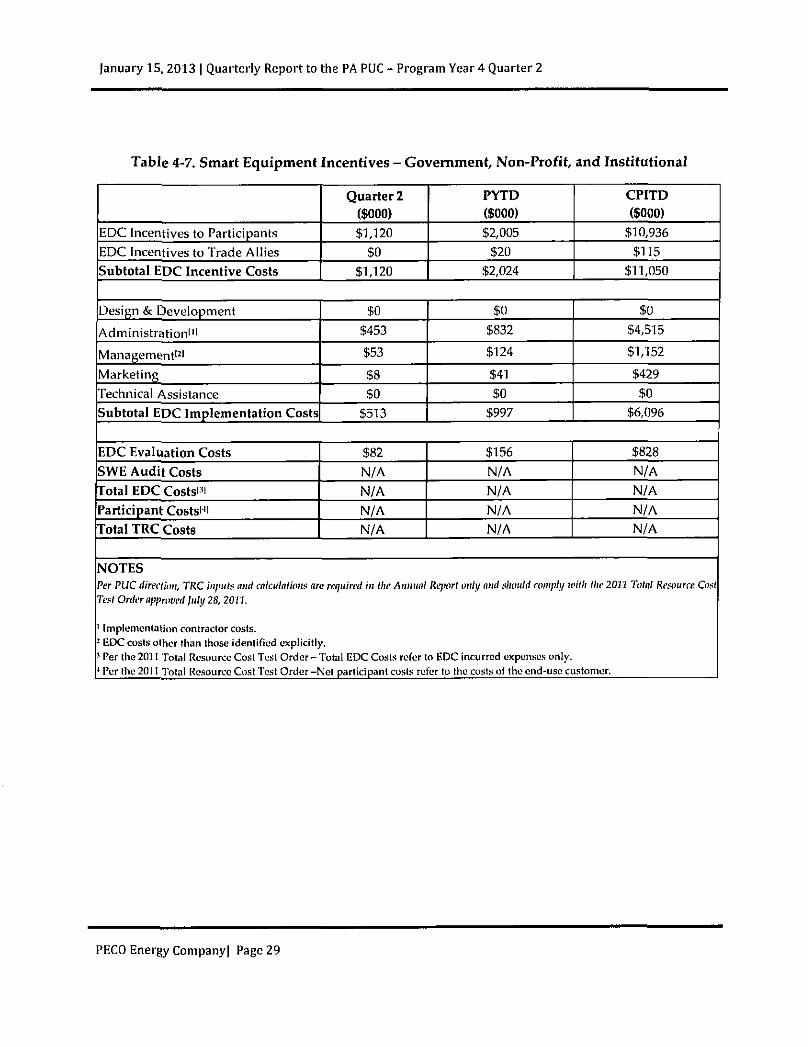
Table 4-7. Smart Equipment Incentives - Government Non-Profit, and Institutional
Quarter 2 ($000)
PYTD ($000)
CPITD ($000)
EDC Incentives to Participants $1,120 $2,005 $10,936
EDC Incentives to Trade Allies $0 $20 $115
Subtotal EDC Incentive Costs $1,120 $2,024 $11,050
Design & Development $0 $0 $0
Administration111 $453 $832 $4,515
Management121 $53 $124 $1,152
Marketing $8 $41 $429
Technical Assistance $0 $0 $0
Subtotal EDC Implementation Costs $513 $997 $6,096
EDC Evaluation Costs $82 $156 $828
SWE Audit Costs N/A N/A N/A
Total EDC Costsi31 N/A N/A N/A
Participant Costsi-11 N/A N/A N/A
Total TRC Costs N/A N/A N/A
NOTES Per PUC directum, TRC inputs and calculations arc required in the Annual Report only ami should comply with the 2017 Total Resource Cost Test Order approved July 28, 2077.
1 Implementation contractor costs. 1 EDC costs other than those identified explicitly. 1 Per the 2011 Total Resource Cost Test Order - Total EDC Costs refer to EDC incurred expenses only. 1 Per the 2011 Total Resource Cost Test Order-Net participant costs refer to the costs of the end-use customer.
PECO Energy Companyl Page 29

January 15, 2013 | Quarterly Report to the PA PUC - Program Year 4 Quarter 2
Table 4-8. Smart Construction Incentives
Quarter 2 ($000)
PYTD ($000)
CPITD ($000)
EDC Incentives to Participants $106 $192 $805
EDC Incentives to Trade Allies $25 $25 $144
Subtotal EDC Incentive Costs $131 $217 $949
Design & Development $0 $0 $0
Administration11' $49 $96 $496
Management121 $12 $24 $137
Marketing $5 $11 $65
Technical Assistance $0 $0 $0
Subtotal EDC Implementation Costs $66 $131 $698
EDC Evaluation Costs $3 $6 $69
SWE Audit Costs N/A N/A N/A
Total EDC CostsPi N/A N/A N/A
Participant Costs''' N/A N/A N/A
Total TRC Costs N/A N/A N/A
NOTES Per PUC directum, TRC inputs and calculations are required bt the Amtual Rqwrt only and should compl)/ wilh the 2011 Total Resource Cost Test Order approivd July 28, 2011.
1 Irnplomuntation contractor costs. 2 EDC costs other than those identified explicitly. 1 Per the 2011 Total Resource Cost Test Order - Total EDC Costs refer to EDC incurred expenses only. 4 Per the 2011 Total Resource Cost Test Order-Net participant costs refer to the costs of the end-use customer.
PECO Energy Companyl Page 30

January 15, 2013 | Quarterly Report to the PA PUC - Program Year 4 Quarter 2
Table 4-9. Conservation Voltage Reduction
Quarter 2 ($000)
PYTD ($000)
CPITD ($000)
EDC Incentives to Participants $0 $0 $0
EDC Incentives to Trade Allies $0 $0 $0
Subtotal EDC Incentive Costs $0 $0 $0
Design & Development $0 $0 $0
Administration'11 $174 $239 $1,950
Management'2' ($39) ($29) $130
Marketing $0 $0 $0
Technical Assistance $0 $0 $0
Subtotal EDC Implementation Costs $135 $210 $2,080
EDC Evaluation Costs $15 $29 $169
SWE Audit Costs N/A N/A N/A
Total EDC Costs'1' N/A N/A N/A
Participant Costs'4' N/A N/A N/A
Total TRC Costs N/A N/A N/A
NOTES Per PUC direction, TRC inputs and calculations are required in the Annual Report only and should comply with the 2011 Total Resource Cost Test Ordar approved }uly 28, 2011.
1 Implementation contractor costs. 1 EDC costs other than those identified explicitly. 1 Per the 2011 Total Resource Cost Test Order - Total EDC Costs refer to EDC incurred expenses only. 1 Per the 2011 Total Resource Cost Test Order -Net participant costs refer to the costs of the end-use customer.
PECO Energy Company) Page 31

January 15, 2013 | Quarterly Report to the PA PUC - Program Year 4 Quarter 2
Table 4-10. Residential Smart AC Saver
Quarter 2 ($000)
PYTD ($000)
CPITD ($000)
EDC Incentives to Participants $5,601 $11,156 $19,784
EDC Incentives to Trade Allies $0 $0 $0
Subtotal EDC Incentive Costs $5,601 $11,156 $19,784
Design & Development $0 $0 $0
Administration111 $273 $1,965 $9,353
Management121 $91 $751 $13,353
Marketing $31 $54 $359
Technical Assistance $0 $0 $0
Subtotal EDC Implementation Costs $395 $2,770 $23,065
EDC Evaluation Costs $42 $80 $504
SWE Audit Costs N/A N/A N/A
Total EDC Costs'1' N/A N/A N/A
Participant Costs'4' N/A N/A N/A
Total TRC Costs N/A N/A N/A
NOTES Per PUC directum, TRC inputs and calculations are. required in the Annual Report only and should comply with the 201J Total Resource Cost Test Order approivd ]uhj 28, 2011.
1 Implementntkm contractor costs. 2 EDC costs other than those identified explicitly. 3 Per the 2011 Total Resource Cost Test Order - Total EDC Costs refer to EDC incurred expenses only. ' Per the 2011 Total Resource Cost Test Order -Net participant costs refer to the costs of the end-use customer.
PECO Energy Company) Page 32

January 15, 2013 | Quarterly Report to the PA PUC - Program Year 4 Quarter 2
Table 4-11. Commercial Smart AC Saver
Quarter 2 ($000)
PYTD ($000)
CPITD ($000)
EDC Incentives to Participants $252 $504 $649
EDC Incentives to Trade Allies $0 $0 $0
Subtotal EDC Incentive Costs $252 $504 $649
Design & Development $0 $0 $0
Administration'" $178 $336 $3,349
Management'2' $28 $83 $791
Marketing $46 $104 $280
Technical Assistance $0 $0 $0
Subtotal EDC Implementation Costs $252 $523 $4,420
EDC Evaluation Costs $15 $28 $191
SWE Audit Costs N/A N/A N/A
Total EDC Costsi3' N/A N/A N/A
Participant Costs'4' N/A N/A N/A
Total TRC Costs N/A N/A N/A
NOTES Per PUC direction, TRC inputs and calculation:; are required in the Annual Report only and should comply with the 2011 Total Resource Cost Test Order approved luly 28, 2011.
1 Implementation contractor costs. 2 EDC costs other than those identified explicitly. M'er the 2011 Total Resource Cost Test Order-Total EDC Costs refer to EDC incurred expenses only. * Per the 2011 Total Resource Cost Test Order-Net participant costs refer to the costs of the end-use customer.
PECO Energy Company) Page 33

January 15, 2013 | Quarterly Report to the PA PUC - Program Year 4 Quarter 2
Table 4-12. Permanent Load Reduction
Quarter 2 ($000)
PYTD ($000)
CPITD ($000)
EDC Incentives to Participants $35 $35 $35
EDC Incentives to Trade Allies $0 $0 $0
Subtotal EDC Incentive Costs $35 $35 $35
Design & Development $0 $0 $0
Administration'1' $37 $70 $376
Management'2' $8 $20 $270
Marketing $0 $0 $0
Technical Assistance $0 $0 $0
Subtotal EDC Implementation Costs $44 $90 $646
EDC Evaluation Costs $8 $15 $85
SWE Audit Costs N/A N/A N/A
Total EDC Costs'1' N/A N/A N/A
Participant Costs'4' N/A N/A N/A
Total TRC Costs N/A N/A N/A
NOTES Per PUC direction, TRC inputs and calculations arc required in the Annual Report only and should comply with the 2011 Total Resource Cost Test Order approivd July 28, 2011.
1 Implementation contractor costs. 1 EDC costs other than those identified explicitly. 5 Per the 2011 Total Resource Cost Test Order - Total EDC Costs refer to EDC incurred expenses only. ' Per the 2011 Total Resource Cost Test Order-Net participant costs refer to the costs of the end-use customer.
PECO Energy Company) Page 34

January 15, 2013 | Quarterly Report to the PA PUC - Program Year 4 Quarter 2
Table 4-13. Demand Response Aggregators
Quarter 2 ($000)
PYTD ($000)
CPITD ($000)
EDC Incentives to Participants $0 $0 $0
EDC Incentives to Trade Allies $0 $0 $0
Subtotal EDC Incentive Costs $0 $0 $0
Design & Development $0 $0 $0
Administration"1 $2,976 $6,199 $14,944
Management'21 $83 $193 $1,085
Marketing $0 $109 $1,001
Technical Assistance $0 $0 $0
Subtotal EDC Implementation Costs $3,059 $6,391 $16,028
EDC Evaluation Costs $19 $36 $307
SWE Audit Costs N/A N/A N/A
Total EDC Costsi N/A N/A N/A
Participant Costsi'i N/A N/A N/A
Total TRC Costs N/A N/A N/A
NOTES Per PUC direction, TRC inputs and calculations are. required in the Annual Report only and should comply ivith the 2011 Total Resource Cost Test Order approved July 28, 2077.
1 Implementation contractor costs. 2 EDC costs other than those identified explicitly. 3 Per the 2011 Total Resource Cost Test Order - Total EDC Costs refer to EDC incurred expenses only. 4 Per the 2011 Total Resource Cost Test Order -Net participant costs refer to the costs of the end-use customer.
PECO Energy Company) Page 35

January 15, 2013 | Quarterly Report to the PA PUC - Program Year 4 Quarter 2
Table 4-14. Distributed Energy Resources
Quarter 2 ($000)
PYTD ($000)
CPITD ($000)
EDC Incentives to Participants $0 $0 $0
EDC Incentives to Trade Allies $0 $0 $0
Subtotal EDC Incentive Costs $0 $0 $0
Design & Development $0 $0 $0
Administration"1 $397 $1,016 $1,429
Management121 $204 $336 $1,399
Marketing $0 $0 $0
Technical Assistance $0 $0 $0
Subtotal EDC Implementation Costs $601 $1,351 $2,827
EDC Evaluation Costs $30 $57 $331
SWE Audit Costs N/A N/A N/A
Total EDC Costsi N/A N/A N/A
Participant Costs'1' N/A N/A N/A
Total TRC Costs N/A N/A N/A
NOTES Pi'r PUC ttireciiou, TRC inputs and adculatiom arr required in the Annua! Report only and should comply with the 2011 Total Resource Cost Test Order approved luly 28, 20V.
1 Implomiintation contractor costs. 2 EDC costs other than those identified explicitly. 1 Per the 2011 Total Resource Cost Test Order - Total EDC Costs refer to EDC incurred expenses only. 1 Per the 2011 Total Resource Cost Test Order -Net participant costs refer to the costs of the end-use customer.
PECO Energy Company) Page 36
Page 1 of 1
From: (215)841-5776 Anna Migliaccio Exelon
2301 Market Street S15-2
Philadelphia. PA 19103
Origin ID: REDA f ^ J ^ S Eiiress
J12201209200325
SHIP TO: (717) 772-7777 BILL SENDER
Rosemary Chiavetta, Secretary Pa Public Utility Commission 400 NORTH ST FL 2 COMMONWEALTH KEYSTONE BLDG HARRISBURG, PA 17120
Ship Date:15JAN13 ActWgt: 2.0 LB CAD: 9876187/INET3300
Delivery Address Bar Code
Ref# Invoice # PO# Dept#
™<# 7945 1891 2073 I 0201 I
WED-16 JAN A1 STANDARD OVERNIGHT
ZN MDTA 17120
PA-US
MDT
515G2ff813/AA44
After printing this label: 1. Use the 'Print' button on this page to print your label to your laser or inkjet printer. 2. Fold the printed page along the horizontal line. 3. Place label in shipping pouch and affix it to your shipment so that the barcode portion of the label can be read and scanned.
Warning: Use only the printed original label for shipping. Using a photocopy of this label for shipping purposes is fraudulent and could result in additional billing charges, along with the cancellation of your FedEx account number. Use of this system constitutes your agreement to the service conditions in the current FedEx Service Guide, available on fedex.com. Fed Ex will not be responsible for any claim in excess of $100 per package, whether the result of loss, damage, delay, nondelivery, misdelivery.or misinformation, unless you declare a higher value, pay an additional charge, document your actual loss and file a timely claim.Limitations found in the current FedEx Service Guide apply. Your right to recover from FedEx for any loss, including intrinsic value of the package, loss of sales, income interest, profit, attorney's fees, costs, and other forms of damage whether direct, incidental,consequential, or special is limited to the greater of $100 or the authorized declared value. Recovery cannot exceed actual documented loss.Maximum for items of extraordinary value is $1,000, e.g. jewelry, precious metals, negotiable instruments and other items listed in our ServiceGuide. Written claims must be filed within strict time limits, see current FedEx Service Guide.
https://www.fedex.eom/shipping/himl/eii//PrintIFrame.html 1/15/2013