richard w. fisher president & ceo federal reserve bank of
TRANSCRIPT

Gainesville Area Chamber of Commerce ---
Tuesday, December 18, 2012
Richard W. Fisher President & CEO
Federal Reserve Bank of Dallas
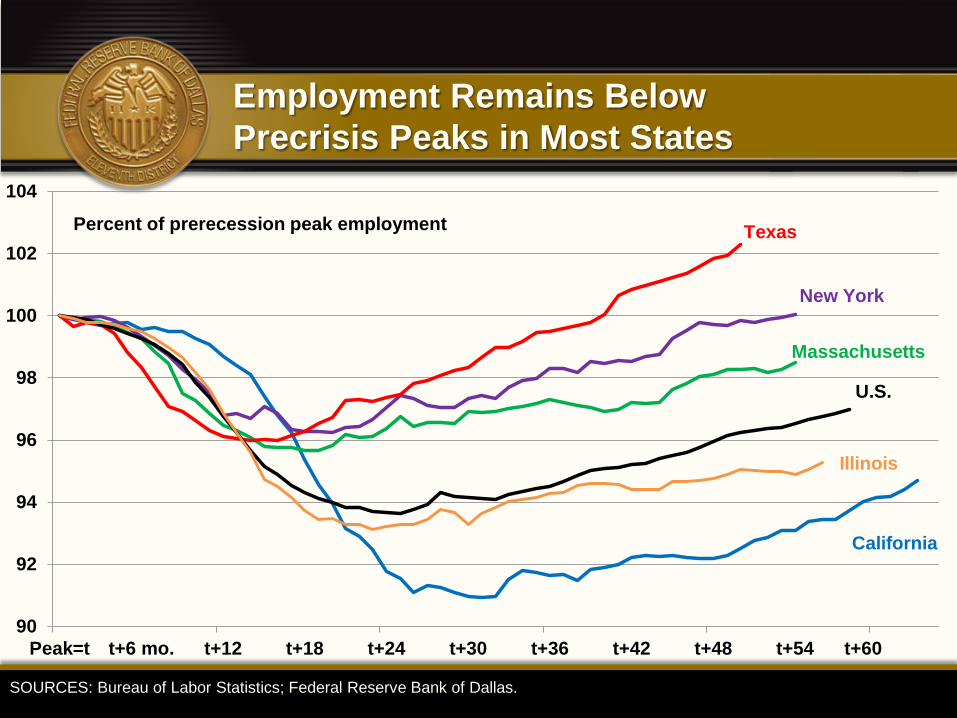
Employment Remains Below Precrisis Peaks in Most States
SOURCES: Bureau of Labor Statistics; Federal Reserve Bank of Dallas.
90
92
94
96
98
100
102
104
Peak=t t+6 mo. t+12 t+18 t+24 t+30 t+36 t+42 t+48 t+54 t+60
Percent of prerecession peak employment
California
U.S.
Massachusetts
New York
Texas
Illinois

Total Nonagricultural Employment Since 1990
SOURCES: Bureau of Labor Statistics; Federal Reserve Bank of Dallas.
90
100
110
120
130
140
150
160
1990 1995 2000 2005 2010
Texas
U.S.
California
New York Massachusetts
Job Growth Index, 100 = January 1990
Illinois

SOURCES: Bureau of Labor Statistics; seasonally adjusted by Federal Reserve Bank of Dallas.
Change in Number of Jobs
47.6
14.2
41.9
54.7
41.5
13.3 11.2
31.6
15.3
0.7 0
10
20
30
40
50
60
(Year-to-date growth in Texas through October 2012) Thousands of jobs
Oil & Gas Extraction and Mining Support
(2.4%)
Financial Activities (6.0%)
Trade, Transp & Utilities (20.0%)
Manufacturing (7.9%)
Educational & Health Services
(13.5%)
Construction (5.5%)
Leisure & Hospitality
(10.0%) Information
(1.8%)
Prof. & Business Services (13.0%)
Government (16.4%)

Job Growth by Wage Quartile, 2001-11
25.2
7.0
13.3 11.9
15.8
-6.4
-0.2
9.4
-10
-5
0
5
10
15
20
25
30
Lowest Wage Quartile Lower-Middle WageQuartile
Upper-Middle WageQuartile
Highest Wage Quartile
Texas U.S.
Percent change
SOURCE: Occupational Employment Statistics, Bureau of Labor Statistics.

Percent of Jobs Created in Texas by Wage Quartile, 2001-11
28
28
24
21
Lowest wage quartile
Lower-middle wage quartile
Upper-middle wage quartile
Highest wage quartile
NOTE: Figures do not equal 100 because of rounding. SOURCE: Occupational Employment Statistics, Bureau of Labor Statistics.

Conclusions
Texas consistently creates jobs about twice as fast as the nation
– Faster in nearly all occupations and every wage quartile
Despite balanced growth, Texas wages still below U.S. wages
Job growth is most rapid at low-wage end, as it is in nation
– High-wage jobs growing, too, as in nation
So what’s different in Texas?
– Middle-income jobs growing in Texas, shrinking in nation
– “Secret” due more to a growing middle class than a growing underclass

New York Net Migration
NOTE: Data for census years 2000 and 2010 are not available. SOURCE: Census Bureau.
-300
-250
-200
-150
-100
-50
0
50
100
150
200
1991 1993 1995 1997 1999 2002 2004 2006 2008 2011
InternationalDomestic
Thousands of people

Illinois Net Migration
NOTE: Data for census years 2000 and 2010 are not available. SOURCE: Census Bureau.
-100
-80
-60
-40
-20
0
20
40
60
80
100
1991 1993 1995 1997 1999 2002 2004 2006 2008 2011
InternationalDomestic
Thousands of people

California Net Migration
NOTE: Data for census years 2000 and 2010 are not available. SOURCE: Census Bureau.
-500
-400
-300
-200
-100
0
100
200
300
400
1991 1993 1995 1997 1999 2002 2004 2006 2008 2011
InternationalDomestic
Thousands of people
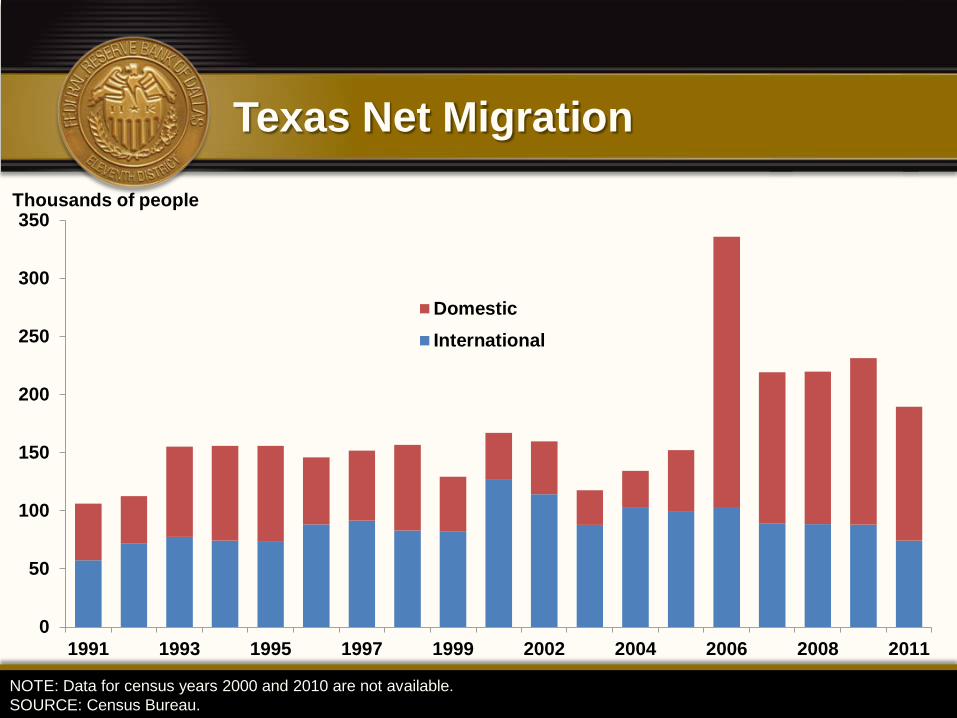
Texas Net Migration
NOTE: Data for census years 2000 and 2010 are not available. SOURCE: Census Bureau.
0
50
100
150
200
250
300
350
1991 1993 1995 1997 1999 2002 2004 2006 2008 2011
DomesticInternational
Thousands of people

The New Yorker
SOURCE: The New Yorker, Nov. 5, 2012, p. 99.

U.S. Economic Dashboard
5 2 . 4
-1
-0.5
0
0.5
11.5 2 2.5
3
3.5
4
4.5
5
1.74
HeadlinePCE
-2.5
-2
-1.5
-1
-0.5
0
0.51
1.5 22.5
3
3.5
4
4.5
5
5.5
6
2.49Year-over-year
Real GDP growth
4
4.5
5
5.5
66.5 7 7.5
8
8.5
9
9.5
10
7.7
Unemployment rate
Percent of jobs recovered
33.5
4
4.5
55.5
6 6.5 77.5
8
8.5
9
9.510
5.60
Junk-bond spread
Warning
Unemp.jump
Yieldcurve
Oilshock
Enginestall

Gainesville Area Chamber of Commerce ---
Tuesday, December 18, 2012
Richard W. Fisher President & CEO
Federal Reserve Bank of Dallas