richard yamarone economic indicators to watch
Post on 18-Oct-2014
3.202 views
DESCRIPTION
Presentation referenced by Richard Yamarone of the Bloomberg Economic BRIEF, at the 2012 Texas Financial Market Roundtable sponsored by Professor Lewis Spellman at the McCombs School of Business, The University of Texas at Austin. Mr. Yamarone is the author of "The Trader's Guide to Key Economic Indicators."TRANSCRIPT

Economic Indicators to Watch
What Are the Odds of a 2012 Recession? New York, NY
Monday, June 4, 2012
Richard Yamarone
Bloomberg Economic BRIEF
Author of “The Trader’s Guide to Key Economic Indicators”
Richard Yamarone, [email protected], TEL: 212-617-8737 Twitter: @Yamarone
Richard Yamarone, [email protected], TEL: 212-617-8737
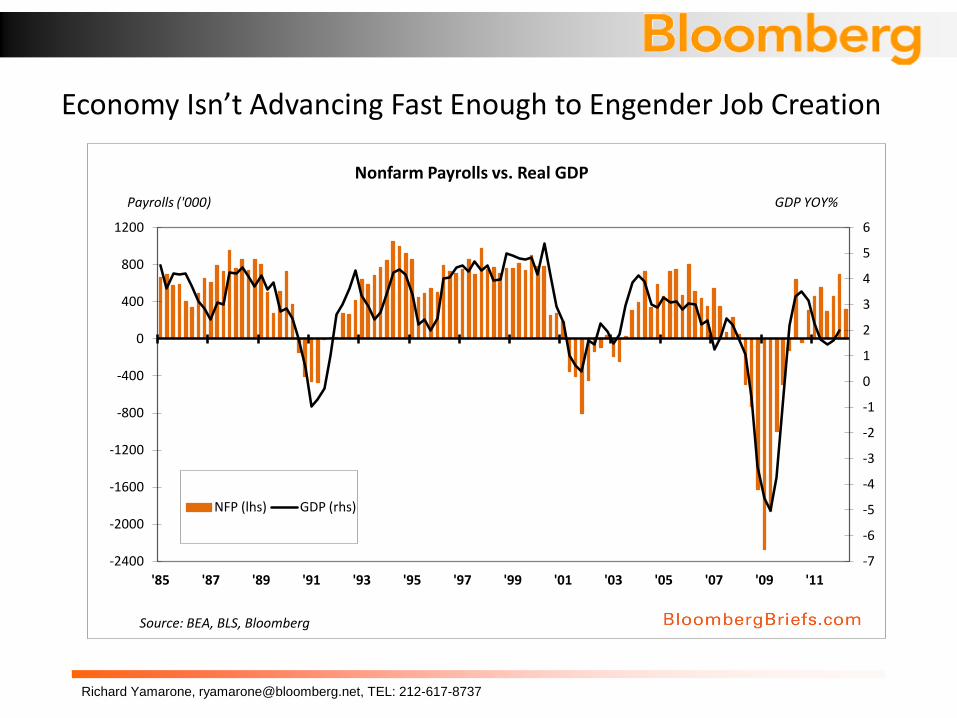
Economy Isn’t Advancing Fast Enough to Engender Job Creation
-7
-6
-5
-4
-3
-2
-1
0
1
2
3
4
5
6
-2400
-2000
-1600
-1200
-800
-400
0
400
800
1200
'85 '87 '89 '91 '93 '95 '97 '99 '01 '03 '05 '07 '09 '11
Nonfarm Payrolls vs. Real GDP
NFP (lhs) GDP (rhs)
Payrolls ('000) GDP YOY%
Source: BEA, BLS, Bloomberg

Richard Yamarone, [email protected], TEL: 212-617-8737
Economy Operating Well Below its Potential
$5,500
$6,500
$7,500
$8,500
$9,500
$10,500
$11,500
$12,500
$13,500
$14,500
1980 1985 1990 1995 2000 2005 2010 2015
Potential GDP
Real GDP
Real GDP (Blns) vs. Real Potential GDP (Blns)
Source: BEA, CBO, Bloomberg
CBOPGDPR <Index>, GDP CHWG <Index>
Richard Yamarone, [email protected], TEL: 212-617-8737
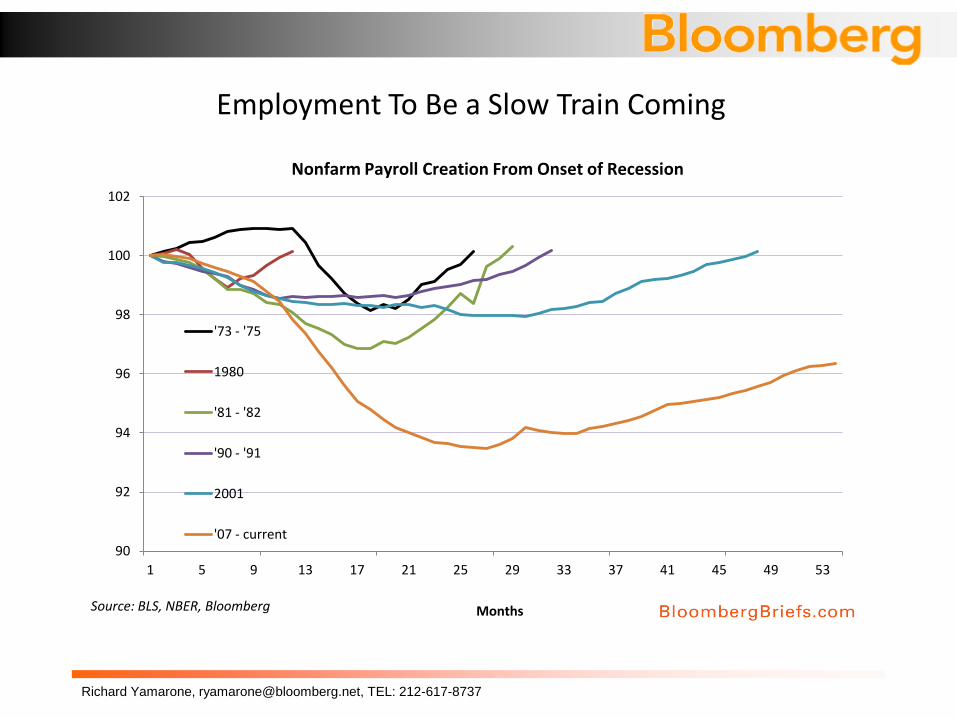
Employment To Be a Slow Train Coming
90
92
94
96
98
100
102
1 5 9 13 17 21 25 29 33 37 41 45 49 53
'73 - '75
1980
'81 - '82
'90 - '91
2001
'07 - current
Nonfarm Payroll Creation From Onset of Recession
Source: BLS, NBER, Bloomberg Months
Richard Yamarone, [email protected], TEL: 212-617-8737
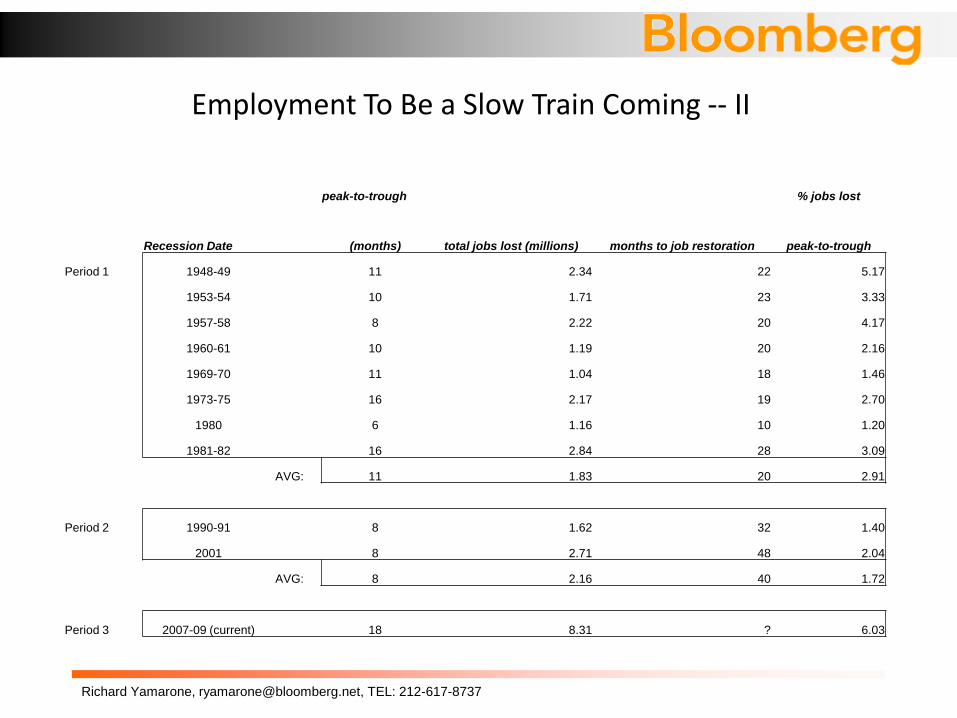
Employment To Be a Slow Train Coming -- II
peak-to-trough % jobs lost
Recession Date (months) total jobs lost (millions) months to job restoration peak-to-trough
Period 1 1948-49 11 2.34 22 5.17
1953-54 10 1.71 23 3.33
1957-58 8 2.22 20 4.17
1960-61 10 1.19 20 2.16
1969-70 11 1.04 18 1.46
1973-75 16 2.17 19 2.70
1980 6 1.16 10 1.20
1981-82 16 2.84 28 3.09
AVG: 11 1.83 20 2.91
Period 2 1990-91 8 1.62 32 1.40
2001 8 2.71 48 2.04
AVG: 8 2.16 40 1.72
Period 3 2007-09 (current) 18 8.31 ? 6.03
Richard Yamarone, [email protected], TEL: 212-617-8737
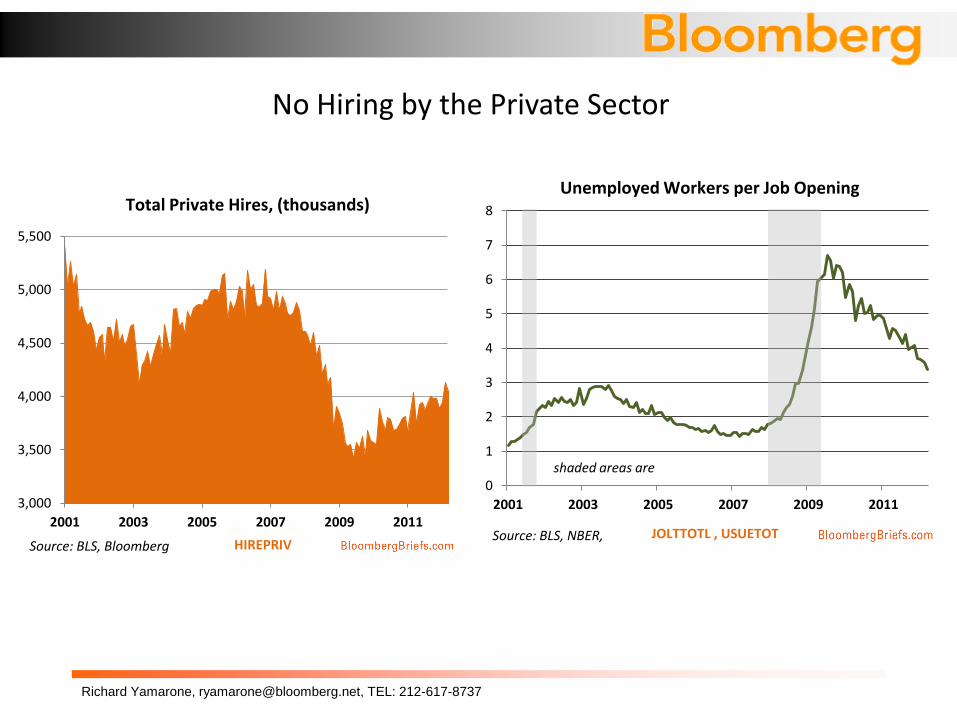
No Hiring by the Private Sector
0
1
2
3
4
5
6
7
8
2001 2003 2005 2007 2009 2011
Unemployed Workers per Job Opening
Source: BLS, NBER,
shaded areas are
JOLTTOTL , USUETOT
3,000
3,500
4,000
4,500
5,000
5,500
2001 2003 2005 2007 2009 2011
Total Private Hires, (thousands)
HIREPRIV Source: BLS, Bloomberg
Richard Yamarone, [email protected], TEL: 212-617-8737
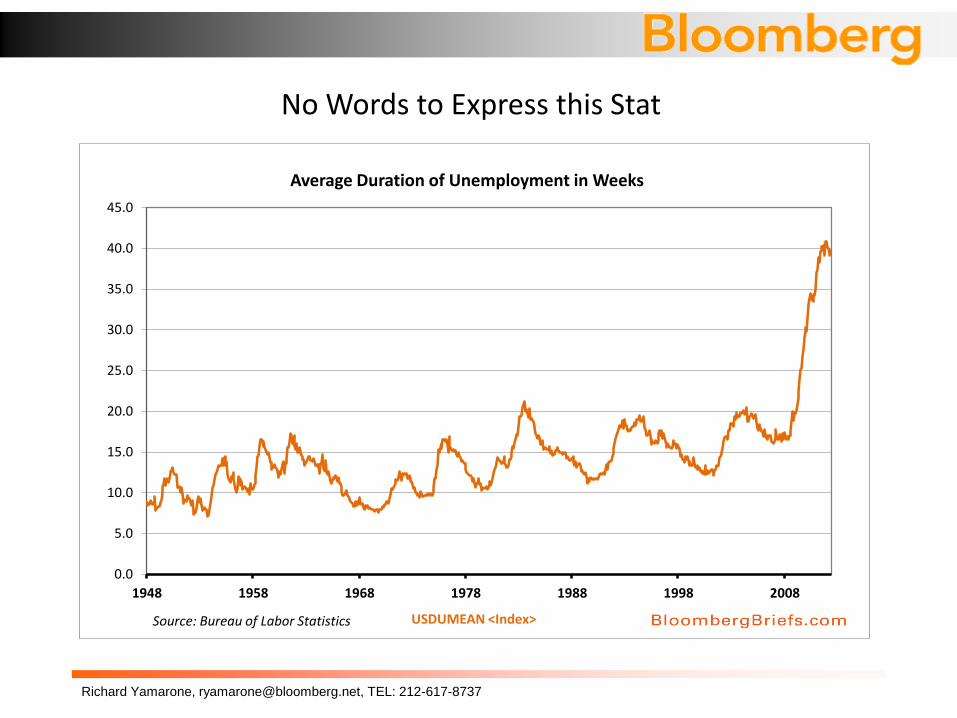
No Words to Express this Stat
0.0
5.0
10.0
15.0
20.0
25.0
30.0
35.0
40.0
45.0
1948 1958 1968 1978 1988 1998 2008
Average Duration of Unemployment in Weeks
Source: Bureau of Labor Statistics USDUMEAN <Index>
Richard Yamarone, [email protected], TEL: 212-617-8737
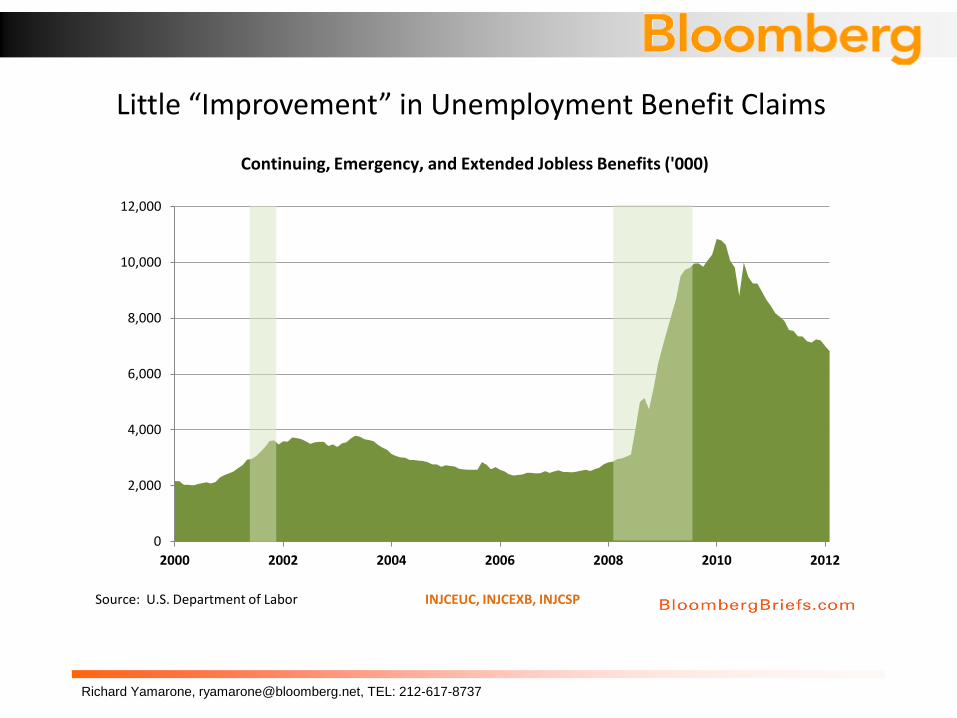
Little “Improvement” in Unemployment Benefit Claims
0
2,000
4,000
6,000
8,000
10,000
12,000
2000 2002 2004 2006 2008 2010 2012
Continuing, Emergency, and Extended Jobless Benefits ('000)
Source: U.S. Department of Labor INJCEUC, INJCEXB, INJCSP
Richard Yamarone, [email protected], TEL: 212-617-8737
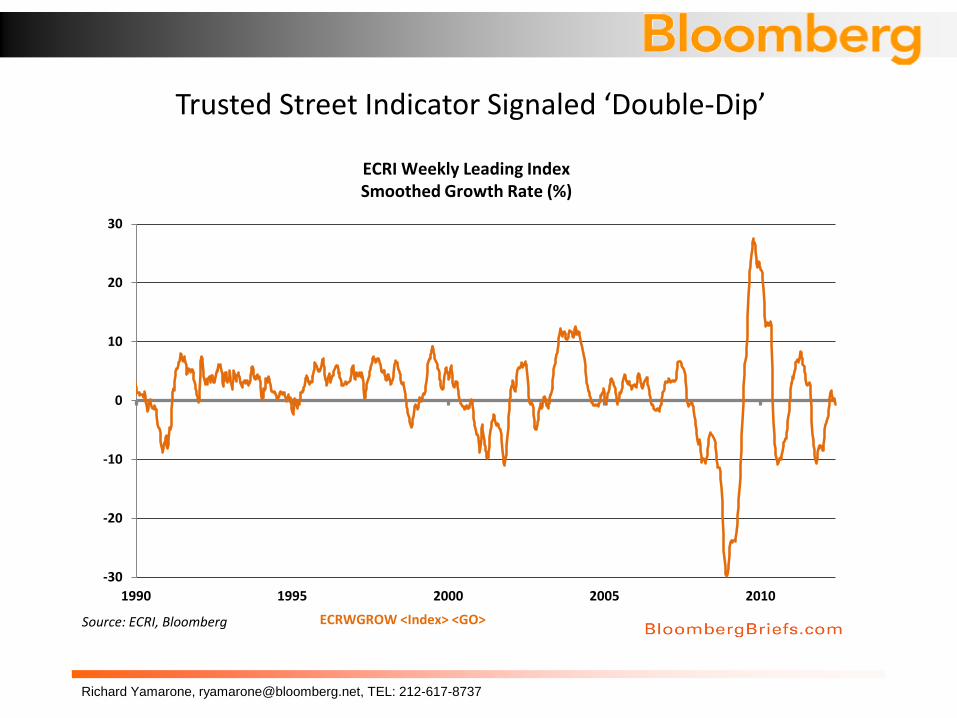
Trusted Street Indicator Signaled ‘Double-Dip’
-30
-20
-10
0
10
20
30
1990 1995 2000 2005 2010
ECRI Weekly Leading Index Smoothed Growth Rate (%)
Source: ECRI, Bloomberg ECRWGROW <Index> <GO>

Richard Yamarone, [email protected], TEL: 212-617-8737
Economy Set for An ‘About-Face’
-18
-16
-14
-12
-10
-8
-6
-4
-2
0
2
4
6
8
10
12
-8
-6
-4
-2
0
2
4
6
8
'85 '95 '05
Leading Economic Indicators (Y/Y%) vs. Real GDP Growth (Y/Y%)
Series2
LEI (rhs)
Source: Bureau of Economic Analysis, The Conference Board
GDP CYOY <Index> <GO>, LEI TOTL <Index> <GO>
Richard Yamarone, [email protected], TEL: 212-617-8737
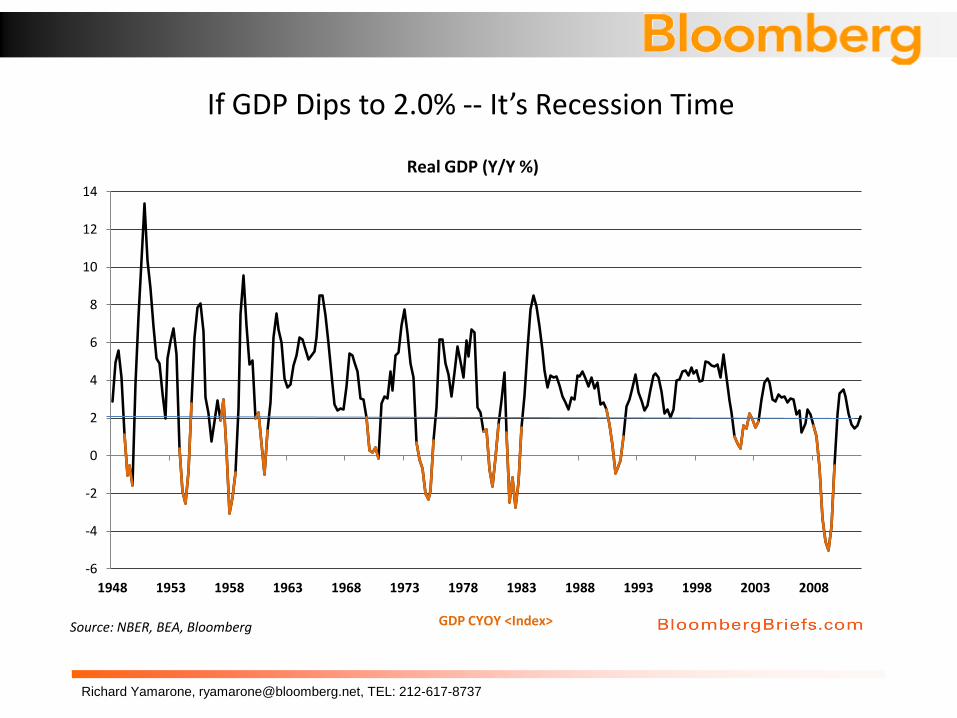
If GDP Dips to 2.0% -- It’s Recession Time
-6
-4
-2
0
2
4
6
8
10
12
14
1948 1953 1958 1963 1968 1973 1978 1983 1988 1993 1998 2003 2008
Real GDP (Y/Y %)
Source: NBER, BEA, Bloomberg GDP CYOY <Index>

Richard Yamarone, [email protected], TEL: 212-617-8737
Robust Fed Index Points to Sub-Par Performance
-4.00
-3.50
-3.00
-2.50
-2.00
-1.50
-1.00
-0.50
0.00
0.50
1.00
'90 '93 '96 '99 '02 '05 '08 '11
Chicago Fed National Activity Index
Source: Federal Reserve Bank of Chicago
Three Month Moving Average
CFNAI <Index>

Richard Yamarone, [email protected], TEL: 212-617-8737
Economic Deceleration Occurred During Early June
-6.00
-4.00
-2.00
0.00
2.00
4.00
6.00
8.00
-50
-40
-30
-20
-10
0
10
20
30
40
1994 1996 1998 2000 2002 2004 2006 2008 2010 2012
Railcar Loads (lhs)
Real GDP (rhs)
Real GDP (Y/Y%) vs. Railcar Loads of Waste/Scrap (Y/Y%)
Source: Association of American Railroads, BEA, Bloomberg
RAILWAST <Index>
Richard Yamarone, [email protected], TEL: 212-617-8737
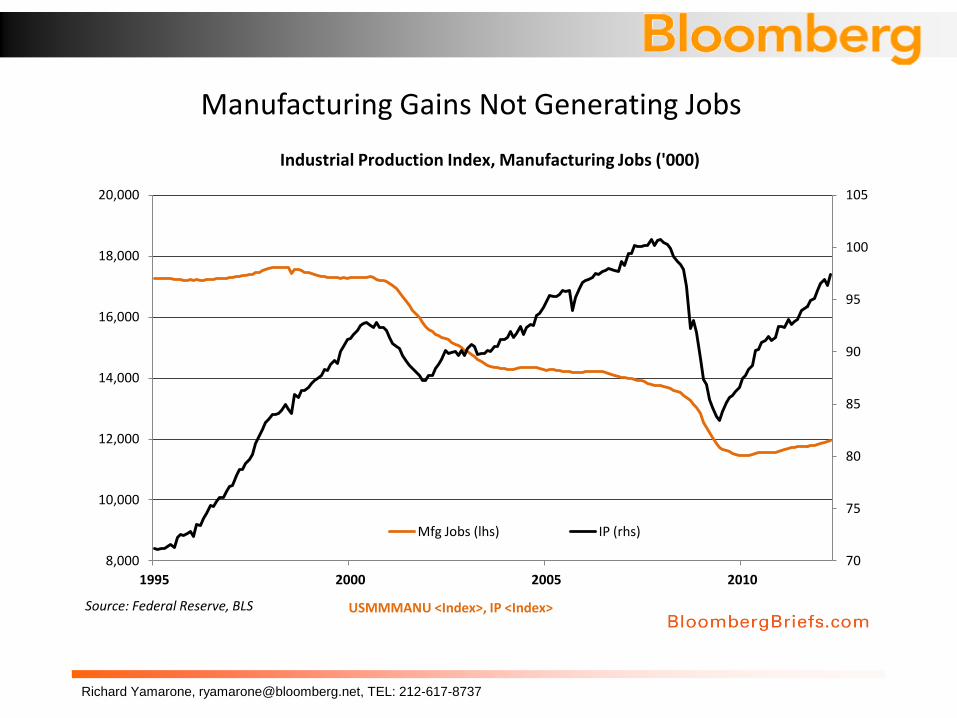
Manufacturing Gains Not Generating Jobs
70
75
80
85
90
95
100
105
8,000
10,000
12,000
14,000
16,000
18,000
20,000
1995 2000 2005 2010
Mfg Jobs (lhs) IP (rhs)
Industrial Production Index, Manufacturing Jobs ('000)
Source: Federal Reserve, BLS USMMMANU <Index>, IP <Index>
Richard Yamarone, [email protected], TEL: 212-617-8737
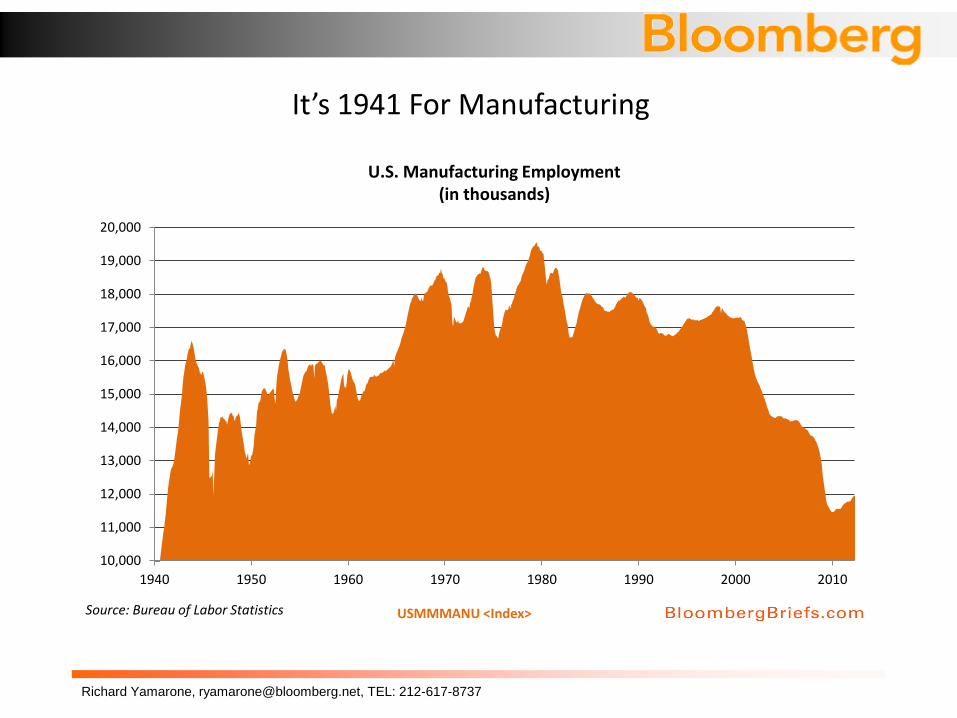
It’s 1941 For Manufacturing
10,000
11,000
12,000
13,000
14,000
15,000
16,000
17,000
18,000
19,000
20,000
1940 1950 1960 1970 1980 1990 2000 2010
U.S. Manufacturing Employment (in thousands)
Source: Bureau of Labor Statistics USMMMANU <Index>
Richard Yamarone, [email protected], TEL: 212-617-8737
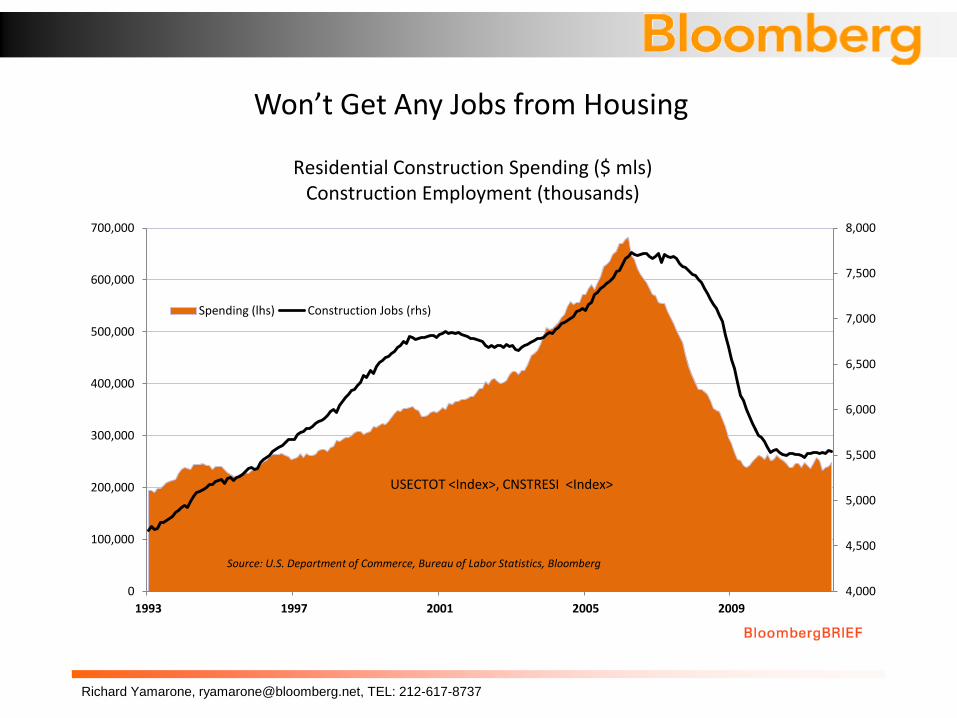
Won’t Get Any Jobs from Housing
4,000
4,500
5,000
5,500
6,000
6,500
7,000
7,500
8,000
0
100,000
200,000
300,000
400,000
500,000
600,000
700,000
1993 1997 2001 2005 2009
Spending (lhs) Construction Jobs (rhs)
Residential Construction Spending ($ mls) Construction Employment (thousands)
Source: U.S. Department of Commerce, Bureau of Labor Statistics, Bloomberg
USECTOT <Index>, CNSTRESI <Index>
Richard Yamarone, [email protected], TEL: 212-617-8737
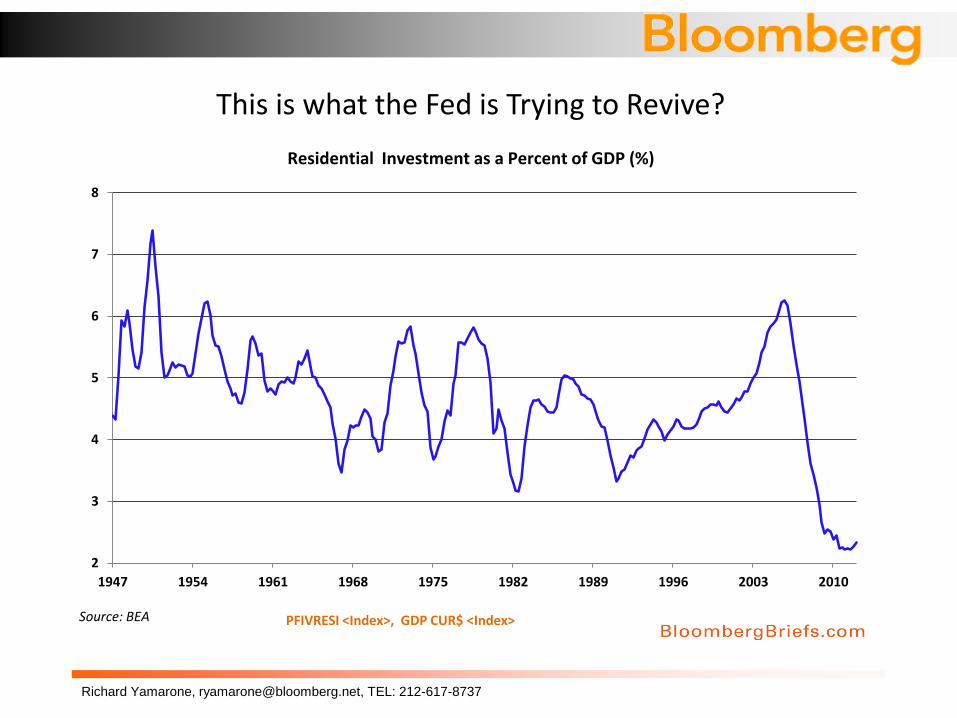
This is what the Fed is Trying to Revive?
2
3
4
5
6
7
8
1947 1954 1961 1968 1975 1982 1989 1996 2003 2010
Residential Investment as a Percent of GDP (%)
PFIVRESI <Index>, GDP CUR$ <Index> Source: BEA
Richard Yamarone, [email protected], TEL: 212-617-8737
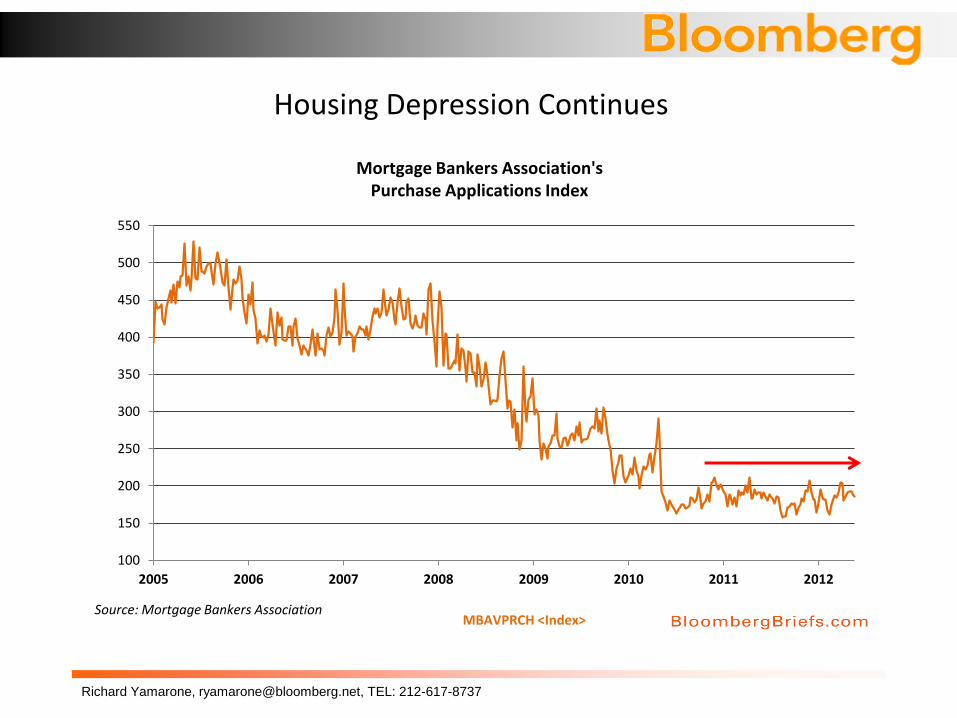
Housing Depression Continues
100
150
200
250
300
350
400
450
500
550
2005 2006 2007 2008 2009 2010 2011 2012
Source: Mortgage Bankers Association
Mortgage Bankers Association's Purchase Applications Index
MBAVPRCH <Index>
Richard Yamarone, [email protected], TEL: 212-617-8737
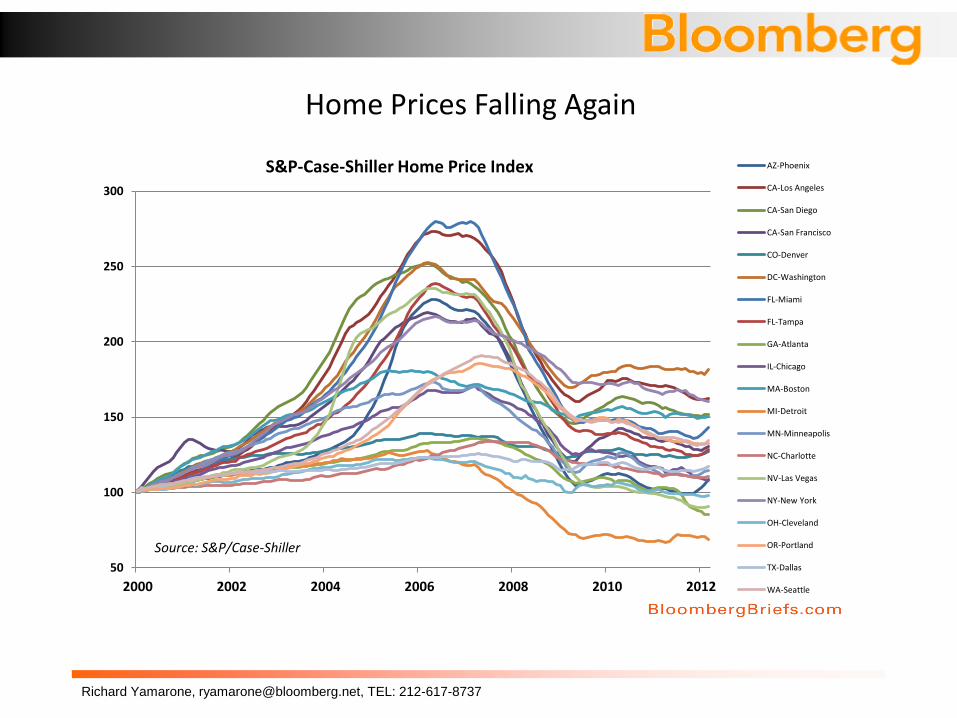
Home Prices Falling Again
50
100
150
200
250
300
2000 2002 2004 2006 2008 2010 2012
AZ-Phoenix
CA-Los Angeles
CA-San Diego
CA-San Francisco
CO-Denver
DC-Washington
FL-Miami
FL-Tampa
GA-Atlanta
IL-Chicago
MA-Boston
MI-Detroit
MN-Minneapolis
NC-Charlotte
NV-Las Vegas
NY-New York
OH-Cleveland
OR-Portland
TX-Dallas
WA-Seattle
S&P-Case-Shiller Home Price Index
Source: S&P/Case-Shiller
Richard Yamarone, [email protected], TEL: 212-617-8737
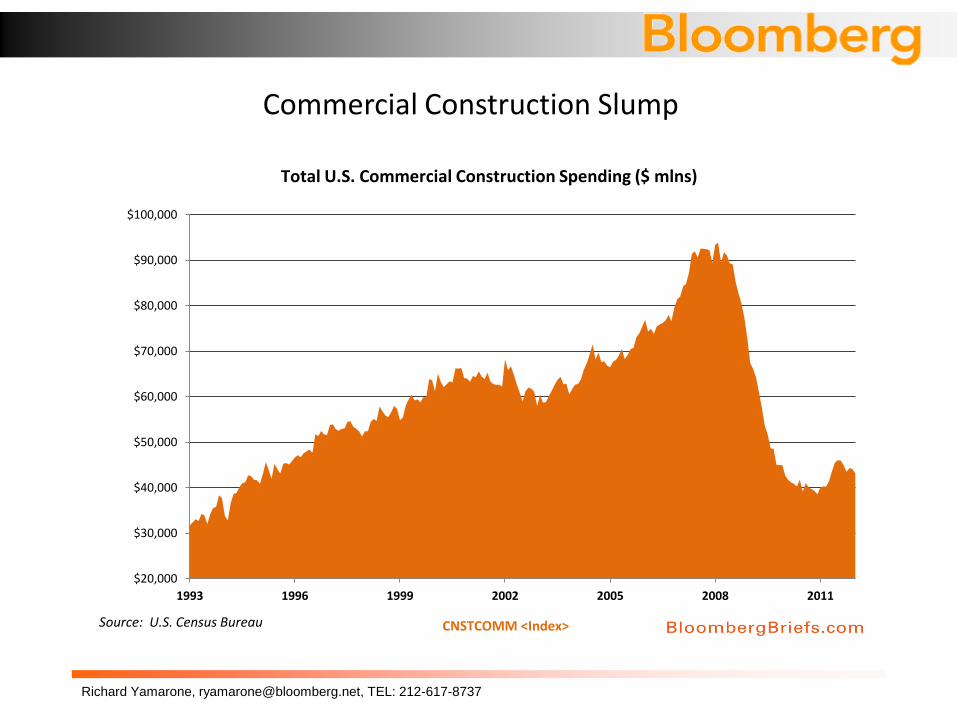
Commercial Construction Slump
$20,000
$30,000
$40,000
$50,000
$60,000
$70,000
$80,000
$90,000
$100,000
1993 1996 1999 2002 2005 2008 2011
Total U.S. Commercial Construction Spending ($ mlns)
Source: U.S. Census Bureau CNSTCOMM <Index>

Richard Yamarone, [email protected], TEL: 212-617-8737
Retailers Headed Out of the Malls
4.0%
5.0%
6.0%
7.0%
8.0%
9.0%
10.0%
11.0%
12.0%
2000 2003 2006 2009
Regional & Strip Mall Vacancies
Strip Mall Regional & Superregional Malls
Source: Reis Inc.
Richard Yamarone, [email protected], TEL: 212-617-8737
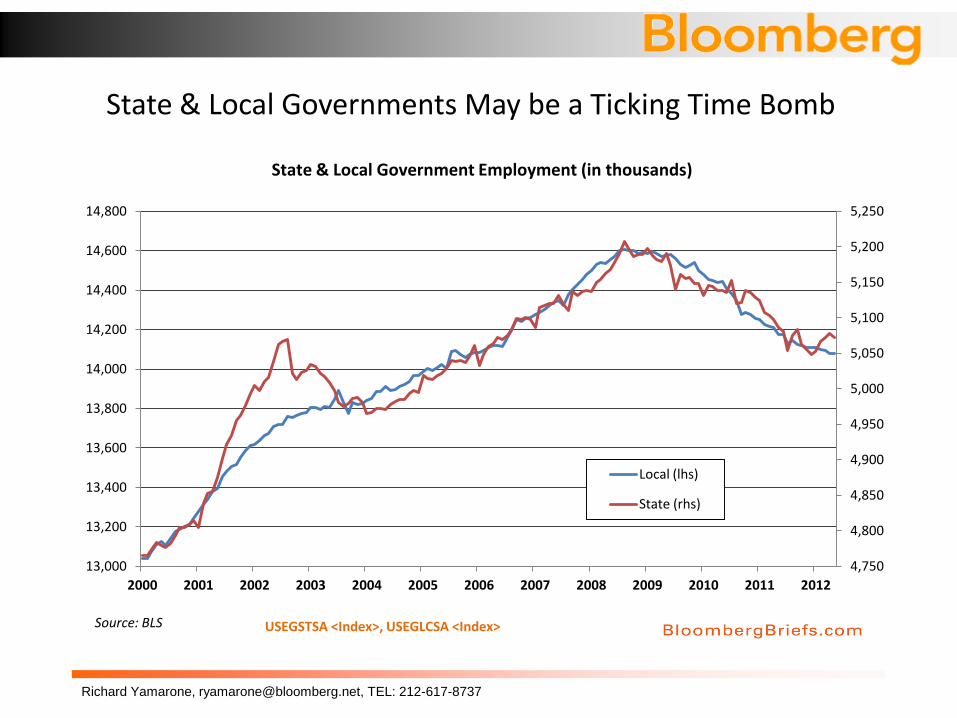
State & Local Governments May be a Ticking Time Bomb
4,750
4,800
4,850
4,900
4,950
5,000
5,050
5,100
5,150
5,200
5,250
13,000
13,200
13,400
13,600
13,800
14,000
14,200
14,400
14,600
14,800
2000 2001 2002 2003 2004 2005 2006 2007 2008 2009 2010 2011 2012
Local (lhs)
State (rhs)
State & Local Government Employment (in thousands)
Source: BLS USEGSTSA <Index>, USEGLCSA <Index>

Earnings/Analyst Conference Calls

Richard Yamarone, [email protected], TEL: 212-617-8737
Bloomberg Orange Book Summary of Commentary on ____________________
Current Economic
Conditions
By Corporation
from earning statements commencing July 1, 2010
NI ORANGEBOOK <GO>

Richard Yamarone, [email protected], TEL: 212-617-8737
What is Being Said…
“And so we're still seeing that midnight shopping in our stores when that EBT card, it's like a debit card, when it is ready and it is funded, there are people who are in the store at midnight because they know it turns on. And they have shopped from like 10:45 to midnight and they're waiting for that card and then our lines open up. And we've had some of our busiest ours at midnight.”
Rosalind Brewer, EVP, Wal-Mart April 12, 2011
“I think the most telling indicator for us that economic weakness and employment is the key issue driving soft volumes, is the fact that we continue to see, as – in contrast to the historical norms, we continue to see volume pick up heavily at the beginning of each month, and then steadily erode through the month, being particularly soft in the last week to 10 days of the month. That just tells us that people are running out of money.”
Gregg Engles, CEO Dean Foods May 10, 2011 “Now clearly when it gets to the end of the month and they've run out of dollars and the first of month gets there, you'll see some pick-up in sales. I would say it's not as dramatic as it was two years ago due mostly to the fact that not 100% of those benefits are getting loaded on to people's cards..”
J. Michael Schlotman, CFO, SVP Kroger May 17, 2011

Richard Yamarone, [email protected], TEL: 212-617-8737
It Pays to Read those 200 Transcripts…
-15.00
-10.00
-5.00
0.00
5.00
10.00
-6.00
-4.00
-2.00
0.00
2.00
4.00
6.00
8.00
1999 2001 2003 2005 2007 2009 2011
GDP (lhs) Fed Ex Shipments (rhs)
Fed Ex Total US Package Shipments (Y/Y%) vs. Real GDP (Y/Y%)
Source: Federal Express, Bureau of Economic Analysis
GDP Packages
Richard Yamarone, [email protected], TEL: 212-617-8737
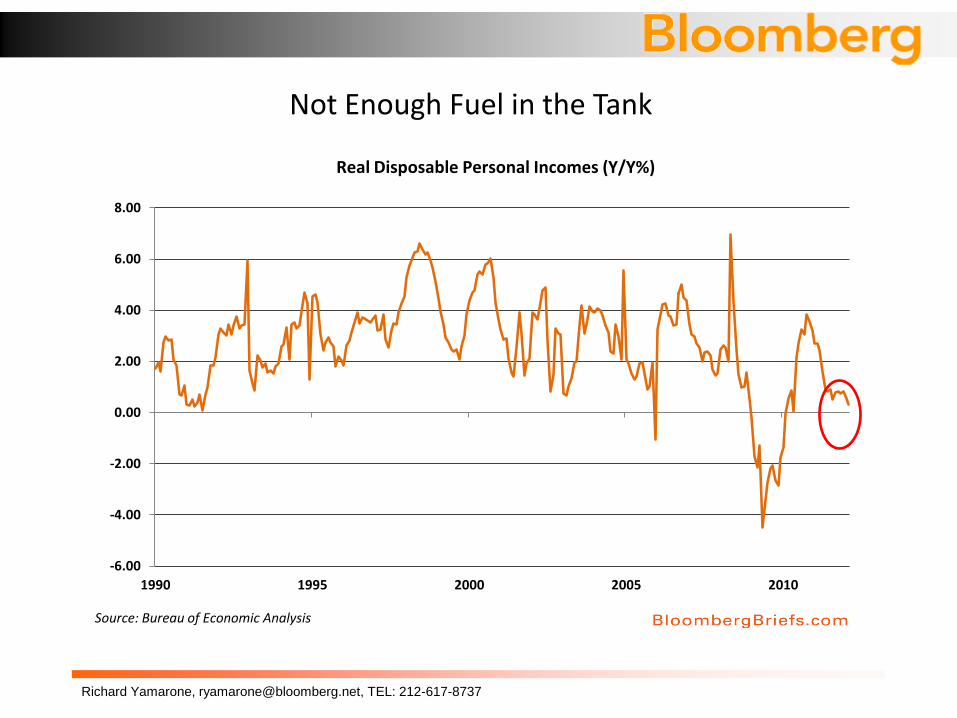
Not Enough Fuel in the Tank
-6.00
-4.00
-2.00
0.00
2.00
4.00
6.00
8.00
1990 1995 2000 2005 2010
Real Disposable Personal Incomes (Y/Y%)
Source: Bureau of Economic Analysis
Richard Yamarone, [email protected], TEL: 212-617-8737
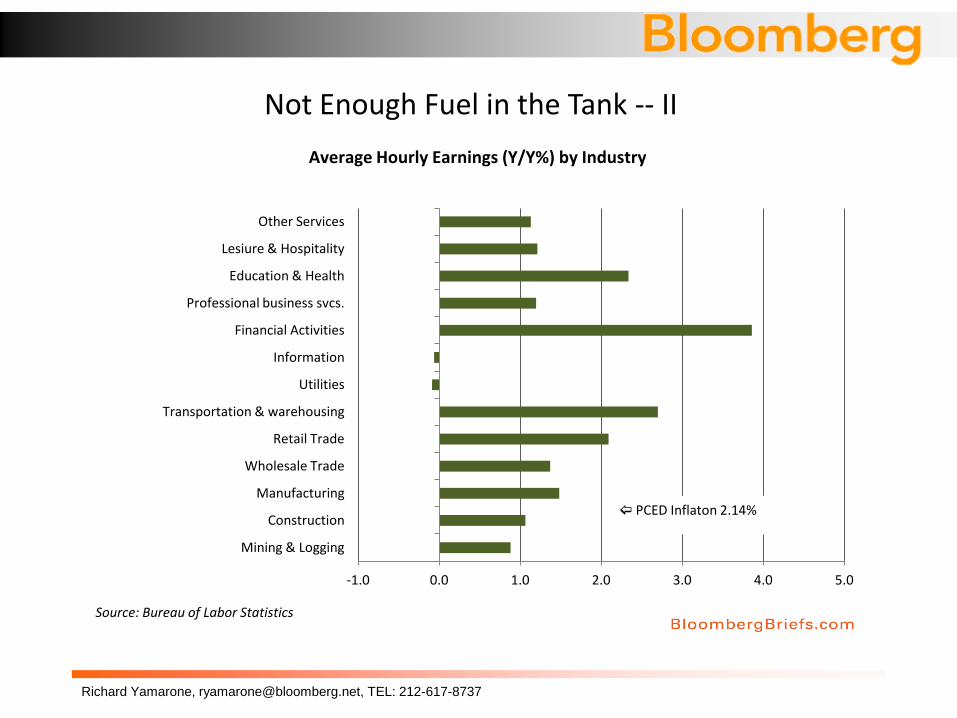
Not Enough Fuel in the Tank -- II
-1.0 0.0 1.0 2.0 3.0 4.0 5.0
Mining & Logging
Construction
Manufacturing
Wholesale Trade
Retail Trade
Transportation & warehousing
Utilities
Information
Financial Activities
Professional business svcs.
Education & Health
Lesiure & Hospitality
Other Services
Average Hourly Earnings (Y/Y%) by Industry
Source: Bureau of Labor Statistics
PCED Inflaton 2.14%
Richard Yamarone, [email protected], TEL: 212-617-8737
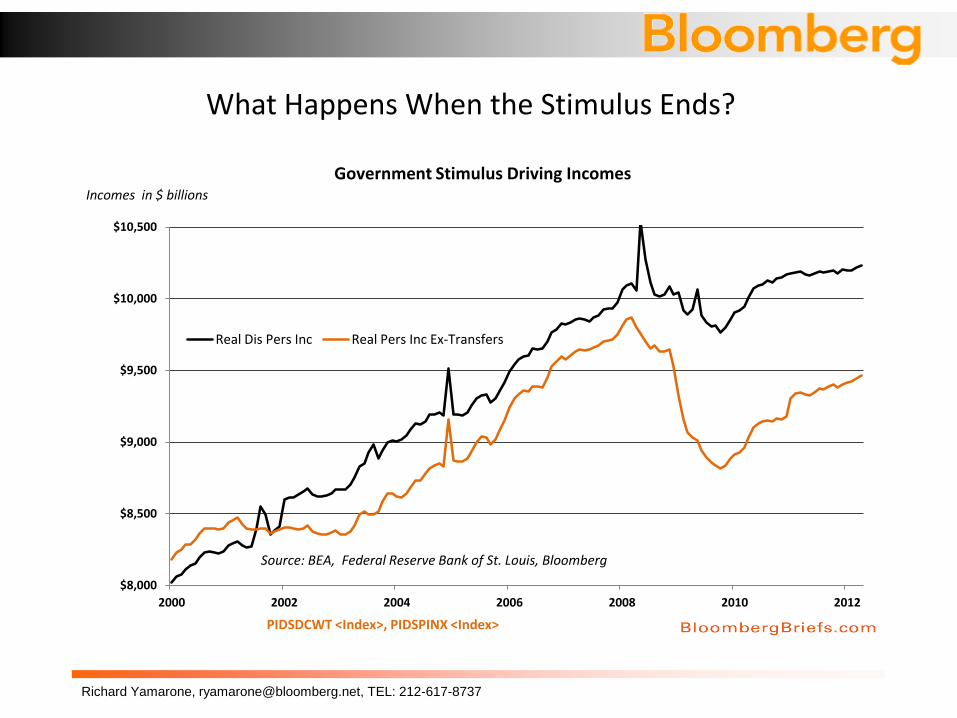
What Happens When the Stimulus Ends?
$8,000
$8,500
$9,000
$9,500
$10,000
$10,500
2000 2002 2004 2006 2008 2010 2012
Real Dis Pers Inc Real Pers Inc Ex-Transfers
Government Stimulus Driving Incomes
Source: BEA, Federal Reserve Bank of St. Louis, Bloomberg
Incomes in $ billions
PIDSDCWT <Index>, PIDSPINX <Index>
Richard Yamarone, [email protected], TEL: 212-617-8737
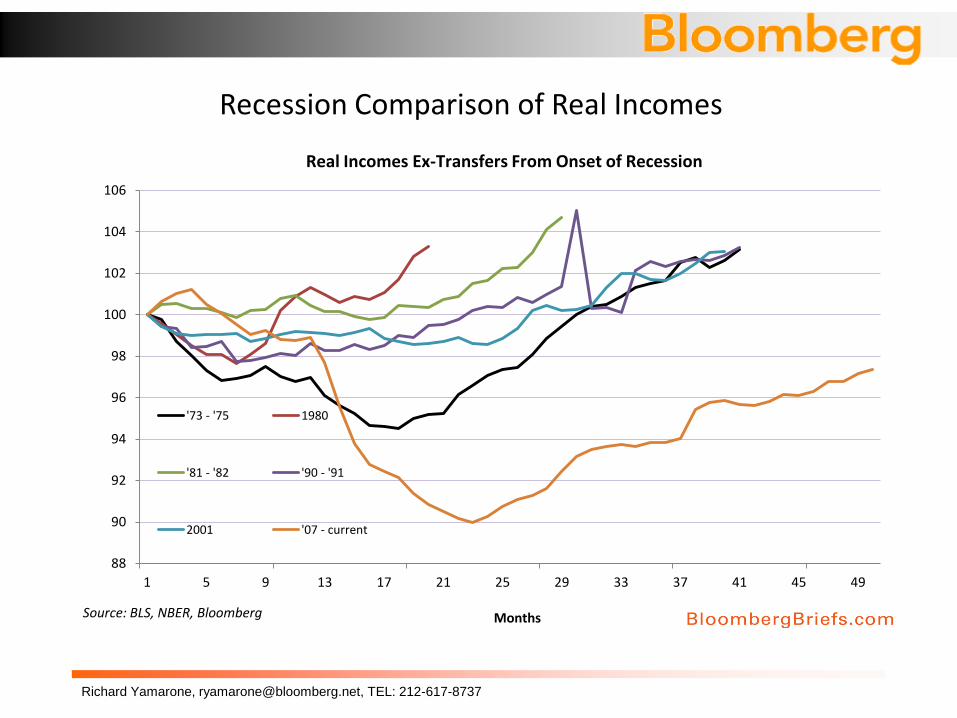
Recession Comparison of Real Incomes
88
90
92
94
96
98
100
102
104
106
1 5 9 13 17 21 25 29 33 37 41 45 49
'73 - '75 1980
'81 - '82 '90 - '91
2001 '07 - current
Real Incomes Ex-Transfers From Onset of Recession
Source: BLS, NBER, Bloomberg Months
Richard Yamarone, [email protected], TEL: 212-617-8737
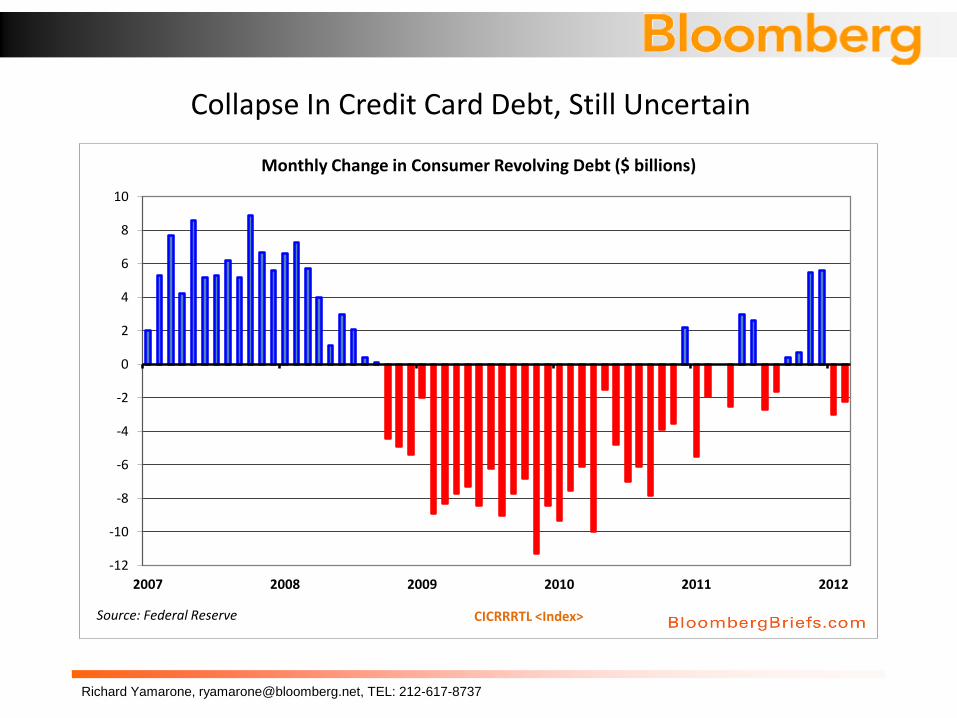
Collapse In Credit Card Debt, Still Uncertain
-12
-10
-8
-6
-4
-2
0
2
4
6
8
10
2007 2008 2009 2010 2011 2012
Monthly Change in Consumer Revolving Debt ($ billions)
CICRRRTL <Index> Source: Federal Reserve
Richard Yamarone, [email protected], TEL: 212-617-8737
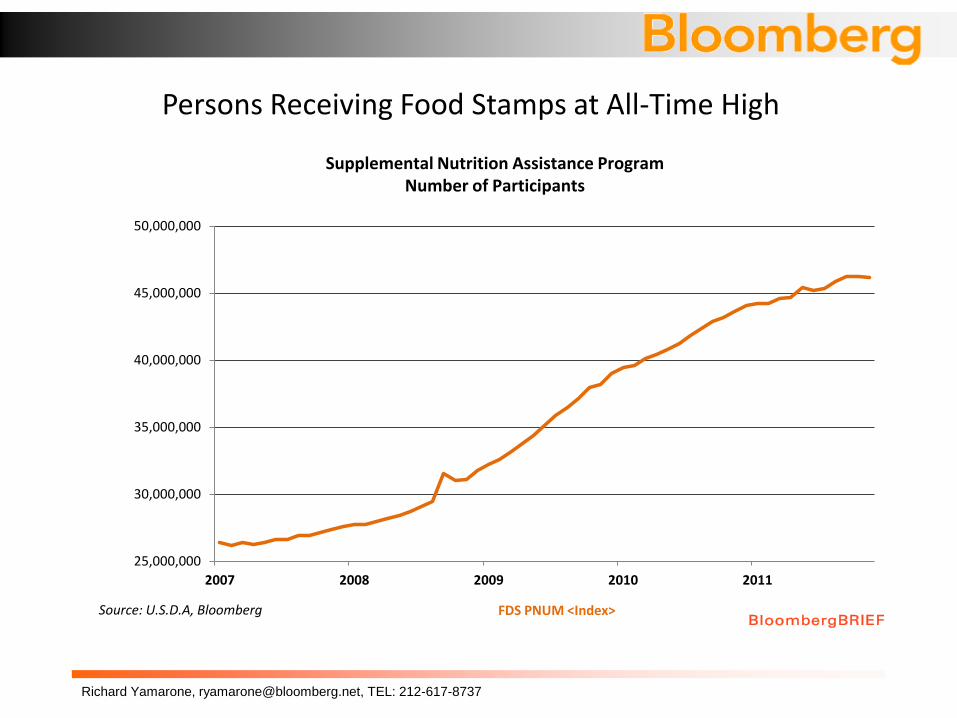
Persons Receiving Food Stamps at All-Time High
25,000,000
30,000,000
35,000,000
40,000,000
45,000,000
50,000,000
2007 2008 2009 2010 2011
Supplemental Nutrition Assistance Program Number of Participants
Source: U.S.D.A, Bloomberg FDS PNUM <Index>
Richard Yamarone, [email protected], TEL: 212-617-8737
There is No Holy Grail of Economic Indicators
Richard Yamarone, [email protected], TEL: 212-617-8737
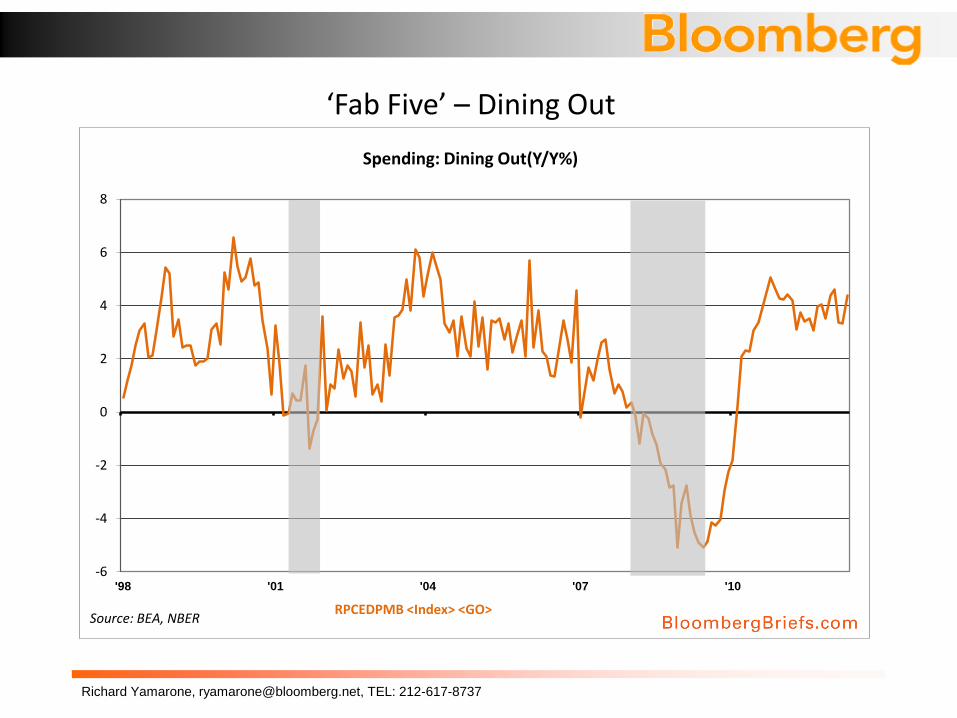
‘Fab Five’ – Dining Out
-6
-4
-2
0
2
4
6
8
'98 '01 '04 '07 '10
Spending: Dining Out(Y/Y%)
Source: BEA, NBER RPCEDPMB <Index> <GO>
Richard Yamarone, [email protected], TEL: 212-617-8737
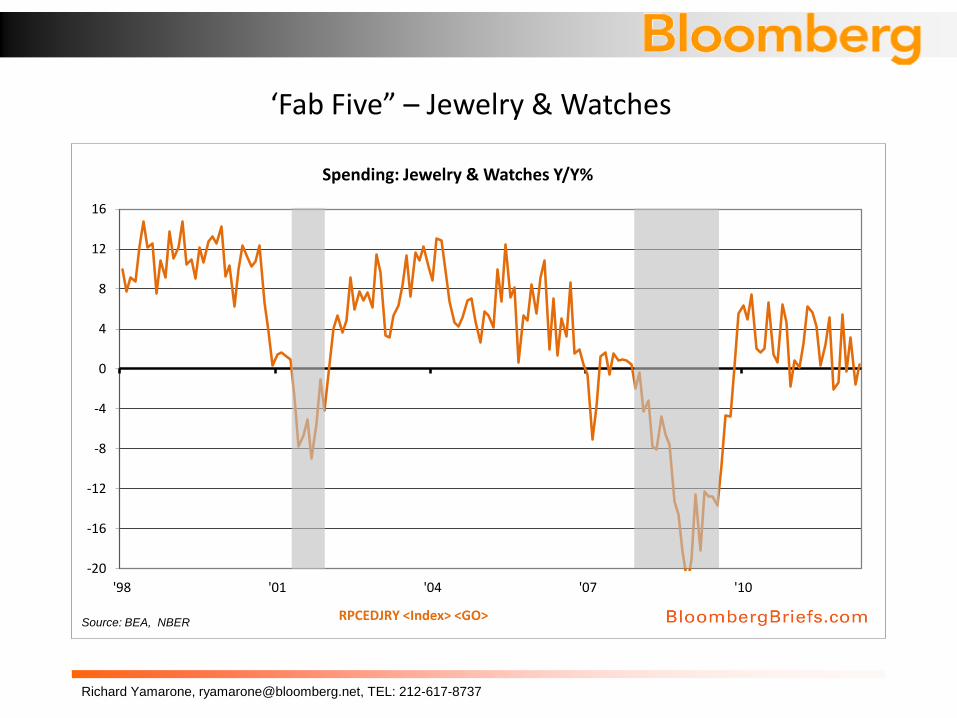
‘Fab Five” – Jewelry & Watches
-20
-16
-12
-8
-4
0
4
8
12
16
'98 '01 '04 '07 '10
Spending: Jewelry & Watches Y/Y%
Source: BEA, NBER RPCEDJRY <Index> <GO>
Richard Yamarone, [email protected], TEL: 212-617-8737
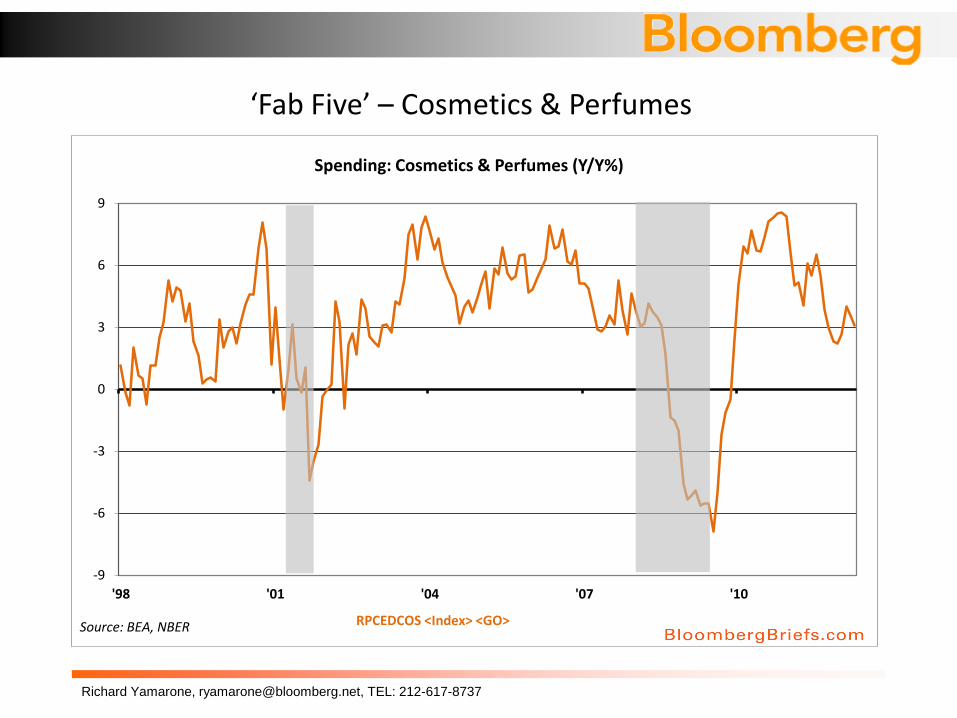
‘Fab Five’ – Cosmetics & Perfumes
-9
-6
-3
0
3
6
9
'98 '01 '04 '07 '10
Spending: Cosmetics & Perfumes (Y/Y%)
Source: BEA, NBER RPCEDCOS <Index> <GO>
Richard Yamarone, [email protected], TEL: 212-617-8737
Richard Yamarone, [email protected], TEL: 212-617-8737
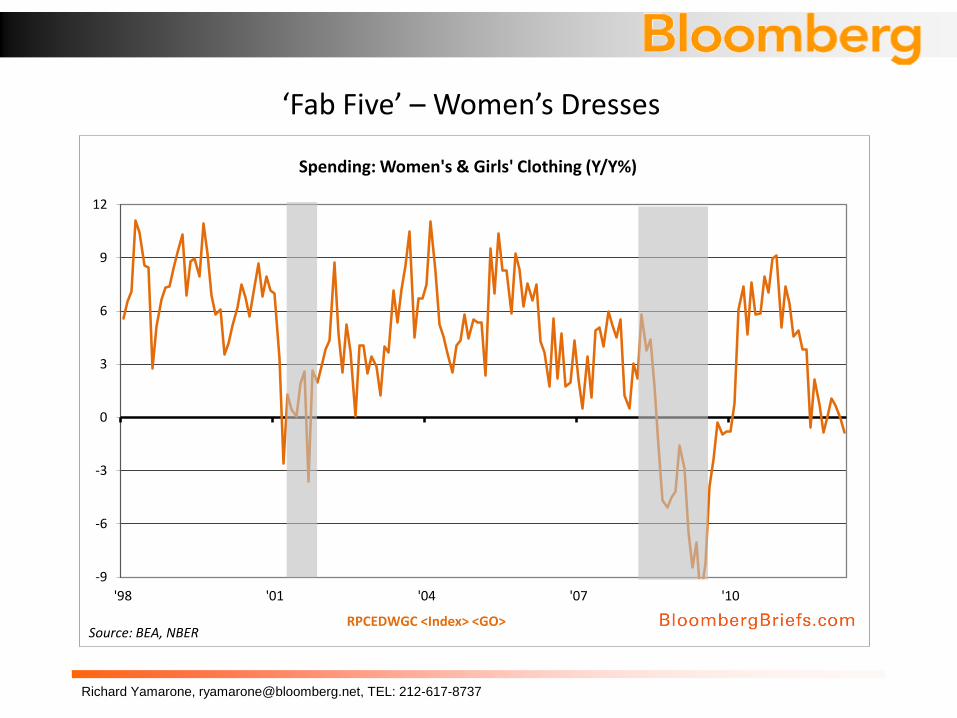
‘Fab Five’ – Women’s Dresses
-9
-6
-3
0
3
6
9
12
'98 '01 '04 '07 '10
Spending: Women's & Girls' Clothing (Y/Y%)
Source: BEA, NBER RPCEDWGC <Index> <GO>
Richard Yamarone, [email protected], TEL: 212-617-8737
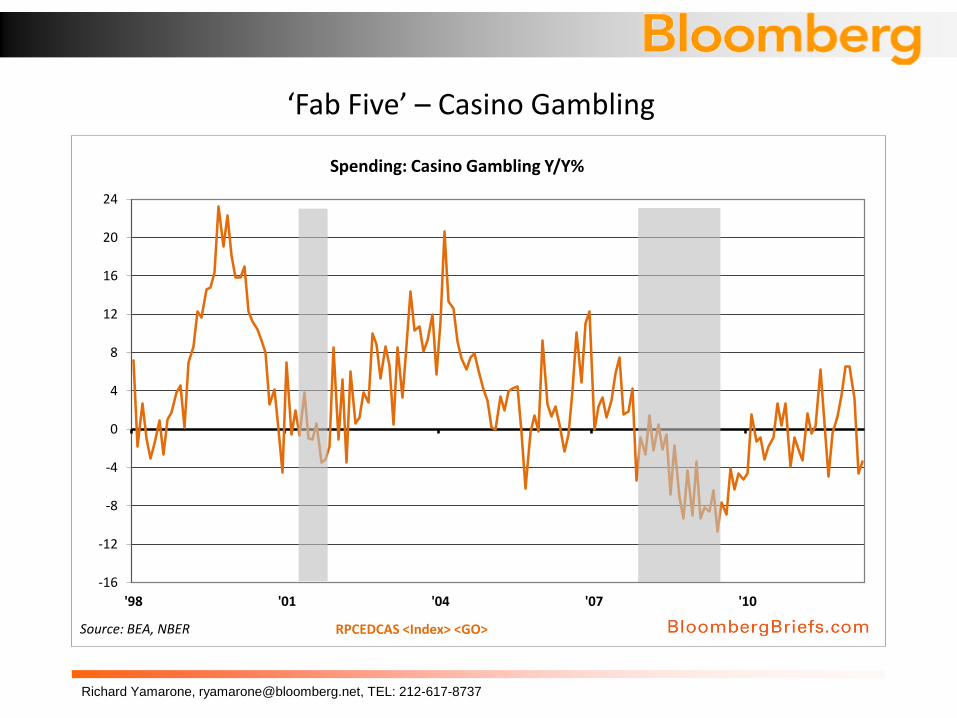
‘Fab Five’ – Casino Gambling
-16
-12
-8
-4
0
4
8
12
16
20
24
'98 '01 '04 '07 '10
Spending: Casino Gambling Y/Y%
Source: BEA, NBER RPCEDCAS <Index> <GO>

Richard Yamarone, [email protected], TEL: 212-617-8737
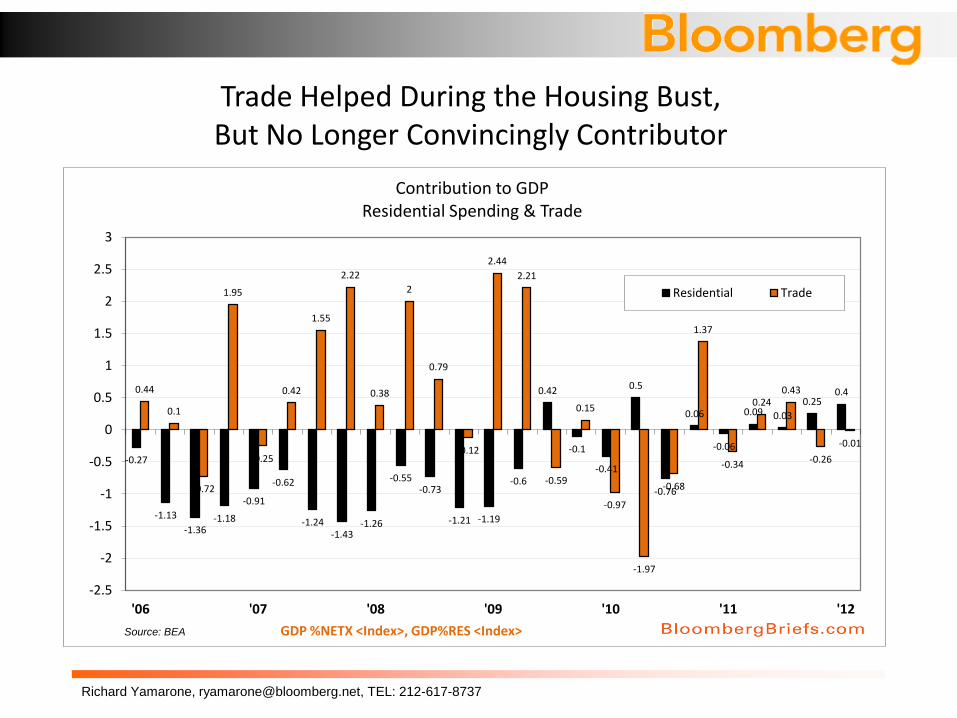
Trade Helped During the Housing Bust, But No Longer Convincingly Contributor
-0.27
-1.13
-1.36 -1.18
-0.91
-0.62
-1.24 -1.43
-1.26
-0.55 -0.73
-1.21 -1.19
-0.6
0.42
-0.1
-0.41
0.5
-0.76
0.06
-0.06
0.09 0.03
0.25 0.4 0.44
0.1
-0.72
1.95
-0.25
0.42
1.55
2.22
0.38
2
0.79
-0.12
2.44
2.21
-0.59
0.15
-0.97
-1.97
-0.68
1.37
-0.34
0.24 0.43
-0.26
-0.01
-2.5
-2
-1.5
-1
-0.5
0
0.5
1
1.5
2
2.5
3
'06 '07 '08 '09 '10 '11 '12
Contribution to GDP Residential Spending & Trade
Residential Trade
Source: BEA GDP %NETX <Index>, GDP%RES <Index>

Richard Yamarone, [email protected], TEL: 212-617-8737
Money Beginning to Enter Goods Market to ‘Chase too Few Goods’
200
300
400
500
600
700
800
900
2000 2001 2002 2003 2004 2005 2006 2007 2008 2009 2010 2011 2012
C& I Loans Large Commercial Banks ($blns)
Source: Federal Reserve, Bloomberg ALCBLCID <Index>
Richard Yamarone, [email protected], TEL: 212-617-8737
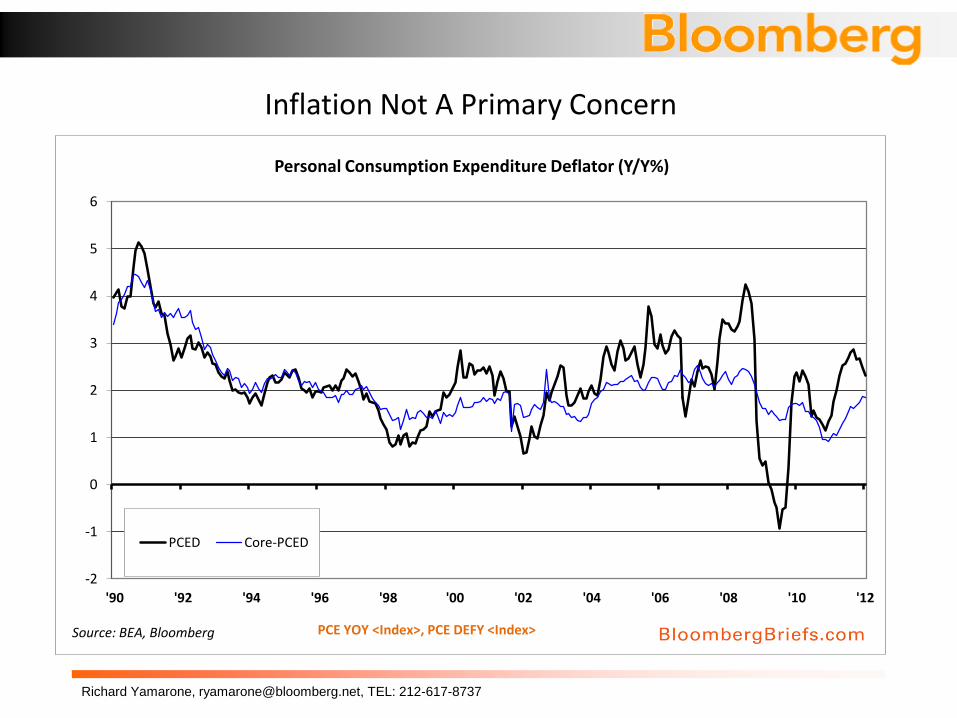
Inflation Not A Primary Concern
-2
-1
0
1
2
3
4
5
6
'90 '92 '94 '96 '98 '00 '02 '04 '06 '08 '10 '12
Personal Consumption Expenditure Deflator (Y/Y%)
PCED Core-PCED
Source: BEA, Bloomberg PCE YOY <Index>, PCE DEFY <Index>

Richard Yamarone, [email protected], TEL: 212-617-8737