ris of developing countries discussion papers - ips.lk · developing countries to globalization,...
TRANSCRIPT

Research and Information Systemfor Developing Countries
Core IV-B, Fourth FloorIndia Habitat CentreLodhi RoadNew Delhi-110 003, India.Ph. 91-11-2468 2177-80Fax: 91-11-2468 2173-74-75Email: [email protected]: http://www.ris.org.inWebsite: http://www.newasiaforum.org
RIS
RISDiscussion Papers
Research and Information Systemfor Developing Countries
RIS
RISRIS is a New Delhi-based autonomous policy think-tank supported
by the Government of India and devoted to trade and development
issues. Its work programme focuses on policy research and capacity
building on multilateral trade and financial negotiations, regional
economic cooperation in Asia, South-South cooperation, new
technologies and development, and strategic policy responses of
developing countries to globalization, among other issues. The
work of RIS is published in the form of research reports, books,
discussion papers, policy briefs and journals.
RIS has networked effectively with other prominent policy
think-tanks, government agencies, industry bodies and international
organizations in Asia and other parts of the world for collaborative
research and joint activities. It has a consultative status with
UNCTAD, and has been accredited to the Summit Meetings of
NAM and WTO Ministerial Conferences. It has conducted policy
research and other activities in collaboration with other agencies,
including UN-ESCAP, UNCTAD, UNU, Group of 77, SAARC
Secretariat, Asian Development Bank (ADB), the World Bank,
and the South Centre.
For more information about RIS and its work programme,
please visit its website: www.ris.org.in.
— Policy research to shape the international development agenda
A Think-Tankof Developing Countries
India-Sri Lanka BilateralFree Trade Agreement:
Six Years Performance and Beyond
Saman Kelegamaand
Indra Nath Mukherji
RIS-DP # 119

India-Sri Lanka BilateralFree Trade Agreement:
Six Years Performance and Beyond
Saman Kelegamaand
Indra Nath Mukherji
RIS-DP # 119
February 2007
Core IV-B, Fourth Floor, India Habitat CentreLodhi Road, New Delhi – 110 003 (India)
Tel: +91-11-2468 2177/2180; Fax: +91-11-2468 2173/74Email: [email protected]
RIS Discussion Papers intend to disseminate preliminary findings of the researchcarried out within the framework of institute’s work programme. The feedback andcomments may be directed to the author(s). RIS Discussion Papers are available atwww.ris.org.in

1
.
India-Sri Lanka Bilateral Free Trade Agreement:Six Years Performance and Beyond*
Saman Kelegama** and Indra Nath Mukherji***
Abstract: India-Sri Lanka Bilateral Free Trade Agreement signed in1998 was apioneering attempt in the direction of trade liberalization in South Asian region.This paper examines the performance of the Agreement in the first six years of itscoming into being and draws lessons from its success that could be relevant in thecontext of SAFTA and other such initiatives. Section 1 of the paper gives anoverview of the history of Indo-Lanka trade links and the birth of the Indo-SriLanka Bilateral Trade Agreement. It also talks about the conceptualization ofthe ILBFTA. Section 2 highlights the positive outcomes of the ILBFTA. Section 3highlights the negative outcomes and problematic areas that have caught theattention of the trade negotiators. Section 4 describes the steps taken and progressmade in moving the FTA towards a Comprehensive Economic PartnershipAgreement (CEPA). Section 5 discusses about lessons from six years of success.
1. Overview
1.1 History of Indo-Lanka Trade LinksTrade relations between Sri Lanka and India date back to pre-colonialtimes. Under British rule, trade between the two countries was geared tofulfil the needs of the colonial power in the occupying territory, and wasdominated by imports and exports in food-related items. Afterindependence in 1947 and 1948 for India and Sri Lanka respectively, bothnational governments adopted inward-looking policies centred on theconcepts of “self-reliance” and import substitution industrialization.Consequentially, a very modest level of trading took place between whatbecame two virtually closed economies. In 1977, Sri Lanka became thefirst South Asian country to liberalize its economy, opening it up to therest of the world. However, substandard products from India – the resultof excessive inward-looking policies – were not competitive against thegoods from East Asia that flooded the Sri Lankan market.
*This paper is based on a presentation made by the two authors at a seminar on the subjectorganized by the RIS on 20 April 2006 at RIS. The authors gratefully acknowledge theresearch assistance by Prathibashi Seneviratne, Project-Intern, IPS.**Executive Director, Institute of Policy Studies, Colombo, Sri Lanka.*** Professor, School of International Studies, JNU, New Delhi.
2 3
With partial liberalization of the Indian economy during the 1980s andfurther liberalization in 1991, trade began to pick up, particularly in favourof India. Between 1993 and 1996, there was a doubling of two-way trade,and between 1990 and 1996 imports of Indian goods to Sri Lanka grew by556 per cent. In 1995, India replaced Japan as the largest source of importsto Sri Lanka, accounting for 8-9 per cent of total imports. For Sri Lanka, itbecame evident that trade with the SAARC1 region ultimately amounted totrade with India owing to the sheer size of the latter’s rapidly emergingeconomy and expanding middle-class population. Hence, the perceivedmutual benefits of free trade between the two countries became increasinglyclear.2 Sri Lanka’s private sector – frustrated by the slow progress of theSAPTA3 to boost regional trade – pressurized the government to enter intoa free trade agreement (FTA) with the Indian government that would increasemarket access for Sri Lankan exporters.
1.2 Birth of the ILBFTA4
Politics was ultimately the major player in the move towards free trade. SriLanka entertained the hope of clearing away the political tensions of the1980s and engaging India’s assistance once more in solving the North/Eastconflict of the country. India was propelled by an immediate need to acquireSouth Asian markets following economic sanctions imposed on the countryfor the nuclear tests conducted in May 1998. Among other factors, thesepolitical forces led to the signing of the Indo-Sri Lanka Bilateral Free TradeAgreement (ILBFTA) on December 28, 1998.
Sri Lanka’s economic objectives were to increase trade ties withSouth Asia’s dominant economic power, to induce the transformationof Sri Lanka’s exports from low-value added goods to high value-addedgoods aimed at niche markets, and to provide low-income groups withcheap consumer imports from India (Kelegama, 1999). Moreover, SriLanka hoped to attract more export-oriented foreign direct investment(FDI) from third countries by promoting itself as an effective entrypoint into the Indian market. With the Board of Investment (BOI)being made a “one stop shop” in the early 1990s, Sri Lanka has longbeen a relatively appealing location for foreign investors compared toits more bureaucratized South Asian neighbours.
1.3 ConceptualizationThe conceptualization phase of the ILBFTA occurred between December1998 and March 2000, and was based on several previous studies andrecommendations.5 The agreement was intended to supersede the existingeconomic partnership under the SAARC, viz., SAPTA. Bilateral free tradeagreements are traditionally formulated using the “positive list” approach,whereby each participating country catalogues the individual commoditiesfor which it would grant preferences to the other. Nonetheless, owing tothe time-consuming nature of such a method, the ILBFTA was formulatedon the “negative list” approach; each country extending concessions/preferences to all commodities except those indicated in its “negative” list,namely items of a sensitive nature with regard to protecting nationalinterests. The two countries agreed for preferential treatment on 5112 tarifflines (by 6-digit HS Code). An 8-year time table was devised for phasingout tariffs. Non-tariff barriers, such as Indian State taxes and customs-level procedures (e.g., landing tax), were to be gradually removed as well.
Taking into account the asymmetry between the two countries, SriLanka was accorded special and differential treatment; the immediate duty-free list (319 items) and 50 per cent preferential duty list (889 items) wereconsiderably smaller than those offered by India (1,351 items and 2,799items, respectively), while the Sri Lankan negative list (1,180 items) wasconsiderably larger than India’s (196 items). Among others, the agriculturalsector of Sri Lanka was not subject to liberalization and was included inthe negative list. The majority of Indian exports were initially grantedonly a 35 per cent duty concession with an 8-year tariff reduction period,while Sri Lankan exports were granted a 50 per cent concession with a 3-year tariff reduction period. Moreover, Sri Lanka was granted the freedomto reduce its negative list at her comfort level, instead of a pre-determinedformula.
Rules of origin (ROO) criteria were also relaxed in Sri Lanka’s favour.Preferential treatment requires a minimum of 35 per cent domestic valueaddition, or 25 per cent when Indian inputs comprise 10 per cent. In addition,although the agreement does not feature revenue compensation, Sri Lankamaintained that tariff concessions would not be granted for high-duty

4 5
imports such as automobiles; import duties are an important source ofgovernment revenue and comprise 2 per cent of Sri Lankan GDP.
Some aspects of the agreement were deferred for subsequent negotiation;these include the number of entry ports, Indian state-level taxes, customsprocedures, and the specifics of phasing out non-tariff barriers.6 Theagreement included mechanisms for review and consultation, as well assettlement of disputes above and beyond the protection afforded to bothcountries under the safeguards clause. Table 1.1 records the progress madetill end-2005 in reducing tariffs.
The rest of the paper is organized as follows. Section 2 highlights thepositive outcomes of the ILBFTA. Section 3 highlights the negative outcomes
and problematic areas that have caught the attention of the trade negotiators.Section 4 describes the steps taken and progress made in moving theFTA towards a Comprehensive Economic Partnership Agreement(CEPA). Section 5 provides some concluding remarks. The analysis ofthe paper is confined to the 1999-2005 period.
2. Positive Outcomes
2.1 Trade Flows: View from Sri Lankan SourcesThe period 1999-2005 saw a surge in two-way trade; Sri Lanka’s exportsto India rose from 1 per cent to 9 per cent of total exports, while importsfrom India increased from 8.5 per cent to 20.7 per cent of total imports(see Table 2.1). The corresponding boom in preferential exports to Indiaunder the ILBFTA reaffirms the success of bilateral trade liberalization(see Table 2.3). By 2005 about 90 per cent of Sri Lankan exports to Indiaand 45 per cent of Indian exports to Sri Lanka came under the ILBFTA.Sri Lanka’s imports-to-exports ratio fell from 10.3:1 to 3.3:1, a relativelyfast decline compared to the five-year period prior to 2000 (see Table2.2).
The number of Sri Lankan export items to India increased from 505to 1,062, and a visible shift from agricultural products to manufacturinggoods was noted (Tables 3.1 and 3.2). In 2005, the main Sri Lankan exportsto India were: copper and copper products (28 per cent), vegetable fats/oil(26 per cent), Aluminium (8 per cent), spices (6 per cent), and electricalmachinery and equipment (5 per cent) (Table 3.2). India has been the 3rd
largest export destination since 2003, whereas it was 16th largest in 2000. Itis now Sri Lanka’s 3rd largest trading partner after the United States andthe European Union. A number of Sri Lankan firms producing bothindustrial and consumer goods have successfully entered the Indian marketwith the support of the FTA (see Table 2.4); products include value-addedtea, sausages, biscuits, chocolates, ceramics, furniture, metal products,footwear, wooden toys, memory chips, machinery and mechanicalappliances, and herbal products. Trade creation and a number of newproducts entering the Indian market from Sri Lanka were visible after theILBFTA (Mukherji et al., 2002).
Duty Concessions for Sri Lankan Exports to IndiaTariff Red- Tariff Lines Remarksuction 1998 2005100% 1,351 4,150
50% 2,799 0
50% - Tea 5 5 50% fixed tariff concession for imports of tea from
Sri Lanka(Annual maximum quota of 15 million
kilograms)
50% - 233 233 Garments covering Chapters 61&62 while remaining in theGarments negative list, will be given 50% tariff concessions on a fixed
basis, subject to an annual restriction of eight million pieces,of which six million shall be extended the concession only ifmade of Indian fabric. On utilization of the unrestrictedquota, an additional quota of 2 million pieces out of 8 millionpieces is permitted. The quota level per category is increasedfrom 1.5 million to 2 million pieces per category per year.
25% - 528 528 Concessions on Textile items restricted to 25% on ChaptersTextiles 51-56, 58-60, & 63. Four Chapters under the Textile sector
retained in the negative list (Chapters 50,57,61 and 62)
0% 196 196 Negative list
Duty Concessions for Indian Exports to Sri LankaTariff Red- Tariff Lines Remarksuction 1998 2005100% 319 1,208
50% 889 0
35% 2,724 2,724 Subject to 70% tariff reduction in 2006, and 100% in 2008
0% 1,180 1,180 Negative list
Table 1.1: Duty Concessions under the ILBFTA

Table 2.1: India’s Emergence as a Trading Partner (Share of Sri Lankan Trade)
Year % of Total Exports % of Total Imports
1986 1.0 4.3
1990 1.0 4.4
1994 0.7 8.5
1998 0.8 9.2
1999 1.0 8.5
2000 1.0 8.2
2001 1.5 10.1
2002 3.6 14.0
2003 4.8 16.1
2004 6.8 18.0
2005 8.9 20.7
Source: Sri Lanka Customs.
Table 2.2: Sri Lanka’s Trade with India (US $million)
Sources: 1. Sri Lanka Customs. 2. Central Bank of Sri Lanka, Annual Report, various issues.
Table 2.3: Preferential Exports to India under the ILBFTA
Year Exports % of preferential
(Rs. million) exports to India
2000 655 15.5
2001 1,423 22.1
2002 10,930 67.0
2003 15,820 68.0
2004 30,616 79.0
2005 31,089 74.0
Source: Department of Commerce, Sri Lanka, Country of Origin certificates.
Table 2.4: Sri Lankan Firms whose Products Entered the Indian Market
under the ILBFTA
Company Product
Ceylon Chocolates (Pvt) Ltd. Chocolate (Kanbar)
Edna Chocolates Chocolates
Maliban Biscuits
Prima Ceylon Ltd. Processed food
Keells Processed food
Mlesna Branded tea
DSI Rubber slippers / rubber products
Gloves Lanka (Pvt) Ltd. Knitted gloves
Lanka Walltiles Ceramic wall tiles
Damro Furniture
Eclar Toys Wooden toys
Tandon Associated Lanka (Pvt) Ltd. Dual inline memory modules
Skyspan Asia (Pvt) Ltd. Substitute to conventional roofing systems
Tantri Trailers Trailers / long vehicles
Link Natural Ayurvedic medicines
Source: Board of Investment (BOI) of Sri Lanka.
2.2 Trade Flows: View from the Indian SourcesThe data on trade flows from Indian source shows similar trends. Asmay be seen in Table 2.5. India’s trade with Sri Lanka has increasedbriskly since ILBFTA was signed between the two countries. Bothexports and import shares in relation to world exports and importsincreased. Further, since India’s imports from Sri Lanka increased fasterthan its exports to that country, the export to import ratio declinedfrom as high as 14.22 in 2000-01 to less than 3.72 per cent in 2004-05(Table 2.5). The main Indian exports to Sri Lanka were: automobiles/transport items (19 per cent), mineral fuels/oils (17 per cent), cotton (6per cent), iron and steel (5 per cent), machinery and mechanicalappliances (5 per cent), and pharmaceuticals (4 per cent).
Year Exports Imports Ex+Im Exports/ Imports/ Trade Balance Imports/US $ mn US $ mn US $ mn Total Trade Total Trade US $ mn Exports
1995 30.23 444.89 475.12 0.06 0.94 414.65- 14.721996 41.80 547.68 589.47 0.07 0.93 505.88- 13.101997 42.13 538.84 580.97 0.07 0.93 496.71- 12.791998 35.91 513.97 549.88 0.07 0.93 478.06- 14.311999 47.47 499.38 546.85 0.09 0.91 451.92- 10.522000 54.93 568.04 622.97 0.09 0.91 513.10- 10.342001 69.05 576.97 646.03 0.11 0.89 507.92- 8.362002 168.64 843.47 1,012.12 0.17 0.83 674.83- 5.002003 244.77 1,070.81 1,315.58 0.19 0.81 826.03- 4.372004 391.51 1,439.51 1,770.86 0.21 0.79 1,048.00- 3.682005 556.41 1,835.43 1,611.60 0.23 0.77 1,279.02- 3.30
6 7

8 9
Table 2.5: India-Sri Lanka and South Asian Trade: Value in US $ Million
1999- 2000- 2001- 2002- 2003- 2004-
2000 2001 2002 2003 2004 2005
India’s Exports to Sri Lanka
Export to 36822 44560 43827 52719 63843 48389.85
the World :
Exports to 499.27 640.14 630.89 920.98 1319.2 1355.23
Sri Lanka
(% Share of 1.36 1.44 1.44 1.75 2.07 2.80
World)
India’s Imports from Sri Lanka
Imports from the 49671 50536 51413 61412 78150 61937.79`
World
Import from 44.23 45.01 67.38 90.83 194.74 364.39
Sri Lanka
(% Share of World) 0.09 0.09 0.13 0.15 0.25 0.59
Export/Import 11.29 14.22 9.36 10.14 6.77 3.72
Ratio
Source: Customs data of India.
Table 2.6 gives the value as well as value share of productsoffered concessions by India to Sri Lanka in respect of differentcategories. It will be seen that in 1999 India imported US$ 4.4million of such products under the proposed duty free list from SriLanka.
After the offer of duty free concessions, India’s importsincreased to US$ 12.2 million in 2003. As a share of world imports,it increased from 0.29 per cent in 1999 to 0.50 per cent in 2003 ascan be seen in Figure 2.1. Even though the share trend is not verymarked, there remains considerable opportunity for India to furtherincrease its imports share from Sri Lanka in respect of such products. C
once
ssio
ns
No.
of
Par
tner
/19
9920
0020
0120
0220
0319
99-
Pro
duct
sSh
are
2003
Neg
ativ
e L
ist(
NL
)1
4W
orld
5650
865
095
9049
51
00
20
71
58
38
14
70
68
6S
ri L
anka
548
217
236
258
4525
5784
Shar
e (%
)0.
970.
330.
260.
262.
861.
23Z
ero
Dut
y(Z
D)
55
Wor
ld1
53
59
95
19
33
47
51
78
54
72
20
64
87
32
46
38
72
97
83
68
7S
ri L
anka
4477
1074
812
617
6218
1226
446
324
Shar
e (%
)0.
290.
560.
710.
30.
50.
47Te
a5
Wor
ld59
0897
7414
198
2577
113
891
6954
2S
ri L
anka
2014
1779
2469
981
682
7925
Shar
e (%
)34
.09
18.2
17.3
93.
814.
9111
.4Te
xtile
(TE
X)
35
Wor
ld3
50
34
03
32
59
15
25
95
43
89
56
25
50
89
52
14
93
42
Sri
Lan
ka82
694
012
2912
4328
1670
54Sh
are
(%)
0.24
0.28
0.23
0.32
0.51
0.33
Gar
men
t(G
AR
)5
Wor
ld19
3422
8322
2196
7415
2217
634
Sri
Lan
ka29
90
61
36
172
568
Shar
e (%
)15
.46
02.
750.
3711
.33.
22R
esid
ual(
RE
S)
205
Wor
ld53
6042
656
3615
263
6944
975
7291
410
6262
9635
5652
37S
ri L
anka
3104
526
332
4543
173
796
16
04
66
33
70
70
Shar
e (%
)0.
580.
470.
710.
971.
510.
95To
tal (
NL
+Z
D+
319
Wor
ld73
1111
179
7937
087
8778
910
1630
0113
8148
5748
0561
28Te
a+T
EX
+S
ri L
anka
3920
940
016
6204
382
532
18
09
25
40
47
25
GA
R+
RE
S)
Shar
e (%
)0.
540.
500.
710.
811.
310.
84To
tal (
ZD
+Te
a+30
5W
orld
7254
603
7914
275
8697
294
1006
2794
1365
6476
4758
5442
TE
X+
GA
R+
RE
S)S
ri L
anka
3866
139
799
6180
782
274
17
64
00
39
89
41
Shar
e (%
)0.
530.
500.
710.
821.
290.
84To
tal I
mpo
rts
332
Wor
ld49
7107
7451
3743
4351
9050
7061
1139
8177
1963
7929
1300
547
(All
Cat
egor
ies)
Sri
Lan
ka42
835
4369
666
127
8805
31
87
48
54
28
19
6Sh
are
(%)
0.09
0.09
0.13
0.14
0.24
0.15
Tab
le 2
.6:
Indi
a’s
Impo
rts
from
Sri
Lan
ka a
nd W
orld
und
er D
iffe
rent
Cat
egor
ies
(Val
ue in
‘00
0 U
SD
)
Sou
rce:
C
usto
ms
data
of
Indi
a.

Figure 2.1: India’s Imports from Sri Lanka under Zero Duty (%)
Source: Estimated using Customs data of India.
India’s imports of residual products as a group increased fromUS $ 31 million in 1999 to US $ 160 million in 2003. Its share inworld imports has also been increasing steadily from 0.58 per cent in1999 to 1.5 per cent in 2003. This increasing trend is shown in Figure2.2.
Unlike the increasing trends shown earlier, the value of India’s teaimports (after increasing in 2001) has been declining. India importedUS $ 2.0 million in 1999 but this declined to US $ 0.7 million in 2003.The share of Sri Lanka in India’s world tea imports declined from 34per cent in 1999 to 4.9 per cent in 2003. Figure 2.3 shows the trend.
Figure 2.2: India’s Imports from Sri Lanka under Residual (%)
10 11
Source: Estimated using Customs data of India.
India’s import of textiles from Sri Lanka increased from US $ 0.82million in 1999 to US $ 2.8 million in 2003. During this period its share inworld imports increased from 0.24 per cent to 0.51 per cent. This trend ispresented in Figure 2.4.
Source: Estimated using Customs data of India.
India did not show any positive inducement to buy garments from SriLanka. In fact, its garment imports declined from US $ 0.30 million in1999 to US $ 0.17 million in 2003. The declining share of India’s garmentimports from Sri Lanka is shown in Figure 2.5.
y = 0.016x + 0.424R2 = 0.02
0
0.2
0.4
0.6
0.8
1999 2000 2001 2002 2003
Year
Per
cen
t
y = 0.236x + 0.14R2 = 0.8109
0
0.5
1
1.5
2
1999 2000 2001 2002 2003Year
Per
cen
t
Source: Estimated using Customs data of India.
y = -7.275x + 37.505
R2 = 0.8747
0
5
10
15
20
25
30
35
40
1999 2000 2001 2002 2003Year
Per
cent
y = 0.058x + 0.142R 2 = 0.6454
0
0.1
0.2
0.3
0.4
0.5
0.6
1999 2000 2001 2002 2003Year
Figure 2.4: India’s Imports from Sri Lanka : Textile (%)
Figure 2.3: India’s Imports from Sri Lanka : Tea (%)

12 13
Figure 2.5: India’s Imports from Sri Lanka : Garment (%)
Source: Estimated using Customs data of India.
The products under Negative List have not been offered tariffpreferences and hence were not expected any positive impact on Indianimports from Sri Lanka. However the data reveals that that India’s importsunder this list declined steadily from 1999 to 2002 but shot up from 2002to 2003. Hence over the period the import value increased from US $ 0.54million in 1999 to US $ 4.5 million in 2003 as shown in Figure 2.6.
Figure 2.6: India’s Imports from Sri Lanka under Negative List (%)
Source: Estimated using Customs data of India.
The value of products imported under all categories increased from US$ 39 million in 1999 to US $ 181 million in 2003. The increasing share inworld imports is shown in Figure 2.7. This share increased in spite offalling shares in case of tea and garments.
Figure 2.7: India’s Imports from Sri Lanka : All Categories (%)
Source: Estimated using Customs data of India.
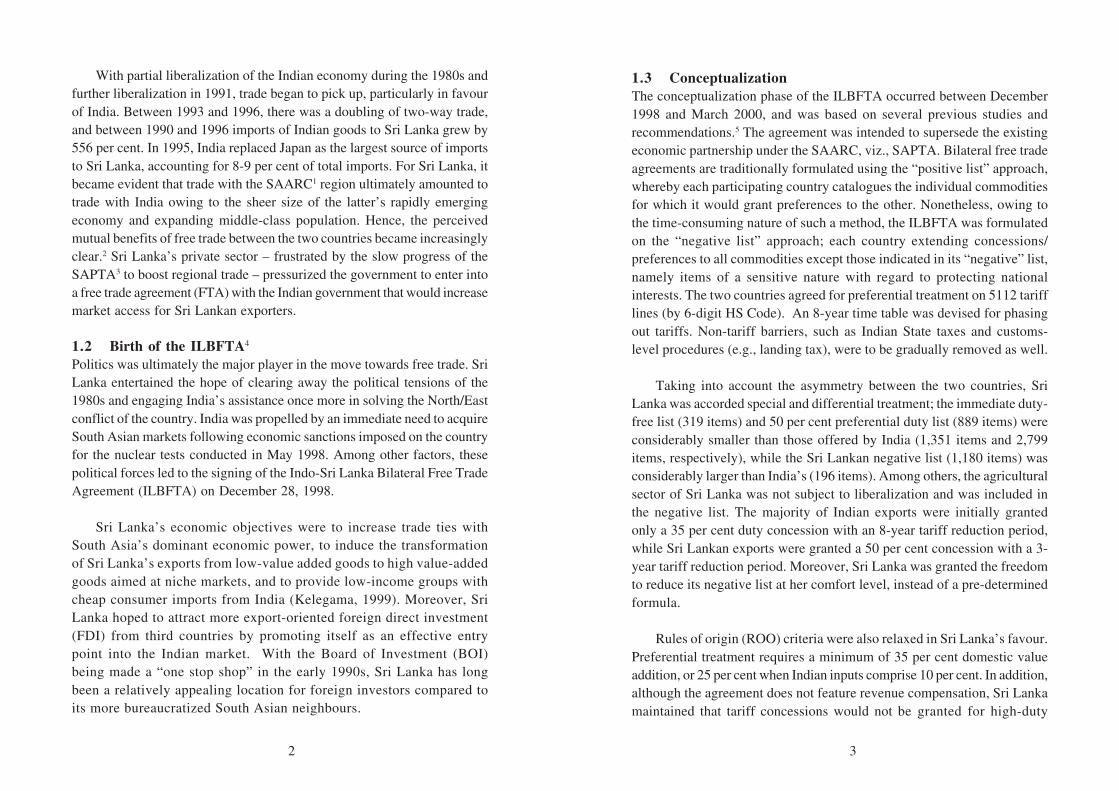
Now we turn to examine whether Sri Lanka has been able to increaseits share of Indian imports in relation to world imports for products offeredconcessions by it. In this case we have data for 1999, 2001 and 2002. Thetrend for all categories is shown in Table 2.7.
With respect to duty free products we notice that Sri Lanka’s importsfrom India increased from US $ 3.49 million in 1999 to US $ 3.83 millionin 2002. This reflected an increasing share from 36.88 per cent in 1999 to43.70 per cent in 2003. Figure 2.8 illustrates this trend.
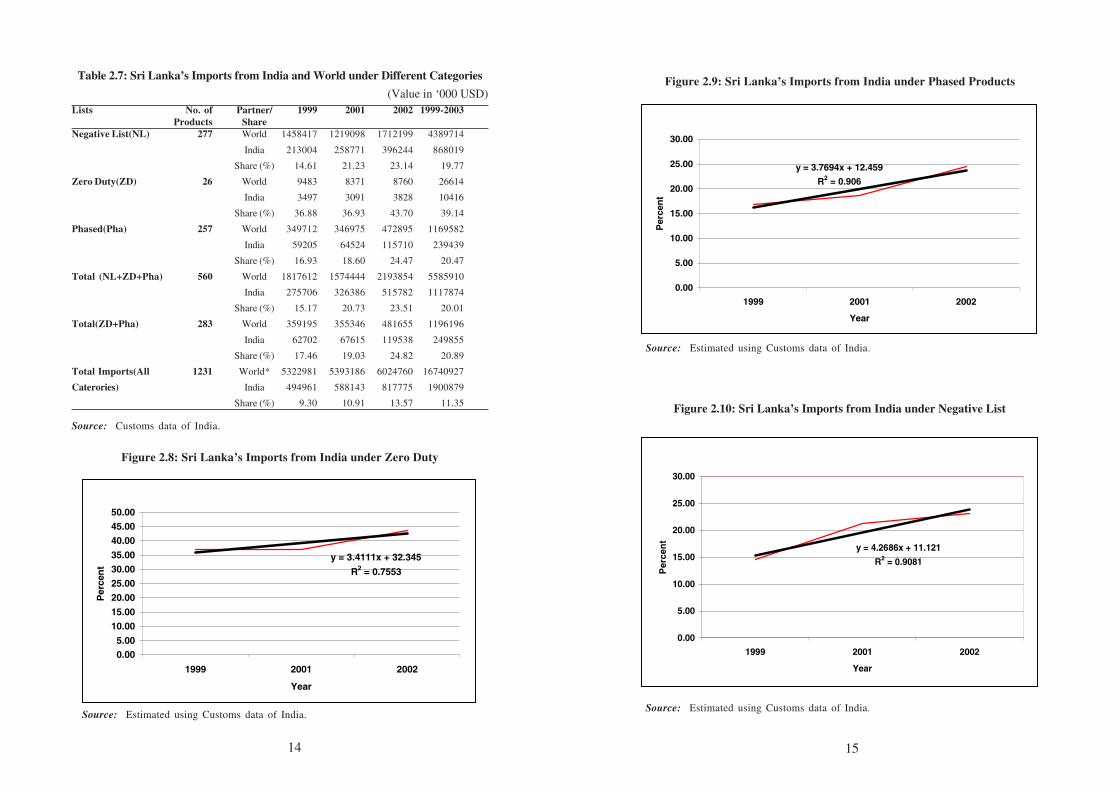
Sri Lanka’s imports of phased products increased from US $ 59.20million in 1999 to US $ 115.71 million in 2002. This reflected anincreasing share from 16.93 per cent in 1999 to 24.47 per cent in 2003as may be seen in Figure 2.9.
It is interesting to note that even in the case of products underNegative List Sri Lanka’s imports from India increased significantlyfrom US $ 213 million in 1999 to US $ 396 million in 2002. Thisreflected an increasing share in relation to world imports from 14.61per cent in 1999 to 23.15 per cent in 2002. Figure 2.10 illustrates thistrend.
y = -0 .79 5x + 8 .3 61R 2 = 0 .03 23
0
2
4
6
8
10
12
14
16
18
19 99 2 00 0 20 01 20 02 2 003
Ye ar
y = 0.3699x - 0.1739R 2 = 0 .2752
0.00
0.50
1.00
1.50
2.00
2.50
3.00
1999 2000 2001 2002 2003Year
y = 0.1857x + 0.2159
R2 = 0.8141
0.00
0.20
0.40
0.60
0.80
1.00
1.20
1.40
1999 2000 2001 2002 2003
Year
Per
cent
14 15
Figure 2.10: Sri Lanka’s Imports from India under Negative List
Lists No. of Partner/ 1999 2001 2002 1999-2003Products Share
Negative List(NL) 277 World 1458417 1219098 1712199 4389714
India 213004 258771 396244 868019
Share (%) 14.61 21.23 23.14 19.77
Zero Duty(ZD) 26 World 9483 8371 8760 26614
India 3497 3091 3828 10416
Share (%) 36.88 36.93 43.70 39.14
Phased(Pha) 257 World 349712 346975 472895 1169582
India 59205 64524 115710 239439
Share (%) 16.93 18.60 24.47 20.47
Total (NL+ZD+Pha) 560 World 1817612 1574444 2193854 5585910
India 275706 326386 515782 1117874
Share (%) 15.17 20.73 23.51 20.01
Total(ZD+Pha) 283 World 359195 355346 481655 1196196
India 62702 67615 119538 249855
Share (%) 17.46 19.03 24.82 20.89
Total Imports(All 1231 World* 5322981 5393186 6024760 16740927
Caterories) India 494961 588143 817775 1900879
Share (%) 9.30 10.91 13.57 11.35
Table 2.7: Sri Lanka’s Imports from India and World under Different Categories
(Value in ‘000 USD)
Source: Customs data of India.
y = 3.4111x + 32.345
R2 = 0.7553
0.005.00
10.0015.00
20.0025.0030.0035.00
40.0045.0050.00
1999 2001 2002
Year
Per
cen
t
Figure 2.8: Sri Lanka’s Imports from India under Zero Duty
Source: Estimated using Customs data of India.
y = 3.7694x + 12.459
R2 = 0.906
0.00
5.00
10.00
15.00
20.00
25.00
30.00
1999 2001 2002
Year
Per
cen
t
Figure 2.9: Sri Lanka’s Imports from India under Phased Products
Source: Estimated using Customs data of India.
y = 4.2686x + 11.121
R2 = 0.9081
0.00
5.00
10.00
15.00
20.00
25.00
30.00
1999 2001 2002
YearP
erce
nt
Source: Estimated using Customs data of India.

estimated investment of Rs. (SL) 12.5 billion. The principal sectors aresteel, cement, rubber products, tourism, computer software, IT training,textiles and garments, food products, automobile components, plaitsproducts, construction, chemicals, electrical equipment, printing, shipping,financial and non-financial services.
During past six years, leading Indian companies such as Gujrat Ambuja,Indian Oil, Apollo Hospitals, Asian Paints, Larsen and Toubro, CEAT, TajHotels, Mudra Communications, National Diary Development Board, AshokLeyland, Exide Industries, Tata Tea, Cadila Pharmaceuticals, Ansal Housing,Arvind Mills, etc., have committed substantial investments. The signing ofILBFTA gave further impetus for Indian companies to set up their venturesin Sri Lanka with a view to buy back for the duty free Indian market,particularly in southern India. Such investment flows contributed in nosmall measure in promoting entry of products made in Sri Lanka to theIndian market. Prominent among them were copper, vanaspathi, bakeryshortening/ margarine and marble industries.
Table 2.8 Top Ten Countries Ranked by Cumulative FDI in Sri Lanka, 2000-2003
(US $ million)
2000 2001 2002 2003
Country $ Mn. Country $ Mn. Country $ Mn. Country $ Mn.
Singapore 273 UK 290 UK 329 UK 354
UK 260 Singapore 253 Singapore 237 Singapore 283
Japan 244 Japan 209 Japan 204 Japan 205
Korea 190 Korea 165 Hong Kong 137 Hong Kong 193
Hong Kong 150 Hong Kong 126 Korea 161 Australia 185
Sweden 99 Australia 107 Australia 140 Korea 155
Australia 96 Sweden 83 USA 113 USA 135
Br. Virgin Is. 55 USA 63 India 89 India 115
Netherlands 52 India 53 Sweden 48 Netherlands 68
Finland 52 Finland 45 Netherlands 43 Sweden 53
16 17
Sri Lanka’s imports of all categories (excluding residual products) fromIndia increased from US $ 275 million in 1999 to US $ 516 million reflectingan increasing share from 15.17 per cent to 23.51 per cent during the sameperiod. This is illustrated in Figure 2.11.
Source: Estimated using Customs data of India.
The Indian imports that recorded maximum growth in recent years,namely automobiles/transport items and mineral fuels/oils are in the SriLankan negative list. As stated, these are not subjected to tariff preferencesdue to revenue considerations.7 However, the rapid increase in imports toSri Lanka of the items in the negative list calls for serious examination ofmaintaining its status quo. A gradual phasing out of the negative list so as tokeep it to a bare minimum may be considered.
2.3 InvestmentWhile the exchange of tariff preference no doubt induced the acceleratedflow of bilateral trade between the two countries, the more rapid increase inSri Lankan exports to India had also much to do with the emergence of SriLanka as a production and profit centre for Indian companies seeking accessto regional and global markets. Over 50 per cent of Indian joint venturesand wholly owned subsidiaries in the South Asian region are located in SriLanka. The inflow of direct investment from Indian companies began in thewake of Sri Lanka’s economic liberalization programme during the 1980s.By the end of June 2000 the number of Indian projects stood at 120 with an
y = 2.1375x + 6.9841R2 = 0.9799
0.00
2.00
4.00
6.00
8.00
10.00
12.00
14.00
16.00
1999 2001 2002
Year
Per
cen
t
Figure 2.11: Sri Lanka’s Imports from India
Source: Board of Investment (BOI) of Sri Lanka (reproduced from Thenuwara, 2005).

18 19
India is now amongst the top 5 foreign investors in Sri Lanka afterbeing in 9th place in 2001 (see Tables 2.8, 2.9 and 2.10). 40 Indianmanufacturing projects are currently operating in the country as a resultof investment driven by the FTA (Table 2.11). Sri Lanka’s access tothe Indian market, together with its conduciveness to investment, hasattracted more third-country investors also (Thenuwara 2005). However,Indian investment in Sri Lanka is still less than 1 per cent of India’stotal investment overseas (which stood at US $ 9.6 billion in 2005). Incontrast to Indian investment in Sri Lanka, Sri Lankan investment inIndia is small. Food processing, furniture, textiles, freight andforwarding are among them. Some prominent Sri Lankan investmentsin India are Ceylon Biscuits, Damro and Brandix. It is reported thatBrandix is investing US $ 650 million in setting up a textile/garmentcity in Vizag.
Table 2.9: Top Ten Countries Ranked by Foreign Investment*, 2004-2005
(Projects approved under Section 17 of the BOI Law)8
2004 2005*
Rank Country** No. of Investment Country** No. of Investment
Projects (Rs. Million) Projects (Rs. million)
1 UK 108 21,673 Malaysia 21 24,418
2 Singapore 44 20,752 USA 67 23,688
3 USA 62 19,032 UK 126 22,879
4 India 101 14,846 Singapore 50 20,966
5 Malaysia 17 13,844 India 102 19,471
6 Hong Kong 56 12,928 Hong Kong 55 12,655
7 UAE 17 12,744 Korea 92 12,361
8 Korea 94 8,049 UAE 20 11,553
9 Switzerland 19 7,686 Switzerland 20 8,075
10 Japan 63 6,244 Japan 66 6,096
Source: Board of Investment (BOI) of Sri Lanka.
Note: 2004-2005 based on current investment country.
* Realized (cumulative) foreign investment as at year end.
** Investment where country specified is involved (100% owned foreign & joint venture
projects).
Table 2.10: Foreign Direct Investment of BOI Enterprises during 2005 – by Country
(Projects approved under Section 17 of the BOI Law)
No. Country No. of Projects US $ million
1 Malaysia 8 99.556
2 Singapore 12 30.626
3 UK 33 26.338
4 India 19 17.855
5 Luxemburg 4 17.312
6 Hong Kong 12 15.468
7 U.S.A 16 12.662
8 Italy 5 10.563
9 Sweden 6 10.130
10 Belgium 2 8.382
11 Others (less than 8 million) 18 38.312
Total 199 287.204
Source: Board of Investment (BOI) of Sri Lanka.
Table 2.11: Manufacturing Projects in Sri Lanka related to ILBFTA (2005)
Products Country No. in operation
Copper and copper-based products India/UAE 10
India/UAE
Vanaspati (vegetable oil) Singapore/Malaysia/ 09
Sri Lanka
Electric and electronic products India/USA 07
Lead and lead-based products India 02
Zinc oxide India 01
Other chemicals and chemical-based products India/USA/Sri Lanka 03
Marble products India 03
Pine resins India 02
Rubber-based sports goods India 01
Ghee from milk cream India 01
Diamond cutting tips India 01
Total 40
Source: Board of Investment (BOI) of Sri Lanka.Note: UAE – United Arab Emirates.

20 21
2.4 ServicesThe natural linkages between goods and services opened up a number of servicesectors to bilateral trade in the aftermath of increased goods flows. Unilateralliberalization of FDI in various services have opened the door for variousIndian services to invest in Sri Lanka such as the ones listed in Table 2.12.Retailing and distribution – although a “sensitive” area that neither India norSri Lanka liberalized under the GATS during the Uruguay Round of WTOtalks – now makes up a significant component of services trade between thetwo countries, mainly through franchise arrangements. Such franchise led retailservices are Titan, Usha, Godrej, Bajaj, etc. from India and Damro (pre-fabricated furniture), Noritake porcelain and Dankotuwa porcelain, etc., fromSri Lanka. Although FDI in retailing in not permitted in India, initiatives bythe Export Development Board of Sri Lanka (EDB) with Reserve Bank ofIndia (RBI) made way for Sri Lankan firms to engage in exhibition-cum-retail sale for a brief period during 2004-2005.
In early 2002, the tourism sector was given a boost when Sri Lanka took theunilateral measure of granting visas upon arrival to Indian tourists. Since then,the largest number of tourist arrivals to the country has been from India(sometimes coming a close second to UK or Germany). In a reciprocal gesture,India granted 4 additional destinations to Sri Lankan Airlines. Now with atotal of 10 destinations, tourist flows from Sri Lanka to India have also risensignificantly.9 With 94 weekly flights to India, Sri Lankan Airline is today thelargest foreign airline operating into India and 42 per cent of the Airline’srevenue comes from Indian operations.
Table 2.12: Indian Service Suppliers in Sri Lanka
Sector Service suppliersHealth Apollo Hospital
Escorts Heart Centre at Durdans HospitalHotels and restaurants Taj Hotels
Barista (fast food/coffee outlets)Amaravathi (restaurant)
Air travel Jet AirwaysAir Sahara
Retailing/distribution Indian Oil CompanyTitan (watches)Usha (electrical appliances)Godrej (consumer durables)Bajaj (three wheelers/scooters)
3. Negative Outcomes: Perceptions in India and SriLanka
3.1 Lopsided TradeThe perception that trade growth under the FTA has been far from uniformamongst industries is shared both in Sri Lanka and in India. Nearly 50 percent exports from Sri Lanka to India is restricted to copper and vanaspati (ahydrogenated vegetable oil similar to ghee). 2005 showed a greaterasymmetry in the distribution of exports compared to 1999 (see Tables 3.1and 3.2). This is reflected in the uneven distribution of preferential exportsunder the FTA (Table 3.3). Of the 1,351 items that were initially granted100 per cent duty concessions by India, only 68 have been of export interestto Sri Lanka.10 If copper, vanaspati, bakery shortenings and marble wereremoved from the export items, Sri Lanka’s trade deficit with India mayratio-wise have shown an increase rather than a decrease.
Table 3.1: Sri Lanka’s Main Exports to India in 1999
Products Value Rs. million Percentage
Pepper 695 20.30
Areca nut 382 11.15
Waste and scrap of alloy steel 272 7.94
Dried fruit 214 6.25
Cloves 199 5.81
Waste paper & paper board 191 5.57
Glycerol 181 5.28
Apparel & clothing accessories – plastic 149 4.35
Black tea in bulk 146 4.26
Nutmeg 81 2.36
Source: Department of Commerce, Sri Lanka.
One reason for lopsided trade in Sri Lankan perception is that manyexport items are subjected to para-tariffs such as port charges, and non-tariff barriers (NTBs) such as discriminatory sales taxes, which more orless erode the preferential margins granted by the FTA.11 For instance, SriLankan exporters complain of difficulties rising from entry tax and salestaxes in the southern state of Tamil Nadu; whereas local manufacturers payonly 10.5 per cent in sales tax, Sri Lankan products are charged at the

Table 3.2: Sri Lanka’s Main Exports to India in 2005
Product Value Rs. million Percentage
Copper and Copper products 15,590 27.74
Vegetable fats and oil – Vanaspati 12,321 21.92
Aluminium Products 4,534 8.07
Electrical Machinery and Parts 2,304 4.10
Antibiotics 2,279 4.06
Cloves 1,659 2.95
Iron & Steel Products 1,511 2.69
Pepper 1,088 1.94
Pulp 1,077 1.92
Fibre board of wood etc. 1,034 1.84
Source: Department of Commerce, Sri Lanka.
22 23
higher rate of 21 per cent. The Indian government maintains that goodsfrom other parts of India are too subjected to Tamil Nadu’s higher tax rate,a corollary of India’s federal structure that grants autonomous powers tostate governments.
Table 3.3: Top Ten Export Items under Preferential Tariffs (2003)
Product Value Rs. million Percentage
Copper-related products 11,820 51.71
Waste paper 968 4.23
Black pepper 818 3.58
Dual Inline memory Modules 808 3.53
Cloves 387 1.70
Iron scrap 332 1.45
Tyres 290 1.27
Furniture 141 0.62
Rice bran 131 0.57
Marbles 122 0.53
Source: Department of Commerce, Sri Lanka.
However, not all market access barriers are erected by India. Sri Lankanexporters have been held back by their own lack of aggression in pursuingthe many opportunities offered to them by the agreement. The Sri Lankanmindset is somewhat constrained by the traditional export bias towards
developed nations in the West, resulting in the unfortunate failure to perceivethe immense market potential in India’s growing middle class of 350 million– larger than the entire population of the United States.
3.2 Rules of OriginA major Indian perception is that non-compliance with rules of origin(ROO) by exporters from Sri Lanka has somewhat undermined the spiritof free trade. Customs officials are not always able to detect the nationalorigin of a product; this is especially true of spices, such as cloves andpepper. Goods from third countries have illegally entered duty-freeinto India via Sri Lanka, prompting demands from Indian entrepreneursto clamp down on free trade and revert to protectionist policies. Peppergrowers in India, for instance, allege that the surge in pepper importsfrom Sri Lanka has led to falling prices, to the detriment of domesticproducers.12 Growers have demanded quotas on imports in addition torestricting entry to a single port, preferably Kochi, to facilitate theenforcement of ROO.
Sri Lanka, on the other hand, maintains that the existing rules oforigin are too stringent and obstruct free trade, especially when coupledwith para-tariffs and non-tariff barriers (NTBs). Under the 35 per centrule, 74 per cent of non-garment exports and 46 per cent of garmentexports qualified for the Indian market (Department of Commerce ascited in Kelegama, 1999). Ready-made garments (RMGs), althoughgranted duty concessions, are subjected to the condition that Sri Lankarestricts exports to 8 million pieces with at least 6 million manufacturedfrom Indian fabric inputs. The remaining 2 million, although favouredunder relaxed ROO, are nevertheless subjected to various NTBs.Consequently, Sri Lankan garments are more expensive than thoseproduced in India and exporters have failed to gain a foothold in theIndian market; at present, less than 1 per cent of the quota is beingutilized. Similarly, a quota of 15 million kilograms is imposed withstrict ROO on tea exports with entry ports limited to Kochin and Kolkata.Section 3.3 elaborates the ROO issue in regard to tea. Less than 1 percent of total Sri Lankan tea exports make their way to India, amountingto a meagre 2.7 per cent of the quota.

24 25
Table 3.4: Sri Lankan Exports of Garments to India, 2003-2005
Year HS 61 HS 62 Total Value % Share ofRs. million Total Garment
Quantity Value Quantity Value Exports
Rs. million Rs. million
2003 2,953 kg 11.16 2,819 kg 33.06 44.22 0.02
39,067 pieces 42,441 pieces
2004 1,851 kg 16.75 1,222 kg 30.32 47.07 0.02
66,742 pieces 26,386 pieces
2005 37,970 kg 22.95 544 kg 28.37 51.32 0.02
16,533 pieces 47,183 pieces
Source: Sri Lanka Customs.Note: HS 61– apparel, knitted or crocheted; HS 62 – apparel, not knitted or crocheted.Annual apparel quota for Sri Lanka – 8 million pieces.
Table 3.5: Sri Lankan Exports of Tea to India, 2005
Product Quantity Value
(metric tonnes) (Rs. Million)
Green Tea 7.26 2.10
Black tea (packs not exceeding 101.18 43.65
3 kg)
Black Tea – bulk 290.46 64.39
Instant tea 4.70 0.25
Total 403.60 110.39
Source: Sri Lanka Customs.Note: Quota allocation for Sri Lanka – 15 million kg of tea per annum Quota utilization– only 2.69% (based on total exports).
3.3 Problems and Issues on Trade Flows and the InvestmentRegimeThe surge in certain import items from Sri Lanka has caused considerabledistress amongst Indian domestic manufacturers unable to compete withcheaper foreign goods. A number of issues have been raised at recent meetingsbetween the two parties and have been the subject of intense dispute. Tariffrate quotas (TRQs), initially applied only to tea and garment exports, havefound their way back to the negotiating table with India requesting export
caps on several products. We highlight below some TRQ issues and otherissues that have disturbed the smooth progress of the ILBFTA.
a) VanaspatiThe FTA gave licence to substantial trade deflection in the vanaspati oilindustry, to the benefit of Sri Lanka and detriment of India. Vanaspati oilis refined from palm oil inputs which are imported from East Asia underduty free conditions to Sri Lanka (by industries coming under the BOI) butunder a hefty 80 per cent duty rate to India. Consequently, several Indianmanufacturers relocated their refineries to Sri Lanka and profited fromexporting the finished product to India under the duty free privileges of theFTA. This led to a surge in exports of vanaspati from Sri Lanka to India(adding to India’s woes are duty-free imports from Bangladesh, Bhutanand Nepal as well). As a result, vanaspati and bakery shortening/margarine(a close substitute to vanaspati, but with its own customs code: 1516) importsto India rose from 10,000 metric tonnes in 2004 to 170,000 metric tonnesin 2005 from 14 factories operating in Sri Lanka and earning Rs. (SL) 13.6billion in 2005.13 Indian manufacturers claim that 120 of the 260 vanaspatimanufacturing units in the country have shut down.14
Sri Lanka acquiesced with India’s request to restrict vanaspatimanufacturing to 10 factories and cap exports at 250,000 metric tonnesannually. However, in early 2006 India re-fuelled the dispute by demandingthat shipments of both vanaspati and bakery shortenings/margarine berestricted even further to 100,000 metric tonnes per year, a move whichwas resisted by Sri Lanka. Manufacturers in Sri Lanka claim that, with anaverage output of 3,500-4,500 metric tonnes per month, even the quota of250,000 per annum can easily be fulfilled within six months.15 In early2006, Sri Lanka did attempt to alleviate India’s concerns by imposing aspecial import levy of US $25 per metric tonne of crude palm oil, which isalso an input for bakery shortenings. Nevertheless, India has found thesemeasures to be inadequate; in early June 2006, citing mounting social unrestamong domestic industrialists; India imposed a quota of 250,000 metrictonnes per annum and canalized vanaspati imports by permitting only thestate-run National Agricultural Marketing Federation (NAFED) to importvanaspati from Sri Lanka. In Sri Lanka’s view, such rigorous safeguard

26 27
measures are potentially damaging to the credibility of the BOI and theprospect of attracting future foreign investment to the country.16 Moreover,it is of the view that such measures are contrary to the spirit of an FTA. Arequest was made to remove these restrictions. Manufacturers in Sri Lankanclaimed that 4,000 jobs in the industry were at stake.17 Both sides attemptedto work towards a mutually advantageous solution during June-December2006.18 During this period hardly any vanaspati /bakery shortenings wereexported to India.
One main grouse of the Indian vanaspati manufacturers is that the ROOcriteria in ILBFTA is that this specifies value addition criterion only and notminimum local raw material content. As such it is very easy to qualify forpreferential entry to the Indian market since labour content can easily be inflated.In addition, the local manufacturers under-invoice their exports to easily qualifyfor the ROO criteria. The Indian vanaspati manufacturers further state thatunder ILBFTA there should be provision for accounting professionals to visitmanufacturing sites to ascertain the conformity to the ROO criteria.19
In January 2007 the matter was solved with the NAFED removed andIndia adhering to a quota of 250,000 metric tonnes per annum. Vanaspati/bakery shortening exports to India resumed in early 2007.
b) PepperThe other major source of conflict is the pepper industry. Sri Lanka shipsapproximately 6000 metric tonnes of black pepper, nearly half of which isexported under advanced licensing scheme. However, pepper growers inIndia fear that pepper from other origins have contributed to the recentsurge in pepper imports from Sri Lanka. They are concerned that withoutany mechanism to oversee imports and harvesting in Sri Lanka, the Indianmarket would be flooded with imported pepper, bringing down prices evenfurther.20 India is demanding a maximum export volume of 2,000 metrictonnes per annum, while Sri Lanka is requesting at least 3,000 metric tonnes(which Sri Lanka says amounts to only 4 per cent of India’s pepperproduction). Moreover, India wanted to restrict shipments of the matureberry pepper from the ports of Tuticorin and Cochin and restrict exportsduring the months of January to March.
c) GarmentsOwing to the serious under-utilization of the quota of 8 million pieces, SriLanka has requested: (a) that India provides market access for at least 2million pieces regardless of the fabric’s national source (i.e., in addition tothe 2 million already granted under the FTA); and (b) that India increasestariff concessions on textiles from 25 per cent to 50 per cent. At present,Sri Lanka’s Department of Commerce is in consultation with the JointApparel Associations Forum (JAAF) to identify a limited number of productlines with potential for export to India.
d) TeaThe two main Ports of entry — Kolkata and Kochin have not been supportiveof tea exports entering the Indian market. This is because these two portsare located in tea growing areas and the anti-tea import lobbies are strongand thus resist any foreign tea coming into the domestic market. Second,the rules of origin (35 per cent minimum local value addition for blendedtea and 25 per cent minimum local value addition for blended tea withIndian tea) stipulates that customs HS heading (0902) corresponding to teashould shift at four digit HS heading level which is practically impossible(it is possible only at six and eight digit HS codes). As a result, evenCeylon tea blended with Indian teas cannot enter the Indian market. It hasvirtually ruled out any blended tea from Sri Lanka entering the Indianmarket under the ILBFTA. Moreover, cumbersome procedures as appliedby the Indian customs for registration has put off many tea exporters fromSri Lanka. The under-utilization of Sri Lanka’s tea export quota as a resultof these non-tariff barriers has prompted the Tea Boards of both countriesto engage in several discussions in search of a solution.
e) CementBulk and bagged cement from India is imported at 35 per cent and 47 percent margins of preference (MoP), respectively, over and above the 15 percent MFN (most favoured nation) concession. Currently, Indian cementconstitutes 40 per cent of Sri Lanka’s total cement imports. In the tariffphase-out process, Sri Lanka is obliged to increase the MoP to 100 per centby March 2008. However, local manufacturers are requesting a 10 per centduty on imports in addition to extending the existing 10 per cent surcharge

28 29
on bagged cement to bulk cement as well. There is concern that imposingsuch restrictions could hamper reconstruction in tsunami-affected areas.Further study is required on the potential socio-economic impacts of cappingcement imports.
f) Desiccated coconutIndia has requested a quota of 500 metric tonnes for desiccated coconut (DC)under the previous Bangkok Agreement (BA) duty rate of 30 per cent. SriLanka, however, has asked for at least 6,000 metric tonnes under the samerate. Current exports of DC stand at less than 1,000 metric tonnes per year.
g) CopperThe ISLBFTA paved the way for a large number of copper industries tomushroom in Sri Lanka to cater to the growing Indian demand. At least, 30projects in copper were operating during 2002/2003 period in the countrymostly controlled by Indian entrepreneurs. The industry is multifacetedwhere scrap copper is imported from Indonesia, Russia, and other suppliers,and then melted to produce ingots, rods, etc. The technology used for themelting operations has created environmental problems. However, if purecopper were used with the latest technology such environmental problemswould not have arisen. Although the value addition of the raw copperconversion for exports has been low, the BOI has made it clear that theindustry should venture into high value added products.
Concerned about the high exports of copper ingots under the FTA,India has accused Sri Lankan exporters of deliberately under-valuing thegoods in order to show the required domestic value addition (DVA) of 35per cent as stipulated in the FTA. In response, Sri Lanka imposed a floorprice scheme based on European market prices and revised on a monthlybasis. Dissatisfied, India maintained its initial assertion. Taking into accountthe copper industry’s negative environmental impact and marginalcontribution to the economy, the government of Sri Lanka took a decisionin 2004 to stop approving scrap iron melting projects.
Business executives of Sterlite Industries are of the view that theproducers of Sri Lanka are merely melting scraps and selling ingots toIndia at reduced price. Such refining processes do not qualify for the ROO
certification. The Indian company has filed applications with the concernedgovernment authorities for invoking safeguard measures under FTA but noaction was taken. The ROO are weakly defined and misapplications arerampant.21
Another Indian copper industry - the Hindalco Industries Ltd. alsopointed to the adverse price effects of imported copper from Sri Lanka.They are of the view that copper items under Chapters 74 and 85.44 shouldbe put in the Negative List of India under ILBFTA. They feel that ROO isweakly defined and Change in Tariff Heading (CTH) should be also part ofthe ROO.22
h) Sri Lanka Trade Centre in ChennaiAlthough India does not permit foreign entities to own 100 per cent equityin retail sales, with the approval from the Reserve Bank of India (RBI), SriLanka’s Export Development Board (EDB) established a trade centre inChennai’s Spencer Plaza in early 2004 where 17 Sri Lankan exportersexhibited and sold their products. However, in March 2005, the RBIannounced that all commercial and trading activities in the centre would beprohibited. With only products samples allowed to be sold, several exhibitorshave been forced to withdraw their stalls, reducing their number to 12.Considering that the EDB’s presence in Chennai allowed a number of retailersto successfully enter the Indian market on a franchise basis, Sri Lanka iscurrently working towards a mutually beneficial compromise and in orderto increase the number of exhibitors at the centre.
i) Investment-related issuesThe delay in payment of the subsidy enshrined in the agreement betweenthe Indian Oil Corporation – largest Indian investor in Sri Lanka – and thegovernment of Sri Lanka did dampen investor confidence in India. GujaratAmbuja cement that wanted to set up a plant of cement manufacturingabandoned its plans due to the government of Sri Lanka taking over theearmarked land for a highway project and not allocating an alternativepiece of land. Now the company is involved in importing cement fromIndia and then putting them to sacks for retail trading. Many such investorrelated problems have cropped up from time to time. From the Sri Lankan

side complaints are similar, for example, Ceylon Biscuits has encountereda plethora of problems in India after taking over the third largest biscuitsmanufacturer in India (Bakemans) and obtaining market access to anotherproduct –Tic Tac (Wickremasinghe, 2006). Both sides seem to have takennote of these difficulties and steps have been taken to address them.
All in all, these were some of the stumbling blocs that have featuredduring the five rounds of negotiations in 2005 and two rounds of negotiationin 2006 between the trade negotiating teams of both countries.
4. Looking beyond the FTA
4.1 Comprehensive Economic Partnership Agreement (CEPA)The problems and conflicts of bilateral free trade have not discouragedeither party from pursuing bilateral economic integration at a far moreinclusive level than the trade of goods. Deep and across-the-board economicties with India’s 350 million strong middle class population, fast-growingeconomy could prove to be an important engine of economic growth in SriLanka. In 2004, India accounted for 20 per cent of Asian economic growthand 10 per cent of world economic growth; it is expected to be amongst thetop five industrialized nations and the services hub of the world by 2015(Thenuwara, 2005). India’s push for economic cooperation is incited by adesire to promote to the world its potential for economic prosperity andfriendly political relationships.
The decision to work towards a Comprehensive Economic PartnershipAgreement (CEPA) was taken in June 2002. A Joint Study Group (JSG)was appointed in April 2003 to investigate the possibility of achievinggreater economic integration while renewing the synergy of the bilateralFTA. The report of the JSG was released in October 2003, containing aseries of recommendations.23 Both sides have committed to an agreementconsistent with the rules of the WTO. While the numerous shortcomings ofthe existing FTA must be remedied, its evident achievements can be builtupon with relative ease to formulate the new agreement. The requiredinstitutional support is already in place with the Federation of IndianChambers of Commerce and Industry (FICCI) and the Ceylon Chamber
30 31
Commerce, which function as the focal points for economic cooperation,as well as the Indo-Lanka Joint Commission and the FTA’s Working Groupon Customs.
The first round of technical-level negotiations (TLNs) on the CEPAcommenced in February 2005, somewhat delayed after changes ingovernment in both countries.24 Seven rounds of negotiations have beencompleted by 2006. The CEPA is to cover trade in goods and services,investment liberalization, and economic cooperation. The negotiations ongoods focus primarily on reducing the ILBFTA’s negative lists, relaxingROO criteria, signing mutual recognition agreements (MRAs) on productstandards and certification procedures, and concluding the Memorandumof Understanding (MOU) on consumer protection and legal metrology.Particular attention will be given to developing the supply side of the SriLankan economy. The CEPA will be notified under the GATT’s ArticleXXIV,25 which covers substantial trade instead of under the “EnablingClause” which provides more flexibility to determine the trade coveragebetween developing countries.
In a nutshell, the main objectives of the CEPA are to:1. Deepen existing preferential trade between the two countries2. Reduce the negative lists of the ILBFTA3. Relax ROO criteria4. Liberalize the services sector beyond the coverage of the General
Agreement on Trade in Services (GATS)5. Liberalize investment6. Facilitate economic cooperation as an impetus for liberalization of t
he services and investment sectors, with the Indian Line of Credit toplay a crucial role.26
4.2 Services LiberalizationServices comprise two-thirds of global output, one-third of globalemployment, 40 per cent of global FDI, and 20 per cent of global trade. Itis the fastest-growing component of world trade and investment. Servicesliberalization is already underway at the multinational level under the WTO’sGeneral Agreement on Trade in Services (GATS). Both India and Sri Lankareflect the importance of services to economic prosperity. Sri Lanka’s

32 33
services sector contributed to 55.8 per cent of GDP in 2005 with a growthrate of 6.4 per cent and accounting for 44.8 per cent of total employment(CBSL, 2005). The Indian services sector has maintained a growth rate ofabout 8 per cent since the mid-1990s, contributing towards 57.6 per cent ofGDP in 2004-2005, although accounting for only one quarter of totalemployment.27 In both countries, the services sector has markedly outdoneboth industry and agriculture as an engine of growth, and is the fastest-growing sector in the economy.
Despite the surge of bilateral services flows triggered by the ILBFTA,services are not extensively liberalized at present. One reason is that thegreater extent of domestic value addition and employment is associatedwith services than with goods, thus prompting the desire to safeguard nationalinterests. Another reason is that services flows are difficult to monitor dueto their predominantly intangible nature. Hence, in order to maintainstandards, streamline payments, and protect domestic workers, a complextangle of regulations – such as accreditation processes, foreign exchangerestrictions, licensing and registration requirements – prevail in each country.In fact, domestic regulations are more prominent in services trade than ingoods trade.
Table 4.1: Role of Services Sector in GDP Growth in Sri Lanka
Year Sector Rate of Growth (%) Contribution to Share of Real
Change in GDP (%) GDP (%)
2004 Services 7.6 75.8 55.6
Industry 5.2 25.4 26.4
Agriculture -0.3 -1.2 17.9
2005 Services 6.4 59.3 55.8
Industry 8.3 36.3 27.0
Agriculture 1.5 4.4 17.2
Source: CBSL, 2005.
However, many unilateral liberalization measures have been undertakenby both parties in recent years (as mentioned in Section 2.3). Sri Lanka andIndia have made commitments to the WTO under the GATS as well.28 The
rationale behind the CEPA is to exceed these WTO commitments.Furthermore, unlike in the ILBFTA, a “positive-list approach” will beused for the CEPA as in the GATS (Article V) given the level of sensitivitythat surrounds services liberalization (for details, see Chapter 9, IPS, 2006).It is argued that this approach provides more flexibility to member countries– especially developing economies – with gradual, progressive liberalizationin keeping with national developmental strategies.
Table 4.2: Role of Services Sector in GDP Growth in India
Year Sector Rate of Growth (%) Contribution to Share of Real
Change in GDP (%) GDP (%)
2003-04 Services 8.9 58.9 56.7
Industry 6.5 16.9 21.6
Agriculture 9.6 24.3 21.7
2004-05 Services 8.6 70.5 57.6
Industry 8.3 25.9 21.9
Agriculture 1.1 3.6 20.5
Source: RBI, 2005.
India and Sri Lanka have already submitted their request lists to eachother and are in the process of exchanging schedules which outline marketaccess, national treatment, and other regulatory matters. Sri Lanka’s requestlist for India consists of liberalization in tourism, retail trade, finance,insurance, and maritime services. India’s request list is much longer; itcontains liberalization in audio visual services, information andcommunication technology (ICT), transport, tourism, professional services(accounting, architecture, medicine, dentistry, nursing, midwifery,engineering, etc.), maritime services, energy, education, and construction.The possible gains from liberalization of some of these sectors andimpediments to further liberalization have been highlighted by Taneja etal. (2004).
In regard to financial services, Sri Lanka’s liberalization under CEPAwill be mostly in relation to Mode 3, with deeper concessions granted throughnational treatment. Any measure under Mode 1 will pose significant difficulties

34 35
and will be considered only along with national policies on capital accountliberalization. Both Mode 2 and 4 are also largely restricted (Thenuwara, 2005).
Sri Lanka has specifically requested liberalization in the aviation sector.Aviation is one of several sectors not covered by the GATS because it liesoutside the usual mandate of a trade minister (ITC/CS, 2002). Given the GATS-plus nature of the CEPA, and given the fact that aviation is covered in theIndia-Singapore Comprehensive Economic Cooperation Agreement (CECA),Sri Lanka has taken the position that aviation should be covered under CEPA.Sri Lanka is of the view that for any significant economic partnership andintegration, a vibrant air sector is essential as a support mechanism. Moreimportantly, the aviation sector is one of the few sectors that Sri Lanka caneffectively compete with India. India, however, has maintained the positionthat that air services are dealt bilaterally between the respective civil aviationauthorities and should remain outside the CEPA. This issue is far from settledbut the aviation authorities of both countries are due to discuss the possibilityof more commercial air travel with twice-daily flights to major destinations,5th freedom for airlines to travel beyond the SAARC region, and increasedcode-sharing.
4.3 Unresolved Issues in Services NegotiationsAt present, negotiations are underway with regard to denial of benefits(rules of origin in services), professional services liberalization, theemployment of spouses and dependents, etc. Some of the key issues arehighlighted below.
a) Denial of Benefits/Rules of OriginUnlike with goods trade, whereby the nationalities of inputs are pre-determined by the geographic location of production, the nationality of aservice-providing firm depends on the nationality/nationalities of itsownership (i.e., investment capital or shareholders). The firm’s labour(human capital) could also be multinational. The ownership/nationality ofa service provider – which determines ROO criteria in services trade –frequently changes with share transfers, mergers, acquisitions, and labourturnover. Hence, in negotiating the CEPA, the two parties have to decideon a sufficient percentage of inputs from the source country while also
ensuring that the concessions granted to each other are not undermined byoverly stringent ROO. Determining ROO criteria could thus prove to be avery complex and lengthy process. In Sri Lanka’s case, a number of importantservice-providers with large-scale business operations – for example in thetelecommunications sector – are controlled by foreign-owned companies.
b) Professional ServicesSeveral professional services sectors in Sri Lanka have serious shortages.For instance, certain highly-focused areas of medicine (neurosurgery,glaucoma) and law (intellectual property rights, information technologylaw) have very few specialists, rendering their services inaccessible to amajority of the population. With the current lack of skills in Sri Lanka,India has much potential to fulfil these deficiencies under a liberalizedenvironment. However, the movement of professionals in a certain sectorcan only be facilitated via Mutual Recognition Agreements (MRAs) signedby corresponding professional bodies in both countries. Liberalization ofprofessional services would be imprudent without adequate legislation tocover standards, professional qualifications, and registration of practisingprofessionals. Unfortunately, very few service sectors in Sri Lanka areformally organized under an overseeing authority sanctioned by thegovernment, and these tend to be restricted to the traditionally “prestigious”professions such as medicine, law, engineering, accountancy, etc. The legalframework for professional services is seriously lacking (unlike in India),and some of the existing Acts of Parliament governing professional bodiesare in need of amendment before signing of any MRA.
Given the time-consuming nature of the legislative process, Sri Lankais taking a cautious stance towards professional services liberalization underthe CEPA. Sri Lanka is adamant that liberalization under Mode 4 or“movement of natural persons” (in GATS terminology) only take placewith Mode 3 (“commercial presence”).29 Up to now, the presence of Indianprofessionals in Sri Lanka has been tied to investment; for example, doctorsat Apollo Hospital, executives at the Indian Oil Company, and senior staffat Taj Group hotels. The BOI determines at its own discretion the numberof foreign professionals allowed to work in Sri Lanka. India, however,demands that Mode 4 be de-linked from Mode 3, which Sri Lanka will

36 37
consider if it is done explicitly under government-to-government economiccooperation in specific sectors only. At present, Sri Lanka is willing toopen up Mode 4 to fulfil the acute shortages of nurses in the war-affectedNorth-East and for English teacher trainers to train Sri Lankan school teachersin English throughout the country.
Bringing Indian professionals on a sector-specific basis with governmentinvolvement in this manner will provide a signal to domestic professionalbodies that services liberalization is well on its way, thus giving them theopportunity to re-organize themselves before large-scale liberalization takesplace. Concerns of “opening the floodgates” to Indian professionals can beaddressed within the WTO framework which provides for adequate safeguards(market access, national treatment, etc.) to control services flows. Professionalbodies are already being persuaded to sign MRAs with their Indian counterparts,and this in turn has prompted a move towards re-assessing and restructuringthe regulatory framework that governs professional services. Opening upcompetition from India could also prove to be a catalyst for enhanced technicalskills training of Sri Lankan professionals.
4.4 Investment LiberalizationInvestment relations between the two countries have been fast catching upwith trade relations as an important channel of economic cooperation. Severalunilateral liberalization measures have already taken place. Currently, in bothcountries, all sectors of the economy, barring a small negative list and fewrestricted areas, are entitled to foreign direct investment (FDI) under theautomatic route.30 A notable recent development in FDI flows has been thechange from a one-way flow (India to Sri Lanka) to an increasingly two-wayrelationship. In addition, sectoral composition of direct investment has beendiversifying.
Most bilateral investment flows take place from India to Sri Lanka;investments in the opposite direction are very small in comparison. Thus,investment liberalization under the CEPA could be greatly beneficial to SriLanka in terms of capital formation, technology transfer, and trade creation.Moreover, Sri Lanka should see the imbalance in the trade account due to itslimited export supply capacity getting compensated by investment flows
into the capital account (RIS, 2004). Sri Lanka requires high FDI inflowsto fill the projected gap of 4 per cent of GDP – about US $1 billion –between national savings and investment to achieve annual economic growthof 8-10 per cent in the long term (JSG, 2003). The ongoing CEPAnegotiations cover a number of issues pertaining to MFN treatment,expropriation and dispute settlement, and have prompted reviews of existinginvestment treaties – the Bilateral Investment Promotion and ProtectionAgreement (BIPPA) of 1997 and the Agreement on Double Taxation andPrevention of Fiscal Evasion (DTAA) of 1982. Agreement was reached onthe latter during the seventh round of negotiations in June 2006. With regardto national treatment (NT), Sri Lanka at present offers only post-establishment NT to foreign investment. However, as noted by the JointStudy Group, pre-establishment national treatment could provide asubstantial boost to investment and could be considered for sectors where100 per cent FDI is anyway permitted under the automatic route.
5. Lessons from Six Years of SuccessIn determining the future of Indo-Lanka economic ties, six important lessonscan be drawn from the ILBFTA. First, both governments have displayedthe political will to forge ahead towards economic integration which isreflected in the growing share of both partner countries’ bilateral trade inworld trade in all categories of concessions exchanged (with the exceptionsof Sri Lankan tea and garments). Second, considerable size disparity betweentwo countries does not hinder bilateral free trade when appropriate specialand differential treatment is accorded to the smaller country. Third, FTAscan invigorate dormant complementarities, as Sri Lanka discovered whenits comparative advantage in producing a number of consumer goods thatfound entry to the Indian market for the first time following the exchangeof preferences. Fourth, a bilateral FTA activates unilateral liberalizationmeasures that are unrelated but complementary to the agreement, creatingdeeper economic integration; this is clearly visible in the tourism and airtravel sectors of India and Sri Lanka. Fifth, the ILBFTA’s conciseness is alikely reason for its success; it is a 14-page document devoid of excessive rulesand regulations. Finally, the economic benefits of free trade can and do overridepolitical problems; the ILBFTA has done much to clear the acrimonious politicalatmosphere that marked Indo-Lanka relations during the 1980s.

38 39
However in order to sustain this growing partnership, products havinggenuine comparative advantage should be encouraged, if not sustaining thetrade momentum will be difficult due to the political economy ofinternational trade. It can be observed from the 2006 trade data that SriLankan exports to India have declined by 12.11 per cent due to the clampdown on both vanaspathi/bakery shortening and copper exports to India,while India sustained the earlier growth momentum of trade by recording a25.9 per cent increase in trade. This calls for addressing the lopsided natureof bilateral trade, largely the result of differing external trade policies ofthe two countries and misutilization of ROO provisions under the Agreement.India needs to ensure that the temporary decline of Sri Lankan exports isoffset by more unilateral initiatives in favour of Sri Lanka so that the growthmomentum is restored. In the services sector also a number of unresolvedissues need to be addressed. It is by resolving these issues that the movementtowards CEPA could be put on fast track to make it a reality in 2007.CEPA has the potential to break new ground in South Asia’s forwardmovement towards economic prosperity.
Notes1 South Asian Association for Regional Cooperation.2 For background details, see, for instance, Kelegama (1999).3 The SAARC Preferential Trading Arrangement (SAPTA) was signed in April 1993 and
came into operation in December 1995.4 Available on the Board of Investment of Sri Lanka website, http://www.boi.lk5 See Jayawardena, L. et al. (1993) and Panchamukhi, V.R. et al. (1992).6 India had committed to the WTO that it would remove non-tariff barriers by 2004.7 Sri Lankan government loses Rs. (SL). 1.5 -1.8 billion yearly due to the tariff concessions
under the ILBFTA. This is a substantial revenue loss in the context of the escalatingbudget deficits in Sri Lanka. The Sri Lankan government has resorted to imposingvarious import cesses to cover up for these losses (Sunday Leader, Business, 8 October2006).
8 Under Section 17 of the BOI Law, the Board has the power to grant a wide range ofincentives and concessions to foreign investors satisfying eligibility criteria in terms ofexports and employment.
9 The 10 destinations are: New Delhi, Mumbai, Buddh Gaya, Chennai, Bangalore,Hyderabad, Trichy, Trivandrum, Cochin, and Goa.
10 During the first year of operation of the ILBFTA only 10 per cent of Sri Lanka’sexports to India qualified for duty-free status, 68 per cent for 50 per cent duty concession,8.5 per cent for 25 per cent duty concession while 13.6 per cent of Sri Lanka’s exportsto India were in the Indian negative list. In fact, out of the 2,799 items offered at 50 percent duty preference only 218 items were of export interest to Sri Lanka (Weerakoon,2001).
11 Also, specifying ports of entry for particular products acted as an impediment to specificexports.
12 “Govt. working to check Lankan pepper imports”, Hindu Business Line, June 9, 2006,http://www.thehindubusinessline.com/2006/06/09/stories/2006060903050800.htm
13 India May Invoke Safeguards in Lanka FTA, Centad (Centre for Trade andDevelopment), March 2006, http://www.centad.org/tradenews_46.asp
14 ibid.15 “Chess Game”, Lanka Business Online, April 24, 2006, http://
www.lankabusinessonline.com/fullstory.php?newsID=180877541016 This led to a number of other issues such as the allocation of the quota among the 14
factories, etc.17 “Oily Row”, Lanka Business Online, April 4, 2006, http://www.lankabusinessonline.com/
fullstory.php?newsID=13737231118 Discussion were dragged because there was an attempt to link a deal for vanaspathi with
more restrictions on pepper and desiccated coconuts from Sri Lanka.19 Bhanja (2006).20 “Govt Working to Check Lankan Pepper Imports”, Hindu Business Line, June 9, 2006,
http://www.thehindubusinessline.com/2006/06/09/stories/2006060903050800.htm21 Op cit, n13.22 Ibid.23 The report can be downloaded from www.ips.lk24 When the JSG report on CEPA was exchanged between the two Prime Ministers in
October 2003, the intention of both leaders was to have CEPA operational by March2004. However, due to change of governments in both countries during the first halfof 2004, the new governments. needed more time to study the CEPA before committingto it. It took nearly one year to re-start the negotiations.
25 GATT – General Agreement on Tariffs and Trade.26 The Indian Line of Credit is a credit facility granted by India to other developing
countries to purchase goods and services from India, usually with a long re-paymentperiod. Since January 2001, Sri Lanka has borrowed a total of US $281 million for thepurchase of food, petroleum, buses, roofing sheets, and consulting services.
27 CIA World Factbook.28 Sri Lanka’s commitments cover tourism, telecommunications and financial services.
India’s commitments cover professional services, communications, construction,distribution, education, environment, financial services, health and social services,tourism and culture, sports, and transport.
29 This position is mainly influenced by the following factors: (a) as stated, manyprofessional bodies not having an effective regulatory framework in place, and (b)fearful perception that, Indian workers will flood the market. This perception has beentriggered by a number of Indian workers engaging in work at Copper and Vanaspathifactories using the 3 months visa at arrival policy of Sri Lanka (now the arrival visa isoffered only for one month). The BOI has also been relaxed in monitoring such workerinflows. Once perceptions are rectified and regulatory frameworks are put in place SriLanka will consider the Indian request of de-linking Mode 4 from Mode 3.
30 FDI via the “automatic” (non-governmental) route requires prior approval of theReserve Bank of India (RBI) in the case of India, and the Board of Investment (BOI) inthe case of Sri Lanka; both institutions function autonomously.

40 (i)
RIS Discussion Papers
Available at http://www.ris.org.in/risdiscussion_papers.html
DP#118-2007 Trade Facilitation Measures in South Asian FTAs: AnOverview of Initiatives and Policy Approaches by SachinChaturvedi
DP#117-2006 Emerging Multinationals: Trends, Patterns and Determinantsof Outward Investment by Indian Enterprises by NageshKumar
DP#116-2006 Addressing Global Growth Asymmetries through RegionalTrade Integration: Some Explorations by Ram Upendra Dasand Ramaa Sambamurty.
DP#115-2006 Trade Facilitation and Customs Valuations in India : Identifying the Gaps by Sachin Chaturvedi
DP#114-2006 India’s Regional Trading Arrangements by Rajesh Mehtaand S. Narayanan
DP#113-2006 FDI and Spillover Effects in the Indian PharmaceuticalIndustry by Annika Bergman
DP#112-2006 Regional Cooperation for Asian Energy Security by VipulTuli
DP#111-2006 Demographic Complementarities and Outsourcing:Implications and Challenges for India by Mukul G. Asher andAmarendu Nandy
DP#110-2006 Reinventing UNCTAD: Some Proposals for the UNCTAD Mid-term Review by Muchkund Dubey
DP#109-2006 Trade Facilitation Priorities in India and Commitments atWTO: An Overview of Current Trends by Sachin Chaturvedi
DP#108-2006 Towards Comprehensive Economic Co-operation between Indiaand Central Asian Republics by Dr. Ramgopal Agarwala
DP#107-2006 Monetary and Financial Cooperation in Asia: Emerging Trendsand Prospects by Ramkishen S. Rajan
DP#106-2006 Japan and an Asian Economic Community by Masanori KondoDP#105-2005 India-Vietnam Trade:Current Relations and Prospects by Rajesh
MehtaDP#104-2005 Trade in IBSA Economic Cooperation: The Role of Transportation
Linkages by Prabir DeDP#103-2005 Trade and Environment in the WTO: Negotiating Options for
Developing Countries by Sanjay Kumar and Nupur Chowdhury
ReferencesBhanja, Atal Bihari (2006), ‘Study of Impact of FTAs signed with Thailand, Singapore
and Sri Lanka’ a Report submitted under Part II of International Trade laws & WTOof the Institute of Chartered Accountants of India, New Delhi,(mimeo), July 2006.
CBSL (2005), Annual Report, Central Bank of Sri Lanka.
ITC/CS (2002), Business Guide to the General Agreement on Trade in Services,International Trade Centre UNCTAD/WTO (Geneva) and Commonwealth Secretariat(London).
IPS (2006), Sri Lanka: State of the Economy 2006, Institute of Policy Studies, Colombo.
JSG (2003), India-Sri Lanka Comprehensive Economic Partnership Agreement, JointStudy Group, October 2003, http://www.ips.lk/publications/etc/cepa_reprot/islcepa.pdf
Jayawardena, L. et al. (1993), Indo-Sri Lanka Economic Cooperation: Facilitating TradeExpansion through a Reciprocal Preference Scheme, The United Nations University,WIDER, Helsinki.
Kelegama, S. (1999), ‘Indo-Sri Lanka Trade and the Bilateral Free Trade Agreement: ASri Lankan Perspective’, Asia-Pacific Development Journal, Vol.6, No.2, December1999.
Mukherjee, I.N., T. Jayawardena and S. Kelegama (2002), ‘India-Sri Lanka Free TradeAgreement: An Assessment of Potential and Impact’, SANEI completed study(www.saneinetwork.net ).
Panchamukhi, V.R. et al. (1992), Indo-Sri Lanka Economic Cooperation: An OperationalProgramme, The United Nations University, WIDER, Helsinki.
RBI (2005), Annual Report, Reserve Bank of India.
RIS (2004), South Asia Development and Cooperation Report 2004, RIS, New Delhi,India.
Taneja, N., A. Mukherjee, S. Jayanetti, and T. Jayawardena (2004), ‘Indo-Sri LankaTrade in Services: FTA II and Beyond’, SANEI completed study(www.saneinetwork.net ).
Thenuwara, H.N. (2005), ‘Beyond Indo-Sri Lanka Free Trade: Comprehensive EconomicPartnership Agreement with India’, 24th anniversary lecture of the Centre for BankingStudies, Central Bank of Sri Lanka, December 2005.
Weerakoon, D. (2001), ‘Indo-Sri Lanka FTA’, Economic and Political Weekly, 24February.
Wickremasinghe, Mineka (2006), ‘The FTA/CEPA’, paper presented to the 9th meetingof the Sri Lanka-India Joint Business Council, jointly organized by the FCCISL andFICCI, Taj Samudra Hotel, Colombo, 3-4 November (mimeo).

(iii)(ii)
DP#102-2005 Prospects for Environmental Trade under the Regional Processin South Asia: Evidence from SAPTA and Proposals for SAFTA byS. K. Mohanty and Sachin Chaturvedi
DP#101-2005 Emergence of China and India in the new Millennium: Will itfacilitate Market Access for LDCs and Developing Countries? byS. K. Mohanty and Sachin Chaturvedi
DP#100-2005 Towards a Broader Asian Community: Agenda for the East AsiaSummit by Nagesh Kumar
DP#99-2005 Biosafety Protocol, International Trade and AgriculturalBiotechnology: Policy Inferences for India by Sachin Chaturvediand Lian Chawii
DP#98-2005 The WTO Negotiations on Industrial Tariffs: What is atStake for Developing Countries? by Yilmaz Akyüz
DP#97-2005 Non-tariff Barriers Affecting India’s Exports by RajeshMehta
DP#96-2005 Advancing the ASEAN-India Partnership in the NewMillennium by Ong Keng Yong
DP#95-2005 The Search for Regional Architecture: The Role of ASEANas Strange Attractor by Djisman S. Simanjuntak
DP#94-2005 India-Central Asia Economic Relations: A Report of RIS/CII Seminar
DP#93-2005 Asian Energy Outlook to 2020: Trends, Patterns andImperatives of Regional Cooperation by Kokichi Ito, LiZhidong and Ryoichi Komiyama
DP#92-2005 Regional Trade and Investment Architecture in Asia-Pacific:Emerging Trends and Imperatives by Tiziana Bonapace
DP#91-2005 India-East Asia Integration: A Win-Win for Asia by MukulG. Asher and Rahul Sen
DP#90-2005 Strategic Relevance of Asian Economic Integration by EricTeo Chu Cheow
DP#89-2005 China’s Role in the Asian Economic Unification Process byYao Chao Cheng
DP#88-2005 Strategic Approach to Strengthening the InternationalCompetitiveness in Knowledge Based Industries: ElectronicsIndustry by K. J. Joseph
DP#87-2004 Regional Cooperation for Poverty Alleviation and FoodSecurity in South Asia by Sachin Chaturvedi
DP#86-2004 Towards a Free Trade Area in South Asia: Charting A
Feasible Course for Trade Liberalisation with Reference toIndia’s Role by Indra Nath Mukherji
DP#85-2004 Industrial Restructuring and Export Competitiveness of the Textilesand Clothing Sector in SAARC in the Context of MFA Phase-Outby Ram Upendra Das
DP#84-2004 India’s Export by Countries and Commodities: On the Estimationof a Forecasting Model Using Panel Data by Rajesh Mehta andParul Mathur
DP#83-2004 Strategic Approach to Strengthening the InternationalCompetitiveness in Knowledge Based Industries:Indian ChemicalIndustry by Vijay Kumar Kaul
DP#82-2004 Strategic approach to Strengthening the InternationalCompetitiveness in Knowledge Based Industries: The Case ofIndian Automotive Industry by Neelam Singh
DP#81-2004 Strategic approach to Strengthening the InternationalCompetitiveness in Knowledge Based Industries: Non-electricalMachinery Industry by M. Padma Suresh
DP#80-2004 Strategic approach to Strengthening the InternationalCompetitiveness in Knowledge Based Industries: The IndianPharmaceutical industry by Aradhna Aggarwal
DP#79-2004 Complementarities and Potentials of Intra-regional Transfers ofInvestments, Technology and Skills in Asia by Saikat Sinha Roy
DP#78-2004 Towards Formation of Close Economic Cooperation among AsianCountries by S K Mohanty, Sanjib Pohit and Saikat Sinha Roy
DP#77-2004 Transaction Costs as Barriers to Economic Integration in Asia:An Empirical Exploration by Prabir De.
DP#76-2004 Transforming Digital Divide into Digital Dividend: The Role ofSouth-South Cooperation in ICTs by K J Joseph.
DP#75-2004 Transport Cooperation in BIMST-EC: Issues and Way Forwardby Prabir De.
DP#74-2004 WTO Market Access Negotiations and Indian Small Scale Industryby Rajesh Mehta and Pooja Agarwal.
DP#73-2004 ASEAN-India Economic Relations: Current Status and FutureProspects by Rahul Sen, Mukul G. Asher and Ramkishen S. Rajan.
DP#72-2004 National Innovation Systems and India’s IT Capability:Are there any lessons for ASEAN Newcomers? by Nagesh Kumarand K J Joseph.