risk assessment/ alternatives analysis report downtown
TRANSCRIPT

Risk Assessment/ Alternatives Analysis Report
Downtown Environmental Assessment Project, Montgomery, Alabama
Prepared for
Alabama Department of Environmental Management by the
Downtown Environmental Alliance
February 2019


AX0523180835MGM iii
Contents PG and PE Certification
1 Introduction ....................................................................................................................... 1-1 1.1 Background ...................................................................................................................... 1-1
1.1.1 Site History .......................................................................................................... 1-1 1.1.2 Supplemental EI Summary .................................................................................. 1-2 1.1.3 Supplemental EI Results...................................................................................... 1-3
1.2 Conceptual Site Model ..................................................................................................... 1-4 1.2.1 Geology/Hydrogeology ....................................................................................... 1-4 1.2.2 Surface Water Features ...................................................................................... 1-5 1.2.3 Identification of Groundwater Plumes ............................................................... 1-5 1.2.4 Chemical Transport ............................................................................................. 1-6 1.2.5 Fate of Chemicals ................................................................................................ 1-6 1.2.6 Land Use and Potential Exposure Scenarios ....................................................... 1-7
2 Risk Assessment.................................................................................................................. 2-1 2.1 Human Health Risk Assessment ....................................................................................... 2-1
2.1.1 Conceptual Exposure Model ............................................................................... 2-1 2.1.2 RSL Evaluation ..................................................................................................... 2-2 2.1.3 RM-1 Evaluation .................................................................................................. 2-7 2.1.4 Uncertainty Analysis ......................................................................................... 2-10 2.1.5 HHRA Summary and Recommendations .......................................................... 2-11
2.2 Screening-Level Ecological Risk Assessment .................................................................. 2-12 2.2.1 Screening Level Problem Formulation .............................................................. 2-12 2.2.2 Ecological Conceptual Site Model ..................................................................... 2-13 2.2.3 Ecological Effects Evaluation ............................................................................ 2-14 2.2.4 Screening-Level Preliminary Exposure Estimation ........................................... 2-14 2.2.5 Screening-Level Risk Calculation ....................................................................... 2-14 2.2.6 Uncertainties ..................................................................................................... 2-15 2.2.7 Risk Characterization ........................................................................................ 2-15
3 Alternatives Analysis ........................................................................................................... 3-1 3.1 Remedial Action Objectives ............................................................................................. 3-1 3.2 Development and Screening of Alternatives ................................................................... 3-2
3.2.1 Potential Alternatives ......................................................................................... 3-2 3.3 Detailed Evaluation of Alternatives ................................................................................. 3-5
3.3.1 Alternatives Evaluation Summary ....................................................................... 3-6
4 Summary and Conclusions ................................................................................................... 4-1
5 References .......................................................................................................................... 5-1

CONTENTS CONTINUED
AX0523180835MGM iv
Appendixes
A Human Health Risk Assessment and Supplemental Information B Correspondence from Capitol Trailways Regarding Discontinued Use of Water Supply Well
Tables
1-1 Groundwater Sampling Results from the Supplemental EI 1-2 Soil Vapor Sampling Results from the Supplemental EI 1-3 Physical Properties of the Chemicals of Potential Concern 1-4 Geotechnical Sampling Results from the Supplemental EI 3-1 ARARs 3-2 Balancing Criteria Evaluation Summary for Remedial Alternatives
Figures
1-1 Site Map with Investigation Locations 1-2 PCE Groundwater Results – July 2016 1-3 Soil Vapor Results – July 2016 1-4 Cypress Creek Hydraulic Study Results 1-5 Conceptual Site Model 1-6 July 2016 Shallow Potentiometric Surface 1-7 Extent of PCE Plume and Current Property Use Map 2-1 Conceptual Exposure Model 2-2 Vapor Intrusion Area of Interest

AX0523180835MGM v
Acronyms and Abbreviations µg/L micrograms per liter µg/m3 micrograms per cubic meter AA alternatives analysis ADEM Alabama Department of Environmental Management AG Attorney General AMS AMS retract-a-tip Annex County Annex III ARAR applicable, relevant, and appropriate requirement AS-SVE air sparging and soil vapor extraction atm-m3/mole atmospheric cubic meter per mole ATSDR Agency for Toxic Substances and Disease Registry BCF bioconcentration factor bgs below ground surface CEM conceptual exposure model CH2M CH2M HILL Engineers, Inc. City City of Montgomery cm/s centimeters per second COC chemical of concern COG Community Outreach Group COPC chemical of potential concern CSM conceptual site model DAF dilution attenuation factor DCE dichloroethene DEA Downtown Environmental Alliance DEAP Downtown Environmental Assessment Project DO dissolved oxygen EI Environmental Investigation EPA U.S. Environmental Protection Agency ERA ecological risk assessment FYR Five-year Review GIS geographic information system GSI groundwater-surface water interface HHRA human health risk assessment HI hazard index HQ hazard quotient IC institutional control IELCR individual excess lifetime cancer risk ISCO in situ chemical oxidation ISCR in situ chemical reduction MCL maximum contaminant level MDL method detection limit MNA monitored natural attenuation MWWSSB Montgomery Water Workers and Sanitary Sewer Board NCP National Oil and Hazardous Substances Pollution Contingency Plan NPDES National Pollutant Discharge Elimination System PCE tetrachloroethene PRG preliminary remediation goal

ACRONYMS AND ABBREVIATIONS
AX0523180835MGM vi
RA remedial action RA/AA Risk Assessment/Alternatives Analysis RAO remedial action objective RM risk management RSA Retirement Systems of Alabama RSL Regional Screening Level site Montgomery DEAP site SLERA screening-level ecological risk assessment SVE soil vapor extraction TCE trichloroethene USGS U.S. Geological Survey VC vinyl chloride VF volatilization factor VI vapor intrusion VIMS vapor intrusion monitoring system VISL vapor intrusion screening level VOC volatile organic compound WQS water quality standard

AX0523180835MGM 1-1
SECTION 1
Introduction This Risk Assessment/Alternatives Analysis (RA/AA) Report is being submitted to the Alabama Department of Environmental Management (ADEM) by the Downtown Environmental Alliance (DEA) to document the results of the human health risk assessment (HHRA), screening-level ecological risk assessment (SLERA), and remedial alternatives analysis (AA) for the Downtown Environmental Alliance Project (DEAP) site. The DEAP site includes the extent of tetrachloroethene (PCE) in groundwater that originally was discovered in former public water supply well PW-9W in 1991 and during the construction of the Retirement Systems of Alabama (RSA) Tower Energy Plant (hereinafter referred to as the RSA Energy Plant) in 1993.
Since the discovery of PCE impacted groundwater, the site has been the subject of numerous investigations (see Section 1.1.1). The HHRA, SLERA, and AA documented in this report were performed to assess potential risks to human health and the environment, and evaluate alternatives to mitigate those potential risks. The assessments were performed using the results of the supplemental environmental investigation (EI) conducted by the DEA in 2016 and 2017 (CH2M, 2017).
Figure 1-1 presents the DEAP site boundary, major site features, and the EI investigation locations. The DEAP site covers approximately 30 city blocks in downtown Montgomery. Although not within the site boundary, the HHRA and remedial AA also considered the results of the Supplemental EI sampling conducted near the County Annex III (Annex) Building and the Alabama Attorney General (AG) Building, which was performed to evaluate the potential for vapor intrusion (VI) impacts based on previous odor/indoor air quality complaints received during site work conducted by the U.S. Environmental Protection Agency (EPA).
1.1 Background After the discovery of PCE in groundwater in downtown Montgomery, remedial actions (RAs) and investigations were conducted by various parties to address and/or evaluate potential contamination in downtown Montgomery.
1.1.1 Site History In response to the 1991 discovery of PCE in well PW-9W, the Water Works and Sanitary Sewer Board of the City of Montgomery, Alabama, discontinued use of the North Well Field. All water supply wells within the DEAP site boundary were abandoned in 2011, except PW-9W, which was retained for environmental monitoring. However, the pump was removed from the well in 2017 based on 3 years of analytical results that indicate PCE is no longer present in the well at concentrations above the EPA Maximum Contaminant Level (MCL). The potential abandonment of PW-9W was discussed with ADEM in August 2017 and the well was abandoned in January 2019.
In response to the discovery of PCE during construction of the RSA Energy Plant in 1993, an emergency removal was conducted by the RSA under ADEM oversight. Since then, multiple investigations have been conducted in the area to assess the nature and extent of remaining contamination across the DEAP site, and other investigations have been conducted as environmental site assessments for commercial and industrial properties within downtown Montgomery. These investigations evaluated soil, groundwater, sewer water, soil vapor, and tree core samples through 2017 (including the Supplemental EI summarized in Section 1.1.2).
Over the course of these investigations, a PCE plume in groundwater emanating from the former RSA Energy Plant location was identified and subsequently monitored (however, no residual PCE

SECTION 1 INTRODUCTION
AX0523180835MGM 1-2
contamination was identified in vadose zone soil). Additionally, potential indoor air quality concerns were identified at two buildings (the Annex Building and the AG Building, see Figure 1-1). During investigations in 2011, EPA installed a vapor intrusion monitoring system (VIMS), consisting of five soil vapor sampling points installed at 10-foot intervals from 10 to 50 feet below ground surface (bgs), across the street from the Annex Building to evaluate soil vapor concentrations.
Investigation results concluded that multiple sources of contamination likely exist within the downtown Montgomery area. As documented in the ADEM-approved work plan (CH2M, 2016), the site definition and evaluation are based on residual PCE and associated degradation products in groundwater as a result of the release from the former RSA Energy Plant.
Data from investigative work conducted between 1993 and 2012 were compiled and evaluated to develop the scope of the Supplemental EI work as documented in the ADEM-approved work plan (CH2M, 2016).
1.1.2 Supplemental EI Summary The Supplemental EI was implemented at the DEAP site between July 2016 and February 2017 to refine the conceptual site model (CSM). Although other chemicals that are commonly found in industrial or commercial areas were observed during the historical investigations, chemicals of potential concern (COPCs) assessed as part of this investigation are PCE in groundwater, identified at the RSA Energy Plant and former public water supply well PW-9W, and associated degradation products, namely trichloroethene (TCE), cis-1,2-dichloroethene (DCE), trans-1,2-DCE, and vinyl chloride (VC). The term COPC is used according to Section 5.1 of the Risk-Based Corrective Action Guidance (ARBCA) guidance manual (ADEM, 2017a) throughout this report to refer to the site-specific chemical list. Investigation locations, shown on Figure 1-1, include:
• One temporary piezometer (TMPZ-1), installed near the downgradient edge of the PCE plume (Although TMPZ-1 initially was intended for use as a temporary piezometer, it was completed following the Alabama Environmental Investigation and Remediation Guidance [ADEM, 2017b] as a Type II permanent monitoring well. Because it may be used to collect groundwater samples in the future and was installed as a permanent well, TMPZ-1 will be considered a monitoring well and referred to as TMPZ-1/MW-13S through the remainder of this document.)
• Groundwater samples from 14 monitoring wells (including TMPZ-1/MW-13S) analyzed for COPCs, PCE and degradation products, TCE, cis-1,2-DCE, trans-1,2-DCE, and VC
• Sixteen soil vapor samples from eight locations analyzed for the COPCs
• Bus wash water from Capital Trailways bus station, analyzed for the COPCs (At the time, the business was using an industrial groundwater supply well to supply bus wash water; the business switched to using publicly supplied water in 2017 and discontinued use of the industrial water supply well.)
• Six geotechnical samples collected at four locations using Shelby tubes
• Two hydraulic studies (both wet- and dry-weather seasons) at the downgradient edge of the PCE plume, located adjacent to Cypress Creek (and near the confluence of Cypress Creek and the Alabama River)
The data were collected to meet the following objectives:
• Assess the nature and extent of PCE in groundwater.
• Identify concentrations of COPCs in soil vapor within the site boundary where groundwater exceeds EPA residential vapor intrusion screening levels (VISLs; EPA, 2018).

SECTION 1 INTRODUCTION
AX0523180835MGM 1-3
• Evaluate the potential for VI at the AG and Annex Buildings.
• Evaluate the potential for groundwater to impact surface water in Cypress Creek.
• Provide sufficient data to evaluate potential exposure risk.
1.1.3 Supplemental EI Results Results from the Supplemental EI are summarized below. The Supplemental EI report (CH2M, 2017) is publicly available on the DEAP website at:
http://www.montgomeryal.gov/home/showdocument?id=8961
1.1.3.1 Groundwater Analytical results from the Supplemental EI groundwater sampling identified only PCE and TCE at concentrations exceeding respective screening levels (Table 1-1)1; however, TCE did not exceed the MCL. Because PCE was identified historically in the RSA Energy Plant excavation (the source of the plume), is present over the largest extent, and there is no TCE exceeding the MCL, groundwater impacts were delineated to the MCL for PCE. Figure 1-2 presents the horizontal extent of the PCE plume. Based on the investigation results, the following were concluded:
• PCE has been laterally and vertically delineated.
• PCE in groundwater is composed of two commingling plumes from different sources:
− From the historical RSA Energy Plant, a plume extends to the downstream end of Cypress Creek, adjacent to the Alabama River.
− From the industrialized area around MW-12S, a second plume extends toward the downstream end of Cypress Creek, which discharges to the Alabama River, where the two plumes comingle.
• PCE concentrations generally increase in the downgradient areas of the plumes, with the highest concentration reported at the farthest downgradient well, TMPZ-1/MW-13S.
1.1.3.2 Soil Vapor PCE and TCE results from the EI soil vapor sampling effort are summarized in Table 1-2 and shown on Figure 1-3; both PCE and TCE exceeded their respective VISLs.2 Based on the investigation results, the following was concluded:
• The highest PCE concentrations in soil vapor (above VISLs) were reported at MW-02S, downgradient of the RSA Energy Plant where PCE also is present in groundwater.
• Soil vapor TCE concentrations above VISLs were reported at MW-08S and from the 10- and 50-foot VIMS points (VIMS-10 and VIMS-50, respectively), installed north across Washington Avenue from the Annex Building (Figure 1-3).
• TCE in soil vapor at these locations is not considered related to the PCE groundwater plume at the DEAP site and is attributed to historical vadose zone releases from other sources based on:
− Low concentrations of dissolved TCE (maximum concentration 1.01 micrograms per liter [μg/L]) in groundwater.
− TCE soil vapor concentrations at the VIMS are upgradient of the PCE groundwater plume.
1 Screening levels were updated using 2018 values.
2 VISLs were updated using 2018 values.

SECTION 1 INTRODUCTION
AX0523180835MGM 1-4
− The higher proportion of TCE to PCE concentrations in soil vapor at the VIMS (i.e., PCE and TCE were detected in shallow soil vapor at the VIMS-10 at concentrations of 99.6 micrograms per cubic meter [µg/m3] and 13,100 µg/m3, respectively) indicates that TCE is from a source other than the PCE groundwater plume.
− The lateral extent of TCE at the VIMS, where soil vapor TCE concentrations are the highest, is also limited as it was not detected in the Annex Building samples collected less than 100 feet away.
− The higher concentrations of TCE in the shallow soil vapor sample (7 to 8 feet bgs) at MW-08S compared to the soil vapor sample collected above the water table (29 to 30 feet bgs) (336 µg/m3 and 27.8 µg/m3, respectively) indicate that the shallow TCE is from a source other than groundwater.
1.1.3.3 Hydraulic Study Results of the wet and dry period hydraulic studies are presented on Figure 1-4. Study results indicate the surface water and porewater of the Alabama River communicates directly with, and is the primary influence of, the movement of surface water in the downstream portion of Cypress Creek (connected via an open culvert) and groundwater at TMPZ-1/MW-13S, respectively. Influence on groundwater from the Alabama River occurs as porewater exchange, the cycling of water between the river’s surface and sediments below the river. Due to the large volume of flow in the Alabama River near Montgomery (over 37 billion liters per day3), porewater from the Alabama River acts as a hydraulic barrier that limits the migration of the PCE plume into the creek and dilutes concentrations of PCE at the downgradient edge.
1.2 Conceptual Site Model The CSM (Figure 1-5) identifies the sources, and fate and transport pathways of the COPCs based on the physical characteristics of the Montgomery DEAP site. The CSM is used to support the risk assessment (Section 2), risk management decisions, and remedial AA (Section 3), as applicable. The physical characteristics, primary release sources, transport pathways, receiving media, and potential receptors are described in the following subsections.
1.2.1 Geology/Hydrogeology The geology beneath the DEAP consists of a thin soil layer on top of quaternary terrace deposits comprised of medium to coarse-grained sand, with interbedded clay and gravel lenses. Underlying these recent terrace deposits are Cretaceous sediments of the Eutaw, Gordo, and Coker formations. The Eutaw formation is an aquifer unit characterized by two thick layers of marine sands separated by a thin layer of marine clay (Scott et al., 1987). The terrace deposits and Eutaw formation are combined to comprise the shallow aquifer. The Gordo and Coker aquifers consist of an estimated 500 feet of interbedded clay, sand, and gravel above crystalline bedrock.
The shallow aquifer is unconfined and 120 to 150 feet thick underneath the DEAP, but a localized low permeability zone may exist from approximately 35 to 50 feet bgs (ADEM, 1995). Beneath the shallow aquifer, a low-permeability sandy clay unit effectively separates it from the underlying Gordo and Coker formations.
Water levels measured at the site in July 2016 range from approximately 25 to 57 feet bgs and groundwater generally flows west-northwest (toward Cypress Creek and the Alabama River) (Figure 1-6). Based on slug tests, hydraulic conductivity in the shallow aquifer has been estimated
3 Mean discharge obtained from U.S. Geological Survey station 02420000 based on 79 years of record.

SECTION 1 INTRODUCTION
AX0523180835MGM 1-5
between 8.14 × 10⁻⁴ centimeters per second (cm/s) and 4.38 × 10⁻³ cm/s, with a geometric mean of 3.60 × 10⁻³ cm/s (Black & Veatch, 2002). The groundwater pore velocity in the shallow aquifer was calculated at 8.63 × 10⁻⁵ cm/s, based on the following equation:
𝑣𝑣 = 𝐾𝐾𝐾𝐾/𝑛𝑛
Where:
K = geometric mean of the hydraulic conductivity slug test results (0.0036 cm/s)
n = geometric mean of the porosity values obtained from the Shelby tube samples in September 2016 (0.42)
i = hydraulic gradient between MW-10S and TMPZ-1/MW-13S (calculated as 0.008 based on July 2016 groundwater elevation data
1.2.2 Surface Water Features The northwestern portion of the site is located within the 100-year flood plain of the Alabama River (Office of Water Resources, 2017). Surface water features near the site include the Alabama River and Cypress Creek; the creek comprises approximately a one-third mile portion of the northwestern DEAP site boundary and drains directly into the Alabama River (Figure 1-1). Surface water contributions to Cypress Creek include overland flow during rainfall events as well as contributions from multiple industries located along upstream portions of the creek. In addition, treated groundwater discharges into Cypress Creek upstream of the site from the Coliseum Boulevard TCE plume treatment system operated by the Alabama Department of Transportation under National Pollutant Discharge Elimination System (NPDES) permit AL0081167.
Surface water flow in Cypress Creek along the site boundary is partially restricted between two culverts (shown on Figure 1-1) that are at a higher elevation than the creek bed. The downstream culvert between the creek and the Alabama River restricts outflow, creating a ponded area immediately upstream. Alabama River water also flows into the ponded area when elevations are higher than the culvert.
1.2.3 Identification of Groundwater Plumes The DEAP site boundary includes the area where PCE was discovered during the construction of the RSA Energy Plant in 1993, as well as groundwater surrounding and downgradient from that area toward former public water supply well PW-9W, where PCE was detected at concentrations above the MCL in 1991 (Figure 1-1). As such, the DEA is not addressing all urban contaminants from various sources throughout Montgomery (CH2M, 2016).
Multiple potential sources of PCE contamination exist within the DEAP site boundary due to historical use of PCE across multiple industries such as dry cleaning. However, the DEAP investigation is related only to the PCE identified in soil during construction of the RSA Energy Plant in 1993 and in groundwater at PW-9W in 1991. During a 1993 emergency removal action, impacted soil was excavated prior to construction of the RSA Energy Plant. Following the removal action, concentrations of PCE were not identified above the EPA Regional Screening Level (RSL) in soil, indicating that the source was removed. In addition, a historical data review indicated there are no ongoing sources of PCE (i.e., no residual mass in the vadose zone) within the site boundary. Based on the 1993 source removal action of impacted soil at the RSA Energy plant, and a review of historical soil data from investigations related to the RSA Energy Plant and additional Phase 1 investigations in the site area, there are no ongoing sources of PCE to groundwater.
Although the PCE identified during construction of the RSA Energy Plant contributed to PCE in groundwater, other historical releases within the site boundary are indicated by the portion of the

SECTION 1 INTRODUCTION
AX0523180835MGM 1-6
plume that originates near MW-12S (Figure 1-2) and the presence of TCE in soil vapor (particularly at MW-08S and the VIMS) that is not related to the DEAP site plume (Section 1.1.3.2). The plume near MW-12S is not directly downgradient of the RSA Energy Plant and is located in an industrialized area. Concentrations of TCE in groundwater (at MW-08S and MW-09S near the VIMS) are not high enough to result in the detected TCE soil vapor concentrations. Based on a historical review of records, several former dry cleaners, automotive service centers, and other commercial and industrial facilities were identified in downtown Montgomery that are potential PCE and TCE sources to this area.
1.2.4 Chemical Transport Chemical transport mechanisms that may be acting on the site groundwater plumes and influencing groundwater migration are summarized in this section. Once dissolved in groundwater, three processes govern the transport of contaminants: advection, dispersion, and retardation. Advection is the most important transport process driving groundwater contaminant migration in the subsurface. Because the primary lithology in the aquifer (sand) does not appreciably retard the rate of contaminant migration relative to advective groundwater velocity, retardation is not discussed further in this section.
1.2.4.1 Advection Advection refers to the lateral movement of dissolved-phase contaminants caused by the flow of groundwater. Lateral migration at the site has resulted largely from natural hydraulic gradients to the northwest (Figure 1-6), and groundwater pore velocity within the upper portion of the aquifer was calculated at 8.63 × 10⁻⁵ cm/s or 0.245 feet per day (CH2M, 2017). The general pattern of increasing contaminant concentrations in the downgradient flow direction is consistent with plume migration via advection and a decrease in advective flow as the plume approaches and encounters porewater from the Alabama River hydraulic barrier. The decrease in groundwater pore velocity reduces the migration of dissolved phase contaminants to Cypress Creek via advection likely contributing to the higher PCE concentrations observed at downgradient well TMPZ-1/MW-13S relative to other wells.
1.2.4.2 Dispersion Hydrodynamic dispersion is the process that spreads out contaminants in groundwater in three dimensions: parallel to the direction of migration (longitudinal), laterally (transverse), and vertically. The underlying processes are mechanical dispersion and molecular diffusion. The magnitude of mechanical dispersion is proportional to groundwater velocity, and the result is typically spreading and mixing (and therefore reduced concentrations) at the plume edges. The lack of PCE exceedances/detections in the intermediate wells indicates vertical dispersion is limited to the upper portion of the aquifer (approximately 40 to 60 feet bgs), as noted by the lack of PCE in MW-07S (screened from 85 to 94.7 feet bgs).
At the downgradient edge of the plume, dispersion near Cypress Creek occurs as commingling with porewater from the Alabama River. As noted in the hydraulic study (CH2M, 2017), the influence of the porewater exchange from the Alabama River acts as a hydraulic barrier between the leading edge of the plume and Cypress Creek; this impacts the lateral dispersion of chemicals into the creek by diluting concentrations as the plume commingles with the Alabama River pore water (hydraulic barrier).
1.2.5 Fate of Chemicals 1.2.5.1 Volatility and Vapor Migration The partitioning of a molecule from aqueous phase to the vapor phase is termed volatilization. Depending on the Henry’s Law constant (a partitioning coefficient between adjacent liquid and air phases) (Table 1-3), COPCs in groundwater can volatilize at the water table into the overlying soil. The Henry’s Law constants for PCE (0.0177 atmospheric cubic meter per mole [atm-m3/mole]) and TCE (0.00985 atm-m3/mole) are indicative of compounds that easily partition into the vapor phase, where
SECTION 1 INTRODUCTION
AX0523180835MGM 1-7
they can migrate through air-filled soil pores via primarily diffusion along a concentration gradient. The tendency for COPCs to diffuse through soil depends on the chemical and physical properties (diffusion coefficients in air and water), soil porosity (higher porosity encourages diffusion), and soil moisture content (high moisture content may provide a barrier to vapor diffusion). Results of the geotechnical analysis conducted for the EI (Table 1-4) indicate little variability in soil properties across the site, with total soil porosity ranging from 0.36 to 0.48, which is typical for sandy lithology (Das, 2008).
1.2.5.2 Attenuation Attenuation processes that act to reduce contaminant concentrations in groundwater include a variety of physical, chemical, or biological processes that, under favorable conditions, act without human intervention to reduce the mass, toxicity, mobility, volume, or concentration of contaminants in soil or groundwater (EPA, 1999). These in situ processes include degradation, dispersion, dilution, sorption, volatilization, and chemical or biological stabilization, transformation, or destruction of contaminants. Degradation of PCE typically is driven by reductive dechlorination, a process where the contaminant’s chlorine atoms are replaced by electrons coupled to hydrogen atoms. This results in sequential dechlorination of PCE as follows:
PCE → TCE → cis-1,2-DCE → VC → ethene
Degradation of PCE via reductive dechlorination at the DEAP site appears limited based on very few daughter products detected in groundwater (CH2M, 2017). Therefore, dispersion and dilution are the primary mechanisms acting to attenuate the plume, although the presence of elevated PCE concentrations at co-located groundwater and soil vapor sampling locations indicates that volatilization also is occurring.
1.2.6 Land Use and Potential Exposure Scenarios The DEAP site is located in a downtown commercial, municipal, and industrial area. The area is covered primarily with private and public buildings, paved streets, and parking areas, with few areas of open space. The buildings within the DEAP site boundary were reviewed to determine building use type, as provided on Figure 1-7. The land use assessment (conducted in November 2018 based on ADEM comments received during October 2018 meetings) included a review of the city’s geographical information system (GIS), parcel boundaries, parcel land use codes (such as residential, hotel, retail, etc.), basement locations, and ownership information for state, city, and RSA parcels. Most of the buildings were identified as government buildings (i.e., municipal, state, or RSA) or industrial/commercial buildings.
A windshield survey of parcels classified in the records as residential was conducted to identify which parcels included first-floor residential occupancy. In addition, properties identified with second floor apartments or lofts were called to confirm whether any apartments were occupied on the first floor. Three first-floor residential properties4, one vacant residential lot without buildings, one school, and a child care facility were identified within the DEAP site boundary; however, these properties (Figure 1-7) are outside the groundwater plume areas and 100-foot buffer of the plume.
For the location previously identified as a potential residential property (308 Lawrence Street, as indicated to ADEM during the July 2018 meeting) within the plume boundary, a phone interview was conducted with the owner on October 25, 2018, to confirm property usage. The owner indicated that the property was used only as a short-term rental, not a residence. Moreover, the basement is used for
4 Loft apartments and other residential properties that are above the first floor are not considered due to the insignificance of potential impacts from vapor intrusion.

SECTION 1 INTRODUCTION
AX0523180835MGM 1-8
storage, the first floor is used for office space, and the typical stay does not exceed four nights. This building is not currently, and has not been, used as a first-floor residence according to the owner.
Therefore, it was concluded that no parcels located within the DEAP plume, or within a 100-foot buffer of the plume, are currently used as first-floor residential properties. The current land use is not expected to change significantly in the future within the DEAP boundary.
Potable water at the DEAP site is currently served by the Montgomery Water Works and Sanitary Sewer Board (MWWSSB). The primary public water source is surface water from the Tallapoosa River, a tributary to the Alabama River, located several miles upstream of the DEAP site. Water is also obtained from public water supply wells located at MWWSSB’s West and Southwest well fields, located generally 4 to 5 miles from the DEAP site. All public water supply wells from the former North Well Field (which extended within the DEAP site) were abandoned in 2011 except PW-9W, which was retained for environmental sampling and was abandoned in January 2019. MWWSSB is not aware of any domestic wells in use at the DEAP site (ATSDR, 2004). Additionally, the City enacted an ordinance in 2003 to prohibit future well drilling in the downtown area. Therefore, groundwater exposures for a potable use scenario are highly unlikely. However, in accordance with ADEM guidance, this HHRA conservatively assumes that potable groundwater use may occur in the future.
One industrial well is known to exist within the site boundary at the Capital Trailways bus station on North Court Street (Figure 1-1). The industrial well is not currently being used and there are no plans to use it in the future. The power lines and plumbing connected to the well and the water storage tank that the water was pumped into were removed in February of 2017, rendering the well unusable in its current state (see Appendix B). Capital Trailways has since connected to the City water supply and has no foreseeable future use for this well. However, because the well was not abandoned per ADEM guidance (the well is located within a building, making abandonment per the guidance costly), ADEM directed that this HHRA conservatively assume that bus maintenance workers could potentially use this well for washing vehicles or potable use in the future. Therefore, under this unlikely scenario, exposures to pumped water from the industrial well at the Capital Trailways bus station are considered potentially complete under a future scenario in the HHRA (Section 2).
Groundwater is present at approximately 25 to 40 feet bgs in the vicinity of the groundwater plumes. The COPCs detected in groundwater and soil vapor at the DEAP site could potentially migrate to the indoor air of overlying buildings, where commercial/industrial and government workers are present and residents could be present in the future.5 Therefore, in the HHRA, the VI pathway is considered potentially complete for future residents and current and future commercial/industrial and government workers.
The potentially complete exposure pathways identified for the DEAP site are described further in the HHRA (Section 2).
5 As previously mentioned, the first-floor residential properties and schools identified within the DEAP site boundary are outside the DEAP PCE groundwater plume exceeding the MCL (Figure 1-7). Data in the EPA Vapor Intrusion Database (EPA, 2013) suggest that significant vapor intrusion impacts typically are not observed where groundwater concentrations are less than MCLs. Therefore, the vapor intrusion pathway for PCE is likely insignificant at these areas. However, the HHRA evaluates soil vapor data collected outside of the groundwater plume areas including those collected at the AG and Annex Buildings.

AX0523180835MGM 2-1
SECTION 2
Risk Assessment Data collected during the Supplemental EI were used to evaluate risk to human health and the environment following the ARBCA (ADEM, 2017a).
2.1 Human Health Risk Assessment The HHRA was prepared for the Montgomery DEAP site to evaluate potential risks to human health associated with current and potential future exposures to soil vapor and groundwater within and at two buildings adjacent to the DEAP boundary.6 Additionally, the HHRA evaluated potential exposures to surface water (including fish consumption) at Cypress Creek, assuming groundwater from the site is discharging to Cypress Creek. The HHRA incorporates the site information and analytical data collected during the Supplemental EI conducted in accordance with the work plan (CH2M, 2016).
The ARBCA guidance (ADEM, 2017a) recommends using a tiered risk-based approach for the assessment of cumulative risk at a site. The three tiers of evaluation are: 1) RSL Evaluation, 2) Risk Management-1 (RM-1) Level Evaluation, and 3) Risk Management-2 (RM-2) Level Evaluation.7 If a chemical was detected at a concentration greater than its respective screening level in the RSL Evaluation, then the HHRA proceeded to an RM-1 Evaluation. In the RM-1 Evaluation, site-specific cumulative risks were calculated for the exposure scenarios using the chemical(s) exceeding their respective screening levels in the RSL Evaluation.
In accordance with the ARBCA process, the HHRA consists of the following:
• Conceptual Exposure Model (CEM) – Summarizes potential sources, current and reasonable-future receptors, and potentially complete exposure pathways.
• RSL Evaluation – Provides a comparison of the maximum detected site concentrations to the EPA RSLs, MCLs, or VISLs for each exposure medium.
• RM-1 Evaluation – Includes the estimation of site-specific, cumulative risks for the exposure scenarios using the chemicals exceeding the RSLs.
The CEM, RSL Evaluation, and RM-1 Evaluation are discussed in Sections 2.1.1 through 2.1.3, respectively. The supporting tables for the HHRA are provided in Appendix A-1, Tables A-1 through A-10.
2.1.1 Conceptual Exposure Model The site characteristics, contaminant sources and migration pathways, and current/future land uses are described in Section 1.2. Based on the current and likely future land uses (i.e., primarily industrial/ commercial and potential future residential) and the potential sources and migration pathways associated with the groundwater plumes, the following exposure pathways are considered potentially complete for the DEAP site (Appendix A-1, Table A-1):
• Groundwater (Discharge to Surface Water) – Current/future recreational users potentially could be exposed to site groundwater that is mixing with the Alabama River porewater and then discharging to surface water in Cypress Creek. Potential human exposure routes to surface water include ingestion of fish caught from Cypress Creek (the primary pathway based on the surface water use
6 Two properties were evaluated adjacent to the DEAP boundary and include the AG and Annex Buildings.
7 An RM-2 Evaluation was not necessary because the conclusions of the HHRA were based on the results of the RM-1 Evaluation.

SECTION 2 RISK ASSESSMENT
AX0523180835MGM 2-2
designation of Cypress Creek), incidental ingestion of water, and dermal contact during recreational activities.
• Groundwater (Indoor Air) – Current/future industrial/commercial and government workers and potential future first-floor residents in buildings could be exposed to site COPCs if chemicals in underlying groundwater migrate to indoor air through VI. The potential exposure route is inhalation.8
• Soil Vapor (Indoor Air) – Current/future industrial/commercial and government workers, and potential future first-floor residents in buildings could be exposed to site COPCs if chemicals in soil vapor migrate to indoor air through VI. The potential exposure route is inhalation.
• Wash water (Capital Trailways Bus Station) – Although unlikely, if the decommissioned bus station well is reconstructed/reconnected for future use, future bus maintenance workers could potentially contact wash water from the Capital Trailways bus station while washing vehicles, and, although highly unlikely, the bus station well could be used as a potable water source. Potential exposure routes associated with vehicle washing would be dermal contact and inhalation, while potential exposure routes associated with potable water use would be ingestion, dermal, and inhalation during showering.9 In addition to the evaluation of the wash water sample under a commercial use scenario (vehicle washing), this sample also was included in the groundwater dataset evaluated under a potable use scenario.
• Groundwater (Potable Use Scenario) – Potable use of groundwater is an incomplete exposure pathway under current and foreseeable future site conditions. The DEAP site is currently served by the MWWSSB. All public water supply wells from the former North Well Field were abandoned and there are no known domestic wells in use at the DEAP. Further, the City of Montgomery enacted an ordinance prohibiting the drilling of any future wells within a specific boundary that encompasses the current DEAP site in accordance with Montgomery City Ordinance 58-2003. Based on ADEM requirements, groundwater data from monitoring wells and the bus washing well were evaluated for a hypothetical potable use exposure scenario in the HHRA. Potential exposure routes associated with potable water use would be ingestion, and dermal contact and inhalation during showering.
Figure 2-1 provides a graphical presentation of the CEM. The potentially complete exposure pathways and hypothetical potable use exposure scenario are evaluated further in the RSL evaluation and RM-1 evaluation.
2.1.2 RSL Evaluation The RSL evaluation consists of comparing the maximum detected concentration of each COPC to the EPA’s RSLs, MCLs, and/or VISLs and identifying the chemicals of concern (COCs) for each medium (ADEM, 2017a). Therefore, the RSL evaluation for the DEAP site was conducted based on the following three steps: 1) data evaluation, 2) selection of screening levels, and 3) identification of COCs.
2.1.2.1 Data Evaluation The groundwater and soil vapor samples included in the HHRA were collected during the sampling events conducted in July and September 2016. Additionally, one wash water sample (from the bus wash sprayers) and a field duplicate sample that were collected in February 2017 from the Capital Trailways bus station prior to connecting to publicly supplied water were included in the RSL Evaluation. The 8 Potential exposures to indoor air associated with vapor intrusion from groundwater are evaluated based on soil vapor data rather than groundwater data. The soil vapor data, which were collected at locations with groundwater concentrations greater than the VISLs, were used in the HHRA because these data are more representative of potential v VI than groundwater data.
9 As discussed in Section 1.2.6, the well has been decommissioned by Capital Trailways and it is unlikely to be reconstructed for future use. However, per ADEM guidance, the sample collected from the wash water was evaluated in the HHRA.

SECTION 2 RISK ASSESSMENT
AX0523180835MGM 2-3
groundwater and soil vapor samples were analyzed for the following COPCs: PCE, TCE, cis-1,2-DCE, trans-1,2-DCE, and VC. The samples were collected in accordance with the work plan (CH2M, 2016). The sample locations are depicted on Figure 1-1. The list of samples included in the HHRA are provided in Appendix A-1, Table A-2, and the complete dataset used in the HHRA is provided in Appendix A-2.
The samples were partitioned into various data groupings based on the potential exposure scenarios identified for the DEAP site. The data groupings for each medium are described below:
• Groundwater (Discharge to Surface Water) – TMPZ-1/MW-13S, the farthest downgradient well located near the edge of the PCE plume adjacent to Cypress Creek, was sampled in July 2016. The analytical data collected from TMPZ-1/MW-13S were used to evaluate potential exposures to surface water, assuming groundwater at TMPZ-1/MW-13S is discharging to Cypress Creek. A hydraulic study was conducted as part of the Supplemental EI Report and evaluated the interaction between groundwater in TMPZ-1/MW-13S and surface water in Cypress Creek and the Alabama River (CH2M, 2017). Using the data collected from the hydraulic study and the Remedial Investigation Report (Black & Veatch, 2002), and a conservative assumption that no dilution is occurring from the Alabama River porewater, a site-specific attenuation factor of 103 was estimated, as provided in Appendix A-1, Table A-3. Although the primary influence on subsurface dilution is the Alabama River porewater, to be conservative, the dilution attenuation factor (DAF) for Cypress Creek was used in the risk assessment. For comparison, the DAF calculated using the Alabama River discharge is 1,162,880.
The concentrations in Cypress Creek were estimated using the following equation, which is based on Equation C-11 in Appendix C of the ARBCA Guidance (ADEM, 2017a):
Where:
Csw = concentration in surface water at Cypress Creek (µg/L) Cgw = concentration in groundwater at TMPZ-1/MW-13S (µg/L)
AF = attenuation factor (unitless)
The estimated surface water concentrations in Cypress Creek were as follows: 1.69 µg/L for PCE, 0.0098 µg/L for TCE, and 0.00849 µg/L for cis-1,2-DCE. Supporting calculations are provided in Appendix A-1, Table A-4.
• Soil Vapor (Indoor Air) – Soil vapor samples were collected in September 2016 from locations where COPCs were present in shallow groundwater at concentrations exceeding the EPA residential VISLs during the supplemental EI sampling (CH2M, 2017). The soil vapor samples were partitioned into four data groupings based on their proximity to buildings or association with groundwater sampling locations. The VIMS location was evaluated separately because it is not associated with a building or groundwater monitoring location. Only shallow soil vapor samples were included in this VI evaluation because the shallow samples are more likely to be representative of potential VI due to their proximity to a building’s slab. The four soil vapor data groupings are as follows:
− VIMS-10 (shallowest sample collected from the VIMS at 10 feet bgs) − AG Building – includes locations AMS-03 and AMS-04 − Annex Building – includes locations AMS-01 and AMS-02 − Monitoring wells – includes locations TMPZ-1/MW-13S, MW-12S, MW-08S, and MW-02S
The soil vapor samples within each data grouping were screened on a sample-by-sample basis.
• Wash Water (Capital Trailways Bus Station) – One sample and a field duplicate sample were collected in February 2017 from the sprayers in the bus washing area (CT-01-S) at the Capital
AFC
C GWSW =

SECTION 2 RISK ASSESSMENT
AX0523180835MGM 2-4
Trailways bus station before the business was connected to City water. The analytical data collected from the samples were used to evaluate potential direct contact exposures with wash water in the unlikely event that the well is reconstructed and used in the future by bus maintenance workers for washing vehicles. The wash water samples also were included in the groundwater dataset evaluated under a potable use scenario.
• Groundwater (Potable Use) – Although potential exposures to groundwater are considered incomplete for a potable use scenario under current and foreseeable future site conditions, groundwater data from each monitoring well and bus wash water station well (CT-01-S) were evaluated for a hypothetical potable use scenario. The groundwater analytical data were evaluated on a sample-by-sample basis for a future hypothetical potable use scenario.
For samples with field duplicate analyses, the higher of the two detected concentrations was used in the HHRA.10
2.1.2.2 Identification of Screening Levels The screening levels used for each medium in the RSL Evaluation are discussed below:
• Groundwater (Discharge to Surface Water) – The surface water screening levels were calculated using the equations, bioconcentration factors (BCFs), and exposure assumptions provided in ADEM Admin. Code r. 335-6-10 (February 2017). The toxicity values were updated and were obtained from the EPA’s Integrated Risk Information System database (EPA, 2018a). The portion of the Alabama River that is located near Cypress Creek has a Fish and Wildlife Classification only and does not have a Public Water Supply Use or Swimming Classification. Therefore, the surface water screening levels for consumption of fish only are applicable for this portion of the Alabama River and Cypress Creek. However, as a conservative approach, two sets of surface water screening levels were calculated: one set of screening levels was calculated for ingestion of fish only and a second set of screening levels was calculated for consumption of fish and water. The surface water screening levels were calculated for carcinogenic and non-carcinogenic endpoints. The screening levels were calculated for carcinogens using Equations 16 and 17, and for non-carcinogens using Equations 18 and 19, of ADEM Admin. Code r. 335-6-10 (February 2017). The lower value of the carcinogenic and non-carcinogenic screening levels was selected as the final surface water screening level. Additionally, the BCF for trans-1,2-DCE was used as a surrogate for cis-1,2-DCE because this parameter value was not available for cis-1,2-DCE. The surface water screening level calculations are provided in Appendix A-1, Table A-4. The final surface water screening levels for each COPC detected in TMPZ-1/MW-13S are summarized below:
− PCE – Screening levels of 36 µg/L and 11 µg/L were calculated for consumption of fish and consumption of water and fish, respectively.
− TCE – Screening levels of 4.8 µg/L and 0.66 µg/L were calculated for consumption of fish and consumption of water and fish, respectively.
− cis-1,2-DCE – Screening levels of 591 µg/L and 14 µg/L were calculated for consumption of fish and consumption of water and fish, respectively.
• Soil Vapor (Vapor Intrusion) – The screening levels used in the soil vapor screening comparison were the EPA VISLs for commercial and residential scenarios (EPA, 2018b). The results of the property survey (conducted in November 2018) indicated that there are no parcels or buildings within the plume or within a 100-foot buffer of the plume that are occupied by first-floor residents;
10 No COPCs were detected in the primary sample and associated field duplicate sample collected from location CT-01-S. The MDLs used for the RSL evaluation were the same for each constituent between the primary and field duplicate samples. Therefore, only the results from the primary sample (L891420-03) were used in the HHRA.

SECTION 2 RISK ASSESSMENT
AX0523180835MGM 2-5
however, there are first-floor residential units within the site boundary. Therefore, soil vapor data were screened against residential VISLs. The VISLs were based on a default attenuation factor of 0.03 for soil vapor-to-indoor air, a target individual excess lifetime cancer risk (IELCR) of 1 × 10⁻⁶ and a target noncancer hazard quotient (HQ) of 0.1. VISLs were not available for cis- and trans-1,2-DCE because EPA withdrew their inhalation toxicity values in 2014.
• Wash Water (Capital Trailways Bus Station) – The screening levels for wash water from the Capital Trailways bus station were calculated using the tap water RSLs (EPA, 2018c). The tap water RSLs were modified to only include the dermal and inhalation exposure routes because water that was formerly obtained from the now decommissioned industrial well at the bus station was used to wash vehicles and was not used as a potable water source. The modified tap water RSLs were based on a target IELCR of 1 × 10⁻⁶ and noncancer hazard index (HI) of 0.1. Although the exposure scenario at the bus station is commercial, the modified tap water RSLs are considered more protective of a bus maintenance worker because they are based mostly on conservative residential exposure assumptions; the reasonable maximum exposure duration and exposure frequency for a bus maintenance worker likely would be less than those for the EPA’s 2014 default exposure frequency and duration for a resident, which are 350 days/year and 26 years, respectively (EPA, 2014). For the dermal exposure route, the default tap water RSLs assume the total body surface area of a receptor would be exposed to groundwater while showering, although the duration of bus washing may be longer than showering time incorporated in the development of tap water RSLs. For the bus maintenance worker scenario, the actual exposed skin surface area for dermal contact would be less than a showering scenario and likely would include only hands and arms. Additionally, for the inhalation exposure route, the default tap water RSLs assume an exposure time of 24 hours and a conservative volatilization factor (VF) of 0.5, whereas the exposure time for a bus maintenance worker likely would be considerably less and the concentrations in outdoor air would be less than those estimated using a VF of 0.5.
• Groundwater (Potable Use) – The detected concentrations at each groundwater sampling location, including bus wash water station well (CT-01-S)11, were compared to EPA’s tap water RSLs and MCLs to evaluate a hypothetical future potable use scenario (EPA, 2018c). The tap water RSLs used in this evaluation were based on a target IELCR of 1 × 10⁻⁶ and noncancer HI of 0.1.
2.1.2.3 Identification of Chemicals of Concern The COPCs were identified as COCs in the RSL Evaluation if they were detected at concentrations greater than their respective screening levels, except the sample collected at the Capital Trailways bus station. None of the analyzed chemicals were detected in the bus station sample; therefore, the method detection limits (MDLs) were used as a conservative, maximum estimate of concentrations and were compared to the screening levels in the maintenance worker RSL Evaluation. The results of the screening comparison for each exposure scenario are provided below:
• Groundwater (Discharge to Surface Water) – Three COPCs (cis-1,2-DCE, PCE, and TCE) were detected at TMPZ-1/MW-13S (Table 1-1); however, the estimated concentrations in surface water in Cypress Creek were less than their respective surface water screening levels for the protection of human health (Appendix A-1, Table A-4). Therefore, no COCs were identified in groundwater based on surface water screening levels protective of human health.
• Soil Vapor (Vapor Intrusion)
Commercial Exposure Scenario: None of the detected COPCs exceeded the commercial VISLs at the AG Building or Annex Building. Two COPCs (PCE and TCE) were detected at concentrations greater
11 No COPCs were detected at the bus wash water station well (CT-01-S).

SECTION 2 RISK ASSESSMENT
AX0523180835MGM 2-6
than their respective commercial VISLs and were identified as COCs (Appendix A-1, Table A-5), although TCE in soil vapor is not related to the DEAP-site PCE groundwater plume (Section 1.1.3.2):
− VIMS-10
TCE exceeded the commercial VISL in the sample collected from the VIMS (VIMS-10).
− Monitoring Wells
PCE exceeded the commercial VISL in the sample collected from monitoring well MW-02S (AMS-MW02-08).
TCE exceeded the commercial VISL in the sample collected from MW-08S (SV-MW08-08).
Residential Exposure Scenario: None of the detected COPCs exceeded the residential VISLs at the AG Building or Annex Building. Two COPCs (PCE and TCE) were detected at concentrations greater than their respective residential VISLs and were identified as COCs (Appendix A-1, Table A-5), although TCE in soil vapor is not related to the DEAP-site PCE groundwater plume (Section 1.1.3.2):
− VIMS-10
TCE exceeded the residential VISL in the sample collected from the VIMS (VIMS-10).
− Monitoring Wells
PCE exceeded the residential VISL in the sample collected from monitoring well MW-02S (AMS-MW02-08).
PCE and TCE exceeded their residential VISLs in the sample collected from MW-08S (SV-MW08-08).
In soil vapor, cis- and trans-1,2-DCE were detected in one sample (VIMS-10-0916) at concentrations of 88.6 µg/m3 and 2.55 µg/m3, respectively. However, there are no commercial or residential VISLs for these chemicals.
• Wash Water (Capital Trailways Bus Station) – No COPCs were detected in the wash water sample collected from the bus station. However, two COPCs (TCE and VC) had MDLs greater than the modified tap water RSLs (Appendix A-1, Table A-6).
• Groundwater (Potable Use)12 – Two COPCs (PCE and TCE) were detected at concentrations greater than the tap water RSLs and/or MCLs and were identified as COCs (Appendix A-1, Table A-7):
− PCE exceeded the tap water RSL and MCL at MW-02S, MW-03S, MW-08S, MW-12S, and TMPZ-1/MW-13S.
− TCE exceeded the tap water RSL at MW-03S, MW-08S, MW-09S, MW-12S, and TMPZ-1/ MW-13S. None of the detected TCE concentrations exceeded the MCL.
2.1.2.4 Scenarios Carried Forward to the RM-1 Evaluation Based on the RSL evaluation, COPC concentrations in soil vapor exceeded the VISLs and two COCs (PCE and TCE) were identified for the VI exposure scenario. However, as presented in Section 1.1.3.2, TCE in soil vapor is not related to the DEAP-site PCE groundwater plume. Although not detected in the samples, the MDLs of two COPCs in the sample collected at the Capital Trailways bus station were greater than the modified tap water RSLs. Additionally, two COPCs (PCE and TCE) were detected at concentrations greater than the tap water RSLs and/or MCL at six monitoring wells. Therefore, in accordance with ADEM guidance, a further evaluation of potential commercial and potable use of wash water at the bus 12 Potable use of groundwater is an incomplete pathway under current and anticipated future site conditions. The DEAP site is currently served by the MWWSSB. All public water supply wells from the former North Well Field were abandoned and there are no known domestic wells in use at the DEAP site. Additionally, the City enacted an ordinance in 2003 to prohibit future well drilling in the downtown area.

SECTION 2 RISK ASSESSMENT
AX0523180835MGM 2-7
station and hypothetical potable use of groundwater at the six monitoring wells was performed in the RM-1 Level Evaluation.
2.1.2.5 Scenarios Not Carried Forward to the RM-1 Evaluation No COCs were identified for the groundwater discharge to surface water exposure scenario in the RSL evaluation. Therefore, additional evaluation at the RM-1 Level for this exposure scenario was not required in the HHRA.
2.1.3 RM-1 Evaluation The RM-1 Evaluation includes the calculation of risk for each COC, each complete exposure pathway, and the cumulative risks for each receptor (ADEM, 2017a). The estimated cumulative risks for each receptor scenario are then compared to the allowable risk standards. The allowable risk standards under the ARBCA process include an IELCR of 1 × 10⁻⁵ and a non-carcinogenic HI of 1.013. Generally, RAs are not warranted if the cumulative IELCR is equal to or less than 1 × 10⁻⁵ and the estimated HQ or HI is equal or less than 1.0, although actions may be warranted if a promulgated standard (such as an MCL) is exceeded.
2.1.3.1 Approach for Calculating Carcinogenic Risks and Non-Carcinogenic Hazards The IELCR is the increase in the probability of an individual developing cancer due to exposure to a COC through a complete exposure pathway. The probability of developing cancer as a result of exposure to two or more COCs and by two or more exposure pathways is calculated by summing the risk estimates for each COC in the appropriate scenarios. For non-carcinogenic effects, HQs and HIs are estimated to determine the potential for adverse health effects. The HQ represents the ratio of the estimated dose or exposure concentration of a COC to the reference dose or reference concentration, respectively. An HQ that exceeds 1.0 (i.e., estimated dose exceeds the reference dose or exposure concentration exceeds the reference concentration) indicates that there is a potential for adverse health effects associated with exposure to that COC. To assess the potential for non-carcinogenic health effects posed by exposure to multiple COCs and exposure routes, an HI approach is used (ADEM, 2017a). The HI approach assumes that non-carcinogenic hazards associated with exposure to more than one COC and exposure route are additive. The HI is calculated by summing the HQs for each COC in the appropriate scenarios.
Potential IELCRs and non-carcinogenic HQs or HIs were estimated for the COCs identified in soil vapor samples, in wash water at the Capital Trailways bus station, and in groundwater samples. The IELCR and HQs or HIs were estimated for the soil vapor COCs (including TCE in soil vapor that is not related to the DEAP-site PCE groundwater plume) using EPA’s VISL Calculator (EPA, 2018b) and the default soil vapor-to-indoor air attenuation factor of 0.03. The estimated IELCRs and HQs or HIs for each soil vapor sampling location are provided in Appendix A-1, Table A-8. The VISL calculator worksheets are provided in Appendix A-3.
The potential IELCRs and non-carcinogenic HIs for the COCs identified in the wash water at the Capital Trailways bus station and groundwater samples (potable use scenario) were estimated using a ratio approach based on the detected concentrations in groundwater and tap water RSL, as provided in the following general equations:
𝐼𝐼𝐼𝐼𝐼𝐼𝐼𝐼𝐼𝐼 = 𝑇𝑇𝐼𝐼 ×𝐼𝐼𝐺𝐺𝐺𝐺𝑆𝑆𝐼𝐼𝑐𝑐
𝐻𝐻𝐼𝐼 = 𝑇𝑇𝐻𝐻𝐼𝐼 ×𝐼𝐼𝐺𝐺𝐺𝐺𝑆𝑆𝐼𝐼𝑛𝑛𝑐𝑐
Where:
IELCR = Individual Excess Lifetime Cancer Risk 13 Note that EPA’s current risk assessment practice requires that final non-carcinogenic HI be presented with one significant figure only (EPA, 2004).

SECTION 2 RISK ASSESSMENT
AX0523180835MGM 2-8
HI = Hazard Index CGW = Concentration in groundwater (µg/L) SLc = Carcinogenic tap water RSL, based on cancer risk of 1 × 10⁻⁶ (µg/L) SLn = Non-carcinogenic tap water RSL, based on hazard index of 1.0 (µg/L) TR = Screening Level Target Risk of 1 × 10⁻⁶ THI = Screening Level Target Hazard Index of 1.0
Because no COPCs were detected in the wash water at the Capital Trailways bus station, the MDL was conservatively used as the potential commercial exposure concentration for the COPCs. Additionally, as indicated in Section 2.1.2.2, modified tap water RSLs were used to estimate the potential IELCR and HI for a commercial exposure scenario associated with the wash water sample. The estimated IELCRs and HI for wash water from the bus station and for potable use of groundwater are provided in Appendix A-1, Table A-9 and Table A-10, respectively, and are discussed in Section 2.1.3.2.
2.1.3.2 Summary of Risk Results The estimated IELCRs and HQ or HIs for each exposure scenario are summarized below:
• Soil Vapor (Vapor Intrusion) –
Commercial Exposure Scenario: Potential IELCRs and HQs were estimated for three soil vapor sampling locations (VIMS-10, MW-08S, and MW-02S), as provided in Appendix A-1, Table A-8. Soil vapor COCs identified as risk drivers under the commercial exposure scenario include PCE and TCE, although TCE in soil vapor is not related to the DEAP- site PCE groundwater plume (Section 1.1.3.2):
− VIMS-10
The estimated IELCR was 1 × 10⁻⁴ and the estimated non-carcinogenic HQ was 44.9 due to TCE.
− Monitoring Wells
MW-08S – The estimated IELCR was 3 × 10⁻⁶ and the estimated non-carcinogenic HQ was 1.2 due to TCE.
MW-02S – The estimated IELCR was 3 × 10⁻⁶ and the estimated non-carcinogenic HQ was 0.8 due to PCE.
Residential Exposure Scenario: Potential IELCRs and HQs were estimated for three soil vapor sampling locations (VIMS-10, MW-08S, and MW-02S), as provided in Appendix A-1, Table A-8. Soil vapor COCs identified as risk drivers under the residential exposure scenario include PCE and TCE, although TCE in soil vapor is not related to the DEAP-site PCE plume (Section 1.1.3.2):
− VIMS-10
The estimated IELCR was 8 × 10⁻⁴ and the estimated non-carcinogenic HQ was 188.0 due to TCE.
− Monitoring Wells
MW-08S – The estimated IELCR was 2 × 10⁻⁵ and the estimated non-carcinogenic HI was 5.2 due mainly to TCE.
MW-02S – The estimated IELCR was 1 × 10⁻⁵ and the estimated non-carcinogenic HQ was 3.6 due to PCE.
• Wash Water (Capital Trailways Bus Station) – The estimated IELCR was 2 × 10⁻⁶ and the estimated non-carcinogenic HI was 0.1 due to TCE and VC (Appendix A-1, Table A-9); however, the estimated risks are based on the MDLs because these chemicals were not detected.

SECTION 2 RISK ASSESSMENT
AX0523180835MGM 2-9
• Groundwater (Potable Use Scenario) – Potential IELCRs and HIs were estimated for monitoring wells where COCs were detected, as provided in Appendix A-1, Table A-10:
− MW-02S – The estimated IELCR was 3 × 10⁻⁶ and the estimated non-carcinogenic HI was 0.8.
− MW-03S – The estimated IELCR was 2 × 10⁻⁶ and the estimated non-carcinogenic HI was 0.4.
− MW-08S – The estimated IELCR was 8 × 10⁻⁶ and the estimated non-carcinogenic HI was 2.1 due to PCE.
− MW-09S – The estimated IELCR was 1 × 10⁻⁶ and the estimated non-carcinogenic HI was 0.2.
− MW-12S – The estimated IELCR was 6 × 10⁻⁶ and the estimated non-carcinogenic HI was 1.6 due to PCE.
− TMPZ-1/MW-13S – The estimated IELCR was 2 × 10⁻⁵ and the estimated non-carcinogenic HI was 4.6 due to PCE.
The estimated cumulative IELCRs were compared to ADEM’s target risk of 1 × 10⁻⁵ and the estimated non-carcinogenic hazards were compared to the target HQ and HI of 1.0.14
2.1.3.3 RM-1 Evaluation Conclusions Under the commercial exposure scenario, the estimated IELCRs and HQs for soil vapor were less than ADEM’s target risks of 1 × 10⁻⁵ and 1.0, respectively, except for the IELCR and HQs estimated for VIMS-10. At MW-08S, the HQ slightly exceeded ADEM’s target due to TCE concentrations in soil vapor.15 Also, TCE in soil vapor is not related to the DEAP-site PCE groundwater plume (Section 1.1.3.2).
Under the residential exposure scenario, the estimated IELCRs for soil vapor exceeded ADEM’s target risk of 1 × 10⁻⁵, and/or the estimated HQs for soil vapor exceeded ADEM’s target HI of 1.0 at sampling locations VIMS-10, MW-08S, and MW-02S. These exceedances were due to TCE (that is not related to the PCE groundwater plume at the DEAP site) at VIMS-10 and MW-08S, and PCE at MW-02S.
The estimated IELCR and HI for wash water from the bus station were less than ADEM’s target risk of 1 × 10⁻⁵ and target HI of 1.0, respectively.
The estimated IELCR and/or HI for a hypothetical potable use scenario exceeded ADEM’s target risk of 1 × 10⁻⁵ and/or target HI of 1.0 at three monitoring wells (MW-08S, MW-12S, and TMPZ-1/MW-13S). The exceedances were primarily due to PCE in groundwater, with a smaller contribution from TCE in groundwater.
TCE is identified as a risk driver in soil vapor at the VIMS-10 and MW-08S sampling locations for both commercial and residential scenarios. However, consistent with the CSM, TCE concentrations in soil vapor at these locations are not considered to be related to the PCE plumes, are attributed to historical releases of TCE from separate sources that appear limited to the vadose zone, and are localized in extent. Therefore, TCE concentrations in soil vapor are not related to the DEAP site PCE groundwater plume that the DEA agreed to address. (Section 1.1.3.2).
Based on the lack of TCE detections or concentrations exceeding the VISL in the soil vapor samples collected at the Annex Building (less than 100 feet from the VIMS), the TCE exceedances at the VIMS are localized to the vicinity of the VIMS and do not present a VI concern under current conditions because of the lack of receptors within 100 feet of the VIMS. Similar conditions (limited lateral extent) are expected 14 Note that a target HQ and HI of 1 were used in the Draft Risk Assessment/Alternatives Analysis Report (CH2M, July 2018), which are consistent with EPA risk assessment guidance; however, under the ARBCA process, an additional significant figure is included (i.e., HQ and HI of 1.0).
15 Note that although the HQ slightly exceeded ADEM’s target because of TCE concentrations in soil vapor, it did not exceed EPA’s target HI of 1 (EPA, 1989, 2004).

SECTION 2 RISK ASSESSMENT
AX0523180835MGM 2-10
to exist at MW-08S based on much lower TCE soil vapor concentrations than those noted at the VIMS. At MW-08S, the HQ for the commercial scenario slightly exceeded ADEM’s target due to TCE concentrations in soil vapor. Furthermore, several conservative assumptions including the use of the residential-based attenuation factor (see Section 2.1.4) are included in the calculation of the HQs for the commercial use scenario and it is likely that the resulting HQs are an overestimation of potential VI risk. Although data collected from the building nearest to the VIMS (within 100 feet) indicate there is not a current VI concern in this area, no additional samples were collected by the DEA near MW-08S. However, TCE was not detected in previous soil vapor samples collected by the U.S. Geological Society (USGS) using Gore Sorbers™ adjacent to MW-08S (Figure 2-2); only low levels of PCE were detected (CH2M, 2016). Further, Alabama Power collected samples of soil excavated during the construction of a duct bank near MW-08S and did not detect PCE or TCE in the samples.
Consistent with ARBCA, which defaults to EPA guidance (EPA, 2015) for technical issues related to VI, an area of interest (AOI) defined as a 100-foot radius from a VISL exceedance, was identified around MW-08S. The AOI is shown on Figure 2-2 and includes public right of way and a portion of a City-owned vacant lot. Because a VI decision unit (DU) is defined by the footprint of a potentially impacted building, and there are currently no buildings within the AOI, there is currently no DU. Future DUs would apply to any building that is constructed, even partially, within the DU. Currently, there is no exposure risk from TCE in soil vapor at MW-08S because of the lack of buildings within 100 feet of MW-08S.
2.1.4 Uncertainty Analysis The volatilization of subsurface contaminants could be expected to increase with increases in soil and groundwater temperature, and typically higher soil vapor concentrations would be noted in summer, when such temperatures are highest. In addition, changes in groundwater elevation may affect vapor concentrations at the surface. Rising groundwater elevations can push the vapors upwards through the vadose zone, as well as decrease the distance between the groundwater vapor source and the surface. EPA guidance suggests that soil vapor samples be collected during multiple sampling events to characterize seasonal variability in climate and identify a reasonable maximum VI condition (EPA, 2015). At the DEAP site, one round of soil vapor sampling was conducted. However, to conservatively account for the potential effects of seasonality, the soil vapor data were collected during the summer (July 2016), when seasonal temperature effects are expected to result in higher soil vapor concentrations, to represent a reasonable maximum VI condition. This sampling technique was documented in the ADEM-approved work plan (CH2M, 2016). Furthermore, groundwater is 25 to 60 feet below ground surface at the DEAP site, and groundwater levels are not expected to fluctuate more than a few feet per year (as noted in the transducer study conducted in February and August 2016 at TMPZ-1 [Figure 1-4]). Therefore, seasonal fluctuations in groundwater elevations are not expected to have a significant impact on soil vapor concentrations or vapor intrusion potential.
The HHRA conservatively assumes that soil vapor concentrations remain constant throughout the exposure period at each sampling location. However, historical and recent groundwater data collected at the site indicate stable to decreasing concentration trends in the PCE plume (CH2M, 2017). The detected VOC concentrations in soil vapor at each sampling location were used to estimate potential indoor air concentrations and risks for residential and commercial receptors. This approach typically will lead to an overestimation of actual risks because receptors are assumed to be exposed to indoor air concentrations estimated based on the detected concentrations in soil vapor for the entire exposure duration, without accounting for decreases in COPC concentrations due to natural attenuation or biodegradation.
Two VOCs (cis-1,2-DCE and trans-1,2-DCE) detected in soil vapor currently have no inhalation toxicity values from the hierarchy of EPA recommended toxicity value sources (EPA, 2003) to calculate VISLs. An appropriate surrogate chemical could not be identified in the EPA database for cis-1,2-DCE and trans-

SECTION 2 RISK ASSESSMENT
AX0523180835MGM 2-11
1,2-DCE. Therefore, these two VOCs could not be quantitatively evaluated in the HHRA, and risks may be underestimated for the soil vapor sampling location (VIMS-10) that had detections of these VOCs.
EPA’s default attenuation factor of 0.03 for soil vapor-to-indoor air is not based on site-specific data and is conservative, particularly for commercial or industrial buildings. The soil vapor VISLs calculated using this conservative default attenuation factor reflect reasonable worst-case conditions (i.e., residential structures), as described in EPA’s Vapor Intrusion Guide (EPA, 2015). Therefore, the VISLs used in the RSL and RM-1 evaluations likely overestimate the potential for VI at commercial or industrial buildings.
2.1.5 HHRA Summary and Conclusions A HHRA was conducted to evaluate potential risks to human health associated with current and future exposures to soil vapor and groundwater within and adjacent to the DEAP site boundary. The groundwater and soil vapor samples included in the HHRA were collected during the sampling events conducted in July and September 2016. Additionally, one wash water sample and a field duplicate were collected in February 2017 from the Capital Trailways bus station and were included in the HHRA per ADEM’s direction.
The HHRA was conducted in accordance with the ARBCA guidance (ADEM, 2017) and was based on a tiered approach, which included an RSL Evaluation and RM-1 Level Evaluation. The HHRA did not proceed to an RM-2 Level Evaluation; an AA was performed to address potential risk identified in the RM-1 Evaluation. Therefore, additional evaluation at the RM-2 Level was not required in the HHRA.
2.1.5.1 RSL Evaluation The RSL Evaluation consists of comparing the maximum detected concentration of each COPC to the EPA’s RSLs, MCLs, and/or VISLs, and selecting the COCs for each medium. The results of the RSL Evaluation are summarized below for each exposure scenario:
• Groundwater (Discharge to Surface Water) – No COCs were identified.
• Soil Vapor (Vapor Intrusion) – PCE and TCE were identified as COCs under potential commercial and residential exposure scenarios at MW-02S (PCE), the VIMS-10 (TCE unrelated to the PCE groundwater plume at the DEAP site), and MW-08S (TCE unrelated to the PCE groundwater plume at the DEAP site).
• Wash water (Capital Trailways Bus Station) – No COPCs were detected in the sample collected from the sprayers at the bus station; however, the MDLs of TCE and VC were greater than the modified tap water RSLs.
• Groundwater (Potable Use) – PCE and TCE were identified as COCs. PCE exceeded the tap water RSL and MCL at MW-02S, MW-03S, MW-08S, MW-12S and TMPZ-1/MW-13S. TCE exceeded the tap water RSL, but not the MCL, at MW-03S, MW-08S, MW-09S, MW-12S and TMPZ-1/MW-13S.
2.1.5.2 RM-1 Evaluation
Under a commercial exposure scenario, the estimated IELCR for soil vapor at VIMS-10 exceeded ADEM’s target risk level of 1 × 10⁻⁵ due to TCE. However, TCE exceedances at the VIMS appear to be localized; concentrations were less than the VISL in the soil vapor samples collected at the Annex Building (less than 100 feet from the VIMS). Because of the lack of other buildings within 100 feet of the VIMS, no current receptors are identified in this area. At MW-08S, although the HQ slightly exceeded ADEM’s target due to TCE concentrations in soil vapor, it did not exceed EPA’s target HI of 1 (EPA, 1989; 2004) and is likely an overestimation of risk based on conservative assumptions used in the calculation. Also, TCE in soil vapor is not related to the PCE groundwater plume at the DEAP site (Section 1.1.3.2). In addition, there are no current exposures to soil vapor around MW-08S as there

SECTION 2 RISK ASSESSMENT
AX0523180835MGM 2-12
are no buildings within a 100-foot radius of the sample location. The alternatives evaluated to address PCE in soil vapor would also mitigate VI potential from TCE.
Under a residential exposure scenario, the estimated IELCR and HQ/HI for soil vapor at VIMS-10 (due to TCE), MW-08S (due to TCE), and MW-02S (due to PCE) also exceeded ADEM’s target risk levels of 1 × 10⁻⁵ and HI of 1.0. However, no parcels currently occupied by first-floor residents were identified within the PCE plume in groundwater, a 100-foot buffer of the plume, or 100-foot radius of each sample location during the property survey (Figure 1-7). Although a first-floor residential property initially was thought to be present near MW-08S, it was concluded that this property is used as a short-term rental and not as a residence. Therefore, the residential VI exposure pathway is not considered complete; however, the potential for VI will be included in the alternatives analysis to mitigate the potential for future exposure.
The estimated IELCRs and HIs associated with commercial exposure to the wash water at the Capital Trailways bus station were within acceptable levels.
The estimated IELCR and/or HI for a hypothetical potable use scenario exceeded ADEM’s target risk of 1 × 10⁻⁵ and/or target HI of 1.0 at three monitoring wells (MW-08S, MW-12S, and TMPZ-1/MW-13S). The exceedances were primarily due to PCE in groundwater, with a smaller contribution from TCE in groundwater.
2.2 Screening-Level Ecological Risk Assessment This section presents a SLERA for the DEAP site, specifically for the discharge of groundwater containing COPCs into Cypress Creek. According to ARBCA guidance (ADEM, 2017a), any site where ecological receptors may be affected will undergo an RM-2 Evaluation.
The assessment follows the EPA Ecological Risk Assessment Guidance (EPA, 1997) and uses screening values from EPA Region 4 (EPA, 2018d). The SLERA includes Steps 1 and 2 of the EPA 8-step process:
• Step 1 Screening-Level Problem Formulation and Ecological Effects Evaluation • Step 2 Screening-Level Preliminary Exposure Estimate and Risk Calculation
The objective of a SLERA is to determine whether there are complete exposure pathways to contamination at levels that warrant further risk evaluation or consideration of remedy.
2.2.1 Screening Level Problem Formulation The screening-level problem formulation addresses the ecological setting and the ecological CSM. The ecological CSM is consistent with the overall CSM (Section 1.2) but focuses on the ecological exposure pathways and exposure routes.
2.2.1.1 Ecological Setting Based on investigations to date (CH2M, 2017), groundwater associated with the plume may discharge into the partially restricted, “ponded” area of Cypress Creek, after mixing with porewater from the Alabama River. In a biological assessment of Cypress Creek conducted by the U.S. Army Corps of Engineers (CH2M, 2012), the potential discharge zone is referred to as Reach 4. As noted in that study, the majority of the reach was a lentic (still water) environment with slow glides and deep pools with soft silts due to the impoundment at the bottom of the reach. The riparian corridor (floodplain closest to the stream channel) was constricted along the right bank with a nearby commercial property; however, the riparian buffer (i.e., vegetated area near the stream channel that helps shade and protect the stream from adjacent land uses) on the left bank provided a fairly dense canopy cover with several dominant overstory species such as box elder (Acer negundo), American elm (Ulmus americana), paper mulberry (Broussonetia papyrifera), and cottonwood (Populus deltoides). It also was observed that the stream had an excessive amount of green and brown filamentous algae and debris associated with runoff.

SECTION 2 RISK ASSESSMENT
AX0523180835MGM 2-13
The results of the biological assessment indicated that the watershed has been 75 percent developed by multiple facilities upstream of the DEAP site and the available aquatic habitat and water quality have been negatively impacted by changes in hydrologic conditions, erosion, sedimentation, and multiple point and nonpoint sources of pollutants (CH2M, 2012). The fish community qualitative rating for sampling stations in Cypress Creek was very poor, the habitat condition ratings were poor or very poor, and the temperature and dissolved oxygen (DO) in the stretch subject to potential contaminant discharge did not meet ADEM temperature or DO standards.
2.2.2 Ecological Conceptual Site Model The main objective of the ecological CSM is to identify any complete and critical exposure pathways that could be present for ecological receptors. Key components of the model are discussed in the following subsections.
2.2.2.1 Potential Source Areas The source is COPCs in groundwater, as demonstrated by detections in well TMPZ-1/MW-13S (Figure 1-2). This well is closest to the potential Cypress Creek discharge point and is where the maximum COPC detections were reported at the site.
2.2.2.2 Release Mechanisms and Transport Pathways The primary mechanism for chemical release and transport is migration of groundwater to the groundwater-surface water interface (GSI) at Cypress Creek. However, at this reach of Cypress Creek, ground water inflow towards the creek first encounters and mixes with Alabama River porewater. At the GSI, sediment (including sediment porewater) and surface water may be impacted. Once in the waterway, diffusion, river flow, and bioturbation can facilitate the movement of contaminants.
2.2.2.3 Exposure Pathways and Routes Groundwater is not considered an exposure medium since ecological receptors, beyond microbes, are not directly exposed to it. Although there are no direct exposure pathways between ecological receptors and groundwater contaminants, there is the potential for exposure to ecological receptors due to groundwater inflow mixing with porewater and potentially migrating to the GSI.
Potentially complete exposure pathways exist for lower trophic level receptors that live in Cypress Creek (e.g., plants, invertebrates, fish, amphibians, and reptiles), primarily via direct contact. Ecological receptors that live in or on the surface of the sediment (e.g., benthic invertebrates) in the hypothetical discharge zone could be exposed to plume-related contaminants in sediment pore water or surface water. Receptors inhabiting the water column (e.g., fish) also could be exposed to contaminants in the discharge.
Upper-trophic-level receptors (e.g., fish-eating birds) are not expected to be significantly exposed because of the limited quality of the habitat and because the COPCs are not considered important bioaccumulative compounds (EPA, 2000).
2.2.2.4 Assessment and Measurement Endpoints Problem formulation includes the selection of ecological endpoints based on the CSM. Two types of endpoints, assessment endpoints and measurement endpoints, are defined as part of the SLERA process (EPA, 1997). An assessment endpoint is an explicit expression of the environmental component or value that is to be protected. A measurement endpoint is a measurable ecological characteristic related to the component or value chosen as the assessment endpoint.

SECTION 2 RISK ASSESSMENT
AX0523180835MGM 2-14
The endpoints and risk questions for this SLERA, which focused on lower trophic level receptors, were as follows:
• Assessment Endpoint – Survival, growth, and reproduction of the aquatic community.
• Risk Question – Are site-related constituent concentrations in groundwater sufficient to adversely affect the aquatic community?
• Measurement Endpoint – Comparison of estimated concentrations in surface water with screening values intended to be protective.
2.2.3 Ecological Effects Evaluation The purpose of the ecological effects evaluation is to establish constituent exposure levels (screening values) that represent conservative thresholds for adverse ecological effects. One set of screening values typically is developed for each selected assessment endpoint.
TCE, PCE, and cis-1,2-DCE were detected in TMPZ-1/MW-13S (Table 1-1). There are no aquatic life criteria for these compounds in ADEM Admin. Code Ch. 335-6-10. Chronic freshwater screening values in EPA Region 4 (2018d) are as follows:
• PCE – 53 μg/L • TCE – 220 μg/L • cis-1,2-DCE – 620 μg/L
2.2.4 Screening-Level Preliminary Exposure Estimation Two types of exposure values were considered: 1) the concentrations in groundwater, and 2) the concentrations estimated in Cypress Creek surface water considering attenuation and dilution. Concentrations in TMPZ-1/MW-13S were as follows:
• PCE – 174 μg/L • TCE – 1.01 μg/L • cis-1,2-DCE – 0.874 μg/L
The DAF estimated for Cypress Creek was 103 (Table 3 of Appendix A-1). Dividing the TMPZ-1/MW-13S groundwater concentrations by 103 yields the following estimated surface water concentrations16:
• PCE – 1.69 μg/L • TCE – 0.009 μg/L • cis-1,2-DCE – 0.008 μg/L
2.2.5 Screening-Level Risk Calculation The HQs were calculated by dividing the exposure concentrations by the screening values. Two sets of HQs were calculated, with the first set conservatively using the measured groundwater concentrations at TMPZ-1/MW-13S as the exposure concentrations (assumes no dilution between TMPZ-1 and the creek). For example, the TMPZ-1/MW-13S concentration of 174 µg/L for PCE was divided by the PCE screening value of 53 µg/L, with a resulting HQ of 3.3. The second set of HQs used the COPC
16 The COPC concentrations in Cypress Creek surface water samples, collected in 2006 and 2008 at stations 0241998809 and 024198808, were lower than the estimated values generated from this report using a DAF of 103. In the 2006 and 2008 surface water sampling events, only PCE was detected, at a maximum concentration of 0.52 µg/L. (USGS, 2008).

SECTION 2 RISK ASSESSMENT
AX0523180835MGM 2-15
concentrations in Cypress Creek that were estimated based on the DAF presented in Appendix A, Table A-3 of Appendix A-1. The HQs calculated for the three COPCs were as follows:
• HQs Using Measured TMPZ-1/MW-13S Groundwater Concentrations − TCE – 0.005 − PCE – 3.3 − cis-1,2-DCE – 0.001
• HQs Using Estimated Surface Water Concentrations − TCE – <0.001 − PCE – 0.03 − cis-1,2-DCE – <0.001
A potential for risk is identified when the maximum concentration of a contaminant exceeds the chronic freshwater screening value (i.e., when the HQ exceeds 1). For TCE and cis-1,2-DCE, both the groundwater and estimated surface water concentrations were lower than their respective screening values (HQ < 1). For PCE, the groundwater concentration was higher than the screening value (HQ >1), but the estimated surface water concentration was two orders of magnitude lower than the screening value (HQ <1) and does not account for dilution from the Alabama River.
2.2.6 Uncertainties Uncertainties are present in all ecological risk assessments (ERAs) because of the limitations of available data and the need to make certain assumptions and extrapolations based on incomplete information. The main uncertainties in this ERA are the groundwater and dilution modeling and the available data for TMPZ-1/MW-13S. However, given the extremely low HQs for the estimated surface water concentrations, it is unlikely that inaccuracies in estimated surface water concentrations would cause an incorrect conclusion about risks. In addition, given that dilution with Alabama River porewater is not considered, dilution and retardation of plume movement within the porewater exchange increase the likelihood by over four orders of magnitude that the plume will not negatively impact the creek.
2.2.7 Risk Characterization The HQs indicate little potential for significant risk to receptor populations associated with the potential discharge of COPCs in groundwater into Cypress Creek. In addition, because of development within the majority of the Cypress Creek watershed upstream of the DEAP site, the habitat in the reach of Cypress Creek at the downgradient boundary of the DEAP site is considered to be poor to very poor (CH2M, 2012).
EPA (1997) defines a scientific/management decision point at the end of Step 2. The decision to be made is whether a full ecological risk assessment is necessary (or remediation should be considered). Based on the results of the SLERA, the assessment endpoint was met and no further risk assessment or consideration of remedy is recommended for ecological receptors at this time.

AX0523180835MGM 3-1
SECTION 3
Alternatives Analysis This section describes the steps to evaluate alternatives for addressing potential identified risks to human health, including presentation of remedial action objectives (RAOs) and applicable, relevant, and appropriate requirements (ARARs), definition of preliminary remediation goals (PRGs), and the evaluation of potential alternatives.
3.1 Remedial Action Objectives RAOs establish the goals of the proposed RA and provide the basis for the RA alternatives. As detailed in the HHRA in Section 2.1.4, PCE concentrations in groundwater were identified at concentrations exceeding the MCL, which may pose potential risks to human health if groundwater were used for potable purposes. Although groundwater is not currently used for potable purposes at the site, RAOs for groundwater were conservatively established to address the potential for future potable use. Therefore, the MCLs are selected as the PRGs for this pathway. Additionally, the City has requested that the Capital Trailways well be abandoned in accordance with Montgomery Municipal Code (Chapter 14, Article IV, Section 14-138) because it is no longer in use.
Based on the results of the 2017 hydraulic study (CH2M, 2017), PCE concentrations in groundwater are mixing with porewater from the Alabama River and potentially discharging to surface water in Cypress Creek. However, estimated PCE concentrations in Cypress Creek were less than the human and ecological surface water quality criteria. The estimated PCE concentrations in the creek are considered biased high because the calculated DAF of 103 did not consider dilution from the Alabama River porewater, which mixes with groundwater in the subsurface as far as TMPZ-1/MW-13S based on the hydraulic studies (Appendix A, Table A-3 of Appendix A-1). The DAF would increase by orders of magnitude if the Alabama River discharge were included in the calculations. Given the discharge of the Alabama River (over 37 billion L/day) and poor habitat of the creek, RAOs are not needed for surface water.
In soil vapor, PCE concentrations were identified that contribute to potential future human health risks through the VI exposure pathway. Based on the CSM, TCE concentrations are not related to the PCE plume, rather are attributed to historical vadose zone releases from other sources; therefore, TCE in soil vapor is not related to the PCE groundwater plume at the DEAP site (CH2M 2016) and is not specifically considered in the alternatives analysis. However, alternatives that address PCE in soil vapor also will address TCE in soil vapor.
The RAOs for the DEAP site are:
• Protect human health and the environment from exposure to COPCs in groundwater at concentrations above their respective MCLs.
• Protect human health from potential future exposure to COPCs in soil vapor.
• Minimize disruptions to property owners and business from activities related to the implementation of the RA.
These RAOs will serve as the foundation for the development and evaluation of RA alternatives at the site.

SECTION 3 ALTERNATIVES ANALYSIS
AX0523180835MGM 3-2
3.2 Development and Screening of Alternatives This section presents the development and preliminary screening of alternatives. Alternatives identified as potentially applicable to the DEAP site are based on the identified potential future risks and compliance with the two threshold criteria established by EPA:
1. Overall protection of human health and the environment– The selected alternative must provide adequate protection to human health and the environment. The selected alternative should focus on providing adequate protection and describe how potential future site risks posed through each pathway are addressed, eliminated, reduced, or controlled.
2. Compliance with ARARs – Each alternative is evaluated to assess compliance with chemical-specific, action-specific, and location-specific ARARs, as summarized in Table 3-1.
Site characteristics such as location and aquifer chemistry are included in the screening step to identify potentially significant problems with the implementability, safety, and effectiveness of possible remedial technologies. The technologies that remained following screening were assembled into RAs for each medium that meet the RAOs, satisfy ARARs, and address chemicals that pose potential future risks. In addition, the National Oil and Hazardous Substances Pollution Contingency Plan (NCP) requires that No Action be included as an alternative to provide a baseline for comparison of the other alternatives and is carried forward throughout the alternatives evaluation.
3.2.1 Potential Alternatives Remedial alternatives considered to be potentially applicable at the DEAP site to address PCE in soil vapor and/or groundwater include:
• Pump and treat • In situ chemical reduction (ISCR) • In situ chemical oxidation (ISCO) • Air sparging and soil vapor extraction (AS-SVE) • Enhanced bioremediation • Institutional controls (ICs) with Five-year Reviews (FYRs) • ICs with FYRs and Groundwater Monitoring • ICs with FYRs and monitored natural attenuation (MNA)
Site-specific conditions such as the location of the DEAP site in a densely populated downtown area and the aerobic nature of the aquifer (DO greater than 3.46 mg/L in the shallow portion of the aquifer [Table 4-3 of the Supplemental EI Report]) would negatively affect the implementability, safety, and/or effectiveness of several of the potential technologies, including the pump and treat, ISCR, ISCO, AS-SVE, and/or enhanced bioremediation options, as follows:
• Implementability – Significant aboveground and subsurface urban infrastructure would make identifying suitable locations with sufficient open area to implement the aboveground and subsurface components of the pump and treat, ISCR, ISCO, AS-SVE, and enhanced bioremediation options difficult, and could result in damage to infrastructure and physical hazards to pedestrians.
• Technical Effectiveness – The technical effectiveness of the enhanced bioremediation and ISCR treatment options, both of which require reducing conditions to be effective (generally DO less than 0.5 mg/L), would be limited in an aerobic aquifer such as that present at the DEAP site.
• Safety and Security – High levels of traffic in the downtown area increase the risks of personal injury and would require pedestrian and traffic control around remediation equipment for the pump and treat, ISCR, ISCO, AS-SVE, and enhanced bioremediation options. In addition, storage and handling

SECTION 3 ALTERNATIVES ANALYSIS
AX0523180835MGM 3-3
of treatment chemicals that can be hazardous to human health in a public area would be required for ISCO and ISCR, and therefore, are not recommended.
Based on the above implementability, technical effectiveness, and safety considerations, the pump and treat, ISCR, ISCO, AS-SVE, and enhanced bioremediation treatment options are not considered further.
The remaining remedial alternatives carried forward in the evaluation include:
• No Action • ICs with FYRs • ICs with FYRs and Monitoring • ICs with FYRs and MNA
These alternatives are described briefly in the following sections.
3.2.1.1 Alternative 1 – No Action The No Action alternative assumes that the DEA will not implement any treatment as part of an RA. The site will remain in its current state, and no actions will be conducted to remove, isolate, monitor, or remediate the contamination. Because concentrations of PCE and TCE contributing to potential future human health risks exceeding ADEM’s target IELCR of 1 × 10⁻⁵ were detected in groundwater and there is potential for future risks based on potential for VI from PCE concentrations in soil vapor, the No Action alternative would not be protective of human health and the environment and therefore, is not in accordance with ARARs. However, the No Action alternative will be used for comparison purposes in the alternatives analysis.
3.2.1.2 Alternative 2 – Institutional Controls with Five-year Reviews ICs are non-engineering measures, usually legal or administrative means, of limiting potential exposures to a site or medium of concern by limiting or preventing access. ICs would comply with ARARs and protect human health from contaminants in groundwater at the DEAP site by restricting use of groundwater at the site, and would protect human health from contaminants identified in soil vapor by providing notification of the potential for VI, updating building codes, and recommending building alternatives to applicants for new construction and current property owners within the site boundary. The FYRs are conducted to periodically confirm that ICs remain in place and are being implemented. Overall, implementation of ICs with FYRs would include the following:
• Working with the local jurisdiction to maintain and develop ordinances to restrict well drilling and prohibit groundwater access, respectively
• Developing a notification/permitting procedure for the City to implement when building permit applications for new development or renovation are submitted that can reduce VI within the site boundary, specifically, building codes and construction alternatives
• Providing information about the potential to encounter COPCs and a link to the most up-to-date information for the DEAP site as part of the City’s permitting process for contractors requesting permits to excavate within the DEAP site boundary
• Notifying current property owners within the site boundary of the potential for VI and educating owners on building alternatives that mitigate potential VI risk
• Conducting FYRs to ensure that the City GIS and County GIS show the boundaries of the DEAP site and areas where COPCs are potentially present in groundwater or soil vapor and that applicants for new construction are notified
• Completing FYR reports
These ICs would remain in place indefinitely under Alternative 2.

SECTION 3 ALTERNATIVES ANALYSIS
AX0523180835MGM 3-4
3.2.1.3 Alternative 3 –Institutional Controls with Five-Year Reviews and Monitoring Alternative 3, ICs with FYRs and monitoring, addresses potential risks to current and potential future receptors by using ICs to prevent immediate groundwater COPC and potential future VI COPC exposure, and performing groundwater monitoring as part of the FYRs at site wells where groundwater COPCs have been detected at levels above protective criteria. These data may be used to evaluate whether ICs are still needed in the future. RA activities would be conducted in compliance with ARARs. The following are the main components of ICs with FYRs and groundwater monitoring:
• Implementing ICs (according to Alternative 2) to prevent use of groundwater and mitigating potential VI risk for new construction, renovation, and existing property owners
• Conducting FYRs to ensure that the City GIS and County GIS show the boundaries of the DEAP site and areas where COPCs are potentially present in groundwater or soil vapor and that applicants for new construction or renovation are notified
• Monitoring groundwater during the FYRs with analysis for COPCs (as defined in Section 1.1.2) at the five site monitoring wells where concentrations above criteria were detected (MW-02S, MW-03S, MW-08S, MW-12S, and TMPZ-1/ MW-13S) (Figure 1-2)
• Completing FYR reports with updated plume and potentiometric surface maps
ICs for groundwater would remain in place for as long as concentrations of COPCs exceeding MCLs are detected in groundwater. ICs for soil vapor impacts would remain in place until groundwater concentrations no longer exceed VISLs under Alternative 3.
3.2.1.4 Alternative 4 – Institutional Controls with Five-year Reviews and Monitored Natural Attenuation
Alternative 4, ICs with FYRs and MNA, addresses potential risks to current and potential future receptors by using ICs to prevent immediate groundwater COPC and potential future VI COPC exposure. MNA, conducted as part of the FYRs, addresses potential risks to current and potential future receptors by relying on natural attenuation to decrease COPC concentrations in groundwater. RA activities would be conducted in compliance with ARARs. The following are the main components of ICs with FYRs and MNA:
• Implementing ICs (according to Alternative 2) to prevent use of groundwater and mitigating potential VI risk for new construction, renovation, and existing property owners
• Conducting FYRs to ensure that the City GIS and County GIS show the boundaries of the DEAP site and areas where COPCs are potentially present in groundwater or soil vapor and that applicants for new construction or renovation are notified
• Monitoring groundwater during the FYRs at five monitoring wells where concentrations above protective criteria were detected (MW-02S, MW-03S, MW-08S, MW-12S, and TMPZ-1/MW-13S) and one site monitoring well located upgradient of the current groundwater plumes (MW-01S) for the following analyses:
- COPCs to assess concentration trends in the parent chemical (PCE) and daughter products over time
- MNA parameters including nitrate, nitrite, total organic carbon, sulfate, sulfide, manganese, and ferric and ferrous iron to assess whether geochemical conditions in the aquifer are conducive to natural degradation of the contaminants
- Field parameters including DO and oxidation-reduction potential.
SECTION 3 ALTERNATIVES ANALYSIS
AX0523180835MGM 3-5
• Completing FYR reports with updated plume maps, potentiometric surface maps, time-series evaluation of concentration trends, and evaluation of natural attenuation processes across the longitudinal transect of the plume
3.3 Detailed Evaluation of Alternatives This section evaluates the RA alternatives:
• No action • ICs with FYRs • ICs with FYRs and Monitoring • ICs with FYRs and MNA
These alternatives were carried forward from the alternatives screening described in in Section 3.2 and are considered to satisfy EPA’s threshold criteria of protection of human health and the environment, except for the “No Action” alternatives. The other RAs that were carried forward would trigger and meet the various components of the threshold criterion for ARARs (Table 3-1) compliance. To ensure compliance, the RA activities will be performed in accordance with the alternative-specific ARARs listed in Table 3-1. The MCLs for drinking water were identified as the single chemical-specific ARAR for groundwater.
The RA alternatives are evaluated further using the five “balancing criteria” established by the EPA. The “balancing” criteria evaluate the balance between the relative effectiveness and reduction of toxicity, mobility, or volume through treatment, implementability, and cost. Evaluations against effectiveness criteria are qualitative, based largely on available literature and project experiences regarding expected technology performance. Evaluations against the cost criterion are completed on an order-of-magnitude basis, considering recent project experience, technology vendor estimates, and/or other conventional sources of cost data used by construction cost engineers:
1. Long-term effectiveness and permanence – The long-term effectiveness criterion relates to the sustainability of the RA results with respect to the potential risk remaining after the response objectives have been met. An RA that removes the highest percentage or mass of contamination and does not require additional treatments or actions and minimizes the need for ICs is favored for selection.
2. Reduction of contaminant toxicity, mobility, or volume – This evaluation criterion relates to the RA alternative’s ability to reduce significantly (through treatment or recycling) the toxicity, mobility, or volume of the hazardous substances. This criterion can be accomplished through the destruction of toxic contaminants, irreversible reduction of contaminant mobility, or reduction of the volume of contaminated media.
3. Short-term effectiveness – This evaluation criterion focuses on the effects of the RA alternative on human health and the environment during the implementation phase. The RA alternative best accomplishes the short-term effectiveness criterion if it protects the community and workers during RA activities, mitigates potential adverse effects on the environment during RA activities (including limiting energy consumption), and limits the time required to achieve protection for the site.
4. Implementability – This evaluation criterion focuses on the technical and administrative feasibility of implementing a specific RA alternative. The technical aspects of this criterion include the following:
a. Technical difficulties and unknowns associated with the RA alternative b. Reliability of the RA alternative c. Ease of undertaking additional RA alternatives d. Monitoring considerations of the RA alternative

SECTION 3 ALTERNATIVES ANALYSIS
AX0523180835MGM 3-6
The administrative aspects of this criterion include the coordination between offices and agencies (such as prerequisite approvals and rights-of-way acquisition). This criterion also addresses the availability of the necessary materials and services to implement the RA alternative.
5. Cost – This evaluation criterion is used to evaluate the relative costs associated with implementation of the RA alternatives. The financial aspects of this criterion include direct capital costs (construction costs, equipment costs, land and development costs, building and services costs, and relocation costs), indirect capital costs (engineering costs, permitting costs, startup costs, and contingency costs), and annual operation and maintenance costs.
Modifying criteria are used to address state and community acceptance of the IRA, as follows:
1. State Acceptance – This evaluation criterion focuses on the technical and administrative issues and concerns of the state agency (ADEM).
2. Community Acceptance – The RA/AA Report findings and recommendations were reviewed with the Community Outreach Group (COG) on July 10, 2018. COG members attending were satisfied with the assessment and analysis results, as presented in July 2018. COG members were encouraged to review the final report in detail and submit any additional feedback concurrently with ADEM Review. The public will have access to this document via the project website at: http://montgomeryal.gov/live/about-montgomery/capital-city-plume-information, where project contact information is available for questions or comments. Any comments received through the website will be considered in the final selection of alternatives. After a remedy is selected, the final remedial action plan will be subject to public notice and a formal comment period. The DEA will continue to engage the COG as new information may arise.
Table 3-2 summarizes the comparison of the potential alternatives against the five balancing criteria. The modifying criteria of state and community acceptance will be considered after the public information session.
3.3.1 Alternatives Evaluation Summary As noted in Table 3-2, Alternative 3 – ICs with FYRs and Monitoring best satisfies the “balancing” evaluation criteria for addressing potential future risks associated with direct exposure (potential future potable use) to groundwater and potential future exposure to soil vapor, and therefore is recommended. The ICs are effective in the short-term by immediately preventing direct exposure of human health to groundwater contaminants at the site, mitigating potential VI long-term through building codes and construction alternatives, notifying current property owners of the potential for VI and building alternatives to mitigate potential VI, and conducting FYRs that include the evaluation of updated plume data to confirm that those protections remain in place and assess when the remedy can be terminated. ICs with FYRs and Monitoring are readily implemented, as there are well established processes for implementing ICs, monitoring groundwater, and conducting FYRs. No additional protectiveness is gained from the increased costs associated with the MNA alternative, and although the ICs with FYRs alternative is less expensive, it does not provide the monitoring data required to support the FYR evaluation and address when the remedy can be terminated. Therefore, Alternative 3, ICs with FYRs and Monitoring, is the recommended alternative.

AX0523180835MGM 4-1
SECTION 4
Summary and Conclusions The results of the Supplemental EI conducted at the DEAP site indicate PCE is present in groundwater above its MCL in two commingled plumes in the shallow portion of the aquifer; these plumes extend from the RSA Energy Plant and MW-12S (separate historical source) along the groundwater flow direction toward Cypress Creek (Figure 1-2). In addition, PCE in soil vapor was detected at concentrations exceeding the residential VISL at MW-02S, and although not related to the PCE groundwater plumes, TCE in soil vapor was detected at concentrations exceeding the commercial and residential VISL at MW-08S and exceeding the commercial VISL at the VIMS. Because PCE and TCE in groundwater and PCE in soil vapor were identified as site-related chemicals at concentrations exceeding their appropriate screening levels, an HHRA and SLERA were conducted to assess whether COPCs at the DEAP site may pose risks to human health and the environment.
PCE and TCE concentrations above the tap water RSLs and PCE above the MCL were identified in groundwater and the estimated risks for a hypothetical potable use scenario exceeded ADEM-acceptable risk levels at three monitoring wells (MW-08S, MW-12S, and TMPZ-1/MW-13S); however, there is no potable use of groundwater in the DEAP site boundary and there is an existing ordinance, Montgomery City Ordinance 58-2003, that prohibits drilling of new wells within a boundary that encompasses the current DEAP site. In addition, the elevated concentrations of TCE and/or PCE in soil vapor at the VIMS, MW-08S, and MW-02S were identified as posing potential future risks to human health through the VI exposure pathway, although no VI exposure concerns were identified under the current site conditions. No unacceptable risks were identified for the groundwater discharge to surface water exposure scenario and the potential commercial use of wash water at the Capital Trailways bus station.
The SLERA concluded that the assessment endpoint was met, and no further risk assessment or consideration of remedy is recommended for ecological receptors.
Because of the potential future risks to human health due to PCE in groundwater exceeding the MCL, and because of the potential risk for future exposure to PCE detected in soil vapor at MW-02S, RAs for the site were assessed using EPA’s threshold and balancing evaluation criteria. In addition to Alternative 1 – No Action (used to provide a baseline comparison for the other alternatives), three alternatives were established that satisfy the threshold criteria of protection of human health and the environment and compliance with ARARs, as follows:
• Alternative 2 – ICs with FYRs • Alternative 3 – ICs with FYRs and Monitoring • Alternative 4 – ICs with FYRs and MNA
The comparative analysis of these alternatives included evaluating each alternative against the balancing criteria of long-term and short-term effectiveness; reduction of toxicity, mobility, or volume; implementability; and cost. The results of these assessments indicate that Alternative 3 – ICs with FYRs and Monitoring would provide the best overall balance between effectiveness, implementability, and cost to address potential future risks identified at the DEAP site.

AX0523180835MGM 5-1
SECTION 5
References Alabama Department of Environmental Management (ADEM). 1995. Preliminary Assessment, Capitol City Plume, Montgomery, Alabama. February.
Agency for Toxic Substances and Disease Registry (ATSDR). 2004. Public Health Assessment for Capitol City Plume, Montgomery, Alabama. January.
Alabama Department of Environmental Management (ADEM). 2017a. Alabama Risk‐Based Corrective Action Guidance Manual, Revision 3.0. February.
Alabama Department of Environmental Management (ADEM). 2017b. Alabama Environmental Investigation and Remediation Guidance. February.
Black & Veatch. 2002. Remedial Investigation Report, Capitol City Plume Site, Montgomery, Alabama. November.
CH2M HILL Engineers, Inc. (CH2M). 2012. Problem Areas Report for the Cypress Creek Aquatic Ecosystem Restoration Feasibility Study. September.
CH2M HILL Engineers, Inc. (CH2M). 2016. Technical Work Plan – Downtown Environmental Assessment Project, Montgomery, Alabama. Prepared for Alabama Department of Environmental Management by the Downtown Environmental Alliance. March.
CH2M HILL Engineers, Inc. (CH2M). 2017. Supplemental Environmental Investigation Report Downtown Environmental Assessment Project, Montgomery, Alabama. Prepared for Alabama Department of Environmental Management by the Downtown Environmental Alliance. October.
Office of Water Resources. 2017. Alabama Flood Map website. http://alabamaflood.com/map. Accessed January 2017.
Das, Braja M. 2008. Advanced Soil Mechanics. Taylor & Francis Group, London and New York.
Scott, John C., R.H. Cobb, and R.D. Castleberry. 1987. Geohydrology and Susceptibility of Major Aquifers to Surface Contamination in Alabama, Area 8. U.S. Geological Survey, Water Resources Investigation Report 86-4360.
U.S. Geological Survey (USGS). 2008. Alabama Water Science Center Data Report.
Environmental Protection Agency (EPA). 1989. Risk Assessment Guidance for Superfund, Volume 1, Human Health Evaluation Manual (Part A). EPA/540/1-89/002.
U.S. Environmental Protection Agency (EPA). 1997. Ecological Risk Assessment Guidance for Superfund: Process for Designing and Conducting Ecological Risk Assessments. Interim Final. EPA/540/R-97/006.
U.S. Environmental Protection Agency (EPA). 1999. Monitored Natural Attenuation of Petroleum Hydrocarbons, U.S. EPA Remedial Technology Fact Sheet. May.
U.S. Environmental Protection Agency (EPA). 2000. Bioaccumulation Testing and Interpretation for the Purpose of Sediment Quality Assessment - Status and Needs. EPA-823-R-00-001. February.
U.S. Environmental Protection Agency (EPA). 2003. Human Health Toxicity Values in Superfund Risk Assessments. OSWER Directive 9285.7-53. December.
U.S. Environmental Protection Agency (EPA). 2004. An Examination of EPA Risk Assessment Principles and Practices. EPA/100/B-04/001. March.

SECTION 4 INVESTIGATION RESULTS
AX0523180835MGM 5-2
U.S. Environmental Protection Agency (EPA). 2013. Vapor Intrusion Database. Office of Solid Waste and Emergency Response. Accessed July 19, 2013.
U.S. Environmental Protection Agency (EPA). 2014. Human Health Evaluation Manual, Supplemental Guidance: Update of Standard Default Exposure Factors, OSWER Directive 9200.1‐120. February.
U.S. Environmental Protection Agency (EPA). 2015. OSWER Technical Guide for Assessing and Mitigating the Vapor Intrusion Pathway from Subsurface Vapor Sources to Indoor Air, OSWER Directive 9200.2‐154. June.
U.S. Environmental Protection Agency (EPA). 2018a. Vapor Intrusion Screening Level (VISL) Calculator Available online: https://epa-visl.ornl.gov/cgi-bin/visl_search.
U.S. Environmental Protection Agency (EPA). 2018b. Integrated Risk Information System (IRIS). Available online: https://www.epa.gov/iris.
U.S. Environmental Protection Agency (EPA). 2018c. Regional Screening Levels (RSLs). November. Available online: https://www.epa.gov/risk/regional-screening-levels-rsls.
U.S. Environmental Protection Agency (EPA). 2018d. Region 4 Ecological Risk Assessment Supplemental Guidance. Scientific Support Section, Superfund Division. March.

Tables

TABLE 1-1Groundwater Sampling Results from the Supplemental EI Downtown Environmental Assessment Project, Montgomery, Alabama
Station ID Date Sampled
PCEVISL: 15MCL: 5RSL: 11
TCEVISL: 1.2MCL: 5
RSL: 0.49
cis-1,2-DCEVISL: NAMCL: 70RSL: 36
trans-1,2-DCEVISL: NAMCL: 100RSL: 360
VCVISL: 0.15
MCL: 2RSL: 0.019
MW-01S 7/12/2016 1.56 0.398 U 0.260 U 0.396 U 0.259 U
MW-02S 7/13/2016 34.1 0.398 U 0.260 U 0.396 U 0.259 U
MW-03S 7/13/2016 6.27 0.566 J 0.260 U 0.396 U 0.259 U
MW-03S FDUP 7/13/2016 6.02 0.442 J 0.260 U 0.396 U 0.259 U
MW-08S 7/13/2016 78.4 0.599 J 0.260 U 0.396 U 0.259 U
MW-09S 7/11/2016 0.372 U 0.567 J 0.260 U 0.396 U 0.259 U
MW-10S 7/12/2016 0.372 U 0.398 U 0.260 U 0.396 U 0.259 U
MW-12S 7/13/2016 58.9 0.414 J 0.268 J 0.396 U 0.259 U
TMPZ-1/MW-13S 7/22/2016 174 1.01 0.874 J 0.396 U 0.259 U
MW-01l 7/12/2016 0.372 U 0.398 U 0.260 U 0.396 U 0.259 U
MW-05l 7/14/2016 0.595 J 0.398 U 0.260 U 0.396 U 0.259 U
MW-05I FDUP 7/14/2016 0.573 J 0.398 U 0.260 U 0.396 U 0.259 U
MW-07l 7/12/2016 0.372 U 0.398 U 0.260 U 0.396 U 0.259 U
MW-07S 7/12/2016 0.372 U 0.398 U 0.260 U 0.396 U 0.259 U
MW-08l 7/13/2016 0.372 U 0.398 U 0.260 U 0.396 U 0.259 U
MW-12l 7/13/2016 0.372 U 0.398 U 0.260 U 0.396 U 0.259 U
BSW-0217 2/20/2017 0.372 U 0.398 U 0.260 U 0.396 U 0.259 U
Notes:
Concentrations presented in micrograms per liter (µg/L).Bold text indicates concentration exceeds the lower of the MCL/RSL.
Shaded cell indicate shallow interval well concentration exceeds the EPA VISL.
PCE = tetrachloroethene
TCE = trichloroethene
DCE = dichloroethene
VC = vinyl chloride
FDUP = field duplicate
MCL = U.S. Environmental Protection Agency (EPA) Maximum Contaminant LevelRSL = EPA Regional Screening Level (tap water; based on a target risk = 1 × 10⁻⁶ and target hazard quotient = 1), November 2018
VISL = vapor intrusion screening level (based on a residential scenario, target risk = 1 × 10⁻⁶ , target hazard quotient = 1,
default groundwater temperature), November 2018
NA = no VISL available
DEAP = Downtown Environmental Assessment Project
J = concentration is estimated
U = analyte was not detected
Shallow Interval Wells
Intermediate Interval Wells
Commercial Bus Washing Station
AX0523180835MGM 1 of 1

TABLE 1-2Soil Vapor Sampling Results from the Supplemental EIDowntown Environmental Assessment Project, Montgomery, Alabama
Station ID
Sample Depth(ft bgs) Date Sampled
PCEResidential VISL: 1,400
TCEResidential
VISL: 70
cis-1,2-DCEResidential
VISL: NA
trans-1,2-DCEResidential
VISL: NA
VCResidential
VISL: 56
7.8 - 8 09/23/2016 4,940 3.21 1.59 U 1.59 U 1.02 U
34 - 35 09/22/2016 5,280 34.5 1.59 U 1.59 U 1.02 U
7 - 8 09/22/2016 493 336 1.59 U 1.59 U 1.02 U
29 - 30 09/22/2016 361 27.8 1.59 U 1.59 U 1.02 U
7 - 8 09/21/2016 23.3 3.56 1.59 U 1.59 U 1.02 U
21 - 22 09/21/2016 4.36 J 42.3 J 1.59 U 1.59 U 1.02 U
21 - 22 (FD) 09/21/2016 6.41 J 64.6 J 5.67 J 1.59 U 1.02 U
7 - 8 09/21/2016 3.49 2.14 U 1.59 U 1.59 U 1.02 U
26 - 27 09/21/2016 1,240 10 1.59 U 1.59 U 1.02 U
VIMS-10 10 09/21/2016 99.6 13,100 88.6 2.55 1.02 U
VIMS-50 50 09/22/2016 286 98,800 873 19.1 4.09 U
Station ID
Sample Depth(ft bgs) Date Sampled
PCECommercial VISL: 5,800
TCECommercial
VISL: 290
cis-1,2-DCECommercial
VISL: NA
trans-1,2-DCECommercial
VISL: NA
VCCommercial
VISL: 930
AMS-01 11.8 - 12 09/19/2016 14.2 2.14 U 1.59 U 1.59 U 1.02 U
AMS-02 11.8 - 12 09/19/2016 6.28 6.67 1.59 U 1.59 U 1.02 U
AMS-03 14.8 - 15 09/20/2016 9.68 2.14 U 1.59 U 1.59 U 1.02 U
11.8 - 12 09/20/2016 9.37 2.14 U 1.59 U 1.59 U 1.02 U
11.8 - 12 (FD) 09/20/2016 9.18 2.14 U 1.59 U 1.59 U 1.02 U
Notes:Concentrations presented in micrograms per meter cubed (µg/m3).
Bold text indicates concentration exceeds EPA residential VISL.
ft bgs = feet below ground surface
PCE = tetrachloroethene
TCE = trichloroethene
DCE = dichloroethene
VC = vinyl chloride
FD = field duplicate
NA = no VISL available
DEAP = Downtown Environmental Assessment Project
J = concentration is estimated
U = analyte was not detected
VISL = EPA Vapor Intrusion Screening Level (based on target risk of 1 × 10⁻⁵ and target hazard quotient of 1), November 2018.
AMS-04
Vapor Intrusion Monitoring System
Plume Area
County Annex III Building
Alabama Attorney General's Building
MW-02S
MW-08S
MW-12S
TMPZ-1/MW-13S
AX0523180835MGM 1 of 1

TABLE 1-3Physical Properties of the Chemicals of Potential ConcernDowntown Environmental Assessment Project, Montgomery, Alabama
ChemicalVapor Pressure
(mm Hg @ 25oC)Henry's Lawa
(atm-m3/mole)Densityb
(g/cm3)log Kow
a
(L/kg)Solubilitya
(mg/L)Tetrachloroethene 18.5c 1.77E-02 1.623 3.4 206
Trichloroethene 69d 9.85E-03 1.4642 2.42 1,280
cis-1,2-Dichloroethene 200c 4.08E-03 1.2837 1.86 6,410
trans-1,2-Dichloroethene 331a 9.40E-03 1.2565 2.09 4,520
Vinyl chloride 2980e 2.78E-02 0.9106 1.62f 8,800
Notes:
mm Hg @ 25oC = millimeters of mercury at 25 degrees Celsius
atm-m3/mole = atmospheres in cubic meters per mole
g/cm3 = grams per cubic centimeterL/kg = liters per kilogram
mg/L = milligrams per liter
b Weast, R.C. 1989. CRC Handbook of Chemistry and Physics . Boca Raton, FL: CRC Press.
f Knovel. 2003. Yaws' Handbook of Thermodynamic and Physical Properties of Chemical Compounds .
a The Estimation Programs Interface (EPI) SuiteTM was developed by the U.S. Environmental Protection Agency's Office of Pollution Prevention and Toxics and Syracuse Research Corporation (SRC). These programs estimate various chemical-specific properties.
c Riddick, J.A., W.B. Bunger, and T.K. Sakano. Techniques of Chemistry. 4th ed., Volume II. Organic Solvents. New York, NY: John Wiley and Sons., 1985.d Boublik, T., V. Fried, and E. Hala. 1984. The Vapour Pressures of Pure Substances . Second Revised Edition. Amsterdam: Elsevier.e Daubert, T.E. and R.P. Danner. Physical and Thermodynamic Properties of Pure Chemicals Data Compilation . Washington, D.C.: Taylor and Francis, 1989.
AX0523180835MGM 1 of 1
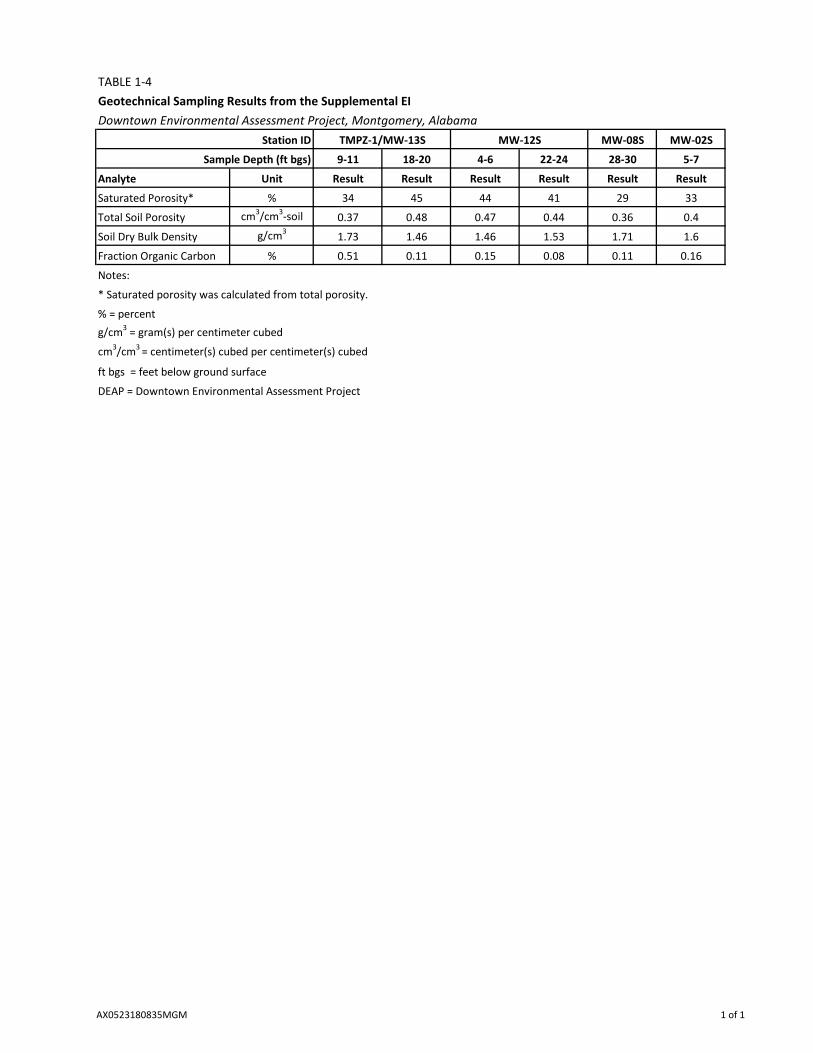
TABLE 1-4Geotechnical Sampling Results from the Supplemental EI
MW-08S MW-02S
9-11 18-20 4-6 22-24 28-30 5-7
Analyte Unit Result Result Result Result Result Result
Saturated Porosity* % 34 45 44 41 29 33
Total Soil Porosity cm3/cm3-soil 0.37 0.48 0.47 0.44 0.36 0.4
Soil Dry Bulk Density g/cm3 1.73 1.46 1.46 1.53 1.71 1.6
Fraction Organic Carbon % 0.51 0.11 0.15 0.08 0.11 0.16
Notes:
* Saturated porosity was calculated from total porosity.
% = percentg/cm3 = gram(s) per centimeter cubed
cm3/cm3 = centimeter(s) cubed per centimeter(s) cubed
ft bgs = feet below ground surface
DEAP = Downtown Environmental Assessment Project
Downtown Environmental Assessment Project, Montgomery, AlabamaTMPZ-1/MW-13S MW-12S
Sample Depth (ft bgs)
Station ID
AX0523180835MGM 1 of 1

TABLE 3-1ARARs
Media Requirement Prerequisite Citation
40 CFR 141.61(a)
ADEM 335-7-2-.05
Action Requirement Prerequisite Citation
Storage of solid waste
All solid waste shall be disposed in manner consistent with the requirements of the Land Division.
Generation of solid waste that is determined not to be hazardous - Applicable to Alternatives 3 and 4.
ADEM 335-13-1-.11
A generator may accumulate hazardous waste at the facility for up to 90 days provided that:
ADEM 335-14-3-7(a) only as it incorporates the following citations:
· Waste is placed in containers that comply with 40 CFR 262.15(a); and
40 CFR 262.17(a)(1)(ii)
· The date upon which accumulation begins is clearly marked and visible for inspection on each container;
· Container is marked with the words “hazardous waste”; or
· Container may be marked with other words that identify the contents.
Location Requirement Prerequisite Citation
Migratory Flyway Almost all species of native birds in the United States are protected from unregulated taking.
Any activity taking place within a migratory flyway. Applicable for Alternatives 3 and 4.
Migratory Bird Treaty Act, 16 USC 703
Notes:ADEM = Alabama Department of Environmental ManagementARAR = Applicable, relevant and appropriate requirementCFR = Code of Federal RegulationsMCL = maximum contaminant levelRCRA = Resource Conservation and Recovery ActUSC = United States Code
Groundwater
Downtown Environmental Assessment Project, Montgomery, Alabama
Chemical-Specific ARARs
Shall not exceed the Safe Drinking Water Act National Revised Primary Drinking Water Regulations: maximum contaminant levels (MCLs) for organic contaminants specified in 40 CFR 141.61(a).
Groundwaters that are an existing or potential source of drinking water - Relevant and Appropriate to all alternatives.
Action-Specific ARARs
Location-Specific ARARs
Waste Characterization and Storage — Primary Wastes (i.e., excavated contaminated soils)
Temporary accumulation of hazardous waste in containers
Accumulation of RCRA hazardous waste onsite as defined in 40 CFR 260.10 - Applicable to Alternatives 3 and 4.
40 CFR 262.17(a)(5)
AX0523180835MGM 1 of 1

TABLE 3-2Balancing Criteria Evaluation Summary for Remedial AlternativesDowntown Environmental Assessment Project, Montgomery, Alabama
Alternative Balancing Criteria Evaluation Summary Criteria Ranking Overall RankingLong-term Effectiveness Does not satisfy - COC concentrations above risk criteria are left in place. 5
Short-term EffectivenessDoes not satisfy - COC concentrations exceeding risk criteria are left in place.
5
RTMV Does not satisfy - no active treatment. 5
Implementability Readily Implemented - no action. 1
Cost $0 1
17
Long-term Effectiveness
Satisfies - prevents exposure to elevated COC concentrations in groundwater1 and implements ICs to mitigate potential future VI risks. Also includes a process to evaluate continued protectiveness every 5 years. However, does not provide groundwater data to support the five-year reviews.
3
Short-term Effectiveness
Satisfies - immediately prevents exposure to elevated COC concentrations in groundwater1 and provides notifications to mitigate potential future VI risks; there are no short-term risks from implementation.
1
RTMV Does not satisfy - no active treatment. 5
Implementability Readily implemented - process exists for preparing ICs. 1
One-Time IC Cost $20,000 ---
FYR Report $10,000 ---
Total Cost (30 years) $70,000 2
12
Long-term Effectiveness
Satisfies - prevents exposure to elevated COC concentrations in groundwater1 by restricting potable use and implements ICs to mitigate potential future VI risks. Also includes groundwater monitoring to support the five-year reviews. 1
Short-term EffectivenessSatisfies - immediately prevents exposure to elevated COC concentrations in groundwater1 and provides notifications to mitigate potential future VI risks; there are no short-term risks from implementation.
1
RTMV Does not satisfy - no active treatment. 5
ImplementabilityReadily implemented - process exists for implementing ICs and wells exist for monitoring. 1
Monitoring Cost $11,000 ---
One-Time IC Cost $20,000 ---
FYR Report $20,000 ---
Total Cost (30 years) $206,000 3
11
Long-term Effectiveness
Satisfies - prevents exposure to elevated COC concentrations in groundwater1 by restricting potable use and implement ICs to mitigate potential future VI risks; although attenuation processes permanently transform COCs to nontoxic compounds, the processes that break down COCs are expected to occur slowly at the site.
1
Short-term EffectivenessSatisfies - immediately prevents exposure to elevated COC concentrations in groundwater1 and provides notifications to mitigate potential future VI risks; there are no short-term risks from implementation.
1
RTMV Does not satisfy - no active treatment. 5
Implementability Readily implemented - wells exist for monitoring. 1
Monitoring Cost $15,000 ---
One-Time IC Cost $20,000 ---
FYR Report $30,000 ---
Total Cost (30 years) $290,000 4
12Notes:1 Potable use of groundwater is an incomplete pathway under current and future site conditions. The DEAP site is currently served by the Montgomery Water Works and Sanitary Sewer Board. All public water supply wells from the former North Well Field were abandoned and there are no known domestic wells in use at the DEAP site. Additionally, the City enacted an ordinance in 2003 to prohibit future well drilling in the downtown area.
RTMV = reduction of toxicity, mobility, or volume through treatment
Criteria ranking on a scale of 1 to 5, where 1 indicates criteria is fulfilled well and 5 indicates criteria is not fulfilled.Overall criteria ranking is given relative to the other alternatives evaluated.Monitoring costs are given based on a 30-year monitoring cycle.
Institutional Controls (ICs) with Five-Year Reviews
Total
Total
No Action
Institutional Controls with Five-Year Reviews and Monitoring
Total
1
Institutional Controls with Five-Year Reviews and Monitored Natural Attenuation
Total
3
4
2
AX0523180835MGM 1 of 1

Figures

@A
@A
@A
@A
@A
@A
@A@A@A
@A
@A
@A
@A
@A
!(!(
!(
!(
!(
!(
!(!(
!(
!(!(
!(
!(
#*#*
#*
#*
!A
@A
%,
Alabama River
TMPZ-1/MW-13S
MW-01I
MW-05I
MW-07I
MW-08I
MW-12I
MW-01S
MW-02SMW-03S
MW-07S
MW-08S
MW-10S
MW-12S
Cypress Creek
AlabamaAG Building
RSATower RSA
EnergyPlant
AnnexBuilding
!(
USGS02419988
R:\ENBG\00_Proj\M\MontgomeryDEAP\MapFiles\RAAA_Report\Figure_1-1_Site_Map_with_Investigation_Locations.mxd AESPEJO 6/15/2018
LEGEND@A Shallow Monitoring Well
@A Intermediate Monitoring Well!( VIMS
!( Soil Vapor Sampling Location
#* Geotechnical Sampling Location!A Alabama River Gauge Station
%, Commercial Bus-Washing Station
RSA Building
Site BoundaryFIGURE 1-1Site Map with Investigation LocationsRisk Assessment/Alternatives Analysis ReportDowntown Environmental Assessment ProjectMontgomery, AL
Notes:1. AG = Attorney General2. RSA = Retirement Systems of Alabama3. VIMS = Vapor Intrusion Monitoring System4. DigitalGlobe Aerial Imagery (September 26, 2017).5. Figure extent increased to show location of the Alabama River Gauge.
@A!(!(!(
!(
!(
AnnexBuilding
VIMS-10VIMS-50 MW-09S
0 350 700
Feet$

@A
@A
@A
@A
@A
@?
@A
@A
@A@A
@A
@A
@A
@A
@A
³³
³³
@A
%,
AlabamaAG Building
AnnexBuilding
RSATower
RSAEnergyPlant
Alabama River
Cypress Creek
TMPZ-1/MW-13S
(174)
MW-01S(1.56)
MW-02S(34.1)
MW-03S*(6.27)
MW-07S(BMDL)
MW-08S(78.4)
MW-09S(BMDL)
MW-10S(BMDL)
MW-12S(58.9)
MW-01I(BMDL)
MW-05I*(0.595 J)
MW-07I(BMDL)
MW-08I(BMDL)
MW-12I(BMDL)
PW-09W
LEGEND@A Shallow Monitoring Well
@A Intermediate Monitoring Well
@? Former City Water Supply Well
³³ Approximate Culvert Location
%, Commercial Bus-Washing Station
Approximate Extent of PCE > 5 µg/L
RSA Building
Site Boundary 0 250 500
Feet$Notes:1. AG = Attorney General2. BMDL = below method detection limit3. J = concentration is estimated4. PCE = tetrachloroethene5. RSA = Retirement Systems of Alabama6. µg/L = micrograms per liter7. * = field duplicate sample location, highest result presented
R:\ENBG\00_Proj\M\MontgomeryDEAP\MapFiles\RAAA_Report\Figure_1-2_PCE_Groundwater_Results_July_2016.mxd AESPEJO 6/15/2018
FIGURE 1-2PCE Groundwater Results - JulyRisk Assessment/Alternatives Analysis ReportDowntown Environmental Assessment ProjectMontgomery, AL
8. (34.1) = PCE concentration in groundwater in µg/L9. Darker plume shading shows the approximate extent of the commingled portion of the PCE plumes.10. DigitalGlobe Aerial Imagery (September 26, 2017).

Alabama River
21 - 22
Annex Building
AlabamaAG Building
Cypress Creek
TMPZ-1/MW-13S
MW-08S
MW-02S
MW-12S
AMS-03
AMS-04
26 -27
29 - 30
34 -35
7 - 87 - 8
7 - 8
11.8 - 1214.8 - 15
7.8 - 8
RSATower
RSA EnergyPlant
Notes:1. VISL = EPA vapor intrusion screening level (based on target risk of 1x10⁻⁵ and target hazard quotient of 1) (EPA, 2016)2. µg/L = micrograms per liter3. PCE = tetrachloroethene4. TCE = trichloroethene5. # - # = the depth interval in feet below ground surface.
AMS-01
AMS-02
VIMS
10 50
11.8 - 12
11.8 - 12
0 250 500
Feet
R:\ENBG\00_Proj\M\MontgomeryDEAP\MapFiles\RAAA_Report\Figure_1-3_Soil_Vapor_Results.mxd gtwigg 6/25/2018
FIGURE 1-3Soil Vapor ResultsRisk Assessment/Alternatives Analysis ReportDowntown Environmental Assessment ProjectMontgomery, AL
LEGENDSoil Vapor VISL Screening Results
Result Does Not Exceed VISLResult Exceeds Residential VISL for PCEResult Exceeds Residential VISL for TCEResult Exceeds Commercial VISL for TCE
Soil Vapor Sample LocationApproximate Extent of PCE > 5 µg/LSite BoundaryBuildingRSA Building
6. Soil vapor results collected adjacent to the Annex and Attorney General (AG) Buildings were compared to commercial VISLs, results from all other locations were compared to residential VISLs.7. Darker plume shading shows the approximate extent of the commingled portion of the PCE plumes.8. DigitalGlobe Aerial Imagery (September 26, 2017).

123
124
125
126
127
128
129
130
131
1/31/17 2/5/17 2/10/17 2/15/17 2/20/17 2/25/17 3/2/17
Elev
atio
n (fe
et N
AVD
88)
TMPZ‐1 USGS AL River Station (Montgomery)
123
124
125
126
127
128
129
130
131
7/29/16 8/3/16 8/8/16 8/13/16 8/18/16 8/23/16 8/28/16
Elev
atio
n (fe
et N
AVD
88)
CCG‐1 TMPZ‐1 USGS AL River Station (Montgomery)
Notes:CCG‐1 = Cypress Creek GaugeUSGS AL River Station = United States Geological Society Alabama River Gauge 02419988NAVD88 = North American Vertical Datum of 1988
Figure 1-4 Cypress Creek Hydraulic Study Results
Risk Assessment/Alternatives Analysis Report Downtown Environmental Assessment Project
Montgomery, AL

MW-01S
MW-10S
MW-01I
MW-07S MW-07I
MW-08SMW-08I
C r o s s S e c t i o n L i n eC r o s s S e c t i o n L i n e
TMPZ-1/MW-13STMPZ-1/MW-13SAA
Site Boundary
Shallow Monitoring Well
Deep Monitoring Well
PCE Plume
Approximate Extent of Alabama River Influence
Sand
Silt and Clay
Sandy Gravel
Groundwater Level
Groundwater Flow Direction
Vapor Migration
LEGEND
Notes:1. Not to scale
2. Below surface elements vertically exaggerated for clarity
3. Darker purple color indicates commingled plumes
4. PCE = tetrachloroethene
5. ft AMSL = feet above mean sea level
Alabama River
(125.8 ft AMSL)
Cypress Creek
TMPZ-1/MW-13SMW-8I
MW-8SMW-7I
MW-7SMW-01S
MW-10S
RSA Generalized Excavation Area
212 ft AMSL
156.3 ft AMSL
125.9 ft AMSL
140 ft AMSL
Creek Bed119.6 ft AMSL
Plan View
A'A'
AAA'A'
N
EN1223161159WDC CoM_Capitol_City_Plume_CSM_v11 6-15-18 tdaus
Figure 1-5Conceptual Site ModelRisk Assessment/Alternatives Analysis Report Downtown Environmental Assessment Project Montgomery, Alabama
MW-8SMW-8SMW-8SMW-8SMW-8S
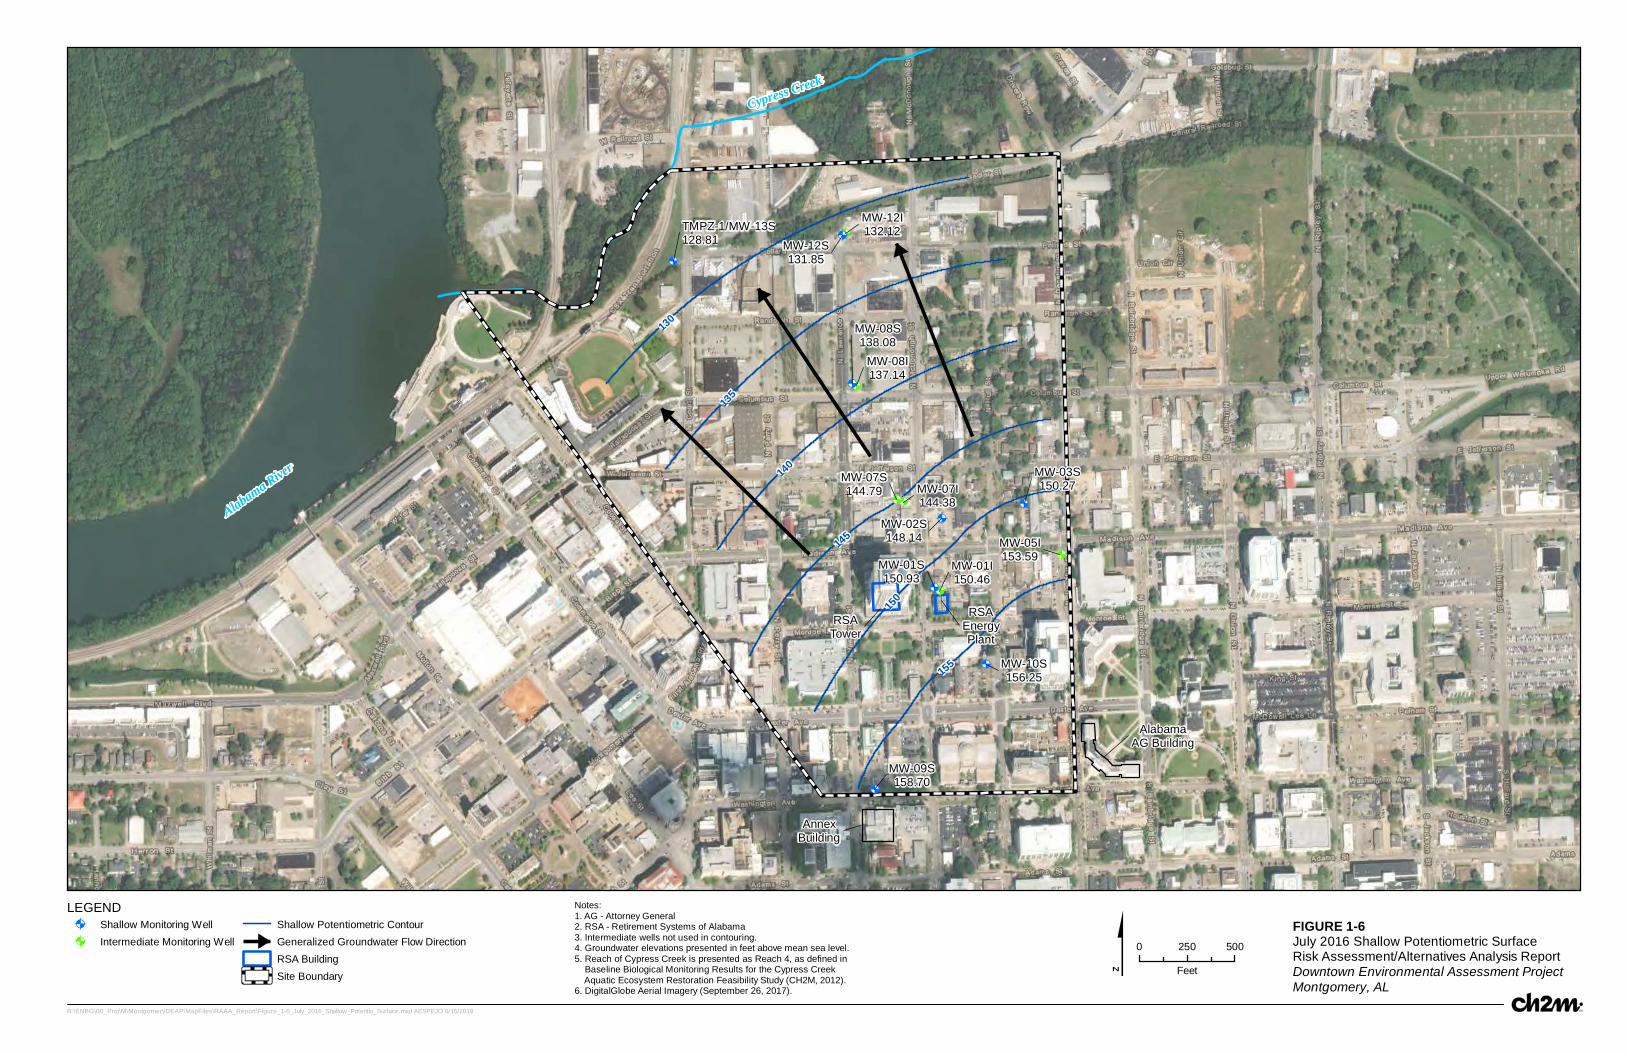
@A
@A
@A
@A
@A
@A
@A
@A
@A
@A
@A
@A
@A
@A
RSATower
RSAEnergyPlant
TMPZ-1/MW-13S128.81
MW-09S158.70
AlabamaAG Building
AnnexBuilding
Cypress Creek
Alabama River
MW-01S150.93
MW-02S148.14
MW-03S150.27
MW-07S144.79
MW-08S138.08
MW-10S156.25
MW-12S131.85
MW-01I150.46
MW-05I153.59
MW-07I144.38
MW-08I137.14
MW-12I132.12
155
150
145
140
135
130
LEGEND@A Shallow Monitoring Well
@A Intermediate Monitoring WellShallow Potentiometric ContourGeneralized Groundwater Flow DirectionRSA BuildingSite Boundary
Notes:1. AG - Attorney General2. RSA - Retirement Systems of Alabama3. Intermediate wells not used in contouring.4. Groundwater elevations presented in feet above mean sea level.5. Reach of Cypress Creek is presented as Reach 4, as defined in Baseline Biological Monitoring Results for the Cypress Creek Aquatic Ecosystem Restoration Feasibility Study (CH2M, 2012).6. DigitalGlobe Aerial Imagery (September 26, 2017).
0 250 500
Feet$R:\ENBG\00_Proj\M\MontgomeryDEAP\MapFiles\RAAA_Report\Figure_1-6_July_2016_Shallow_Potentio_Surface.mxd AESPEJO 6/15/2018
FIGURE 1-6July 2016 Shallow Potentiometric SurfaceRisk Assessment/Alternatives Analysis ReportDowntown Environmental Assessment ProjectMontgomery, AL

@A
@A
@A
@A
@A
@?
@A
@A
@A@A
@A
@A
@A
@A
@A!!
Alabama River
Cypress Creek
AlabamaAG's Building
AnnexBuilding
RSATower
RSAEnergyPlant
MW-01S
MW-02S
MW-03SMW-07S
MW-08S
MW-09S
MW-10S
MW-12S
MW-01I
MW-05I
MW-07I
MW-08I
MW-12I
TMPZ-1
PW-09W
R:\ENBG\00_Proj\M\MontgomeryDEAP\MapFiles\Misc\Fig1_Extent_of_PCE_Plume_and_Property_Use_Map.mxd AESPEJO 11/27/2018
LEGEND@A Monitoring Well
@? Former City Water Supply Well
!! Temporary PiezometerRSA BuildingSite Boundary
Approximate Extent of PCE > 5 µg/LPCE Plume 100-foot BufferParcel BoundaryProperty with BasementCity-owned Property
State PropertyRSA PropertySchool/Daycare PropertyResidential (First Floor Commercial)Residential (First Floor Occupancy)Empty Residential Lot
0 250 500
Feet$FIGURE 1-7Extent of PCE Plume and Current Property Use Map Downtown Environmental Assessment Project Montgomery, AL
Notes:1. AG = Attorney General2. PCE = tetrachloroethene3. RSA = Retirement Systems of Alabama4. µg/L = micrograms per liter5. Parcel is industrial/commercial use unless
otherwise indicated.
215 North Court Street
246 North Court Street 523 North Decatur Street
405 North Decatur Street

Potential Receptors
PRIMARY SOURCE
PRIMARY RELEASE
MECHANISM
SECONDARY SOURCE
SECONDARY RELEASE
MECHANISM
EXPOSUREPOINT EXPOSURE ROUTE
Indu
stria
l/Com
mer
cial
and
G
over
nmen
t Wor
kers
Firs
t-Flo
or R
esid
ents
Rec
reat
iona
l Use
rs
Fish
Con
sum
ers
Bus
Mai
nten
ance
Wor
ker
Pota
ble
Wat
er U
sers
Wash Water Ingestion F (2)
Dermal F (2) F (2)
Groundwater (1) Volatile Emission Ambient Air(Capital Trailways Bus Station) Inhalation F (2) F (2)
Volatilization Groundwater/Soil Vapor Vapor Intrusion Indoor Air Inhalation C/F (4) F (4)
Discharge Surface Water Surface Water (3)
(Cypress Creek)Ingestion/Dermal C/F
Fish Ingestion C/F
Notes:(1) Potable use of groundwater is an incomplete pathway under current and future site conditions. The DEAP site C/F - Potentially Complete Pathway under Current and Future Exposure Scenarios is currently served by the Montgomery Water Works and Sanitary Sewer Board. All public water supply wells F - Potentially Complete Pathway under Future Exposure Scenario from the former North Well Field were abandoned and there are no known domestic wells in use at the DEAP site. Additionally, the City enacted an ordinance in 2003 to prohibit future well drilling in the downtown area. (2) As discussed in Section 1.2.6 of the text, the Capital Trailways well has been decommissioned and it is unlikely
to be reconstructed and used in the future. However, per ADEM’s request, the following potential future exposurescenarios were evaluated:- Bus maintenance workers were assumed to be exposed to water through dermal contact an d inhaltion exposure pathways.- Potable water users were assumed to be exposed to water through ingestion, dermal contact, and inhalation exposure pathways.
(3) Potential surface water concentrations were estimated using groundwater concentrations from monitoring well TMPZ-1 and a site-specific attenuation factor.
(4) Potential exposures to indoor air associated with vapor intrusion from groundwater were not evaluated because preference is given to the soil vapor data, which were collected at locations with groundwater concentrations greater than the vapor intrusion screening levels.
Wash Water(Capital Trailways Bus Station)
FIGURE 2-1Conceptual Exposure Model
Risk Assessment/Alternatives Analysis ReportDowntown Environmental Assessment Project, Montgomery, Alabama

MW-03SMW-07S
MW-08S
MW-07I
MW-08I
TMPZ-1
Acres:0.72
Acres:1.79
Acres:0.37
Acres:1.06
Acres:0.49
Acres:0.24 Acres:
0.09
Acres:0.18
Acres:0.08
Acres:0.35
Acres:0.14
Acres:0.12
Acres:2.51
Acres:0.25
Acres:0.93
R:\ENBG\00_Proj\M\MontgomeryDEAP\MapFiles\Misc\DU_at_MW08S.mxd gtwigg 2/19/2019
LEGENDMonitoring WellSite BoundaryParcel BoundaryProperty with Basement
City-owned PropertyCity-owned Property (Being Sold)VI AOIHistorical Soil Vapor Sample Location 0 100 200
Feet
FIGURE 2-2Vapor Intrusion Area of InterestDowntown Environmental Assessment ProjectMontgomery, AL
Notes:1. Parcel is industrial/commercial use unless otherwise indicated.2. VI AOI = Vapor intrusion area of interest3. Historical samples collected in 2011 presented in the Technical Work Plan (CH2M 2016).

Appendix A Human Health Risk Assessment Tables
and Supplemental Information

Appendix A-1 Human Health Risk Assessment Tables

A-1. Potentially Complete Exposure PathwaysDowntown Environmental Assessment Project, Montgomery, Alabama
Scenario Timeframe Medium Exposure Medium Exposure Point Receptor
Exposure Route Evaluation Rationale
Surface Water(Cypress Creek)
Recreational UsersIngestion,
DermalQuant
Recreational users could potentially be exposed to site groundwater discharging to surface water in Cypress Creek.
Fish Fish Consumers Ingestion Quant Fish consumers could potentially consume fish caught from Cypress Creek.
Groundwater (Indoor Air)
Buildings Near Groundwater Plume
Industrial/Commercial and Government Workers
Inhalation None (4) There is the potential for vapor intrusion to occur.
Soil Vapor(Indoor Air)
Buildings Near Groundwater Plume
Industrial/Commercial and Government Workers
Inhalation Quant There is the potential for vapor intrusion to occur.
Groundwater (Indoor Air)
Buildings Near Groundwater Plume
First-Floor Residents Inhalation None (4)There is the potential for future vapor intrusion to occur. However, there are currently no occupied first-floor residences within the groundwater plume boundary or within a 100-foot buffer of the plume.
Soil Vapor(Indoor Air)
Buildings Near Groundwater Plume
First-Floor Residents Inhalation QuantThere is the potential for future vapor intrusion to occur. However, there are currently no occupied first-floor residences within the groundwater plume boundary or within a 100-foot buffer of the plume.
Future Groundwater (3) Wash waterWash water
(Capital Trailways Bus Station)Bus Maintenance Workers
Dermal, Inhalation
QuantFuture workers potentially could contact wash water from the industrial well while washing vehicles at the bus maintenance facility (3).
Potable Water UsersIngestion, Dermal,
InhalationQuant
It is very unlikely that the well at the Capital Trailways Bus Station to be reconstructed and used as a potable water source in the future. However, per ADEM’s request, the data from the wash water sample were evaluated for a potable use scenario.
Notes:(1) Potable use of groundwater is an incomplete exposure pathway under current and foreseeable future site conditions. The DEAP site is currently served by the Montgomery Water Works and Sanitary Sewer Board. All public water supply wells from the former North Well Field were abandoned and there are no known domestic wells in use at the DEAP. However, groundwater data were evaluated for a potable use scenario in accordance with the work plan.(2) Potential surface water concentrations were estimated using groundwater concentrations from monitoring well TMPZ-1/MW-13S and a site-specific attenuation factor.
(4) Potential exposures to indoor air associated with vapor intrusion from groundwater will not be evaluated because preference is given to the soil vapor data, which were collected at locations with groundwater concentrations greater than the vapor intrusion screening levels.
washing vehicles and potable water users use this well as a drinking water source in the future. The City has requested the Capital Trailways Well be abandoned in accordance with City Ordinance because it is no longer in use.
Current/Future
Surface Water (2)
Groundwater (1)
(3) The power lines and plumbing connected to the well and the water storage tank that the water was pumped into were removed in February of 2017, rendering the well unusable in its current state (see Appendix B). Capital Trailways has connected to the city water supply and no longer uses groundwater under the DEAP site. However, per ADEM's request, it was conservatively assumed bus maintenance workers could use this well for
Future Groundwater (1)
AX0523180835MGM 1 of 1

A-2. Samples Included in Risk AssessmentDowntown Environmental Assessment Project, Montgomery, Alabama
MW-01I GW-03-0716 7/12/2016 NA PMW-01S GW-04-0716 7/12/2016 NA PMW-02S GW-08-0716 7/13/2016 NA P
GW-09-0716 7/13/2016 NA PFD01-0716 7/13/2016 NA FD
GW-07-0716 7/14/2016 NA PFD02-0716 7/14/2016 NA FD
MW-07I GW-06-0716 7/12/2016 NA PMW-07S GW-05-0716 7/12/2016 NA PMW-08I GW-11-0716 7/13/2016 NA PMW-08S GW-10-0716 7/13/2016 NA PMW-09S GW-01-0716 7/11/2016 NA PMW-10S GW-02-0716 7/12/2016 NA PMW-12I GW-12-0716 7/13/2016 NA PMW-12S GW-13-0716 7/13/2016 NA P
L891420-03 2/20/2017 NA PL891420-04 2/20/2017 NA FDL891420-03 2/20/2017 NA PL891420-04 2/20/2017 NA FD
Discharge to Surface Water(Cypress Creek)
TMPZ-1/MW-13S (4) GW-014-0716 7/22/2016 NA P
AMS-01 AMS-01-0916 9/19/2016 11.8 - 12 PAMS-02 AMS-02-0916 9/19/2016 11.8 - 12 PAMS-03 AMS-03-0916 9/20/2016 14.8 - 15 P
AMS-04-0916 9/20/2016 11.8 - 12 PAMS-FD-0916 9/20/2016 11.8 - 12 FD
Vapor Intrusion Monitoring System (VIMS)
VIMS-10 VIMS-10-0916 9/21/2016 9 - 10 P
MW-12S SV-MW12-08 9/21/2016 7 - 8 PMW-08S SV-MW08-08 9/22/2016 7 - 8 PMW-02S AMS-MW02-08 9/23/2016 7.8 - 8 P
TMPZ-1/MW-13S SV-TMPZ1-08 9/21/2016 7 - 8 PNotes:(1) For primary (P) and field duplicate (FD) samples, the maximum detected concentration was used in the evaluation.(2) Although potential exposures to groundwater are considered incomplete for a potable use scenario, potential exposures
to groundwater via potable use were quantitatively evaluated for informational purposes. Per ADEM’s guidance, the data from the wash water sample were also included in the groundwater dataset evaluated for a potable use scenario.
(3) If shallow and deep monitoring points were available from the same location, only the shallow monitoring point was included in the risk assessment.(4) Potential surface water concentrations were estimated using groundwater concentrations from monitoring well TMPZ-1/MW-13S and a site-specific attenuation factor.bgs = below ground surfaceNA = Not Available/Not Applicable
Sample Type (1)
MW-03S
MW-5I
Wash water (Capital Trailways Bus Station)
Alabama AG's Building
County Annex III Building
AMS-04
CT-01-S
Depth Interval(feet bgs)Sample Location Sample ID Date CollectedData Grouping
CT-01-S
Groundwater (Potable Use)
Monitoring Wells
Soil Vapor (3)
Groundwater (2)Medium
AX0523180835MGM 1 of 1
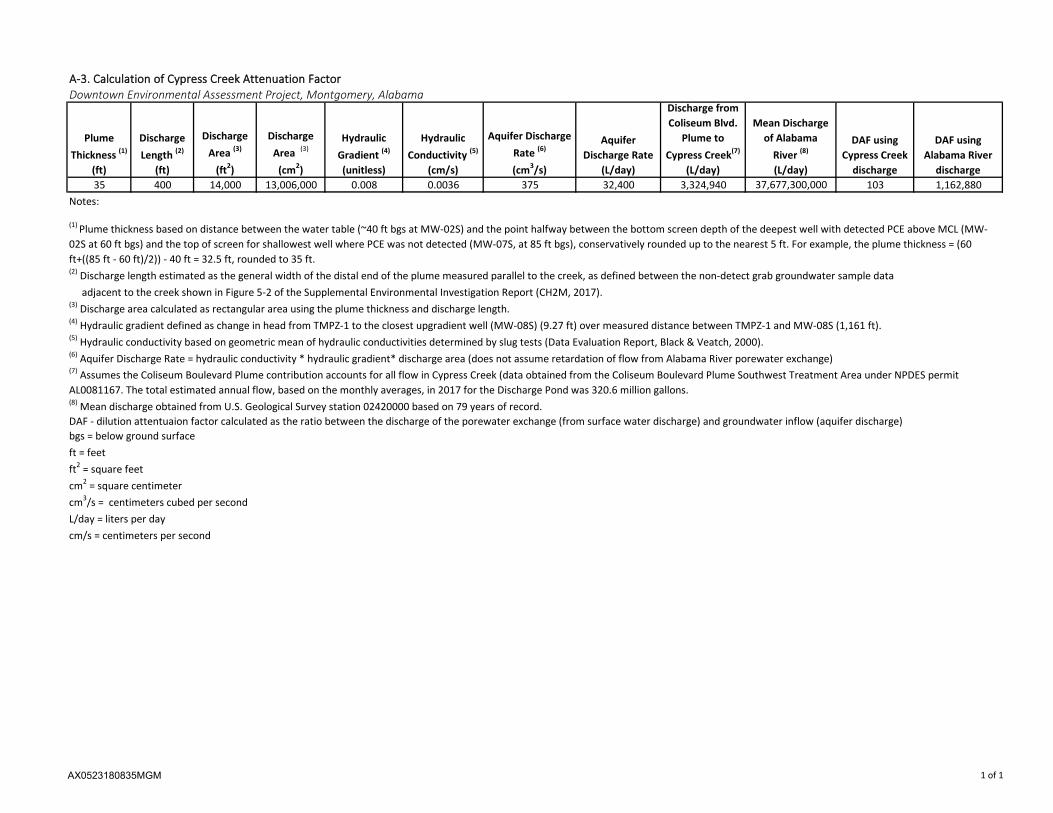
A-3. Calculation of Cypress Creek Attenuation FactorDowntown Environmental Assessment Project, Montgomery, Alabama
Plume Thickness (1)
(ft)
Discharge Length (2)
(ft)
Discharge Area (3)
(ft2)
Discharge Area (3)
(cm2)
Hydraulic Gradient (4)
(unitless)
Hydraulic Conductivity (5)
(cm/s)
Aquifer Discharge Rate (6)
(cm3/s)
Aquifer Discharge Rate
(L/day)
Discharge from Coliseum Blvd.
Plume to Cypress Creek(7)
(L/day)
Mean Discharge of Alabama
River (8)
(L/day)
DAF using Cypress Creek
discharge
DAF using Alabama River
discharge35 400 14,000 13,006,000 0.008 0.0036 375 32,400 3,324,940 37,677,300,000 103 1,162,880
Notes:
(3) Discharge area calculated as rectangular area using the plume thickness and discharge length.(4) Hydraulic gradient defined as change in head from TMPZ-1 to the closest upgradient well (MW-08S) (9.27 ft) over measured distance between TMPZ-1 and MW-08S (1,161 ft). (5) Hydraulic conductivity based on geometric mean of hydraulic conductivities determined by slug tests (Data Evaluation Report, Black & Veatch, 2000).(6) Aquifer Discharge Rate = hydraulic conductivity * hydraulic gradient* discharge area (does not assume retardation of flow from Alabama River porewater exchange)
(8) Mean discharge obtained from U.S. Geological Survey station 02420000 based on 79 years of record.DAF - dilution attentuaion factor calculated as the ratio between the discharge of the porewater exchange (from surface water discharge) and groundwater inflow (aquifer discharge) bgs = below ground surfaceft = feetft2 = square feetcm2 = square centimetercm3/s = centimeters cubed per secondL/day = liters per daycm/s = centimeters per second
(1) Plume thickness based on distance between the water table (~40 ft bgs at MW-02S) and the point halfway between the bottom screen depth of the deepest well with detected PCE above MCL (MW-02S at 60 ft bgs) and the top of screen for shallowest well where PCE was not detected (MW-07S, at 85 ft bgs), conservatively rounded up to the nearest 5 ft. For example, the plume thickness = (60 ft+((85 ft - 60 ft)/2)) - 40 ft = 32.5 ft, rounded to 35 ft.(2) Discharge length estimated as the general width of the distal end of the plume measured parallel to the creek, as defined between the non-detect grab groundwater sample data adjacent to the creek shown in Figure 5-2 of the Supplemental Environmental Investigation Report (CH2M, 2017).
(7) Assumes the Coliseum Boulevard Plume contribution accounts for all flow in Cypress Creek (data obtained from the Coliseum Boulevard Plume Southwest Treatment Area under NPDES permit AL0081167. The total estimated annual flow, based on the monthly averages, in 2017 for the Discharge Pond was 320.6 million gallons.
AX0523180835MGM 1 of 1

A-4. Comparison of Groundwater (TMPZ-1/MW-13S) with Surface Water Standards
Result > SL Result > SLTMPZ-1/MW-13S GW-014-0716 7/22/2016 156-59-2 cis-1,2-DCE 0.874 J 0.00849 J 591 n No 14 n NoTMPZ-1/MW-13S GW-014-0716 7/22/2016 127-18-4 PCE 174 1.69 36 c No 11 c NoTMPZ-1/MW-13S GW-014-0716 7/22/2016 79-01-6 TCE 1.01 0.0098 4.8 c No 0.66 c No
Notes:Only detected concentrations are included on this table.(1) Attenuation factor of 103 used to estimate concentration in Cypress Creek (refer to Table A-3), based on following equation:
(2) Surface Water Screening Level calculated on Table A-4 Supplement.
µg/L = micrograms per literc = carcinogeniccis-1,2-DCE = cis-1,2-dichloroetheneCOPC = chemical of potential concernHI = hazard indexJ = result is estimatedn = noncarcinogenicPCE = tetrachloroetheneSL = screening levelTCE = trichloroethene
Downtown Environmental Assessment Project, Montgomery, Alabama
Surface Water SL(2)
(µg/L)
CSW = Concentration in surface water at Cypress Creek (µg/L) CGW = Concentration in groundwater at TMPZ-1/MW-13S (µg/L) AF = Attenuation factor (unitless)
Surface Water SL(2)
(µg/L)
Consumption of Water and Fish Comparison
Consumption of Fish Comparison
Well ID Sample ID Collection Date CAS COPC
Groundwater Result/
Qualifier(µg/L)
Estimated Surface Water Concentration in Cypress
Creek(1)
(µg/L)
AFC
C GWSW =
AX0523180835MGM 1 of 1

A-4. Supplement. Calculation of Surface Water Screening LevelsDowntown Environmental Assessment Project, Montgomery, Alabama
SLnc
(mg/L)SLca
(mg/L)SLnc
(mg/L)SLca
(mg/L)cis-1,2-DCE 156-59-2 0.002 NA 1.58 0.2 0.591 NA 591 n 0.014 NA 14 n
PCE 127-18-4 0.006 0.0021 30.6 0.2 0.092 0.036 36 c 0.029 0.011423349 11 cTCE 79-01-6 0.0005 0.046 10.6 0.2 0.022 0.0048 4.8 c 0.003 0.000656488 0.66 c
Notes:(1) Source: EPA Integrated Risk Information System, Available online: https://www.epa.gov/iris.
(3) Surface water screening levels were calculated using Equations 16 through 19, as shown below and as provided in the ADEM Admin. Code r. 335-6-10 (February 2017).(4) Most conservative value of noncarcinogenic and carcinogenic screening levels selected as final screening level.
µg/L = microgram per liter mg/L = milligram per literc = carcinogenic n = noncarcinogeniccis-1,2-DCE = cis-1,2-Dichloroethene NA = Not applicable or not availableL/kg = liter per kilogram PCE = tetrachloroethenemg/kg-day = milligram per kilogram per day TCE = trichloroethene
conc. (mg/L) = (HBW x RfD x RSC) / [(FCR x BCF) + WCR] conc. (mg/L) = (HBW x RfD x RSC) / (FCR x BCF)HBW = Human Body Weight 70 kilograms HBW = Human Body Weight 70 kilogramsRfD = Oral Reference Dose (mg/kg-day) chemical-specific RfD = Oral Reference Dose (mg/kg-day) chemical-specificFCR = Fish Consumption Rate 0.030 kilogram/day FCR = Fish Consumption Rate 0.030 kilogram/dayBCF = Bioconcentration Factor (L/kg) chemical-specific BCF = Bioconcentration Factor (L/kg) chemical-specificRSC = Relative Source Contribution (unitless) chemical-specific RSC = Relative Source Contribution (unitless) chemical-specificWCR = Water Consumption Rate 2 liters/day
conc. (mg/L) = (HBW x RL) / (CSF x [FCR x BCF + WCR]) conc. (mg/L) = (HBW x RL) / (CSF x FCR x BCF)HBW = Human Body Weight 70 kilograms HBW = Human Body Weight 70 kilogramsRL = Risk Level 1 x 10⁻⁶ RL = Risk Level 1 x 10⁻⁶
CSF = Oral Cancer Slope Factor (1/mg/kg-day) chemical-specific CSF = Oral Cancer Slope Factor (1/mg/kg-day) chemical-specificFCR = Fish Consumption Rate 0.030 kilogram/day FCR = Fish Consumption Rate 0.030 kilogram/dayBCF = Bioconcentration Factor (L/kg) chemical-specific BCF = Bioconcentration Factor (L/kg) chemical-specificWCR = Water Consumption Rate 2 liters/day
Surface Water SLs - Consumption of Water and Fish(3)
Final SL (4)
(µg/L)
Equation 16. - Consumption of water and fish for noncarcinogens
Equation 18. - Consumption of water and fish for carcinogens
Equation 17. - Consumption of fish for noncarcinogens
Equation 19. - Consumption of fish for carcinogens
Final SL (4)
(µg/L)
Surface Water SLs - Consumption of Fish (3)
Analyte CASRfDoral
(1)
(mg/kg-day)CSForal
(1)
(1/mg/kg-day)BCF (2)
(L/kg) RSC (2)
(2) Source: EPA National Recommended Water Quality Criteria: 2002 Human Health Criteria Calculation Matrix. The BCF and RSC for trans-1,2-DCE are used for cis-1,2-DCE.
AX0523180835MGM 1 of 1

A-5. Soil Vapor Screening ComparisonDowntown Environmental Assessment Project, Montgomery, Alabama
Location Sample ID Collection Date CAS COPC
Result > Residential
VISL
Result > Commercial
VISL156-59-2 cis-1,2-DCE 88.6 NA NA (2) NA NA (2)
156-60-5 trans-1,2-DCE 2.55 NA NA (2) NA NA (2)
127-18-4 PCE 99.6 139 n No 584 n No79-01-6 TCE 13100 6.95 n Yes 29.2 n Yes
AMS-03-0916 9/20/2016 127-18-4 PCE 9.68 139 n No 584 n NoAMS-04-0916 9/20/2016 127-18-4 PCE 9.37 139 n No 584 n NoAMS-01-0916 9/19/2016 127-18-4 PCE 14.2 139 n No 584 n No
127-18-4 PCE 6.28 139 n No 584 n No79-01-6 TCE 6.67 6.95 n No 29.2 n No
SV-TMPZ1-08 9/21/2016 127-18-4 PCE 3.49 139 n No 584 n No127-18-4 PCE 23.3 139 n No 584 n No79-01-6 TCE 3.56 6.95 n No 29.2 n No
127-18-4 PCE 493 139 n Yes 584 n No79-01-6 TCE 336 6.95 n Yes 29.2 n Yes
127-18-4 PCE 4940 139 n Yes 584 n Yes79-01-6 TCE 3.21 6.95 n No 29.2 n No
Notes:Only detected concentrations are included on this table.(1) Vapor Intrusion Screening Levels (VISLs) were calculated using the EPA's VISL Calculator, https://epa-visl.ornl.gov/cgi-bin/visl_search (EPA, November 2018) and are based on an excess lifetime cancer risk (ELCR) of 1 x 10⁻⁶, hazard quotient (HQ) of 0.1, and default attenuation factor (AF) of 0.03. (2) VISLs are not available for cis- and trans-1,2-dichloroethene because the inhalation toxicity criteria were withdrawn by EPA.
µg/m3 = microgram per cubic metercis-1,2-DCE = cis-1,2-dichloroetheneCOPC = chemical of potential concernn = noncarcinogenicPCE = tetrachloroetheneTCE = trichloroethenetrans-1,2-DCE = trans-1,2-dichloroetheneVIMS = Vapor Intrusion Monitoring SystemVISL = Vapor Intrusion Screening Level
9/23/2016
Alabama AG's Building (AMS-03, AMS-04)
County Annex III Building (AMS-01, AMS-02) AMS-02-0916 9/19/2016
Monitoring Wells/Piezometer
(TMPZ-1/MW-13S, MW-12S,
MW-08S, MW-02S)
SV-MW12-08 9/21/2016
SV-MW08-08 9/22/2016
AMS-MW02-08
Result/Qualifier(µg/m3)
Residential VISL (1)
(µg/m3)
Commercial VISL (1)
(µg/m3)VIMS VIMS-10-0916 9/21/2016
AX0523180835MGM 1 of 1
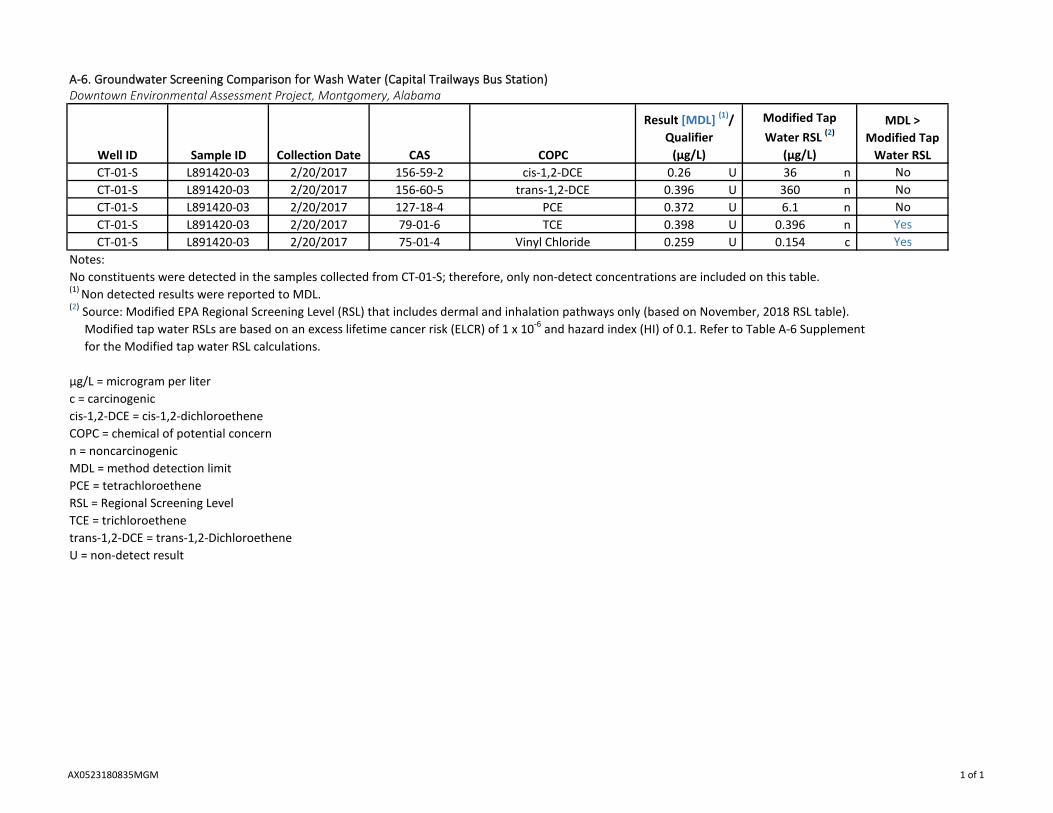
A-6. Groundwater Screening Comparison for Wash Water (Capital Trailways Bus Station)
Well ID Sample ID Collection Date CAS COPC
MDL > Modified Tap
Water RSLCT-01-S L891420-03 2/20/2017 156-59-2 cis-1,2-DCE 0.26 U 36 n NoCT-01-S L891420-03 2/20/2017 156-60-5 trans-1,2-DCE 0.396 U 360 n NoCT-01-S L891420-03 2/20/2017 127-18-4 PCE 0.372 U 6.1 n NoCT-01-S L891420-03 2/20/2017 79-01-6 TCE 0.398 U 0.396 n YesCT-01-S L891420-03 2/20/2017 75-01-4 Vinyl Chloride 0.259 U 0.154 c Yes
Notes:No constituents were detected in the samples collected from CT-01-S; therefore, only non-detect concentrations are included on this table.(1) Non detected results were reported to MDL. (2) Source: Modified EPA Regional Screening Level (RSL) that includes dermal and inhalation pathways only (based on November, 2018 RSL table). Modified tap water RSLs are based on an excess lifetime cancer risk (ELCR) of 1 x 10⁻⁶ and hazard index (HI) of 0.1. Refer to Table A-6 Supplement for the Modified tap water RSL calculations.
µg/L = microgram per literc = carcinogeniccis-1,2-DCE = cis-1,2-dichloroetheneCOPC = chemical of potential concernn = noncarcinogenicMDL = method detection limitPCE = tetrachloroetheneRSL = Regional Screening LevelTCE = trichloroethenetrans-1,2-DCE = trans-1,2-DichloroetheneU = non-detect result
Downtown Environmental Assessment Project, Montgomery, Alabama
Result [MDL] (1)/Qualifier
(µg/L)
Modified Tap Water RSL (2)
(µg/L)
AX0523180835MGM 1 of 1

A-6 Supplement. Calculation of Modified Tap Water RSLsDowntown Environmental Assessment Project, Montgomery, Alabama
Dermal SL Inhalation SL Dermal + Inhalation SL Dermal SL Inhalation SL Dermal & Inhalation SLcis-1,2-DCE 156-59-2 NA NA NA 36 NA 36 36 ntrans-1,2-DCE 156-60-5 NA NA NA 360 NA 360 360 nPCE 127-18-4 65 22 16 23 8.3 6.1 6.1 nTCE 79-01-6 7.4 0.96 0.85 6.9 0.42 0.396 0.396 nVinyl Chloride 75-01-4 0.28 0.34 0.154 89 21 17 0.154 cNotes:Units are microgram(s) per liter (µg/L)Source: EPA Regional Screening Level (November, 2018), based on an excess lifetime cancer risk (ELCR) of 1 x 10⁻⁶ and hazard index (HI) of 0.1.(1) Modified tap water RSLs were calculated based on dermal and inhalation screening levels, as follows: Carcinogenic Modified Tap Water RSL (µg/L) = 1/(1/Dermal SL) & (1/Inhalation SL) Noncarcinogenic Modified Tap Water RSL (µg/L) = 1/(1/Dermal SL) + (1/Inhalation SL)(2) Most conservative value of noncarcinogenic and carcinogenic screening levels selected as final screening level. cis-1,2-DCE = cis-1,2-dichloroethenePCE = tetrachloroetheneRSL = Regional Screening LevelSL = screening levelTCE = trichloroetheneTHI = target hazard indexTR - target risktrans-1,2-DCE = trans-1,2-dichloroethene
Carcinogenic Modified Tap Water RSL (1)
(TR = 1 x 10⁻⁶)Noncarcinogenic Modified Tap Water RSL (1)
(THI = 0.1)
Analyte CASFinal Modified
Tap Water RSL (2)
AX0523180835MGM 1 of 1

A-7. Groundwater Screening Comparison for Potable Use Scenario (Site-Wide)Downtown Environmental Assessment Project, Montgomery, Alabama
MCLResult > Tap
water RSL Result > MCLMW-01S GW-04-0716 7/12/2016 127-18-4 PCE 1.56 4.1 n 5 No NoMW-02S GW-08-0716 7/13/2016 127-18-4 PCE 34.1 4.1 n 5 Yes YesMW-03S GW-09-0716 7/13/2016 127-18-4 PCE 6.27 4.1 n 5 Yes YesMW-03S GW-09-0716 7/13/2016 79-01-6 TCE 0.566 J 0.28 n 5 Yes NoMW-05I GW-07-0716 7/14/2016 127-18-4 PCE 0.595 J 4.1 n 5 No NoMW-08S GW-10-0716 7/13/2016 127-18-4 PCE 78.4 4.1 n 5 Yes YesMW-08S GW-10-0716 7/13/2016 79-01-6 TCE 0.599 J 0.28 n 5 Yes NoMW-09S GW-01-0716 7/11/2016 79-01-6 TCE 0.567 J 0.28 n 5 Yes NoMW-12S GW-13-0716 7/13/2016 156-59-2 cis-1,2-DCE 0.268 J 3.6 n 70 No NoMW-12S GW-13-0716 7/13/2016 127-18-4 PCE 58.9 4.1 n 5 Yes YesMW-12S GW-13-0716 7/13/2016 79-01-6 TCE 0.414 J 0.28 n 5 Yes No
TMPZ-1/MW-13S GW-014-0716 7/22/2016 156-59-2 cis-1,2-DCE 0.874 J 3.6 n 70 No NoTMPZ-1/MW-13S GW-014-0716 7/22/2016 127-18-4 PCE 174 4.1 n 5 Yes YesTMPZ-1/MW-13S GW-014-0716 7/22/2016 79-01-6 TCE 1.01 0.28 n 5 Yes NoNotes:Only detected concentrations are included on this table.(1) Source: EPA Regional Screening Level (RSL) table (November, 2018). Tap water RSLs are based on an excess lifetime cancer risk (ELCR) of 1 x 10⁻⁶ and hazard index (HI) of 0.1.
µg/L = microgram per litercis-1,2-DCE = cis-1,2-dichloroetheneCOPC = chemical of potential concernJ = result is estimatedMCL = EPA Maximum Contaminant Leveln = noncarcinogenicPCE = tetrachloroetheneRSL = Regional Screening LevelTCE = trichloroethene
Screening Result
Station ID Sample ID COPC
Result/Qualifier
(µg/L)
Screening Level (1)
(µg/L)
Tap water RSLCollection Date CAS
AX0523180835MGM 1 of 1

A-8. Estimated Risks and Hazards for Soil Vapor-to-Indoor Air
IELCR HQCumulative
IELCR (3)Cumulative
HI (3) IELCR HQ
VIMS VIMS-10-0916 TCE 393 8.E-04 188.0 8.E-04 188.0 1.E-04 44.9
PCE 14.79 1.E-06 0.4 2.E-05 5.2
TCE 10.08 2.E-05 4.8 3.E-06 1.2
Monitoring Well(MW-02S)
AMS-MW02-08 PCE 148 1.E-05 3.6 1.E-05 3.6 3.E-06 0.8
Notes:
(2) ELCR and HQ were not estimated because the soil vapor concentration did not exceed its screening level.(3) Risk estimates (IELCR and noncarcinogenic HI) were summed for each sample location to obtain cumulative risk results for a residential scenario. Cumulative risk estimates were
not determined for a commercial scenario because only one COC was identified at each sample location.
µg/m3 = microgram(s) per cubic meterCOC = chemical of concernIELCR = individual excess lifetime cancer riskHI = hazard indexHQ = hazard quotientPCE = tetrachloroetheneTCE = trichloroetheneVIMS = Vapor Intrusion Monitoring SystemVISL = Vapor Intrusion Screening Level
(1) The indoor air concentrations, IELCRs, and HQs were estimated using the EPA's VISL Calculator, https://epa-visl.ornl.gov/cgi-bin/visl_search (EPA, November, 2018).
Downtown Environmental Assessment Project, Montgomery, Alabama
Medium Location Sample ID COC
Commercial Scenario (1)Calculated Indoor Air
Concentration (1)
(µg/m3)
Soil Vapor-to-Indoor Air
Monitoring Well (MW-08S)
SV-MW08-08 -- (2)
Residential Scenario (1)
AX0523180835MGM 1 of 1

A-9. Estimated Risks and Hazards for Wash Water (Capital Trailways Bus Station)
Medium Station ID Collection Date CAS COPC
Modified Tap Water Carcinogenic RSL (2)
(µg/L)
Modified Tap Water Noncarcinogenic RSL (2)
(µg/L) IELCR (3) HI (3)Cumulative
IELCR (4)Cumulative
HI (4)
CT-01-S 2/20/2017 79-01-6 TCE 0.398 U 0.85 3.96 5.E-07 0.1 2.E-06 0.1CT-01-S 2/20/2017 75-01-4 Vinyl Chloride 0.259 U 0.15 170 2.E-06 0.002
Notes:No constituents were detected in the samples collected from CT-01-S; therefore, only non-detect concentrations were included in the risk calculations.(1) Non detected results were reported to MDL. (2) Calculation of modified tap water RSLs is provided on Table A-6 Supplement. Note that the modified RSLs presented in this table are based on an HI of 1.0 rather than 0.1(3) Excess lifetime cancer risk and hazard index were estimated using a ratio approach:
Where:CGW = Concentration (non-detect results based on MDL) in groundwater at CT-01-S (µg/L)RSLc = Modified Tap Water Carcinogenic RSL, based on cancer risk of 1 x 10⁻⁶ (µg/L)RSLn = Modified Tap Water Non-carcinogenic RSL, based on hazard index of 1.0 (µg/L)TR = Screening Level Target Risk of 1 x 10⁻⁶
THI = Screening Level Target Hazard Index of 1.0
(4) Risk estimates (IELCR and noncarcinogenic HI) were summed to obtain cumulative risk results.
µg/L = microgram per literCOPC = chemical of potential concernIELCR = individual excess lifetime cancer riskMDL = method detection limitHI = hazard indexRSL = Regional Screening LevelTCE = trichloroetheneU = non-detect result
Downtown Environmental Assessment Project, Montgomery, Alabama
Result [MDL] (1)/Qualifier
(µg/L)Wash Water
(Capital Trailways
TRRSLC
IELCRc
GW ×= THIRSLC
HIn
GW ×=
AX0523180835MGM 1 of 1

A-10. Estimated Risks and Hazards for Potable Use ScenarioDowntown Environmental Assessment Project, Montgomery, Alabama
Station ID Sample IDCollection
Date CAS COC
Result/Qualifier
(µg/L)
Tap Water Carcinogenic RSL (1)
(µg/L)
Tap Water Noncarcinogenic RSL (1)
(µg/L) IELCR (2) HI (2)Cumulative
IELCR (3)Cumulative
HI (3)
MW-02S GW-08-0716 7/13/2016 127-18-4 PCE 34.1 11 41 3.E-06 0.8 3.E-06 0.8MW-03S GW-09-0716 7/13/2016 127-18-4 PCE 6.27 11 41 6.E-07 0.2 2.E-06 0.4MW-03S GW-09-0716 7/13/2016 79-01-6 TCE 0.566 J 0.49 2.8 1.E-06 0.2MW-08S GW-10-0716 7/13/2016 127-18-4 PCE 78.4 11 41 7.E-06 1.9 8.E-06 2.1MW-08S GW-10-0716 7/13/2016 79-01-6 TCE 0.599 J 0.49 2.8 1.E-06 0.2MW-09S GW-01-0716 7/11/2016 79-01-6 TCE 0.567 J 0.49 2.8 1.E-06 0.2 1.E-06 0.2MW-12S GW-13-0716 7/13/2016 127-18-4 PCE 58.9 11 41 5.E-06 1.4 6.E-06 1.6MW-12S GW-13-0716 7/13/2016 79-01-6 TCE 0.414 J 0.49 2.8 8.E-07 0.1
TMPZ-1/MW-13S GW-014-0716 7/22/2016 127-18-4 PCE 174 11 41 2.E-05 4.2 2.E-05 4.6TMPZ-1/MW-13S GW-014-0716 7/22/2016 79-01-6 TCE 1.01 0.49 2.8 2.E-06 0.4
Notes:Only detected concentrations are included on this table.(1) Source: EPA Regional Screening Level (RSL) table (November, 2018); tap water RSLs based on an an excess lifetime cancer risk (ELCR) of 1 x 10⁻⁶ and hazard index (HI) of 1.0.(2) Individual excess lifetime cancer risk (IELCR) and noncarcinogenic hazard index (HI)were estimated using a ratio approach:
Where:CGW = Concentration in groundwater (µg/L)RSLc = Tap Water Carcinogenic RSL, based on cancer risk of 1 x 10⁻⁶ (µg/L)RSLn = Tap Water Non-carcinogenic RSL, based on hazard index of 1.0 (µg/L)TR = Screening Level Target Risk of 1 x 10⁻⁶
THI = Screening Level Target Hazard Index of 1.0(3) Risk estimates (IELCR and noncarcinogenic HI) were summed for each sample location to obtain cumulative risk results.
IELCR = individual excess lifetime cancer riskHI = hazard indexµg/L = microgram per literCOC = chemical of concernJ = result is estimatedPCE = tetrachloroetheneRSL = Regional Screening LevelTCE = trichloroethene
TRRSLC
IELCRc
GW ×= THIRSLC
HIn
GW ×=
AX0523180835MGM 1 of 1
Appendix A-2 Human Health Risk Assessment Data

Appendix A-2. Analytical Data Used in Risk AssessmentDowntown Environmental Assessment Project, Montgomery, Alabama
Matrix Station ID Sample IDCollection
Date COPC Detect Result Qualifier ResultSample
Type
UpperDepth(feet)
LowerDepth(feet) Method
Soil Vapor AMS-01 AMS-01-0916 19-Sep-16 cis-1,2-DCE No 1.59 U µg/m3 p 11.8 12 TO-15Soil Vapor AMS-01 AMS-01-0916 19-Sep-16 trans-1,2-DCE No 1.59 U µg/m3 p 11.8 12 TO-15Soil Vapor AMS-01 AMS-01-0916 19-Sep-16 PCE Yes 14.2 µg/m3 p 11.8 12 TO-15Soil Vapor AMS-01 AMS-01-0916 19-Sep-16 TCE No 2.14 U µg/m3 p 11.8 12 TO-15Soil Vapor AMS-01 AMS-01-0916 19-Sep-16 Vinyl Chloride No 1.02 U µg/m3 p 11.8 12 TO-15Soil Vapor AMS-02 AMS-02-0916 19-Sep-16 cis-1,2-DCE No 1.59 U µg/m3 p 11.8 12 TO-15Soil Vapor AMS-02 AMS-02-0916 19-Sep-16 trans-1,2-DCE No 1.59 U µg/m3 p 11.8 12 TO-15Soil Vapor AMS-02 AMS-02-0916 19-Sep-16 PCE Yes 6.28 µg/m3 p 11.8 12 TO-15Soil Vapor AMS-02 AMS-02-0916 19-Sep-16 TCE Yes 6.67 µg/m3 p 11.8 12 TO-15Soil Vapor AMS-02 AMS-02-0916 19-Sep-16 Vinyl Chloride No 1.02 U µg/m3 p 11.8 12 TO-15Soil Vapor AMS-03 AMS-03-0916 20-Sep-16 cis-1,2-DCE No 1.59 U µg/m3 p 14.8 15 TO-15Soil Vapor AMS-03 AMS-03-0916 20-Sep-16 trans-1,2-DCE No 1.59 U µg/m3 p 14.8 15 TO-15Soil Vapor AMS-03 AMS-03-0916 20-Sep-16 PCE Yes 9.68 µg/m3 p 14.8 15 TO-15Soil Vapor AMS-03 AMS-03-0916 20-Sep-16 TCE No 2.14 U µg/m3 p 14.8 15 TO-15Soil Vapor AMS-03 AMS-03-0916 20-Sep-16 Vinyl Chloride No 1.02 U µg/m3 p 14.8 15 TO-15Soil Vapor AMS-04 AMS-04-0916 20-Sep-16 cis-1,2-DCE No 1.59 U µg/m3 p 11.8 12 TO-15Soil Vapor AMS-04 AMS-04-0916 20-Sep-16 trans-1,2-DCE No 1.59 U µg/m3 p 11.8 12 TO-15Soil Vapor AMS-04 AMS-04-0916 20-Sep-16 PCE Yes 9.37 µg/m3 p 11.8 12 TO-15Soil Vapor AMS-04 AMS-04-0916 20-Sep-16 TCE No 2.14 U µg/m3 p 11.8 12 TO-15Soil Vapor AMS-04 AMS-04-0916 20-Sep-16 Vinyl Chloride No 1.02 U µg/m3 p 11.8 12 TO-15Soil Vapor AMS-04 AMS-FD-0916 20-Sep-16 cis-1,2-DCE No 1.59 U µg/m3 FD 11.8 12 TO-15Soil Vapor AMS-04 AMS-FD-0916 20-Sep-16 trans-1,2-DCE No 1.59 U µg/m3 FD 11.8 12 TO-15Soil Vapor AMS-04 AMS-FD-0916 20-Sep-16 PCE Yes 9.18 µg/m3 FD 11.8 12 TO-15Soil Vapor AMS-04 AMS-FD-0916 20-Sep-16 TCE No 2.14 U µg/m3 FD 11.8 12 TO-15Soil Vapor AMS-04 AMS-FD-0916 20-Sep-16 Vinyl Chloride No 1.02 U µg/m3 FD 11.8 12 TO-15Soil Vapor TMPZ-1/MW-13S SV-TMPZ1-08 21-Sep-16 cis-1,2-DCE No 1.59 U µg/m3 p 7 8 TO-15Soil Vapor TMPZ-1/MW-13S SV-TMPZ1-08 21-Sep-16 trans-1,2-DCE No 1.59 U µg/m3 p 7 8 TO-15Soil Vapor TMPZ-1/MW-13S SV-TMPZ1-08 21-Sep-16 PCE Yes 3.49 µg/m3 p 7 8 TO-15Soil Vapor TMPZ-1/MW-13S SV-TMPZ1-08 21-Sep-16 TCE No 2.14 U µg/m3 p 7 8 TO-15Soil Vapor TMPZ-1/MW-13S SV-TMPZ1-08 21-Sep-16 Vinyl Chloride No 1.02 U µg/m3 p 7 8 TO-15Soil Vapor VIMS-10 VIMS-10-0916 21-Sep-16 cis-1,2-DCE Yes 88.6 µg/m3 p 9 10 TO-15Soil Vapor VIMS-10 VIMS-10-0916 21-Sep-16 trans-1,2-DCE Yes 2.55 µg/m3 p 9 10 TO-15Soil Vapor VIMS-10 VIMS-10-0916 21-Sep-16 PCE Yes 99.6 µg/m3 p 9 10 TO-15Soil Vapor VIMS-10 VIMS-10-0916 21-Sep-16 TCE Yes 13100 µg/m3 p 9 10 TO-15Soil Vapor VIMS-10 VIMS-10-0916 21-Sep-16 Vinyl Chloride No 1.02 U µg/m3 p 9 10 TO-15Soil Vapor MW-12S SV-MW12-08 21-Sep-16 cis-1,2-DCE No 1.59 U µg/m3 p 7 8 TO-15Soil Vapor MW-12S SV-MW12-08 21-Sep-16 trans-1,2-DCE No 1.59 U µg/m3 p 7 8 TO-15
AX0523180835MGM 1 of 2

Appendix A-2. Analytical Data Used in Risk AssessmentDowntown Environmental Assessment Project, Montgomery, Alabama
Matrix Station ID Sample IDCollection
Date COPC Detect Result Qualifier ResultSample
Type
UpperDepth(feet)
LowerDepth(feet) Method
Soil Vapor MW-12S SV-MW12-08 21-Sep-16 PCE Yes 23.3 µg/m3 p 7 8 TO-15Soil Vapor MW-12S SV-MW12-08 21-Sep-16 TCE Yes 3.56 µg/m3 p 7 8 TO-15Soil Vapor MW-12S SV-MW12-08 21-Sep-16 Vinyl Chloride No 1.02 U µg/m3 p 7 8 TO-15Soil Vapor MW-08S SV-MW08-08 22-Sep-16 cis-1,2-DCE No 1.59 U µg/m3 p 7 8 TO-15Soil Vapor MW-08S SV-MW08-08 22-Sep-16 trans-1,2-DCE No 1.59 U µg/m3 p 7 8 TO-15Soil Vapor MW-08S SV-MW08-08 22-Sep-16 PCE Yes 493 µg/m3 p 7 8 TO-15Soil Vapor MW-08S SV-MW08-08 22-Sep-16 TCE Yes 336 µg/m3 p 7 8 TO-15Soil Vapor MW-08S SV-MW08-08 22-Sep-16 Vinyl Chloride No 1.02 U µg/m3 p 7 8 TO-15Soil Vapor MW-02S AMS-MW02-08 23-Sep-16 cis-1,2-DCE No 1.59 U µg/m3 p 7.8 8 TO-15Soil Vapor MW-02S AMS-MW02-08 23-Sep-16 trans-1,2-DCE No 1.59 U µg/m3 p 7.8 8 TO-15Soil Vapor MW-02S AMS-MW02-08 23-Sep-16 PCE Yes 4940 µg/m3 p 7.8 8 TO-15Soil Vapor MW-02S AMS-MW02-08 23-Sep-16 TCE Yes 3.21 µg/m3 p 7.8 8 TO-15Soil Vapor MW-02S AMS-MW02-08 23-Sep-16 Vinyl Chloride No 1.02 U µg/m3 p 7.8 8 TO-15
Notes:cis-1,2-DCE = cis-1,2-DichloroetheneCOPC = chemical of potential concern
PCE = TetrachloroetheneTCE = Trichloroethenetrans-1,2-DCE = trans-1,2-Dichloroethene
J = result is estimated
µg/m3 = microgram per cubic meterµg/L = microgram per liter
FD = Field Duplicate
P = PrimaryNA = Not Applicable
U = Not detected
AX0523180835MGM 2 of 2

Appendix A-3 Human Health Risk Assessment
VISL Calculator Worksheets

Site-specific VISL Results 1Commercial Equation Inputs
* Inputted values different from Commercial defaults are highlighted.Output generated 30NOV2018:17:22:46
Site-specific VISL Results 1Commercial Equation Inputs
* Inputted values different from Commercial defaults are highlighted.Output generated 30NOV2018:17:22:46
Variable
CommercialAir
DefaultValue Value
AFgw
(Attenuation Factor Groundwater) unitless 0.001 0.001
AFss
(Attenuation Factor Sub-Slab) unitless 0.03 0.03
ATw (averaging time - composite worker) 365 365
EDw (exposure duration - composite worker) yr 25 25
EFw (exposure frequency - composite worker) day/yr 250 250
ETw (exposure time - composite worker) hr 8 8
THQ (target hazard quotient) unitless 0.1 0.1
LT (lifetime) yr 70 70
TR (target risk) unitless 1.0E-06 1.0E-06
Appendix A-3VISL Calculator Output, MW-08S - Commercial Scenario

Commercial Vapor Intrusion Screening Levels (VISL) 2
Key: I = IRIS; P = PPRTV; O = OPP; A = ATSDR; C = Cal EPA; X = APPENDIX PPRTV SCREEN;H = HEAST; W = see RSL user guide Section 2.3.5; E = see RSL user guide Section 2.3.6; S = see RSLuser's guide Section 5.
Commercial Vapor Intrusion Screening Levels (VISL) 2
Key: I = IRIS; P = PPRTV; O = OPP; A = ATSDR; C = Cal EPA; X = APPENDIX PPRTV SCREEN;H = HEAST; W = see RSL user guide Section 2.3.5; E = see RSL user guide Section 2.3.6; S = see RSLuser's guide Section 5.
ChemicalCAS
Number
Does thechemical
meetthe
definitionfor
volatility?(HLC>1E-5or VP>1)
Does thechemical
haveinhalation
toxicitydata?(IUR
and/orRfC)
Is ChemicalSufficiently
Volatile and Toxicto
Pose InhalationRisk
Via VaporIntrusion
from Soil Source?(C
vp > C
i,a,Target?)
Is ChemicalSufficiently
Volatile and Toxicto
Pose InhalationRisk
Via VaporIntrusion fromGroundwater
Source?(C
hc > C
i,a,Target?)
TargetIndoor Air
Concentration(TCR=1E-06or THQ=0.1)
MIN(Cia,c
,Cia,nc
)
(µg/m3)Toxicity
Basis
Trichloroethylene 79-01-6 Yes Yes Yes Yes 8.76E-01 NC
Chemical
TargetSub-Slab andNear-source
Soil GasConcentration
(TCR=1E-06or THQ=0.1)C
sg,Target
(µg/m3)
TargetGroundwaterConcentration
(TCR=1E-06or THQ=0.1)C
gw,Target
(µg/L)
Is TargetGroundwaterConcentration
< MCL?(C
gw < MCL?)
Pure PhaseVapor
ConcentrationC
vp\
(25 ℃)\
(µg/m3)
MaximumGroundwater
VaporConcentration
Chc
\
(µg/m3)
Temperaturefor MaximumGroundwater
VaporConcentration
(℃)
LowerExplosive
LimitLEL(%by
volume)
Trichloroethylene 2.92E+01 2.18E+00 Yes (5) 4.88E+08 5.15E+08 25 8.00
ChemicalLELRef
IUR(ug/m3)-1
IURRef
RfC(mg/m3)
RfCRef
MutagenicIndicator
CarcinogenicVISL
TCR=1E-06C
ia,c
(µg/m3)
NoncarcinogenicVISL
THQ=0.1C
ia,nc
(µg/m3)
Trichloroethylene CRC89 4.10E-06 I 2.00E-03 I Mut 2.99E+00 8.76E-01
Appendix A-3VISL Calculator Output, MW-08S - Commercial Scenario

Commercial Vapor Intrusion Risk 3Output generated 30NOV2018:17:22:46Commercial Vapor Intrusion Risk 3Output generated 30NOV2018:17:22:46
ChemicalCAS
Number
SiteSub-Slab andExterior Soil
GasConcentration
Csg
\
(µg/m3)
SiteIndoor Air
ConcentrationC
i,a\
(µg/m3)
VICarcinogenic
RiskCR
VIHazard
HQIUR
(ug/m3)-1
IURRef
ChronicRfC
(mg/m3)
Trichloroethylene 79-01-6 336 1.01E+01 3.37E-06 1.15E+00 4.10E-06 I 2.00E-03
*Sum 3.37E-06 1.15E+00
ChemicalRfCRef
Temperature
(℃)\for
GroundwaterVapor
Concentration Mutagen?
Trichloroethylene IRIS 25 Mut
*Sum
Appendix A-3VISL Calculator Output, MW-08S - Commercial Scenario

Chemical Properties 4Output generated 30NOV2018:17:22:46Chemical Properties 4Output generated 30NOV2018:17:22:46
ChemicalCAS
Number
Does thechemical
meetthe
definitionfor
volatility?(HLC>1E-5or VP>1)
Does thechemical
haveinhalation
toxicitydata?(IUR
and/orRfC) MW
MWRef
VaporPressure
VP(mm Hg)
VPRef
S(mg/L)
SRef
Trichloroethylene 79-01-6 Yes Yes 131.39 PHYSPROP 6.90E+01 PHYSPROP 1.28E+03 PHYSPROP
ChemicalMCL
(ug/L)HLC
(atm-m3/mole)
Henry'sLaw
Constant(unitless)
H`and HLC
Ref
Henry'sLaw
ConstantUsed inCalcs
(unitless)D
ia\
(cm2/s)D
ia\
RefD
iw\
(cm2/s)D
iw\
Ref
Trichloroethylene 5 9.85E-03 4.03E-01 PHYSPROP 4.03E-01 6.87E-02 WATER9 (U.S. EPA,2001)
1.02E-05 WATER9 (U.S. EPA,2001)
Chemical
NormalBoilingPoint
BP(K)
BPRef
CriticalTemperature
TC(K)
TCRef
Enthalpy ofvaporization
atthe normal
boiling point
ΔHv,b
\(cal/mol)
ΔHv,b
\Ref
Koc
\(cm3/g)
Koc
\Ref
LowerExplosive
LimitLEL(%by
volume)LELRef
Trichloroethylene 360.35 PHYSPROP 5.71E+02 YAWS 7505.00 Weast 60.7 EPI 8.00 CRC89
Appendix A-3VISL Calculator Output, MW-08S - Commercial Scenario
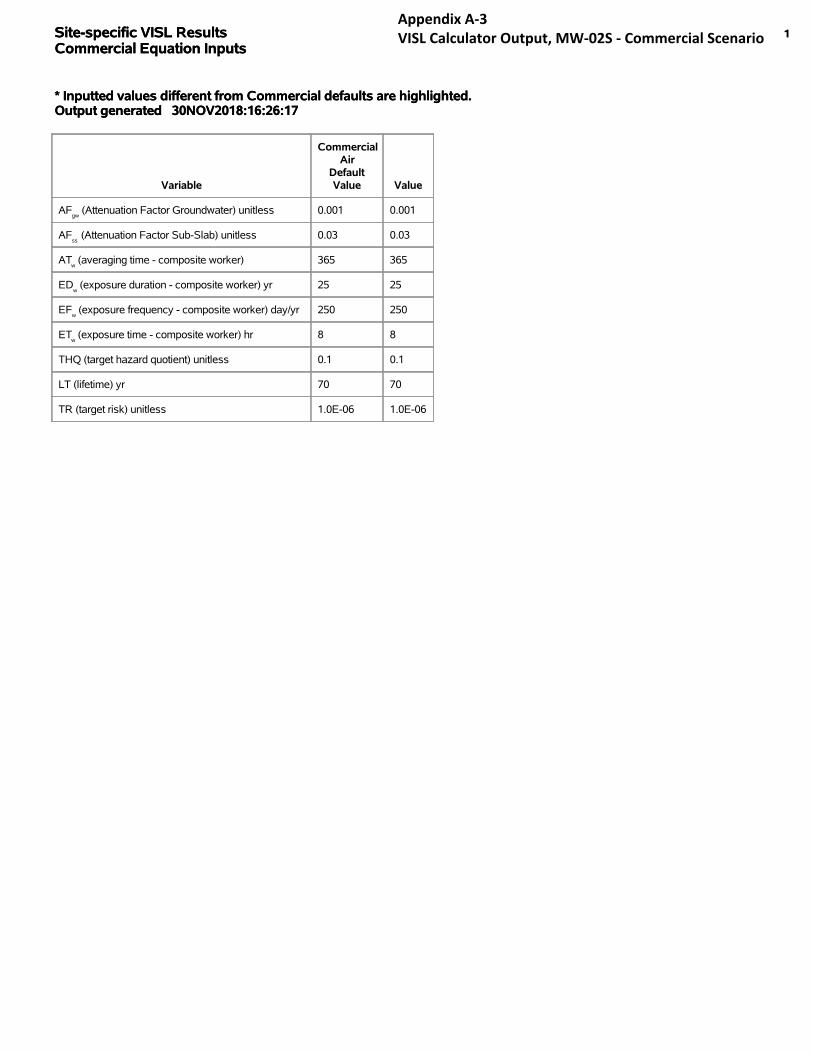
Site-specific VISL Results 1
Commercial Equation Inputs
* Inputted values different from Commercial defaults are highlighted.Output generated 30NOV2018:16:26:17
Site-specific VISL Results 1
Commercial Equation Inputs
* Inputted values different from Commercial defaults are highlighted.Output generated 30NOV2018:16:26:17
Variable
CommercialAir
DefaultValue Value
AFgw
(Attenuation Factor Groundwater) unitless 0.001 0.001
AFss
(Attenuation Factor Sub-Slab) unitless 0.03 0.03
ATw (averaging time - composite worker) 365 365
EDw (exposure duration - composite worker) yr 25 25
EFw (exposure frequency - composite worker) day/yr 250 250
ETw (exposure time - composite worker) hr 8 8
THQ (target hazard quotient) unitless 0.1 0.1
LT (lifetime) yr 70 70
TR (target risk) unitless 1.0E-06 1.0E-06
Appendix A-3VISL Calculator Output, MW-02S - Commercial Scenario

Commercial Vapor Intrusion Screening Levels (VISL) 2
Key: I = IRIS; P = PPRTV; O = OPP; A = ATSDR; C = Cal EPA; X = APPENDIX PPRTV SCREEN;H = HEAST; W = see RSL user guide Section 2.3.5; E = see RSL user guide Section 2.3.6; S = see RSLuser's guide Section 5.
Commercial Vapor Intrusion Screening Levels (VISL) 2
Key: I = IRIS; P = PPRTV; O = OPP; A = ATSDR; C = Cal EPA; X = APPENDIX PPRTV SCREEN;H = HEAST; W = see RSL user guide Section 2.3.5; E = see RSL user guide Section 2.3.6; S = see RSLuser's guide Section 5.
ChemicalCAS
Number
Does thechemical
meetthe
definitionfor
volatility?(HLC>1E-5or VP>1)
Does thechemical
haveinhalation
toxicitydata?(IUR
and/orRfC)
Is ChemicalSufficiently
Volatile and Toxicto
Pose InhalationRisk
Via VaporIntrusion
from Soil Source?(C
vp > C
i,a,Target?)
Is ChemicalSufficiently
Volatile and Toxicto
Pose InhalationRisk
Via VaporIntrusion fromGroundwater
Source?(C
hc > C
i,a,Target?)
TargetIndoor Air
Concentration(TCR=1E-06or THQ=0.1)
MIN(Cia,c
,Cia,nc
)
(µg/m3)Toxicity
Basis
Tetrachloroethylene 127-18-4 Yes Yes Yes Yes 1.75E+01 NC
Chemical
TargetSub-Slab andNear-source
Soil GasConcentration
(TCR=1E-06or THQ=0.1)C
sg,Target
(µg/m3)
TargetGroundwaterConcentration
(TCR=1E-06or THQ=0.1)C
gw,Target
(µg/L)
Is TargetGroundwaterConcentration
< MCL?(C
gw < MCL?)
Pure PhaseVapor
ConcentrationC
vp\
(25 ℃)\
(µg/m3)
MaximumGroundwater
VaporConcentration
Chc
\
(µg/m3)
Temperaturefor MaximumGroundwater
VaporConcentration
(℃)
LowerExplosive
LimitLEL(%by
volume)
Tetrachloroethylene 5.84E+02 2.42E+01 No (5) 1.65E+08 1.49E+08 25
ChemicalLELRef
IUR(ug/m3)-1
IURRef
RfC(mg/m3)
RfCRef
MutagenicIndicator
CarcinogenicVISL
TCR=1E-06C
ia,c
(µg/m3)
NoncarcinogenicVISL
THQ=0.1C
ia,nc
(µg/m3)
Tetrachloroethylene 2.60E-07 I 4.00E-02 I No 4.72E+01 1.75E+01
Appendix A-3VISL Calculator Output, MW-02S - Commercial Scenario

Commercial Vapor Intrusion Risk 3Output generated 30NOV2018:16:26:17Commercial Vapor Intrusion Risk 3Output generated 30NOV2018:16:26:17
ChemicalCAS
Number
SiteSub-Slab andExterior Soil
GasConcentration
Csg
\
(µg/m3)
SiteIndoor Air
ConcentrationC
i,a\
(µg/m3)
VICarcinogenic
RiskCR
VIHazard
HQIUR
(ug/m3)-1
IURRef
Tetrachloroethylene 127-18-4 4940 1.48E+02 3.14E-06 8.46E-01 2.60E-07 I
*Sum 3.14E-06 8.46E-01
Chemical
ChronicRfC
(mg/m3)RfCRef
Temperature
(℃)\for
GroundwaterVapor
Concentration Mutagen?
Tetrachloroethylene 4.00E-02 IRIS 25 No
*Sum
Appendix A-3VISL Calculator Output, MW-02S - Commercial Scenario
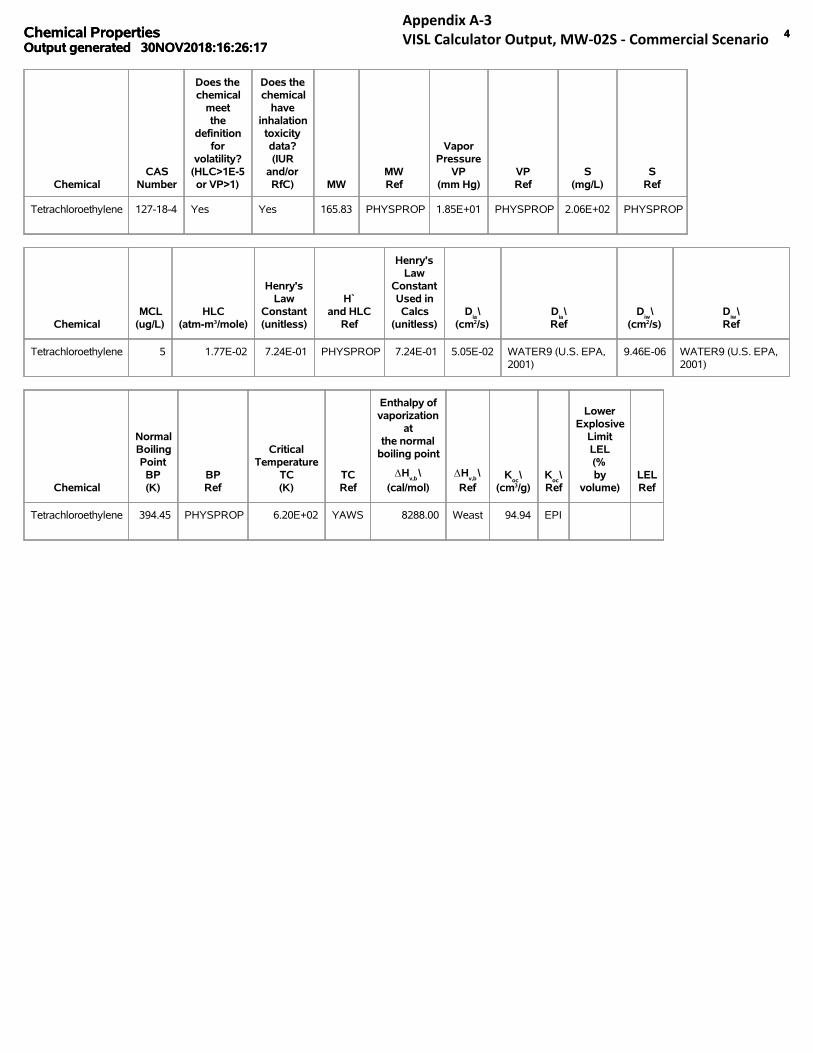
Chemical Properties 4Output generated 30NOV2018:16:26:17Chemical Properties 4Output generated 30NOV2018:16:26:17
ChemicalCAS
Number
Does thechemical
meetthe
definitionfor
volatility?(HLC>1E-5or VP>1)
Does thechemical
haveinhalation
toxicitydata?(IUR
and/orRfC) MW
MWRef
VaporPressure
VP(mm Hg)
VPRef
S(mg/L)
SRef
Tetrachloroethylene 127-18-4 Yes Yes 165.83 PHYSPROP 1.85E+01 PHYSPROP 2.06E+02 PHYSPROP
ChemicalMCL
(ug/L)HLC
(atm-m3/mole)
Henry'sLaw
Constant(unitless)
H`and HLC
Ref
Henry'sLaw
ConstantUsed inCalcs
(unitless)D
ia\
(cm2/s)D
ia\
RefD
iw\
(cm2/s)D
iw\
Ref
Tetrachloroethylene 5 1.77E-02 7.24E-01 PHYSPROP 7.24E-01 5.05E-02 WATER9 (U.S. EPA,2001)
9.46E-06 WATER9 (U.S. EPA,2001)
Chemical
NormalBoilingPoint
BP(K)
BPRef
CriticalTemperature
TC(K)
TCRef
Enthalpy ofvaporization
atthe normal
boiling point
ΔHv,b
\(cal/mol)
ΔHv,b
\Ref
Koc
\(cm3/g)
Koc
\Ref
LowerExplosive
LimitLEL(%by
volume)LELRef
Tetrachloroethylene 394.45 PHYSPROP 6.20E+02 YAWS 8288.00 Weast 94.94 EPI
Appendix A-3VISL Calculator Output, MW-02S - Commercial Scenario

Site-specific VISL Results 1
Commercial Equation Inputs
* Inputted values different from Commercial defaults are highlighted.Output generated 30NOV2018:16:27:34
Site-specific VISL Results 1
Commercial Equation Inputs
* Inputted values different from Commercial defaults are highlighted.Output generated 30NOV2018:16:27:34
Variable
CommercialAir
DefaultValue Value
AFgw
(Attenuation Factor Groundwater) unitless 0.001 0.001
AFss
(Attenuation Factor Sub-Slab) unitless 0.03 0.03
ATw (averaging time - composite worker) 365 365
EDw (exposure duration - composite worker) yr 25 25
EFw (exposure frequency - composite worker) day/yr 250 250
ETw (exposure time - composite worker) hr 8 8
THQ (target hazard quotient) unitless 0.1 0.1
LT (lifetime) yr 70 70
TR (target risk) unitless 1.0E-06 1.0E-06
Appendix A-3VISL Calculator Output, VIMS - Commercial Scenario

Commercial Vapor Intrusion Screening Levels (VISL) 2
Key: I = IRIS; P = PPRTV; O = OPP; A = ATSDR; C = Cal EPA; X = APPENDIX PPRTV SCREEN;H = HEAST; W = see RSL user guide Section 2.3.5; E = see RSL user guide Section 2.3.6; S = see RSLuser's guide Section 5.
Commercial Vapor Intrusion Screening Levels (VISL) 2
Key: I = IRIS; P = PPRTV; O = OPP; A = ATSDR; C = Cal EPA; X = APPENDIX PPRTV SCREEN;H = HEAST; W = see RSL user guide Section 2.3.5; E = see RSL user guide Section 2.3.6; S = see RSLuser's guide Section 5.
ChemicalCAS
Number
Does thechemical
meetthe
definitionfor
volatility?(HLC>1E-5or VP>1)
Does thechemical
haveinhalation
toxicitydata?(IUR
and/orRfC)
Is ChemicalSufficiently
Volatile and Toxicto
Pose InhalationRisk
Via VaporIntrusion
from Soil Source?(C
vp > C
i,a,Target?)
Is ChemicalSufficiently
Volatile and Toxicto
Pose InhalationRisk
Via VaporIntrusion fromGroundwater
Source?(C
hc > C
i,a,Target?)
TargetIndoor Air
Concentration(TCR=1E-06or THQ=0.1)
MIN(Cia,c
,Cia,nc
)
(µg/m3)Toxicity
Basis
Trichloroethylene 79-01-6 Yes Yes Yes Yes 8.76E-01 NC
Chemical
TargetSub-Slab andNear-source
Soil GasConcentration
(TCR=1E-06or THQ=0.1)C
sg,Target
(µg/m3)
TargetGroundwaterConcentration
(TCR=1E-06or THQ=0.1)C
gw,Target
(µg/L)
Is TargetGroundwaterConcentration
< MCL?(C
gw < MCL?)
Pure PhaseVapor
ConcentrationC
vp\
(25 ℃)\
(µg/m3)
MaximumGroundwater
VaporConcentration
Chc
\
(µg/m3)
Temperaturefor MaximumGroundwater
VaporConcentration
(℃)
LowerExplosive
LimitLEL(%by
volume)
Trichloroethylene 2.92E+01 2.18E+00 Yes (5) 4.88E+08 5.15E+08 25 8.00
ChemicalLELRef
IUR(ug/m3)-1
IURRef
RfC(mg/m3)
RfCRef
MutagenicIndicator
CarcinogenicVISL
TCR=1E-06C
ia,c
(µg/m3)
NoncarcinogenicVISL
THQ=0.1C
ia,nc
(µg/m3)
Trichloroethylene CRC89 4.10E-06 I 2.00E-03 I Mut 2.99E+00 8.76E-01
Appendix A-3VISL Calculator Output, VIMS - Commercial Scenario

Commercial Vapor Intrusion Risk 3Output generated 30NOV2018:16:27:34Commercial Vapor Intrusion Risk 3Output generated 30NOV2018:16:27:34
ChemicalCAS
Number
SiteSub-Slab andExterior Soil
GasConcentration
Csg
\
(µg/m3)
SiteIndoor Air
ConcentrationC
i,a\
(µg/m3)
VICarcinogenic
RiskCR
VIHazard
HQIUR
(ug/m3)-1
IURRef
ChronicRfC
(mg/m3)
Trichloroethylene 79-01-6 13100 3.93E+02 1.31E-04 4.49E+01 4.10E-06 I 2.00E-03
*Sum 1.31E-04 4.49E+01
ChemicalRfCRef
Temperature
(℃)\for
GroundwaterVapor
Concentration Mutagen?
Trichloroethylene IRIS 25 Mut
*Sum
Appendix A-3VISL Calculator Output, VIMS - Commercial Scenario

Chemical Properties 4Output generated 30NOV2018:16:27:34Chemical Properties 4Output generated 30NOV2018:16:27:34
ChemicalCAS
Number
Does thechemical
meetthe
definitionfor
volatility?(HLC>1E-5or VP>1)
Does thechemical
haveinhalation
toxicitydata?(IUR
and/orRfC) MW
MWRef
VaporPressure
VP(mm Hg)
VPRef
S(mg/L)
SRef
Trichloroethylene 79-01-6 Yes Yes 131.39 PHYSPROP 6.90E+01 PHYSPROP 1.28E+03 PHYSPROP
ChemicalMCL
(ug/L)HLC
(atm-m3/mole)
Henry'sLaw
Constant(unitless)
H`and HLC
Ref
Henry'sLaw
ConstantUsed inCalcs
(unitless)D
ia\
(cm2/s)D
ia\
RefD
iw\
(cm2/s)D
iw\
Ref
Trichloroethylene 5 9.85E-03 4.03E-01 PHYSPROP 4.03E-01 6.87E-02 WATER9 (U.S. EPA,2001)
1.02E-05 WATER9 (U.S. EPA,2001)
Chemical
NormalBoilingPoint
BP(K)
BPRef
CriticalTemperature
TC(K)
TCRef
Enthalpy ofvaporization
atthe normal
boiling point
ΔHv,b
\(cal/mol)
ΔHv,b
\Ref
Koc
\(cm3/g)
Koc
\Ref
LowerExplosive
LimitLEL(%by
volume)LELRef
Trichloroethylene 360.35 PHYSPROP 5.71E+02 YAWS 7505.00 Weast 60.7 EPI 8.00 CRC89
Appendix A-3VISL Calculator Output, VIMS - Commercial Scenario

Site-specific VISL Results1
Resident Equation Inputs
* Inputted values different from Resident defaults are highlighted.Output generated 30NOV2018:16:25:08
Site-specific VISL Results1
Resident Equation Inputs
* Inputted values different from Resident defaults are highlighted.Output generated 30NOV2018:16:25:08
Variable
ResidentAir
DefaultValue Value
AFgw
(Attenuation Factor Groundwater) unitless 0.001 0.001
AFss
(Attenuation Factor Sub-Slab) unitless 0.03 0.03
EDres
(exposure duration) years 26 26
ED0-2
(mutagenic exposure duration first phase) years 2 2
ED2-6
(mutagenic exposure duration second phase) years 4 4
ED6-16
(mutagenic exposure duration third phase) years 10 10
ED16-26
(mutagenic exposure duration fourth phase) years 10 10
EFres
(exposure frequency) days/year 350 350
EF0-2
(mutagenic exposure frequency first phase) days/year 350 350
EF2-6
(mutagenic exposure frequency second phase) days/year 350 350
EF6-16
(mutagenic exposure frequency third phase) days/year 350 350
EF16-26
(mutagenic exposure frequency fourth phase) days/year 350 350
ETres
(exposure time) hours/day 24 24
ET0-2
(mutagenic exposure time first phase) hours/day 24 24
ET2-6
(mutagenic exposure time second phase) hours/day 24 24
ET6-16
(mutagenic exposure time third phase) hours/day 24 24
ET16-26
(mutagenic exposure time fourth phase) hours/day 24 24
THQ (target hazard quotient) unitless 0.1 0.1
LT (lifetime) years 70 70
TR (target risk) unitless 1.0E-06 1.0E-06
Appendix A-3VISL Calculator Output, MW-02S - Residential Scenario

Resident Vapor Intrusion Screening Levels (VISL) 2
Key: I = IRIS; P = PPRTV; O = OPP; A = ATSDR; C = Cal EPA; X = APPENDIX PPRTV SCREEN;H = HEAST; W = see RSL user guide Section 2.3.5; E = see RSL user guide Section 2.3.6; S = see RSLuser's guide Section 5.
Resident Vapor Intrusion Screening Levels (VISL) 2
Key: I = IRIS; P = PPRTV; O = OPP; A = ATSDR; C = Cal EPA; X = APPENDIX PPRTV SCREEN;H = HEAST; W = see RSL user guide Section 2.3.5; E = see RSL user guide Section 2.3.6; S = see RSLuser's guide Section 5.
ChemicalCAS
Number
Does thechemical
meetthe
definitionfor
volatility?(HLC>1E-5or VP>1)
Does thechemical
haveinhalation
toxicitydata?(IUR
and/orRfC)
Is ChemicalSufficiently
Volatile and Toxicto
Pose InhalationRisk
Via VaporIntrusion
from Soil Source?(C
vp > C
i,a,Target?)
Is ChemicalSufficiently
Volatile and Toxicto
Pose InhalationRisk
Via VaporIntrusion fromGroundwater
Source?(C
hc > C
i,a,Target?)
TargetIndoor Air
Concentration(TCR=1E-06or THQ=0.1)
MIN(Cia,c
,Cia,nc
)
(µg/m3)Toxicity
Basis
Tetrachloroethylene 127-18-4 Yes Yes Yes Yes 4.17E+00 NC
Chemical
TargetSub-Slab andNear-source
Soil GasConcentration
(TCR=1E-06or THQ=0.1)C
sg,Target
(µg/m3)
TargetGroundwaterConcentration
(TCR=1E-06or THQ=0.1)C
gw,Target
(µg/L)
Is TargetGroundwaterConcentration
< MCL?(C
gw < MCL?)
Pure PhaseVapor
ConcentrationC
vp\
(25 ℃)\
(µg/m3)
MaximumGroundwater
VaporConcentration
Chc
\
(µg/m3)
Temperaturefor MaximumGroundwater
VaporConcentration
(℃)
LowerExplosive
LimitLEL(%by
volume)
Tetrachloroethylene 1.39E+02 5.76E+00 No (5) 1.65E+08 1.49E+08 25
ChemicalLELRef
IUR(ug/m3)-1
IURRef
RfC(mg/m3)
RfCRef
MutagenicIndicator
CarcinogenicVISL
TCR=1E-06C
ia,c
(µg/m3)
NoncarcinogenicVISL
THQ=0.1C
ia,nc
(µg/m3)
Tetrachloroethylene 2.60E-07 I 4.00E-02 I No 1.08E+01 4.17E+00
Appendix A-3VISL Calculator Output, MW-02S - Residential Scenario

Resident Vapor Intrusion Risk 3Output generated 30NOV2018:16:25:08Resident Vapor Intrusion Risk 3Output generated 30NOV2018:16:25:08
ChemicalCAS
Number
SiteSub-Slab andExterior Soil
GasConcentration
Csg
\
(µg/m3)
SiteIndoor Air
ConcentrationC
i,a\
(µg/m3)
VICarcinogenic
RiskCR
VIHazard
HQIUR
(ug/m3)-1
IURRef
Tetrachloroethylene 127-18-4 4940 1.48E+02 1.37E-05 3.55E+00 2.60E-07 I
*Sum 1.37E-05 3.55E+00
Chemical
ChronicRfC
(mg/m3)RfCRef
Temperature
(℃)\for
GroundwaterVapor
Concentration Mutagen?
Tetrachloroethylene 4.00E-02 IRIS 25 No
*Sum
Appendix A-3VISL Calculator Output, MW-02S - Residential Scenario

Chemical Properties 4Output generated 30NOV2018:16:25:08Chemical Properties 4Output generated 30NOV2018:16:25:08
ChemicalCAS
Number
Does thechemical
meetthe
definitionfor
volatility?(HLC>1E-5or VP>1)
Does thechemical
haveinhalation
toxicitydata?(IUR
and/orRfC) MW
MWRef
VaporPressure
VP(mm Hg)
VPRef
S(mg/L)
SRef
Tetrachloroethylene 127-18-4 Yes Yes 165.83 PHYSPROP 1.85E+01 PHYSPROP 2.06E+02 PHYSPROP
ChemicalMCL
(ug/L)HLC
(atm-m3/mole)
Henry'sLaw
Constant(unitless)
H`and HLC
Ref
Henry'sLaw
ConstantUsed inCalcs
(unitless)D
ia\
(cm2/s)D
ia\
RefD
iw\
(cm2/s)D
iw\
Ref
Tetrachloroethylene 5 1.77E-02 7.24E-01 PHYSPROP 7.24E-01 5.05E-02 WATER9 (U.S. EPA,2001)
9.46E-06 WATER9 (U.S. EPA,2001)
Chemical
NormalBoilingPoint
BP(K)
BPRef
CriticalTemperature
TC(K)
TCRef
Enthalpy ofvaporization
atthe normal
boiling point
ΔHv,b
\(cal/mol)
ΔHv,b
\Ref
Koc
\(cm3/g)
Koc
\Ref
LowerExplosive
LimitLEL(%by
volume)LELRef
Tetrachloroethylene 394.45 PHYSPROP 6.20E+02 YAWS 8288.00 Weast 94.94 EPI
Appendix A-3VISL Calculator Output, MW-02S - Residential Scenario
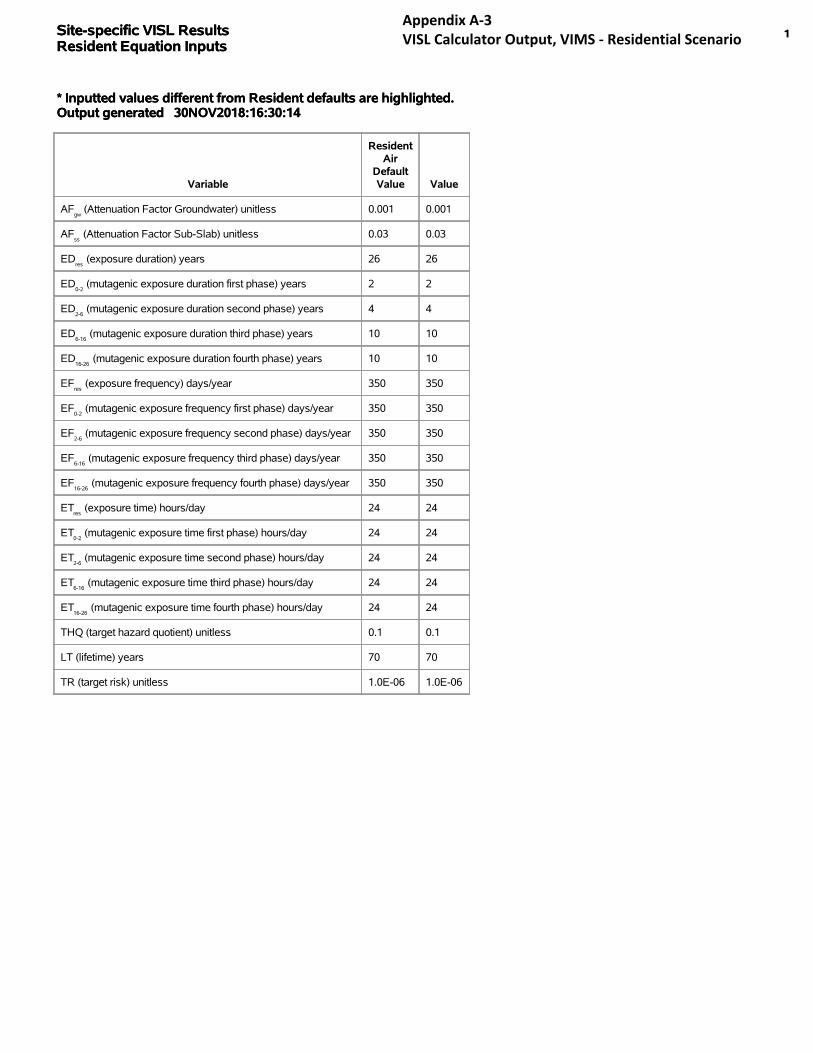
Site-specific VISL Results 1Resident Equation Inputs
* Inputted values different from Resident defaults are highlighted.Output generated 30NOV2018:16:30:14
Site-specific VISL Results 1Resident Equation Inputs
* Inputted values different from Resident defaults are highlighted.Output generated 30NOV2018:16:30:14
Variable
ResidentAir
DefaultValue Value
AFgw
(Attenuation Factor Groundwater) unitless 0.001 0.001
AFss
(Attenuation Factor Sub-Slab) unitless 0.03 0.03
EDres
(exposure duration) years 26 26
ED0-2
(mutagenic exposure duration first phase) years 2 2
ED2-6
(mutagenic exposure duration second phase) years 4 4
ED6-16
(mutagenic exposure duration third phase) years 10 10
ED16-26
(mutagenic exposure duration fourth phase) years 10 10
EFres
(exposure frequency) days/year 350 350
EF0-2
(mutagenic exposure frequency first phase) days/year 350 350
EF2-6
(mutagenic exposure frequency second phase) days/year 350 350
EF6-16
(mutagenic exposure frequency third phase) days/year 350 350
EF16-26
(mutagenic exposure frequency fourth phase) days/year 350 350
ETres
(exposure time) hours/day 24 24
ET0-2
(mutagenic exposure time first phase) hours/day 24 24
ET2-6
(mutagenic exposure time second phase) hours/day 24 24
ET6-16
(mutagenic exposure time third phase) hours/day 24 24
ET16-26
(mutagenic exposure time fourth phase) hours/day 24 24
THQ (target hazard quotient) unitless 0.1 0.1
LT (lifetime) years 70 70
TR (target risk) unitless 1.0E-06 1.0E-06
Appendix A-3VISL Calculator Output, VIMS - Residential Scenario

Resident Vapor Intrusion Screening Levels (VISL) 2
Key: I = IRIS; P = PPRTV; O = OPP; A = ATSDR; C = Cal EPA; X = APPENDIX PPRTV SCREEN;H = HEAST; W = see RSL user guide Section 2.3.5; E = see RSL user guide Section 2.3.6; S = see RSLuser's guide Section 5.
Resident Vapor Intrusion Screening Levels (VISL) 2
Key: I = IRIS; P = PPRTV; O = OPP; A = ATSDR; C = Cal EPA; X = APPENDIX PPRTV SCREEN;H = HEAST; W = see RSL user guide Section 2.3.5; E = see RSL user guide Section 2.3.6; S = see RSLuser's guide Section 5.
ChemicalCAS
Number
Does thechemical
meetthe
definitionfor
volatility?(HLC>1E-5or VP>1)
Does thechemical
haveinhalation
toxicitydata?(IUR
and/orRfC)
Is ChemicalSufficiently
Volatile and Toxicto
Pose InhalationRisk
Via VaporIntrusion
from Soil Source?(C
vp > C
i,a,Target?)
Is ChemicalSufficiently
Volatile and Toxicto
Pose InhalationRisk
Via VaporIntrusion fromGroundwater
Source?(C
hc > C
i,a,Target?)
TargetIndoor Air
Concentration(TCR=1E-06or THQ=0.1)
MIN(Cia,c
,Cia,nc
)
(µg/m3)Toxicity
Basis
Trichloroethylene 79-01-6 Yes Yes Yes Yes 2.09E-01 NC
Chemical
TargetSub-Slab andNear-source
Soil GasConcentration
(TCR=1E-06or THQ=0.1)C
sg,Target
(µg/m3)
TargetGroundwaterConcentration
(TCR=1E-06or THQ=0.1)C
gw,Target
(µg/L)
Is TargetGroundwaterConcentration
< MCL?(C
gw < MCL?)
Pure PhaseVapor
ConcentrationC
vp\
(25 ℃)\
(µg/m3)
MaximumGroundwater
VaporConcentration
Chc
\
(µg/m3)
Temperaturefor MaximumGroundwater
VaporConcentration
(℃)
LowerExplosive
LimitLEL(%by
volume)
Trichloroethylene 6.95E+00 5.18E-01 Yes (5) 4.88E+08 5.15E+08 25 8.00
ChemicalLELRef
IUR(ug/m3)-1
IURRef
RfC(mg/m3)
RfCRef
MutagenicIndicator
CarcinogenicVISL
TCR=1E-06C
ia,c
(µg/m3)
NoncarcinogenicVISL
THQ=0.1C
ia,nc
(µg/m3)
Trichloroethylene CRC89 4.10E-06 I 2.00E-03 I Mut 4.78E-01 2.09E-01
Appendix A-3VISL Calculator Output, VIMS - Residential Scenario

Resident Vapor Intrusion Risk 3Output generated 30NOV2018:16:30:14Resident Vapor Intrusion Risk 3Output generated 30NOV2018:16:30:14
ChemicalCAS
Number
SiteSub-Slab andExterior Soil
GasConcentration
Csg
\
(µg/m3)
SiteIndoor Air
ConcentrationC
i,a\
(µg/m3)
VICarcinogenic
RiskCR
VIHazard
HQIUR
(ug/m3)-1
IURRef
ChronicRfC
(mg/m3)
Trichloroethylene 79-01-6 13100 3.93E+02 8.22E-04 1.88E+02 4.10E-06 I 2.00E-03
*Sum 8.22E-04 1.88E+02
ChemicalRfCRef
Temperature
(℃)\for
GroundwaterVapor
Concentration Mutagen?
Trichloroethylene IRIS 25 Mut
*Sum
Appendix A-3VISL Calculator Output, VIMS - Residential Scenario

Chemical Properties 4Output generated 30NOV2018:16:30:14Chemical Properties 4Output generated 30NOV2018:16:30:14
ChemicalCAS
Number
Does thechemical
meetthe
definitionfor
volatility?(HLC>1E-5or VP>1)
Does thechemical
haveinhalation
toxicitydata?(IUR
and/orRfC) MW
MWRef
VaporPressure
VP(mm Hg)
VPRef
S(mg/L)
SRef
Trichloroethylene 79-01-6 Yes Yes 131.39 PHYSPROP 6.90E+01 PHYSPROP 1.28E+03 PHYSPROP
ChemicalMCL
(ug/L)HLC
(atm-m3/mole)
Henry'sLaw
Constant(unitless)
H`and HLC
Ref
Henry'sLaw
ConstantUsed inCalcs
(unitless)D
ia\
(cm2/s)D
ia\
RefD
iw\
(cm2/s)D
iw\
Ref
Trichloroethylene 5 9.85E-03 4.03E-01 PHYSPROP 4.03E-01 6.87E-02 WATER9 (U.S. EPA,2001)
1.02E-05 WATER9 (U.S. EPA,2001)
Chemical
NormalBoilingPoint
BP(K)
BPRef
CriticalTemperature
TC(K)
TCRef
Enthalpy ofvaporization
atthe normal
boiling point
ΔHv,b
\(cal/mol)
ΔHv,b
\Ref
Koc
\(cm3/g)
Koc
\Ref
LowerExplosive
LimitLEL(%by
volume)LELRef
Trichloroethylene 360.35 PHYSPROP 5.71E+02 YAWS 7505.00 Weast 60.7 EPI 8.00 CRC89
Appendix A-3VISL Calculator Output, VIMS - Residential Scenario

Site-specific VISL Results 1Resident Equation Inputs
* Inputted values different from Resident defaults are highlighted.Output generated 30NOV2018:16:33:47
Site-specific VISL Results 1Resident Equation Inputs
* Inputted values different from Resident defaults are highlighted.Output generated 30NOV2018:16:33:47
Variable
ResidentAir
DefaultValue Value
AFgw
(Attenuation Factor Groundwater) unitless 0.001 0.001
AFss
(Attenuation Factor Sub-Slab) unitless 0.03 0.03
EDres
(exposure duration) years 26 26
ED0-2
(mutagenic exposure duration first phase) years 2 2
ED2-6
(mutagenic exposure duration second phase) years 4 4
ED6-16
(mutagenic exposure duration third phase) years 10 10
ED16-26
(mutagenic exposure duration fourth phase) years 10 10
EFres
(exposure frequency) days/year 350 350
EF0-2
(mutagenic exposure frequency first phase) days/year 350 350
EF2-6
(mutagenic exposure frequency second phase) days/year 350 350
EF6-16
(mutagenic exposure frequency third phase) days/year 350 350
EF16-26
(mutagenic exposure frequency fourth phase) days/year 350 350
ETres
(exposure time) hours/day 24 24
ET0-2
(mutagenic exposure time first phase) hours/day 24 24
ET2-6
(mutagenic exposure time second phase) hours/day 24 24
ET6-16
(mutagenic exposure time third phase) hours/day 24 24
ET16-26
(mutagenic exposure time fourth phase) hours/day 24 24
THQ (target hazard quotient) unitless 0.1 0.1
LT (lifetime) years 70 70
TR (target risk) unitless 1.0E-06 1.0E-06
Appendix A-3VISL Calculator Output, MW-08S - Residential Scenario

Resident Vapor Intrusion Screening Levels (VISL) 2
Key: I = IRIS; P = PPRTV; O = OPP; A = ATSDR; C = Cal EPA; X = APPENDIX PPRTV SCREEN;H = HEAST; W = see RSL user guide Section 2.3.5; E = see RSL user guide Section 2.3.6; S = see RSLuser's guide Section 5.
Resident Vapor Intrusion Screening Levels (VISL) 2
Key: I = IRIS; P = PPRTV; O = OPP; A = ATSDR; C = Cal EPA; X = APPENDIX PPRTV SCREEN;H = HEAST; W = see RSL user guide Section 2.3.5; E = see RSL user guide Section 2.3.6; S = see RSLuser's guide Section 5.
ChemicalCAS
Number
Does thechemical
meetthe
definitionfor
volatility?(HLC>1E-5or VP>1)
Does thechemical
haveinhalation
toxicitydata?(IUR
and/orRfC)
Is ChemicalSufficiently
Volatile and Toxicto
Pose InhalationRisk
Via VaporIntrusion
from Soil Source?(C
vp > C
i,a,Target?)
Is ChemicalSufficiently
Volatile and Toxicto
Pose InhalationRisk
Via VaporIntrusion fromGroundwater
Source?(C
hc > C
i,a,Target?)
TargetIndoor Air
Concentration(TCR=1E-06or THQ=0.1)
MIN(Cia,c
,Cia,nc
)
(µg/m3)Toxicity
Basis
Tetrachloroethylene 127-18-4 Yes Yes Yes Yes 4.17E+00 NC
Trichloroethylene 79-01-6 Yes Yes Yes Yes 2.09E-01 NC
Chemical
TargetSub-Slab andNear-source
Soil GasConcentration
(TCR=1E-06or THQ=0.1)C
sg,Target
(µg/m3)
TargetGroundwaterConcentration
(TCR=1E-06or THQ=0.1)C
gw,Target
(µg/L)
Is TargetGroundwaterConcentration
< MCL?(C
gw < MCL?)
Pure PhaseVapor
ConcentrationC
vp\
(25 ℃)\
(µg/m3)
MaximumGroundwater
VaporConcentration
Chc
\
(µg/m3)
Temperaturefor MaximumGroundwater
VaporConcentration
(℃)
LowerExplosive
LimitLEL(%by
volume)
Tetrachloroethylene 1.39E+02 5.76E+00 No (5) 1.65E+08 1.49E+08 25
Trichloroethylene 6.95E+00 5.18E-01 Yes (5) 4.88E+08 5.15E+08 25 8.00
ChemicalLELRef
IUR(ug/m3)-1
IURRef
RfC(mg/m3)
RfCRef
MutagenicIndicator
CarcinogenicVISL
TCR=1E-06C
ia,c
(µg/m3)
NoncarcinogenicVISL
THQ=0.1C
ia,nc
(µg/m3)
Tetrachloroethylene 2.60E-07 I 4.00E-02 I No 1.08E+01 4.17E+00
Trichloroethylene CRC89 4.10E-06 I 2.00E-03 I Mut 4.78E-01 2.09E-01
Appendix A-3VISL Calculator Output, MW-08S - Residential Scenario

Resident Vapor Intrusion Risk 3Output generated 30NOV2018:16:33:47Resident Vapor Intrusion Risk 3Output generated 30NOV2018:16:33:47
ChemicalCAS
Number
SiteSub-Slab andExterior Soil
GasConcentration
Csg
\
(µg/m3)
SiteIndoor Air
ConcentrationC
i,a\
(µg/m3)
VICarcinogenic
RiskCR
VIHazard
HQIUR
(ug/m3)-1
IURRef
Tetrachloroethylene 127-18-4 493 1.48E+01 1.37E-06 3.55E-01 2.60E-07 I
Trichloroethylene 79-01-6 336 1.01E+01 2.11E-05 4.83E+00 4.10E-06 I
*Sum 2.24E-05 5.19E+00
Chemical
ChronicRfC
(mg/m3)RfCRef
Temperature
(℃)\for
GroundwaterVapor
Concentration Mutagen?
Tetrachloroethylene 4.00E-02 IRIS 25 No
Trichloroethylene 2.00E-03 IRIS 25 Mut
*Sum
Appendix A-3VISL Calculator Output, MW-08S - Residential Scenario

Chemical Properties 4Output generated 30NOV2018:16:33:47Chemical Properties 4Output generated 30NOV2018:16:33:47
ChemicalCAS
Number
Does thechemical
meetthe
definitionfor
volatility?(HLC>1E-5or VP>1)
Does thechemical
haveinhalation
toxicitydata?(IUR
and/orRfC) MW
MWRef
VaporPressure
VP(mm Hg)
VPRef
S(mg/L)
SRef
Tetrachloroethylene 127-18-4 Yes Yes 165.83 PHYSPROP 1.85E+01 PHYSPROP 2.06E+02 PHYSPROP
Trichloroethylene 79-01-6 Yes Yes 131.39 PHYSPROP 6.90E+01 PHYSPROP 1.28E+03 PHYSPROP
ChemicalMCL
(ug/L)HLC
(atm-m3/mole)
Henry'sLaw
Constant(unitless)
H`and HLC
Ref
Henry'sLaw
ConstantUsed inCalcs
(unitless)D
ia\
(cm2/s)D
ia\
RefD
iw\
(cm2/s)D
iw\
Ref
Tetrachloroethylene 5 1.77E-02 7.24E-01 PHYSPROP 7.24E-01 5.05E-02 WATER9 (U.S. EPA,2001)
9.46E-06 WATER9 (U.S. EPA,2001)
Trichloroethylene 5 9.85E-03 4.03E-01 PHYSPROP 4.03E-01 6.87E-02 WATER9 (U.S. EPA,2001)
1.02E-05 WATER9 (U.S. EPA,2001)
Chemical
NormalBoilingPoint
BP(K)
BPRef
CriticalTemperature
TC(K)
TCRef
Enthalpy ofvaporization
atthe normal
boiling point
ΔHv,b
\(cal/mol)
ΔHv,b
\Ref
Koc
\(cm3/g)
Koc
\Ref
LowerExplosive
LimitLEL(%by
volume)LELRef
Tetrachloroethylene 394.45 PHYSPROP 6.20E+02 YAWS 8288.00 Weast 94.94 EPI
Trichloroethylene 360.35 PHYSPROP 5.71E+02 YAWS 7505.00 Weast 60.7 EPI 8.00 CRC89
Appendix A-3VISL Calculator Output, MW-08S - Residential Scenario

Appendix B Correspondence from Capitol
Trailways Regarding Discontinued Use of Water Supply Well
