risk assessment of ballast water mediated species ... · ballast water mediated species...
TRANSCRIPT
Risk Assessment of
Ballast Water Mediated Species Introductions –
a Baltic Sea Approach
Erkki Leppäkoski 1) & Stephan Gollasch 2)
1) Åbo Akademi University, Turku/Åbo, Finland
2) GoConsult, Hamburg, Germany [email protected]
Risk Assessment of Ballast Water Mediated Species Introductions into the Baltic Sea
- 1 -
The following abbreviations were used in this report: AIS Aquatic Invasive Species
AIS* Automatic Identification System
ALARM Assessing LArge scale environmental Risks for biodiversity with tested
Methods (EU Project)
BITIS Biological Intergrity of the Baltic Sea Threatened by Invasive Species
BMB Baltic Marine Biologists
BWC Ballast Water Convention of IMO (International Convention for the
Control and Management of Ships’ Ballast Water and Sediments)
BWE Ballast Water Exchange
CIESM The Mediterranean Science Commission
DAISIE Delivering Alien Invasive Species Inventories for Europe (EU Project)
EMBLA Environmental Ballast Water Management Assessment
GEF Global Environment Facility
GloBallast GEF/UNDP/IMO Global Ballast Water Management Programme
HELCOM Helsinki Commission
HELCOM EC HELCOM Environment Committee
ICES International Council for the Exploration of the Sea
IGSS Issue Group on Sustainable Shipping (reports to OSPAR)
IMO International Maritime Organization
IOC International Oceanographic Commission
MEPC Marine Environment Protection Committee
NEST A decision support system for management of eutrophication in the
Baltic Sea (see MARE Project at http://www.mare.su.se/nest/)
NIS Nonindigenous Species
NOBANIS North European and Baltic Network on Invasive Alien Species
NOBOB No Ballast on Board
OSPAR Oslo-Paris Commission
SGBWS Study Group on Ballast Water and Sediments
UNEP United Nations Environment Programme
WGITMO Working Group on Introductions and Transfers of Marine Organisms
Risk Assessment of Ballast Water Mediated Species Introductions into the Baltic Sea
- 2 -
Risk Assessment of
Ballast Water Mediated Species Introductions –
a Baltic Sea Approach Table of Content Recommendations to HELCOM......................................................................................... 4
1. Recommended actions............................................................................................. 4 2. Suggested ballast water management approach for the Baltic ................................ 7 3. High risk shipping routes ........................................................................................ 8 3.1 Ships on oceanic voyages...................................................................................... 8 3.2 Inner-European shipping ....................................................................................... 9 3.3 Inner Baltic shipping ........................................................................................... 10 3.4 Designation of a ballast water exchange zone within the Baltic......................... 10 4. The HELCOM ballast water management approach in the wider European
context .................................................................................................................. 11 1 Objectives of the report.................................................................................................. 13 2 Species introductions, introduction vectors and mitigation measures ........................... 15 2.1 History of species introductions in the Baltic and rising concern of ballast water
issues .......................................................................................................................... 15 2.2 Vectors of species introductions ................................................................................. 20 2.3 Management strategies to avoid species introductions............................................... 20 3 Analysis of present and future shipping patterns in the Baltic Sea................................ 27 3.1 Today's shipping pattern in the Baltic Sea.................................................................. 27 3.2 Short sea shipping ....................................................................................................... 35 3.3 Prognosis of future shipping patterns in the Baltic ..................................................... 37 3.4 Volume and origin of ballast water discharged .......................................................... 38 4 Potential donor and recipient regions of ballast water................................................... 44 4.1 Life in ballast tanks..................................................................................................... 44 4.2 Identification of shipping routes that pose a high risk of transferring invasive
alien species into the Baltic Sea ................................................................................. 45 4.3 Identification of areas/ports of special interest ........................................................... 46 4.4 Identification of shipping traffic which poses high risk for the introduction of
invasive alien species into the Baltic Sea (high risk donor ports).............................. 51
Risk Assessment of Ballast Water Mediated Species Introductions into the Baltic Sea
- 3 -
5 Risk assessment results .................................................................................................. 57 5.1 Ballast water management and risk assessment.......................................................... 57 5.2 Proposals for risk assessment methodologies to be used in the Baltic Sea
region.......................................................................................................................... 58 5.3 Risk assessment approach for the ports selected ........................................................ 60 5.4 Results of the risk assessment for the selected ports .................................................. 66 5.5 Needs and proposals for monitoring of invasive species and port baseline
surveys........................................................................................................................ 67 5.6 Development of proposals for a common structured procedure for
species-specific risk assessments ............................................................................... 69 5.7 Target species list (the "Black List" approach)........................................................... 71 Acknowledgements........................................................................................................... 77 References ........................................................................................................................ 78 Annex 1 Consistency with other regional risk assessment guidelines and strategies ... 83 Annex 2 Detailed risk assessment results for the Port of Copenhagen (Denmark) .... 100 Annex 3 Detailed risk assessment results for the Port of Gothenburg (Sweden) ....... 104 Annex 4 Detailed risk assessment results for the Port of Kiel (Germany) ................. 106 Annex 5 Detailed risk assessment results for the Port of Klaipeda (Lithuania) ......... 107 Annex 6 Detailed risk assessment results for the Port of Sköldvik/Kilpilahti
(Finland)....................................................................................................... 108 Annex 7 Detailed risk assessment results for the port region Tornio, Kemi, and
Raahe (Finland)............................................................................................ 110
Risk Assessment of Ballast Water Mediated Species Introductions into the Baltic Sea
- 4 -
Recommendations to HELCOM The Baltic Sea countries have international obligations to address invasive alien species, principally according to the Convention on Biological Diversity (1992) and, concerning marine areas, the International Convention for the Control and Management of Ships’ Ballast Water and Sediments (IMO 2004). At the meeting of the HELCOM Heads of Delegation, 14-15 June, 2005, Helsinki, Finland, (Paragraph 2.5, LD 6) it was decided to establish a project entitled "Risk Assessment of Ballast Water Mediated Introductions." This Report, authored by Erkki Leppäkoski (contracted Project Manager; Åbo Akademi University, Turku, Finland) and Stephan Gollasch (GoConsult, Hamburg, Germany), makes ten key Recommendations to improve measures to reduce the introduction of ship-mediated alien species into the Baltic Sea and provide further a suggested ballast water management approach for the Baltic Sea.
1. Recommended actions Aggressive invaders represent a threat to the biosecurity of most coastal countries of the world. Shipping (ballast water and hull fouling) has been and will continue to be the most important vector for unintentional species introductions into aquatic environments. Introductions of aquatic invasive species (AIS) are considered as a key influence on various environmental and socio-economic sectors – thereby affecting many stakeholders. Biological invasions are a global phenomenon and thus a feature of ongoing global change – indicating the scale of the problem. The most obvious ecological impacts are directed to coastal biodiversity. AIS may change the native food web and some are known as ecosystem engineers, which result in substantial habitat modifications. It is not only the environment being at risk, also economical and human health issues were reported, e.g. during harmful algal blooms and human consumption of contaminated seafood. Tourism, one of the world's leading industries, is also potentially at risk when hit by harmful algal blooms. The MARITIME group drafted in a meeting in Copenhagen October 2004 the HELCOM recommendations: "Measures to address the threat of invasive species transported via the ballast water of ships". Considering that ballast water exchange (hereafter BWE) is a limited option for ballast water management in the Baltic Sea, the group emphasized the need for regional cooperation when addressing the threat. The Governments of the Contracting Parties to the Helsinki Convention recommended:
• to designate/identify a clear responsibility for coordinating the national response to the issue,
Risk Assessment of Ballast Water Mediated Species Introductions into the Baltic Sea
- 5 -
• to request arriving ships to submit ballast water reporting forms using the IMO Guidelines (IMO Resolution A.868(20), adopted on 27 November 1997),
• to require ships flying the country’s flag or calling at the country’s ports to carry and implement a shipboard ballast water management plan (taking into account the IMO Guidelines),
• to provide adequate reception facilities for sediments in ports and terminals where cleaning and repair of ballast tanks occurs,
• to carry out by 1 January 2007 risk assessments for major ports. The risk assessments should be carried out using the compatible methodology developed under IMO,
• to cooperate in order to establish by 2006 the national and regional information systems for the data obtained from the ballast water reporting as well as during risk assessments, biological surveys and monitoring (including an early warning system),
• to conduct by 1 January 2007 biological surveys and establish a monitoring system for invasive aquatic species in major ports using harmonized methodology developed and updated by the appropriate HELCOM subsidiary bodies and to be based on guidelines prepared under the IMO,
• to link the port surveys and monitoring to an early-warning system, whereby ships can be alerted to outbreaks of harmful species, and
• to cooperate with the North Sea countries when implementing the provision of this Convention.
To address the recommendations from the MARITIME group, the following actions may be considered to significantly reduce the probability of ship-mediated introductions into the Baltic Sea: 1. Identify pathways leading to unintentional introductions, e.g. the importance of ballast water vs. other vectors. 2. Assess, in particular, shipping routes that cross biogeographical zones, which might connect previously separated flora and fauna. 3. Identify most important source areas of alien species introductions into the Baltic Sea. Despite academic interest, such information is essential for regional cooperation with the aim to jointly assess control measures and risk assessments. These source areas of species might be specific in different parts of the Baltic Sea and may also change in time due to changes in shipping pattern. 4. Increase the exchange of information between scientists and management agencies. 5. Have in place a basin-wide early warning system for taking rapid and effective action, including public consultation, should unintentional introductions occur. An early warning system rapidly reporting on new findings of AIS is an important tool when planning to undertake eradication measures of newly introduced AIS. With an early warning instrument, neighbouring countries may be made aware and by doing so concerted
Risk Assessment of Ballast Water Mediated Species Introductions into the Baltic Sea
- 6 -
actions may be achieved1. 6. Support R&D focused on initiatives to reduce the problems of alien invasives arising from ballast water discharges, understanding that preventing the introduction of alien invasive species should be the first goal and keeping in mind that mechanical or chemical eradication of established AIS is not an option, neither biological control of them (prevention is better than cure). The actions should be focussed on
• development of national and regional ballast water management programmes, • research on sampling and monitoring regimes, • information to port authorities and ships' crews on ballast water hazards, • disseminating international guidelines and recommendations, such as the IMO
Ballast Water Management Convention, IMO guidelines on BWE (completed) and BWE zones (in preparation), and
• development of an online decision support system to assist port authorities and ships' crews on appropriate ballast water uptake and discharge zones. This tool may eventually result in an online "Baltic Sea Ballast Water Management Decision Support System" providing information on zones in the Baltic Sea where ballast uptake/discharge is permitted/not permitted (depending on origin of the ballast water, taking into account various scenarios of ship routes, etc.). This online system may also include information on ballast water treatment options, risk calculations and occurrence of algal blooms.2 Consequently, an early warning tool should be included to avoid ballast water uptake in (Baltic) areas where potential harmful species bloom.
7. It is strongly recommended that HELCOM should consider to introduce a ballast water reporting system (as also required by the IMO BWC) as soon as possible, i.e. already before the BWC has entered into force, to allow data gathering for risk assessment (see lack of data availability as outlined in the report). 8. Identify high-risk ships or shipping routes through risk assessment and special measures that can be applied for the management of their ballast water (for example treatment, BWE in designated areas outside the Baltic or treatment at land-based ballast water and sediment reception facilities). 9. Elaborate a common structured procedure for species-specific assessment to be used in developing a “black list” of harmful or potentially harmful alien species (= target species) that are especially undesirable to be introduced to the Baltic Sea. The presence/absence of target species will influence the risk level quantification of the shipping routes considered. 1 Positive eradication examples are known, e.g. the successful removal of Caulerpa taxifolia off the Californian coast. It should however be noted that eradication efforts are only successful in case the new species is not established, colonizes a small area only and also benthic organisms may be easier to remove rather than planktonic species. Routine monitoring programmes should consider taking samples in regions of ballast water operations to timely proof the occurrence of new AIS. 2 A very good example of such system, which may be used as a model, is NEST (on eutrophication in the Baltic) developed by the Stockholm University.
Risk Assessment of Ballast Water Mediated Species Introductions into the Baltic Sea
- 7 -
10. Organize regional introductory training courses for port administrators, environmental and fisheries administrators as well as NGOs. 2. Suggested ballast water management approach for the Baltic Each vessel arriving in the Baltic poses a risk to introduce a new AIS. Even ships with no ballast on board (NOBOB) are of risk to introduce new AIS3. This indicates the urgent need for efficient ballast water treatment systems. As those systems are not yet readily available, BWE is the only option to reduce the risk of AIS introductions with ballast water release. In addition all measures should be undertaken to avoid species uptake in the ballast water donor region. The recommendations of the IMO Guideline 868(20) should whenever possible be followed. These measures include: • Precautionary practices, • Minimizing uptake of harmful aquatic organisms, pathogens and sediments, • When loading ballast, every effort should be made to avoid the uptake of
potentially harmful aquatic organisms, pathogens and sediment that may contain such organisms. The uptake of ballast water should be minimized or, where practicable, avoided in areas and situations such as: • areas identified by the port State… ...port States should inform local
agents and/or the ship of areas and situations where the uptake of ballast water should be minimized, such as: - areas with outbreaks, infestations or known populations of harmful
organisms and pathogens; - areas with current phytoplankton blooms (algal blooms, such as red
tides); - nearby sewage outfalls; - nearby dredging operations; - when a tidal stream is known to be the more turbid; and - areas where tidal flushing is known to be poor.
• in darkness when bottom-dwelling organisms may rise up in the water column;
• in very shallow water; or • where propellers may stir up sediment.
• Removing ballast sediment on a timely basis, • Where practicable, routine cleaning of the ballast tank to remove sediments
should be carried out in mid-ocean or under controlled arrangements in port or dry dock, in accordance with the provisions of the ship's ballast water management plan.
3 In inbound traffic to the Great Lakes, NOBOB ships contain an average of 60 tonnes of unpumpable residual water and sediment in ballast tanks. This unpumpable ballast contains up to tens of millions of viable resting stages of invertebrates per tonne sediment (Gray et al. 2005). Experimental studies performed by the same authors showed that exposure to high-saline water does not effectively eliminate sediment-bound resting stages but only reduce the numbers or viability of them. This unpumpable ballast may not be discharged when a ship arrives in a Baltic port. However, once one tank with residual ballast water and sediment was filled in one Baltic port the sediment and organisms may be recirculated into the water column and may be released when this ship calls for the next (Baltic) port and has to discharge this tank here.
Risk Assessment of Ballast Water Mediated Species Introductions into the Baltic Sea
- 8 -
• Avoiding unnecessary discharge of ballast water, • If it is necessary to take on and discharge ballast water in the same port to
facilitate safe cargo operations, care should be taken to avoid unnecessary discharge of ballast water that has been taken up in another port.
3. High risk shipping routes The risk assessment4 carried out for the selected ports5 revealed that high risk shipping routes are those connecting ballast water donor and recipient regions in the same bioregion or within identical climate zone(s). The major difficulty in Europe is that BWE cannot be carried out on those shipping routes as all high risk ports are in regional seas not meeting the IMO depth and/or distance limits for BWE during the ships voyage. As BWE cannot be carried out here as risk reducing measure, this indicates the need for ballast water treatment. Ports with the lowest risk levels are all very distant (i.e. oceanic shipping) and many also have temperature regimes different from the Baltic. Here, provided safety permits, a BWE should be carried out as risk reducing measure. Due to the varying salinity conditions throughout the Baltic and its adjacent waters, a route-specific approach to address ballast water management is recommended. However, all shipping routes may be grouped in three categories as outlined below. The measures recommended below assume that ballast water treatment systems are unavailable and also that ballast water reception facilities are lacking. As a result the "only" risk reducing measure is BWE. 3.1 Ships on oceanic voyages Ships operated on oceanic voyages are usually enabled to meet the IMO water depth and distance limits for BWE. However, safety aspects may not enable to carry out BWE while being at sea. Further, BWE shows limited efficiency to remove organisms from ballast tanks. However, as an interim solution and until ballast water treatment systems become available, BWE should be carried out wherever possible on those voyages before entering the Baltic Sea. 3.1.1 Scenario 1 – Matching salinity or temperature in donor and recipient region for ships operated on oceanic voyages In case a salinity and temperature match occurs in donor and recipient region, e.g. shipping routes connecting a brackish water port in the Chesapeake Bay (east coast 4 For comparison, various risk assessment approaches were reviewed. A summary is available as Annex 1. 5 Copenhagen (Denmark), Gothenburg (Sweden), Kiel (Germany), Klaipeda (Lithuania), Sköldvik and the port region Tornio, Kemi, Raahe (Finland).
Risk Assessment of Ballast Water Mediated Species Introductions into the Baltic Sea
- 9 -
of North America) with the Baltic proper (both regions are located in similar climate zones), a mid-ocean BWE should be carried out provided that safety permits. It is also recommended to exchange the ballast water in mid-ocean when ships connect two freshwater ports, e.g. Duluth (North American Great Lakes) and St. Petersburg (both ports are located in similar climate zones). 3.1.2 Scenario 2 – Non-matching salinity or temperature in donor and recipient region for ships operated on oceanic voyages On shipping routes without salinity match, e.g. Singapore (= fully marine conditions) to Helsinki (= low-brackish conditions) BWE may not be carried out as the risk that a marine organism survives when being released into freshwater conditions is minimal. In case ballast water was taken onboard in a freshwater tropical port and released in Helsinki in winter, the species introduction risk is also minimal. Another case is the release of water from Singapore in the Baltic in the vicinity of thermal discharges (e.g. from power plants) in summer, especially if such species show a broad salinity tolerance. In this case we recommend to carry out BWE as the abiotic conditions of donor and recipient region overlap. 3.2 Inner-European shipping In northwest (NW)-European shipping the IMO water depth and distance limits for BWE cannot be met. However, the risk to introduce species remains high when donor and recipient regions show similar salinity and temperature conditions. The following scenarios may be considered. 3.2.1 Scenario 1 – Matching salinity or temperature in donor and recipient region for ships operated on NW-European shipping routes When the shipping route connects ports with a match in salinity or temperature, e.g. Rotterdam (= brackish water) with the western Baltic (both ports are located in the identical climate zones), a BWE should be carried out in fully marine water conditions although the IMO depth and distance limits cannot be met. It is believed that organisms in the high saline water taken onboard during BWE will not likely survive when being discharged in lower saline brackish waters. Fresh water ballast originating from outside the Baltic should also be exchanged prior release in freshwater habitats of the Baltic, e.g. on ship voyages from Antwerp to the eastern Baltic, both being freshwater port regions in the identical climate zone.
Risk Assessment of Ballast Water Mediated Species Introductions into the Baltic Sea
- 10 -
By doing so the risk to introduce a species is reduced, although the risk reduction is not as efficient as in ships operated on oceanic voyages due to the lower water depth in the BWE zone. In addition ships operated in the Ponto-Caspian – Baltic inland waterway (matching salinity) should carry out a BWE en-route at best in the beginning of the canals. 3.2.2 Scenario 2 – Non-matching salinity or temperature in donor and recipient region for ships operated on inner-European shipping routes Ships engaged in voyages without salinity or temperature match, e.g. La Coruna (Spain, marine conditions) to St. Petersburg (= freshwater conditions) may not carry out a BWE as the risk that a marine organism survives when being released into freshwater conditions is minimal. 3.3 Inner Baltic shipping Inner-Baltic shipping poses the risk for secondary spread of previously introduced species. As in NW-European shipping, ships operated within the Baltic are not able to meet the IMO water depth and distance limits for BWE. However, on certain shipping routes a BWE may be required in case a salinity match occurs between ports separated by more saline waters between them. As an example, ships carrying ballast water from St. Petersburg (= freshwater) and intend to discharge this ballast water in freshwater ports at river mouths in the southern Baltic Sea should exchange the water within the Baltic at the highest salinity. One reasoning for this scenario is that introduced freshwater organisms occurring in the inner Gulf of Finland would not be able to reach freshwater habitats adjacent to the southern or western Baltic as the increasing salinity between these areas prevents their natural spread. 3.4 Designation of a ballast water exchange zone within the Baltic The IMO currently works out a guideline to identify BWE zones. A draft document will likely be discussed at the next meeting of IMO´s Marine Environment Protection Committee in Spring 2006. Once completed, this guideline should be reviewed for its applicability to address the risk of species movements in inner-Baltic shipping (see above). 3.4.1 Ballast water exchange zone for shipping from outside the Baltic It is assumed that a BWE zone in the Baltic for ballast water originating from outside the
Risk Assessment of Ballast Water Mediated Species Introductions into the Baltic Sea
- 11 -
Baltic cannot be identified as a biologically meaningful reasoning cannot be given as the Baltic is too shallow and all potential BWE zones are located in (very) close proximity to the coast. Instead, ships intending to discharge ballast water from outside the Baltic shall endeavor to exchange the ballast water prior entry into the Baltic Sea. However, this approach needs careful consideration with affected states as on a voyage from e.g. Antwerp to Helsinki this scenario would result in BWE in the North Sea and in other cases, where ships are on voyages from the Black Sea to NW Europe the Mediterranean Sea may be affected. 3.4.2 Ballast water exchange zone for inner-Baltic shipping In rare instances a BWE in ships on inner-Baltic voyages may be required, e.g. transport of freshwater ballast across more saline waters which will be discharged in freshwater recipient regions (see above). 4. The HELCOM ballast water management approach in the wider European context As indicated above, various ballast water management approaches are currently developing, e.g. for the OSPAR region, Mediterranean and Caspian Seas. The HELCOM approach recommends to exchange the ballast water of ships arriving from outside the Baltic and also in inner-Baltic shipping (in certain instances – see above). Problems occur to identify appropriate BWE zones as neighbouring seas and jurisdictions may be affected, e.g. when recommending to exchange ballast water of ships in inner-European traffic prior entry into the Baltic which may result in a water exchange in the North Sea. From the Baltic perspective this is considered as a risk reducing measure. However, at the same time it exposes the North Sea to additional ballast water discharges, but the ultimate goal should be to reduce the amount of ballast water discharges to the essential minimum. This conflict of interest may only be solved by the development of a European-wide ballast water management approach. It is therefore recommended to launch a working group of experts involving various stakeholders across all European seas. The target of this initiative should include to harmonize the ballast water management approach across all European seas and further to develop guidelines how to identify BWE zones especially for inner-European shipping. It may be considered to launch a "European Ballast Water Management Decision Support System". It should be noted that, assuming the BWC enters into force as planned, BWE is only a risk reducing measure of limited duration, i.e. according to the BWC the first ships need to meet the higher discharge standards (organism concentration limit) by January 1st 2009. All risk reducing measures including BWE, are seen as an essential tool to protect European seas from new AIS introductions. As a result, although BWE may have a limited duration, provided the BWC enters into force as planned, all efforts in this regard will reduce the risks of new AIS introductions. Further, the entry into force of the BWC may be delayed due to lack of signatory countries with sufficient world fleet tonnage. It is
Risk Assessment of Ballast Water Mediated Species Introductions into the Baltic Sea
- 12 -
also believed that the implementation of mandatory BWE requirements may prompt the ratification of the BWC. References Gray DK, Bailey SA, Duggan IC, MacIsaac HJ 2005. Viability of invertebrate diapausing
eggs exposed to saltwater: implications for Great Lakes’ ship ballast management. Biological Invasions 7: 531-539.
IUCN Guidelines for the Prevention of Biodiversity Loss caused by Alien Invasive Species. Prepared by the SSC Invasive Species Specialist Group. Approved by the 51st Meeting of the IUCN Council, Gland Switzerland, February 2000
http://iucn.org/themes/ssc/pubs/policy/invasivesEng.htm#ERADICATION%20AND%20CONTROL
HELCOM MARITIME 2004. Draft HELCOM Recommendation ”Measures to address the Threat of Invasive Species transported via the Ballast Water of Ships”, Copenhagen, Denmark, 26-28 October 2004. http://sea.helcom.fi/dps/docs/ documents/Maritime%20Group/HELCOM%20MARITIME%203,%202004/7-1.pdf
Risk Assessment of Ballast Water Mediated Species Introductions into the Baltic Sea
- 13 -
1 Objectives of the report The objectives of this report include to present a risk assessment of species introductions to certain Baltic ports, initial recommendations on ballast water management options for the Baltic Sea, and identify available/lacking ballast water related data. The project is in accordance with the overall HELCOM priority in the maritime field: “Based on statistics on ships movements in the Baltic as well as risk assessments to ensure that the increasing maritime traffic and offshore activities are carried out in a safe and environmentally sound manner” and the specific task to “Identify ways to regionally implement the Ballast Water Management Convention, set for adoption in 2004”. The authors hope that this report may also initiate discussions of ballast water management strategies with and within relevant HELCOM bodies. The following issues are addressed: 1. a brief summary of introduced aquatic species in the Baltic Sea, 2. background information on present and future shipping patterns in the Baltic Sea, 3. history of the ballast water risk assessment measures development, 4. proposed methodologies for risk assessment to be used in the Baltic Sea region:
a. methods to identify potential source regions that pose a high risk of donating invasive alien species to the Baltic Sea,
b. procedures for a species-specific risk assessment, c. methods to identify areas/ports of special interest, i.e. potential donor
locations of future species introductions with ballast water into the Baltic region, where detailed risk assessments should be made, and
d. methods to identify shipping routes which pose a high risk for the introduction of invasive alien species to the Baltic Sea.
5. the proposed risk assessment methodologies are applied to six selected ports/port regions, i.e. Copenhagen (Denmark), Gothenburg (Sweden), Kiel (Germany), Klaipeda (Lithuania), Sköldvik and the port region Tornio, Kemi and Raahe (Finland),
6. initial measures for reducing or ameliorating the risks identified in risk assessments, 7. suggestions to allow for consistency with other regional guidelines and strategies, and 8. recommended actions to address ballast water issues in a Baltic Sea context. Problems encountered when preparing this report include (not exhaustive):
• shipping statistics in Europe lack data on the source region of the vessels. The source regions indicated (if any!) are mainly based on ships cargo. In some cases the last port of call is given, but this may well be another European port, such as the major hub ports in Europe, e.g. Rotterdam, Antwerp, Felixstowe and Hamburg, rather than the most distant port of this shipping route where the ballast water onboard may originate. An indication of the source region of the vessel and/or last port of call does not provide information on the uptake region of the ballast water onboard. It will therefore remain a challenge to identify source regions of ballast water discharged in the Baltic Sea,
• data on the amount of ballast water released in the Baltic are lacking,
Risk Assessment of Ballast Water Mediated Species Introductions into the Baltic Sea
- 14 -
• due to the lack of basin-wide information and data availability on these aspects, particularly the volumes and frequencies of ballast water being discharged, only rough estimates and site-specific examples can be presented. For some Baltic recipient regions the volume of ballast water discharged was assessed by the dimension of the cargo handled, and
• as outlined above the essentially needed shipping pattern details, especially the donor region of the ballast water onboard, were not available. Instead, all ports engaged in trade pattern with the Baltic Sea were listed when developing the risk assessment for species introductions as ballast water discharged in the Baltic may originate from all ports engaged in ships` voyages to the Baltic.
To gather relevant information to overcome these shortcomings, a questionnaire was sent to relevant authorities in all HELCOM countries to ask for information such as annual ship arrivals in all ports, amount of ballast water released and taken onboard.
Risk Assessment of Ballast Water Mediated Species Introductions into the Baltic Sea
- 15 -
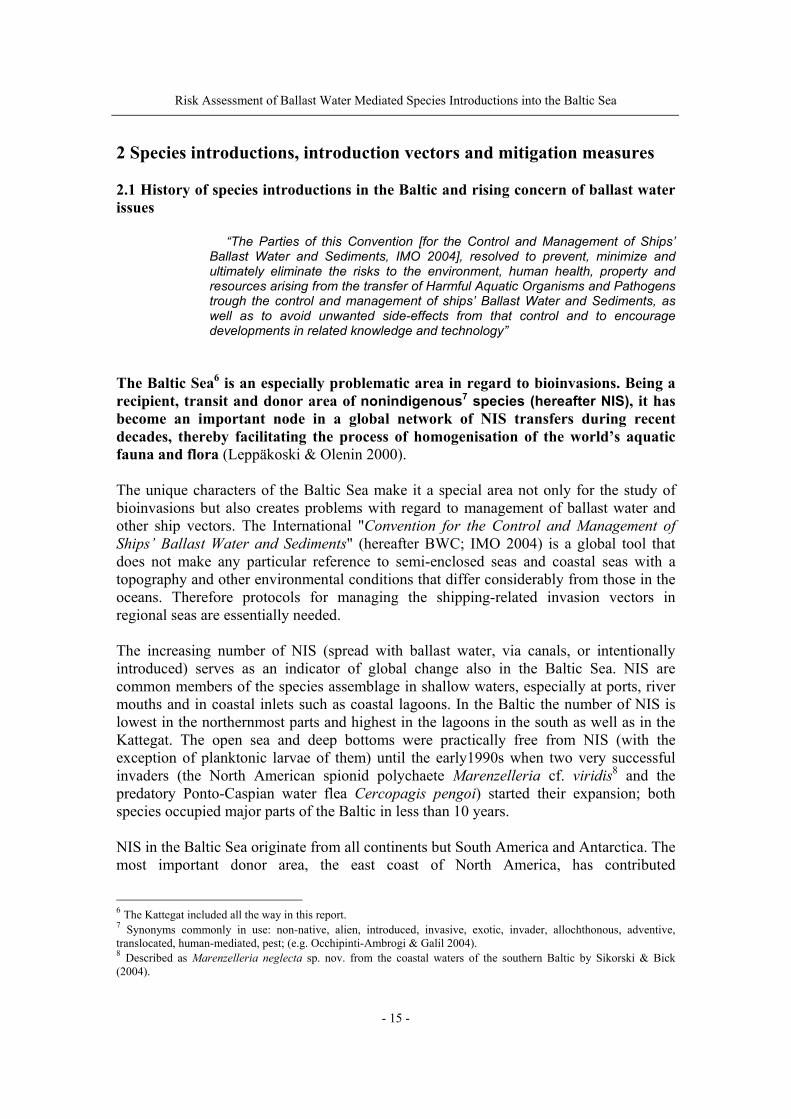
2 Species introductions, introduction vectors and mitigation measures 2.1 History of species introductions in the Baltic and rising concern of ballast water issues
“The Parties of this Convention [for the Control and Management of Ships’
Ballast Water and Sediments, IMO 2004], resolved to prevent, minimize and ultimately eliminate the risks to the environment, human health, property and resources arising from the transfer of Harmful Aquatic Organisms and Pathogens trough the control and management of ships’ Ballast Water and Sediments, as well as to avoid unwanted side-effects from that control and to encourage developments in related knowledge and technology”
The Baltic Sea6 is an especially problematic area in regard to bioinvasions. Being a recipient, transit and donor area of nonindigenous7 species (hereafter NIS), it has become an important node in a global network of NIS transfers during recent decades, thereby facilitating the process of homogenisation of the world’s aquatic fauna and flora (Leppäkoski & Olenin 2000). The unique characters of the Baltic Sea make it a special area not only for the study of bioinvasions but also creates problems with regard to management of ballast water and other ship vectors. The International "Convention for the Control and Management of Ships’ Ballast Water and Sediments" (hereafter BWC; IMO 2004) is a global tool that does not make any particular reference to semi-enclosed seas and coastal seas with a topography and other environmental conditions that differ considerably from those in the oceans. Therefore protocols for managing the shipping-related invasion vectors in regional seas are essentially needed. The increasing number of NIS (spread with ballast water, via canals, or intentionally introduced) serves as an indicator of global change also in the Baltic Sea. NIS are common members of the species assemblage in shallow waters, especially at ports, river mouths and in coastal inlets such as coastal lagoons. In the Baltic the number of NIS is lowest in the northernmost parts and highest in the lagoons in the south as well as in the Kattegat. The open sea and deep bottoms were practically free from NIS (with the exception of planktonic larvae of them) until the early1990s when two very successful invaders (the North American spionid polychaete Marenzelleria cf. viridis8 and the predatory Ponto-Caspian water flea Cercopagis pengoi) started their expansion; both species occupied major parts of the Baltic in less than 10 years. NIS in the Baltic Sea originate from all continents but South America and Antarctica. The most important donor area, the east coast of North America, has contributed
6 The Kattegat included all the way in this report. 7 Synonyms commonly in use: non-native, alien, introduced, invasive, exotic, invader, allochthonous, adventive, translocated, human-mediated, pest; (e.g. Occhipinti-Ambrogi & Galil 2004). 8 Described as Marenzelleria neglecta sp. nov. from the coastal waters of the southern Baltic by Sikorski & Bick (2004).
Risk Assessment of Ballast Water Mediated Species Introductions into the Baltic Sea
- 16 -
approximately 30% of all known introductions. The ongoing "Americanisation" is one of the most important processes that contribute to the xenodiversity9 of all semi-enclosed European seas, including the Baltic (Leppäkoski & Olenin 2000). Other NIS of transoceanic origin than those native to North America are rare in the Baltic, e.g., the New Zealand mud snail Potamopyrgus antipodarum, the Chinese mitten crab Eriocheir sinensis (not reproducing in the Baltic but adult specimens commonly recorded since the 1930s), and the planktonic Indo-Pacific diatom Odontella sinensis. The brackish conditions of the Baltic Sea do not protect it from species introductions. Today the fauna and flora of the Baltic are exposed to other brackish-water biota of the world, owing to the breakdown of large-scale geographical barriers by ship traffic, which results in an exchange of species (Leppäkoski & Olenin 2001). Many important harbours in the world and especially in NW Europe are located at river mouths. The salinity range of these estuarine habitats is similar to the oligo10- and mesohaline11 conditions of the Baltic Sea and thus the ballast water loaded at these sites will be discharged somewhere in the Baltic in harbours with matching salinity conditions (Gollasch & Leppäkoski 1999; Leppäkoski et al. 2002). In addition to its contact with the Atlantic through the Danish Straits, the Baltic and its drainage area are connected to the Ponto-Caspian brackish seas by rivers and canals, which were opened during the period from 1775 to 1952. Species native or even endemic to Ponto-Caspian basins (Black, Azov and Caspian Seas and the adjacent rivers emptying into these seas) have become established in inland Europe, the Baltic Sea and, most recently, the North American Great Lakes (Ojaveer et al. 2002). All highly euryhaline12 and cold-eurythermal13 species are potential invaders into the Baltic Sea. There is a pool of species to be kept on a next-to-come list (see Table 5.7, page 73). The ability of these species to live and reproduce at the low salinity of the Baltic Sea is a key factor to determine their invasion success (e.g. Pienimäki & Leppäkoski 2004; Paavola et al. 2005). The salinity gradient from almost 0 psu14 in the innermost parts of the large gulfs, through 6-8 psu in the Baltic proper, to 20-24 psu in the Kattegat makes the Baltic Sea susceptible for invasions of freshwater, brackish and marine species. Also vertical gradients strongly influence not only the native biotic communities, but also provide NIS of different biogeographical origin (from cold stenothermal15 to eurythermal species) an extended repertoire of hospitable temperature conditions within the broad salinity range. Since both the established and potential NIS originate from warmer areas,
9 Xenodiversity = diversity caused by non-native species both at species and functional groups/life forms levels (Leppäkoski & Olenin 2000). 10 Organisms tolerant of only a moderate range of salinities, in this case brackish water with a salinity of 0.5 to 3.0 (or 5.0) psu. 11 Moderately brackish water with a salinity range of 5-18 psu. 12 Capable of tolerating a wide range of salt water concentrations. 13 Adaptable to a wide range of temperatures. 14 Practical Salinity Unit (almost equal to ‰ or ppt). 15 Capable of surviving over only a narrow range of temperature.
Risk Assessment of Ballast Water Mediated Species Introductions into the Baltic Sea
- 17 -
changes in the temperature and salinity conditions may influence the invasion pattern and population dynamics of NIS. If the process of global warming continues, the risk that additional warm-water species become established in the Baltic Sea will increase.
BALTIC SEA
0
20
40
60
80
100
120
<1820 1820 1840 1860 1880 1900 1920 1940 1960 1980 >2000
Total Shipping
BALTIC SEA
0
20
40
60
80
100
120
<1820 1820 1840 1860 1880 1900 1920 1940 1960 1980 >2000
Total Shipping
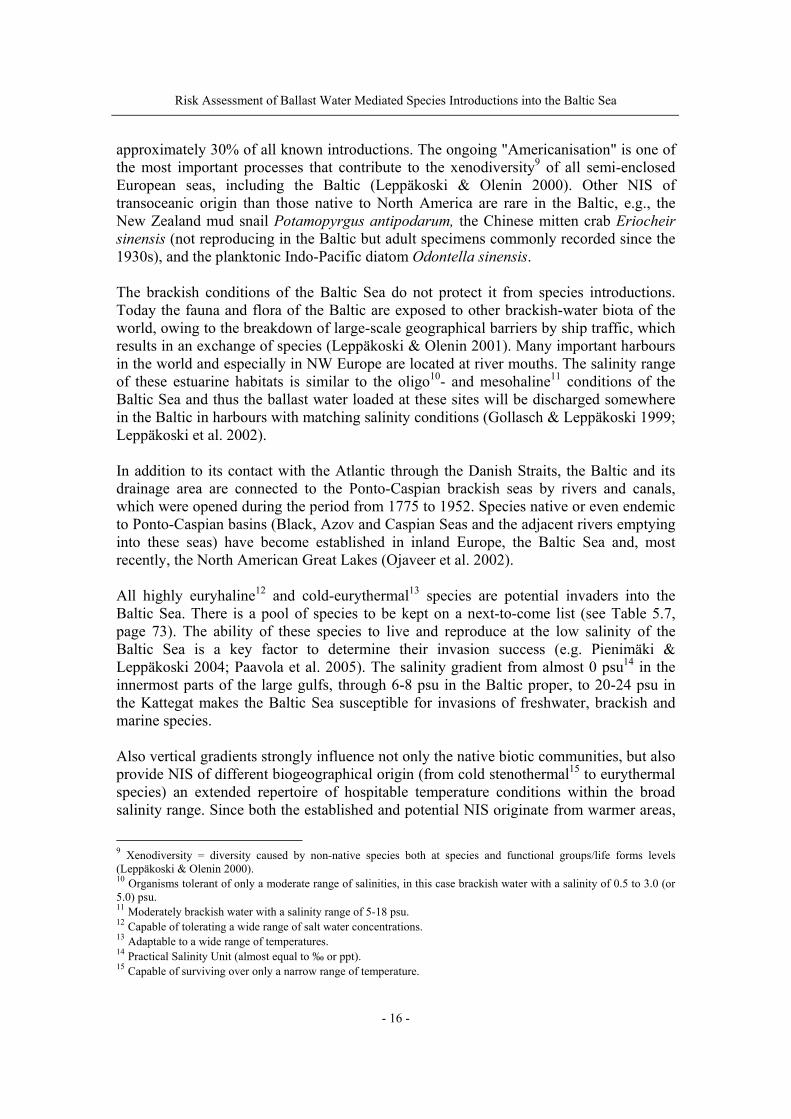
Fig. 2.1. Cumulative number of first records of nonindigenous species (NIS) in the Baltic Sea (105 NIS, based on Baltic Sea Alien Species Database, 2005) and the share of ship-mediated introductions since the early 1800s. More than 105 NIS have been recorded in the brackish waters (> 0.5 psu) of the Baltic Sea, most of them being introduced during the last 100 years and with shipping as the main vector (Fig. 2.1). Some 60-70 NIS have established reproducing populations in the Baltic or at least in some parts of it (Baltic Sea Alien Species Database 200516). Generally, and in comparison with most coastal seas worldwide, the alien fauna and flora are well known in the Baltic. For a majority of species, several key questions asked by Vermeij (1996) and Bax et al. (2001) have been answered: (1) confirm that the species is an alien one, (2) identify a donor region, (3) identify the vectors that transported the species, (4) assess the abilities of species in the donor region to take advantage of the routes and means of transport, and (5) identify the regional distribution of the species. On the contrary, there are still a few estimates only available of the actual and potential effects, ecological and socio-economic, of established NIS in the Baltic Sea. Further, the propagule17 pressure on the recipient areas in the Baltic, i.e. the number of arriving propagules, is largely unknown. In all, ca. 850 NIS have been reported (up to 2004) in European marine and brackish waters; more than half of them have been established in at least one regional sea (Streftaris et al. 2005). In the NW European seas and adjacent brackish and freshwater habitats more than 350 aquatic NIS are known as established (i.e. self-sustaining populations). Most of these species occur in marine (255 species) and freshwater habitats
16 Searchable on, e.g., species’ names, area of origin, vector of introduction, salinity range, impacts. 17 Any of various portions of a plant or animal that aid in dispersal of the species and from which a new individual may develop.
Risk Assessment of Ballast Water Mediated Species Introductions into the Baltic Sea
- 18 -
(83 species). 31 species are known as typical brackish (Tab. 2.1). The numbers given here should be considered as preliminary as for more than 100 species their population status remains unclear. For 32 species it is unknown whether they are introduced or native (cryptogenic species) (Gollasch 2006). Table 2.1. Established NIS according to salinity regime and region of occurrence18 (after Gollasch 2006).
Region Salinity regime Total freshwater brackish
water marine
North Sea 33 10 89 132 Atlantic coast 6 4 91 101 Baltic Sea 41 14 37 92 Irish waters & NW UK 3 2 31 36 Arctic waters 1 7 8 Total 83 31 255 369
The origin of several invaders is unknown. Of those species where the origin is known, more than half (115 species) originate from the Pacific Ocean (here including the Indian Ocean). 40 species are native in waters of the western or eastern Atlantic Ocean outside Europe and 51 species originate in European waters outside the geographic scope of this study, e.g. the Mediterranean Sea. The assumed dominating introduction vector is shipping, with 119 species introduced in hull fouling and 105 in ballast water. The third most important vector is the intentional species introduction for aquaculture and stocking purposes (110 species).
0%
10%
20%
30%
40%
50%
60%
70%
80%
90%
100%
1800 1825 1850 1875 1900 1925 1950 1975 2000
Perce
nt of
total
(Inva
sives
, Flee
t tonn
age,
Seab
orne T
rade)
Invasive SpeciesWorld Fleet TonnageSeaborne Trade Volume
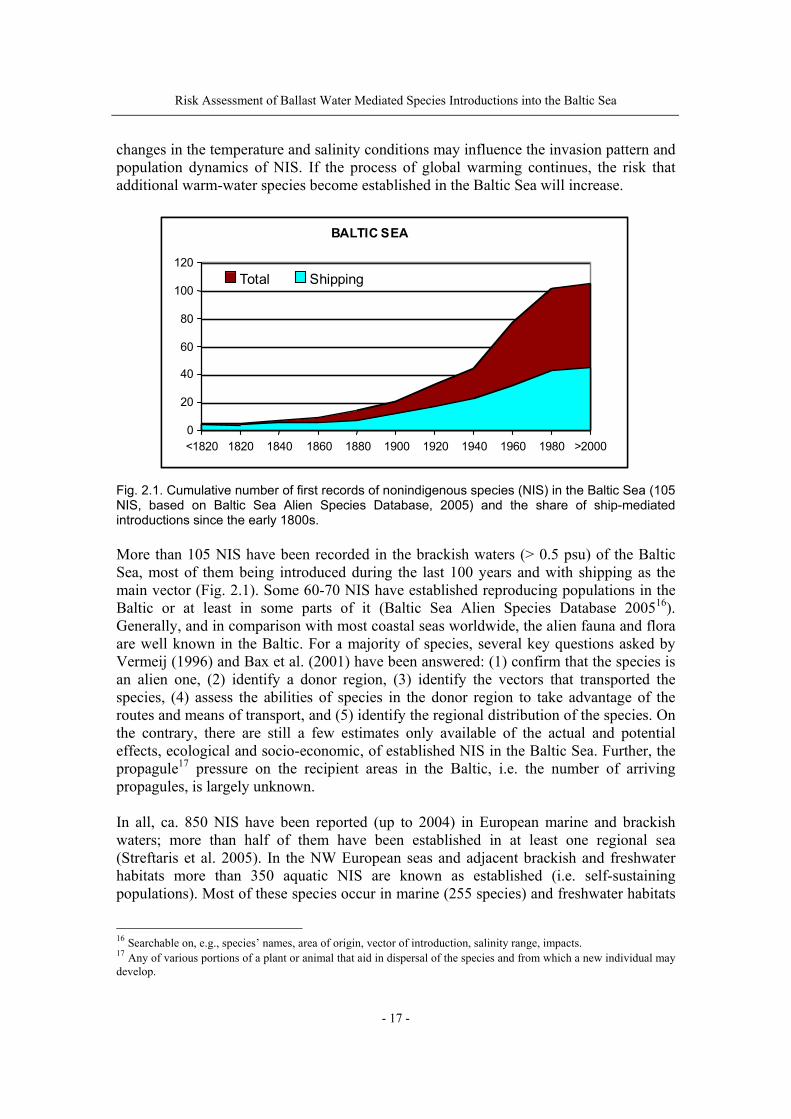
Fig. 2.2. Illustration of increase in invasive species as world fleet tonnage and seaborne trade increased over time. Species data is specific to a biological survey for the Black Sea (Zaitsev et al. 2003) (see also Cohen and Carlton 1998); fleet tonnage data from Lloyds Register Statistical Tables for various years; seaborne trade data from various sources (From Corbett & Firestone 2004; Firestone et al. 2004). Courtesy: J. Firestone, Graduate College of Marine Studies, University of Delaware, USA. 18 Including freshwaters in close proximity to coastal waters, i.e. inner estuaries, rivers, lakes etc.
Risk Assessment of Ballast Water Mediated Species Introductions into the Baltic Sea
- 19 -
A reason for the rising concern of NIS, globally (Fig. 2.2) as well as regionally, is their increasing impact on the environment and economy in certain regions. Well known examples are the zebra mussel Dreissena polymorpha introduced to NW Europe and North America, the comb jelly Mnemiopsis leidyi introduced into the Black, Azov and Caspian Seas and adjacent water bodies, the Chinese mitten crab Eriocheir sinensis which can be found in coastal and inland waters of various NW European countries – including findings in all Baltic countries except Latvia. The number of mitten crab findings is increasing and stretches up to eastern part of the Gulf of Finland.
05 000
10 00015 00020 00025 00030 00035 000
1960
1965
1970
1975
1980
1985
1990
1995
2000
2004
Yea
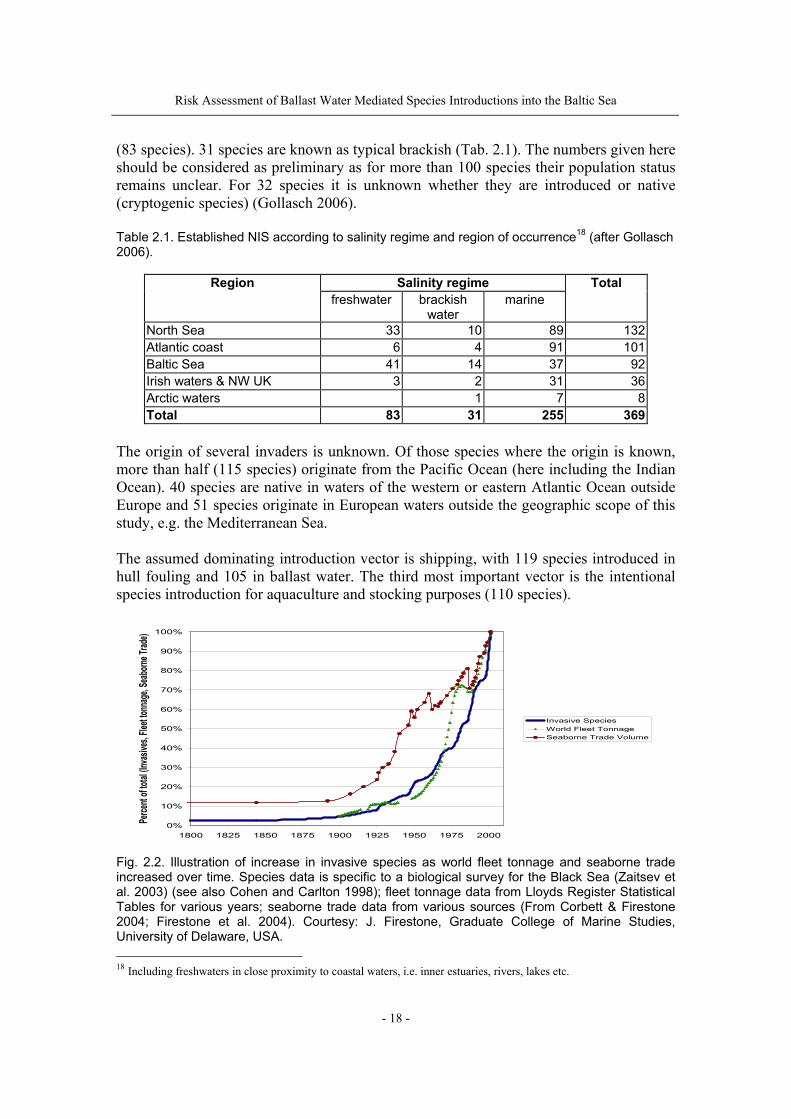
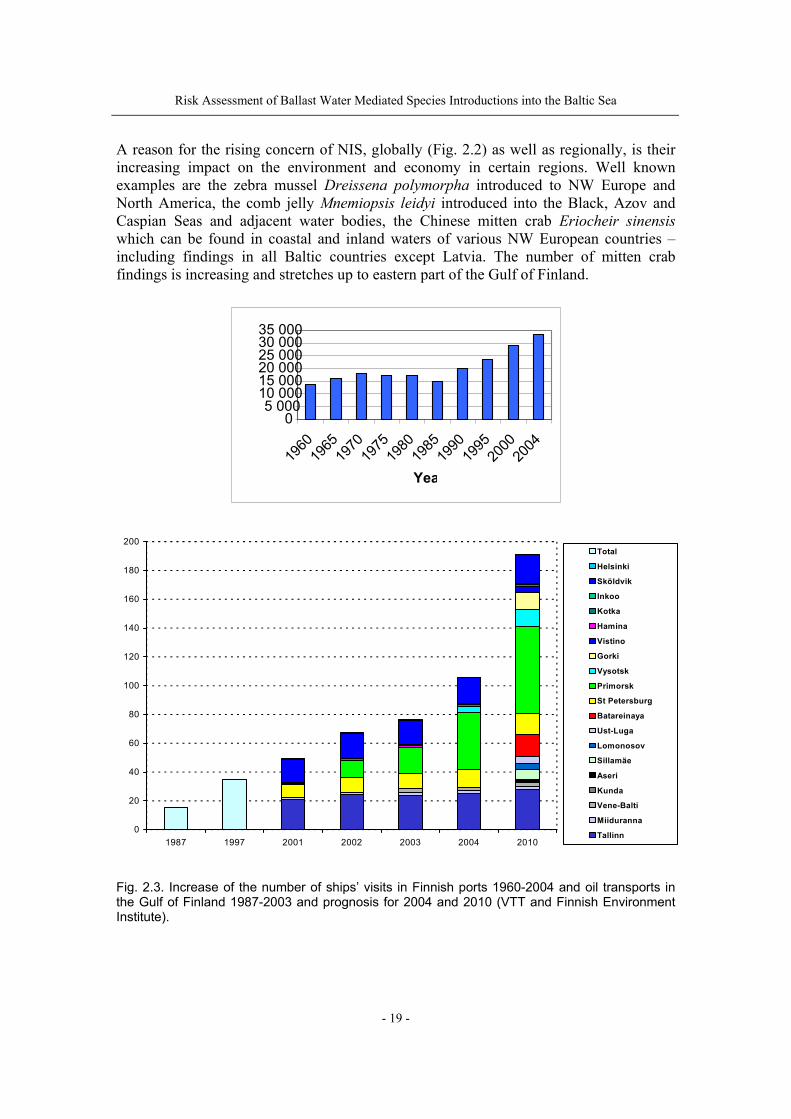
Fig. 2.3. Increase of the number of ships’ visits in Finnish ports 1960-2004 and oil transports in the Gulf of Finland 1987-2003 and prognosis for 2004 and 2010 (VTT and Finnish Environment Institute).
0
20
40
60
80
100
120
140
160
180
200
1987 1997 2001 2002 2003 2004 2010
Total
Helsinki
Sköldvik
Inkoo
Kotka
Hamina
Vistino
Gorki
Vysotsk
Primorsk
St Petersburg
Batareinaya
Ust-Luga
Lomonosov
Sillamäe
Aseri
Kunda
Vene-Balti
Miiduranna
Tallinn
Risk Assessment of Ballast Water Mediated Species Introductions into the Baltic Sea
- 20 -
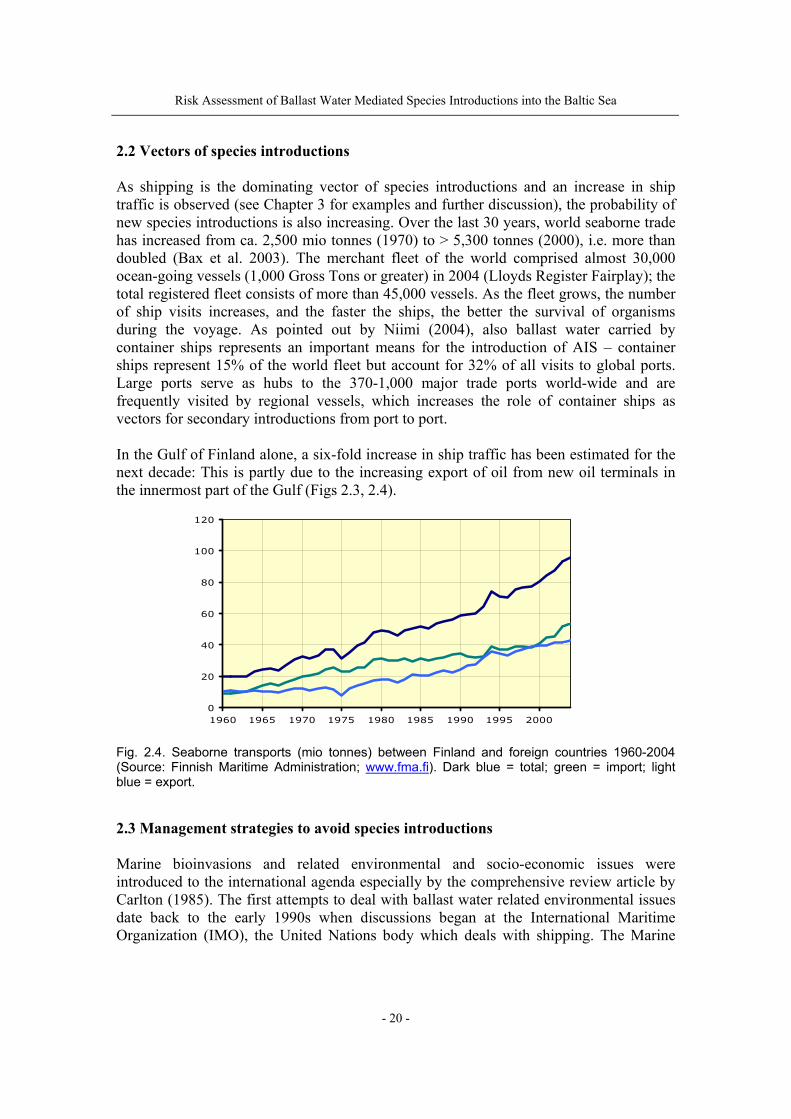
2.2 Vectors of species introductions As shipping is the dominating vector of species introductions and an increase in ship traffic is observed (see Chapter 3 for examples and further discussion), the probability of new species introductions is also increasing. Over the last 30 years, world seaborne trade has increased from ca. 2,500 mio tonnes (1970) to > 5,300 tonnes (2000), i.e. more than doubled (Bax et al. 2003). The merchant fleet of the world comprised almost 30,000 ocean-going vessels (1,000 Gross Tons or greater) in 2004 (Lloyds Register Fairplay); the total registered fleet consists of more than 45,000 vessels. As the fleet grows, the number of ship visits increases, and the faster the ships, the better the survival of organisms during the voyage. As pointed out by Niimi (2004), also ballast water carried by container ships represents an important means for the introduction of AIS – container ships represent 15% of the world fleet but account for 32% of all visits to global ports. Large ports serve as hubs to the 370-1,000 major trade ports world-wide and are frequently visited by regional vessels, which increases the role of container ships as vectors for secondary introductions from port to port. In the Gulf of Finland alone, a six-fold increase in ship traffic has been estimated for the next decade: This is partly due to the increasing export of oil from new oil terminals in the innermost part of the Gulf (Figs 2.3, 2.4).
Fig. 2.4. Seaborne transports (mio tonnes) between Finland and foreign countries 1960-2004 (Source: Finnish Maritime Administration; www.fma.fi). Dark blue = total; green = import; light blue = export. 2.3 Management strategies to avoid species introductions Marine bioinvasions and related environmental and socio-economic issues were introduced to the international agenda especially by the comprehensive review article by Carlton (1985). The first attempts to deal with ballast water related environmental issues date back to the early 1990s when discussions began at the International Maritime Organization (IMO), the United Nations body which deals with shipping. The Marine
0
20
40
60
80
100
120
1960 1965 1970 1975 1980 1985 1990 1995 2000
Risk Assessment of Ballast Water Mediated Species Introductions into the Baltic Sea
- 21 -
Environment Protection Committee (MEPC)19 within IMO launched a ballast water working group in 1992 and as a result of this work in 1998 the Assembly Resolution A.868 (20): "Guidelines for the Control and Management of Ship’s Ballast Water to Minimise the Transfer of Harmful Aquatic Organisms and Pathogens" was published. The group continued its work and in February 2004 the IMO BWC was adopted. As a consequence the IMO based Global Ballast Water Management Programme (GloBallast) was launched as a four-year project. GloBallast came to an end in December 2004 and is considered to have effectively achieved its goals, one of which was to carry out a risk assessment for species movements in ballast water for all six GloBallast demonstration sites (based in Brazil, China, India, Iran, Ukraine and South Africa). Since the completion of GloBallast in 2004, IMO and other funding authorities currently prepare a follow-up initiative, i.e. GloBallast Partnerships. This programme may be launched in 2007 and may put an emphasis on a more regional approach when dealing with ballast water management matters. Another key objective may also be support for the timely implementation on the IMO BWC. ICES emphasised the need to deal with ballast water already in the end of the 1980s at the 1987 meeting of the ICES Working Group on Introductions and Transfers of Marine Organisms (WGITMO). In the end of the 1990s the ICES WGITMO emphasised the need to follow the IMO Assembly resolution A.868(20). In addition to the WGITMO, ICES, IOC and IMO established in 1997 a joint Study Group (SGBWS) focussing on unintentional species introductions with ships. To address the growing concern of other ship vectors than ballast water the Study Group was renamed to Study Group on Ballast and other Ship Vectors (SGBOSV) in 1999. To allow for a longer working term of this group it was renamed again in Working Group on Ballast and Other Ship Vectors (WGBOSV) in 2004 and its work continues with annual meetings. A regional body particularly relevant in this field is the working group of the BMB on Nonindigenous Estuarine and Marine Organisms, established in 1994. Objectives of the Working Group include:
• to collect and summarise information on introduced species in the Baltic Sea, • to promote a closer co-operation between biologists dealing with introduced
species within the Baltic Sea and between the Baltic Sea and other marine areas, and
• to elaborate recommendations for consideration of HELCOM. A statement to HELCOM made by the Working Group at its first meeting in Klaipeda in 1995 was appreciated by the HELCOM EC. Initiated and funded by the German Environmental Protection Agency (Umwelt-bundesamt, Berlin) a ship sampling programme on ballast water, hull fouling and sediments in ballast tanks was carried out 1992-1996 in German ports. This study was the first ballast water sampling study in Europe. It also provided a simplified risk assessment 19 Of the Baltic Sea countries, Denmark, Finland, Germany, Poland, the Russian Federation, and Sweden have actively contributed to the work of MEPC in the early 2000s when completing the Ballast Water Management Convention.
Risk Assessment of Ballast Water Mediated Species Introductions into the Baltic Sea
- 22 -
to analyse the likeliness of species introduction for all NIS found during the investigation. This risk assessment was based upon the comparison of salinity and temperature in the area of origin of the found NIS and NW Europe, with a focus on the North Sea (Gollasch 1996). During 1997-1998 the Nordic Council of Ministers funded a study entitled "Initial Risk Assessment of Alien Species in Nordic Coastal Waters" and the final report was published in 1999. For the Baltic Sea area, Gollasch & Leppäkoski (1999) and their co-workers generated an initial risk assessment overview for Nordic coastal waters. They reviewed existing, and presented new ideas on the components to be included in a risk assessment of NIS (vectors, environmental matching approach, volume of ballast water discharged, port profiles) and conducted qualitative risk assessments for brackish water species and five selected ports along the salinity gradient from St. Petersburg to Bergen. This study was the first of its kind in Europe and addressed the risk of species invasions in various port regions within the Nordic countries. The project identified:
• Nordic marine areas that might be particularly sensitive to the introduction of NIS,
• NIS that are particularly potent to cause large-scale environmental problems (including impacts on biodiversity) and/or economic effects,
• ecosystems and indigenous species that are particularly sensitive to the impact of NIS,
• economic losses due to the impact of NIS, • tools for risk assessment for selected harbour areas, including ecological criteria
and prerequisites (e.g., salinity and temperature conditions, availability of habitats, turbidity, eutrophication, pollution) for probabilities of harbour areas to act as receivers and/or donors, quantified in relation to survival probabilities of NIS,
• existing vectors in selected, international harbours, including harbour profiles with regard to import/export of ballast water, i.e., an origin/destination profile for imported/exported ballast water. Harbours studied were St. Petersburg (Russia), Turku (Finland), Klaipeda (Lithuania), Stenungsund (Sweden), and Sture (Norway),
• suggestions of measures and strategies to be employed to tackle the problems, and • the need for further research, and suggestions to monitoring activities.
However, the results from the study can only be applied to the today's situation on a limited scale as e.g. the IMO BWC emerged which addresses certain depth and distance limits for ballast water exchange and other ballast water management requirements. Further, the approach taken was not based on shipping routes, but was more in general nature. Previous risk assessment studies of aquatic NIS have used frameworks and concepts of general ecological risk assessment (see also Annex 1). Qualitative risk assessments have been more common (e.g. Gollasch 1996, Gollasch & Leppäkoski 1999, Grigorovich et al.
Risk Assessment of Ballast Water Mediated Species Introductions into the Baltic Sea
- 23 -
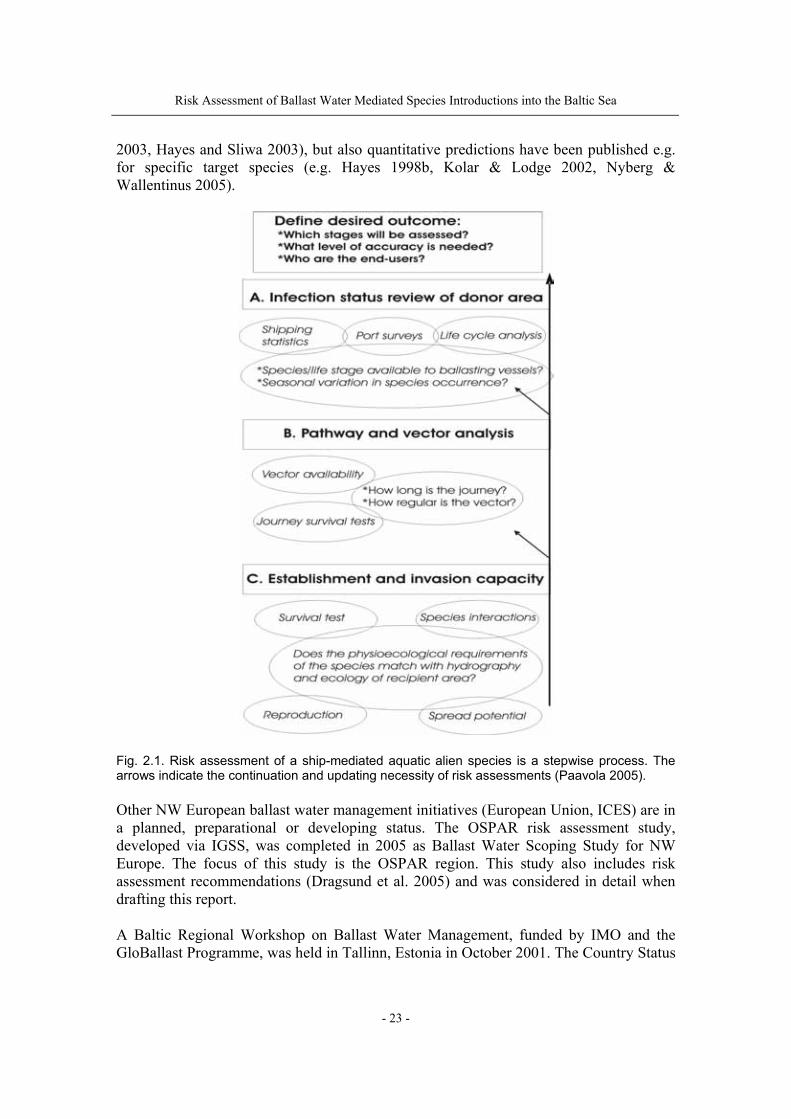
2003, Hayes and Sliwa 2003), but also quantitative predictions have been published e.g. for specific target species (e.g. Hayes 1998b, Kolar & Lodge 2002, Nyberg & Wallentinus 2005).
Fig. 2.1. Risk assessment of a ship-mediated aquatic alien species is a stepwise process. The arrows indicate the continuation and updating necessity of risk assessments (Paavola 2005). Other NW European ballast water management initiatives (European Union, ICES) are in a planned, preparational or developing status. The OSPAR risk assessment study, developed via IGSS, was completed in 2005 as Ballast Water Scoping Study for NW Europe. The focus of this study is the OSPAR region. This study also includes risk assessment recommendations (Dragsund et al. 2005) and was considered in detail when drafting this report. A Baltic Regional Workshop on Ballast Water Management, funded by IMO and the GloBallast Programme, was held in Tallinn, Estonia in October 2001. The Country Status
Risk Assessment of Ballast Water Mediated Species Introductions into the Baltic Sea
- 24 -
Reports compiled in the framework of the workshop showed that all Baltic Region countries have suffered from marine bioinvasions, all are undergoing expansions of their port facilities and are facing significant increases in shipping activities (Raaymakers 2002). During the workshop discussions, all countries agreed that the problem of ballast water and marine bioinvasions must be addressed in the Baltic Sea on a regional basis and that a cooperation between all countries in the region is essential. The reasons given for this position were:
• the Baltic is an enclosed sea and the marine and coastal environments of all Baltic Sea countries are linked,
• shipping is an international industry and ships routinely cross jurisdictional border lines to conduct trade,
• actions by an individual country would therefore be of limited effectiveness, and • there is a strong history of effective regional cooperation in the Baltic on maritime
and marine resource management matters. Further, the participants at the Baltic Regional Workshop 2001 agreed that a regional cooperation on ballast water control and management should be developed and coordinated through existing regional structures and mechanisms, and should be linked, wherever possible, with existing marine resource management and environmental protection activities. HELCOM and the GEF Baltic Sea Regional Project were identified as the most suitable entities (Raaymakers 2002). The Nordic Council of Ministers held the Nordic Ballast Water Summit in Oslo in January 2002 at the headquarters of Det Norske Veritas, Hövik (Norway). One of the results from this summit was a call for a "Regional Strategy and Action Plan for Ballast Water Control and Management". The outcome of this workshop supported the development of the Det Norske Veritas risk assessment approach, named EMBLA, which is a ballast water risk assessment method. The overall objective of EMBLA is to provide an Internet based decision support system for ballast water exchange on specific voyages. More recently DNV reviewed and updated EMBLA to address new developments at IMO, i.e. compliance with the IMO BWC and the Risk Assessment Guideline G7 which is currently developing. The EMBLA system encompasses the following main modules:
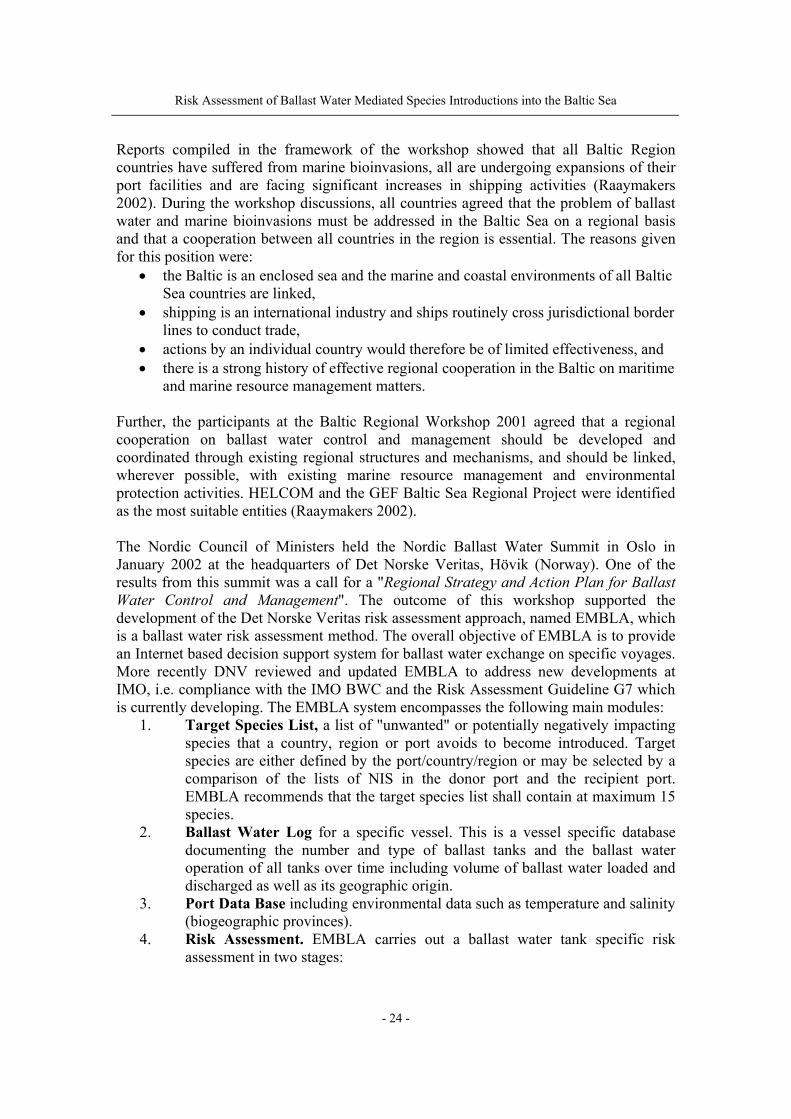
1. Target Species List, a list of "unwanted" or potentially negatively impacting species that a country, region or port avoids to become introduced. Target species are either defined by the port/country/region or may be selected by a comparison of the lists of NIS in the donor port and the recipient port. EMBLA recommends that the target species list shall contain at maximum 15 species.
2. Ballast Water Log for a specific vessel. This is a vessel specific database documenting the number and type of ballast tanks and the ballast water operation of all tanks over time including volume of ballast water loaded and discharged as well as its geographic origin.
3. Port Data Base including environmental data such as temperature and salinity (biogeographic provinces).
4. Risk Assessment. EMBLA carries out a ballast water tank specific risk assessment in two stages:
Risk Assessment of Ballast Water Mediated Species Introductions into the Baltic Sea
- 25 -
a. environmental match between donor and recipient region of the ballast water. The endpoint of the risk assessment is qualitative, i.e. high, medium and low, and
b. species-specific assessment. The survival probability of target species is calculated in EMBLA according to species survival during each of the ballast water operations (uptake, transfer, discharge, recipient region). Whenever possible different life stages of the target species are taken into account and also the seasonal occurrence of the different target species life stage in the donor port/port region as well as the seasonal changes in environmental conditions in the recipient port/port region. The risk assessment endpoint is quantitative.
As stated in Dragsund et al. (2005), HELCOM 25 in March 2004 recommended the HELCOM Contracting Parties to ratify, as soon as possible, the Ballast Water Management Convention, and each Baltic state should develop a national lead agency for ballast water management. The Maritime group drafted in a meeting in Copenhagen in October 2004 the HELCOM recommendations: "Measures to address the threat of invasive species transported via the ballast water of ships". Considering that ballast water exchange is a limited option for ballast water management in the Baltic Sea the group emphasized the need for regional cooperation when addressing the threat. The Governments of the Contracting Parties to the Helsinki Convention recommended:
• to designate/identify a clear responsibility for coordinating the national response to the issue,
• to request arriving ships to submit Ballast Water reporting forms using the IMO Guidelines (IMO Resolution A.868(20), adopted on 27 November 1997),
• to require ships flying the country’s flag or calling at the country’s ports to carry and implement a shipboard ballast water management plan (taking into account the IMO Guidelines),
• to provide adequate reception facilities for sediments in ports and terminals where cleaning and repair of ballast tanks occurs,
• to carry out by 1 January 2007 risk assessments for major ports. The risk assessments should be carried out using the compatible methodology developed under IMO (the development of the IMO risk assessment guideline is currently ongoing and a draft document will likely be discussed at the next meeting of IMO MEPC in March 2006),
• to cooperate in order to establish by 2006 national and regional information systems for the data obtained from the Ballast Water reporting as well as during risk assessments, biological surveys and monitoring (including an early warning system),
• to conduct by 1 January 2007 biological surveys and establish a monitoring system for invasive aquatic species in major ports using harmonized methodology developed and updated by the appropriate HELCOM subsidiary bodies and to be based on guidelines prepared under the IMO,
• to link the port surveys and monitoring to an early-warning system, whereby ships can be alerted to outbreaks of harmful species, and
Risk Assessment of Ballast Water Mediated Species Introductions into the Baltic Sea
- 26 -
• to cooperate with the North Sea countries when implementing the provision of the Ballast Water Management Convention.
The implications in a regional context of the BWC were discussed by Baltic Sea experts at a Workshop in Palanga, Lithuania, in February 2005 (BSRC/HELCOM/COLAR 2005). During this workshop the following subjects were elaborated and discussed further:
• applicability of the risk assessment and port baseline survey methodologies developed under the IMO GloBallast and other relevant projects for the Baltic Sea,
• research capacity, technical potential and financial resources needed for the risk assessment and the port baseline surveys,
• common principles for the monitoring system of invasive species in the Baltic Sea, and
• common information system for the Baltic Sea supporting the implementation of the IMO BWC.
Results and recommendations from all above-mentioned initiatives relevant to risk assessment were considered in great detail during the preparation of this report.
Risk Assessment of Ballast Water Mediated Species Introductions into the Baltic Sea
- 27 -
3 Analysis of present and future shipping patterns in the Baltic Sea
“For the first time in the history of human endeavor and the history of the ocean, large parcels of plankton-rich water were being transported virtually instantaneously across and between oceans” (Carlton 1996).
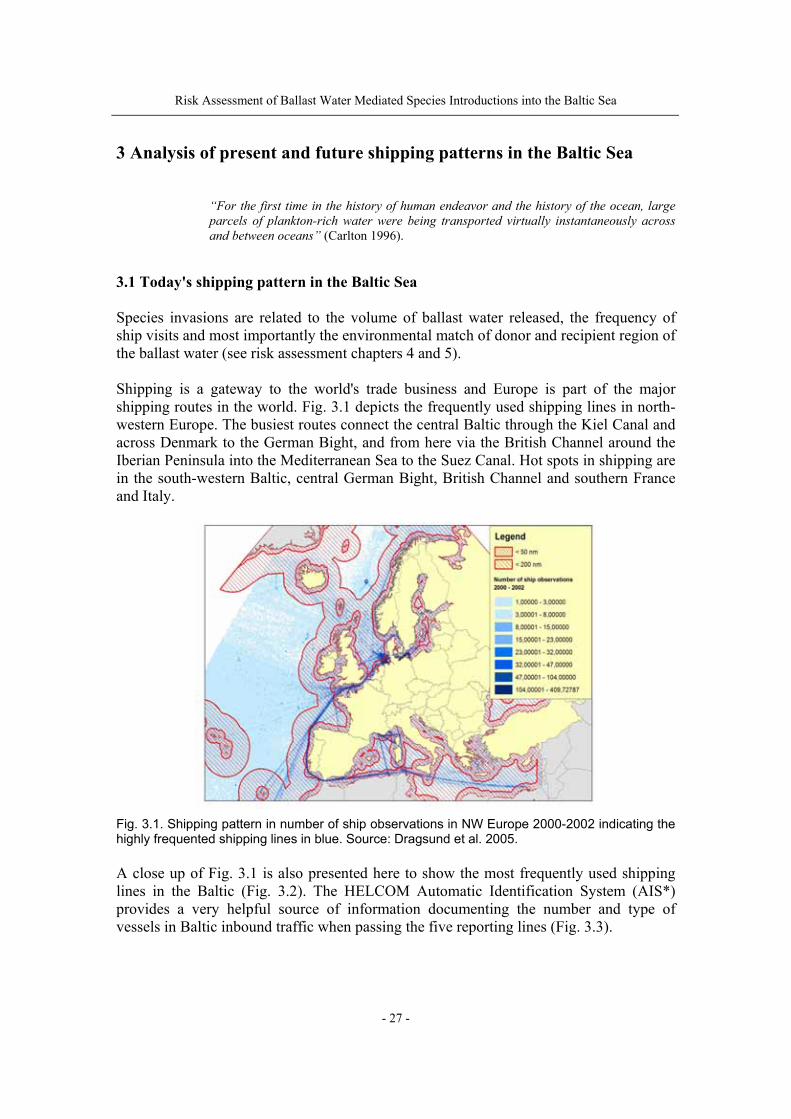
3.1 Today's shipping pattern in the Baltic Sea Species invasions are related to the volume of ballast water released, the frequency of ship visits and most importantly the environmental match of donor and recipient region of the ballast water (see risk assessment chapters 4 and 5). Shipping is a gateway to the world's trade business and Europe is part of the major shipping routes in the world. Fig. 3.1 depicts the frequently used shipping lines in north-western Europe. The busiest routes connect the central Baltic through the Kiel Canal and across Denmark to the German Bight, and from here via the British Channel around the Iberian Peninsula into the Mediterranean Sea to the Suez Canal. Hot spots in shipping are in the south-western Baltic, central German Bight, British Channel and southern France and Italy.
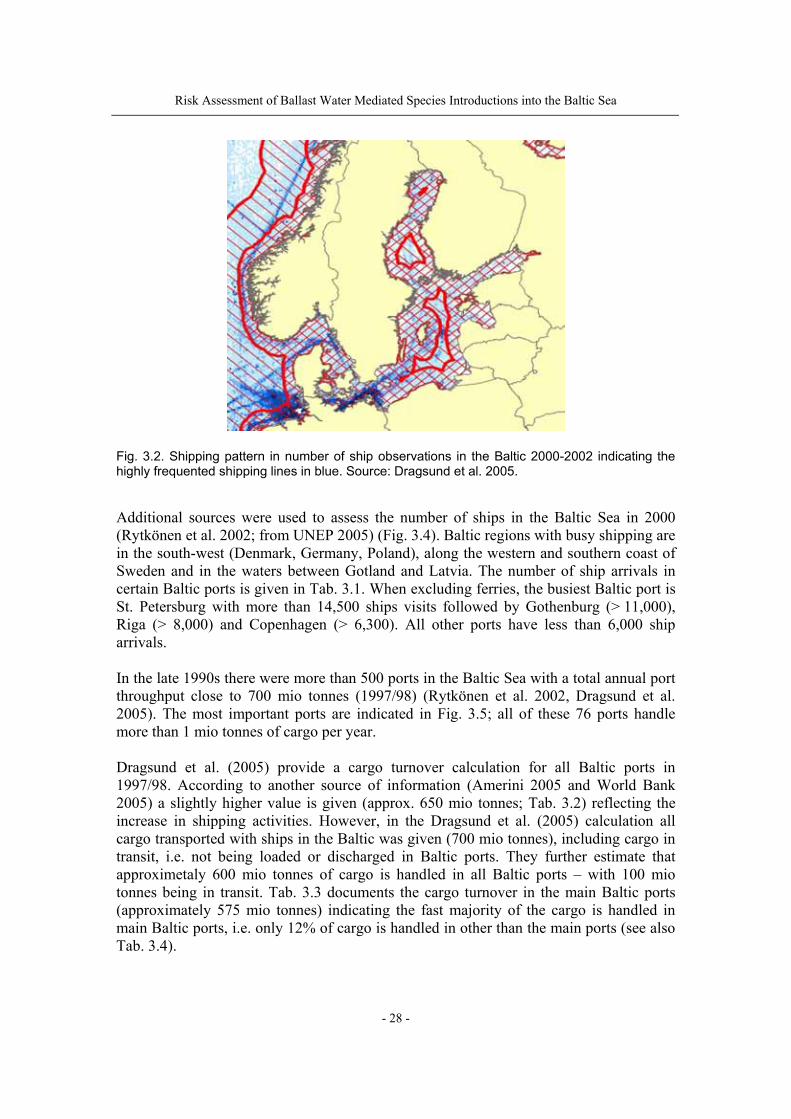
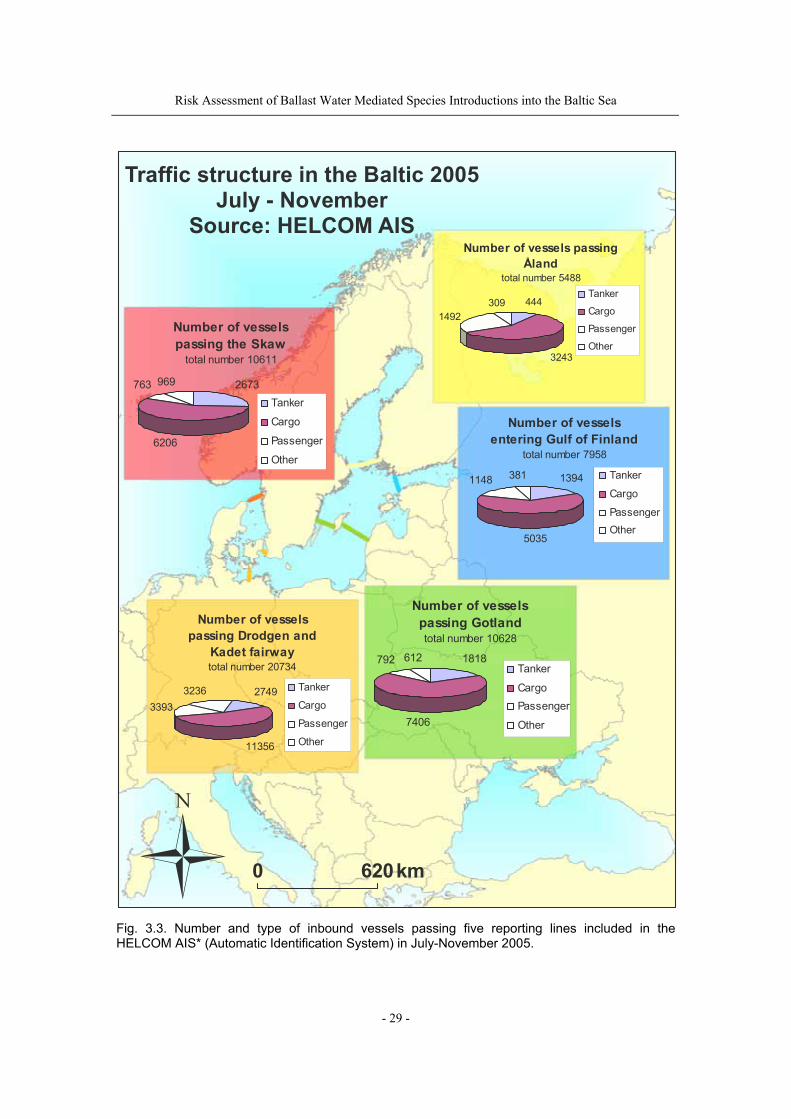
Fig. 3.1. Shipping pattern in number of ship observations in NW Europe 2000-2002 indicating the highly frequented shipping lines in blue. Source: Dragsund et al. 2005. A close up of Fig. 3.1 is also presented here to show the most frequently used shipping lines in the Baltic (Fig. 3.2). The HELCOM Automatic Identification System (AIS*) provides a very helpful source of information documenting the number and type of vessels in Baltic inbound traffic when passing the five reporting lines (Fig. 3.3).
Risk Assessment of Ballast Water Mediated Species Introductions into the Baltic Sea
- 28 -
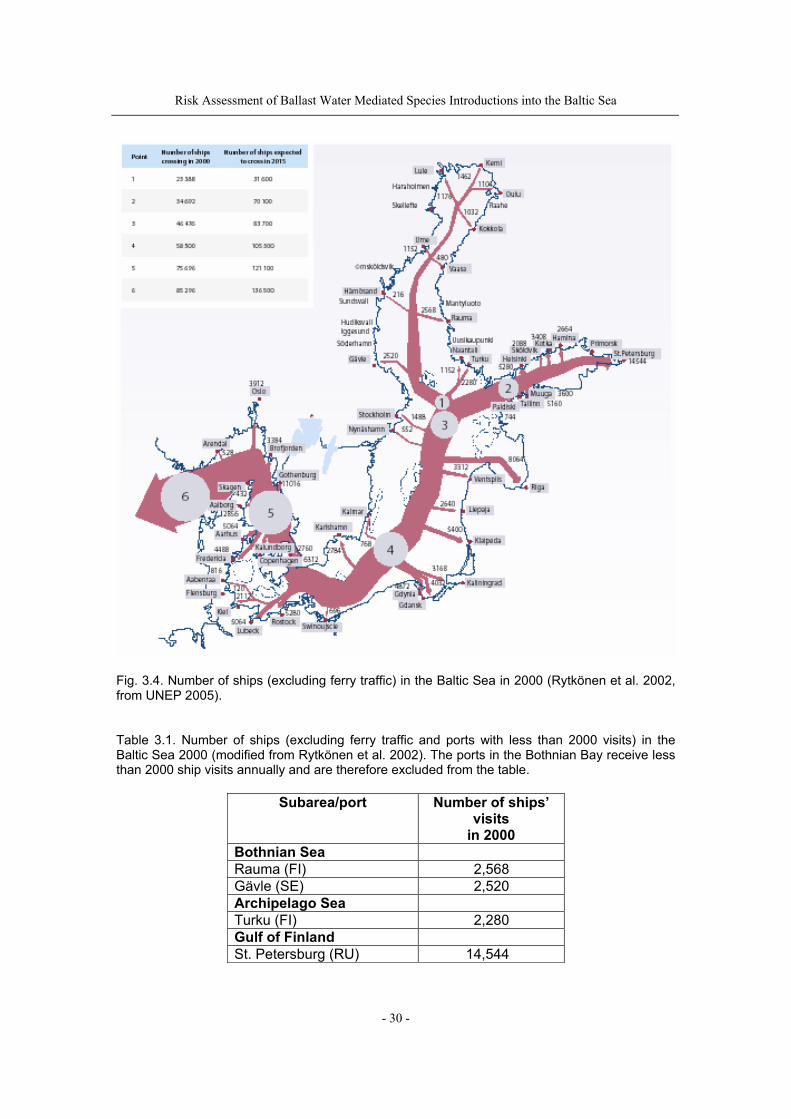
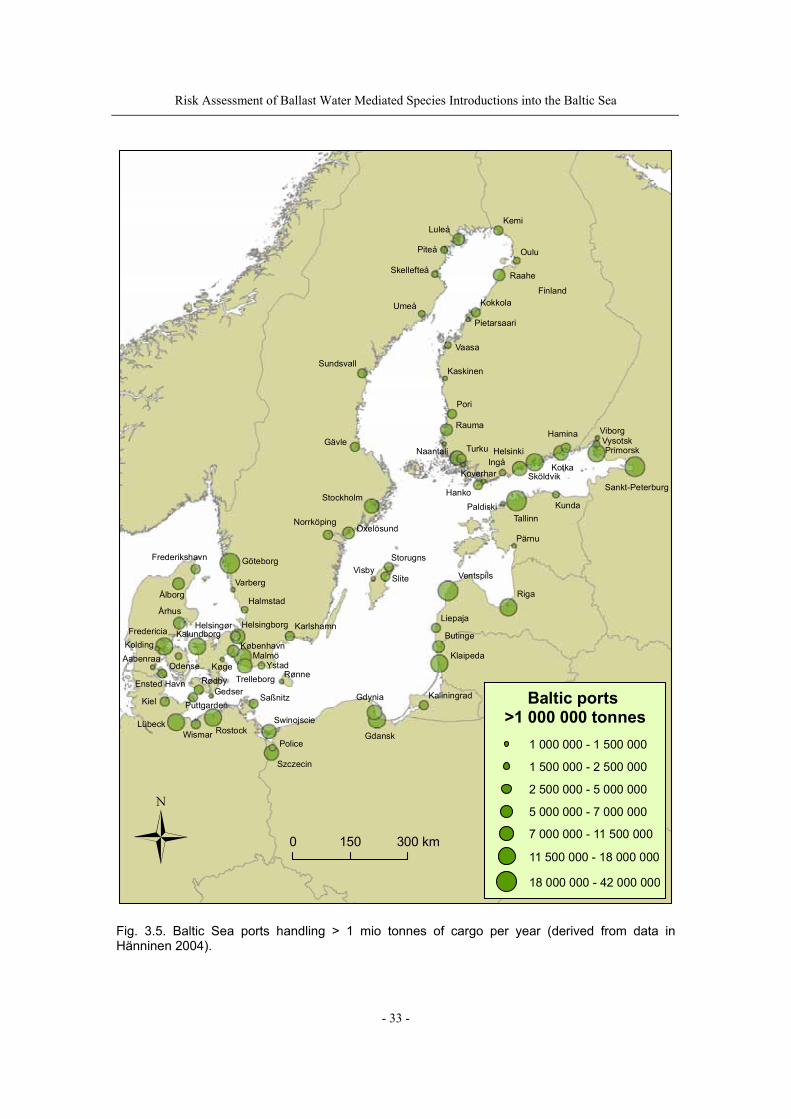
Fig. 3.2. Shipping pattern in number of ship observations in the Baltic 2000-2002 indicating the highly frequented shipping lines in blue. Source: Dragsund et al. 2005. Additional sources were used to assess the number of ships in the Baltic Sea in 2000 (Rytkönen et al. 2002; from UNEP 2005) (Fig. 3.4). Baltic regions with busy shipping are in the south-west (Denmark, Germany, Poland), along the western and southern coast of Sweden and in the waters between Gotland and Latvia. The number of ship arrivals in certain Baltic ports is given in Tab. 3.1. When excluding ferries, the busiest Baltic port is St. Petersburg with more than 14,500 ships visits followed by Gothenburg (> 11,000), Riga (> 8,000) and Copenhagen (> 6,300). All other ports have less than 6,000 ship arrivals. In the late 1990s there were more than 500 ports in the Baltic Sea with a total annual port throughput close to 700 mio tonnes (1997/98) (Rytkönen et al. 2002, Dragsund et al. 2005). The most important ports are indicated in Fig. 3.5; all of these 76 ports handle more than 1 mio tonnes of cargo per year. Dragsund et al. (2005) provide a cargo turnover calculation for all Baltic ports in 1997/98. According to another source of information (Amerini 2005 and World Bank 2005) a slightly higher value is given (approx. 650 mio tonnes; Tab. 3.2) reflecting the increase in shipping activities. However, in the Dragsund et al. (2005) calculation all cargo transported with ships in the Baltic was given (700 mio tonnes), including cargo in transit, i.e. not being loaded or discharged in Baltic ports. They further estimate that approximetaly 600 mio tonnes of cargo is handled in all Baltic ports – with 100 mio tonnes being in transit. Tab. 3.3 documents the cargo turnover in the main Baltic ports (approximately 575 mio tonnes) indicating the fast majority of the cargo is handled in main Baltic ports, i.e. only 12% of cargo is handled in other than the main ports (see also Tab. 3.4).
Risk Assessment of Ballast Water Mediated Species Introductions into the Baltic Sea
- 29 -
0 620km
Traffic structure in the Baltic 2005July - November
Source: HELCOM AIS
Number of vessels passing the Skaw
total number 10611
2673
6206
763 969
Tanker
Cargo
Passenger
Other
Number of vessels entering Gulf of Finland
total number 7958
1394
5035
1148 381 Tanker
Cargo
PassengerOther
Number of vessels passing Åland
total number 5488
444
3243
1492309
Tanker
Cargo
Passenger
Other
Number of vessels passing Gotlandtotal number 10628
1818
7406
792 612Tanker
CargoPassenger
Other
Number of vessels passing Drodgen and
Kadet fairwaytotal number 20734
2749
11356
33933236 Tanker
Cargo
Passenger
Other
Fig. 3.3. Number and type of inbound vessels passing five reporting lines included in the HELCOM AIS* (Automatic Identification System) in July-November 2005.
Risk Assessment of Ballast Water Mediated Species Introductions into the Baltic Sea
- 30 -
Fig. 3.4. Number of ships (excluding ferry traffic) in the Baltic Sea in 2000 (Rytkönen et al. 2002, from UNEP 2005). Table 3.1. Number of ships (excluding ferry traffic and ports with less than 2000 visits) in the Baltic Sea 2000 (modified from Rytkönen et al. 2002). The ports in the Bothnian Bay receive less than 2000 ship visits annually and are therefore excluded from the table.
Subarea/port Number of ships’ visits
in 2000 Bothnian Sea Rauma (FI) 2,568 Gävle (SE) 2,520 Archipelago Sea Turku (FI) 2,280 Gulf of Finland St. Petersburg (RU) 14,544
Risk Assessment of Ballast Water Mediated Species Introductions into the Baltic Sea
- 31 -
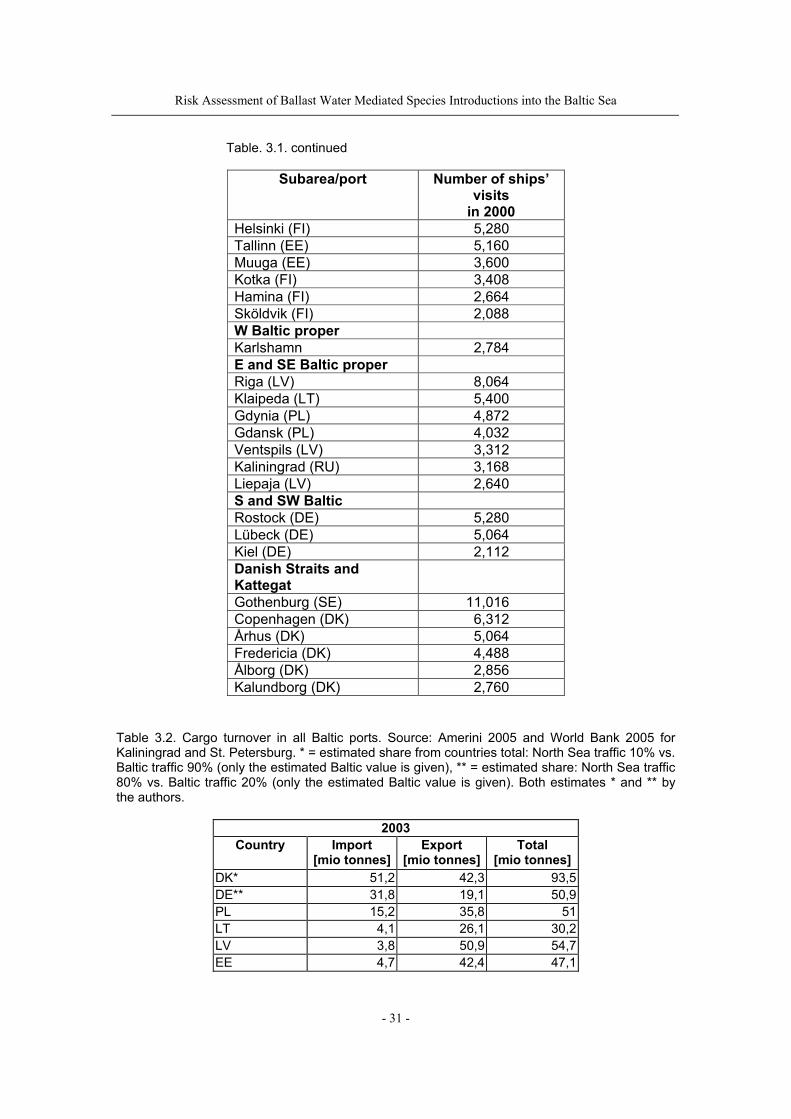
Table. 3.1. continued
Subarea/port Number of ships’ visits
in 2000 Helsinki (FI) 5,280 Tallinn (EE) 5,160 Muuga (EE) 3,600 Kotka (FI) 3,408 Hamina (FI) 2,664 Sköldvik (FI) 2,088 W Baltic proper Karlshamn 2,784 E and SE Baltic proper Riga (LV) 8,064 Klaipeda (LT) 5,400 Gdynia (PL) 4,872 Gdansk (PL) 4,032 Ventspils (LV) 3,312 Kaliningrad (RU) 3,168 Liepaja (LV) 2,640 S and SW Baltic Rostock (DE) 5,280 Lübeck (DE) 5,064 Kiel (DE) 2,112 Danish Straits and Kattegat
Gothenburg (SE) 11,016 Copenhagen (DK) 6,312 Århus (DK) 5,064 Fredericia (DK) 4,488 Ålborg (DK) 2,856 Kalundborg (DK) 2,760
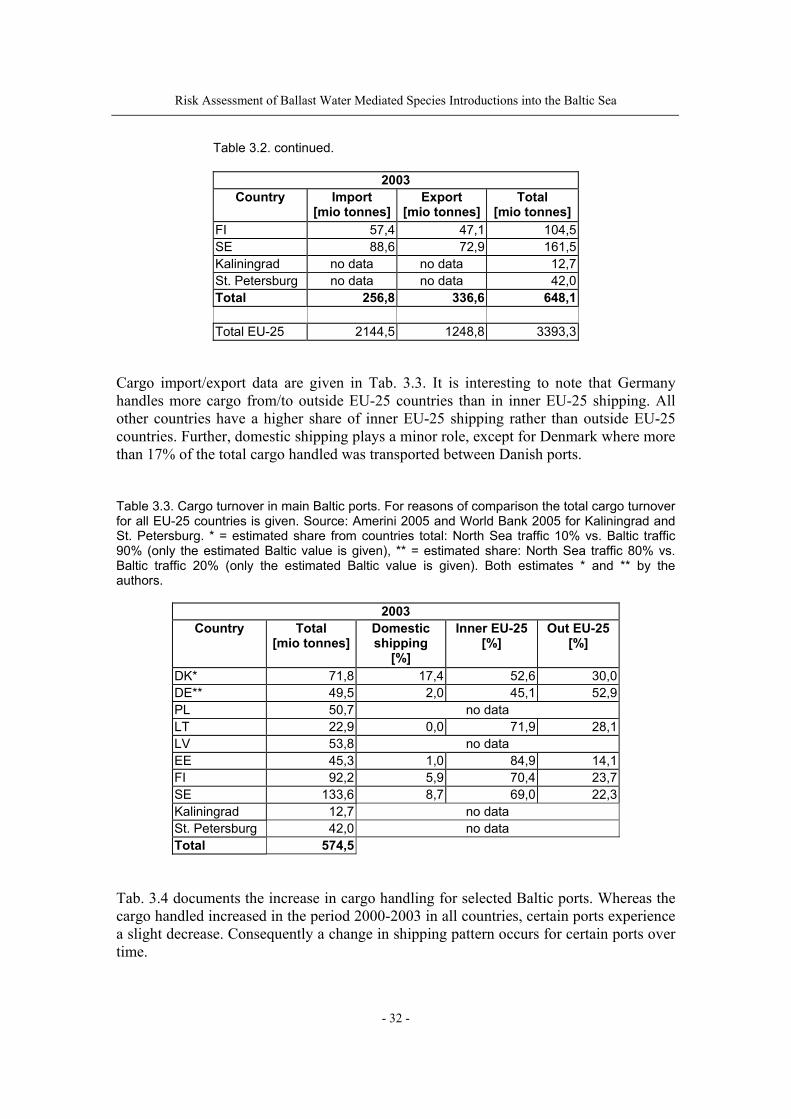
Table 3.2. Cargo turnover in all Baltic ports. Source: Amerini 2005 and World Bank 2005 for Kaliningrad and St. Petersburg. * = estimated share from countries total: North Sea traffic 10% vs. Baltic traffic 90% (only the estimated Baltic value is given), ** = estimated share: North Sea traffic 80% vs. Baltic traffic 20% (only the estimated Baltic value is given). Both estimates * and ** by the authors.
2003 Country Import
[mio tonnes]Export
[mio tonnes]Total
[mio tonnes] DK* 51,2 42,3 93,5 DE** 31,8 19,1 50,9 PL 15,2 35,8 51 LT 4,1 26,1 30,2 LV 3,8 50,9 54,7 EE 4,7 42,4 47,1
Risk Assessment of Ballast Water Mediated Species Introductions into the Baltic Sea
- 32 -
Table 3.2. continued.
2003 Country Import
[mio tonnes]Export
[mio tonnes]Total
[mio tonnes] FI 57,4 47,1 104,5 SE 88,6 72,9 161,5 Kaliningrad no data no data 12,7 St. Petersburg no data no data 42,0 Total 256,8 336,6 648,1
Total EU-25 2144,5 1248,8 3393,3
Cargo import/export data are given in Tab. 3.3. It is interesting to note that Germany handles more cargo from/to outside EU-25 countries than in inner EU-25 shipping. All other countries have a higher share of inner EU-25 shipping rather than outside EU-25 countries. Further, domestic shipping plays a minor role, except for Denmark where more than 17% of the total cargo handled was transported between Danish ports. Table 3.3. Cargo turnover in main Baltic ports. For reasons of comparison the total cargo turnover for all EU-25 countries is given. Source: Amerini 2005 and World Bank 2005 for Kaliningrad and St. Petersburg. * = estimated share from countries total: North Sea traffic 10% vs. Baltic traffic 90% (only the estimated Baltic value is given), ** = estimated share: North Sea traffic 80% vs. Baltic traffic 20% (only the estimated Baltic value is given). Both estimates * and ** by the authors.
2003 Country Total
[mio tonnes]Domestic shipping
[%]
Inner EU-25 [%]
Out EU-25 [%]
DK* 71,8 17,4 52,6 30,0 DE** 49,5 2,0 45,1 52,9 PL 50,7 no data LT 22,9 0,0 71,9 28,1 LV 53,8 no data EE 45,3 1,0 84,9 14,1 FI 92,2 5,9 70,4 23,7 SE 133,6 8,7 69,0 22,3 Kaliningrad 12,7 no data St. Petersburg 42,0 no data Total 574,5
Tab. 3.4 documents the increase in cargo handling for selected Baltic ports. Whereas the cargo handled increased in the period 2000-2003 in all countries, certain ports experience a slight decrease. Consequently a change in shipping pattern occurs for certain ports over time.
Risk Assessment of Ballast Water Mediated Species Introductions into the Baltic Sea
- 33 -
KemiLuleå
Piteå
Skellefteå
Umeå
Sundsvall
Oulu
Raahe
Kokkola
Pietarsaari
Vaasa
Kaskinen
Pori
Rauma
TurkuNaantali
Hanko
KoverharIngå
Helsinki
SköldvikKotka
Hamina Viborg
Primorsk
Sankt-Peterburg
KundaTallinn
Paldiski
Pärnu
Riga
Ventspils
Liepaja
Butinge
Klaipeda
KaliningradGdynia
GdanskPolice
Szczecin
Swinojscie
Saßnitz
Rønne
Karlshamn
TrelleborgYstad
MalmöKøbenhavn
Halmstad
Køge
Helsingør Helsingborg
Rostock
GedserRødby
Puttgarden
WismarLübeck
Kiel
Ensted Havn
Kalundborg
Odense
Århus
ÅlborgVarberg
Frederikshavn Göteborg
NorrköpingOxelösund
Stockholm
Storugns
SliteVisby
Gävle
Aabenraa
FredericiaKolding
Finland
Vysotsk
0 150 300 km
Baltic ports >1 000 000 tonnes
1 000 000 - 1 500 000
1 500 000 - 2 500 000
2 500 000 - 5 000 000
5 000 000 - 7 000 000
7 000 000 - 11 500 000
11 500 000 - 18 000 000
18 000 000 - 42 000 000
Fig. 3.5. Baltic Sea ports handling > 1 mio tonnes of cargo per year (derived from data in Hänninen 2004).
Risk Assessment of Ballast Water Mediated Species Introductions into the Baltic Sea
- 34 -
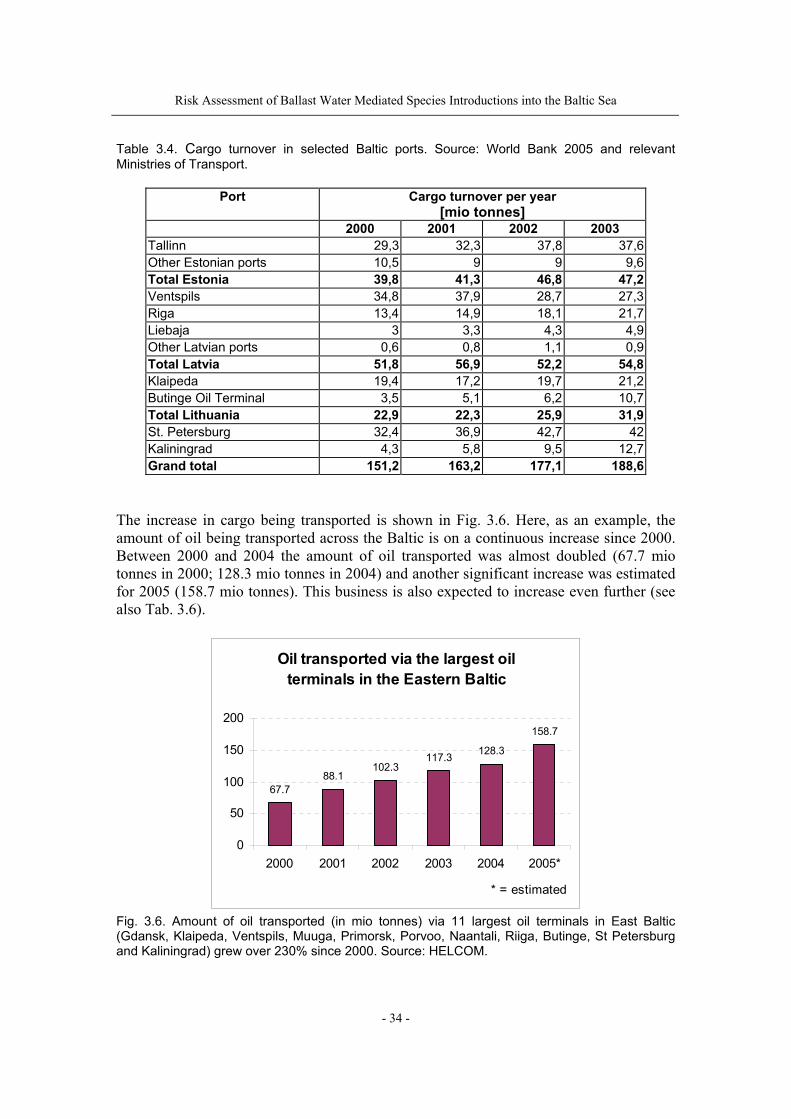
Table 3.4. Cargo turnover in selected Baltic ports. Source: World Bank 2005 and relevant Ministries of Transport.
Port Cargo turnover per year [mio tonnes]
2000 2001 2002 2003 Tallinn 29,3 32,3 37,8 37,6 Other Estonian ports 10,5 9 9 9,6 Total Estonia 39,8 41,3 46,8 47,2 Ventspils 34,8 37,9 28,7 27,3 Riga 13,4 14,9 18,1 21,7 Liebaja 3 3,3 4,3 4,9 Other Latvian ports 0,6 0,8 1,1 0,9 Total Latvia 51,8 56,9 52,2 54,8 Klaipeda 19,4 17,2 19,7 21,2 Butinge Oil Terminal 3,5 5,1 6,2 10,7 Total Lithuania 22,9 22,3 25,9 31,9 St. Petersburg 32,4 36,9 42,7 42 Kaliningrad 4,3 5,8 9,5 12,7 Grand total 151,2 163,2 177,1 188,6
The increase in cargo being transported is shown in Fig. 3.6. Here, as an example, the amount of oil being transported across the Baltic is on a continuous increase since 2000. Between 2000 and 2004 the amount of oil transported was almost doubled (67.7 mio tonnes in 2000; 128.3 mio tonnes in 2004) and another significant increase was estimated for 2005 (158.7 mio tonnes). This business is also expected to increase even further (see also Tab. 3.6).
Oil transported via the largest oil terminals in the Eastern Baltic
67.788.1
102.3117.3 128.3
158.7
0
50
100
150
200
2000 2001 2002 2003 2004 2005*
* = estimated
Fig. 3.6. Amount of oil transported (in mio tonnes) via 11 largest oil terminals in East Baltic (Gdansk, Klaipeda, Ventspils, Muuga, Primorsk, Porvoo, Naantali, Riiga, Butinge, St Petersburg and Kaliningrad) grew over 230% since 2000. Source: HELCOM.
Risk Assessment of Ballast Water Mediated Species Introductions into the Baltic Sea
- 35 -
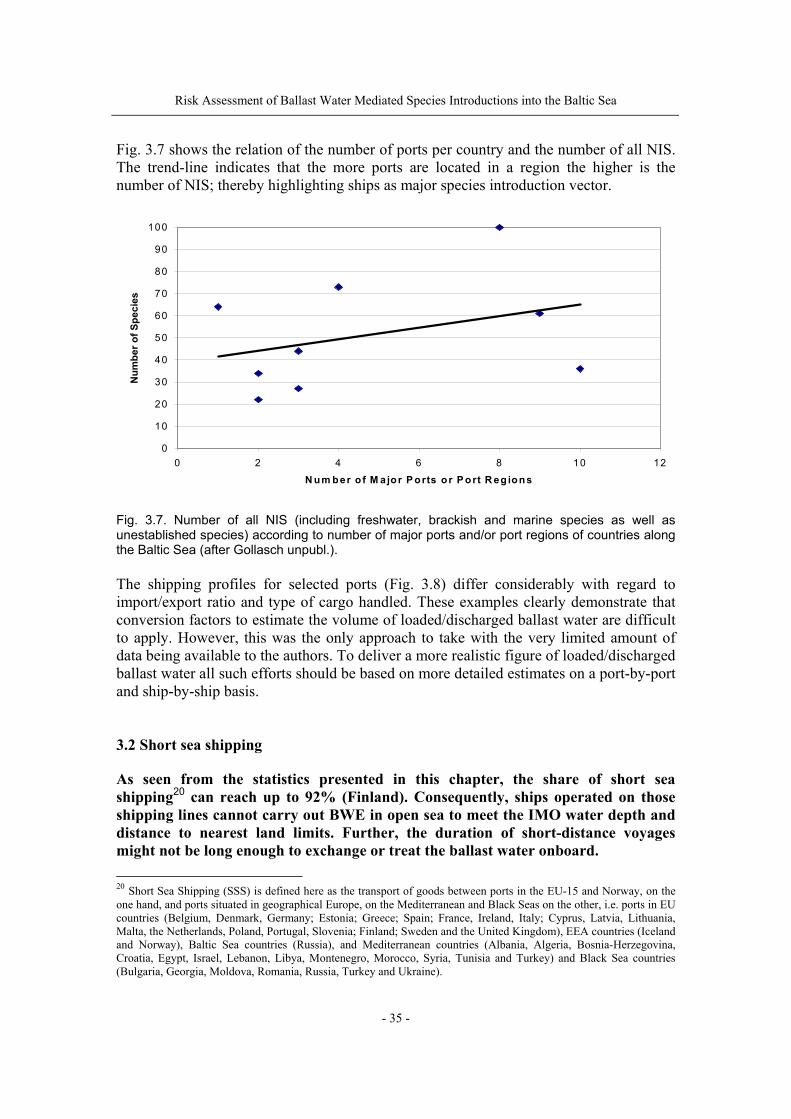
Fig. 3.7 shows the relation of the number of ports per country and the number of all NIS. The trend-line indicates that the more ports are located in a region the higher is the number of NIS; thereby highlighting ships as major species introduction vector.
0
10
20
30
40
50
60
70
80
90
100
0 2 4 6 8 10 12
N um ber o f M ajor P orts o r P ort R eg ions
Num
ber o
f Spe
cies
Fig. 3.7. Number of all NIS (including freshwater, brackish and marine species as well as unestablished species) according to number of major ports and/or port regions of countries along the Baltic Sea (after Gollasch unpubl.). The shipping profiles for selected ports (Fig. 3.8) differ considerably with regard to import/export ratio and type of cargo handled. These examples clearly demonstrate that conversion factors to estimate the volume of loaded/discharged ballast water are difficult to apply. However, this was the only approach to take with the very limited amount of data being available to the authors. To deliver a more realistic figure of loaded/discharged ballast water all such efforts should be based on more detailed estimates on a port-by-port and ship-by-ship basis. 3.2 Short sea shipping As seen from the statistics presented in this chapter, the share of short sea shipping20 can reach up to 92% (Finland). Consequently, ships operated on those shipping lines cannot carry out BWE in open sea to meet the IMO water depth and distance to nearest land limits. Further, the duration of short-distance voyages might not be long enough to exchange or treat the ballast water onboard. 20 Short Sea Shipping (SSS) is defined here as the transport of goods between ports in the EU-15 and Norway, on the one hand, and ports situated in geographical Europe, on the Mediterranean and Black Seas on the other, i.e. ports in EU countries (Belgium, Denmark, Germany; Estonia; Greece; Spain; France, Ireland, Italy; Cyprus, Latvia, Lithuania, Malta, the Netherlands, Poland, Portugal, Slovenia; Finland; Sweden and the United Kingdom), EEA countries (Iceland and Norway), Baltic Sea countries (Russia), and Mediterranean countries (Albania, Algeria, Bosnia-Herzegovina, Croatia, Egypt, Israel, Lebanon, Libya, Montenegro, Morocco, Syria, Tunisia and Turkey) and Black Sea countries (Bulgaria, Georgia, Moldova, Romania, Russia, Turkey and Ukraine).
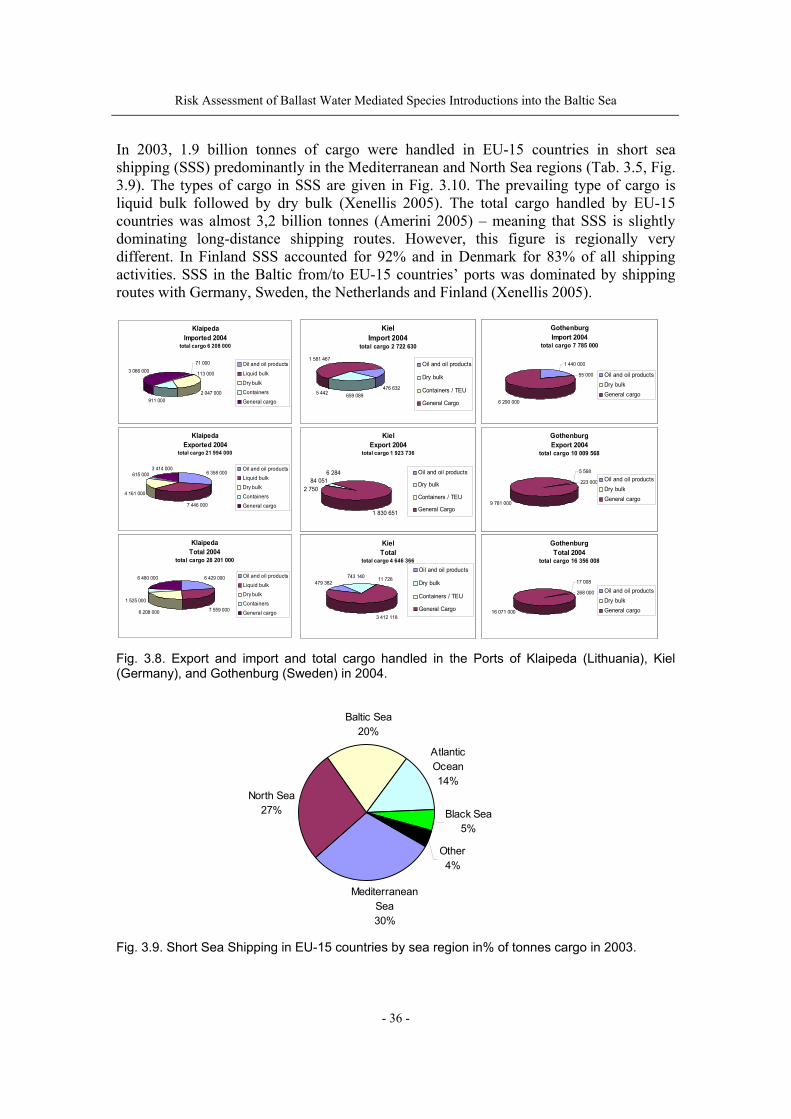
Risk Assessment of Ballast Water Mediated Species Introductions into the Baltic Sea
- 36 -
In 2003, 1.9 billion tonnes of cargo were handled in EU-15 countries in short sea shipping (SSS) predominantly in the Mediterranean and North Sea regions (Tab. 3.5, Fig. 3.9). The types of cargo in SSS are given in Fig. 3.10. The prevailing type of cargo is liquid bulk followed by dry bulk (Xenellis 2005). The total cargo handled by EU-15 countries was almost 3,2 billion tonnes (Amerini 2005) – meaning that SSS is slightly dominating long-distance shipping routes. However, this figure is regionally very different. In Finland SSS accounted for 92% and in Denmark for 83% of all shipping activities. SSS in the Baltic from/to EU-15 countries’ ports was dominated by shipping routes with Germany, Sweden, the Netherlands and Finland (Xenellis 2005).
KlaipedaExported 2004
total cargo 21 994 000
6 358 0003 414 000
615 000
4 161 000
7 446 000
Oil and oil productsLiquid bulk
Dry bulk
Containers
General cargo
KlaipedaImported 2004
total cargo 6 208 000
71 000
113 000
2 047 000911 000
3 066 000Oil and oil products
Liquid bulk
Dry bulkContainers
General cargo
KlaipedaTotal 2004
total cargo 28 201 000
6 429 000
7 559 0006 208 000
1 525 000
6 480 000 Oil and oil productsLiquid bulk
Dry bulk
Containers
General cargo
KielImport 2004
total cargo 2 722 630
5 442 659 089
1 581 467
476 632
Oil and oil products
Dry bulk
Containers / TEU
General Cargo
KielExport 2004
total cargo 1 923 736
84 051
1 830 651
2 750
6 284 Oil and oil products
Dry bulk
Containers / TEU
General Cargo
KielTotal
total cargo 4 646 366
743 140 11 726
3 412 118
479 382
Oil and oil products
Dry bulk
Containers / TEU
General Cargo
GothenburgImport 2004
total cargo 7 785 000
1 440 000
55 000
6 290 000
Oil and oil productsDry bulkGeneral cargo
GothenburgExport 2004
total cargo 10 009 568
5 568
223 000
9 781 000
Oil and oil productsDry bulkGeneral cargo
GothenburgTotal 2004
total cargo 16 356 008
268 000
17 008
16 071 000
Oil and oil productsDry bulkGeneral cargo
Fig. 3.8. Export and import and total cargo handled in the Ports of Klaipeda (Lithuania), Kiel (Germany), and Gothenburg (Sweden) in 2004.
Mediterranean Sea30%
North Sea27%
Baltic Sea20%
Atlantic Ocean14%
Black Sea5%
Other4%
Fig. 3.9. Short Sea Shipping in EU-15 countries by sea region in% of tonnes cargo in 2003.
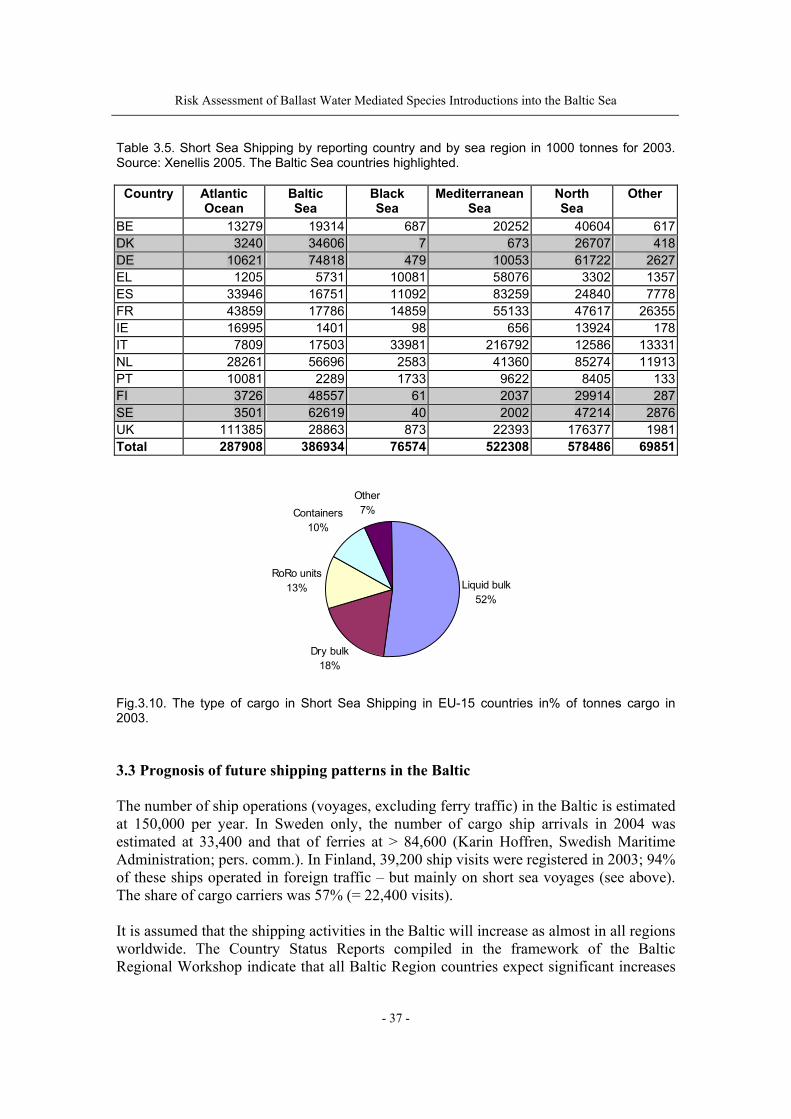
Risk Assessment of Ballast Water Mediated Species Introductions into the Baltic Sea
- 37 -
Table 3.5. Short Sea Shipping by reporting country and by sea region in 1000 tonnes for 2003. Source: Xenellis 2005. The Baltic Sea countries highlighted.
Country Atlantic Ocean
Baltic Sea
Black Sea
Mediterranean Sea
North Sea
Other
BE 13279 19314 687 20252 40604 617DK 3240 34606 7 673 26707 418DE 10621 74818 479 10053 61722 2627EL 1205 5731 10081 58076 3302 1357ES 33946 16751 11092 83259 24840 7778FR 43859 17786 14859 55133 47617 26355IE 16995 1401 98 656 13924 178IT 7809 17503 33981 216792 12586 13331NL 28261 56696 2583 41360 85274 11913PT 10081 2289 1733 9622 8405 133FI 3726 48557 61 2037 29914 287SE 3501 62619 40 2002 47214 2876UK 111385 28863 873 22393 176377 1981Total 287908 386934 76574 522308 578486 69851
Liquid bulk52%
Dry bulk18%
RoRo units13%
Containers10%
Other7%
Fig.3.10. The type of cargo in Short Sea Shipping in EU-15 countries in% of tonnes cargo in 2003. 3.3 Prognosis of future shipping patterns in the Baltic The number of ship operations (voyages, excluding ferry traffic) in the Baltic is estimated at 150,000 per year. In Sweden only, the number of cargo ship arrivals in 2004 was estimated at 33,400 and that of ferries at > 84,600 (Karin Hoffren, Swedish Maritime Administration; pers. comm.). In Finland, 39,200 ship visits were registered in 2003; 94% of these ships operated in foreign traffic – but mainly on short sea voyages (see above). The share of cargo carriers was 57% (= 22,400 visits). It is assumed that the shipping activities in the Baltic will increase as almost in all regions worldwide. The Country Status Reports compiled in the framework of the Baltic Regional Workshop indicate that all Baltic Region countries expect significant increases
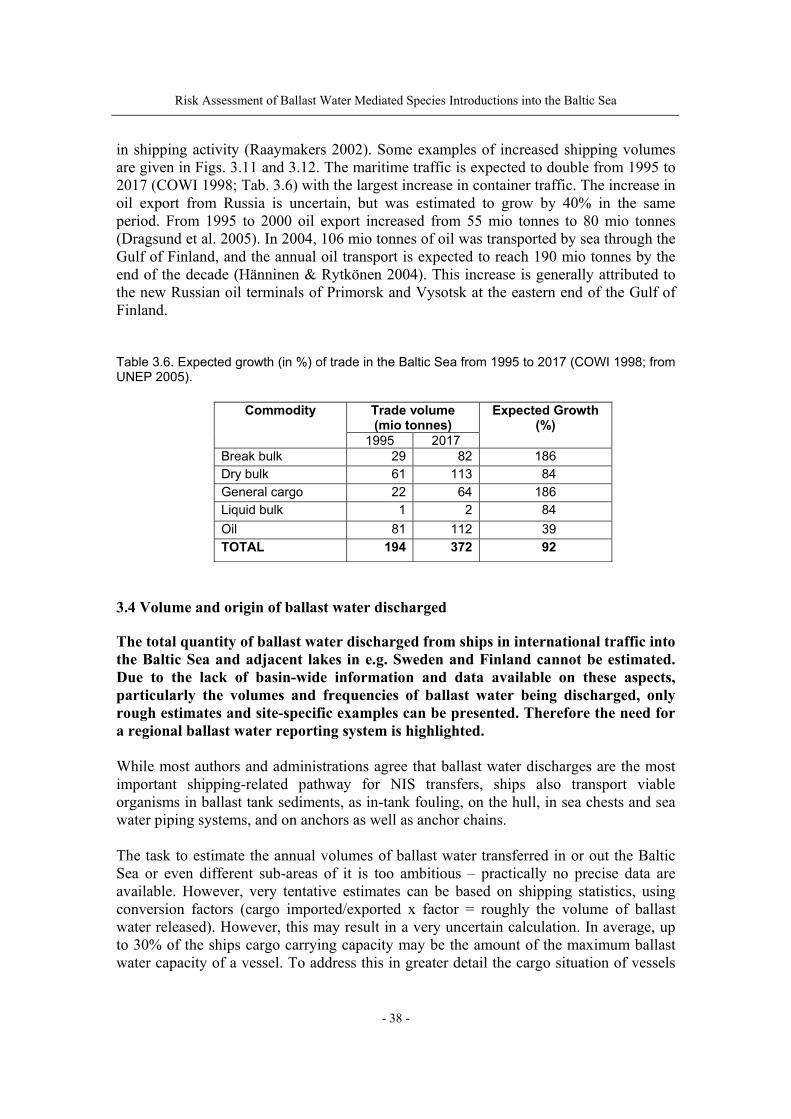
Risk Assessment of Ballast Water Mediated Species Introductions into the Baltic Sea
- 38 -
in shipping activity (Raaymakers 2002). Some examples of increased shipping volumes are given in Figs. 3.11 and 3.12. The maritime traffic is expected to double from 1995 to 2017 (COWI 1998; Tab. 3.6) with the largest increase in container traffic. The increase in oil export from Russia is uncertain, but was estimated to grow by 40% in the same period. From 1995 to 2000 oil export increased from 55 mio tonnes to 80 mio tonnes (Dragsund et al. 2005). In 2004, 106 mio tonnes of oil was transported by sea through the Gulf of Finland, and the annual oil transport is expected to reach 190 mio tonnes by the end of the decade (Hänninen & Rytkönen 2004). This increase is generally attributed to the new Russian oil terminals of Primorsk and Vysotsk at the eastern end of the Gulf of Finland. Table 3.6. Expected growth (in %) of trade in the Baltic Sea from 1995 to 2017 (COWI 1998; from UNEP 2005).
Trade volume (mio tonnes)
Commodity
1995 2017
Expected Growth (%)
Break bulk 29 82 186 Dry bulk 61 113 84 General cargo 22 64 186 Liquid bulk 1 2 84 Oil 81 112 39 TOTAL 194 372 92
3.4 Volume and origin of ballast water discharged The total quantity of ballast water discharged from ships in international traffic into the Baltic Sea and adjacent lakes in e.g. Sweden and Finland cannot be estimated. Due to the lack of basin-wide information and data available on these aspects, particularly the volumes and frequencies of ballast water being discharged, only rough estimates and site-specific examples can be presented. Therefore the need for a regional ballast water reporting system is highlighted. While most authors and administrations agree that ballast water discharges are the most important shipping-related pathway for NIS transfers, ships also transport viable organisms in ballast tank sediments, as in-tank fouling, on the hull, in sea chests and sea water piping systems, and on anchors as well as anchor chains. The task to estimate the annual volumes of ballast water transferred in or out the Baltic Sea or even different sub-areas of it is too ambitious – practically no precise data are available. However, very tentative estimates can be based on shipping statistics, using conversion factors (cargo imported/exported x factor = roughly the volume of ballast water released). However, this may result in a very uncertain calculation. In average, up to 30% of the ships cargo carrying capacity may be the amount of the maximum ballast water capacity of a vessel. To address this in greater detail the cargo situation of vessels
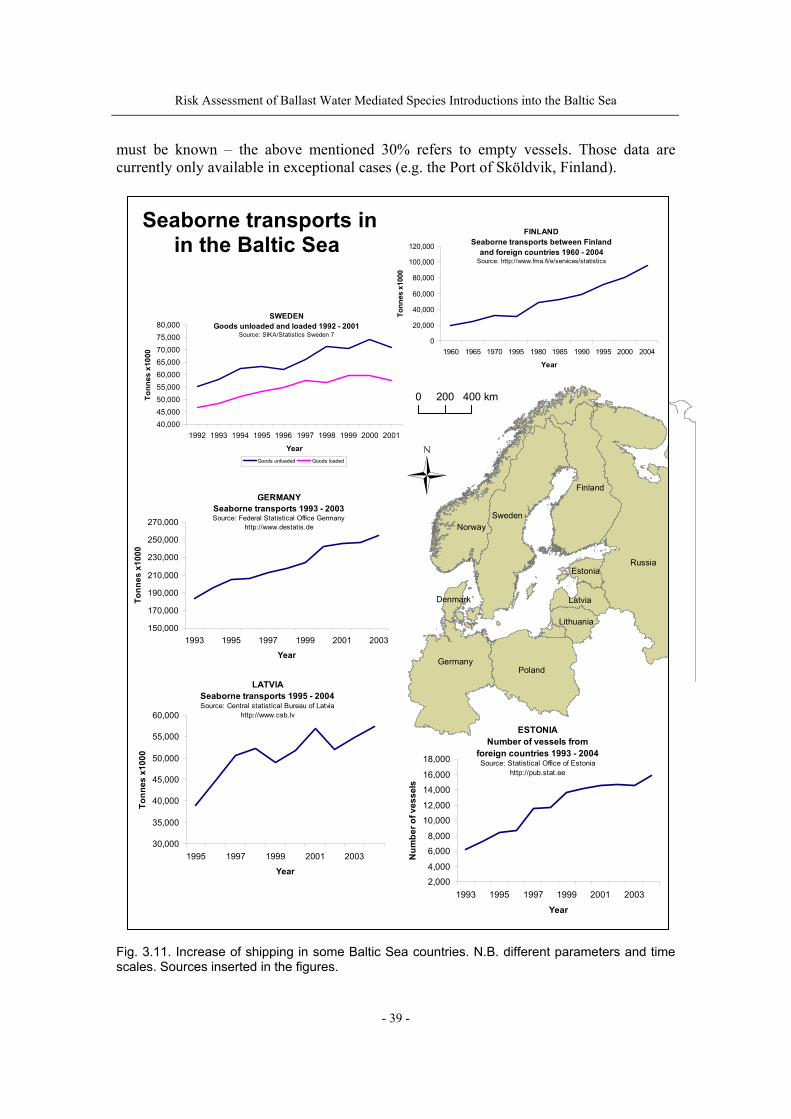
Risk Assessment of Ballast Water Mediated Species Introductions into the Baltic Sea
- 39 -
must be known – the above mentioned 30% refers to empty vessels. Those data are currently only available in exceptional cases (e.g. the Port of Sköldvik, Finland).
Finland
Sweden
Lithuania
Latvia
Estonia
PolandGermany
Denmark
Norway
Russia
0 200 400 km
Seaborne transports inin the Baltic Sea
FINLANDSeaborne transports between Finland
and foreign countries 1960 - 2004Source: http://www.fma.fi/e/services/statistics
0
20,000
40,000
60,000
80,000
100,000
120,000
1960 1965 1970 1995 1980 1985 1990 1995 2000 2004
Year
Tonn
es x
1000
SWEDENGoods unloaded and loaded 1992 - 2001
Source: SIKA/Statistics Sweden 7
40,00045,00050,00055,00060,00065,00070,00075,00080,000
1992 1993 1994 1995 1996 1997 1998 1999 2000 2001
Year
Tonn
es x
1000
Goods unloaded Goods loaded
LATVIASeaborne transports 1995 - 2004Source: Central statistical Bureau of Latvia
http://www.csb.lv
30,000
35,000
40,000
45,000
50,000
55,000
60,000
1995 1997 1999 2001 2003
Year
Tonn
es x
1000
GERMANYSeaborne transports 1993 - 2003Source: Federal Statistical Office Germany
http://www.destatis.de
150,000
170,000
190,000
210,000
230,000
250,000
270,000
1993 1995 1997 1999 2001 2003
Year
Tonn
es x
1000
ESTONIANumber of vessels from
foreign countries 1993 - 2004 Source: Statistical Office of Estonia
http://pub.stat.ee
2,000
4,000
6,000
8,000
10,000
12,000
14,000
16,000
18,000
1993 1995 1997 1999 2001 2003
Year
Num
ber o
f ves
sels
Fig. 3.11. Increase of shipping in some Baltic Sea countries. N.B. different parameters and time scales. Sources inserted in the figures.
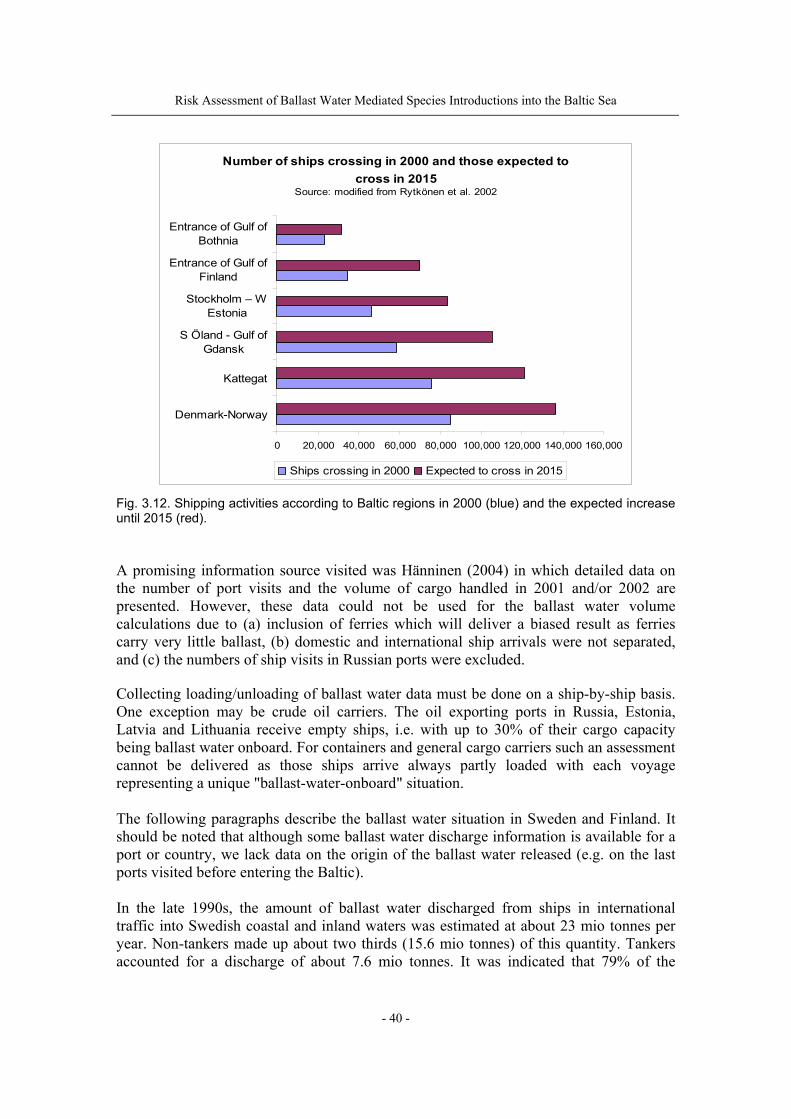
Risk Assessment of Ballast Water Mediated Species Introductions into the Baltic Sea
- 40 -
Number of ships crossing in 2000 and those expected to cross in 2015
Source: modified from Rytkönen et al. 2002
0 20,000 40,000 60,000 80,000 100,000 120,000 140,000 160,000
Denmark-Norway
Kattegat
S Öland - Gulf ofGdansk
Stockholm – WEstonia
Entrance of Gulf ofFinland
Entrance of Gulf ofBothnia
Ships crossing in 2000 Expected to cross in 2015
Fig. 3.12. Shipping activities according to Baltic regions in 2000 (blue) and the expected increase until 2015 (red). A promising information source visited was Hänninen (2004) in which detailed data on the number of port visits and the volume of cargo handled in 2001 and/or 2002 are presented. However, these data could not be used for the ballast water volume calculations due to (a) inclusion of ferries which will deliver a biased result as ferries carry very little ballast, (b) domestic and international ship arrivals were not separated, and (c) the numbers of ship visits in Russian ports were excluded. Collecting loading/unloading of ballast water data must be done on a ship-by-ship basis. One exception may be crude oil carriers. The oil exporting ports in Russia, Estonia, Latvia and Lithuania receive empty ships, i.e. with up to 30% of their cargo capacity being ballast water onboard. For containers and general cargo carriers such an assessment cannot be delivered as those ships arrive always partly loaded with each voyage representing a unique "ballast-water-onboard" situation. The following paragraphs describe the ballast water situation in Sweden and Finland. It should be noted that although some ballast water discharge information is available for a port or country, we lack data on the origin of the ballast water released (e.g. on the last ports visited before entering the Baltic). In the late 1990s, the amount of ballast water discharged from ships in international traffic into Swedish coastal and inland waters was estimated at about 23 mio tonnes per year. Non-tankers made up about two thirds (15.6 mio tonnes) of this quantity. Tankers accounted for a discharge of about 7.6 mio tonnes. It was indicated that 79% of the

Risk Assessment of Ballast Water Mediated Species Introductions into the Baltic Sea
- 41 -
international calls by tankers and 53% of those by non-tankers discharge ballast water. Tankers discharge on average 2,272 tonnes and non-tankers 1,634 tonnes of ballast water each time they call for a Swedish port (Magnusson 1998; Gollasch & Leppäkoski 1999 and references therein). In 2000 more than 14,000 oil tankers passed through the straits between Denmark and Sweden discharging roughly estimated 30 mio tonnes of ballast water in Baltic ports (Dragsund et al. 2005). Vessels calling at the Butinge oil terminal (Lithuania) are all in ballast and this terminal receives large volumes of ballast water. There is no any official estimate of volumes released at Butinge, but as the cargo turnover (oil) was 6.4 mio tonnes in 2004, the amount of ballast water can be estimated at ca. 2 mio tonnes. This is of particular importance as Butinge is the only off-shore oil terminal in the Baltic. For the sake of comparison, Olenin et al. (1999) estimated that 2-4 mio tonnes of ballast water are discharged in the Port of Klaipeda annually. Today's volumes are supposed to be higher (Olenin pers. comm.). Due to increasing volumes of cargo transported and future developments of new ports in the eastern Gulf of Finland (specially the Primorsk Oil Terminal, Russia, that started operation in December 2001) and further expansion of ports such as St. Petersburg and Muuga/Tallinn, a four-fold increase in oil transports in the Gulf of Finland was expected from 1994 to 2005, up to > 90 mio tonnes per year. This increase of sea traffic also means increased volumes of ballast water to be discharged in the Gulf of Finland. Assuming incoming oil tankers are empty and applying the above mentioned conversion factor an export of 90 mio tonnes of oil may result in 30 mio tonnes of ballast water being discharged. Therefore, the Gulf can be added to the list of "hot spots" receiving large amounts of ballast water, also acting as a potential donor area for transfer of NIS to other parts of the Baltic and/or to seas outside the Baltic area. In fact, if preventive actions are not implemented, accidental oil spills and "biological pollution" by NIS could be the most important environmental issues for the Gulf of Finland in the near future (Leppäkoski 2002). The only detailed country report available is for Sweden (Magnusson 1998) in which the estimations were based on the information received from questionnaires (254 ships of different types) and shipping statistics from 1996. The estimations indicate that about 23 mio tonnes ballast water was discharged per year from dry cargo ships and tankers (n = 22,200) in international traffic calling Swedish ports. For the Gulf of Finland, statistics (specially on liquid cargo transports) for 2002-2004 for all major harbours are summarized and available in Hänninen & Rytkönen (2004) and via Internet references in Hänninen (2004). Based on this data, only a rough estimate of likely amounts of ballast water discharged in different sub-areas of the Baltic could be calculated by adopting conversion factors if detailed information of the cargo status of the ships was available (see above). Estimating the volume of ballast water discharged in the Baltic Sea was defined as one of
Risk Assessment of Ballast Water Mediated Species Introductions into the Baltic Sea
- 42 -
the key issues in the Work Plan. However this appeared to be a "mission impossible" for several reasons. As mentioned repeatedly in this report, comparable shipping statistics for countries/individual ports were not available. There are too many uncertainties in the national reports to allow for an overall reliable assessment of ballast volumes:
(i) different parameters used in reports (e.g. number of ship arrivals, amount of cargo handled),
(ii) the share domestic/international/overseas traffic not specified, (iii) passenger ships (and even ferries) included/excluded, (iv) Norway included/excluded (being a HELCOM Contracting Party but not having
any seaports within the geographic Baltic Sea area), and (v) the very few data available are mostly based upon shipping details more than 5
years old (see Swedish example below). Shipping patterns change over time rapidly and therefore "older" data may result in a biased calculation.
To provide an estimate on ballast water discharges in the Baltic Sea the following approach was chosen. However, for the reasons as outlined above, the following calculations must be taken as a very preliminary attempt – the authors hope that the real figures do not differ by an order of magnitude! Assuming that
• the Swedish data for 1996 are representative for all the Baltic Sea ports with regard to the number of ships’ visits and types of vessels,
• the (obvious) differences between ships in international and domestic traffic can be omitted,
• the relative increase of RoRo ships and other NOBOB ships can be omitted, • the numbers of port calls given in Tab. 3.7 are reliable, and • the average increase since 1998 at 25% (16-35%) of shipping volume derived from
graphs in Fig. 3.11 is realistic, we calculated accordingly as follows: 22,200 ships (number of ships in the Swedish report) were estimated to discharge 23 mio tonnes of ballast water. Thus, the estimated number of all ships calling Baltic Sea ports is 65,000 (= 52,100 ships in 1998 (according to Tab. 3.7) + 25% increase until 2003-2004) and can be expected to discharge 68 mio tonnes of ballast water. An additional source of uncertainty is the export increase of Russian crude oil from the terminals in the eastern Baltic area (150 mio tonnes of crude oil exported in 2005; see Fig. 3.6). To reflect the increase in Russian crude oil export, we assume that 30% of the tanker cargo capacity may be filled with ballast water which is discharged when taking onboard crude oil. Consequently, in total 118 mio tonnes of ballast water may be discharged in the Baltic annually. It should be noted that when assessing the risk of NIS introductions, the ballast water quantity is of minor importance. Even small amounts of ballast water discharges pose a high risk when originating from source ports/port regions of matching environmental conditions with the receiving port.

Risk Assessment of Ballast Water Mediated Species Introductions into the Baltic Sea
- 43 -
It will remain a challenge to identify the source regions of ballast water discharged in the Baltic Sea. In order to identify high risk donor areas, shipping statistics need to be analysed to document all potential donor areas of NIS. However, most shipping statistics in Europe lack data on the source region of the vessels. The source regions indicated (if any) are mainly based on ships cargo. In some cases the last port of call is given, but this may well be another European port, such as the major hub ports in Europe, e.g. Rotterdam, Antwerp and Hamburg. Also, an indication of the source region of the vessel and/or last port of call does not provide information on the uptake region of the ballast water onboard. Table 3.7. Number of ship visits in the Baltic Sea ports in 1998 (modifies from Rytkönen et al. 2002).
Country1 Bulk/ comb
Tankers Gas General cargo
Container RoRo Total2
Sweden 446 3,002 241 8,382 648 1,831 14,550 Finland 362 1,128 53 3,904 374 2,086 7,907 Russia 240 411 1 2,291 179 143 3,265 Estonia 104 531 1 1,711 60 142 2,549 Latvia 357 490 53 1,969 67 237 3,173 Lithuania 168 118 0 929 17 146 1,378 Poland 478 707 55 2,544 168 230 4,182 Germany 197 388 10 2,601 20 955 4,171 Denmark 653 2,100 85 6,642 480 967 10,927 Total 3,005 8,875 499 30,973 2,013 6,737 52,102
1) Norway excluded; there are no Norwegian ports in the geographic Baltic Sea area 2) Passenger ships, reefers ((N=810) and other ships (N=130) excluded The amount of discharged ballast water gives an indication how exposed certain regions are to ballast water discharges. However, this figure is not equivalent to the risk these regions are exposed to. The risk of NIS invasions becomes clearer when comparing the salinity and temperature of donor and recipient region of ballast water (Chapter 4). Even if the amount of ballast water discharged is comparably small, when salinity and temperature of the donor and recipient region match the risk is relatively high. Due to the lack of data on ballast water discharge and uptake in the Baltic (quantitative data) we focus the risk assessment for NIS introduction on the environmental match of donor and recipient ports/port regions (qualitative match).
Risk Assessment of Ballast Water Mediated Species Introductions into the Baltic Sea
- 44 -
4 Potential donor and recipient regions of ballast water 4.1 Life in ballast tanks Today, ballast water is suggested as one key vector for introducing NIS. Sampling programmes of ballast water, carried out in Europe, revealed that nearly 1,000 taxa were found in arriving ships. The organism variety ranged from unicellular algae to fish. Ballast tank sediment has been recently recognised as a means of dispersal for algae and animals and especially their resting stages, all of which could be released when the sediment is removed untreated or may become resuspended at ballasting/deballasting or in case ballast water exchange is carried out. Any species transported in ballast tanks must survive the ballasting and deballasting processes in addition to the harsh conditions prevailing inside the ballast tanks21. Consequently, the species assemblage to reach the port where ballast water is discharged results from a stepwise process:
• uptake of the organisms dependent on water depths, time of day, season, algal blooms, i.e. availability of organisms to be taken onboard, propagule pressure,
• survival when passing the pumps during the ballasting and deballasting process, and • survival in tanks during the voyage.
The conditions prevailing in the ballast tanks can be described as follows:
(a) three main habitats are available in the ballast water tanks, free water mass, soft-bottom sediments, and hard substrates, i.e. the walls of the tank;
(b) the ballast water tank configuration influences the physical and chemical habitat diversity of living space and conditions in the tanks; and
(c) darkness, water often polluted (by e.g. oil), ships´ vibration, water temperature and oxygen conditions varying during the voyage.
4.1.1 Ballast water During the 14 European ship sampling studies considered here, a total of 1,508 samples (1,219 ballast water, 289 tank sediment) were collected on 550 ships. The total number of taxa identified during all completed shipping studies varied between 3 and 502 per study and the number of taxa identified overall was 990 (http://www.ku.lt/nemo/ EuroAquaInvaders.htm). The most frequently collected taxa were diatoms, harpacticoid copepods, rotifers, calanoid copepods, larvae of Gastropoda, Bivalvia and Polychaeta. The largest specimens found inside a ballast tank were sea lampreys (Petromyzon marinus) of 15 cm length.
21 For a review, see Gollasch et al. 2002.
Risk Assessment of Ballast Water Mediated Species Introductions into the Baltic Sea
- 45 -
4.1.2 Tank sediment The amount of sediment in the ballast tanks can reach several hundred tonnes. The maximum thickness of sediment known to be transported in ballast tanks reached more than 50 cm. The origin of sediment-bound organisms remains largely unknown, because tank sediments comprise a mixture of deposits accumulated over several years, loaded from a large number of different port areas. In addition, the fate of sediment-dwelling organisms is poorly understood, since a portion of the individuals is resuspended during ballasting operations and some may be pumped out at deballasting. Life in tank sediments has been studied in a few cases only. Obviously there is no published information available from the Baltic Sea area on the contents of macroscopic organisms in ballast tank sediments. In the early 1990s a shipping study was undertaken in Germany to assess species importations in ballast water, hull fouling and tank sediments into German ports. Here, macroscopic bottom-dwelling animals in tanks were studied. Sediment from the bottom of ballast tanks was sampled from 71 vessels and more than 100 taxa were collected (Gollasch 1996). During the only ballast tank study of meiofauna22 known from NW Europe (Radziejewska et al. 2004) a rich and viable meiofauna (up to hundreds per litre) was found even in the residual sediment left after cleaning the tanks of a bulk carrier sampled in Szczecin, Poland. The interior hard substrates, i.e. the ballast water tank walls and internal structures, such as platforms and support frames, act as a habitat for rich microbial assemblages. The biofilms formed on tank surfaces are rich in viruses, bacteria (pathogens among them) and dinoflagellate cysts that may be released with ballast water (Drake et al. 2005). 4.1.3 Ballast tank habitats and risk assessment As a result, it is strongly recommended to include all three ballast tank "habitats", i.e. water, surface fouling and sediments, into future risk assessments. However, this study has clearly shown the difficulties to gather ballast water data and it is assumed that data on in-tank fouling and tank sediments are even more difficult to gather. Consequently, with our today's knowledge, a risk assessment can only be undertaken – with all its limitations as outlined in this report – for NIS transported in ballast water. 4.2 Identification of shipping routes that pose a high risk of transferring invasive alien species into the Baltic Sea This chapter intends to provide information necessary for quantifying and understanding the role of shipping vectors for the introduction of alien species in ballast water into and within the Baltic Sea. The aim is to estimate shipping contacts to and from the Baltic Sea area and to determine the likelihood that a species will be 22 In this study a 0.03 mm mesh size sieve was used.
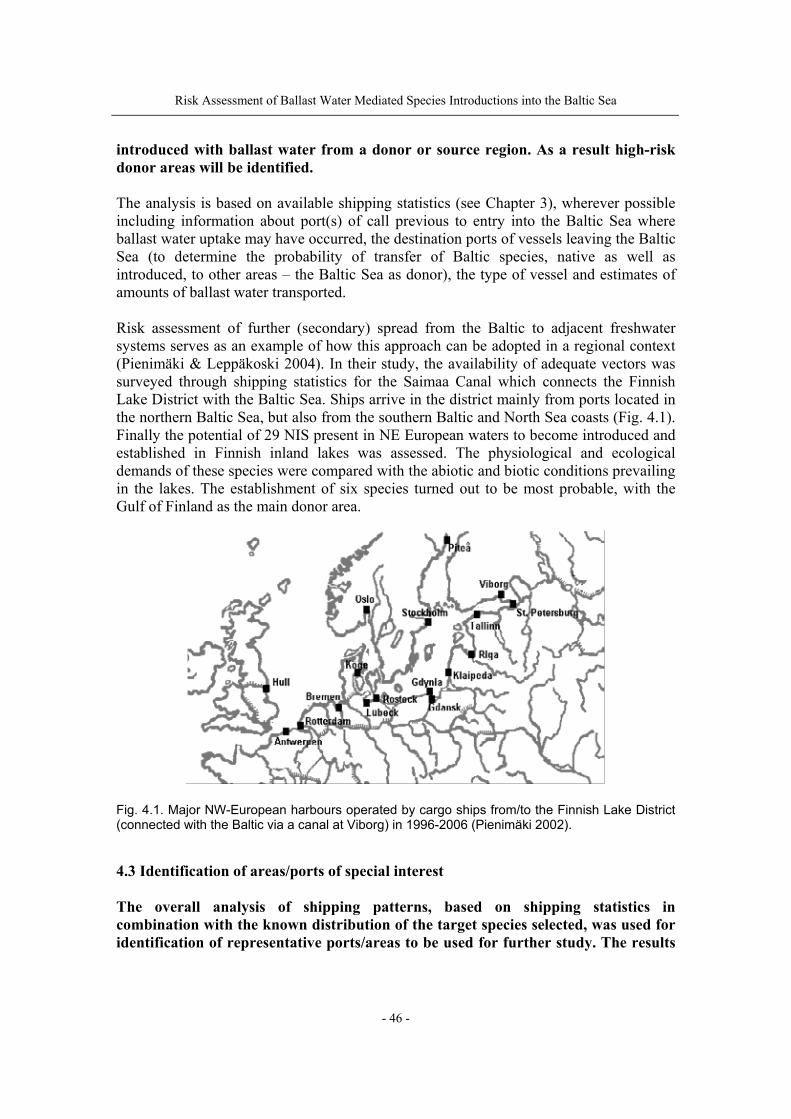
Risk Assessment of Ballast Water Mediated Species Introductions into the Baltic Sea
- 46 -
introduced with ballast water from a donor or source region. As a result high-risk donor areas will be identified. The analysis is based on available shipping statistics (see Chapter 3), wherever possible including information about port(s) of call previous to entry into the Baltic Sea where ballast water uptake may have occurred, the destination ports of vessels leaving the Baltic Sea (to determine the probability of transfer of Baltic species, native as well as introduced, to other areas – the Baltic Sea as donor), the type of vessel and estimates of amounts of ballast water transported. Risk assessment of further (secondary) spread from the Baltic to adjacent freshwater systems serves as an example of how this approach can be adopted in a regional context (Pienimäki & Leppäkoski 2004). In their study, the availability of adequate vectors was surveyed through shipping statistics for the Saimaa Canal which connects the Finnish Lake District with the Baltic Sea. Ships arrive in the district mainly from ports located in the northern Baltic Sea, but also from the southern Baltic and North Sea coasts (Fig. 4.1). Finally the potential of 29 NIS present in NE European waters to become introduced and established in Finnish inland lakes was assessed. The physiological and ecological demands of these species were compared with the abiotic and biotic conditions prevailing in the lakes. The establishment of six species turned out to be most probable, with the Gulf of Finland as the main donor area.
Fig. 4.1. Major NW-European harbours operated by cargo ships from/to the Finnish Lake District (connected with the Baltic via a canal at Viborg) in 1996-2006 (Pienimäki 2002). 4.3 Identification of areas/ports of special interest The overall analysis of shipping patterns, based on shipping statistics in combination with the known distribution of the target species selected, was used for identification of representative ports/areas to be used for further study. The results
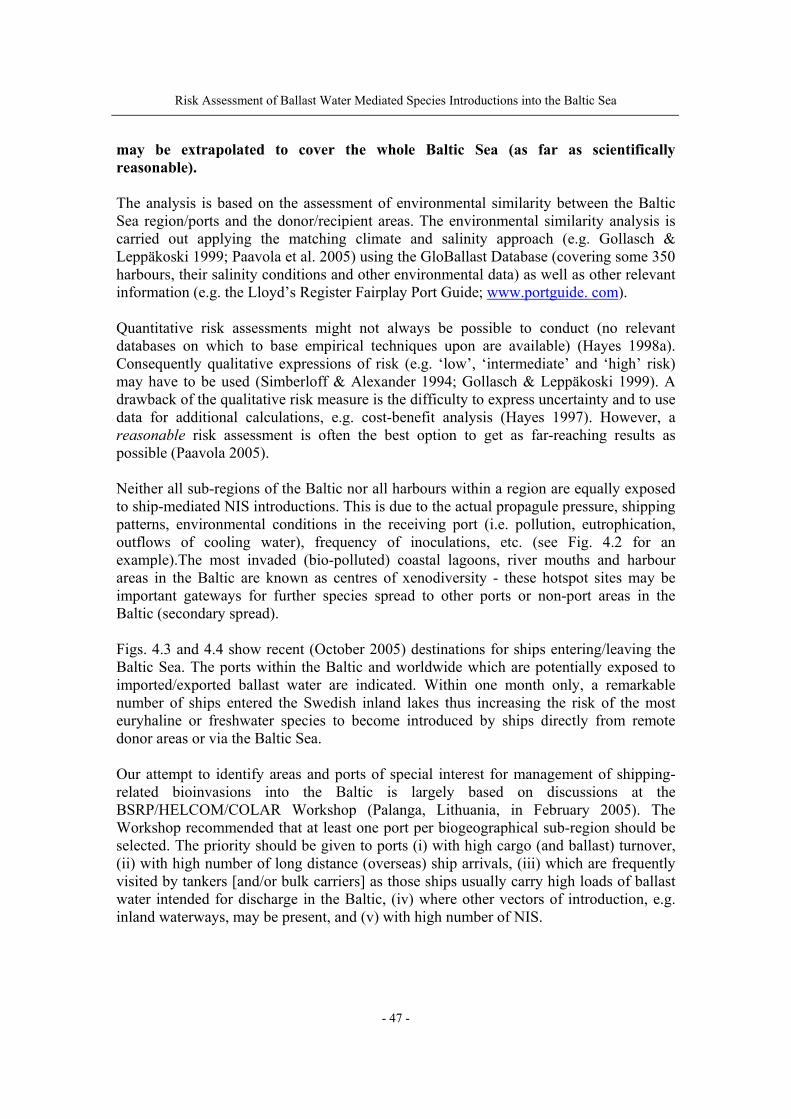
Risk Assessment of Ballast Water Mediated Species Introductions into the Baltic Sea
- 47 -
may be extrapolated to cover the whole Baltic Sea (as far as scientifically reasonable). The analysis is based on the assessment of environmental similarity between the Baltic Sea region/ports and the donor/recipient areas. The environmental similarity analysis is carried out applying the matching climate and salinity approach (e.g. Gollasch & Leppäkoski 1999; Paavola et al. 2005) using the GloBallast Database (covering some 350 harbours, their salinity conditions and other environmental data) as well as other relevant information (e.g. the Lloyd’s Register Fairplay Port Guide; www.portguide. com). Quantitative risk assessments might not always be possible to conduct (no relevant databases on which to base empirical techniques upon are available) (Hayes 1998a). Consequently qualitative expressions of risk (e.g. ‘low’, ‘intermediate’ and ‘high’ risk) may have to be used (Simberloff & Alexander 1994; Gollasch & Leppäkoski 1999). A drawback of the qualitative risk measure is the difficulty to express uncertainty and to use data for additional calculations, e.g. cost-benefit analysis (Hayes 1997). However, a reasonable risk assessment is often the best option to get as far-reaching results as possible (Paavola 2005). Neither all sub-regions of the Baltic nor all harbours within a region are equally exposed to ship-mediated NIS introductions. This is due to the actual propagule pressure, shipping patterns, environmental conditions in the receiving port (i.e. pollution, eutrophication, outflows of cooling water), frequency of inoculations, etc. (see Fig. 4.2 for an example).The most invaded (bio-polluted) coastal lagoons, river mouths and harbour areas in the Baltic are known as centres of xenodiversity - these hotspot sites may be important gateways for further species spread to other ports or non-port areas in the Baltic (secondary spread). Figs. 4.3 and 4.4 show recent (October 2005) destinations for ships entering/leaving the Baltic Sea. The ports within the Baltic and worldwide which are potentially exposed to imported/exported ballast water are indicated. Within one month only, a remarkable number of ships entered the Swedish inland lakes thus increasing the risk of the most euryhaline or freshwater species to become introduced by ships directly from remote donor areas or via the Baltic Sea. Our attempt to identify areas and ports of special interest for management of shipping-related bioinvasions into the Baltic is largely based on discussions at the BSRP/HELCOM/COLAR Workshop (Palanga, Lithuania, in February 2005). The Workshop recommended that at least one port per biogeographical sub-region should be selected. The priority should be given to ports (i) with high cargo (and ballast) turnover, (ii) with high number of long distance (overseas) ship arrivals, (iii) which are frequently visited by tankers [and/or bulk carriers] as those ships usually carry high loads of ballast water intended for discharge in the Baltic, (iv) where other vectors of introduction, e.g. inland waterways, may be present, and (v) with high number of NIS.
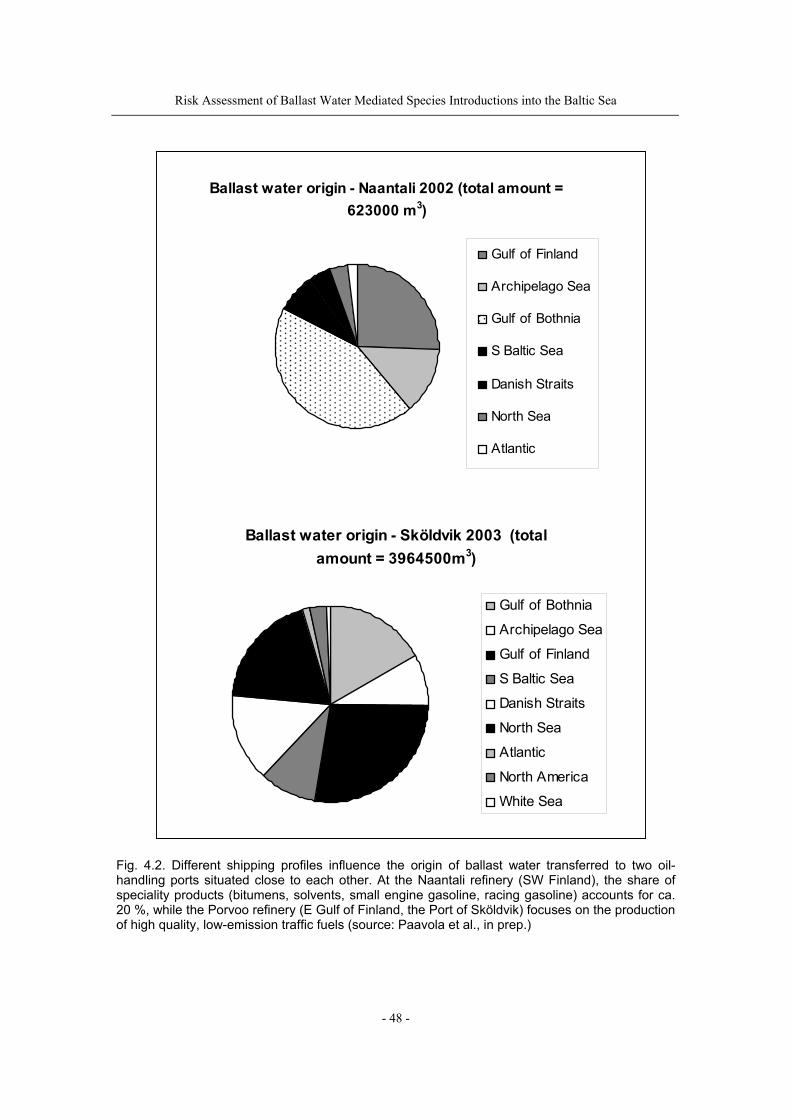
Risk Assessment of Ballast Water Mediated Species Introductions into the Baltic Sea
- 48 -
Ballast water origin - Naantali 2002 (total amount = 623000 m3)
Gulf of Finland
Archipelago Sea
Gulf of Bothnia
S Baltic Sea
Danish Straits
North Sea
Atlantic
Ballast water origin - Sköldvik 2003 (total amount = 3964500m3)
Gulf of Bothnia
Archipelago Sea
Gulf of Finland
S Baltic Sea
Danish Straits
North Sea
Atlantic
North America
White Sea
Fig. 4.2. Different shipping profiles influence the origin of ballast water transferred to two oil-handling ports situated close to each other. At the Naantali refinery (SW Finland), the share of speciality products (bitumens, solvents, small engine gasoline, racing gasoline) accounts for ca. 20 %, while the Porvoo refinery (E Gulf of Finland, the Port of Sköldvik) focuses on the production of high quality, low-emission traffic fuels (source: Paavola et al., in prep.)
Risk Assessment of Ballast Water Mediated Species Introductions into the Baltic Sea
- 49 -
Kokkola
Rauma
HelsinkiPorvoo Hamina
VysotskPrimorsk
St. Petersburg
Kronshtadt
Ust LugaMuugaTallinnPaldiski
Pärnu
Salacgriva
RigaVentspils
Rahja
Raahe
Oulu
Kemi
TornioLulea
Piteå
Holmsund
Husum
KubikenborgSundsvall
Gävle
Hanko
Turku
Dalsbruk
Uusikaupunki
PoriMantyluoto
Tahkoluoto
Kaskö
Pietarsaari
Kuopio
Liepaja
KlaipedaButinge
KlintehamnSlite
StorugnsVästervikFlivikOskarshamn
MönsteråsKalmarDegerhamn
Frederikshavn Gothenburg
Varberg
Halmstad
Helsingborg
KarlshamnMalmö
Kiel Rostock
Fredericia
AarhusRanders
Kalundborg
Uddevalla
Stenungsund
HallstavikVästerås
KopingBålsta
StockholmSödertälje
Nynäshamn
LandsortOxelosund
Braviken
Motala Storm
KaliningradGdyniaGdansk
Szczecin
SwinoujscieWolgast
GreifswaldStralsund
Rønne
WismarLubeck
Neustadt Hafn
Flensburg
Copenhagen
Vyborg
Ystad
Police
SvetliyBaltiysk
Gulfhavn
AssensKolding
Vejle
Koge
Hobro Mariager
Aalborg
Skagen HavnStranby
Falkenberg
Hoganas
Vargön
Lidkoping
GruvönKristinehamnSkoghall
Karlstad
Norrkoping
0 150 300km
Destination and numberof vessels entering
the Baltic in October 2005
1
2 - 10
10 - 50
> 50
The Skaw
Fig. 4.3. Ships entering the Baltic Sea in October 2005 (i.e. number and destinations of vessels passing the Skaw/Skagen). Derived from HELCOM AIS*.
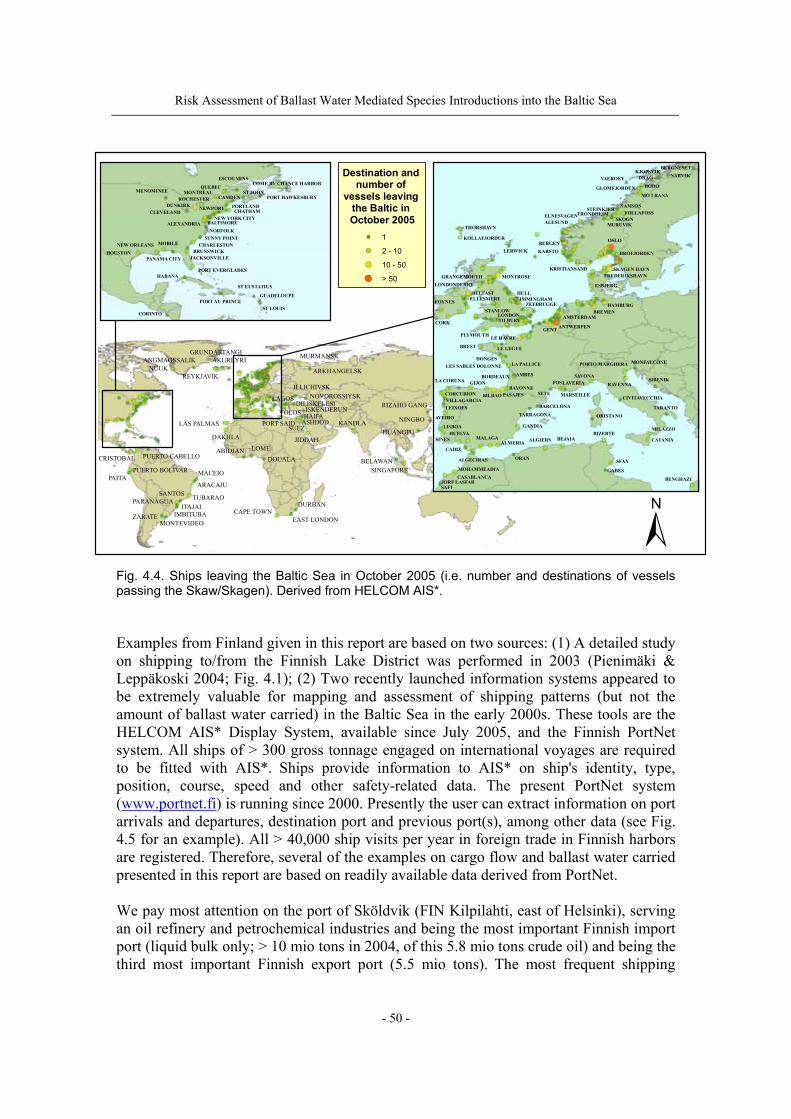
Risk Assessment of Ballast Water Mediated Species Introductions into the Baltic Sea
- 50 -
KANDLA
RIZAHO GANG
NINGBO
HUANGPU
SINGAPOREBELAWAN
DURBAN
EAST LONDONCAPE TOWN
MACEIO
ARACAJU
TUBARAO
ZARATEMONTEVIDEO
IMBITUBAITAJAI
PARANAGUASANTOS
PAITAPUERTO BOLIVAR
CRISTOBAL PUERTO CABELLO
NUUKANGMAGSSALIK
GRUNDARTANGI MURMANSK
ARKHANGELSK
DOUALA
LOMEABIDJAN
REYKJAVIK
AKUREYRI
DAKHLA
LAS PALMAS
NOVOROSSIYSKILLICHIVSK
ISKENDERUNDILISKELESI
SUEZ
JIDDAH
VOLOS
LAGOS
ASHDODHAIFA
PORT SAID
BERGNESETNARVIK
KJOPSVIKDRAGVAEROEY
BODOGLOMFJORDENMO I RANA
FOLLAFOSSNAMSOS
STEINKJER
SKOGNMURUVIK
TRONDHEIMELNESVAGENALESUND
BERGENKARSTO
OSLO
BROFJORDEN
KRISTIANSAND SKAGEN HAVNFREDERIKSHAVN
HAMBURGBREMEN
AMSTERDAM
ANTWERPEN
BILBAO PASAJESBAYONNE
BORDEAUX AMBES
LA PALLICELES SABLES DOLONNEDONGES
BREST LE LEGUE
LE HAVRE
ZEEBRUGGE
GENT
MONTROSEGRANGEMOUTH
BELFAST
PORTO MARGHERA
RAVENNA
SAVONAFOSLAVERIA
MARSEILLESETE
MONFALCONE
SIBENIK
BENGHAZI
TARANTO
MILAZZO
CATANIA
CIVITAVECCHIA
BIZERTE
SFAX
GABES
BEJAIAALGIERS
ORAN
GANDIA
TARRAGONA
BARCELONA
ALMERIAMALAGA
CASABLANCAJORF LASFARSAFI
MOHAMMEADIA
SINES
LISBOA
AVEIRO
LEIXOESVILLAGARCIACORCUBION
GIJONLA CORUNA
PLYMOUTH
CORK
FOYNES
STANLOW
ELLESMERE
ESBJERG
ORISTANO
KOLLAFJORDUR
THORSHAVN
LERWICK
HUELVA
CADIZ
ALGECIRAS
LONDONTILBURY
LONDONDERRY
HULLIMMINGHAM
COME BY CHANCE HARBOR
PORT HAWKESBURYMENOMINEE
HOUSTONNEW ORLEANS MOBILE
PANAMA CITY
GUADELOUPE
ST LOUIS
ST EUSTATIUS
PORT AU PRINCE
CORINTO
HABANAPORT EVERGLADES
JACKSONVILLEBRUNSWICK
CHARLESTONSUNNY POINT
NORFOLK
CLEVELAND
ESCOUMINS
QUEBECMONTREAL
ROCHESTERDUNKIRK
ST JOHN
CHATHAMPORTLAND
CAMDEN
ALEXANDRIA BALTIMORENEW YORK CITY
NEWPORT
Destination and number of
vessels leaving the Baltic in October 2005
1
2 - 10
10 - 50
> 50
Fig. 4.4. Ships leaving the Baltic Sea in October 2005 (i.e. number and destinations of vessels passing the Skaw/Skagen). Derived from HELCOM AIS*. Examples from Finland given in this report are based on two sources: (1) A detailed study on shipping to/from the Finnish Lake District was performed in 2003 (Pienimäki & Leppäkoski 2004; Fig. 4.1); (2) Two recently launched information systems appeared to be extremely valuable for mapping and assessment of shipping patterns (but not the amount of ballast water carried) in the Baltic Sea in the early 2000s. These tools are the HELCOM AIS* Display System, available since July 2005, and the Finnish PortNet system. All ships of > 300 gross tonnage engaged on international voyages are required to be fitted with AIS*. Ships provide information to AIS* on ship's identity, type, position, course, speed and other safety-related data. The present PortNet system (www.portnet.fi) is running since 2000. Presently the user can extract information on port arrivals and departures, destination port and previous port(s), among other data (see Fig. 4.5 for an example). All > 40,000 ship visits per year in foreign trade in Finnish harbors are registered. Therefore, several of the examples on cargo flow and ballast water carried presented in this report are based on readily available data derived from PortNet. We pay most attention on the port of Sköldvik (FIN Kilpilahti, east of Helsinki), serving an oil refinery and petrochemical industries and being the most important Finnish import port (liquid bulk only; > 10 mio tons in 2004, of this 5.8 mio tons crude oil) and being the third most important Finnish export port (5.5 mio tons). The most frequent shipping
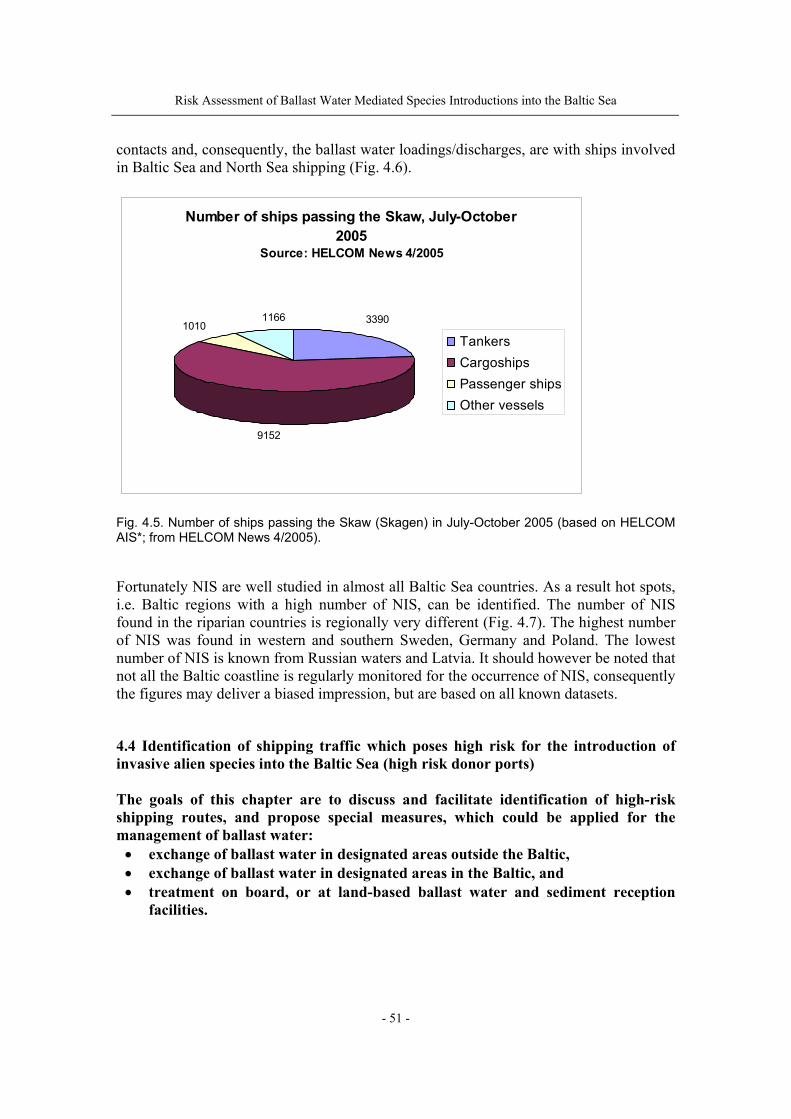
Risk Assessment of Ballast Water Mediated Species Introductions into the Baltic Sea
- 51 -
contacts and, consequently, the ballast water loadings/discharges, are with ships involved in Baltic Sea and North Sea shipping (Fig. 4.6).
Number of ships passing the Skaw, July-October 2005
Source: HELCOM News 4/2005
10101166 3390
9152
Tankers CargoshipsPassenger shipsOther vessels
Fig. 4.5. Number of ships passing the Skaw (Skagen) in July-October 2005 (based on HELCOM AIS*; from HELCOM News 4/2005). Fortunately NIS are well studied in almost all Baltic Sea countries. As a result hot spots, i.e. Baltic regions with a high number of NIS, can be identified. The number of NIS found in the riparian countries is regionally very different (Fig. 4.7). The highest number of NIS was found in western and southern Sweden, Germany and Poland. The lowest number of NIS is known from Russian waters and Latvia. It should however be noted that not all the Baltic coastline is regularly monitored for the occurrence of NIS, consequently the figures may deliver a biased impression, but are based on all known datasets. 4.4 Identification of shipping traffic which poses high risk for the introduction of invasive alien species into the Baltic Sea (high risk donor ports) The goals of this chapter are to discuss and facilitate identification of high-risk shipping routes, and propose special measures, which could be applied for the management of ballast water:
• exchange of ballast water in designated areas outside the Baltic, • exchange of ballast water in designated areas in the Baltic, and • treatment on board, or at land-based ballast water and sediment reception
facilities.
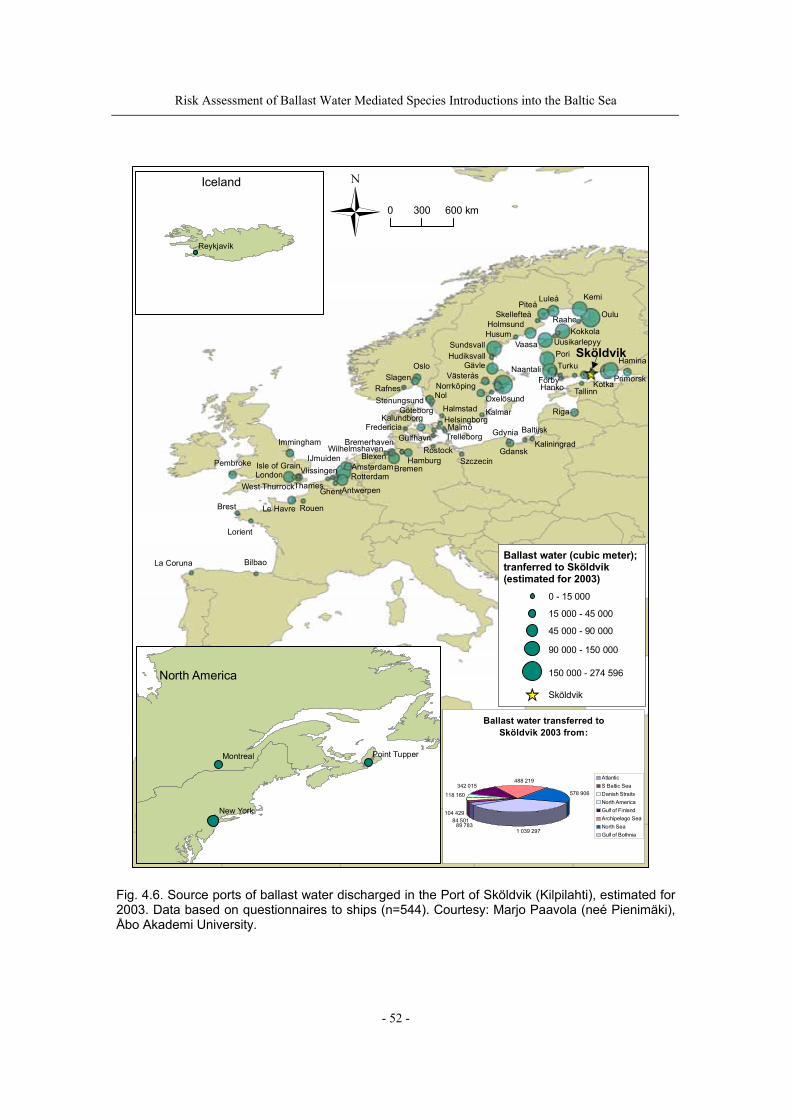
Risk Assessment of Ballast Water Mediated Species Introductions into the Baltic Sea
- 52 -
Sköldvik
Immingham
PembrokeLondon
West Thurrock
Isle of Grain
Thames
Brest Le Havre Rouen
Antwerpen
RotterdamBremen
Blexen
Bremerhaven
HamburgWilhelmshaven
AmsterdamIJmuiden
Ghent
VlissingenSzczecin
Rostock
FredericiaKalundborg
Gulfhavn TrelleborgMalmö
HelsingborgHalmstad Kalmar
Gdansk
Gdynia Baltijsk
Kaliningrad
Stenungsund
OsloSlagen
Rafnes NorrköpingNol
GöteborgOxelösund
VästeråsGävle
HudiksvallSundsvall
HusumHolmsund
SkellefteåPiteå
Luleå
VaasaKokkola
PoriTurkuNaantali
HankoFörby
Riga
Tallinn
Hamina
KotkaPrimorsk
Oulu
Kemi
Raahe
Uusikarlepyy
Lorient
BilbaoLa Coruna
New York
Montreal Point Tupper
Reykjavík
Ballast water (cubic meter); tranferred to Sköldvik (estimated for 2003)
0 - 15 000
15 000 - 45 000
45 000 - 90 000
90 000 - 150 000
150 000 - 274 596
Sköldvik
0 300 600 km
Iceland
North America
Ballast water transferred to Sköldvik 2003 from:
84 50189 783
104 429
118 160
342 015488 219
578 906
1 039 297
AtlanticS Baltic SeaDanish StraitsNorth AmericaGulf of FinlandArchipelago SeaNorth SeaGulf of Bothnia
Fig. 4.6. Source ports of ballast water discharged in the Port of Sköldvik (Kilpilahti), estimated for 2003. Data based on questionnaires to ships (n=544). Courtesy: Marjo Paavola (neé Pienimäki), Åbo Akademi University.
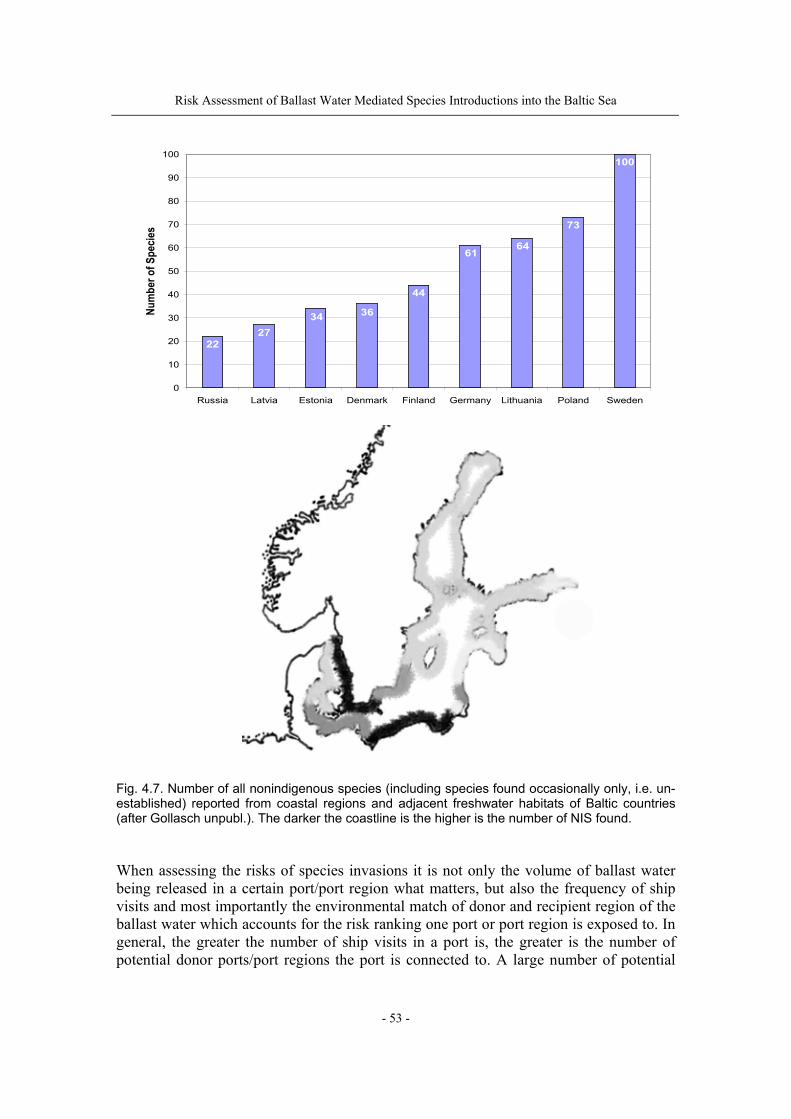
Risk Assessment of Ballast Water Mediated Species Introductions into the Baltic Sea
- 53 -
2227
34 36
44
6164
73
100
0
10
20
30
40
50
60
70
80
90
100
Russia Latvia Estonia Denmark Finland Germany Lithuania Poland Sweden
Num
ber o
f Spe
cies
Fig. 4.7. Number of all nonindigenous species (including species found occasionally only, i.e. un-established) reported from coastal regions and adjacent freshwater habitats of Baltic countries (after Gollasch unpubl.). The darker the coastline is the higher is the number of NIS found. When assessing the risks of species invasions it is not only the volume of ballast water being released in a certain port/port region what matters, but also the frequency of ship visits and most importantly the environmental match of donor and recipient region of the ballast water which accounts for the risk ranking one port or port region is exposed to. In general, the greater the number of ship visits in a port is, the greater is the number of potential donor ports/port regions the port is connected to. A large number of potential
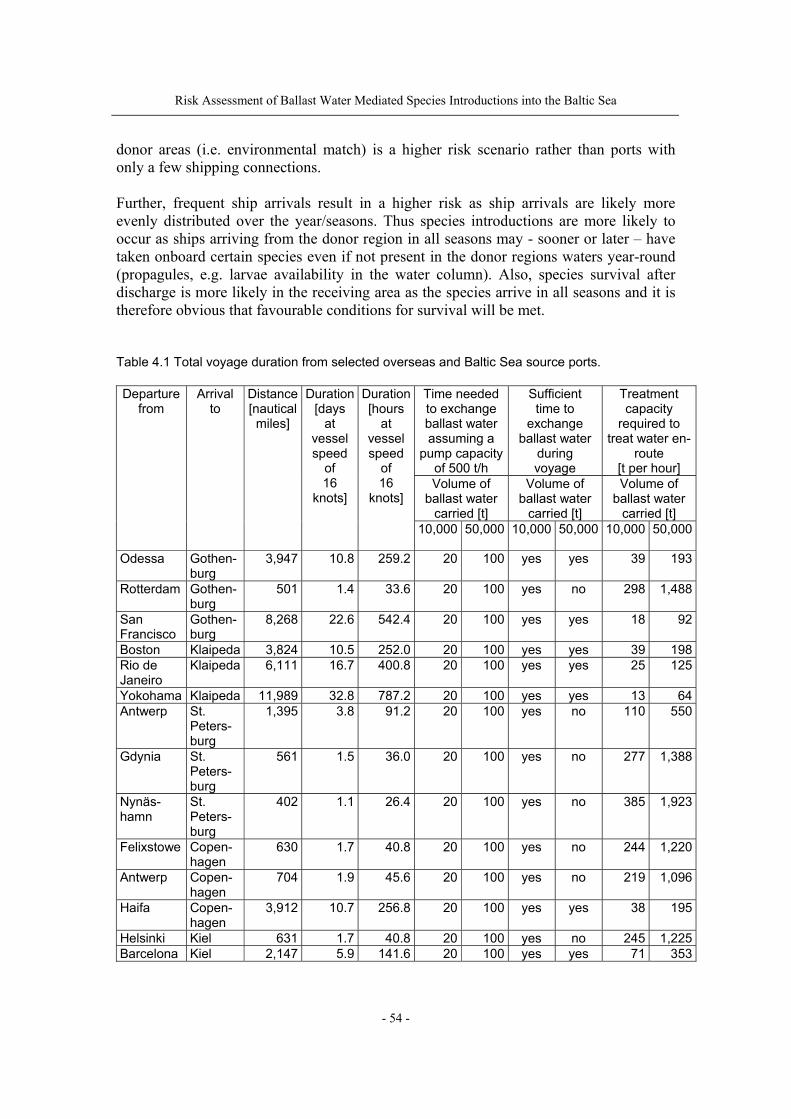
Risk Assessment of Ballast Water Mediated Species Introductions into the Baltic Sea
- 54 -
donor areas (i.e. environmental match) is a higher risk scenario rather than ports with only a few shipping connections. Further, frequent ship arrivals result in a higher risk as ship arrivals are likely more evenly distributed over the year/seasons. Thus species introductions are more likely to occur as ships arriving from the donor region in all seasons may - sooner or later – have taken onboard certain species even if not present in the donor regions waters year-round (propagules, e.g. larvae availability in the water column). Also, species survival after discharge is more likely in the receiving area as the species arrive in all seasons and it is therefore obvious that favourable conditions for survival will be met. Table 4.1 Total voyage duration from selected overseas and Baltic Sea source ports.
Time needed to exchange ballast water assuming a
pump capacity of 500 t/h
Sufficient time to
exchange ballast water
during voyage
Treatment capacity
required to treat water en-
route [t per hour]
Volume of ballast water
carried [t]
Volume of ballast water
carried [t]
Volume of ballast water
carried [t]
Departure from
Arrival to
Distance [nautical miles]
Duration[days
at vessel speed
of 16
knots]
Duration[hours
at vessel speed
of 16
knots]
10,000 50,000 10,000 50,000 10,000 50,000
Odessa Gothen-burg
3,947 10.8 259.2 20 100 yes yes 39 193
Rotterdam Gothen-burg
501 1.4 33.6 20 100 yes no 298 1,488
San Francisco
Gothen-burg
8,268 22.6 542.4 20 100 yes yes 18 92
Boston Klaipeda 3,824 10.5 252.0 20 100 yes yes 39 198Rio de Janeiro
Klaipeda 6,111 16.7 400.8 20 100 yes yes 25 125
Yokohama Klaipeda 11,989 32.8 787.2 20 100 yes yes 13 64Antwerp St.
Peters-burg
1,395 3.8 91.2 20 100 yes no 110 550
Gdynia St. Peters-burg
561 1.5 36.0 20 100 yes no 277 1,388
Nynäs-hamn
St. Peters-burg
402 1.1 26.4 20 100 yes no 385 1,923
Felixstowe Copen-hagen
630 1.7 40.8 20 100 yes no 244 1,220
Antwerp Copen-hagen
704 1.9 45.6 20 100 yes no 219 1,096
Haifa Copen-hagen
3,912 10.7 256.8 20 100 yes yes 38 195
Helsinki Kiel 631 1.7 40.8 20 100 yes no 245 1,225Barcelona Kiel 2,147 5.9 141.6 20 100 yes yes 71 353
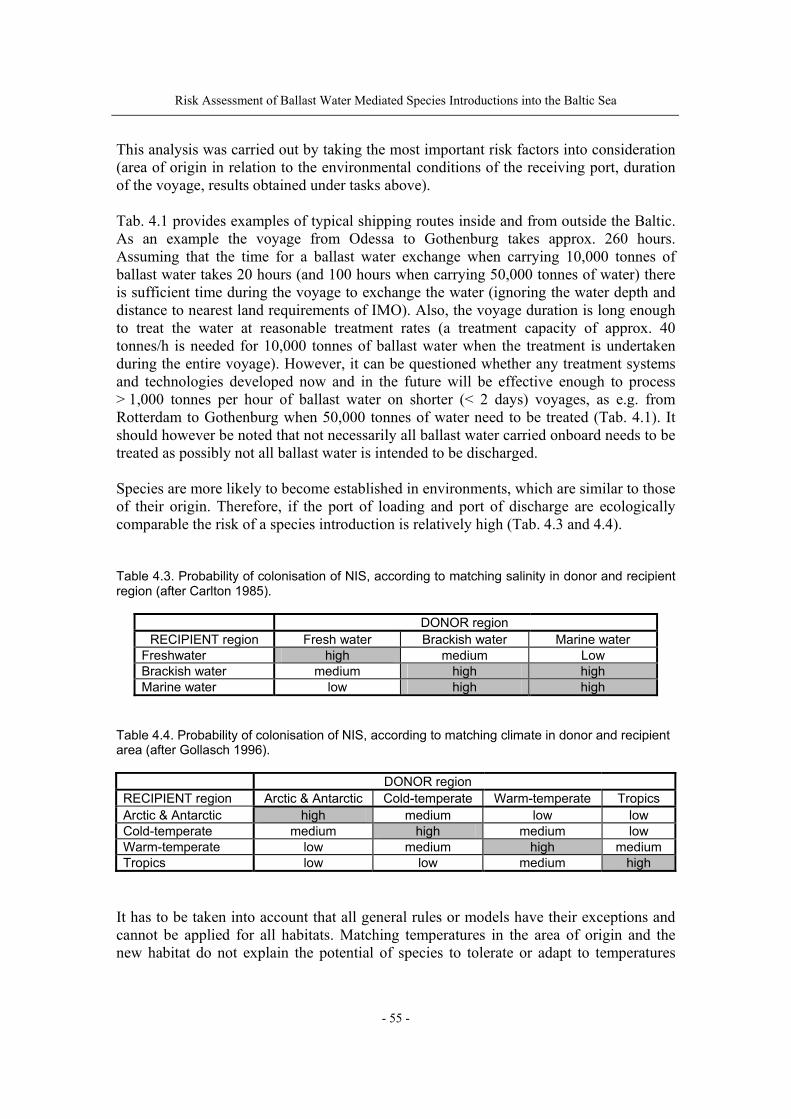
Risk Assessment of Ballast Water Mediated Species Introductions into the Baltic Sea
- 55 -
This analysis was carried out by taking the most important risk factors into consideration (area of origin in relation to the environmental conditions of the receiving port, duration of the voyage, results obtained under tasks above). Tab. 4.1 provides examples of typical shipping routes inside and from outside the Baltic. As an example the voyage from Odessa to Gothenburg takes approx. 260 hours. Assuming that the time for a ballast water exchange when carrying 10,000 tonnes of ballast water takes 20 hours (and 100 hours when carrying 50,000 tonnes of water) there is sufficient time during the voyage to exchange the water (ignoring the water depth and distance to nearest land requirements of IMO). Also, the voyage duration is long enough to treat the water at reasonable treatment rates (a treatment capacity of approx. 40 tonnes/h is needed for 10,000 tonnes of ballast water when the treatment is undertaken during the entire voyage). However, it can be questioned whether any treatment systems and technologies developed now and in the future will be effective enough to process > 1,000 tonnes per hour of ballast water on shorter (< 2 days) voyages, as e.g. from Rotterdam to Gothenburg when 50,000 tonnes of water need to be treated (Tab. 4.1). It should however be noted that not necessarily all ballast water carried onboard needs to be treated as possibly not all ballast water is intended to be discharged. Species are more likely to become established in environments, which are similar to those of their origin. Therefore, if the port of loading and port of discharge are ecologically comparable the risk of a species introduction is relatively high (Tab. 4.3 and 4.4). Table 4.3. Probability of colonisation of NIS, according to matching salinity in donor and recipient region (after Carlton 1985).
DONOR region RECIPIENT region Fresh water Brackish water Marine water
Freshwater high medium Low Brackish water medium high high Marine water low high high
Table 4.4. Probability of colonisation of NIS, according to matching climate in donor and recipient area (after Gollasch 1996). DONOR region RECIPIENT region Arctic & Antarctic Cold-temperate Warm-temperate Tropics Arctic & Antarctic high medium low low Cold-temperate medium high medium low Warm-temperate low medium high medium Tropics low low medium high
It has to be taken into account that all general rules or models have their exceptions and cannot be applied for all habitats. Matching temperatures in the area of origin and the new habitat do not explain the potential of species to tolerate or adapt to temperatures
Risk Assessment of Ballast Water Mediated Species Introductions into the Baltic Sea
- 56 -
uncommon to its native range. A well-known example is the ship-boring mussel Teredo navalis (shipworm). It is believed to be of tropical origin and introduced with wooden sailing vessels. Nowadays the species occurs and causes damages to wooden man-made installations in warm-temperate and even in cold-temperate climates. The first documented record in Europe was a mass occurrence of the species resulting in heavy damages to tide protection installations, quays and wharves along the coasts of the Netherlands, Germany and Denmark in the 1730s. The species was often found in the western Baltic Sea due to secondary introductions by ships or saltwater inflows from the North Sea. Until the early 1990s no self-reproducing population was observed in the Baltic Sea. Most recently larvae of the shipworm were found from the eastern German Baltic coast, indicating a self-reproducing population. Similarly, the unexpected increase of mussels, believed to be zebra mussels, since 2003 off the Finnish nuclear power plant in Lovisa, eastern Gulf of Finland, was shown to be due to the recently invaded dark false mussels (Mytilopsis leucophaeata), a species previously not reported from the brackish Baltic Sea (Laine et al. 2006). This mussel species is native to the Gulf of Mexico area; being a warm water species it obviously benefits from the elevated water temperature off the cooling water outlet of the power plant. Both species were surprisingly able to adapt to cold climates and to lower salinities of brackish waters. None of the established risk assessment models of today would have quoted these species on the list of target, hot spot species for the introduction into cold-temperate and brackish waters due to non-matching climate and salinity regimes of donor and recipeint region.
Risk Assessment of Ballast Water Mediated Species Introductions into the Baltic Sea
- 57 -
5 Risk assessment results This chapter documents the chosen risk assessment approach (see also Annex 1) and also provides results from the risk assessment for the ports selected. 5.1 Ballast water management and risk assessment Several ballast water management options have been discussed and evaluated (Matheickal et al. 2004 for a review of ongoing technical efforts). In the absence of approved ballast water treatment systems, the following options may be considered:
• land-based port reception facilities for untreated ballast water. This option may only be useful in certain ports with certain types of cargo, e.g. smaller ports handling predominantly crude oil or other fluid cargo may be candidates for reception facilities as pipework is already installed and instead of cargo, ballast water may also be discharged to land-based facilities using this pipework. However, it should be noted that ballast water transported in oil cargo compartments may be contaminated by unpumpable oil, which cannot be discharged, and therefore this option needs to be critically reviewed,
• oceanic ballast water exchange (BWE) for vessels that pass through waters that are at least 200 nm (or 50 nm) from nearest land and at the same time are at least 200 m in depth (see IMO requirements for BWE). It should be noted that this is only recommended when time is sufficient to complete the ballast water exchange. Partly exchanged ballast water may "refresh" the water in the tank resulting in species survival and is therefore not acceptable,
• identification of ballast water exchange zones, i.e. zones where it is believed that the exchange of unmanaged/untreated ballast water causes at best no harm although these areas may not meet the depth and distance requirements (see above). Ballast water exchange in designated areas may reduce but not eliminate the risk of species introductions, but is a better approach rather than to discharge untreated ballast water in a port. The invasion risk may be reduced when e.g. offshore-directed currents dominate. However, it is supposed that no ballast water exchange zone of sufficient dimension to allow for complete ballast water exchange can be identified in the Baltic as the waters are mostly too shallow to assume a risk reducing effect. Also outside the Baltic Sea (but within Europe) BWE seems to be difficult to be carried out, and BWE zones maybe even impossible to be identified noting the following requirements: • to avoid voyage deviation, • to ensure efficient "dilution", and • to avoid the risk for secondary species introductions.
Consequently, WGBOSV (2005) highlighted the need for efficient:
• ballast water treatment systems, and • risk assessment approaches to apply relevant requirements for high-risk vessels
only.
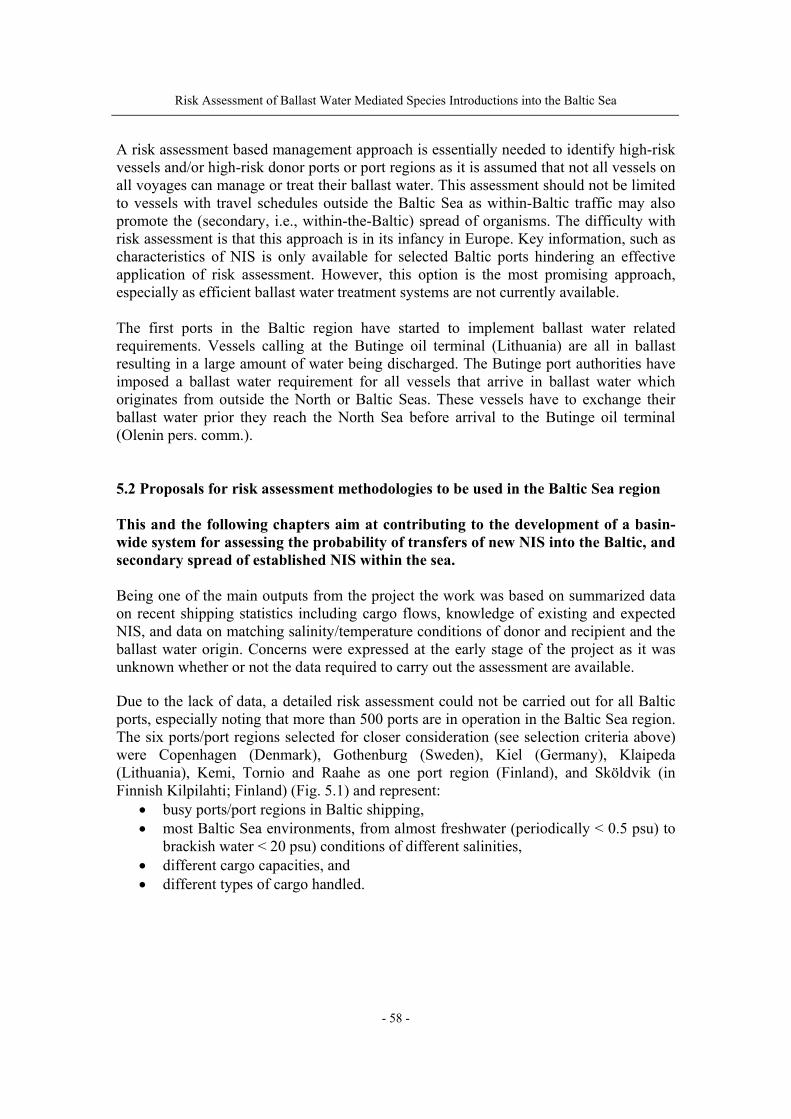
Risk Assessment of Ballast Water Mediated Species Introductions into the Baltic Sea
- 58 -
A risk assessment based management approach is essentially needed to identify high-risk vessels and/or high-risk donor ports or port regions as it is assumed that not all vessels on all voyages can manage or treat their ballast water. This assessment should not be limited to vessels with travel schedules outside the Baltic Sea as within-Baltic traffic may also promote the (secondary, i.e., within-the-Baltic) spread of organisms. The difficulty with risk assessment is that this approach is in its infancy in Europe. Key information, such as characteristics of NIS is only available for selected Baltic ports hindering an effective application of risk assessment. However, this option is the most promising approach, especially as efficient ballast water treatment systems are not currently available.
The first ports in the Baltic region have started to implement ballast water related requirements. Vessels calling at the Butinge oil terminal (Lithuania) are all in ballast resulting in a large amount of water being discharged. The Butinge port authorities have imposed a ballast water requirement for all vessels that arrive in ballast water which originates from outside the North or Baltic Seas. These vessels have to exchange their ballast water prior they reach the North Sea before arrival to the Butinge oil terminal (Olenin pers. comm.). 5.2 Proposals for risk assessment methodologies to be used in the Baltic Sea region This and the following chapters aim at contributing to the development of a basin-wide system for assessing the probability of transfers of new NIS into the Baltic, and secondary spread of established NIS within the sea. Being one of the main outputs from the project the work was based on summarized data on recent shipping statistics including cargo flows, knowledge of existing and expected NIS, and data on matching salinity/temperature conditions of donor and recipient and the ballast water origin. Concerns were expressed at the early stage of the project as it was unknown whether or not the data required to carry out the assessment are available. Due to the lack of data, a detailed risk assessment could not be carried out for all Baltic ports, especially noting that more than 500 ports are in operation in the Baltic Sea region. The six ports/port regions selected for closer consideration (see selection criteria above) were Copenhagen (Denmark), Gothenburg (Sweden), Kiel (Germany), Klaipeda (Lithuania), Kemi, Tornio and Raahe as one port region (Finland), and Sköldvik (in Finnish Kilpilahti; Finland) (Fig. 5.1) and represent:
• busy ports/port regions in Baltic shipping, • most Baltic Sea environments, from almost freshwater (periodically < 0.5 psu) to
brackish water < 20 psu) conditions of different salinities, • different cargo capacities, and • different types of cargo handled.
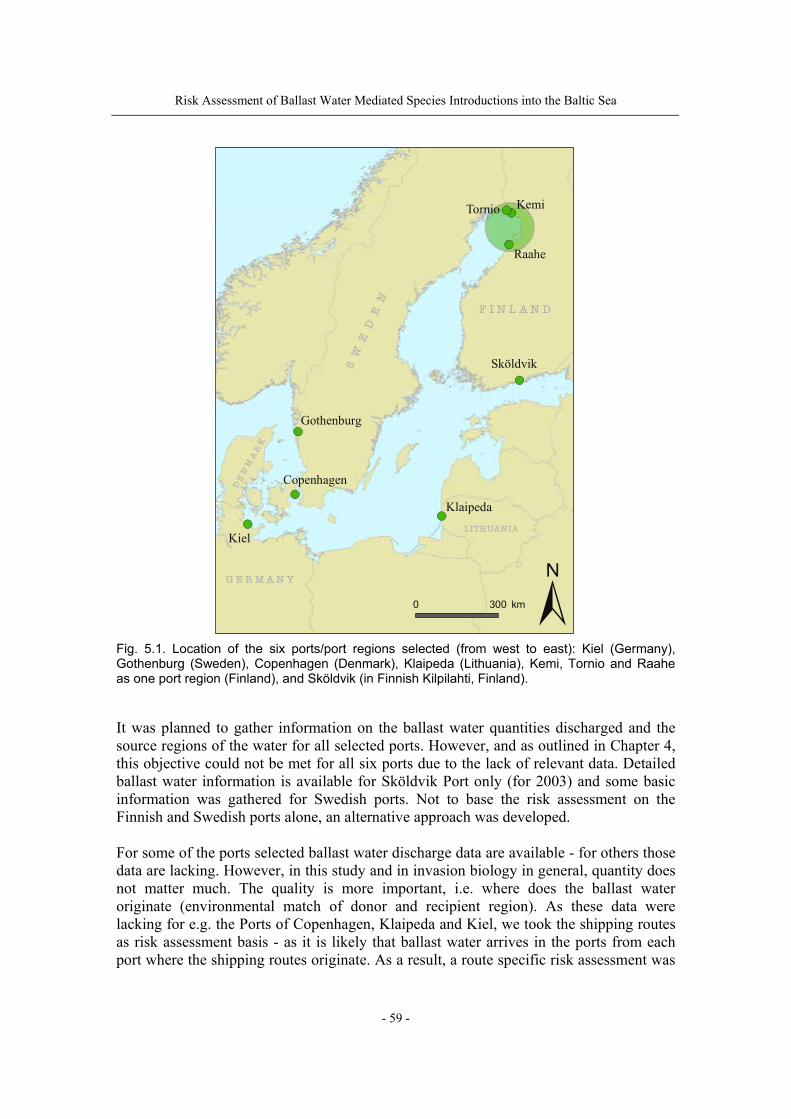
Risk Assessment of Ballast Water Mediated Species Introductions into the Baltic Sea
- 59 -
SW
EDEN
DENMARK
G E R M A N Y
F I N L A N D
LITHUANIA
KemiTornio
Raahe
Sköldvik
Kiel
Copenhagen
Klaipeda
Gothenburg
0 300 km
Fig. 5.1. Location of the six ports/port regions selected (from west to east): Kiel (Germany), Gothenburg (Sweden), Copenhagen (Denmark), Klaipeda (Lithuania), Kemi, Tornio and Raahe as one port region (Finland), and Sköldvik (in Finnish Kilpilahti, Finland). It was planned to gather information on the ballast water quantities discharged and the source regions of the water for all selected ports. However, and as outlined in Chapter 4, this objective could not be met for all six ports due to the lack of relevant data. Detailed ballast water information is available for Sköldvik Port only (for 2003) and some basic information was gathered for Swedish ports. Not to base the risk assessment on the Finnish and Swedish ports alone, an alternative approach was developed. For some of the ports selected ballast water discharge data are available - for others those data are lacking. However, in this study and in invasion biology in general, quantity does not matter much. The quality is more important, i.e. where does the ballast water originate (environmental match of donor and recipient region). As these data were lacking for e.g. the Ports of Copenhagen, Klaipeda and Kiel, we took the shipping routes as risk assessment basis - as it is likely that ballast water arrives in the ports from each port where the shipping routes originate. As a result, a route specific risk assessment was
Risk Assessment of Ballast Water Mediated Species Introductions into the Baltic Sea
- 60 -
carried out. To assess the risk each individual vessel may pose, more specific data on the ballast water situation onboard are required. It should be noted that quantities of released ballast water are also of interest when planning to install land-based ballast water reception facilities to allow for appropriate capacities of such facilities. However, there is currently no interest to make such facilities available in Baltic ports. 5.3 Risk assessment approach for the ports selected Despite the best efforts, such as Internet search, contacting various national and international authorities and sending out a questionnaire to country focal points, ballast water discharge quantities could not be revealed in detail for all ports selected. As a result a quantitative risk assessment of ballast water mediated species introductions could not be carried out. As mentioned above, the authors feel that the volumes of ballast water discharged or taken on board in general are of minor importance in risk assessment as it is not the quantity indicating the risk, but rather the quality, i.e. the environmental match of donor and recipient region of the ballast water. To clarify this statement we give an example. We compare the following scenarios: (a) 10 mio tonnes of ballast water originating from a tropical seawater port are
discharged in one Baltic port annually, (b) 0.5 mio tonnes of ballast water which originates from a cold-temperate brackish
area along the east coast of North America are discharged in one Baltic port annually, and
(c) 0.5 mio tonnes of ballast water which originates from a cold-temperate brackish area along the European Atlantic seabord are discharged in one Baltic port annually.
In this scenario, options (b) and (c) pose a higher risk for a species introduction due to environmental match of donor and recipient compared to option (a) where, although the amount of ballast water is much higher, the source and recipient regions of the ballast water are substantially different in their abiotic water conditions. A ranking of options (b) and (c) reveals that option (c) poses a higher risk as the voyage duration from the EU-Atlantic coast to a Baltic port is much shorter than from North America resulting in an increased survival of species in the ballast tank. En-route scientific studies have shown that organisms die in ballast tanks over time, i.e. the longer a voyage duration lasts the less likely is organism survival (e.g. Gollasch et al. 2000, Olenin et al. 2000). As a consequence the risk assessment for the ports selected was based upon the comparison of donor and recipient port's environmental match (salinity and temperature) and voyage duration. This qualitative approach "ignores" the volume of ballast water discharged (see above). Further, it was assumed that donor ports/port regions outside the Baltic pose a higher risk for species introductions compared to inner-Baltic shipping routes. In inner Baltic trade species may also be transferred in ballast tanks. However, it is likely that organisms once introduced into one Baltic port may spread and reach other

Risk Assessment of Ballast Water Mediated Species Introductions into the Baltic Sea
- 61 -
Baltic regions (secondary introductions) by their natural means of spread or by other human-mediated means than ballast water (e.g. hull fouling, leisure and fishing vessels). This assumption refers in particular to brackish water species. These species usually show a higher tolerance to salinity compared to truly marine and freshwater species. Marine conditions do not exist in the Baltic, but freshwater habitats need special attention here. In case a freshwater species becomes introduced in e.g. the port of St. Petersburg this species may not be able to reach freshwater habitats adjacent to e.g. the western Baltic coast (e.g. rivers and lakes in Denmark or along the west coast of Sweden) as the higher salinity in the central Baltic would naturally reduce the spreading potential of a freshwater species. Even brackish water conditions may pose a migration barrier for freshwater species. As a result inner-Baltic shipping routes which connect freshwater habitats being separated by higher saline brackish waters pose a risk to introduce a species which would be unable to reach other freshwater regions by its own means. 5.3.1 Environmental characteristics of the ports/port regions selected Table 5.1 shows the salinity and temperature characteristics of the ports/port regions selected. The temperature regime was evaluated based upon bioregion mapping (Ekman 1953, Briggs 1974; see Fig. 5.2). The port salinities were extracted from Lloyds Register - Fairplay (2003). As all Baltic ports are located in the identical bioregion they are all exposed to a similar climate regime. Consequently, the individual port salinity (range) is a key differential feature. Table 5.1. Salinity and temperature characteristics of the ports/port regions selected. The salinity in Lloyds Register - Fairplay (2003) was given in density and was calculated to parts per thousand following the Aquatext conversion (www.aquatext.com) at the water temperature of 8°C.
Port /port region Temperature zone Salinity regime [ppt]
Kiel Eastern Atlantic Boreal Region 19.5 Gothenburg Eastern Atlantic Boreal Region 13.1 - 18.2 Copenhagen Eastern Atlantic Boreal Region 10 Klaipeda Eastern Atlantic Boreal Region 0.5 - < 7 Kemi, Tornio, Raahe Eastern Atlantic Boreal Region 0 - 4.2 Sköldvik Eastern Atlantic Boreal Region 0 - 6.7
5.3.2 Risk evaluation parameters As outlined above, the key risk evaluation parameters are temperature, salinity, voyage duration and shipping pattern, both inside and outside the Baltic. All parameters were calculated based on the identical sources as used to describe the ports selected (see above).
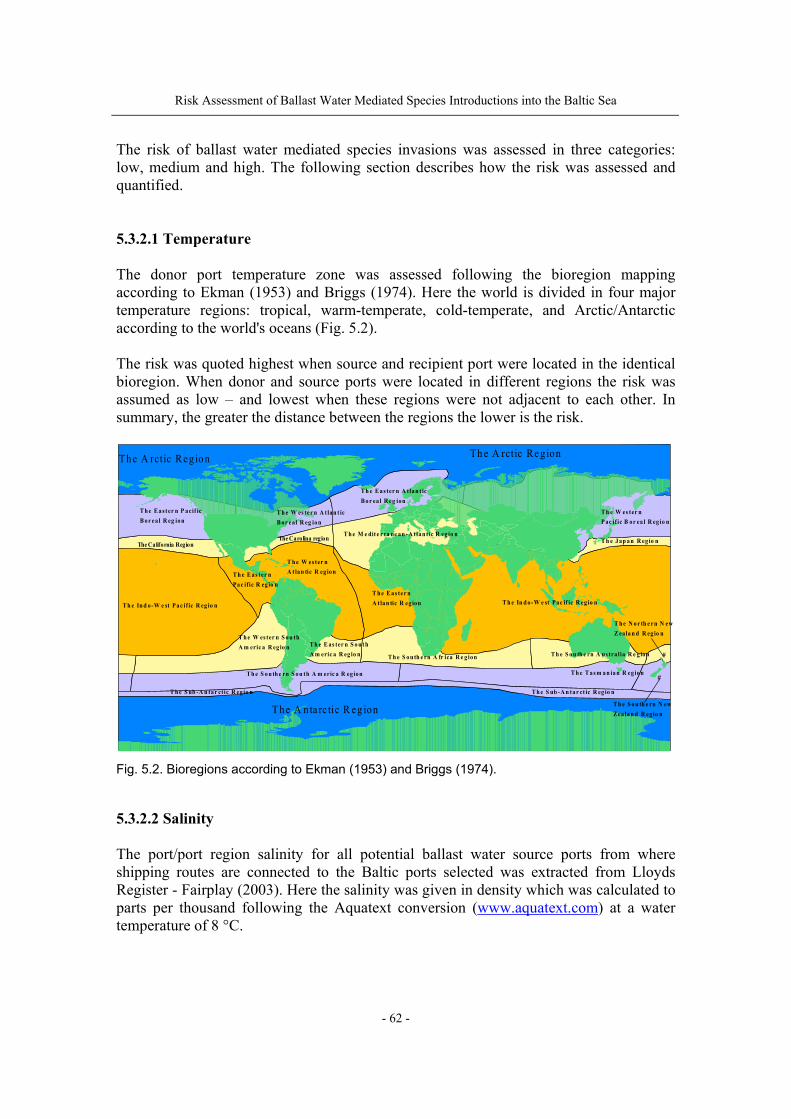
Risk Assessment of Ballast Water Mediated Species Introductions into the Baltic Sea
- 62 -
The risk of ballast water mediated species invasions was assessed in three categories: low, medium and high. The following section describes how the risk was assessed and quantified. 5.3.2.1 Temperature The donor port temperature zone was assessed following the bioregion mapping according to Ekman (1953) and Briggs (1974). Here the world is divided in four major temperature regions: tropical, warm-temperate, cold-temperate, and Arctic/Antarctic according to the world's oceans (Fig. 5.2). The risk was quoted highest when source and recipient port were located in the identical bioregion. When donor and source ports were located in different regions the risk was assumed as low – and lowest when these regions were not adjacent to each other. In summary, the greater the distance between the regions the lower is the risk.
The A nta rc tic R eg ion
The A rctic Reg ion Th e A rctic Re gion
Th e In d o-W e st Pac if ic R eg io n
T h e E as t er n P acif ic B or eal R eg ion
T h e W es ter n S ou th A m eric a R eg io n
Th e S ou th e rn S ou th A m eric a R eg ion
Th e S ub -A n ta r ct ic R eg io nT h e S ub -A n tar ctic R eg io n
T h e T as m an ian R eg ion
T h e W es ter n Pac if ic B or ea l R eg io n
T h e In d o- W e st Pac if ic R egio n
T h e S ou th e rn A us tra lia R e g io n
Th e S ou th e rn N ew Zea lan d R eg io n
T h e N o r th e rn N ew Z eala n d R eg io n
T h e W es ter n A t lan tic R eg ionT h e E as ter n
Pac ific R eg io n
T h e W es ter n A tlan t ic B or eal R eg ion
Th e E as ter n A tlan t ic Bo r ea l R eg ion
T h e M e dit e rra ne an - A tlan t ic R eg io nT h e J ap an R eg io n
T h e S ou th e rn A fr ica R e g ion
T h e E as ter n A t lan tic R eg ion
Th e E as ter n S o u t h A m eric a R eg io n
#
#
The California RegionThe Carolina region
Fig. 5.2. Bioregions according to Ekman (1953) and Briggs (1974). 5.3.2.2 Salinity The port/port region salinity for all potential ballast water source ports from where shipping routes are connected to the Baltic ports selected was extracted from Lloyds Register - Fairplay (2003). Here the salinity was given in density which was calculated to parts per thousand following the Aquatext conversion (www.aquatext.com) at a water temperature of 8 °C.
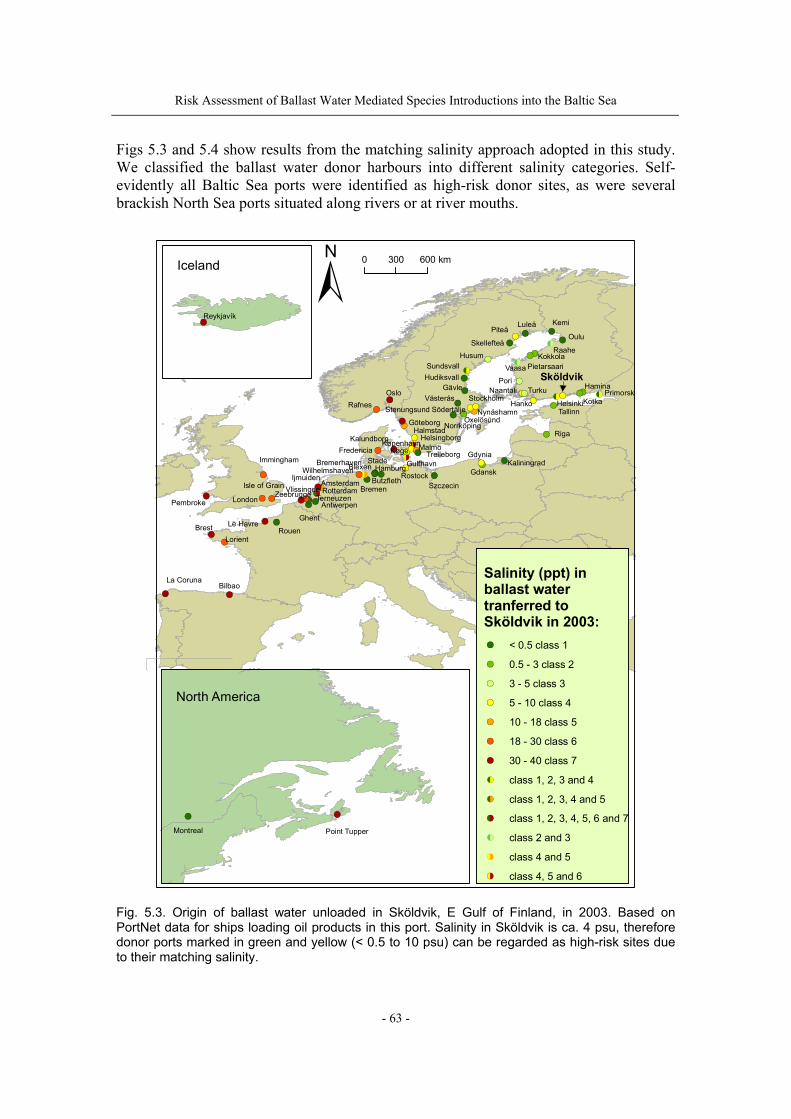
Risk Assessment of Ballast Water Mediated Species Introductions into the Baltic Sea
- 63 -
Figs 5.3 and 5.4 show results from the matching salinity approach adopted in this study. We classified the ballast water donor harbours into different salinity categories. Self-evidently all Baltic Sea ports were identified as high-risk donor sites, as were several brackish North Sea ports situated along rivers or at river mouths.
PrimorskHamina
KotkaTallinn
Hanko
TurkuNaantaliPori
Vaasa PietarsaariKokkola
Raahe
Oulu
KemiLuleåPiteå
Skellefteå
Husum
Riga
SundsvallHudiksvall
GävleStockholm
NynäshamnSödertäljeVästerås
NorrköpingOxelösund
Oslo
Stenungsund
GöteborgHalmstad
HelsingborgMalmö
TrelleborgKøpenhavnKalundborg
Fredericia Køge
Gulfhavn
SzczecinRostock
HamburgStade
Butzfleth
Gdynia
GdanskKaliningradBremerhavenBlexenWilhelmshaven
BremenAmsterdam
Ijmuiden
RotterdamZeebruggeVlissingen
Antwerpen
Ghent
Terneuzen
RouenLe HavreBrest
Lorient
London
Isle of Grain
Immingham
Pembroke
BilbaoLa Coruna
Rafnes
Sköldvik
Helsinki
Montreal Point Tupper
Reykjavík
Salinity (ppt) in ballast water tranferred to Sköldvik in 2003:
< 0.5 class 1
0.5 - 3 class 2
3 - 5 class 3
5 - 10 class 4
10 - 18 class 5
18 - 30 class 6
30 - 40 class 7
class 1, 2, 3 and 4
class 1, 2, 3, 4 and 5
class 1, 2, 3, 4, 5, 6 and 7
class 2 and 3
class 4 and 5
class 4, 5 and 6
North America
Iceland 0 300 600 km
Fig. 5.3. Origin of ballast water unloaded in Sköldvik, E Gulf of Finland, in 2003. Based on PortNet data for ships loading oil products in this port. Salinity in Sköldvik is ca. 4 psu, therefore donor ports marked in green and yellow (< 0.5 to 10 psu) can be regarded as high-risk sites due to their matching salinity.
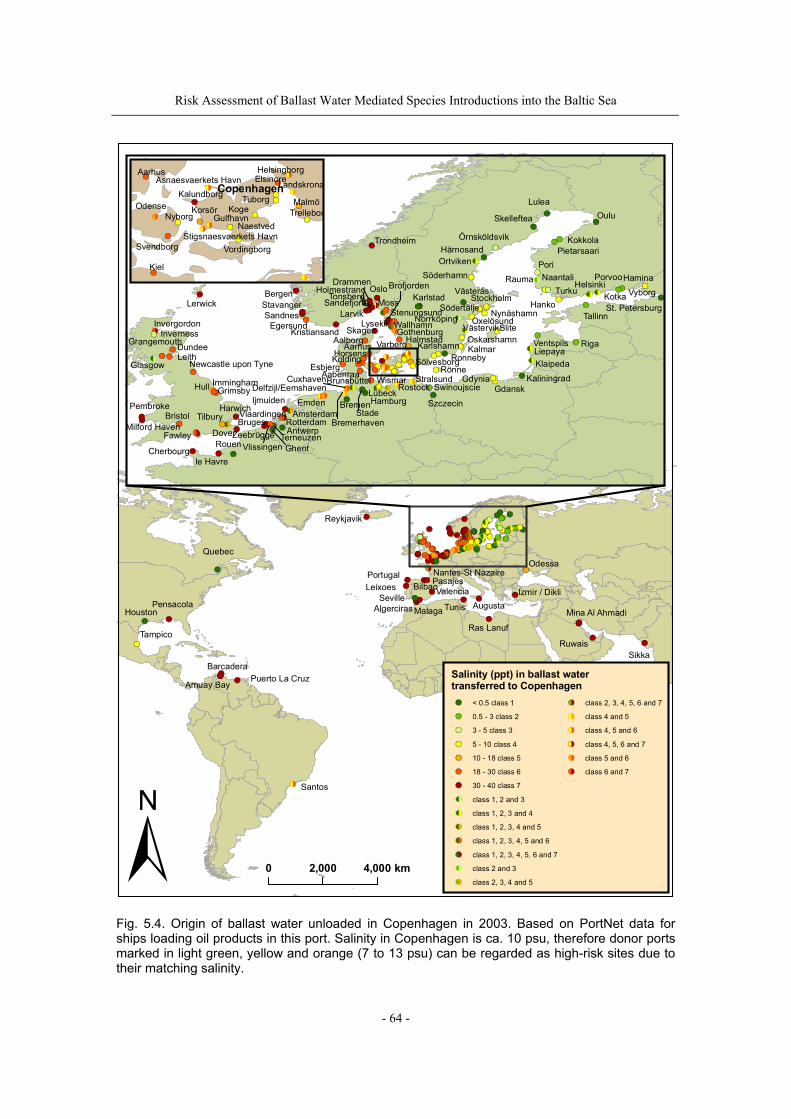
Risk Assessment of Ballast Water Mediated Species Introductions into the Baltic Sea
- 64 -
Reykjavik
Quebec
PensacolaHouston
Tampico
Barcadera
Amuay BayPuerto La Cruz
Santos
SikkaRuwais
Mina Al Ahmadi
Ras Lanuf
Tunis AugustaIzmir / Dikli
Odessa
LeixoesPortugal
SevilleValencia
PasajesBilbaoNantes-St Nazaire
Algerciras Malaga
Trondheim
Lerwick
InvergordonInverness
DundeeLeith
Grangemouth
Glasgow
Pembroke
Milford HavenBristol
Newcastle upon Tyne
Hull ImminghamGrimsby
HarwichTilbury
DoverFawleyRouen
Cherbourgle Havre
Lulea
Skelleftea
ÖrnsköldsvikHärnosandOrtviken
Söderhamn
VästeråsStockholm
Slite
Södertälje NynäshamnNorrköping OxelösundVästervikOskarshamnKalmar
RonnebyRönne
Karlshamn
Sölvesborg
BergenStavangerSandnes
EgersundKristiansand
Oulu
KokkolaPietarsaari
Pori
Rauma NaantaliTurku
Hanko
HelsinkiPorvoo
VyborgKotka
Hamina
Tallinn
RigaVentspilsLiepayaKlaipeda
KaliningradGdansk
Gdynia
Szczecin
Swinoujscie
LarvikSandefjord Karlstad
HolmestrandDrammen
Tonsberg
Zeebrügge
IjmuidenAmsterdamVlaardingen
RotterdamAntwerp
Delfzijl/Eemshaven
Emden
Bruges
TerneuzenVlissingen Ghent
SkagenAalborg
AarhusHorsens
EsbjergAabenraa
Kolding
BrunsbüttelCuxhaven
StadeBremen
Bremerhaven
Hamburg
HalmstadVarbergGothenburg
OsloMoss
Brofjorden
StenungsundWallhamnLysekil
StralsundRostock
WismarLübeck
St. Petersburg
Salinity (ppt) in ballast water transferred to Copenhagen
< 0.5 class 1
0.5 - 3 class 2
3 - 5 class 3
5 - 10 class 4
10 - 18 class 5
18 - 30 class 6
30 - 40 class 7
class 1, 2 and 3
class 1, 2, 3 and 4
class 1, 2, 3, 4 and 5
class 1, 2, 3, 4, 5 and 6
class 1, 2, 3, 4, 5, 6 and 7
class 2 and 3
class 2, 3, 4 and 5
class 2, 3, 4, 5, 6 and 7
class 4 and 5
class 4, 5 and 6
class 4, 5, 6 and 7
class 5 and 6
class 6 and 7
0 2,000 4,000 km
AarhusAsnaesvaerkets Havn
KalundborgOdense
Nyborg
Svendborg
Kiel
Korsör
Stigsnaesvaerkets Havn
GulfhavnNaestved
Vordingborg
KogeTuborg
ElsinoreHelsingborg
LandskronaCopenhagenMalmö
Trellebor
Fig. 5.4. Origin of ballast water unloaded in Copenhagen in 2003. Based on PortNet data for ships loading oil products in this port. Salinity in Copenhagen is ca. 10 psu, therefore donor ports marked in light green, yellow and orange (7 to 13 psu) can be regarded as high-risk sites due to their matching salinity.
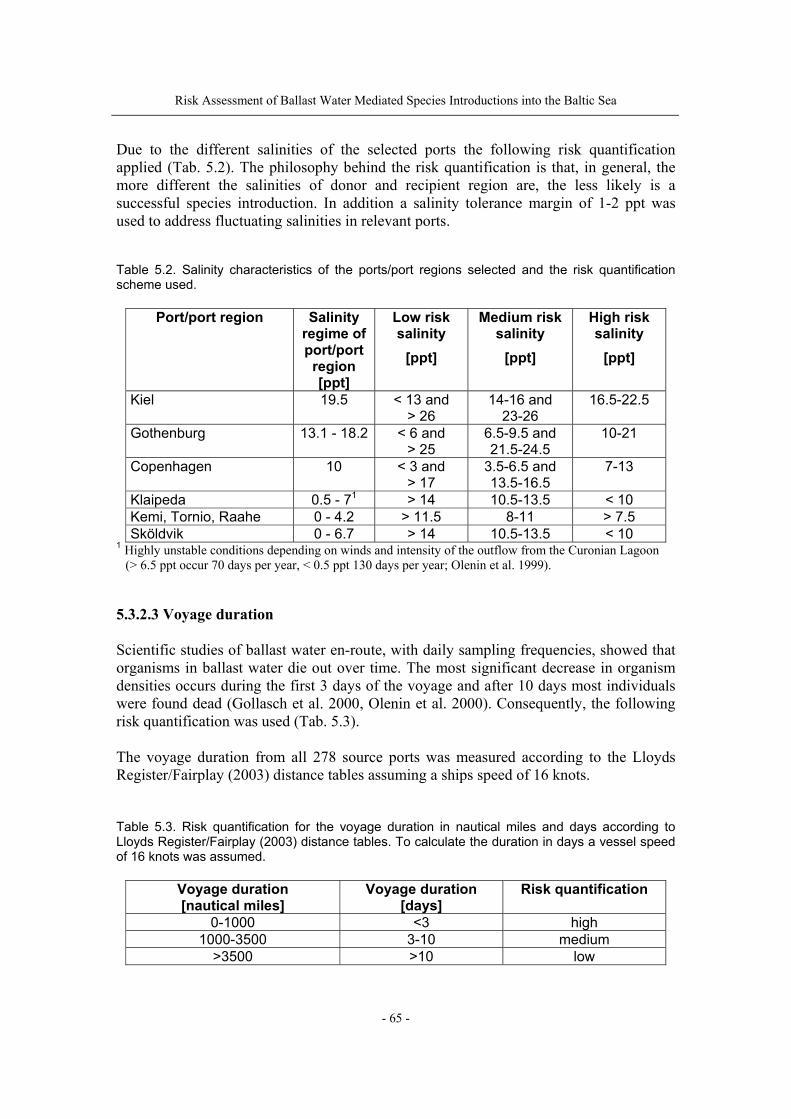
Risk Assessment of Ballast Water Mediated Species Introductions into the Baltic Sea
- 65 -
Due to the different salinities of the selected ports the following risk quantification applied (Tab. 5.2). The philosophy behind the risk quantification is that, in general, the more different the salinities of donor and recipient region are, the less likely is a successful species introduction. In addition a salinity tolerance margin of 1-2 ppt was used to address fluctuating salinities in relevant ports. Table 5.2. Salinity characteristics of the ports/port regions selected and the risk quantification scheme used.
Port/port region Salinity regime of port/port
region [ppt]
Low risk salinity
[ppt]
Medium risk salinity
[ppt]
High risk salinity
[ppt]
Kiel 19.5 < 13 and > 26
14-16 and 23-26
16.5-22.5
Gothenburg 13.1 - 18.2 < 6 and > 25
6.5-9.5 and 21.5-24.5
10-21
Copenhagen 10 < 3 and > 17
3.5-6.5 and 13.5-16.5
7-13
Klaipeda 0.5 - 71 > 14 10.5-13.5 < 10 Kemi, Tornio, Raahe 0 - 4.2 > 11.5 8-11 > 7.5 Sköldvik 0 - 6.7 > 14 10.5-13.5 < 10
1 Highly unstable conditions depending on winds and intensity of the outflow from the Curonian Lagoon (> 6.5 ppt occur 70 days per year, < 0.5 ppt 130 days per year; Olenin et al. 1999).
5.3.2.3 Voyage duration Scientific studies of ballast water en-route, with daily sampling frequencies, showed that organisms in ballast water die out over time. The most significant decrease in organism densities occurs during the first 3 days of the voyage and after 10 days most individuals were found dead (Gollasch et al. 2000, Olenin et al. 2000). Consequently, the following risk quantification was used (Tab. 5.3). The voyage duration from all 278 source ports was measured according to the Lloyds Register/Fairplay (2003) distance tables assuming a ships speed of 16 knots. Table 5.3. Risk quantification for the voyage duration in nautical miles and days according to Lloyds Register/Fairplay (2003) distance tables. To calculate the duration in days a vessel speed of 16 knots was assumed.
Voyage duration [nautical miles]
Voyage duration [days]
Risk quantification
0-1000 <3 high 1000-3500 3-10 medium
>3500 >10 low
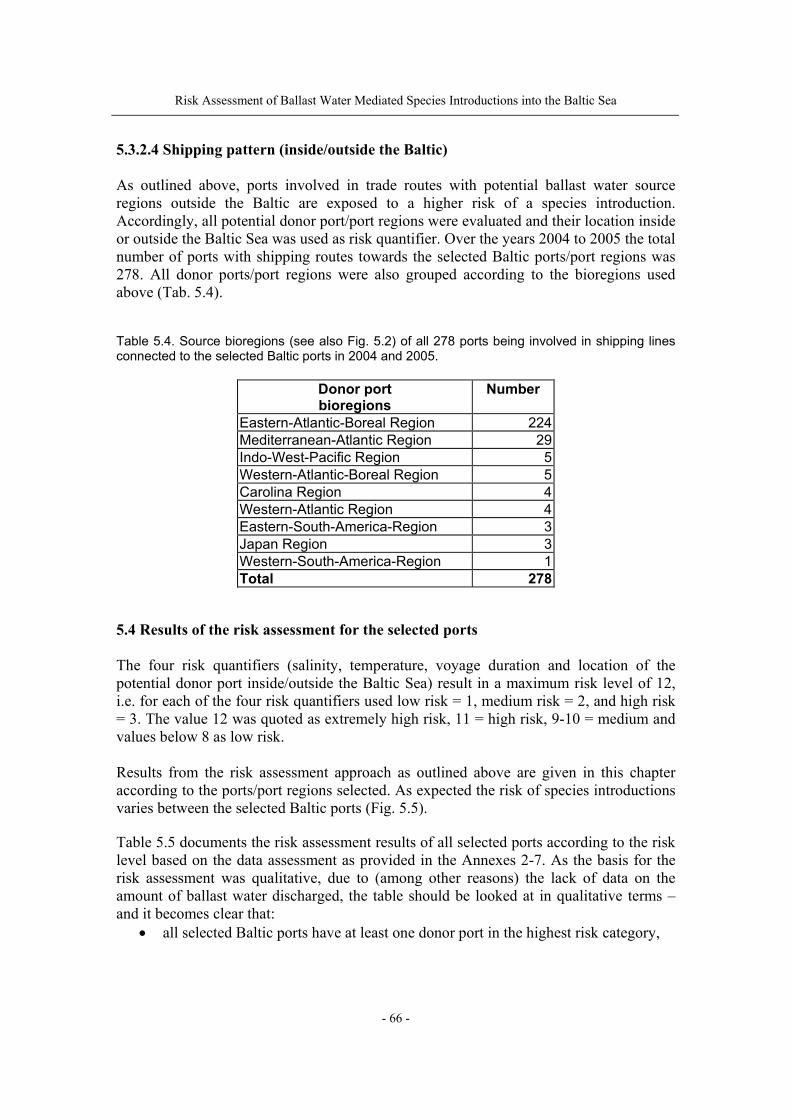
Risk Assessment of Ballast Water Mediated Species Introductions into the Baltic Sea
- 66 -
5.3.2.4 Shipping pattern (inside/outside the Baltic) As outlined above, ports involved in trade routes with potential ballast water source regions outside the Baltic are exposed to a higher risk of a species introduction. Accordingly, all potential donor port/port regions were evaluated and their location inside or outside the Baltic Sea was used as risk quantifier. Over the years 2004 to 2005 the total number of ports with shipping routes towards the selected Baltic ports/port regions was 278. All donor ports/port regions were also grouped according to the bioregions used above (Tab. 5.4). Table 5.4. Source bioregions (see also Fig. 5.2) of all 278 ports being involved in shipping lines connected to the selected Baltic ports in 2004 and 2005.
Donor port bioregions
Number
Eastern-Atlantic-Boreal Region 224Mediterranean-Atlantic Region 29Indo-West-Pacific Region 5Western-Atlantic-Boreal Region 5Carolina Region 4Western-Atlantic Region 4Eastern-South-America-Region 3Japan Region 3Western-South-America-Region 1Total 278
5.4 Results of the risk assessment for the selected ports The four risk quantifiers (salinity, temperature, voyage duration and location of the potential donor port inside/outside the Baltic Sea) result in a maximum risk level of 12, i.e. for each of the four risk quantifiers used low risk = 1, medium risk = 2, and high risk = 3. The value 12 was quoted as extremely high risk, 11 = high risk, 9-10 = medium and values below 8 as low risk. Results from the risk assessment approach as outlined above are given in this chapter according to the ports/port regions selected. As expected the risk of species introductions varies between the selected Baltic ports (Fig. 5.5). Table 5.5 documents the risk assessment results of all selected ports according to the risk level based on the data assessment as provided in the Annexes 2-7. As the basis for the risk assessment was qualitative, due to (among other reasons) the lack of data on the amount of ballast water discharged, the table should be looked at in qualitative terms – and it becomes clear that:
• all selected Baltic ports have at least one donor port in the highest risk category,

Risk Assessment of Ballast Water Mediated Species Introductions into the Baltic Sea
- 67 -
• all extreme and high risk donor ports are located in Europe, but outside the Baltic Sea – with the exception of only two high risk donor ports, i.e. Hamina and Hanko for Gothenburg as recipient port, which are located within the Baltic Sea,
• the most frequently reported high risk donor ports are Rotterdam (6 times), Bremerhaven (5), Amsterdam (4) and Antwerp (3), and
• most high risk donor ports are the major hub ports in Europe.
020406080
100
Kiel
Gothen
burg
Copen
hage
n
Klaipe
da
Kemi, T
ornea
, Raa
he
Sköldv
ik
extremehighmediumlow
[n]
Fig. 5.5. Number of source ports for the selected Baltic ports according to risk level. It is interesting to note that in all selected ports the number of medium and low risk donor ports is highest. As in ballast water mediated species introductions it is not the quantity which matters, but the quality – and it is of concern that all selected ports are connected to at least one extremely high-risk donor port. Comparing the risk level of source ports for each port selected, the share of extreme high risk donor ports ranges from 2.5% (Kemi, Tornio and Raahe) up to 10.8% (Klaipeda) indicating that Klaipeda has the highest percentage of extreme high risk port connections to be followed by Kiel (8.1%) (Tab. 5.6). 5.5 Needs and proposals for monitoring of invasive species and port baseline surveys In this chapter the authors underline the need of detailed knowledge on native and non-indigenous biota in ports or port regions, which is essential when conducting species-specific risk assessment. According to the risk assessment guideline currently in preparation by IMO (see Annex 1) specific port sampling programmes targeting NIS may need to be implemented. Further, data from existing monitoring programmes may also be used to prepare a risk assessment evaluation in the Baltic taking into account current monitoring programs within HELCOM and the EU and the development of relevant Guidelines at the IMO.
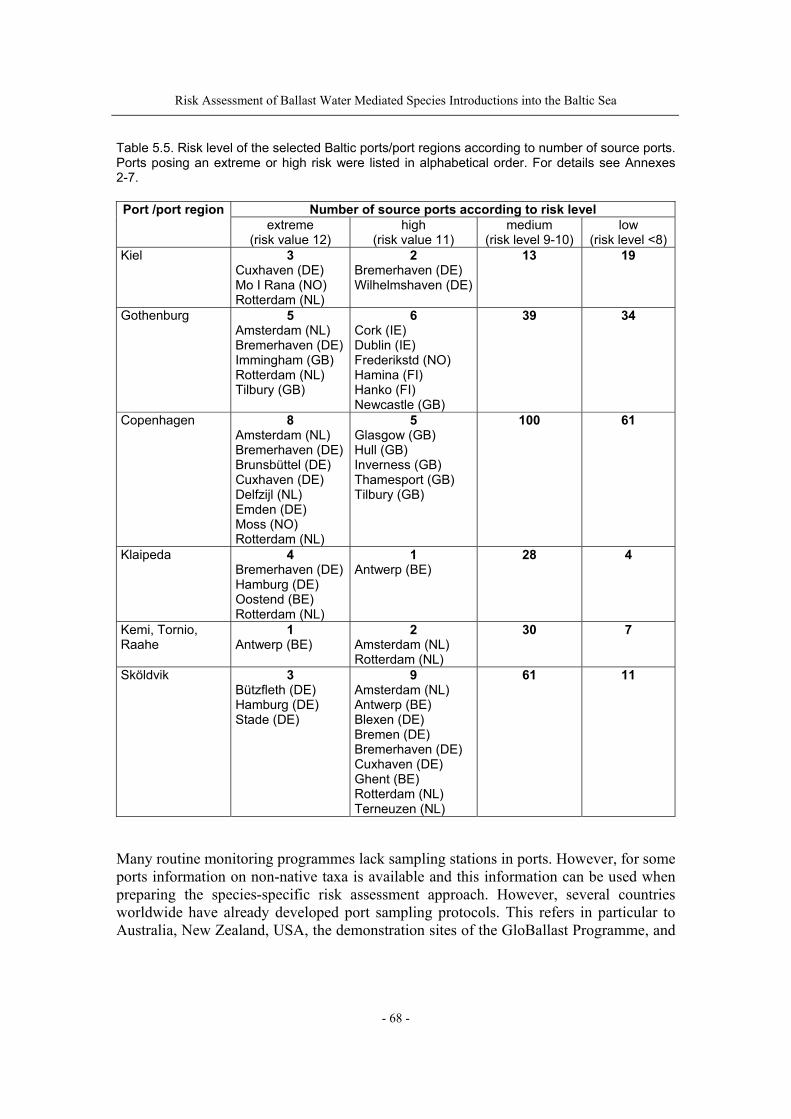
Risk Assessment of Ballast Water Mediated Species Introductions into the Baltic Sea
- 68 -
Table 5.5. Risk level of the selected Baltic ports/port regions according to number of source ports. Ports posing an extreme or high risk were listed in alphabetical order. For details see Annexes 2-7.
Number of source ports according to risk level Port /port region extreme
(risk value 12) high
(risk value 11) medium
(risk level 9-10) low
(risk level <8) Kiel 3
Cuxhaven (DE) Mo I Rana (NO) Rotterdam (NL)
2 Bremerhaven (DE) Wilhelmshaven (DE)
13 19
Gothenburg 5 Amsterdam (NL) Bremerhaven (DE)Immingham (GB) Rotterdam (NL) Tilbury (GB)
6 Cork (IE) Dublin (IE) Frederikstd (NO) Hamina (FI) Hanko (FI) Newcastle (GB)
39 34
Copenhagen 8 Amsterdam (NL) Bremerhaven (DE)Brunsbüttel (DE) Cuxhaven (DE) Delfzijl (NL) Emden (DE) Moss (NO) Rotterdam (NL)
5 Glasgow (GB) Hull (GB) Inverness (GB) Thamesport (GB) Tilbury (GB)
100 61
Klaipeda 4 Bremerhaven (DE)Hamburg (DE) Oostend (BE) Rotterdam (NL)
1 Antwerp (BE)
28 4
Kemi, Tornio, Raahe
1 Antwerp (BE)
2 Amsterdam (NL) Rotterdam (NL)
30 7
Sköldvik 3 Bützfleth (DE) Hamburg (DE) Stade (DE)
9 Amsterdam (NL) Antwerp (BE) Blexen (DE) Bremen (DE) Bremerhaven (DE) Cuxhaven (DE) Ghent (BE) Rotterdam (NL) Terneuzen (NL)
61 11
Many routine monitoring programmes lack sampling stations in ports. However, for some ports information on non-native taxa is available and this information can be used when preparing the species-specific risk assessment approach. However, several countries worldwide have already developed port sampling protocols. This refers in particular to Australia, New Zealand, USA, the demonstration sites of the GloBallast Programme, and
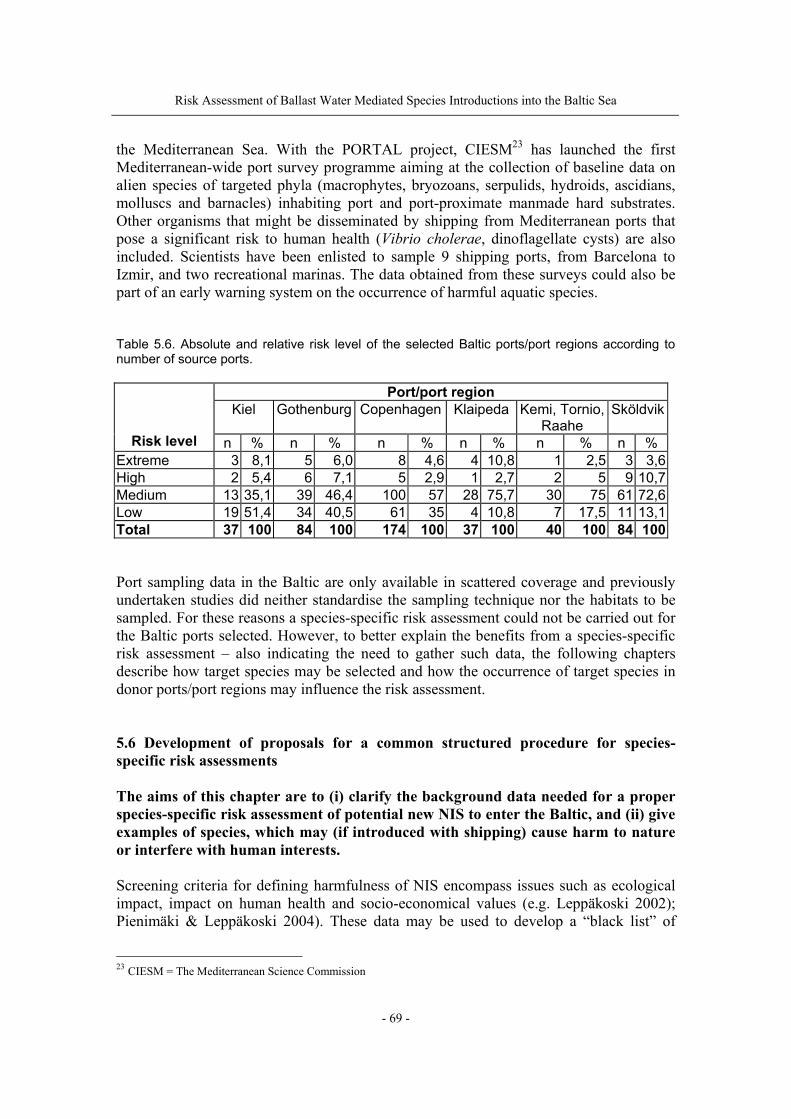
Risk Assessment of Ballast Water Mediated Species Introductions into the Baltic Sea
- 69 -
the Mediterranean Sea. With the PORTAL project, CIESM23 has launched the first Mediterranean-wide port survey programme aiming at the collection of baseline data on alien species of targeted phyla (macrophytes, bryozoans, serpulids, hydroids, ascidians, molluscs and barnacles) inhabiting port and port-proximate manmade hard substrates. Other organisms that might be disseminated by shipping from Mediterranean ports that pose a significant risk to human health (Vibrio cholerae, dinoflagellate cysts) are also included. Scientists have been enlisted to sample 9 shipping ports, from Barcelona to Izmir, and two recreational marinas. The data obtained from these surveys could also be part of an early warning system on the occurrence of harmful aquatic species. Table 5.6. Absolute and relative risk level of the selected Baltic ports/port regions according to number of source ports.
Port/port region Kiel Gothenburg Copenhagen Klaipeda Kemi, Tornio,
Raahe Sköldvik
Risk level n % n % n % n % n % n % Extreme 3 8,1 5 6,0 8 4,6 4 10,8 1 2,5 3 3,6High 2 5,4 6 7,1 5 2,9 1 2,7 2 5 9 10,7Medium 13 35,1 39 46,4 100 57 28 75,7 30 75 61 72,6Low 19 51,4 34 40,5 61 35 4 10,8 7 17,5 11 13,1Total 37 100 84 100 174 100 37 100 40 100 84 100 Port sampling data in the Baltic are only available in scattered coverage and previously undertaken studies did neither standardise the sampling technique nor the habitats to be sampled. For these reasons a species-specific risk assessment could not be carried out for the Baltic ports selected. However, to better explain the benefits from a species-specific risk assessment – also indicating the need to gather such data, the following chapters describe how target species may be selected and how the occurrence of target species in donor ports/port regions may influence the risk assessment. 5.6 Development of proposals for a common structured procedure for species-specific risk assessments The aims of this chapter are to (i) clarify the background data needed for a proper species-specific risk assessment of potential new NIS to enter the Baltic, and (ii) give examples of species, which may (if introduced with shipping) cause harm to nature or interfere with human interests. Screening criteria for defining harmfulness of NIS encompass issues such as ecological impact, impact on human health and socio-economical values (e.g. Leppäkoski 2002); Pienimäki & Leppäkoski 2004). These data may be used to develop a “black list” of
23 CIESM = The Mediterranean Science Commission
Risk Assessment of Ballast Water Mediated Species Introductions into the Baltic Sea
- 70 -
harmful or potentially harmful alien species, which are especially undesirable to be introduced to the Baltic Sea. Consequently, questions to be answered in assessing the risks posed by potential NIS are:
• Vector and pathway analysis: Can the species enter the Baltic Sea as a ballast water-mediated NIS?
• Ecological and ecophysiological assessment: Can the species establish self-reproducing populations?
• Ecological and invasion capacity assessment: Can the species spread further from its first bridge head(s)?
• Hazard analysis: Can the species cause negative economic or ecological impacts? • Benefit assessment: Can the species add new beneficial functions to the
ecosystem, or serve as a new exploitable resource (e.g., food item for commercial fish, selective fishing of the introduced species)?
Species-specific risk assessment of NIS is under development in different regions of the world (reviewed by e.g. Hayes 1997, Gollasch 2002, Paavola et al. 2005, and developed further by Claudi & Ravishankar 2006, among others). In the Baltic area, the key newcomers which likely become established are those that tolerate low salinities, low temperatures, eutrophic conditions and periodically low oxygen conditions in soft bottom habitats. As in the North Sea region, where many of the busiest ports are located in estuaries with low salinities or freshwater conditions, the Baltic shows a large range of salinity conditions (from > 0 to > 20 psu) and is therefore a suitable habitat for many NIS of different biogeographical and ecological origin. Usually organisms show a limited tolerance to varying salinities, i.e. freshwater NIS will not likely be spread by natural means from the easternmost Baltic towards other freshwater regions in the western Baltic as higher saline waters in the central Baltic pose a migration barrier. These organisms may, however, be transported from one location to another in the ballast water of ships, thereby highlighting the need not to exclude all within-Baltic shipping from ballast water management requirements. It is assumed that on a voyage from e.g. St. Petersburg to Hamburg time would permit a water exchange in the Baltic proper – reducing the risk of species transfer as the freshwater organisms originating from St. Petersburg will not likely survive in the brackish waters of the Baltic proper and species contained in the brackish water taken onboard here during exchange will not likely survive in the freshwater port of Hamburg after discharge. However, this general rule has its limitations (see Chapter 4.4) and therefore a species based risk assessment is recommended, possibly in combination with a route-based approach.
Risk Assessment of Ballast Water Mediated Species Introductions into the Baltic Sea
- 71 -
5.7 Target species list (the "Black List" approach) A target species is an organism that is potentially able to become introduced and is known to cause large-scale environmental problems due to impacts to native biodiversity and/or economic effects. A list of target species may be used as a first step to evaluate the potential "danger" of NIS introductions into the Baltic Sea. The prediction of further NIS invasions is rather difficult. However, the introduction of certain species in other regions may indicate the likeliness to become also introduced in the Baltic Sea. As a first attempt during the 1997-1999 risk assessment study in Nordic countries a black list of species was compiled (Gollasch & Leppäkoski 1999). 5.7.1 Which species will become a successful invader? As discussed elsewhere in this report, several recent developments have greatly influenced the transfer of ballast-mediated organisms:
• shorter port residency time (less opportunity for organisms to settle on a ship; as a result the proportion of ballast-mediated NIS suppressed that of plants and animals attached to ship hulls),
• faster ships (a shorter voyage duration implies better survival of organisms in ballast tanks and better post-release condition. Further, faster ships result in more frequent ship arrivals),
• use of separate tanks instead of cargo tanks for ballast water, • improved water quality in donor areas (more species to be taken onboard and less
polluted ballast water) and recipient areas (improved survival of specimens when released with ballast water),
• bigger vessels (discharging an increasing amount of ballast water).
Various factors make a successful invader. The main characteristics of most aquatic high-risk invasive organisms are listed as follows (compiled from Gollasch & Leppäkoski (1999) and references therein):
• high abundance in native habitat, • ability to survive the introducing process (e.g., resistant resting stages), • high tolerance to abiotic factors, especially temperature and salinity, during the
voyage as well as in the receiving area, • high mobility (e.g. planktonic larva), • wide range of habitat selection, • ecological niche (microhabitat and/or functional role) available in receiving
environment, • capacity to adapt to a new trophic niche, • absence of competitors, predators, parasites and diseases in the recipient region, • high potential to replace/compete with native species, • vegetative or hermaphroditic reproduction, • non-specificity in food preferences,
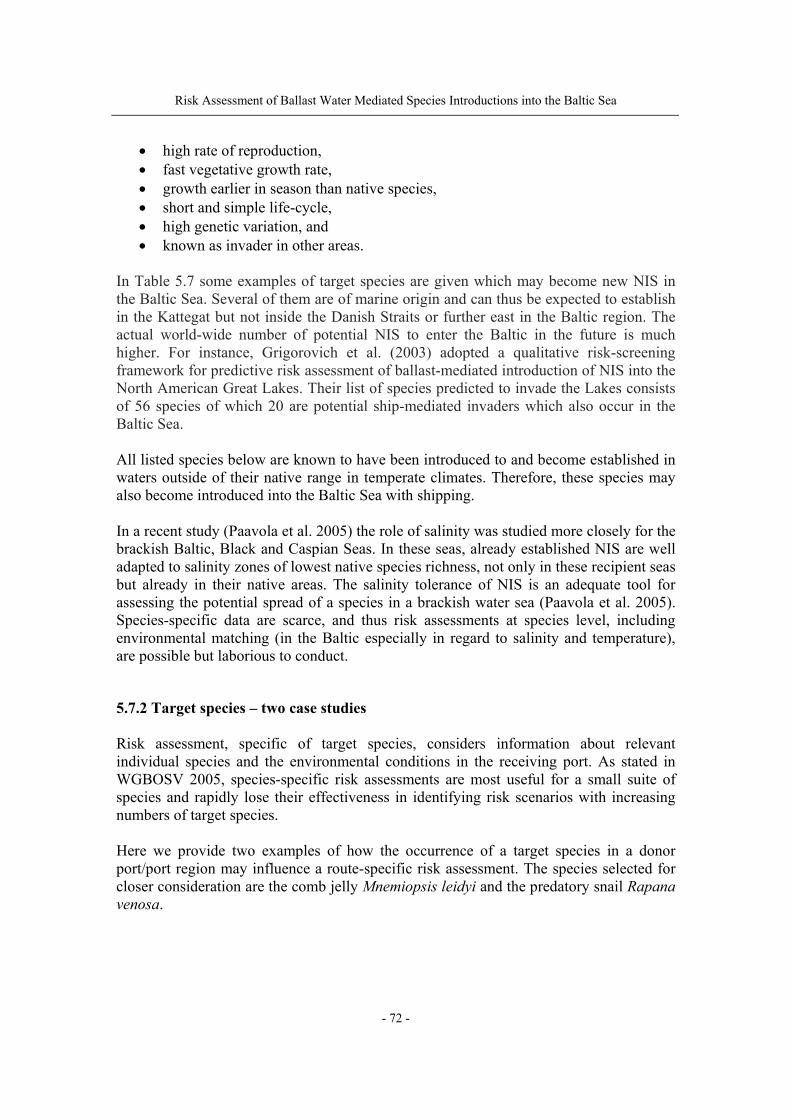
Risk Assessment of Ballast Water Mediated Species Introductions into the Baltic Sea
- 72 -
• high rate of reproduction, • fast vegetative growth rate, • growth earlier in season than native species, • short and simple life-cycle, • high genetic variation, and • known as invader in other areas.
In Table 5.7 some examples of target species are given which may become new NIS in the Baltic Sea. Several of them are of marine origin and can thus be expected to establish in the Kattegat but not inside the Danish Straits or further east in the Baltic region. The actual world-wide number of potential NIS to enter the Baltic in the future is much higher. For instance, Grigorovich et al. (2003) adopted a qualitative risk-screening framework for predictive risk assessment of ballast-mediated introduction of NIS into the North American Great Lakes. Their list of species predicted to invade the Lakes consists of 56 species of which 20 are potential ship-mediated invaders which also occur in the Baltic Sea. All listed species below are known to have been introduced to and become established in waters outside of their native range in temperate climates. Therefore, these species may also become introduced into the Baltic Sea with shipping. In a recent study (Paavola et al. 2005) the role of salinity was studied more closely for the brackish Baltic, Black and Caspian Seas. In these seas, already established NIS are well adapted to salinity zones of lowest native species richness, not only in these recipient seas but already in their native areas. The salinity tolerance of NIS is an adequate tool for assessing the potential spread of a species in a brackish water sea (Paavola et al. 2005). Species-specific data are scarce, and thus risk assessments at species level, including environmental matching (in the Baltic especially in regard to salinity and temperature), are possible but laborious to conduct. 5.7.2 Target species – two case studies Risk assessment, specific of target species, considers information about relevant individual species and the environmental conditions in the receiving port. As stated in WGBOSV 2005, species-specific risk assessments are most useful for a small suite of species and rapidly lose their effectiveness in identifying risk scenarios with increasing numbers of target species. Here we provide two examples of how the occurrence of a target species in a donor port/port region may influence a route-specific risk assessment. The species selected for closer consideration are the comb jelly Mnemiopsis leidyi and the predatory snail Rapana venosa.
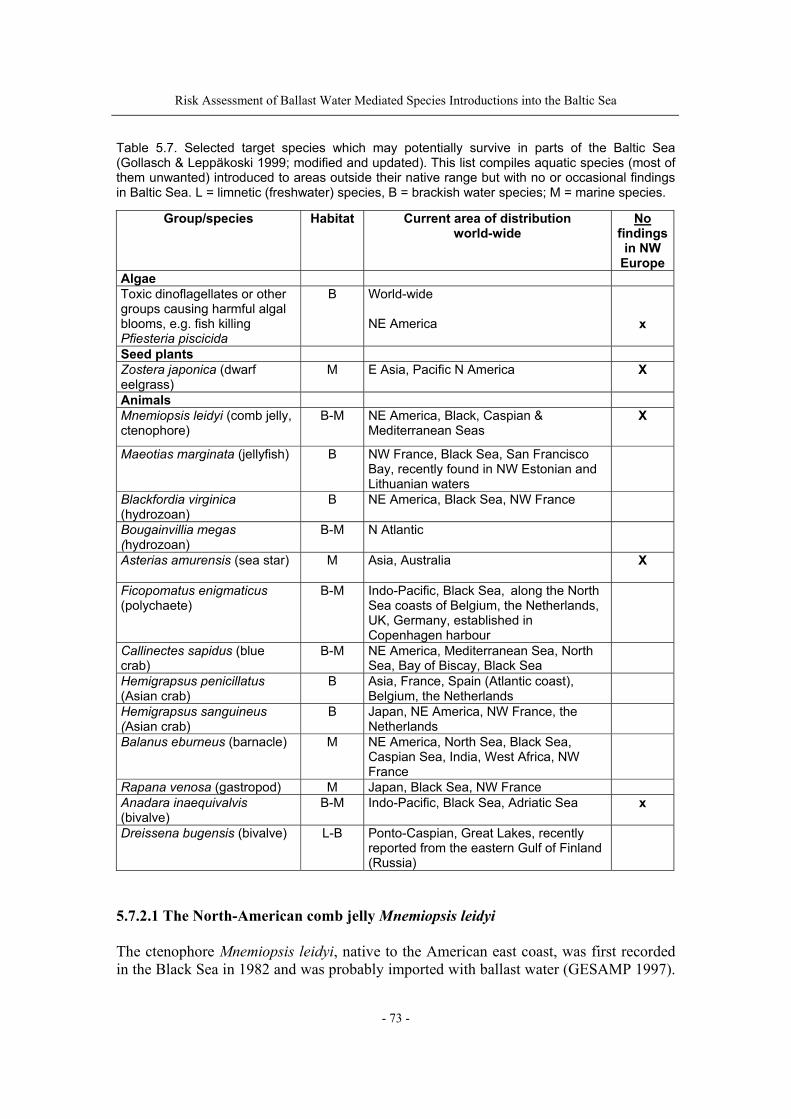
Risk Assessment of Ballast Water Mediated Species Introductions into the Baltic Sea
- 73 -
Table 5.7. Selected target species which may potentially survive in parts of the Baltic Sea (Gollasch & Leppäkoski 1999; modified and updated). This list compiles aquatic species (most of them unwanted) introduced to areas outside their native range but with no or occasional findings in Baltic Sea. L = limnetic (freshwater) species, B = brackish water species; M = marine species.
Group/species
Habitat Current area of distribution world-wide
No findingsin NW
Europe Algae Toxic dinoflagellates or other groups causing harmful algal blooms, e.g. fish killing Pfiesteria piscicida
B World-wide NE America
x
Seed plants Zostera japonica (dwarf eelgrass)
M E Asia, Pacific N America X
Animals Mnemiopsis leidyi (comb jelly, ctenophore)
B-M NE America, Black, Caspian & Mediterranean Seas
X
Maeotias marginata (jellyfish)
B NW France, Black Sea, San Francisco Bay, recently found in NW Estonian and Lithuanian waters
Blackfordia virginica (hydrozoan)
B NE America, Black Sea, NW France
Bougainvillia megas (hydrozoan)
B-M N Atlantic
Asterias amurensis (sea star)
M Asia, Australia X
Ficopomatus enigmaticus (polychaete)
B-M Indo-Pacific, Black Sea, along the North Sea coasts of Belgium, the Netherlands, UK, Germany, established in Copenhagen harbour
Callinectes sapidus (blue crab)
B-M NE America, Mediterranean Sea, North Sea, Bay of Biscay, Black Sea
Hemigrapsus penicillatus (Asian crab)
B Asia, France, Spain (Atlantic coast), Belgium, the Netherlands
Hemigrapsus sanguineus (Asian crab)
B Japan, NE America, NW France, the Netherlands
Balanus eburneus (barnacle) M NE America, North Sea, Black Sea, Caspian Sea, India, West Africa, NW France
Rapana venosa (gastropod) M Japan, Black Sea, NW France Anadara inaequivalvis (bivalve)
B-M Indo-Pacific, Black Sea, Adriatic Sea x
Dreissena bugensis (bivalve)
L-B Ponto-Caspian, Great Lakes, recently reported from the eastern Gulf of Finland (Russia)
5.7.2.1 The North-American comb jelly Mnemiopsis leidyi The ctenophore Mnemiopsis leidyi, native to the American east coast, was first recorded in the Black Sea in 1982 and was probably imported with ballast water (GESAMP 1997).
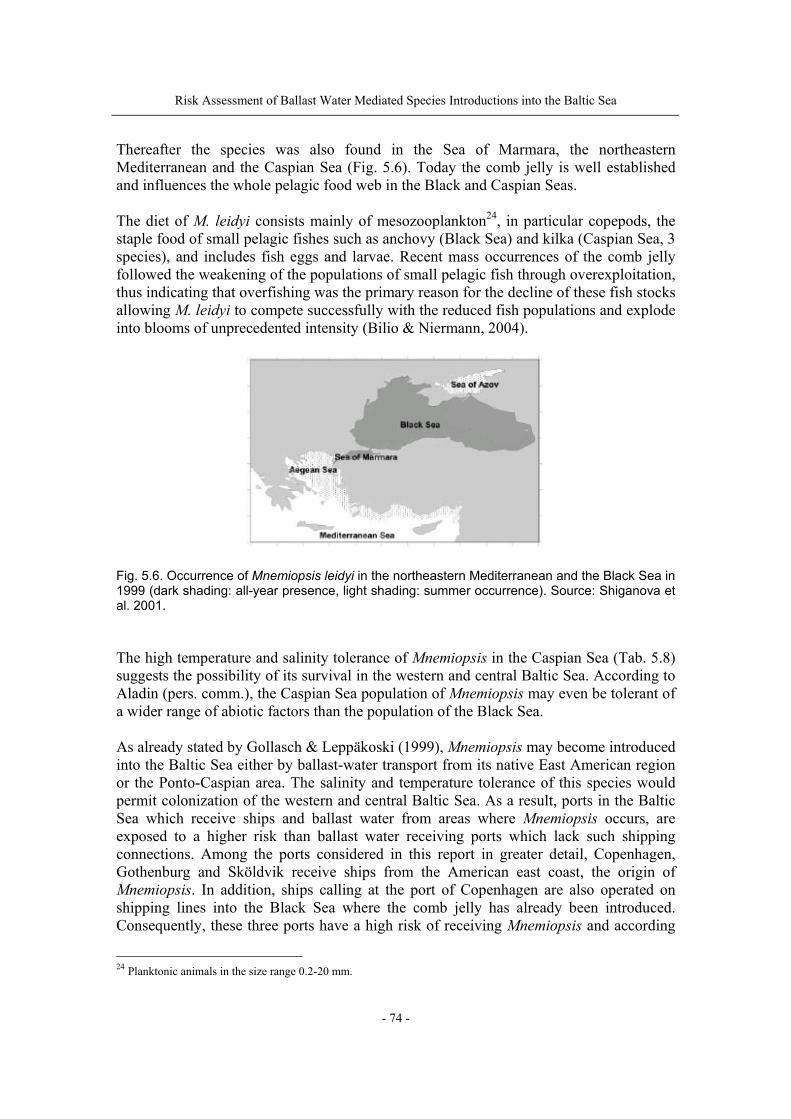
Risk Assessment of Ballast Water Mediated Species Introductions into the Baltic Sea
- 74 -
Thereafter the species was also found in the Sea of Marmara, the northeastern Mediterranean and the Caspian Sea (Fig. 5.6). Today the comb jelly is well established and influences the whole pelagic food web in the Black and Caspian Seas. The diet of M. leidyi consists mainly of mesozooplankton24, in particular copepods, the staple food of small pelagic fishes such as anchovy (Black Sea) and kilka (Caspian Sea, 3 species), and includes fish eggs and larvae. Recent mass occurrences of the comb jelly followed the weakening of the populations of small pelagic fish through overexploitation, thus indicating that overfishing was the primary reason for the decline of these fish stocks allowing M. leidyi to compete successfully with the reduced fish populations and explode into blooms of unprecedented intensity (Bilio & Niermann, 2004).
Fig. 5.6. Occurrence of Mnemiopsis leidyi in the northeastern Mediterranean and the Black Sea in 1999 (dark shading: all-year presence, light shading: summer occurrence). Source: Shiganova et al. 2001. The high temperature and salinity tolerance of Mnemiopsis in the Caspian Sea (Tab. 5.8) suggests the possibility of its survival in the western and central Baltic Sea. According to Aladin (pers. comm.), the Caspian Sea population of Mnemiopsis may even be tolerant of a wider range of abiotic factors than the population of the Black Sea. As already stated by Gollasch & Leppäkoski (1999), Mnemiopsis may become introduced into the Baltic Sea either by ballast-water transport from its native East American region or the Ponto-Caspian area. The salinity and temperature tolerance of this species would permit colonization of the western and central Baltic Sea. As a result, ports in the Baltic Sea which receive ships and ballast water from areas where Mnemiopsis occurs, are exposed to a higher risk than ballast water receiving ports which lack such shipping connections. Among the ports considered in this report in greater detail, Copenhagen, Gothenburg and Sköldvik receive ships from the American east coast, the origin of Mnemiopsis. In addition, ships calling at the port of Copenhagen are also operated on shipping lines into the Black Sea where the comb jelly has already been introduced. Consequently, these three ports have a high risk of receiving Mnemiopsis and according
24 Planktonic animals in the size range 0.2-20 mm.
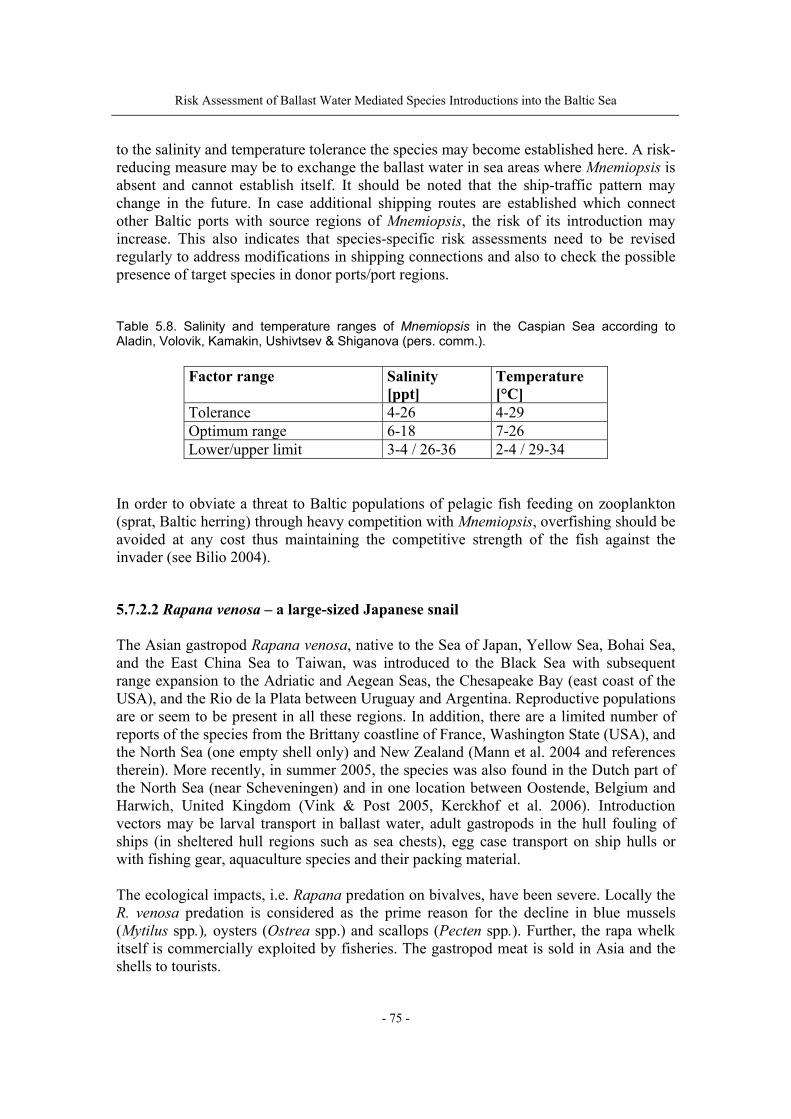
Risk Assessment of Ballast Water Mediated Species Introductions into the Baltic Sea
- 75 -
to the salinity and temperature tolerance the species may become established here. A risk-reducing measure may be to exchange the ballast water in sea areas where Mnemiopsis is absent and cannot establish itself. It should be noted that the ship-traffic pattern may change in the future. In case additional shipping routes are established which connect other Baltic ports with source regions of Mnemiopsis, the risk of its introduction may increase. This also indicates that species-specific risk assessments need to be revised regularly to address modifications in shipping connections and also to check the possible presence of target species in donor ports/port regions. Table 5.8. Salinity and temperature ranges of Mnemiopsis in the Caspian Sea according to Aladin, Volovik, Kamakin, Ushivtsev & Shiganova (pers. comm.).
Factor range Salinity [ppt]
Temperature [°C]
Tolerance 4-26 4-29 Optimum range 6-18 7-26 Lower/upper limit 3-4 / 26-36 2-4 / 29-34
In order to obviate a threat to Baltic populations of pelagic fish feeding on zooplankton (sprat, Baltic herring) through heavy competition with Mnemiopsis, overfishing should be avoided at any cost thus maintaining the competitive strength of the fish against the invader (see Bilio 2004). 5.7.2.2 Rapana venosa – a large-sized Japanese snail The Asian gastropod Rapana venosa, native to the Sea of Japan, Yellow Sea, Bohai Sea, and the East China Sea to Taiwan, was introduced to the Black Sea with subsequent range expansion to the Adriatic and Aegean Seas, the Chesapeake Bay (east coast of the USA), and the Rio de la Plata between Uruguay and Argentina. Reproductive populations are or seem to be present in all these regions. In addition, there are a limited number of reports of the species from the Brittany coastline of France, Washington State (USA), and the North Sea (one empty shell only) and New Zealand (Mann et al. 2004 and references therein). More recently, in summer 2005, the species was also found in the Dutch part of the North Sea (near Scheveningen) and in one location between Oostende, Belgium and Harwich, United Kingdom (Vink & Post 2005, Kerckhof et al. 2006). Introduction vectors may be larval transport in ballast water, adult gastropods in the hull fouling of ships (in sheltered hull regions such as sea chests), egg case transport on ship hulls or with fishing gear, aquaculture species and their packing material. The ecological impacts, i.e. Rapana predation on bivalves, have been severe. Locally the R. venosa predation is considered as the prime reason for the decline in blue mussels (Mytilus spp.), oysters (Ostrea spp.) and scallops (Pecten spp.). Further, the rapa whelk itself is commercially exploited by fisheries. The gastropod meat is sold in Asia and the shells to tourists.
Risk Assessment of Ballast Water Mediated Species Introductions into the Baltic Sea
- 76 -
The prime habitats are estuarine regions with warm summer temperatures. Freezing conditions are overcome by migration into deeper waters. The species is also tolerant to water pollution and to oxygen deficiency. The species colonizes waters with a wide salinity range from mid-estuarine (approximately 12 psu) through oceanic values. The temperature tolerance stretches from 4 to 27 °C, with an upper limit between 27 and 34. If the temperature remains above 20 °C for extended periods, then egg case deposition, hatching and larval development may occur (Mann et al. 2004 and references therein). The wide salinity and temperature tolerance of this invader indicates the suitability of especially the western and central Baltic as appropriate habitat, but the required temperature for egg-laying and larval development (> 20 °C) may not occur in the Baltic each year over the minimum needed time period. However, in certain areas such requirements may be met in warm summers. In additional areas with warm water effluents from power plants may support the species reproduction as well as warmer summers resulting from global temperature change. As a result ports in the western and central Baltic with shipping connections to areas were Rapana occurs are at highest risk to become invaded by the species. As for Mnemiopsis (see above) Copenhagen, Gothenburg and Sköldvik receive ships from the North American east coast, where Rapana is known to occur. In addition the port of Copenhagen is involved in shipping routes to the Black Sea where the species was previously introduced. In the same way as to reduce the risk of a Mnemiopsis introductions, ballast water exchange may be undertaken prior those vessels reach the Baltic. However, Rapana may also become introduced in the hull fouling of ships indicating that water exchange will not eliminate the risk of this invader to become introduced completely. Once this invader establishes in the North Sea, most – if not all – Baltic ports have shipping route connections to at least one potential source port of Rapana indicating the high invasion risk of this species – and also the need for ballast water management in inner-European shipping.
Risk Assessment of Ballast Water Mediated Species Introductions into the Baltic Sea
- 77 -
Acknowledgements Grateful thanks are expressed to Tadas Navickas (HELCOM) for constructive advice and introduction to the HELCOM AIS* and to Ulrika Borg (Swedish Maritime Safety Inspectorate), Karin Hoffren (Swedish Maritime Administration) and Melanie Josefsson (Swedish Environment Protection Agency) for comments on the 1st draft of this report, which considerably improved the report content. Marjo Paavola (née Pienimäki, Åbo Akademi University (AAU), Finland) provided ballast data for the Port of Sköldvik. Sergej Olenin (Klaipeda University, Lithuania) is acknowledged for general comments and ballast water as well as shipping data for the Port of Klaipeda. We are grateful to Jeremy Firestone (Graduate College of Marine Studies, University of Delaware, USA) for permission to use Fig. 2.2, and Marjo Paavola, Patrik Kraufvelin, Markus Helavuori (AAU) and Ari Laine (Finnish Institute of Marine Research) for permission to use Fig. 4.2. We further thank Martin Bilio (Germany) for reading the text of the Mnemiopsis section in the target species chapter and pertinent advice, and Stefan Heinänen (AAU) for the preparation of the maps, layout and other technical assistance.
Risk Assessment of Ballast Water Mediated Species Introductions into the Baltic Sea
- 78 -
References Amerini G 2005. Statistic kurz gefasst. Eurostat, Verkehr 9/2005, 11 pp Australian Quarantine and Inspection Service (AQIS) 1994. Bio-Economic Risk
Assessment of the Potential Introduction of Exotic Organisms Through Ship's Ballast Water. Ballast Water Research Series Rept 6, Australian Government Publishing Service, Canberra, 47 pp
Baltic Alien Species Database 2006. Species Directory. Olenin S, Leppäkoski E, Daunys D (eds). Last update 5 January 2006. www.ku.lt/nemo/mainnemo.html
Bax N, Carlton JT, Mathews-Amos A, Haedrich RL, Howarth FG, Purcell JE, Rieser A, Gray A 2001. The control of biological invasions in the world’s oceans. Conservation Biology 15, 1234-1246
Bax N, Williamson A, Aguero M, Gonzalez E, Geeves W 2003. Marine invasive alien species: a threat to global biodiversity. Marine Policy 27, 313–323
Bilio M 2004. The invasion of the Caspian Sea by Mnemiopsis leidyi: Research and management needs. BISRAG, Baku, 6-7 September 2004, Meeting Results, Appendix 15. www.caspianenvironment.org
Bilio M, Niermann U 2004. Is the comb jelly really to blame for it all? Mnemiopsis leidyi and the ecological concerns about the Caspian Sea. Marine Ecology Progress Series 269, 173-183
Briggs JC 1974. Marine Zoogeography. McGraw-Hill, New York. 475 pp BSRC/HELCOM/COLAR 2005. Report of the BSRP/HELCOM/COLAR Workshop
Ballast water introductions of alien species into the Baltic, 21-25 February 2005, Palanga, Lithuania. http://sea.helcom.fi/dps.html (Monitoring and Assessment Group (MONAS))
Carlton JT 1985. Transoceanic and interoceanic dispersal of coastal marine organisms: The biology of ballast water. Oceanography and Marine Biology Annual Review 23, 313-371
Carlton JT 1996. Marine bioinvasions: The alteration of marine ecosystems by nonindigenous species. Oceanography 9, 36-43
Claudi R, Ravishankar TJ 2006. Quantification of risks of alien species introductions associated with ballast water discharge in the Gulf of St. Lawrence. Biological Invasions 8, 25-44
Cohen AN, Carlton JT 1998. Accelerating invasion rate in a highly invaded estuary. Science 279, 555-558
Corbett JJ, Firestone J 2004. Application of Decision Support Model to Reduce the Risk of Introduction of Aquatic Organisms by Maritime Commerce: Chesapeake Bay and Miami Regions," Proposal submitted to Delaware/NOAA Sea Grant
COWI 1998. Existing and Future Shipping through the Baltic Sea. Tacis, DG 1a. 83 pp Dragsund E, Andersen AB, Gollasch S, ten Hallers-Tjabbes CC, Skogen K 2005. Ballast
Water Scoping Study. Det Norske Veritas, Report 2005-0638, 82 pp Drake LA, Meyer AE, Forsberg RL, Baier RE, Doblin MA, Heinemann S, Johnson WP,
Koch M, Rublee PA, Dobbs FC 2005. Potential invasion of microorganisms and pathogens via ‘interior hull fouling’: biofilms inside ballast water tanks. Biological Invasions 7, 969-982
Risk Assessment of Ballast Water Mediated Species Introductions into the Baltic Sea
- 79 -
Ekman S 1953. Zoogeography of the Sea. Sidgwick & Jackson Ltd., London, 417 pp Firestone J, Cass ND, Corbett JJ, Winebrake JJ 2004. Risk-based Decision-making and
Optimization in Ballast Water Policy Development, 13th International Conference on Aquatic Invasive Species, Ennis, Ireland, http://www.icais.org/pdf/22Wednesday/ A/wed_a_e_am/Firestone%20-%20Wed%20930%20Session%20A.pdf
GESAMP 1997. Opportunistic settlers and the problem of the ctenophore Mnemiopsis leidyi invasion in the Black Sea. GESAMP Reports and Studies 58, 84 pp
Gollasch S 1996. Untersuchungen des Arteintrages durch den internationalen Schiffsverkehr unter besonderer Berücksichtigung nichtheimischer Arten. Diss., Univ. Hamburg; Verlag Dr. Kovac, Hamburg, 314 pp
Gollasch S 2002. Hazard analysis of aquatic species invasions. In: Leppäkoski E, Gollasch S, Olenin S (eds) Invasive Aquatic Species of Europe. Distribution, Impacts and Management. Kluwer Academic Publishers, Dordrecht, The Netherlands, pp 447−455
Gollasch S 2006. Overview on introduced aquatic species in European navigational and adjacent waters. Helgoland Marine Research (accepted)
Gollasch S, Leppäkoski E1999. Initial risk assessment of alien species in Nordic coastal waters. In: Gollasch S, Leppäkoski E (eds) Initial Risk Assessment of Alien Species in Nordic Coastal Waters. Nord 1999: 8. Nordic Council of Ministers, Copenhagen, pp 1-124
Gollasch S, Rosenthal H, Botnen H, Hamer J, Laing I, Leppäkoski E, Macdonald E, Minchin D, Nauke M, Olenin S, Utting S, Voigt M, Wallentinus I 2000. Fluctuations of zooplankton taxa in ballast water during short-term and long-term ocean-going voyages. International Review of Hydrobiology 85, 597-608
Gollasch S, MacDonald E, Belson S, Botnen H, Christensen JT, Hamer JP, Houvenaghel G, Jelmert A, Lucas I, Masson D, McCollin T, Olenin S, Persson A, Wallentinus I, Wetsteyn LPMJ, Wittling T 2002. Life in ballast tanks. In: Leppäkoski E, Gollasch S, Olenin S (eds) Invasive Aquatic Species of Europe. Distribution, Impacts and Management. Kluwer Academic Publishers, Dordrecht, The Netherlands, pp 217-231
Gray DK, Bailey SA, Duggan IC, MacIsaac HJ 2005. Viability of invertebrate diapausing eggs exposed to saltwater: implications for Great Lakes’ ship ballast management. Biological Invasions 7, 531-539
Grigorovich IA, Colautti RI, Mills EL, Holeck K, Ballert AG, MacIsaac HJ 2003. Ballast-mediated animal introductions in the Laurentian Great Lakes: retrospective and prospective analyses. Canadian Journal of Fisheries and Aquatic Sciences 60, 740-756
Hänninen S 2004. [Estimates of traffic and cargo flows in Baltic Sea shipping.] Merenkulkulaitoksen julkaisuja 4/2004 [Publications of the Finnish Maritime Administration] (in Finnish)
Hänninen S, Rytkönen J 2004. Oil transportation and terminal development in the Gulf of Finland. VTT Publications 547, 141 pp
Hayes KR 1997. A review of ecological risk assessment methodologies. CRIMP Technical Report 13, CSIRO Marine Research, Australia, 49 pp
Hayes KR 1998a. Bayesian statistical inference in ecological risk assessment. CRIPM Technical Report 17. CSIRO Marine Research, Australia, 55 pp
Risk Assessment of Ballast Water Mediated Species Introductions into the Baltic Sea
- 80 -
Hayes KR 1998b. Ecological risk assessment for ballast water introductions: A suggested approach. ICES Journal of Marine Science 55, 201-212
Hayes KR, Hewitt CL 1998. A Risk Assessment Framework for Ballast Water Intro-ductions. CRIMP Technical Report 14, Division of Marine Research, CSIRO, Hobart. 75 pp
Hayes KR, Hewitt CL 2000. Quantitative biological risk assessment of the ballast water vector: an Australian approach. In: Pederson J (ed) Marine Bioinvasions, Proceedings of the First National Conference, January 24-27, pp 370-386. Massachusetts Institute of Technology, Sea Grant College Program, Boston, Massachusetts
Hayes KR, Sliwa C 2003. Identifying potential marine pests – a deductive approach applied to Australia. Marine Pollution Bulletin 46, 91-98
HELCOM MARITIME 2004. Draft HELCOM Recommendation ”Measures to address the Threat of Invasive Species transported via the Ballast Water of Ships”, Copenhagen, Denmark, 26-28 October 2004. http://sea.helcom.fi/dps/docs/ documents /Maritime%20Group/HELCOM%20MARITIME%203,%202004/7-1.pdf
IMO 2004. International Convention for the Control and Management of Ballast Water and Sediments, http://www.imo.org/home.asp
IUCN Guidelines for the Prevention of Biodiversity Loss caused by Alien Invasive Species. Prepared by the SSC Invasive Species Specialist Group. Approved by the 51st Meeting of the IUCN Council, Gland Switzerland, February 2000. http:// iucn.org/themes/ssc/pubs/policy/invasivesEng.htm#ERADICATION%20AND%20 CONTROL
Kerckhof F, Vink RJ, Nieweg DC, Post JNJ 2006. The veined whelk Rapana venosa has reached the North Sea. Aquatic Invasions 2006(1)
Kolar CS, Lodge DM 2002. Ecological predictions and risk assessment for alien fishes in North America. Science 298, 1233-1236
Laine AO, Mattila J, Lehikoinen A 2006. First record of the brackish water dreissenid bivalve Mytilopsis leucophaeata in the northern Baltic Sea. Aquatic Invasions 1, 38-41
Leppäkoski E 2002. Harmful non-native species in the Baltic Sea - an ignored problem. In: Schernewski G, Schiewer U (eds) Baltic Coastal Ecosystems: Structure, Function and Coastal Zone Management. Central and Eastern European Development Studies, Springer-Verlag, Berlin Heidelberg, pp 253-275
Leppäkoski E, Olenin S 2000. Xenodiversity of the European brackish water seas: the North American contribution. In: Pederson J (ed) Marine Bioinvasions: Proceedings of the First National Conference, Massachusetts Institute of Technology, January 24-27, 1999, pp 107-119
Leppäkoski E, Olenin S 2001. The meltdown of biogeographical peculiarities of the Baltic Sea: the interaction of natural and man-made processes. Ambio 30, 202-209
Leppäkoski E, Olenin S, Gollasch S 2002. The Baltic Sea –a field laboratory for invasion biology. In: Leppäkoski E, Gollasch S, Olenin S (eds) Invasive Aquatic Species of Europe. Distribution, Impacts and Management, Kluwer Academic Publishers, the Netherlands, pp 253-259
Lloyds Register/Fairplay 2003. Ports & Terminal Guide 2003. Lloyds Register/Fairplay, Surrey, United Kingdom, published on CD-ROM
Risk Assessment of Ballast Water Mediated Species Introductions into the Baltic Sea
- 81 -
MacIsaac HJ, Robbins TC, Lewis MA 2002. Modelling ship's ballast water as invasion threats to the Great Lakes. Canadian Journal of Fisheries and Aquatic Sciences 59: 1245-1256
Magnusson K 1998. Ballast water handling on ships calling Swedish ports. SSPA Marine Consulting Report 974232-2, 34 pp
Mann R, Occhipinti A, Harding JM (eds) 2004. Alien Species Alert: Rapana venosa (veined whelk). Prepared by the Working Group on Introductions and Transfers of Marine Organisms (WGITMO). ICES Research Report 264, 14 pp
Matheickal J, Raaymakers S, Tandon R (eds) 2004. Ballast Water Treatment R & D Directory. 2nd Edition. Global Ballast Water Management Programme, London. 119 pp
Niimi AJ 2004. Role of container vessels in the introduction of exotic species. Marine Pollution Bulletin 49, 778-782
Nyberg C, Wallentinus I 2005. Can species traits be used to predict marine macroalgal introductions? Biological Invasions 7, 265-279
Occhipinti-Ambrogi A, Galil BS 2004. A uniform terminology on bioinvasions: a chimera or an operative tool? Marine Pollution Bulletin 49, 688-694
Ojaveer H, Leppäkoski E, Olenin S, Ricciardi A 2002. Ecological impact of Ponto-Caspian invaders in the Baltic Sea, European inland waters and the Great Lakes: an inter-ecosystem comparison. In: Leppäkoski E, Gollasch S, Olenin S (eds) Invasive Aquatic Species of Europe. Distribution, Impacts and Management. Kluwer Academic Publishers, Dordrecht, The Netherlands, pp 412-425
Olenin S, Olenina I, Daunys D, Gasiûnaitë Z 1999. The harbour profile of Klaipëda, Lithuania. In: Gollasch S, Leppäkoski E (eds) Initial Risk Asessment of Alien Species in Nordic Coastal Waters. Nord 1999: 8. Nordic Council of Ministers, Copenhagen, pp 185-202
Olenin S, Gollasch S, Jonusas S, Rimkute I 2000. En-route investigations of plankton in ballast water on a ship´s voyage from the Baltic to the open Atlantic coast of Europe. International Review of Hydrobiology 85, 577-596
Paavola M, Laine AO, Kraufvelin P, Helavuori M Profiling four brackish water harbours: faunal composition and invasion status (manuscript in prep.)
Paavola M, Olenin S, Leppäkoski E 2005. Are invasive species most successful in habitats of low native species richness across European brackish water seas? Estuarine, Coastal and Shelf Science 64, 738-750
Pienimäki M 2002. Nonindigenous species in Finnish inland waters – is the biological integrity threatened? MSc Thesis, Dept. of Biology, Åbo Akademi University, 91 pp (in Swedish, with English summary)
Pienimäki M, Leppäkoski E 2004. Invasion pressure to the Finnish Lake District: invasion corridors and barriers. Biological Invasions 6, 331-346
Radziejewska T, Gruszka P, Rokicka-Praxmajer J 2004. A home away from home: a meiobenthic assemblage in a ship’s ballast water tank sediment. Poster presented at 5th Baltic Sea Science Congress 20-24 June 2005, Sopot, Poland
Raaymakers S (ed) 2002. Baltic Regional Workshop on Ballast Water Management, Tallinn, Estonia, 22-24 Oct. 2001: Workshop Report. GloBallast Monograph Series 2, IMO London
Rytkönen J, Siitonen L, Riipi T, Sassi J, Sukselainen J 2002. Statistical Analyses of the
Risk Assessment of Ballast Water Mediated Species Introductions into the Baltic Sea
- 82 -
Baltic Maritime Traffic. VTT Research Report VAL34-012344, Espoo. 108 pp Royal Haskoning, 2004. Ballast water risk assessment for Dutch ports. Transport, Public
Works and Water Management, North Sea Directorate, Report No. 9P5983. Shiganova TA, Mirzoyan ZA, Studenikina EA, Volovik SP, Siokou-Frangou I,
Zervoudaki S, Christou ED, Skirta AY, Dumont HJ 2001. Population development of the invader ctenophore Mnemiopsis leidyi, in the Black Sea and in other seas of the Mediterranean Basin. Marine Biology 139, 431-445
Sikorski AV, Bick A 2004. Revision of Marenzelleria Mesnil, 1896 (Spionidae, Polychaeta). Sarsia 89, 253-275
Simberloff D, Alexander M 1994. Issue paper on biological stressors. Ecological Risk Assessment Issue Papers, EPA/630/R-94/009, U.S. EPA, Washington DC
Streftaris N, Zenetos A, Papathanassiou E 2005. Globalisation in marine ecosystems: The story of non-indigenous marine species across European seas. Oceanography and Marine Biology Annual Review 43, 419-453
UNEP 2005. Global International Waters Assessment; Baltic Sea. Lääne A, Kraav E, Titova G (eds). GIWA Regional Assessment 17, 88 pp
Vermeij GJ 1996. An agenda for invasion biology. Biological Conservation 78, 3-9 Vink RJ, Post JNJ 2005. Rapana venosa: een nieuwe exoot voor Nederland. Straatgras
17(3), 49 WGBOSV 2005. Report of the ICES/IOC/IMO Working Group on Ballast and Other
Ship Vectors (WGBOSV). Arendal, Norway, March 14-18 2005, 91 pp. www.ices.dk
World Bank 2005. Trade and Transport Facilitation Audit of The Baltic States: On a Fast Track to Economic Development, 181 pp
Xenellis G 2005. Short Sea Shipping. Statistics in Focus 2/2005, 7 pp Zaitsev Y, Alexandrov B et al. 2003. Port Biological Baseline Surveys, Final Report, Port
of Odessa, Ukraine (August - December 2001). Odessa Branch, Institute of Biology of Southern Seas, National Academy of Sciences of Ukraine and International Maritime Organization
Risk Assessment of Ballast Water Mediated Species Introductions into the Baltic Sea
- 83 -
Annex 1 Consistency with other regional risk assessment guidelines and strategies This annex is focussed on experience of other national and international risk assessments as well as the IMO Ballast Water Management Convention and relevant guidelines. 1 Risk Assessment Recommendations in IMO Assembly Resolution 868(20) The following paragraphs were extracted from the IMO Guidelines in Assembly Resolution 868(20) and are included here for reasons of comparison. It should be noted that new risk assessment guidelines are in preparation by MEPC and are referred to further below. The objectives of these Guidelines are to assist Governments and appropriate authorities, ship masters, operators and owners, and port authorities, as well as other interested parties, in minimizing the risk of introducing harmful aquatic organisms and pathogens from ships' ballast water and associated sediments. The selection of appropriate methods will depend upon several factors, including the type of organisms being targeted, the level of risk involved, its environmental acceptability, the economic and ecological costs involved and the safety of ships. The following is provided for the guidance of port State authorities in the implementation of their ballast water management programme, and to assess risks in relation to ballast water containing harmful aquatic organisms.
• Conditions between uptake and discharge ports Significantly different conditions may exist between port(s) of origin and the port in which ballast water is discharged (e.g., freshwater ballast released into highly saline ports). There is a lower probability of species establishment under such transport events.
• Ballast water age The time during which ballast water is kept in ballast tanks may be a factor determining the number of surviving organisms, because of the absence of light, decreasing nutrients and oxygen, changes of salinity and other factors. Water older than 100 days could be considered to contain a substantially lower number of organisms compared to the day of uptake. Ballast water and sediments may contain dinoflagellate cysts and other resting stages capable of surviving for a much longer time.
• Presence of target organisms Under certain circumstances it may be possible to determine if one or more target species are present in the water of a specific port and have been ballasted in a ship. In these circumstances, the receiving port State authority may invoke management measures accordingly. Even if such target species are not present, the ship may still be carrying many untargeted species which, if released in new
Risk Assessment of Ballast Water Mediated Species Introductions into the Baltic Sea
- 84 -
waters, could be potentially harmful. Port States are encouraged to carry out biological baseline surveys in their ports and to disseminate the results of their investigations.
Consistent with the precautionary approach to environmental protection, these Guidelines can apply to all ships unless specifically exempted (according to Regulation A-4) by a port State authority within its jurisdiction. Port State authorities should inform the IMO on how the Guidelines are being applied. Compliance monitoring should be undertaken by port State authorities by, for example, taking and analysing ballast water and sediment samples to test for the continued survival of harmful aquatic organisms and pathogens. 2 Risk Assessment Requirements in IMO Ballast Water Management Convention The BWC provides requirements relevant to risk assessment. In particular, Regulation A-4 of this Convention allows Parties to exempt vessels from compliance to ballast water management procedures prior to discharge for up to 5 years if an acceptably low risk can be discerned. Currently MEPC develops a guideline relevant to risk assessment, i.e. Guidelines for Risk Assessment to Grant Exemptions under Regulation A-4. The following paragraphs were extracted and slightly modified from the risk assessment guideline, being presently in an advanced preparational stage. Changes to the paragraphs below may occur until the final version of this guideline is agreed upon at IMO. The port State granting exemptions shall give special attention to Regulation A-4.3 which states that any exemptions granted under this regulation shall not impair or damage the environment, human health, property or resources of adjacent or other States. Once the level of risk has been assessed, the result can be compared to the level of risk a Party is willing to accept in order to determine whether an exemption can be granted. An assessment should be deemed high risk if it identifies at least one species that is likely to:
• cause harm and being present in the donor port or region, • be transferred to the recipient port, and • survive in the recipient port.
It is recommended that a third party peer review of the risk assessment method and data used and the assumptions made, be undertaken in order to ensure the most appropriate data and risk assessment methods have been used. The peer review should be undertaken by an independent third party with biological and risk assessment expertise.
Risk Assessment of Ballast Water Mediated Species Introductions into the Baltic Sea
- 85 -
There are several main procedural options for granting exemptions in accordance with Regulation A-4. The options include:
• the Party undertakes a risk assessment for trade routes and ships to determine whether an exemption can be granted for a specific voyage or voyages,
• the Party undertakes a risk assessment for a voyage or voyages on request of an exemption from a ship owner or operator, and
• a ship owner or operator may undertake a risk assessment for a voyage or voyages using the Party’s risk assessment model and subsequently applies to a Party for an exemption for a specific voyage or voyages.
Ships on a voyage(s) or route(s) that satisfy the requirements of Regulation A-4.1 and that pass(es) the terms of acceptance in the risk model may be granted an exemption. The result of the risk assessment should be stated as:
• the voyage(s) or route(s) represent(s) an acceptable risk. The application for an exemption may be granted,
• the voyage(s) or route(s) may represent an unacceptable risk. Further consideration is required, and
• the voyage(s) or route(s) represent(s) an unacceptable risk. The exemption from the ballast water management requirements of the Convention should not be granted.
It is recommended that an intermediate review be undertaken within [12]25 months but in any circumstances no later than [36] months after permission is granted. A recipient port State may require several reviews to be taken during the period the exemption is granted for, but more frequent than annual reviews generally should not be required. No renewal of an exemption following the initial 60 months may be granted without a thorough review of the risk assessment and consultation with affected States. An exemption granted under Regulation A-4 of the Convention may need to be withdrawn in the event of an emergency situation. Emergency situations are outbreaks, infestations, or populations of harmful aquatic organisms and pathogens (e.g., harmful algal blooms) which are likely to be taken up in ballast water (Regulation C-2 of the Convention). 3 Risk assessment methods There are two risk assessment methods outlined in this guideline for assessing the risks in relation to granting an exemption in accordance with Regulation A-4 of the Convention:
• environmental matching risk assessment (i.e. salinity and temperature), and • species-specific risk assessment.
25 Square brackets indicate that its content is of controversial discussion.
Risk Assessment of Ballast Water Mediated Species Introductions into the Baltic Sea
- 86 -
3.1 Environmental matching risk assessment The data necessary to enable an assessment of risk using environmental matching between the donor port(s) or location(s) and the recipient port or location includes, but is not limited to:
• origin of the ballast water to be discharged in recipient port, • biogeographical region of donor port(s) or location(s). Biogeographical
regions applied should be clearly defined and based on appropriate criteria, and
• environmental parameters in donor port, bioregion and recipient port. This should include seasonal or monthly variations of salinity and temperature, taking into account: • depth stratification, • distance to fresh/marine water bodies, • tidal and anthropogenic influence on salinity regime, • seasonal freshwater influx, and • salinity classification: fresh, marine or between fresh and marine for the
entire year. 3.2 Species-specific risk assessment The data necessary to enable an assessment of risk using the species-specific risk assessment includes, but is not limited to:
• biogeographical region of donor and recipient ports or locations. The biogeographical regions applied should be clearly defined using appropriate criteria,
• the presence of all non-indigenous species (including cryptogenic species) in the donor port(s), location(s) or biogeographical regions,
• the presence of all non-indigenous species (including cryptogenic species) in the recipient port(s), location(s) or biogeographical regions,
• the difference between non-indigenous species (including cryptogenic species) or target species in the donor and recipient ports, locations or biogeographical regions,
• native species in the donor port(s) or location(s) not present in the recipient ports, locations or biogeographical regions that may impair or damage the environment, human health, property or resources, including, e.g.: • occurrence of harmful phytoplankton blooms in the donor area, and • occurrence of harmful organisms, pathogens or outbreaks and epidemics
in the donor port. • the presence of target species in the donor and recipient port(s), location(s)
or biogeographical regions if target species are used. Target species should be identified and agreed in consultation with affected States. Target species that may impair or damage the environment, human health, property or resources
Risk Assessment of Ballast Water Mediated Species Introductions into the Baltic Sea
- 87 -
may be selected and defined for a specific port, State or geographical region. The elements to consider when identifying target species include, but should not be limited to:
• evidence of prior introduction, • demonstrated impacts on environment, human health, property or resources, • strength and type of ecological interactions e.g. ecological engineers, • economic significance on property or resources, • current distribution, • relationship with vectors, and • available control mechanisms.
It should be noted that there are limitations involved with using a target species approach. Although some data and information can be obtained to support decision making, identifying species that may impair or damage the environment, human health, property or resources is largely subjective and there will be a degree of uncertainty associated with the approach. For example, it is possible that species identified as harmful in some environments may not be harmful in others and vice versa. Life history information from target species and physiological tolerances (e.g. temperature and salinity) of each life stage should be identified to determine the likelihood of the species completing its life cycle in the recipient port. The likelihood of target species surviving each of the ballast water operational stages should be assessed, including:
• uptake – probability of viable stages entering the vessel’s ballast water tanks during ballast water uptake operations,
• transfer – probability of survival during the voyage, and • discharge – probability of viable stages entering the recipient port through
ballast water discharge on arrival and probability of survival in the recipient port.
The total likelihood of survival of viable stages of target species in the recipient port should be a function of survival during each of the ballast water operational stages. To the extent possible the different life stages of the target species should be assessed considering seasonal variations of life stage occurrence in donor port areas with seasonal conditions in the recipient port. 4 International Council for the Exploration of the Sea At the last meeting of WGBOSV in March 2005 all risk assessment approaches relevant to biological invasions known were briefly reviewed with the aim to prepare a guidance document for consideration at IMO MEPC. The information WGBOSV provided was also reviewed in detail by ICES. The following paragraphs represent the ICES comments on risk assessment relevant to ballast water management.
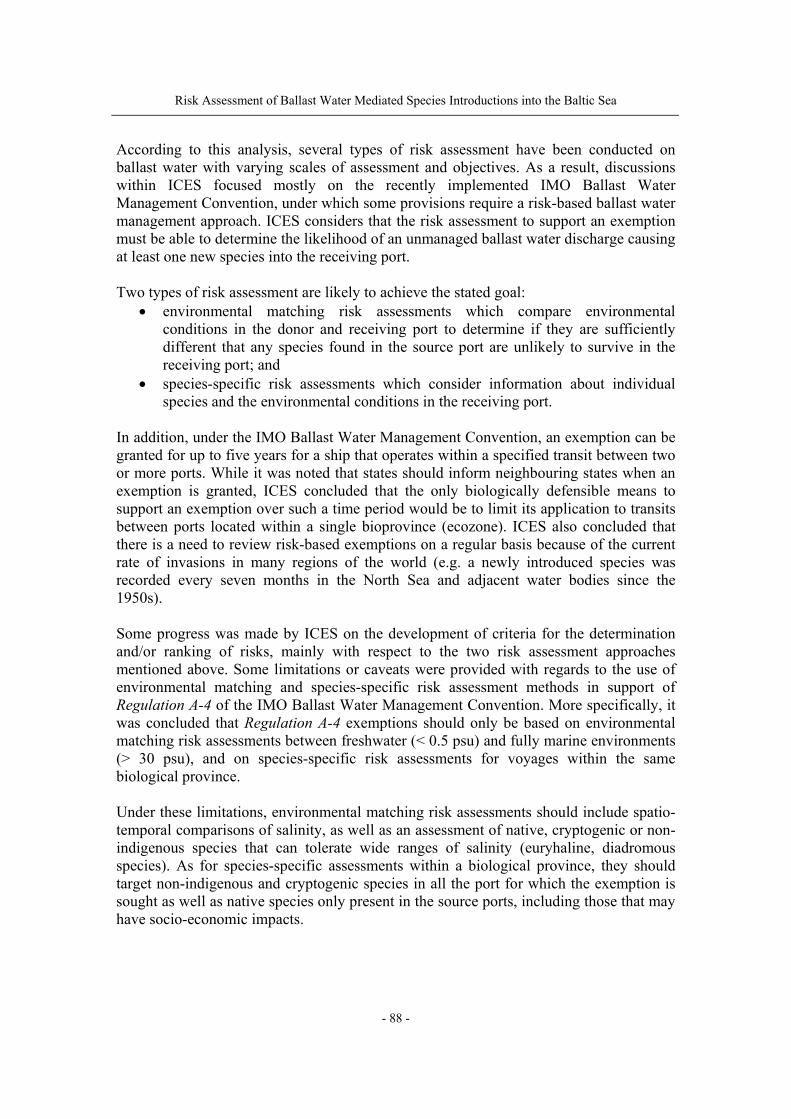
Risk Assessment of Ballast Water Mediated Species Introductions into the Baltic Sea
- 88 -
According to this analysis, several types of risk assessment have been conducted on ballast water with varying scales of assessment and objectives. As a result, discussions within ICES focused mostly on the recently implemented IMO Ballast Water Management Convention, under which some provisions require a risk-based ballast water management approach. ICES considers that the risk assessment to support an exemption must be able to determine the likelihood of an unmanaged ballast water discharge causing at least one new species into the receiving port. Two types of risk assessment are likely to achieve the stated goal:
• environmental matching risk assessments which compare environmental conditions in the donor and receiving port to determine if they are sufficiently different that any species found in the source port are unlikely to survive in the receiving port; and
• species-specific risk assessments which consider information about individual species and the environmental conditions in the receiving port.
In addition, under the IMO Ballast Water Management Convention, an exemption can be granted for up to five years for a ship that operates within a specified transit between two or more ports. While it was noted that states should inform neighbouring states when an exemption is granted, ICES concluded that the only biologically defensible means to support an exemption over such a time period would be to limit its application to transits between ports located within a single bioprovince (ecozone). ICES also concluded that there is a need to review risk-based exemptions on a regular basis because of the current rate of invasions in many regions of the world (e.g. a newly introduced species was recorded every seven months in the North Sea and adjacent water bodies since the 1950s). Some progress was made by ICES on the development of criteria for the determination and/or ranking of risks, mainly with respect to the two risk assessment approaches mentioned above. Some limitations or caveats were provided with regards to the use of environmental matching and species-specific risk assessment methods in support of Regulation A-4 of the IMO Ballast Water Management Convention. More specifically, it was concluded that Regulation A-4 exemptions should only be based on environmental matching risk assessments between freshwater (< 0.5 psu) and fully marine environments (> 30 psu), and on species-specific risk assessments for voyages within the same biological province. Under these limitations, environmental matching risk assessments should include spatio-temporal comparisons of salinity, as well as an assessment of native, cryptogenic or non-indigenous species that can tolerate wide ranges of salinity (euryhaline, diadromous species). As for species-specific assessments within a biological province, they should target non-indigenous and cryptogenic species in all the port for which the exemption is sought as well as native species only present in the source ports, including those that may have socio-economic impacts.
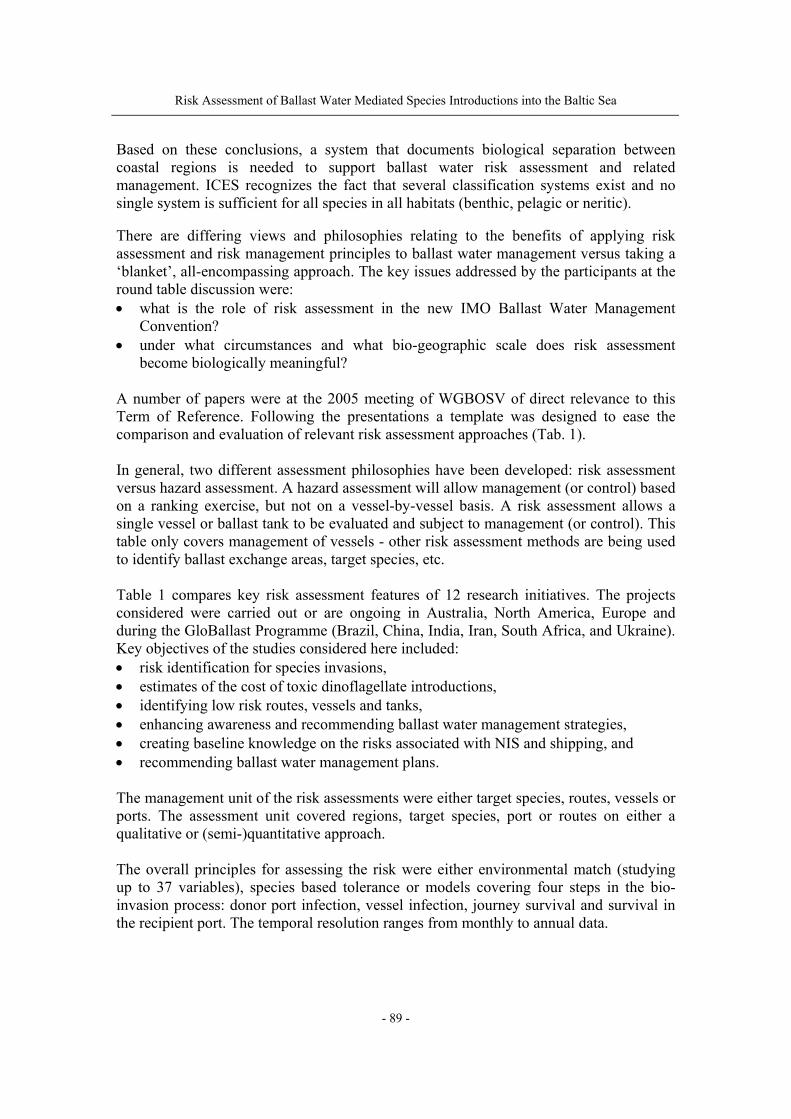
Risk Assessment of Ballast Water Mediated Species Introductions into the Baltic Sea
- 89 -
Based on these conclusions, a system that documents biological separation between coastal regions is needed to support ballast water risk assessment and related management. ICES recognizes the fact that several classification systems exist and no single system is sufficient for all species in all habitats (benthic, pelagic or neritic). There are differing views and philosophies relating to the benefits of applying risk assessment and risk management principles to ballast water management versus taking a ‘blanket’, all-encompassing approach. The key issues addressed by the participants at the round table discussion were: • what is the role of risk assessment in the new IMO Ballast Water Management
Convention? • under what circumstances and what bio-geographic scale does risk assessment
become biologically meaningful? A number of papers were at the 2005 meeting of WGBOSV of direct relevance to this Term of Reference. Following the presentations a template was designed to ease the comparison and evaluation of relevant risk assessment approaches (Tab. 1). In general, two different assessment philosophies have been developed: risk assessment versus hazard assessment. A hazard assessment will allow management (or control) based on a ranking exercise, but not on a vessel-by-vessel basis. A risk assessment allows a single vessel or ballast tank to be evaluated and subject to management (or control). This table only covers management of vessels - other risk assessment methods are being used to identify ballast exchange areas, target species, etc. Table 1 compares key risk assessment features of 12 research initiatives. The projects considered were carried out or are ongoing in Australia, North America, Europe and during the GloBallast Programme (Brazil, China, India, Iran, South Africa, and Ukraine). Key objectives of the studies considered here included: • risk identification for species invasions, • estimates of the cost of toxic dinoflagellate introductions, • identifying low risk routes, vessels and tanks, • enhancing awareness and recommending ballast water management strategies, • creating baseline knowledge on the risks associated with NIS and shipping, and • recommending ballast water management plans. The management unit of the risk assessments were either target species, routes, vessels or ports. The assessment unit covered regions, target species, port or routes on either a qualitative or (semi-)quantitative approach. The overall principles for assessing the risk were either environmental match (studying up to 37 variables), species based tolerance or models covering four steps in the bio-invasion process: donor port infection, vessel infection, journey survival and survival in the recipient port. The temporal resolution ranges from monthly to annual data.
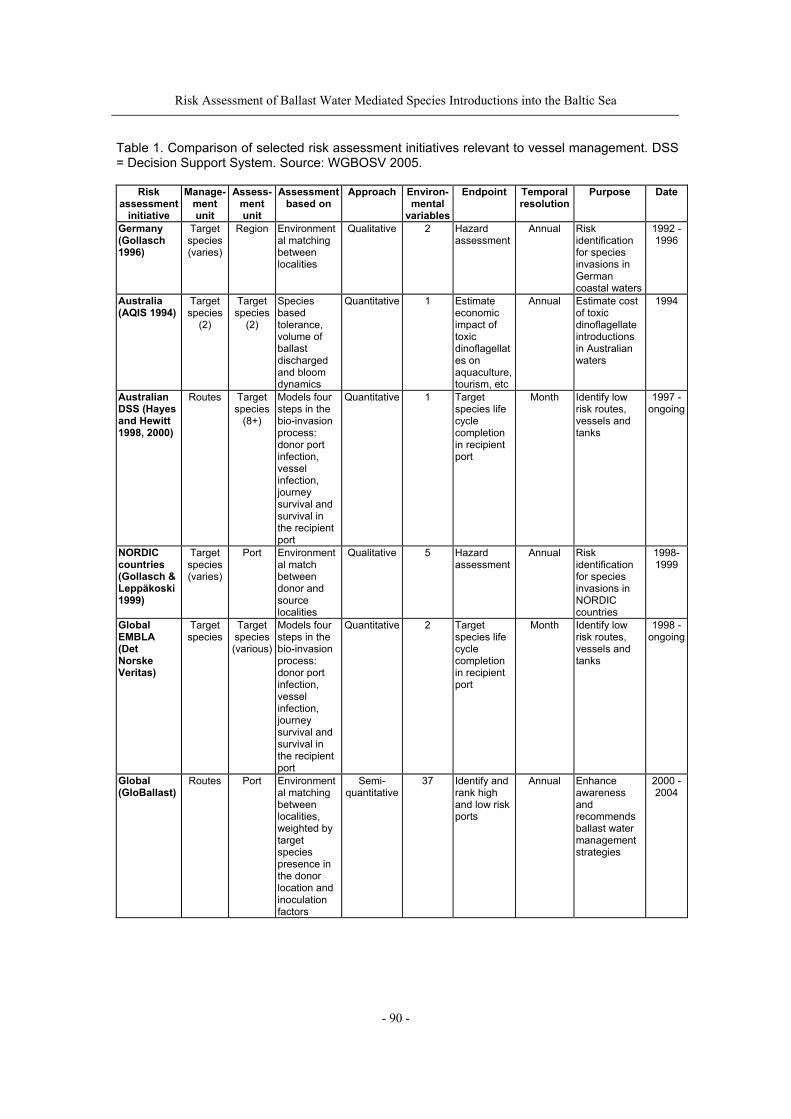
Risk Assessment of Ballast Water Mediated Species Introductions into the Baltic Sea
- 90 -
Table 1. Comparison of selected risk assessment initiatives relevant to vessel management. DSS = Decision Support System. Source: WGBOSV 2005.
Risk assessment
initiative
Manage-ment unit
Assess-ment unit
Assessment based on
Approach Environ-mental
variables
Endpoint Temporal resolution
Purpose Date
Germany (Gollasch 1996)
Target species (varies)
Region Environmental matching between localities
Qualitative 2 Hazard assessment
Annual Risk identification for species invasions in German coastal waters
1992 - 1996
Australia (AQIS 1994)
Target species
(2)
Target species
(2)
Species based tolerance, volume of ballast discharged and bloom dynamics
Quantitative 1 Estimate economic impact of toxic dinoflagellates on aquaculture, tourism, etc
Annual Estimate cost of toxic dinoflagellate introductions in Australian waters
1994
Australian DSS (Hayes and Hewitt 1998, 2000)
Routes Target species
(8+)
Models four steps in the bio-invasion process: donor port infection, vessel infection, journey survival and survival in the recipient port
Quantitative 1 Target species life cycle completion in recipient port
Month Identify low risk routes, vessels and tanks
1997 - ongoing
NORDIC countries (Gollasch & Leppäkoski 1999)
Target species (varies)
Port Environmental match between donor and source localities
Qualitative 5 Hazard assessment
Annual Risk identification for species invasions in NORDIC countries
1998-1999
Global EMBLA (Det Norske Veritas)
Target species
Target species (various)
Models four steps in the bio-invasion process: donor port infection, vessel infection, journey survival and survival in the recipient port
Quantitative 2 Target species life cycle completion in recipient port
Month Identify low risk routes, vessels and tanks
1998 - ongoing
Global (GloBallast)
Routes Port Environmental matching between localities, weighted by target species presence in the donor location and inoculation factors
Semi-quantitative
37 Identify and rank high and low risk ports
Annual Enhance awareness and recommends ballast water management strategies
2000 - 2004
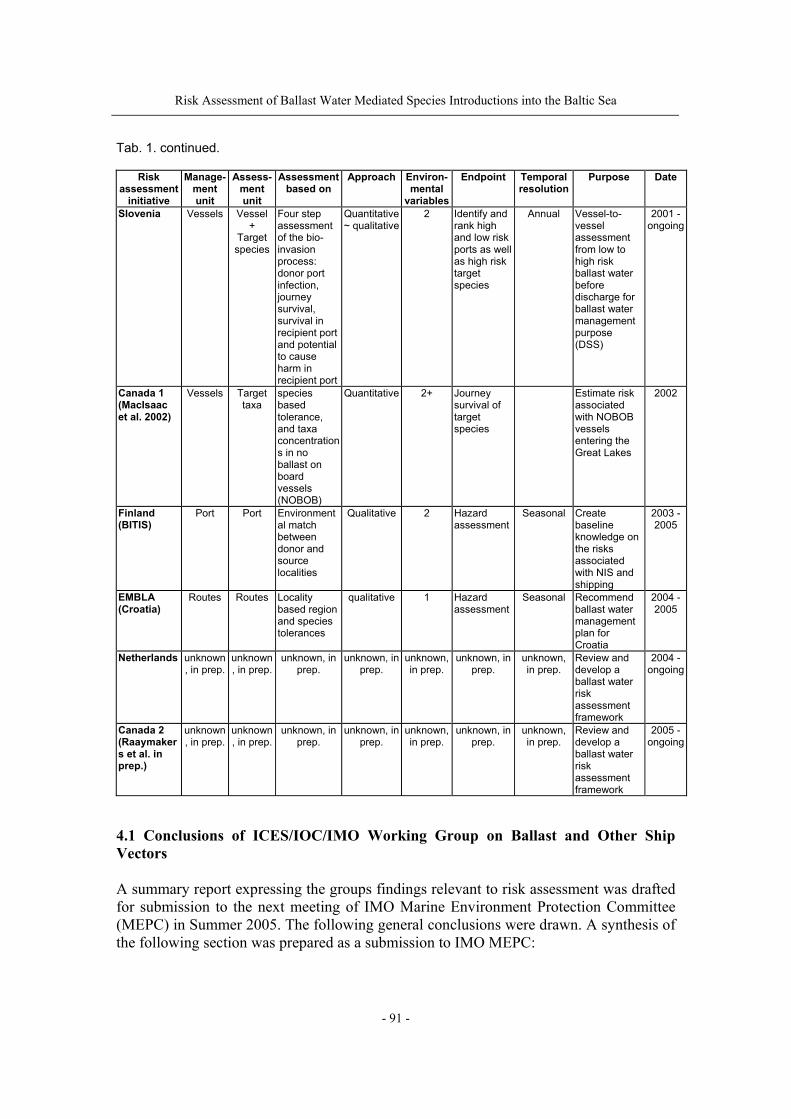
Risk Assessment of Ballast Water Mediated Species Introductions into the Baltic Sea
- 91 -
Tab. 1. continued.
Risk assessment
initiative
Manage-ment unit
Assess-ment unit
Assessmentbased on
Approach Environ-mental
variables
Endpoint Temporal resolution
Purpose Date
Slovenia Vessels Vessel +
Target species
Four step assessment of the bio-invasion process: donor port infection, journey survival, survival in recipient port and potential to cause harm in recipient port
Quantitative ~ qualitative
2 Identify and rank high and low risk ports as well as high risk target species
Annual Vessel-to-vessel assessment from low to high risk ballast water before discharge for ballast water management purpose (DSS)
2001 - ongoing
Canada 1 (MacIsaac et al. 2002)
Vessels Target taxa
species based tolerance, and taxa concentrations in no ballast on board vessels (NOBOB)
Quantitative 2+ Journey survival of target species
Estimate risk associated with NOBOB vessels entering the Great Lakes
2002
Finland (BITIS)
Port Port Environmental match between donor and source localities
Qualitative 2 Hazard assessment
Seasonal Create baseline knowledge on the risks associated with NIS and shipping
2003 - 2005
EMBLA (Croatia)
Routes Routes Locality based region and species tolerances
qualitative 1 Hazard assessment
Seasonal Recommend ballast water management plan for Croatia
2004 - 2005
Netherlands unknown, in prep.
unknown, in prep.
unknown, in prep.
unknown, in prep.
unknown, in prep.
unknown, in prep.
unknown, in prep.
Review and develop a ballast water risk assessment framework
2004 - ongoing
Canada 2 (Raaymakers et al. in prep.)
unknown, in prep.
unknown, in prep.
unknown, in prep.
unknown, in prep.
unknown, in prep.
unknown, in prep.
unknown, in prep.
Review and develop a ballast water risk assessment framework
2005 - ongoing
4.1 Conclusions of ICES/IOC/IMO Working Group on Ballast and Other Ship Vectors A summary report expressing the groups findings relevant to risk assessment was drafted for submission to the next meeting of IMO Marine Environment Protection Committee (MEPC) in Summer 2005. The following general conclusions were drawn. A synthesis of the following section was prepared as a submission to IMO MEPC:
Risk Assessment of Ballast Water Mediated Species Introductions into the Baltic Sea
- 92 -
WGBOSV notes that the IMO Risk Assessment Guidelines are to support the International Convention on the Management of Ships’ Ballast Water and Sediments. Specifically, Regulation A-4 that allows Parties to exempt vessels from compliance with ballast water management prior to discharge if an acceptably low risk can be discerned. WGBOSV discussed the application of risk assessment principles in relation to Regulation A-4 application. It was agreed that the risk assessment to support an exemption must be able to determine the likelihood of an unmanaged ballast water discharge causing at least one new species introduction into the receiving port. An additional requirement includes identifying whether the species is known or suspected to impair or cause harm to the environment, human health, property or resources to aid in determining whether the species is “harmful”. Under the IMO Ballast Water Management Convention an exemption can be granted for up to 5 years for a ship that operates within a specified transit between two or more ports. It was agreed that the only biologically defensible means to determine an evaluation of risk over this period would be to undertake a species specific exemption within a single bioprovince (defined below). We noted that states have to inform neighbour states when an exemption is granted. Concerns were expressed regarding whether or not neighbouring states will have the power to veto the exemption under the proposed convention. Several types of risk assessment have been conducted on ballast water with varying scales of assessment and objectives. Following significant discussion, it was agreed that the goal to achieve Regulation A-4 would be “to determine the likelihood of unmanaged ballast water discharge causing at least one new species introduction (defined either as discharge, establishment, or spread) into the receiving port”. It was agreed that two types of risk assessment are likely to achieve the stated goal. 4.1.1 Environmental matching risk assessments compare environmental conditions in the donor and receiving port to determine if they are sufficiently different that any species found in the source port are unlikely to survive in the receiving port.
• in order for environmental matching to “determine the likelihood of at least one new species introduction (defined either as discharge, establishment, or spread) into the receiving port”, the environmental conditions of the source region must represent the physiological tolerances of the species found in that region,
• environmental matching risk assessment (between freshwater and marine environments) should include seasonal comparisons of salinity, taking into account: o depth stratification, o distance to fresh/marine water bodies, o tidal and anthropogenic influence on salinity regime, and o seasonal freshwater influx.
• environmental matching risk assessments (between freshwater and marine environments) should include an assessment of native, cryptogenic or non-indigenous species, taking into account:
Risk Assessment of Ballast Water Mediated Species Introductions into the Baltic Sea
- 93 -
o species that require freshwater and marine environments to complete their life-cycle, including species migrating between waters of different salinity regimes, i.e. anadromous (e.g. sea lamprey) and catadromous (e.g. Chinese mitten crab) species, and
o species that are capable of surviving in both freshwater and marine environments.
• species-specific risk assessment is applicable for situations within biological regions, but port-to-port environmental matching is important when used between biological regions where there is a different species distribution,
• it was also discussed whether or not environmental matching will work with species that have resting stages,
• low-resolution information on receptor ports and broad data on tolerances for possible invaders complicate the task of risk assessment, and
• ship transit information is available from e.g. Lloyds of London, but this does not indicate where the ballast water originates because there are no records of ballasting and discharge.
4.1.2 Species-specific risk assessments consider information about individual species and the environmental conditions in the receiving port.
• species-specific risk assessments are most useful for a small suite of species and rapidly lose the ability to discern ‘low-risk’ scenarios with increasing numbers of species,
• given that many species may cause harm when introduced to new locations and the uncertainties associated with the large numbers of native species that are present in a source region, we recommend that species-specific risk assessments should only be conducted where the source and receiving ports share a majority of native species. This will enable the focus of a species-specific risk assessment to be restricted to those species that are non-native in the source and receiving ports, and any unshared species that may be harmful,
• species-specific risk assessment (within a biological province) should identify: o the presence of all non-indigenous species (including cryptogenic species)
in the ports or locations for which the exemption is sought, o the difference between non-indigenous species (including cryptogenic
species) in the donor and receiving ports or locations, o those non-indigenous species (including cryptogenic species) that may
impair or damage the environment, human health, property or resources, and
o those rare instances of native species in the source port not present in the receiving ports that impair or damage the environment, human health, property or resources.
• species-specific risk assessments should be conducted on: o nonindigenous species (including cryptogenic species) that are present in
the donor port or locations but absent from the receiving port or location, o a list of actual or potentially harmful non-indigenous species (including
cryptogenic species) agreed between the affected parties, or
Risk Assessment of Ballast Water Mediated Species Introductions into the Baltic Sea
- 94 -
o a list of harmful native species agreed between the affected parties. • species-specific risk assessments may estimate various events in the process of
biological invasions. The two events recommended below are least sensitive to uncertainty - either of these should be used: o discharge of living organisms in the receiving ports or locations, and o completion of the species’ life cycle in the receiving ports or locations.
• species-specific risk assessments may consider multiple species. Exemptions should only be granted for assessments that consider ALL risk-assessed species as low risk, and
• for many species the Australian risk assessment approach delivers helpful data but as has been demonstrated by the target species Crassostrea gigas (Pacific oyster) the risk assessment results do not always correspond with observations. The model indicates that C. gigas would be able to grow north of Brisbane, but observations indicate it does not grow in this area. On the other hand the model results show unfavourable conditions for growth in Tasmania, however, C. gigas grows well there. As a result extreme values of tolerance need to be considered.
A system is needed that documents biological separation between coastal regions. These regions are defined as biological provinces (bioprovinces26). We recognize that several classification systems exist and no single system is sufficient for all species (i.e. most are applicable to benthic species but not pelagic or neritic). Determination and agreement of an acceptable system for the purpose of ballast water risk based exemptions requires significant scientific discussion and should be fit for purpose. 4.1.3 Risk assessment application When using environmental matching, a limited suite of these parameters are likely to be the prime drivers of invasion success, adding further variables can have little effect and can create “noise” around the signal. Examining the signal:noise ratio one can seek to identity the most important versus less important variables required for the risk assessment. However, adding too many variables may make the signal become less obvious resulting in a lack of risk resolution. Some environmental overlap exists between all bioprovinces based on two relevant environmental parameters (temperature and salinity). This suggests that environmental matching between a source province and a receiving port will represent high risk in virtually all instances. 26 Bioprovince = an area within which the animal and plant species show a high degree of similarity. Examples of the biological provinces of the world are provided in Annex 5. Additional expertise is required in order to finalize the provinces and boundaries between them. We note that all boundaries between biological provinces overlap. Ekman and Briggs used predominantly physical processes to define bioprovinces, but this should be updated to include latest work. Also consider demographic process, allee effects, low carrying capacity. How are geographic regions be defined? If one takes propagules and move them to a new location if there are allee effects the movement will erode the boundary between regions. As a result the marine border idea needs to be specified. Seasonal issues and impacts should also be included (e.g. harmful Algal Blooms may be seasonally a problem but not throughout the year). Biogeographic boundaries are integrating these complex processes. Is there gene flow across boundaries? Does it contribute to establishment of genetic material from elsewhere.
Risk Assessment of Ballast Water Mediated Species Introductions into the Baltic Sea
- 95 -
One exception is noted: comparison of freshwater [< 0.5 psu] and fully marine [> 30 psu] environments. This exception will require a more detailed risk assessment outlined below.
Therefore, in reviewing the use of both types of risk assessment, WGBOSV recommends that:
• neither environmental matching nor species-specific risk assessed exemptions under Regulation A-4 are scientifically justified for voyages that start and end between contiguous or non-contiguous biological provinces with the exception below, and
• Regulation A-4 exemptions should only be based on: o environmental matching risk assessments between freshwater [< 0.5 psu]
and fully marine [> 30 psu] environments, and o species-specific risk assessments for voyages that start and end within the
same biological province. Parties considering exemptions should consult any State that the Parties determine may be adversely affected by the species included, or explicitly excluded, in the risk assessment. 4.1.4 Other considerations Risk based exemptions should be reviewed every 12 months and no later than 24 months because of the current rate of invasions in many regions of the world (e.g. a newly introduced species was recorded every 7 months in the North Sea and adjacent water bodies since 1950s). Provision for rapid [< 14 days] suspension, cessation or immediate review of the exemption should be made for circumstances such as:
• outbreaks or infestations of harmful aquatic organisms (including algal blooms) or pathogens in the donor port,
• detection of new non-indigenous species (including cryptogenic species) in the donor port,
• new evidence of harmful behaviour by any species in the donor port, and • significant and enduring change in environmental conditions in the donor and/or
receiving ports or locations (e.g. diversion of fresh or saline water flow, new warm effluent discharge of e.g. power plants).
Biogeographic considerations associated with natural dispersal, oceanographic connectivity between locations, the distribution of known introduced marine pests and operational limitations of ships operating on “regional routes” must be considered when developing risk assessment approaches further.
Risk Assessment of Ballast Water Mediated Species Introductions into the Baltic Sea
- 96 -
5 OSPAR (IGSS) Scoping Study (Dragsund et al. 2005) Vessels visiting European ports will need to undertake ballast water exchange until treatment systems are available and installed onboard. Treatment facilities on board will be required from 2014/2016 onwards for existing vessels or from 2009/2012 onwards for new-built vessels. According to Royal Haskoning (2004) two possible approaches are identified with respect to ballast water management: Option 1 The blanket approach:
• all ballast water should be managed (exchange or treatment) prior to discharge without exemptions. This approach will likely be implemented in the North American Great Lakes from 2008,
• due to safety reasons or other accepted circumstances, some ships may not be able to carry out a ballast water exchange. These cases need to be documented by the ship, and
• ballast water exchange is accepted until IMO approved treatment systems are available.
Option 2 The selective approach allows for exemptions based on the results of risk assessments. This approach encloses three options for granting exemptions, when the results of risk assessment considers to be of a low risk to allow discharge without performing ballast water exchange or treatment:
• exemptions on a regional basis (i.e. vessels intending to discharge ballast water only from ports within the identical bioprovince) are not required to manage ballast water,
• trade/ship-type specific exemptions (i.e. vessels operated on regular routes between the same ports or port areas), and
• voyage specific exemptions. The selective approach requires a standardised risk assessment method (e.g. monitoring of NIS) and a warning system to report outbreaks of unwanted species, such as harmful algal blooms. However, a selective target species approach will leave the ballast water recipient region unprotected of invasions of non-target species. In case risk assessment is decided to be useful in North West Europe to reduce the risk of ballast water mediated species invasions risk mitigation strategies need to be developed for high-risk shipping routes which is currently lacking. Dragsund et al. (2005) support the conclusions drawn by Royal Haskoning (2004) that: “although the blanket approach will give the best protection against unwanted introductions, it does not seem feasible since this imposes all the ship owners with the costs involved with ballast water management, irrespective of the risk of discharge of unmanaged ballast water.” This leaves the selective approach as the preferred option.
Risk Assessment of Ballast Water Mediated Species Introductions into the Baltic Sea
- 97 -
6 BSRP/HELCOM/COLAR Workshop on “Ballast water introductions of alien species into the Baltic Sea” The workshop was held 21-25 February 2005, Palanga, Lithuania with the objectives to:
• assess the applicability of risk assessment and port baseline survey methodologies developed under the IMO GloBallast and other relevant projects for the Baltic Sea,
• evaluate the research capacity, technical potential and financial resources needed for the risk assessment and the port baseline surveys,
• elaborate common principles for the monitoring system of invasive species in the Baltic Sea, and
• develop a common information system for the Baltic Sea supporting the implementation of the IMO Ballast Water Management Convention.
6.1 HELCOM action to address ballast water issue The Workshop discussed the draft HELCOM Recommendation “Measures to address the threat of invasive species transported via the ballast water of ships” (October 2004) elaborated in accordance with the IMO’s BWC. The Workshop also agreed that because of the geographical characteristics of the Baltic Sea (a mean depth of 55 metres; all areas deeper than 200 m are within less than 50 nautical miles to the nearest land) the requirements of the BMWC (Regulation B-4, paragraphs 1.1. and 1.2.) for conducting ballast water exchange cannot be met in the Baltic Sea. An evaluation of the suitability of designating areas in the Baltic where a ship may conduct ballast water exchange, in accordance with Regulation B-4, paragraph 2, must be made by the port states. Ballast water exchange within the Baltic may prevent the spread of freshwater invasive alien species from one freshwater Baltic port to another. However, the ballast water exchange should not be considered as the only effective measure for managing ballast water within the Baltic. Development of risk assessment methodology and other tools (biological surveys, monitoring, early-warning systems, appropriate treatment of ballast water) is extremely important for prevention of ballast water mediated introductions of invasive alien species. The Workshop agreed that the internal Baltic ship traffic is not of primary interest for the risk assessments because alien species once settled in some part of the Baltic, are able to spread through natural means, if the environmental conditions (salinity, temperature, etc.) are acceptable, as well as through ballast water and other human-mediated vectors. Possibilities are very limited for effectively preventing secondary introductions through ballast water within the region and thus limit the advantages of using risk assessment procedures. However, there could be certain cases where the internal shipping risks should be analyzed, for example when extraordinary measures are required to prevent the spread of a particularly harmful species (such as a pathogen or toxic algae).
Risk Assessment of Ballast Water Mediated Species Introductions into the Baltic Sea
- 98 -
6.2 Common principles of the monitoring system of invasive species in the Baltic Sea The Workshop took note of the information on the HELCOM data and assessment strategy and the ongoing review of the HELCOM COMBINE monitoring programme. The Workshop also noted that the input to the review process should be given via national contacts to MONAS and MON-PRO. The Workshop indicated that it is important to report to HELCOM on findings of alien species at national monitoring stations which presently are not included into the HELCOM COMBINE system (e.g. county’s monitoring, national fishery institutes’ surveys, etc.). For management of ballast water it is important to include other groups that are currently not monitored (e.g. pathogenic microflora, meiobenthos, resting stages, marine fungi, etc.). Special attention should be paid to the groups which are listed in the BWC [Ballast Water Performance Standard (Regulation D-2)]. A common methodology should be developed for the monitoring of those groups. 6.3 Proposals for a common information system for the Baltic Sea The Workshop agreed that there is a need for a common information system for the Baltic Sea States supporting the implementation of the IMO Ballast Water Management Convention. The system should support risk assessment activities and decision-making in Baltic Sea ports. It should also serve as a data source for other regions that may be potential recipients of Baltic Sea species. The system should also provide a basis for exchanging information and feed into an early-warning system. The common information system should include:
• an early-warning system on new introductions and spread of invasive alien species and warning for outbreaks of harmful organisms which may affect the suitability of ballast water uptake (BWC Regulation C-2),
• information for Baltic Sea countries and recipient countries outside the Baltic Sea region about the status of alien species etc.,
• information on water quality and abiotic conditions in Baltic harbours, and • a list of targeted or most unwanted species.
Whenever possible, such a common information system should benefit from the recent European initiatives, such as the FW6 IP ALARM and FW6 STREP DAISIE as well from the information system already existing in the Baltic Sea region, such as the Baltic Sea Alien Species Database27, NOBANIS28, AquaInvader29 etc.
27 Baltic Sea Alien Species Database www.ku.lt/nemo/mainnemo.htm 28 NOBANIS North European and Baltic Network on Invasive Alien Species www.artportalen.se/nobanis 29 Database of Aquatic Invasive Species of Europe (AquaInvader) www.zin.ru/rbic/projects/aquainvader/
Risk Assessment of Ballast Water Mediated Species Introductions into the Baltic Sea
- 99 -
Problems: • data on biota in ballast water uptake areas are scattered • standardized port/port region sampling programmes are needed
6.4 Ballast water exchange and protected sea areas In any case, ballast water operations should be kept to the essential minimum or even be prohibited in protected water bodies. According to IMO's initiative to protect particular sensitive sea areas (PSSA) from adverse effects of shipping most European seas are already identified as PSSA's. So far, measures not permitted in PSSA's as recommended by IMO do not include provisions on ballast water operations. However, PSSA's clearly identify the uniqueness of certain sea areas. As ballast water mediated introduction pose a high risk to the receiving environment relevant provisions for PSSA's may be considered. As a result, all attempts should be undertaken to avoid the identification of ballast water exchange zones in or near sensitive aquatic areas. As IMO is currently working on the Guideline on Designation of Areas for Ballast Water Exchange (G14) it may be considered express the abovementioned concerns to ensure that sensitive and protected aquatic areas are not negatively affected by ballast water exchange. In case exchange zones are identified, which is unlikely for the Baltic and other regional seas, constant monitoring programmes should be implemented. The reasoning for monitoring may include to document the occurrence of harmful aquatic organisms in such areas which may be introduced by ballast water exchange. In case harmful aquatic organisms are found to be introduced here, the designated area may be closed to avoid promoting the spread of such newly occurring species to other regions by carrying out ballast water exchange.
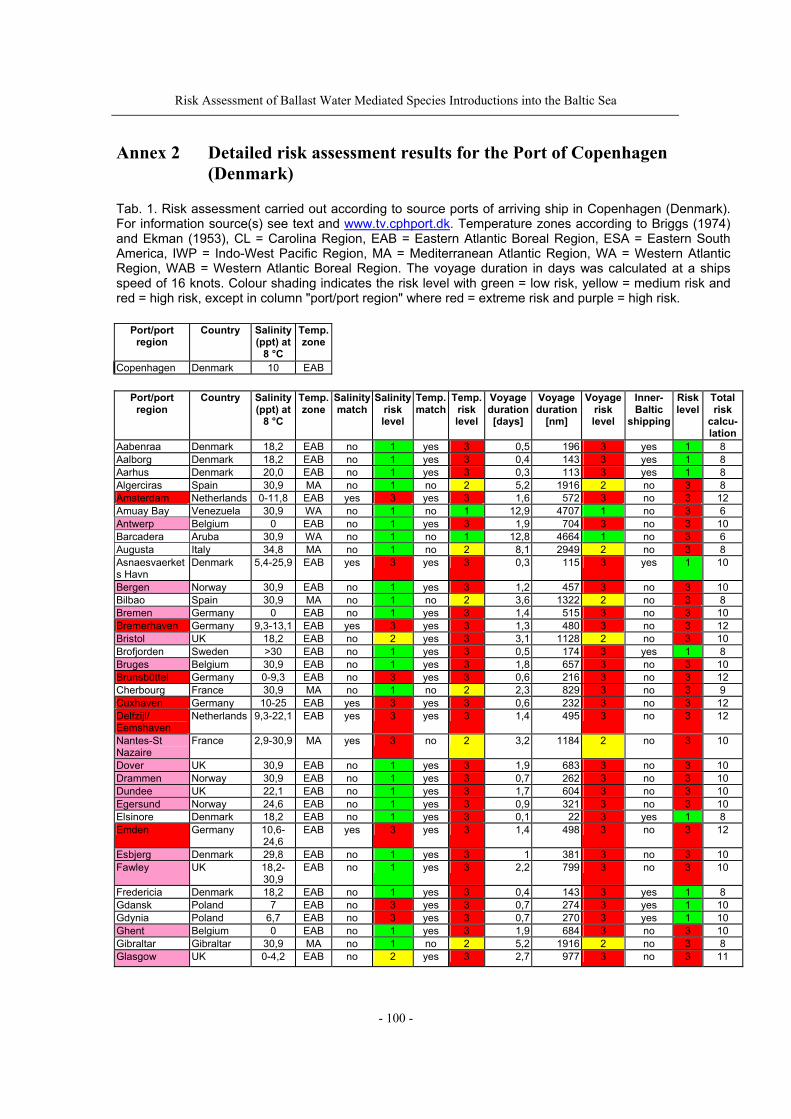
Risk Assessment of Ballast Water Mediated Species Introductions into the Baltic Sea
- 100 -
Annex 2 Detailed risk assessment results for the Port of Copenhagen (Denmark)
Tab. 1. Risk assessment carried out according to source ports of arriving ship in Copenhagen (Denmark). For information source(s) see text and www.tv.cphport.dk. Temperature zones according to Briggs (1974) and Ekman (1953), CL = Carolina Region, EAB = Eastern Atlantic Boreal Region, ESA = Eastern South America, IWP = Indo-West Pacific Region, MA = Mediterranean Atlantic Region, WA = Western Atlantic Region, WAB = Western Atlantic Boreal Region. The voyage duration in days was calculated at a ships speed of 16 knots. Colour shading indicates the risk level with green = low risk, yellow = medium risk and red = high risk, except in column "port/port region" where red = extreme risk and purple = high risk.
Port/port region
Country Salinity (ppt) at
8 °C
Temp. zone
Copenhagen Denmark 10 EAB
Port/port region
Country Salinity (ppt) at
8 °C
Temp. zone
Salinity match
Salinity risk level
Temp. match
Temp. risk level
Voyage duration [days]
Voyage duration
[nm]
Voyage risk level
Inner-Baltic
shipping
Risk level
Total risk
calcu-lation
Aabenraa Denmark 18,2 EAB no 1 yes 3 0,5 196 3 yes 1 8 Aalborg Denmark 18,2 EAB no 1 yes 3 0,4 143 3 yes 1 8 Aarhus Denmark 20,0 EAB no 1 yes 3 0,3 113 3 yes 1 8 Algerciras Spain 30,9 MA no 1 no 2 5,2 1916 2 no 3 8 Amsterdam Netherlands 0-11,8 EAB yes 3 yes 3 1,6 572 3 no 3 12 Amuay Bay Venezuela 30,9 WA no 1 no 1 12,9 4707 1 no 3 6 Antwerp Belgium 0 EAB no 1 yes 3 1,9 704 3 no 3 10 Barcadera Aruba 30,9 WA no 1 no 1 12,8 4664 1 no 3 6 Augusta Italy 34,8 MA no 1 no 2 8,1 2949 2 no 3 8 Asnaesvaerkets Havn
Denmark 5,4-25,9 EAB yes 3 yes 3 0,3 115 3 yes 1 10
Bergen Norway 30,9 EAB no 1 yes 3 1,2 457 3 no 3 10 Bilbao Spain 30,9 MA no 1 no 2 3,6 1322 2 no 3 8 Bremen Germany 0 EAB no 1 yes 3 1,4 515 3 no 3 10 Bremerhaven Germany 9,3-13,1 EAB yes 3 yes 3 1,3 480 3 no 3 12 Bristol UK 18,2 EAB no 2 yes 3 3,1 1128 2 no 3 10 Brofjorden Sweden >30 EAB no 1 yes 3 0,5 174 3 yes 1 8 Bruges Belgium 30,9 EAB no 1 yes 3 1,8 657 3 no 3 10 Brunsbüttel Germany 0-9,3 EAB no 3 yes 3 0,6 216 3 no 3 12 Cherbourg France 30,9 MA no 1 no 2 2,3 829 3 no 3 9 Cuxhaven Germany 10-25 EAB yes 3 yes 3 0,6 232 3 no 3 12 Delfzijl/ Eemshaven
Netherlands 9,3-22,1 EAB yes 3 yes 3 1,4 495 3 no 3 12
Nantes-St Nazaire
France 2,9-30,9 MA yes 3 no 2 3,2 1184 2 no 3 10
Dover UK 30,9 EAB no 1 yes 3 1,9 683 3 no 3 10 Drammen Norway 30,9 EAB no 1 yes 3 0,7 262 3 no 3 10 Dundee UK 22,1 EAB no 1 yes 3 1,7 604 3 no 3 10 Egersund Norway 24,6 EAB no 1 yes 3 0,9 321 3 no 3 10 Elsinore Denmark 18,2 EAB no 1 yes 3 0,1 22 3 yes 1 8 Emden Germany 10,6-
24,6 EAB yes 3 yes 3 1,4 498 3 no 3 12
Esbjerg Denmark 29,8 EAB no 1 yes 3 1 381 3 no 3 10 Fawley UK 18,2-
30,9 EAB no 1 yes 3 2,2 799 3 no 3 10
Fredericia Denmark 18,2 EAB no 1 yes 3 0,4 143 3 yes 1 8 Gdansk Poland 7 EAB no 3 yes 3 0,7 274 3 yes 1 10 Gdynia Poland 6,7 EAB no 3 yes 3 0,7 270 3 yes 1 10 Ghent Belgium 0 EAB no 1 yes 3 1,9 684 3 no 3 10 Gibraltar Gibraltar 30,9 MA no 1 no 2 5,2 1916 2 no 3 8 Glasgow UK 0-4,2 EAB no 2 yes 3 2,7 977 3 no 3 11
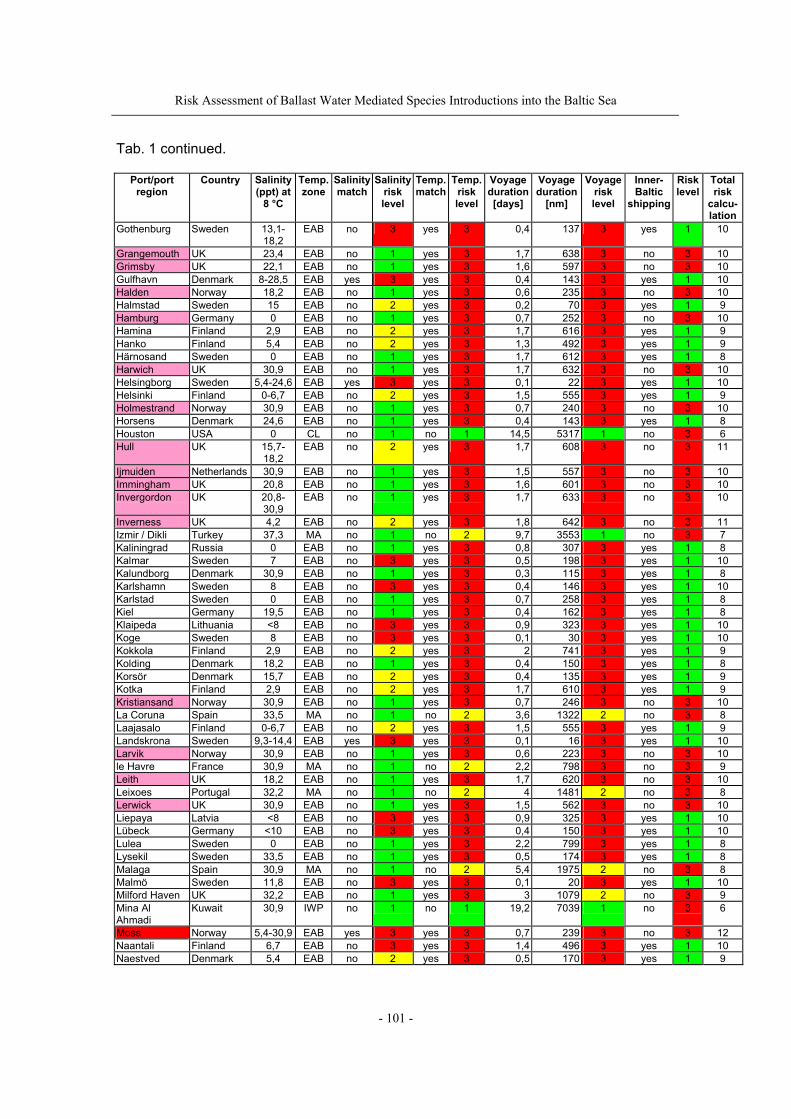
Risk Assessment of Ballast Water Mediated Species Introductions into the Baltic Sea
- 101 -
Tab. 1 continued.
Port/port region
Country Salinity (ppt) at
8 °C
Temp. zone
Salinity match
Salinity risk level
Temp. match
Temp. risk level
Voyage duration [days]
Voyage duration
[nm]
Voyage risk level
Inner-Baltic
shipping
Risk level
Total risk
calcu-lation
Gothenburg Sweden 13,1-18,2
EAB no 3 yes 3 0,4 137 3 yes 1 10
Grangemouth UK 23,4 EAB no 1 yes 3 1,7 638 3 no 3 10 Grimsby UK 22,1 EAB no 1 yes 3 1,6 597 3 no 3 10 Gulfhavn Denmark 8-28,5 EAB yes 3 yes 3 0,4 143 3 yes 1 10 Halden Norway 18,2 EAB no 1 yes 3 0,6 235 3 no 3 10 Halmstad Sweden 15 EAB no 2 yes 3 0,2 70 3 yes 1 9 Hamburg Germany 0 EAB no 1 yes 3 0,7 252 3 no 3 10 Hamina Finland 2,9 EAB no 2 yes 3 1,7 616 3 yes 1 9 Hanko Finland 5,4 EAB no 2 yes 3 1,3 492 3 yes 1 9 Härnosand Sweden 0 EAB no 1 yes 3 1,7 612 3 yes 1 8 Harwich UK 30,9 EAB no 1 yes 3 1,7 632 3 no 3 10 Helsingborg Sweden 5,4-24,6 EAB yes 3 yes 3 0,1 22 3 yes 1 10 Helsinki Finland 0-6,7 EAB no 2 yes 3 1,5 555 3 yes 1 9 Holmestrand Norway 30,9 EAB no 1 yes 3 0,7 240 3 no 3 10 Horsens Denmark 24,6 EAB no 1 yes 3 0,4 143 3 yes 1 8 Houston USA 0 CL no 1 no 1 14,5 5317 1 no 3 6 Hull UK 15,7-
18,2 EAB no 2 yes 3 1,7 608 3 no 3 11
Ijmuiden Netherlands 30,9 EAB no 1 yes 3 1,5 557 3 no 3 10 Immingham UK 20,8 EAB no 1 yes 3 1,6 601 3 no 3 10 Invergordon UK 20,8-
30,9 EAB no 1 yes 3 1,7 633 3 no 3 10
Inverness UK 4,2 EAB no 2 yes 3 1,8 642 3 no 3 11 Izmir / Dikli Turkey 37,3 MA no 1 no 2 9,7 3553 1 no 3 7 Kaliningrad Russia 0 EAB no 1 yes 3 0,8 307 3 yes 1 8 Kalmar Sweden 7 EAB no 3 yes 3 0,5 198 3 yes 1 10 Kalundborg Denmark 30,9 EAB no 1 yes 3 0,3 115 3 yes 1 8 Karlshamn Sweden 8 EAB no 3 yes 3 0,4 146 3 yes 1 10 Karlstad Sweden 0 EAB no 1 yes 3 0,7 258 3 yes 1 8 Kiel Germany 19,5 EAB no 1 yes 3 0,4 162 3 yes 1 8 Klaipeda Lithuania <8 EAB no 3 yes 3 0,9 323 3 yes 1 10 Koge Sweden 8 EAB no 3 yes 3 0,1 30 3 yes 1 10 Kokkola Finland 2,9 EAB no 2 yes 3 2 741 3 yes 1 9 Kolding Denmark 18,2 EAB no 1 yes 3 0,4 150 3 yes 1 8 Korsör Denmark 15,7 EAB no 2 yes 3 0,4 135 3 yes 1 9 Kotka Finland 2,9 EAB no 2 yes 3 1,7 610 3 yes 1 9 Kristiansand Norway 30,9 EAB no 1 yes 3 0,7 246 3 no 3 10 La Coruna Spain 33,5 MA no 1 no 2 3,6 1322 2 no 3 8 Laajasalo Finland 0-6,7 EAB no 2 yes 3 1,5 555 3 yes 1 9 Landskrona Sweden 9,3-14,4 EAB yes 3 yes 3 0,1 16 3 yes 1 10 Larvik Norway 30,9 EAB no 1 yes 3 0,6 223 3 no 3 10 le Havre France 30,9 MA no 1 no 2 2,2 798 3 no 3 9 Leith UK 18,2 EAB no 1 yes 3 1,7 620 3 no 3 10 Leixoes Portugal 32,2 MA no 1 no 2 4 1481 2 no 3 8 Lerwick UK 30,9 EAB no 1 yes 3 1,5 562 3 no 3 10 Liepaya Latvia <8 EAB no 3 yes 3 0,9 325 3 yes 1 10 Lübeck Germany <10 EAB no 3 yes 3 0,4 150 3 yes 1 10 Lulea Sweden 0 EAB no 1 yes 3 2,2 799 3 yes 1 8 Lysekil Sweden 33,5 EAB no 1 yes 3 0,5 174 3 yes 1 8 Malaga Spain 30,9 MA no 1 no 2 5,4 1975 2 no 3 8 Malmö Sweden 11,8 EAB no 3 yes 3 0,1 20 3 yes 1 10 Milford Haven UK 32,2 EAB no 1 yes 3 3 1079 2 no 3 9 Mina Al Ahmadi
Kuwait 30,9 IWP no 1 no 1 19,2 7039 1 no 3 6
Moss Norway 5,4-30,9 EAB yes 3 yes 3 0,7 239 3 no 3 12 Naantali Finland 6,7 EAB no 3 yes 3 1,4 496 3 yes 1 10 Naestved Denmark 5,4 EAB no 2 yes 3 0,5 170 3 yes 1 9
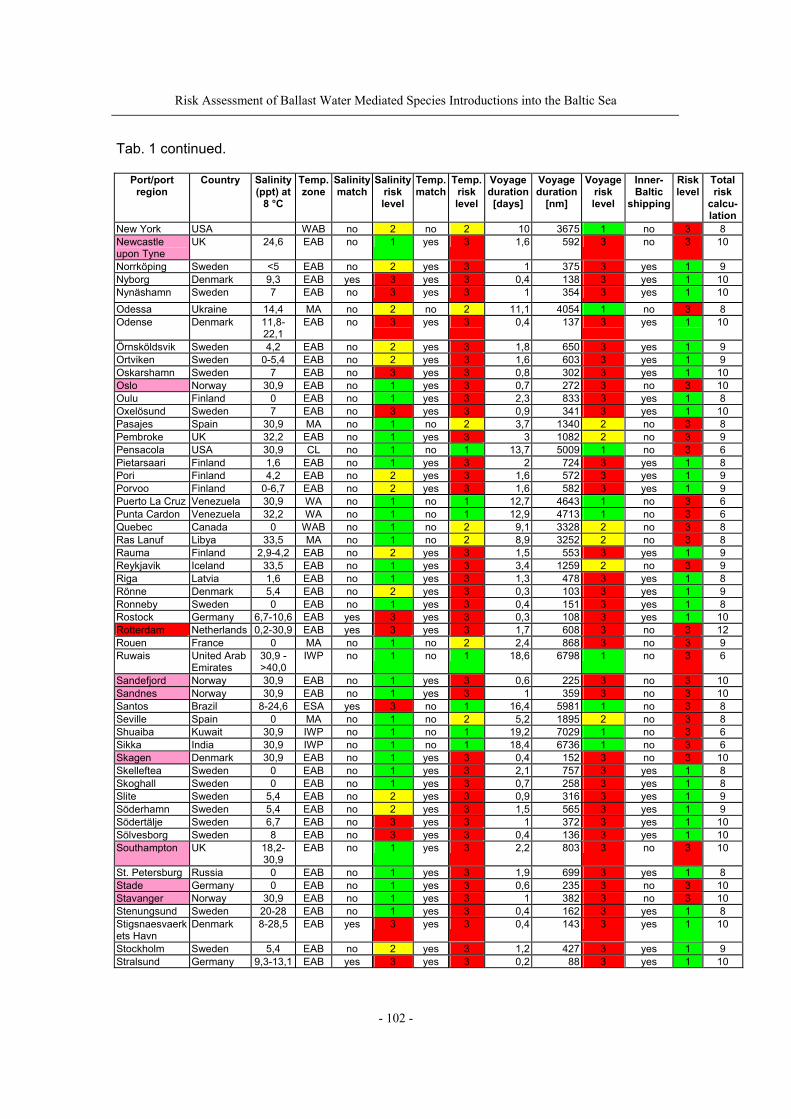
Risk Assessment of Ballast Water Mediated Species Introductions into the Baltic Sea
- 102 -
Tab. 1 continued.
Port/port region
Country Salinity (ppt) at
8 °C
Temp. zone
Salinity match
Salinity risk level
Temp. match
Temp. risk level
Voyage duration [days]
Voyage duration
[nm]
Voyage risk level
Inner-Baltic
shipping
Risk level
Total risk
calcu-lation
New York USA WAB no 2 no 2 10 3675 1 no 3 8 Newcastle upon Tyne
UK 24,6 EAB no 1 yes 3 1,6 592 3 no 3 10
Norrköping Sweden <5 EAB no 2 yes 3 1 375 3 yes 1 9 Nyborg Denmark 9,3 EAB yes 3 yes 3 0,4 138 3 yes 1 10 Nynäshamn Sweden 7 EAB no 3 yes 3 1 354 3 yes 1 10 Odessa Ukraine 14,4 MA no 2 no 2 11,1 4054 1 no 3 8 Odense Denmark 11,8-
22,1 EAB no 3 yes 3 0,4 137 3 yes 1 10
Örnsköldsvik Sweden 4,2 EAB no 2 yes 3 1,8 650 3 yes 1 9 Ortviken Sweden 0-5,4 EAB no 2 yes 3 1,6 603 3 yes 1 9 Oskarshamn Sweden 7 EAB no 3 yes 3 0,8 302 3 yes 1 10 Oslo Norway 30,9 EAB no 1 yes 3 0,7 272 3 no 3 10 Oulu Finland 0 EAB no 1 yes 3 2,3 833 3 yes 1 8 Oxelösund Sweden 7 EAB no 3 yes 3 0,9 341 3 yes 1 10 Pasajes Spain 30,9 MA no 1 no 2 3,7 1340 2 no 3 8 Pembroke UK 32,2 EAB no 1 yes 3 3 1082 2 no 3 9 Pensacola USA 30,9 CL no 1 no 1 13,7 5009 1 no 3 6 Pietarsaari Finland 1,6 EAB no 1 yes 3 2 724 3 yes 1 8 Pori Finland 4,2 EAB no 2 yes 3 1,6 572 3 yes 1 9 Porvoo Finland 0-6,7 EAB no 2 yes 3 1,6 582 3 yes 1 9 Puerto La Cruz Venezuela 30,9 WA no 1 no 1 12,7 4643 1 no 3 6 Punta Cardon Venezuela 32,2 WA no 1 no 1 12,9 4713 1 no 3 6 Quebec Canada 0 WAB no 1 no 2 9,1 3328 2 no 3 8 Ras Lanuf Libya 33,5 MA no 1 no 2 8,9 3252 2 no 3 8 Rauma Finland 2,9-4,2 EAB no 2 yes 3 1,5 553 3 yes 1 9 Reykjavik Iceland 33,5 EAB no 1 yes 3 3,4 1259 2 no 3 9 Riga Latvia 1,6 EAB no 1 yes 3 1,3 478 3 yes 1 8 Rönne Denmark 5,4 EAB no 2 yes 3 0,3 103 3 yes 1 9 Ronneby Sweden 0 EAB no 1 yes 3 0,4 151 3 yes 1 8 Rostock Germany 6,7-10,6 EAB yes 3 yes 3 0,3 108 3 yes 1 10 Rotterdam Netherlands 0,2-30,9 EAB yes 3 yes 3 1,7 608 3 no 3 12 Rouen France 0 MA no 1 no 2 2,4 868 3 no 3 9 Ruwais United Arab
Emirates 30,9 - >40,0
IWP no 1 no 1 18,6 6798 1 no 3 6
Sandefjord Norway 30,9 EAB no 1 yes 3 0,6 225 3 no 3 10 Sandnes Norway 30,9 EAB no 1 yes 3 1 359 3 no 3 10 Santos Brazil 8-24,6 ESA yes 3 no 1 16,4 5981 1 no 3 8 Seville Spain 0 MA no 1 no 2 5,2 1895 2 no 3 8 Shuaiba Kuwait 30,9 IWP no 1 no 1 19,2 7029 1 no 3 6 Sikka India 30,9 IWP no 1 no 1 18,4 6736 1 no 3 6 Skagen Denmark 30,9 EAB no 1 yes 3 0,4 152 3 no 3 10 Skelleftea Sweden 0 EAB no 1 yes 3 2,1 757 3 yes 1 8 Skoghall Sweden 0 EAB no 1 yes 3 0,7 258 3 yes 1 8 Slite Sweden 5,4 EAB no 2 yes 3 0,9 316 3 yes 1 9 Söderhamn Sweden 5,4 EAB no 2 yes 3 1,5 565 3 yes 1 9 Södertälje Sweden 6,7 EAB no 3 yes 3 1 372 3 yes 1 10 Sölvesborg Sweden 8 EAB no 3 yes 3 0,4 136 3 yes 1 10 Southampton UK 18,2-
30,9 EAB no 1 yes 3 2,2 803 3 no 3 10
St. Petersburg Russia 0 EAB no 1 yes 3 1,9 699 3 yes 1 8 Stade Germany 0 EAB no 1 yes 3 0,6 235 3 no 3 10 Stavanger Norway 30,9 EAB no 1 yes 3 1 382 3 no 3 10 Stenungsund Sweden 20-28 EAB no 1 yes 3 0,4 162 3 yes 1 8 Stigsnaesvaerkets Havn
Denmark 8-28,5 EAB yes 3 yes 3 0,4 143 3 yes 1 10
Stockholm Sweden 5,4 EAB no 2 yes 3 1,2 427 3 yes 1 9 Stralsund Germany 9,3-13,1 EAB yes 3 yes 3 0,2 88 3 yes 1 10
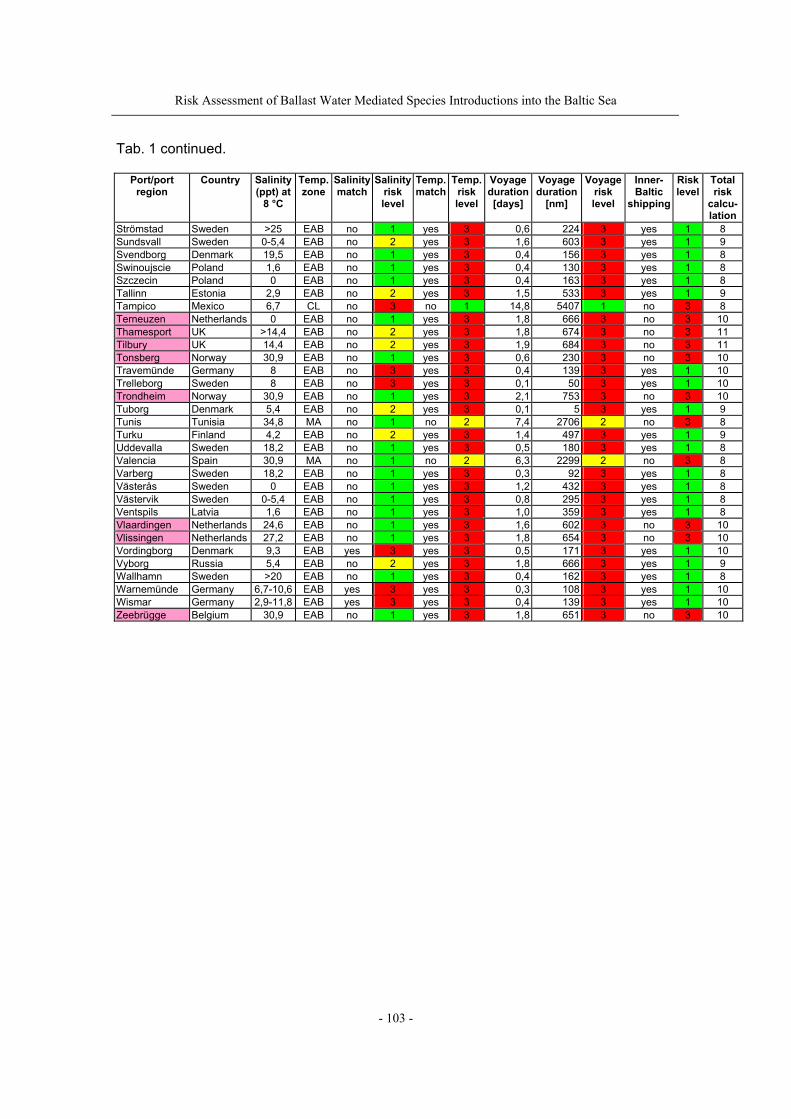
Risk Assessment of Ballast Water Mediated Species Introductions into the Baltic Sea
- 103 -
Tab. 1 continued.
Port/port region
Country Salinity (ppt) at
8 °C
Temp. zone
Salinity match
Salinity risk level
Temp. match
Temp. risk level
Voyage duration [days]
Voyage duration
[nm]
Voyage risk level
Inner-Baltic
shipping
Risk level
Total risk
calcu-lation
Strömstad Sweden >25 EAB no 1 yes 3 0,6 224 3 yes 1 8 Sundsvall Sweden 0-5,4 EAB no 2 yes 3 1,6 603 3 yes 1 9 Svendborg Denmark 19,5 EAB no 1 yes 3 0,4 156 3 yes 1 8 Swinoujscie Poland 1,6 EAB no 1 yes 3 0,4 130 3 yes 1 8 Szczecin Poland 0 EAB no 1 yes 3 0,4 163 3 yes 1 8 Tallinn Estonia 2,9 EAB no 2 yes 3 1,5 533 3 yes 1 9 Tampico Mexico 6,7 CL no 3 no 1 14,8 5407 1 no 3 8 Terneuzen Netherlands 0 EAB no 1 yes 3 1,8 666 3 no 3 10 Thamesport UK >14,4 EAB no 2 yes 3 1,8 674 3 no 3 11 Tilbury UK 14,4 EAB no 2 yes 3 1,9 684 3 no 3 11 Tonsberg Norway 30,9 EAB no 1 yes 3 0,6 230 3 no 3 10 Travemünde Germany 8 EAB no 3 yes 3 0,4 139 3 yes 1 10 Trelleborg Sweden 8 EAB no 3 yes 3 0,1 50 3 yes 1 10 Trondheim Norway 30,9 EAB no 1 yes 3 2,1 753 3 no 3 10 Tuborg Denmark 5,4 EAB no 2 yes 3 0,1 5 3 yes 1 9 Tunis Tunisia 34,8 MA no 1 no 2 7,4 2706 2 no 3 8 Turku Finland 4,2 EAB no 2 yes 3 1,4 497 3 yes 1 9 Uddevalla Sweden 18,2 EAB no 1 yes 3 0,5 180 3 yes 1 8 Valencia Spain 30,9 MA no 1 no 2 6,3 2299 2 no 3 8 Varberg Sweden 18,2 EAB no 1 yes 3 0,3 92 3 yes 1 8 Västerås Sweden 0 EAB no 1 yes 3 1,2 432 3 yes 1 8 Västervik Sweden 0-5,4 EAB no 1 yes 3 0,8 295 3 yes 1 8 Ventspils Latvia 1,6 EAB no 1 yes 3 1,0 359 3 yes 1 8 Vlaardingen Netherlands 24,6 EAB no 1 yes 3 1,6 602 3 no 3 10 Vlissingen Netherlands 27,2 EAB no 1 yes 3 1,8 654 3 no 3 10 Vordingborg Denmark 9,3 EAB yes 3 yes 3 0,5 171 3 yes 1 10 Vyborg Russia 5,4 EAB no 2 yes 3 1,8 666 3 yes 1 9 Wallhamn Sweden >20 EAB no 1 yes 3 0,4 162 3 yes 1 8 Warnemünde Germany 6,7-10,6 EAB yes 3 yes 3 0,3 108 3 yes 1 10 Wismar Germany 2,9-11,8 EAB yes 3 yes 3 0,4 139 3 yes 1 10 Zeebrügge Belgium 30,9 EAB no 1 yes 3 1,8 651 3 no 3 10
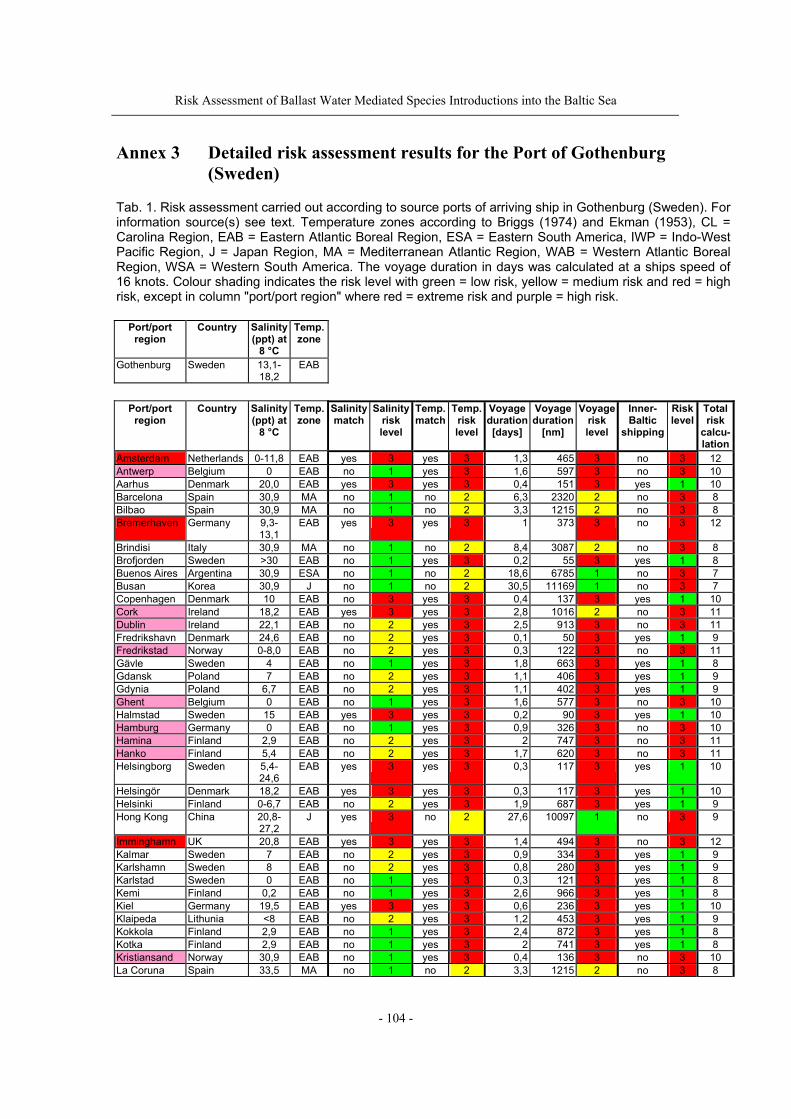
Risk Assessment of Ballast Water Mediated Species Introductions into the Baltic Sea
- 104 -
Annex 3 Detailed risk assessment results for the Port of Gothenburg (Sweden)
Tab. 1. Risk assessment carried out according to source ports of arriving ship in Gothenburg (Sweden). For information source(s) see text. Temperature zones according to Briggs (1974) and Ekman (1953), CL = Carolina Region, EAB = Eastern Atlantic Boreal Region, ESA = Eastern South America, IWP = Indo-West Pacific Region, J = Japan Region, MA = Mediterranean Atlantic Region, WAB = Western Atlantic Boreal Region, WSA = Western South America. The voyage duration in days was calculated at a ships speed of 16 knots. Colour shading indicates the risk level with green = low risk, yellow = medium risk and red = high risk, except in column "port/port region" where red = extreme risk and purple = high risk.
Port/port region
Country Salinity (ppt) at
8 °C
Temp. zone
Gothenburg Sweden 13,1-18,2
EAB
Port/port region
Country Salinity (ppt) at
8 °C
Temp. zone
Salinity match
Salinity risk level
Temp. match
Temp. risk level
Voyage duration [days]
Voyage duration
[nm]
Voyage risk level
Inner-Baltic
shipping
Risk level
Total risk
calcu-lation
Amsterdam Netherlands 0-11,8 EAB yes 3 yes 3 1,3 465 3 no 3 12 Antwerp Belgium 0 EAB no 1 yes 3 1,6 597 3 no 3 10 Aarhus Denmark 20,0 EAB yes 3 yes 3 0,4 151 3 yes 1 10 Barcelona Spain 30,9 MA no 1 no 2 6,3 2320 2 no 3 8 Bilbao Spain 30,9 MA no 1 no 2 3,3 1215 2 no 3 8 Bremerhaven Germany 9,3-
13,1 EAB yes 3 yes 3 1 373 3 no 3 12
Brindisi Italy 30,9 MA no 1 no 2 8,4 3087 2 no 3 8 Brofjorden Sweden >30 EAB no 1 yes 3 0,2 55 3 yes 1 8 Buenos Aires Argentina 30,9 ESA no 1 no 2 18,6 6785 1 no 3 7 Busan Korea 30,9 J no 1 no 2 30,5 11169 1 no 3 7 Copenhagen Denmark 10 EAB no 3 yes 3 0,4 137 3 yes 1 10 Cork Ireland 18,2 EAB yes 3 yes 3 2,8 1016 2 no 3 11 Dublin Ireland 22,1 EAB no 2 yes 3 2,5 913 3 no 3 11 Fredrikshavn Denmark 24,6 EAB no 2 yes 3 0,1 50 3 yes 1 9 Fredrikstad Norway 0-8,0 EAB no 2 yes 3 0,3 122 3 no 3 11 Gävle Sweden 4 EAB no 1 yes 3 1,8 663 3 yes 1 8 Gdansk Poland 7 EAB no 2 yes 3 1,1 406 3 yes 1 9 Gdynia Poland 6,7 EAB no 2 yes 3 1,1 402 3 yes 1 9 Ghent Belgium 0 EAB no 1 yes 3 1,6 577 3 no 3 10 Halmstad Sweden 15 EAB yes 3 yes 3 0,2 90 3 yes 1 10 Hamburg Germany 0 EAB no 1 yes 3 0,9 326 3 no 3 10 Hamina Finland 2,9 EAB no 2 yes 3 2 747 3 no 3 11 Hanko Finland 5,4 EAB no 2 yes 3 1,7 620 3 no 3 11 Helsingborg Sweden 5,4-
24,6 EAB yes 3 yes 3 0,3 117 3 yes 1 10
Helsingör Denmark 18,2 EAB yes 3 yes 3 0,3 117 3 yes 1 10 Helsinki Finland 0-6,7 EAB no 2 yes 3 1,9 687 3 yes 1 9 Hong Kong China 20,8-
27,2 J yes 3 no 2 27,6 10097 1 no 3 9
Imminghamn UK 20,8 EAB yes 3 yes 3 1,4 494 3 no 3 12 Kalmar Sweden 7 EAB no 2 yes 3 0,9 334 3 yes 1 9 Karlshamn Sweden 8 EAB no 2 yes 3 0,8 280 3 yes 1 9 Karlstad Sweden 0 EAB no 1 yes 3 0,3 121 3 yes 1 8 Kemi Finland 0,2 EAB no 1 yes 3 2,6 966 3 yes 1 8 Kiel Germany 19,5 EAB yes 3 yes 3 0,6 236 3 yes 1 10 Klaipeda Lithunia <8 EAB no 2 yes 3 1,2 453 3 yes 1 9 Kokkola Finland 2,9 EAB no 1 yes 3 2,4 872 3 yes 1 8 Kotka Finland 2,9 EAB no 1 yes 3 2 741 3 yes 1 8 Kristiansand Norway 30,9 EAB no 1 yes 3 0,4 136 3 no 3 10 La Coruna Spain 33,5 MA no 1 no 2 3,3 1215 2 no 3 8
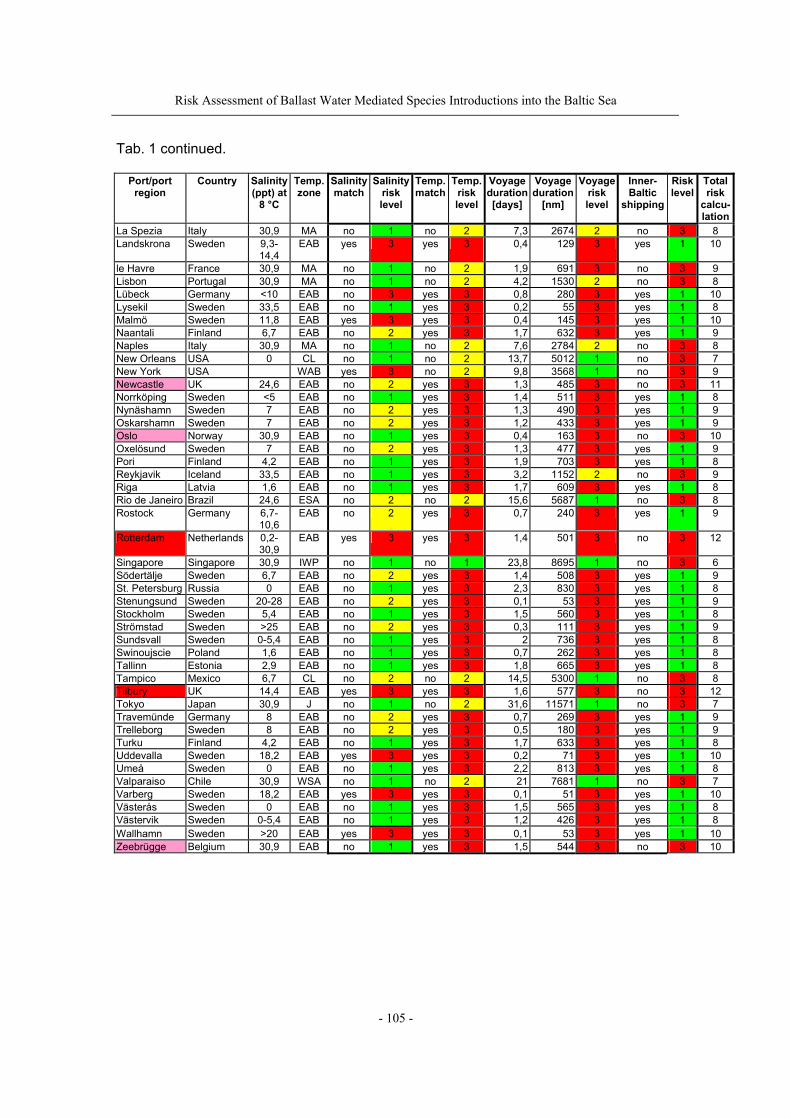
Risk Assessment of Ballast Water Mediated Species Introductions into the Baltic Sea
- 105 -
Tab. 1 continued.
Port/port region
Country Salinity (ppt) at
8 °C
Temp. zone
Salinity match
Salinity risk level
Temp. match
Temp. risk level
Voyage duration [days]
Voyage duration
[nm]
Voyage risk level
Inner-Baltic
shipping
Risk level
Total risk
calcu-lation
La Spezia Italy 30,9 MA no 1 no 2 7,3 2674 2 no 3 8 Landskrona Sweden 9,3-
14,4 EAB yes 3 yes 3 0,4 129 3 yes 1 10
le Havre France 30,9 MA no 1 no 2 1,9 691 3 no 3 9 Lisbon Portugal 30,9 MA no 1 no 2 4,2 1530 2 no 3 8 Lübeck Germany <10 EAB no 3 yes 3 0,8 280 3 yes 1 10 Lysekil Sweden 33,5 EAB no 1 yes 3 0,2 55 3 yes 1 8 Malmö Sweden 11,8 EAB yes 3 yes 3 0,4 145 3 yes 1 10 Naantali Finland 6,7 EAB no 2 yes 3 1,7 632 3 yes 1 9 Naples Italy 30,9 MA no 1 no 2 7,6 2784 2 no 3 8 New Orleans USA 0 CL no 1 no 2 13,7 5012 1 no 3 7 New York USA WAB yes 3 no 2 9,8 3568 1 no 3 9 Newcastle UK 24,6 EAB no 2 yes 3 1,3 485 3 no 3 11 Norrköping Sweden <5 EAB no 1 yes 3 1,4 511 3 yes 1 8 Nynäshamn Sweden 7 EAB no 2 yes 3 1,3 490 3 yes 1 9 Oskarshamn Sweden 7 EAB no 2 yes 3 1,2 433 3 yes 1 9 Oslo Norway 30,9 EAB no 1 yes 3 0,4 163 3 no 3 10 Oxelösund Sweden 7 EAB no 2 yes 3 1,3 477 3 yes 1 9 Pori Finland 4,2 EAB no 1 yes 3 1,9 703 3 yes 1 8 Reykjavik Iceland 33,5 EAB no 1 yes 3 3,2 1152 2 no 3 9 Riga Latvia 1,6 EAB no 1 yes 3 1,7 609 3 yes 1 8 Rio de Janeiro Brazil 24,6 ESA no 2 no 2 15,6 5687 1 no 3 8 Rostock Germany 6,7-
10,6 EAB no 2 yes 3 0,7 240 3 yes 1 9
Rotterdam Netherlands 0,2-30,9
EAB yes 3 yes 3 1,4 501 3 no 3 12
Singapore Singapore 30,9 IWP no 1 no 1 23,8 8695 1 no 3 6 Södertälje Sweden 6,7 EAB no 2 yes 3 1,4 508 3 yes 1 9 St. Petersburg Russia 0 EAB no 1 yes 3 2,3 830 3 yes 1 8 Stenungsund Sweden 20-28 EAB no 2 yes 3 0,1 53 3 yes 1 9 Stockholm Sweden 5,4 EAB no 1 yes 3 1,5 560 3 yes 1 8 Strömstad Sweden >25 EAB no 2 yes 3 0,3 111 3 yes 1 9 Sundsvall Sweden 0-5,4 EAB no 1 yes 3 2 736 3 yes 1 8 Swinoujscie Poland 1,6 EAB no 1 yes 3 0,7 262 3 yes 1 8 Tallinn Estonia 2,9 EAB no 1 yes 3 1,8 665 3 yes 1 8 Tampico Mexico 6,7 CL no 2 no 2 14,5 5300 1 no 3 8 Tilbury UK 14,4 EAB yes 3 yes 3 1,6 577 3 no 3 12 Tokyo Japan 30,9 J no 1 no 2 31,6 11571 1 no 3 7 Travemünde Germany 8 EAB no 2 yes 3 0,7 269 3 yes 1 9 Trelleborg Sweden 8 EAB no 2 yes 3 0,5 180 3 yes 1 9 Turku Finland 4,2 EAB no 1 yes 3 1,7 633 3 yes 1 8 Uddevalla Sweden 18,2 EAB yes 3 yes 3 0,2 71 3 yes 1 10 Umeå Sweden 0 EAB no 1 yes 3 2,2 813 3 yes 1 8 Valparaiso Chile 30,9 WSA no 1 no 2 21 7681 1 no 3 7 Varberg Sweden 18,2 EAB yes 3 yes 3 0,1 51 3 yes 1 10 Västerås Sweden 0 EAB no 1 yes 3 1,5 565 3 yes 1 8 Västervik Sweden 0-5,4 EAB no 1 yes 3 1,2 426 3 yes 1 8 Wallhamn Sweden >20 EAB yes 3 yes 3 0,1 53 3 yes 1 10 Zeebrügge Belgium 30,9 EAB no 1 yes 3 1,5 544 3 no 3 10
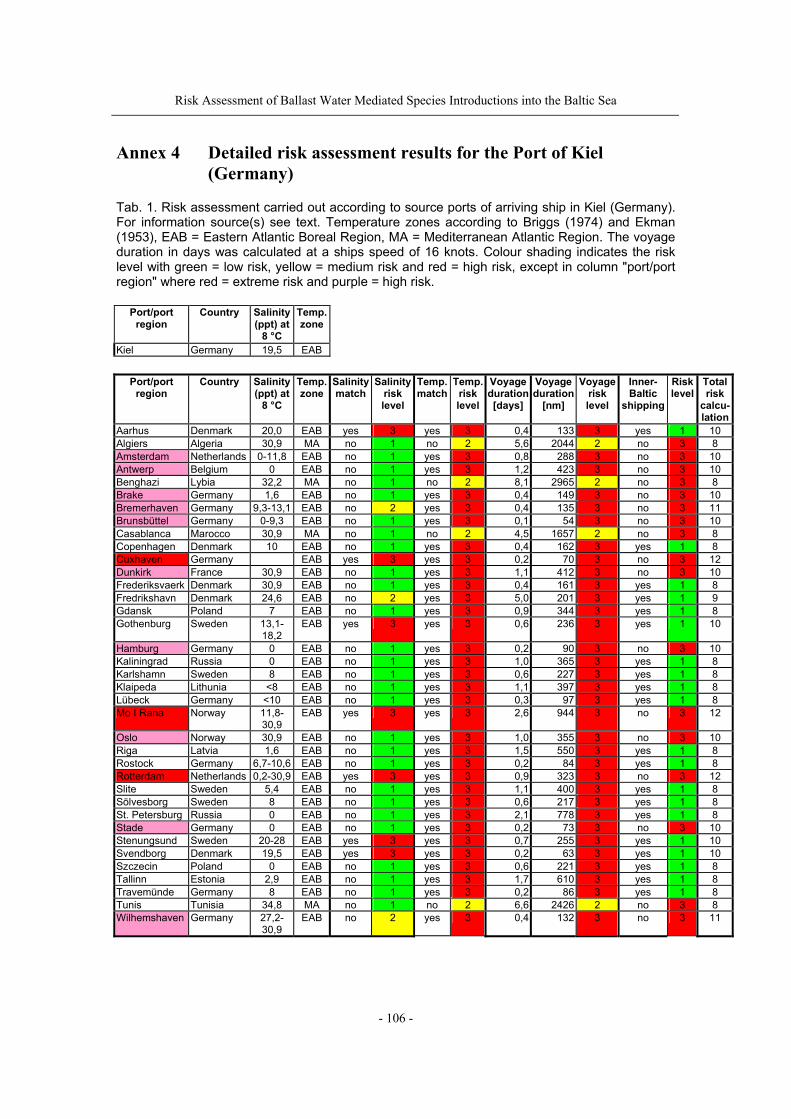
Risk Assessment of Ballast Water Mediated Species Introductions into the Baltic Sea
- 106 -
Annex 4 Detailed risk assessment results for the Port of Kiel (Germany)
Tab. 1. Risk assessment carried out according to source ports of arriving ship in Kiel (Germany). For information source(s) see text. Temperature zones according to Briggs (1974) and Ekman (1953), EAB = Eastern Atlantic Boreal Region, MA = Mediterranean Atlantic Region. The voyage duration in days was calculated at a ships speed of 16 knots. Colour shading indicates the risk level with green = low risk, yellow = medium risk and red = high risk, except in column "port/port region" where red = extreme risk and purple = high risk.
Port/port region
Country Salinity (ppt) at
8 °C
Temp. zone
Kiel Germany 19,5 EAB
Port/port region
Country Salinity (ppt) at
8 °C
Temp. zone
Salinity match
Salinity risk level
Temp. match
Temp. risk level
Voyage duration [days]
Voyage duration
[nm]
Voyage risk level
Inner-Baltic
shipping
Risk level
Total risk
calcu-lation
Aarhus Denmark 20,0 EAB yes 3 yes 3 0,4 133 3 yes 1 10 Algiers Algeria 30,9 MA no 1 no 2 5,6 2044 2 no 3 8 Amsterdam Netherlands 0-11,8 EAB no 1 yes 3 0,8 288 3 no 3 10 Antwerp Belgium 0 EAB no 1 yes 3 1,2 423 3 no 3 10 Benghazi Lybia 32,2 MA no 1 no 2 8,1 2965 2 no 3 8 Brake Germany 1,6 EAB no 1 yes 3 0,4 149 3 no 3 10 Bremerhaven Germany 9,3-13,1 EAB no 2 yes 3 0,4 135 3 no 3 11 Brunsbüttel Germany 0-9,3 EAB no 1 yes 3 0,1 54 3 no 3 10 Casablanca Marocco 30,9 MA no 1 no 2 4,5 1657 2 no 3 8 Copenhagen Denmark 10 EAB no 1 yes 3 0,4 162 3 yes 1 8 Cuxhaven Germany EAB yes 3 yes 3 0,2 70 3 no 3 12 Dunkirk France 30,9 EAB no 1 yes 3 1,1 412 3 no 3 10 Frederiksvaerk Denmark 30,9 EAB no 1 yes 3 0,4 161 3 yes 1 8 Fredrikshavn Denmark 24,6 EAB no 2 yes 3 5,0 201 3 yes 1 9 Gdansk Poland 7 EAB no 1 yes 3 0,9 344 3 yes 1 8 Gothenburg Sweden 13,1-
18,2 EAB yes 3 yes 3 0,6 236 3 yes 1 10
Hamburg Germany 0 EAB no 1 yes 3 0,2 90 3 no 3 10 Kaliningrad Russia 0 EAB no 1 yes 3 1,0 365 3 yes 1 8 Karlshamn Sweden 8 EAB no 1 yes 3 0,6 227 3 yes 1 8 Klaipeda Lithunia <8 EAB no 1 yes 3 1,1 397 3 yes 1 8 Lübeck Germany <10 EAB no 1 yes 3 0,3 97 3 yes 1 8 Mo I Rana Norway 11,8-
30,9 EAB yes 3 yes 3 2,6 944 3 no 3 12
Oslo Norway 30,9 EAB no 1 yes 3 1,0 355 3 no 3 10 Riga Latvia 1,6 EAB no 1 yes 3 1,5 550 3 yes 1 8 Rostock Germany 6,7-10,6 EAB no 1 yes 3 0,2 84 3 yes 1 8 Rotterdam Netherlands 0,2-30,9 EAB yes 3 yes 3 0,9 323 3 no 3 12 Slite Sweden 5,4 EAB no 1 yes 3 1,1 400 3 yes 1 8 Sölvesborg Sweden 8 EAB no 1 yes 3 0,6 217 3 yes 1 8 St. Petersburg Russia 0 EAB no 1 yes 3 2,1 778 3 yes 1 8 Stade Germany 0 EAB no 1 yes 3 0,2 73 3 no 3 10 Stenungsund Sweden 20-28 EAB yes 3 yes 3 0,7 255 3 yes 1 10 Svendborg Denmark 19,5 EAB yes 3 yes 3 0,2 63 3 yes 1 10 Szczecin Poland 0 EAB no 1 yes 3 0,6 221 3 yes 1 8 Tallinn Estonia 2,9 EAB no 1 yes 3 1,7 610 3 yes 1 8 Travemünde Germany 8 EAB no 1 yes 3 0,2 86 3 yes 1 8 Tunis Tunisia 34,8 MA no 1 no 2 6,6 2426 2 no 3 8 Wilhemshaven Germany 27,2-
30,9 EAB no 2 yes 3 0,4 132 3 no 3 11
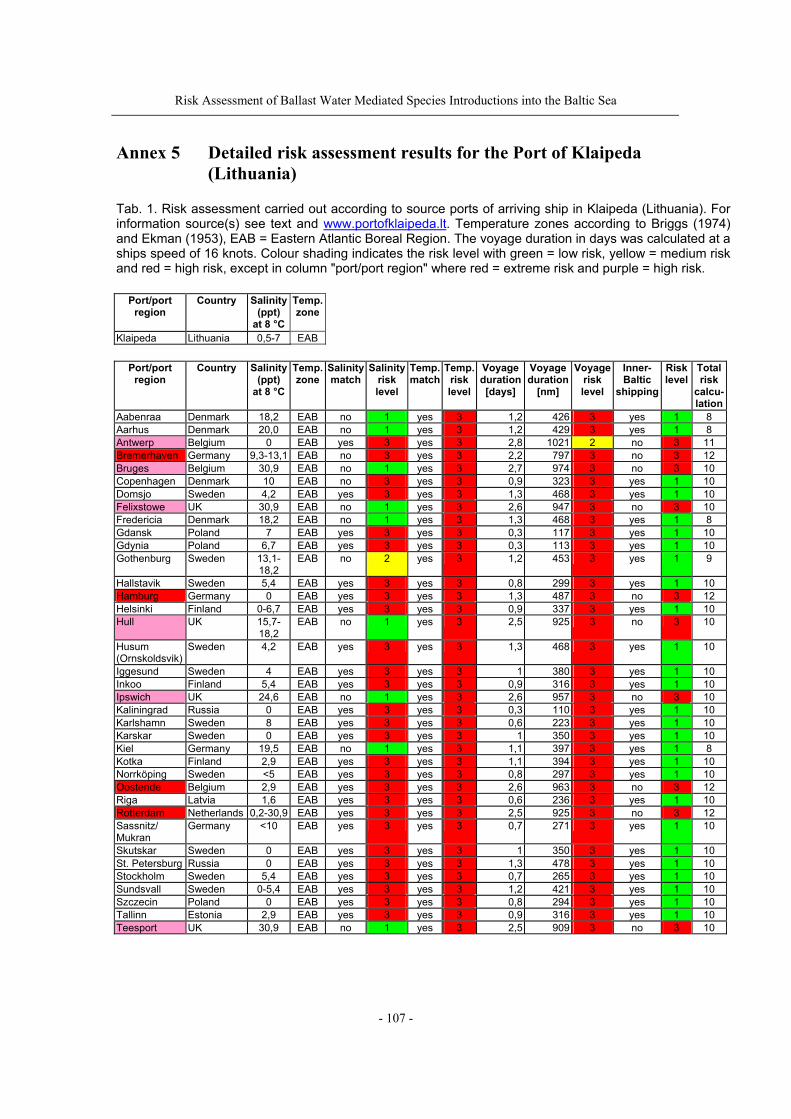
Risk Assessment of Ballast Water Mediated Species Introductions into the Baltic Sea
- 107 -
Annex 5 Detailed risk assessment results for the Port of Klaipeda (Lithuania)
Tab. 1. Risk assessment carried out according to source ports of arriving ship in Klaipeda (Lithuania). For information source(s) see text and www.portofklaipeda.lt. Temperature zones according to Briggs (1974) and Ekman (1953), EAB = Eastern Atlantic Boreal Region. The voyage duration in days was calculated at a ships speed of 16 knots. Colour shading indicates the risk level with green = low risk, yellow = medium risk and red = high risk, except in column "port/port region" where red = extreme risk and purple = high risk.
Port/port region
Country Salinity (ppt)
at 8 °C
Temp. zone
Klaipeda Lithuania 0,5-7 EAB
Port/port region
Country Salinity (ppt)
at 8 °C
Temp. zone
Salinitymatch
Salinityrisk level
Temp.match
Temp.risk level
Voyage duration [days]
Voyage duration
[nm]
Voyage risk level
Inner-Baltic
shipping
Risklevel
Total risk
calcu-lation
Aabenraa Denmark 18,2 EAB no 1 yes 3 1,2 426 3 yes 1 8 Aarhus Denmark 20,0 EAB no 1 yes 3 1,2 429 3 yes 1 8 Antwerp Belgium 0 EAB yes 3 yes 3 2,8 1021 2 no 3 11 Bremerhaven Germany 9,3-13,1 EAB no 3 yes 3 2,2 797 3 no 3 12 Bruges Belgium 30,9 EAB no 1 yes 3 2,7 974 3 no 3 10 Copenhagen Denmark 10 EAB no 3 yes 3 0,9 323 3 yes 1 10 Domsjo Sweden 4,2 EAB yes 3 yes 3 1,3 468 3 yes 1 10 Felixstowe UK 30,9 EAB no 1 yes 3 2,6 947 3 no 3 10 Fredericia Denmark 18,2 EAB no 1 yes 3 1,3 468 3 yes 1 8 Gdansk Poland 7 EAB yes 3 yes 3 0,3 117 3 yes 1 10 Gdynia Poland 6,7 EAB yes 3 yes 3 0,3 113 3 yes 1 10 Gothenburg Sweden 13,1-
18,2 EAB no 2 yes 3 1,2 453 3 yes 1 9
Hallstavik Sweden 5,4 EAB yes 3 yes 3 0,8 299 3 yes 1 10 Hamburg Germany 0 EAB yes 3 yes 3 1,3 487 3 no 3 12 Helsinki Finland 0-6,7 EAB yes 3 yes 3 0,9 337 3 yes 1 10 Hull UK 15,7-
18,2 EAB no 1 yes 3 2,5 925 3 no 3 10
Husum (Ornskoldsvik)
Sweden 4,2 EAB yes 3 yes 3 1,3 468 3 yes 1 10
Iggesund Sweden 4 EAB yes 3 yes 3 1 380 3 yes 1 10 Inkoo Finland 5,4 EAB yes 3 yes 3 0,9 316 3 yes 1 10 Ipswich UK 24,6 EAB no 1 yes 3 2,6 957 3 no 3 10 Kaliningrad Russia 0 EAB yes 3 yes 3 0,3 110 3 yes 1 10 Karlshamn Sweden 8 EAB yes 3 yes 3 0,6 223 3 yes 1 10 Karskar Sweden 0 EAB yes 3 yes 3 1 350 3 yes 1 10 Kiel Germany 19,5 EAB no 1 yes 3 1,1 397 3 yes 1 8 Kotka Finland 2,9 EAB yes 3 yes 3 1,1 394 3 yes 1 10 Norrköping Sweden <5 EAB yes 3 yes 3 0,8 297 3 yes 1 10 Oostende Belgium 2,9 EAB yes 3 yes 3 2,6 963 3 no 3 12 Riga Latvia 1,6 EAB yes 3 yes 3 0,6 236 3 yes 1 10 Rotterdam Netherlands 0,2-30,9 EAB yes 3 yes 3 2,5 925 3 no 3 12 Sassnitz/ Mukran
Germany <10 EAB yes 3 yes 3 0,7 271 3 yes 1 10
Skutskar Sweden 0 EAB yes 3 yes 3 1 350 3 yes 1 10 St. Petersburg Russia 0 EAB yes 3 yes 3 1,3 478 3 yes 1 10 Stockholm Sweden 5,4 EAB yes 3 yes 3 0,7 265 3 yes 1 10 Sundsvall Sweden 0-5,4 EAB yes 3 yes 3 1,2 421 3 yes 1 10 Szczecin Poland 0 EAB yes 3 yes 3 0,8 294 3 yes 1 10 Tallinn Estonia 2,9 EAB yes 3 yes 3 0,9 316 3 yes 1 10 Teesport UK 30,9 EAB no 1 yes 3 2,5 909 3 no 3 10
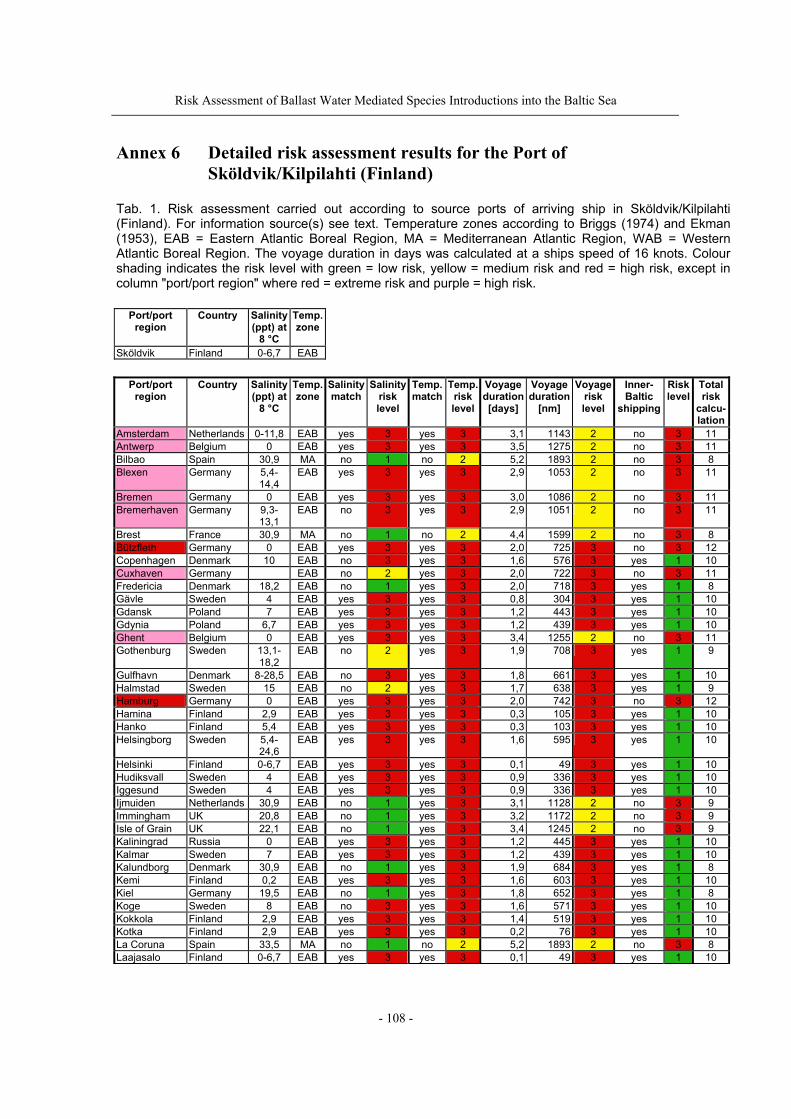
Risk Assessment of Ballast Water Mediated Species Introductions into the Baltic Sea
- 108 -
Annex 6 Detailed risk assessment results for the Port of Sköldvik/Kilpilahti (Finland)
Tab. 1. Risk assessment carried out according to source ports of arriving ship in Sköldvik/Kilpilahti (Finland). For information source(s) see text. Temperature zones according to Briggs (1974) and Ekman (1953), EAB = Eastern Atlantic Boreal Region, MA = Mediterranean Atlantic Region, WAB = Western Atlantic Boreal Region. The voyage duration in days was calculated at a ships speed of 16 knots. Colour shading indicates the risk level with green = low risk, yellow = medium risk and red = high risk, except in column "port/port region" where red = extreme risk and purple = high risk.
Port/port region
Country Salinity (ppt) at
8 °C
Temp. zone
Sköldvik Finland 0-6,7 EAB
Port/port region
Country Salinity (ppt) at
8 °C
Temp. zone
Salinity match
Salinity risk level
Temp. match
Temp. risk level
Voyage duration [days]
Voyage duration
[nm]
Voyage risk level
Inner-Baltic
shipping
Risk level
Total risk
calcu-lation
Amsterdam Netherlands 0-11,8 EAB yes 3 yes 3 3,1 1143 2 no 3 11 Antwerp Belgium 0 EAB yes 3 yes 3 3,5 1275 2 no 3 11 Bilbao Spain 30,9 MA no 1 no 2 5,2 1893 2 no 3 8 Blexen Germany 5,4-
14,4 EAB yes 3 yes 3 2,9 1053 2 no 3 11
Bremen Germany 0 EAB yes 3 yes 3 3,0 1086 2 no 3 11 Bremerhaven Germany 9,3-
13,1 EAB no 3 yes 3 2,9 1051 2 no 3 11
Brest France 30,9 MA no 1 no 2 4,4 1599 2 no 3 8 Bützfleth Germany 0 EAB yes 3 yes 3 2,0 725 3 no 3 12 Copenhagen Denmark 10 EAB no 3 yes 3 1,6 576 3 yes 1 10 Cuxhaven Germany EAB no 2 yes 3 2,0 722 3 no 3 11 Fredericia Denmark 18,2 EAB no 1 yes 3 2,0 718 3 yes 1 8 Gävle Sweden 4 EAB yes 3 yes 3 0,8 304 3 yes 1 10 Gdansk Poland 7 EAB yes 3 yes 3 1,2 443 3 yes 1 10 Gdynia Poland 6,7 EAB yes 3 yes 3 1,2 439 3 yes 1 10 Ghent Belgium 0 EAB yes 3 yes 3 3,4 1255 2 no 3 11 Gothenburg Sweden 13,1-
18,2 EAB no 2 yes 3 1,9 708 3 yes 1 9
Gulfhavn Denmark 8-28,5 EAB no 3 yes 3 1,8 661 3 yes 1 10 Halmstad Sweden 15 EAB no 2 yes 3 1,7 638 3 yes 1 9 Hamburg Germany 0 EAB yes 3 yes 3 2,0 742 3 no 3 12 Hamina Finland 2,9 EAB yes 3 yes 3 0,3 105 3 yes 1 10 Hanko Finland 5,4 EAB yes 3 yes 3 0,3 103 3 yes 1 10 Helsingborg Sweden 5,4-
24,6 EAB yes 3 yes 3 1,6 595 3 yes 1 10
Helsinki Finland 0-6,7 EAB yes 3 yes 3 0,1 49 3 yes 1 10 Hudiksvall Sweden 4 EAB yes 3 yes 3 0,9 336 3 yes 1 10 Iggesund Sweden 4 EAB yes 3 yes 3 0,9 336 3 yes 1 10 Ijmuiden Netherlands 30,9 EAB no 1 yes 3 3,1 1128 2 no 3 9 Immingham UK 20,8 EAB no 1 yes 3 3,2 1172 2 no 3 9 Isle of Grain UK 22,1 EAB no 1 yes 3 3,4 1245 2 no 3 9 Kaliningrad Russia 0 EAB yes 3 yes 3 1,2 445 3 yes 1 10 Kalmar Sweden 7 EAB yes 3 yes 3 1,2 439 3 yes 1 10 Kalundborg Denmark 30,9 EAB no 1 yes 3 1,9 684 3 yes 1 8 Kemi Finland 0,2 EAB yes 3 yes 3 1,6 603 3 yes 1 10 Kiel Germany 19,5 EAB no 1 yes 3 1,8 652 3 yes 1 8 Koge Sweden 8 EAB no 3 yes 3 1,6 571 3 yes 1 10 Kokkola Finland 2,9 EAB yes 3 yes 3 1,4 519 3 yes 1 10 Kotka Finland 2,9 EAB yes 3 yes 3 0,2 76 3 yes 1 10 La Coruna Spain 33,5 MA no 1 no 2 5,2 1893 2 no 3 8 Laajasalo Finland 0-6,7 EAB yes 3 yes 3 0,1 49 3 yes 1 10
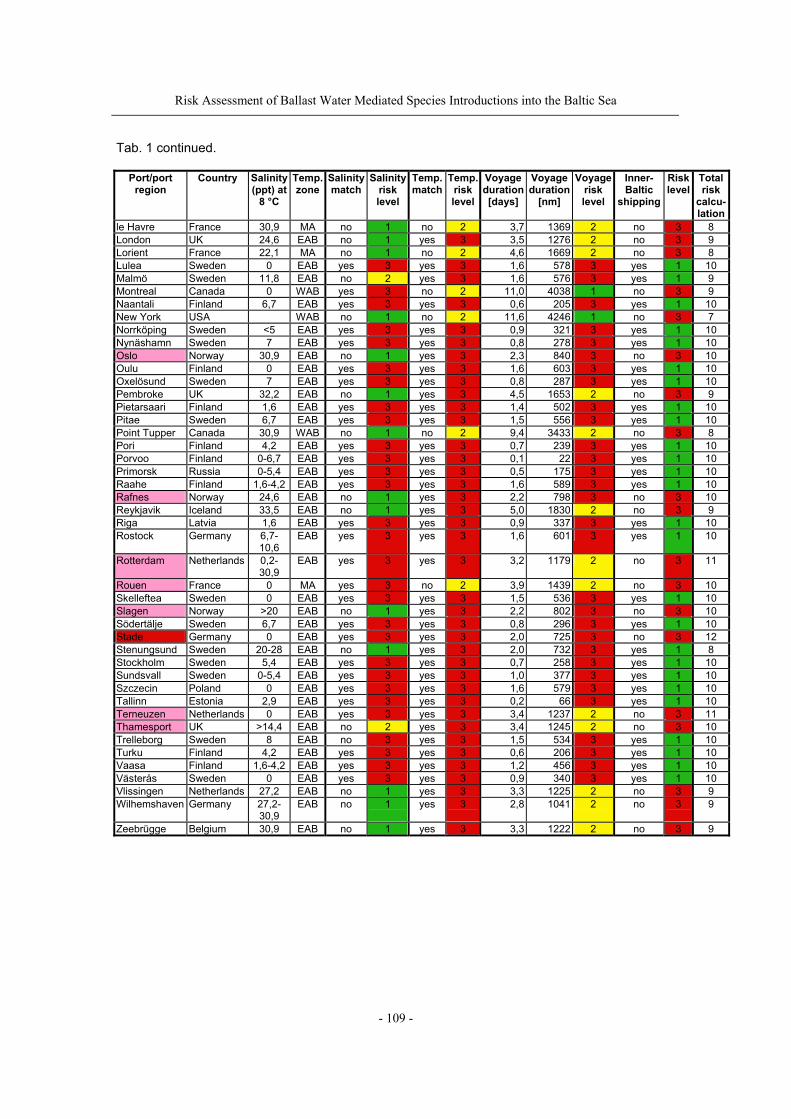
Risk Assessment of Ballast Water Mediated Species Introductions into the Baltic Sea
- 109 -
Tab. 1 continued.
Port/port region
Country Salinity (ppt) at
8 °C
Temp. zone
Salinity match
Salinity risk level
Temp. match
Temp. risk level
Voyage duration [days]
Voyage duration
[nm]
Voyage risk level
Inner-Baltic
shipping
Risk level
Total risk
calcu-lation
le Havre France 30,9 MA no 1 no 2 3,7 1369 2 no 3 8 London UK 24,6 EAB no 1 yes 3 3,5 1276 2 no 3 9 Lorient France 22,1 MA no 1 no 2 4,6 1669 2 no 3 8 Lulea Sweden 0 EAB yes 3 yes 3 1,6 578 3 yes 1 10 Malmö Sweden 11,8 EAB no 2 yes 3 1,6 576 3 yes 1 9 Montreal Canada 0 WAB yes 3 no 2 11,0 4038 1 no 3 9 Naantali Finland 6,7 EAB yes 3 yes 3 0,6 205 3 yes 1 10 New York USA WAB no 1 no 2 11,6 4246 1 no 3 7 Norrköping Sweden <5 EAB yes 3 yes 3 0,9 321 3 yes 1 10 Nynäshamn Sweden 7 EAB yes 3 yes 3 0,8 278 3 yes 1 10 Oslo Norway 30,9 EAB no 1 yes 3 2,3 840 3 no 3 10 Oulu Finland 0 EAB yes 3 yes 3 1,6 603 3 yes 1 10 Oxelösund Sweden 7 EAB yes 3 yes 3 0,8 287 3 yes 1 10 Pembroke UK 32,2 EAB no 1 yes 3 4,5 1653 2 no 3 9 Pietarsaari Finland 1,6 EAB yes 3 yes 3 1,4 502 3 yes 1 10 Pitae Sweden 6,7 EAB yes 3 yes 3 1,5 556 3 yes 1 10 Point Tupper Canada 30,9 WAB no 1 no 2 9,4 3433 2 no 3 8 Pori Finland 4,2 EAB yes 3 yes 3 0,7 239 3 yes 1 10 Porvoo Finland 0-6,7 EAB yes 3 yes 3 0,1 22 3 yes 1 10 Primorsk Russia 0-5,4 EAB yes 3 yes 3 0,5 175 3 yes 1 10 Raahe Finland 1,6-4,2 EAB yes 3 yes 3 1,6 589 3 yes 1 10 Rafnes Norway 24,6 EAB no 1 yes 3 2,2 798 3 no 3 10 Reykjavik Iceland 33,5 EAB no 1 yes 3 5,0 1830 2 no 3 9 Riga Latvia 1,6 EAB yes 3 yes 3 0,9 337 3 yes 1 10 Rostock Germany 6,7-
10,6 EAB yes 3 yes 3 1,6 601 3 yes 1 10
Rotterdam Netherlands 0,2-30,9
EAB yes 3 yes 3 3,2 1179 2 no 3 11
Rouen France 0 MA yes 3 no 2 3,9 1439 2 no 3 10 Skelleftea Sweden 0 EAB yes 3 yes 3 1,5 536 3 yes 1 10 Slagen Norway >20 EAB no 1 yes 3 2,2 802 3 no 3 10 Södertälje Sweden 6,7 EAB yes 3 yes 3 0,8 296 3 yes 1 10 Stade Germany 0 EAB yes 3 yes 3 2,0 725 3 no 3 12 Stenungsund Sweden 20-28 EAB no 1 yes 3 2,0 732 3 yes 1 8 Stockholm Sweden 5,4 EAB yes 3 yes 3 0,7 258 3 yes 1 10 Sundsvall Sweden 0-5,4 EAB yes 3 yes 3 1,0 377 3 yes 1 10 Szczecin Poland 0 EAB yes 3 yes 3 1,6 579 3 yes 1 10 Tallinn Estonia 2,9 EAB yes 3 yes 3 0,2 66 3 yes 1 10 Terneuzen Netherlands 0 EAB yes 3 yes 3 3,4 1237 2 no 3 11 Thamesport UK >14,4 EAB no 2 yes 3 3,4 1245 2 no 3 10 Trelleborg Sweden 8 EAB no 3 yes 3 1,5 534 3 yes 1 10 Turku Finland 4,2 EAB yes 3 yes 3 0,6 206 3 yes 1 10 Vaasa Finland 1,6-4,2 EAB yes 3 yes 3 1,2 456 3 yes 1 10 Västerås Sweden 0 EAB yes 3 yes 3 0,9 340 3 yes 1 10 Vlissingen Netherlands 27,2 EAB no 1 yes 3 3,3 1225 2 no 3 9 Wilhemshaven Germany 27,2-
30,9 EAB no 1 yes 3 2,8 1041 2 no 3 9
Zeebrügge Belgium 30,9 EAB no 1 yes 3 3,3 1222 2 no 3 9
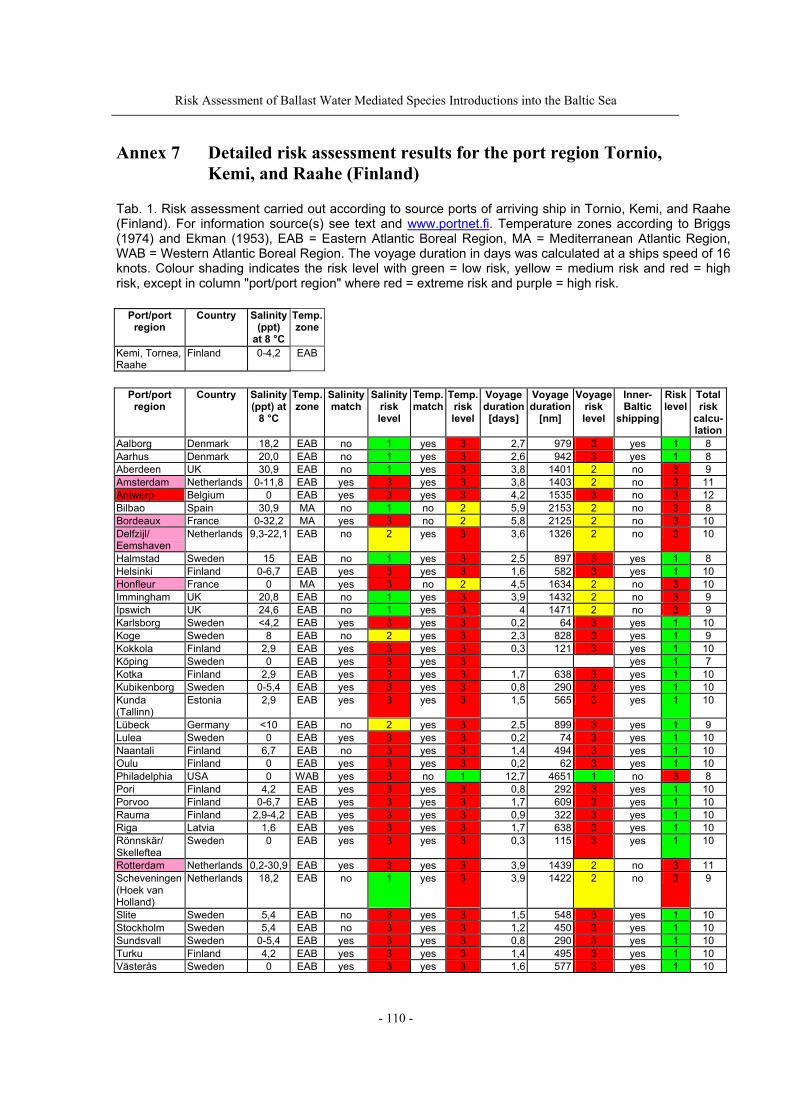
Risk Assessment of Ballast Water Mediated Species Introductions into the Baltic Sea
- 110 -
Annex 7 Detailed risk assessment results for the port region Tornio, Kemi, and Raahe (Finland)
Tab. 1. Risk assessment carried out according to source ports of arriving ship in Tornio, Kemi, and Raahe (Finland). For information source(s) see text and www.portnet.fi. Temperature zones according to Briggs (1974) and Ekman (1953), EAB = Eastern Atlantic Boreal Region, MA = Mediterranean Atlantic Region, WAB = Western Atlantic Boreal Region. The voyage duration in days was calculated at a ships speed of 16 knots. Colour shading indicates the risk level with green = low risk, yellow = medium risk and red = high risk, except in column "port/port region" where red = extreme risk and purple = high risk.
Port/port region
Country Salinity (ppt)
at 8 °C
Temp. zone
Kemi, Tornea, Raahe
Finland 0-4,2 EAB
Port/port
region Country Salinity
(ppt) at 8 °C
Temp. zone
Salinitymatch
Salinityrisk level
Temp.match
Temp.risk level
Voyage duration [days]
Voyage duration
[nm]
Voyage risk level
Inner-Baltic
shipping
Risk level
Total risk
calcu-lation
Aalborg Denmark 18,2 EAB no 1 yes 3 2,7 979 3 yes 1 8 Aarhus Denmark 20,0 EAB no 1 yes 3 2,6 942 3 yes 1 8 Aberdeen UK 30,9 EAB no 1 yes 3 3,8 1401 2 no 3 9 Amsterdam Netherlands 0-11,8 EAB yes 3 yes 3 3,8 1403 2 no 3 11 Antwerp Belgium 0 EAB yes 3 yes 3 4,2 1535 3 no 3 12 Bilbao Spain 30,9 MA no 1 no 2 5,9 2153 2 no 3 8 Bordeaux France 0-32,2 MA yes 3 no 2 5,8 2125 2 no 3 10 Delfzijl/ Eemshaven
Netherlands 9,3-22,1 EAB no 2 yes 3 3,6 1326 2 no 3 10
Halmstad Sweden 15 EAB no 1 yes 3 2,5 897 3 yes 1 8 Helsinki Finland 0-6,7 EAB yes 3 yes 3 1,6 582 3 yes 1 10 Honfleur France 0 MA yes 3 no 2 4,5 1634 2 no 3 10 Immingham UK 20,8 EAB no 1 yes 3 3,9 1432 2 no 3 9 Ipswich UK 24,6 EAB no 1 yes 3 4 1471 2 no 3 9 Karlsborg Sweden <4,2 EAB yes 3 yes 3 0,2 64 3 yes 1 10 Koge Sweden 8 EAB no 2 yes 3 2,3 828 3 yes 1 9 Kokkola Finland 2,9 EAB yes 3 yes 3 0,3 121 3 yes 1 10 Köping Sweden 0 EAB yes 3 yes 3 yes 1 7 Kotka Finland 2,9 EAB yes 3 yes 3 1,7 638 3 yes 1 10 Kubikenborg Sweden 0-5,4 EAB yes 3 yes 3 0,8 290 3 yes 1 10 Kunda (Tallinn)
Estonia 2,9 EAB yes 3 yes 3 1,5 565 3 yes 1 10
Lübeck Germany <10 EAB no 2 yes 3 2,5 899 3 yes 1 9 Lulea Sweden 0 EAB yes 3 yes 3 0,2 74 3 yes 1 10 Naantali Finland 6,7 EAB no 3 yes 3 1,4 494 3 yes 1 10 Oulu Finland 0 EAB yes 3 yes 3 0,2 62 3 yes 1 10 Philadelphia USA 0 WAB yes 3 no 1 12,7 4651 1 no 3 8 Pori Finland 4,2 EAB yes 3 yes 3 0,8 292 3 yes 1 10 Porvoo Finland 0-6,7 EAB yes 3 yes 3 1,7 609 3 yes 1 10 Rauma Finland 2,9-4,2 EAB yes 3 yes 3 0,9 322 3 yes 1 10 Riga Latvia 1,6 EAB yes 3 yes 3 1,7 638 3 yes 1 10 Rönnskär/ Skelleftea
Sweden 0 EAB yes 3 yes 3 0,3 115 3 yes 1 10
Rotterdam Netherlands 0,2-30,9 EAB yes 3 yes 3 3,9 1439 2 no 3 11 Scheveningen (Hoek van Holland)
Netherlands 18,2 EAB no 1 yes 3 3,9 1422 2 no 3 9
Slite Sweden 5,4 EAB no 3 yes 3 1,5 548 3 yes 1 10 Stockholm Sweden 5,4 EAB no 3 yes 3 1,2 450 3 yes 1 10 Sundsvall Sweden 0-5,4 EAB yes 3 yes 3 0,8 290 3 yes 1 10 Turku Finland 4,2 EAB yes 3 yes 3 1,4 495 3 yes 1 10 Västerås Sweden 0 EAB yes 3 yes 3 1,6 577 3 yes 1 10
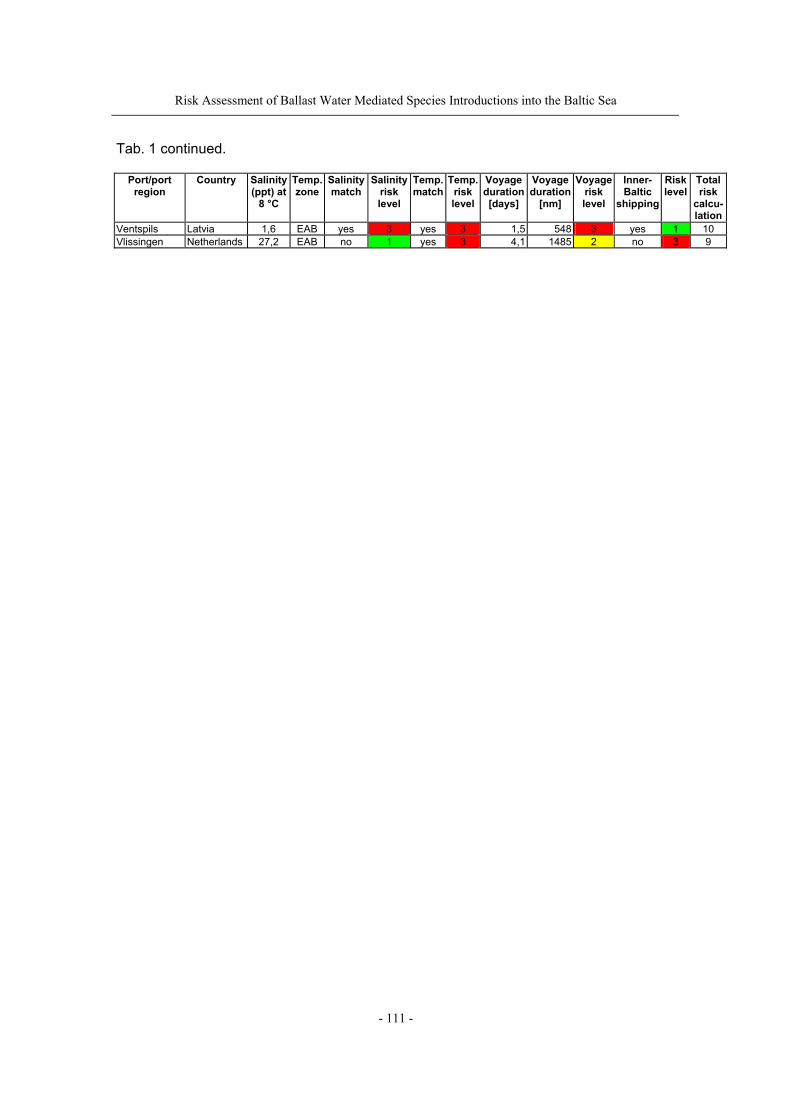
Risk Assessment of Ballast Water Mediated Species Introductions into the Baltic Sea
- 111 -
Tab. 1 continued.
Port/port region
Country Salinity (ppt) at
8 °C
Temp. zone
Salinitymatch
Salinityrisk level
Temp.match
Temp.risk level
Voyage duration [days]
Voyage duration
[nm]
Voyage risk level
Inner-Baltic
shipping
Risk level
Total risk
calcu-lation
Ventspils Latvia 1,6 EAB yes 3 yes 3 1,5 548 3 yes 1 10 Vlissingen Netherlands 27,2 EAB no 1 yes 3 4,1 1485 2 no 3 9