risk factors for inadequate antibody response to primary
TRANSCRIPT
RESEARCH ARTICLE
Risk factors for inadequate antibody response
to primary rabies vaccination in dogs under
one year of age
Ryan M. Wallace1, Anna Pees2, Jesse B. Blanton1, Susan M. Moore2*
1 Poxvirus and Rabies Branch, Centers for Disease Control and Prevention, Atlanta, Georgia, United States
of America, 2 Rabies Laboratory, Kansas State Veterinary Diagnostic Laboratory, Kansas State University
Rabies Laboratory, Manhattan, Kansas, United States of America
Abstract
Ensuring the adequacy of response to rabies vaccination in dogs is important, particularly in
the context of pet travel. Few studies have examined the factors associated with dogs’ fail-
ure to achieve an adequate antibody titer after vaccination (0.5 IU/ml). This study evaluated
rabies antibody titers in dogs after primary vaccination. Dogs under one year of age whose
serum was submitted to a reference laboratory for routine diagnostics, and which had no
prior documented history of vaccination were enrolled (n = 8,011). Geometric mean titers
(GMT) were calculated and univariate analysis was performed to assess factors associated
with failure to achieve 0.5 IU/mL. Dogs vaccinated at >16 weeks of age had a significantly
higher GMT compared to dogs vaccinated at a younger age (1.64 IU/ml, 1.57–1.72, ANOVA
p < 0.01). There was no statistical difference in GMT between dogs vaccinated <12 weeks
and dogs vaccinated 12–16 weeks (1.22 IU/ml and 1.21 IU/ml). The majority of dogs failed
to reach an adequate titer within the first 3 days of primary vaccination; failure rates were
also high if the interval from vaccination to titer check was greater than 90 days. Over 90%
of dogs that failed primary vaccination were able to achieve adequate titers after booster
vaccination. The ideal timing for blood draw is 8–30 days after primary vaccination. In the
event of a failure, most dogs will achieve an adequate serologic response upon a repeat titer
(in the absence of booster vaccination). Booster vaccination after failure provided the high-
est probability of an acceptable titer.
Author summary
For rabies prevention and control it is important that pets and domestic animals be vacci-
nated, this is especially relevant for rabies-free areas of the world which tightly control
dog and cat entry to ensure rabies is not imported. Adequate response to rabies must be
proven by testing the pet’s serum for rabies antibodies. Failure to produce an adequate
antibody response is related to various factors such as pet health, vaccine type, timing of
vaccination and subsequent blood sampling as well as age. Identifying the ideal vaccina-
tion and blood drawing schedules. Unique factors, such as maternal antibody interference,
PLOS Neglected Tropical Diseases | https://doi.org/10.1371/journal.pntd.0005761 July 31, 2017 1 / 14
a1111111111
a1111111111
a1111111111
a1111111111
a1111111111
OPENACCESS
Citation: Wallace RM, Pees A, Blanton JB, Moore
SM (2017) Risk factors for inadequate antibody
response to primary rabies vaccination in dogs
under one year of age. PLoS Negl Trop Dis 11(7):
e0005761. https://doi.org/10.1371/journal.
pntd.0005761
Editor: Charles E Rupprecht, Wistar Institute,
UNITED STATES
Received: April 4, 2017
Accepted: June 30, 2017
Published: July 31, 2017
Copyright: This is an open access article, free of all
copyright, and may be freely reproduced,
distributed, transmitted, modified, built upon, or
otherwise used by anyone for any lawful purpose.
The work is made available under the Creative
Commons CC0 public domain dedication.
Data Availability Statement: All relevant data are
within the paper and raw data is included in the
manuscript as supporting information file "S1
Dataset."
Funding: The authors received no specific funding
for this work.
Competing interests: The authors have declared
that no competing interests exist.
affect the ability of young dogs to mount a robust immune response to vaccination; this
group of pets has not previously been studied. This study looked at rabies antibody result
from dogs under one year of age after a single vaccination to determine the timing of vac-
cination and a blood sampling that ideally would ensure an antibody response sufficient
to prove the vaccination was effective for rabies protection.
Introduction
Recommendations for the vaccination of dogs against rabies differs based upon the endemic
rabies status in a country or region. Countries that have enzootic circulation of rabies in dogs
are encouraged to vaccinate a minimum of 70% of the dog population each year, for 5–7 years,
to achieve elimination [1]. For these countries, all dogs should be vaccinated when campaigns
are held, regardless of age or previous vaccination status. Once the canine rabies virus variant
has been eliminated, vaccination recommendations often vary depending on the transmission
patterns of wildlife rabies in the region. In settings where wildlife rabies reservoirs pose a threat
to domestic animals, dog vaccination may still be important from a public health perspective,
but the 70% threshold for elimination purposes is no longer applicable [2]. In the United
States, a canine rabies-free country, most rabies vaccines are licensed for dogs older than 12
weeks of age, and the National Association for State Public Health Veterinarians recommends
a booster vaccination one year later. Frequency of re-vaccination is often determined by local
policy (either annual or tri-annual booster vaccination).
Re-incursion of the canine rabies virus may pose negative public health and fiduciary con-
sequences. Therefore, countries that have eliminated this variant often require proof of vacci-
nation and/or proof of adequate rabies antibody titer for dogs entering the country. For
example, dogs entering New Zealand, a rabies-free country, are required to have received a
rabies vaccine given no less than six months prior and not more than one year prior to the
date of entry [2,3]. In addition, proof of a rabies antibody titer of at least 0.5 IU/ml from a
blood sample collected not less than three months and not more than 24 months prior to entry
is required. Depending on the jurisdiction, dogs without proof of vaccination may be turned
away, euthanized, or granted access in extenuating circumstances through government moni-
toring programs [4].
Rabies vaccination failures in dogs, although rare, have been documented and falsification
of records has resulted in the entry of canine rabies virus variant infected dogs into rabies-free
countries [5,6]. Therefore, in addition to veterinary records, many countries require that dogs
seeking entry into rabies-free jurisdictions also provide serologic evidence of vaccination. A
rabies neutralizing antibody titer� 0.5 IU/ml is defined by WHO and OIE as the minimum
post-vaccination antibody level [1,7]. However, several studies have reported that roughly 10%
of rabies vaccine naïve dogs fail to reach this threshold after primary vaccination [8,9]. The
immune response to primary vaccination may be affected by intrinsic factors such as genetics,
as well as extrinsic factors such as long delays in the time from vaccination to antibody titer
measurement [10–12]. Vaccination costs (including veterinary fees) average $65.00 USD, and
the typical cost to verify an immunologic response is $150.00 USD (Kansas State University).
Therefore, failure to detect an adequate antibody titer could result in costs of over $400.00 (2
rabies vaccinations and 2 titer draws) per failed titer check. Identifying predisposing factors
and describing the correct timing for primary vaccination, booster vaccination, and blood
draws for titer verification can have both a health impact for the dog as well as an economic
impact for the owner.
Primary rabies vaccination failure in young dogs
PLOS Neglected Tropical Diseases | https://doi.org/10.1371/journal.pntd.0005761 July 31, 2017 2 / 14
This study evaluates the factors associated with failure to reach adequate titers among dogs
that are under one year of age and had no history of vaccination. This cohort has not previ-
ously been studied for risk factors and specifically for blood sampling delay. Knowledge of the
ideal timing of rabies vaccination and blood draw would help veterinarians prepare pets for
export to rabies-free areas as well as provide more information that guides optimal protection
from rabies.
Methods
Kansas State University (KSU) Rabies Laboratory serves as a national reference laboratory for
confirming rabies neutralizing antibody levels in domestic animals and humans. KSU per-
forms rabies serology for international pet travel, clinical trial studies of rabies biologics for
global use, and research of oral rabies vaccine response in wildlife as well as other rabies
research. Serum samples and accompanying dog demographic data were submitted from
162,739 animals to the KSU Rabies Laboratory between 2006 and 2010 for the detection of
rabies antibody titer levels prior to pet travel. Samples are tested via Fluorescent Antibody
Virus Neutralization (FAVN) testing and data from submission forms are entered into Micro-
soft Access and the Universal Veterinary Information System. Submission forms include the
name and address of the submitting clinic or laboratory and animal information (species,
name, identification number, birthdate, sex, breed, vaccination history, and serum draw date).
This study was conducted to evaluate the detection of rabies antibody in rabies vaccine
naïve dogs after primary vaccination. Therefore, the dataset was limited to dogs under one
year of age (n = 13,061) and was further restricted to those with no prior documented history
of rabies vaccination (n = 8,011). Submission forms without an identification number, birth
date, serum draw date, and vaccination history were omitted from the study.
The FAVN assay is performed following the published OIE procedure [13]. Many countries
and international organizations consider an acceptable titer to be 0.5 IU/mL [14]. For purposes
of pet travel, three-fold serum dilutions are carried out to 1:81 to allow discrimination between
samples less than 0.5 IU/mL and those greater than or equal to 0.5 IU/mL. Dogs for which titer
results were not carried out to end-point determination (i.e., above the upper limit of detection
of the assay), a weighted average among all dogs in the reported titer group, and the next two
higher dilutions, was calculated. This weighted titer was used as a proxy for the end-point titer
for purposes of data analysis. Dogs with sera titers less than 0.5 IU/ml were considered to have
a failed test and a titer greater than or equal to 0.5 IU/ml was considered to have a passing test
[1,14]. Canine samples were further categorized into the following cut-off titer groups: <0.5
IU/ml (Low responders),�0.5—<1.5 IU/ml (Moderate responders), 1.5—>7.9 IU/m (High
responders). Unless otherwise noted, only the initial FAVN titer after primary vaccination was
analyzed. Repeated titers for dogs that failed to reach a titer of 0.5 IU/ml, for which additional
data were available, were analyzed separately.
Dogs were classified into three groups based on their age at primary vaccination: less than
12 weeks of age, 12–16 weeks of age (on-time), and greater than 16 weeks of age. Most rabies
vaccines in the US market are licensed for dogs older than 12 weeks of age, therefore dogs with
primary vaccination earlier than 12 weeks were considered early vaccinations [2]. Most state
regulations require that a dog be vaccinated prior to 16 weeks of age. Therefore, dogs receiving
rabies vaccination later than 16 weeks were considered late immunizations.
The time period between initial vaccination and sample draw was calculated based on dates
provided on submission forms and defined as the draw interval. Eight draw intervals categories
were defined: 1)� 3 days, 2) 4 days to� 7 days, 3) 8 days to 14 days, 4) 15 days to 30 days, 5)
31 days to 90 days, 6) 91 days to 180 days, 7) 180 days to 270 days, and 8) > 270 days.
Primary rabies vaccination failure in young dogs
PLOS Neglected Tropical Diseases | https://doi.org/10.1371/journal.pntd.0005761 July 31, 2017 3 / 14
The submission form accompanying the sample included an entry for dog breed. Dogs with
only one dog breed listed were categorized as “Pure Breed” and dogs with multiple breeds
listed or specifically noted as “Mix” on submission forms were considered “Mixed Breed”. The
analysis did not delineate between different breeds but rather assessed the variables of pure
breed versus mixed breed. Breed was also used to categorize dogs into 5 size groups: toy, small,
medium, large, and giant. The American Kennel Club (AKC) has defined each size group with
a weight range and the breeds included in each size group. The AKC groupings were used to
define the size groups in this study.
Statistical analysis
Statistical analyses were performed with SAS software and OpenEpi (www.openepi.com). Var-
iables examined included age group, time period between vaccination and blood draw, and
breed size as well as pure versus mixed breed. Comparison of the frequency for the variables
was analyzed using the Cochran-Mantel-Haenszel test of significance. Geometric mean titers
were calculated and multivariable linear regression models were developed to identify vari-
ables that were significantly associated with individual titer levels. Serological responses were
plotted by the draw interval. The serologic response was measured two ways; GMT, and pro-
portions failing to reach 0.5 IU/ml (Figs 1 and 2, respectively). A polynomial trend line with 3
orders was determined to provide the best fit for the data. Titers for dogs which failed to
achieve 0.5 IU/ml, and for which a repeat titer was conducted and captured in the database,
were analyzed as described above.
Results
The number of dogs less than 1 year of age with no documented history of vaccinations was
8,215. A total of 204 (2.5%) dogs were removed from analysis due to missing or inconsistent
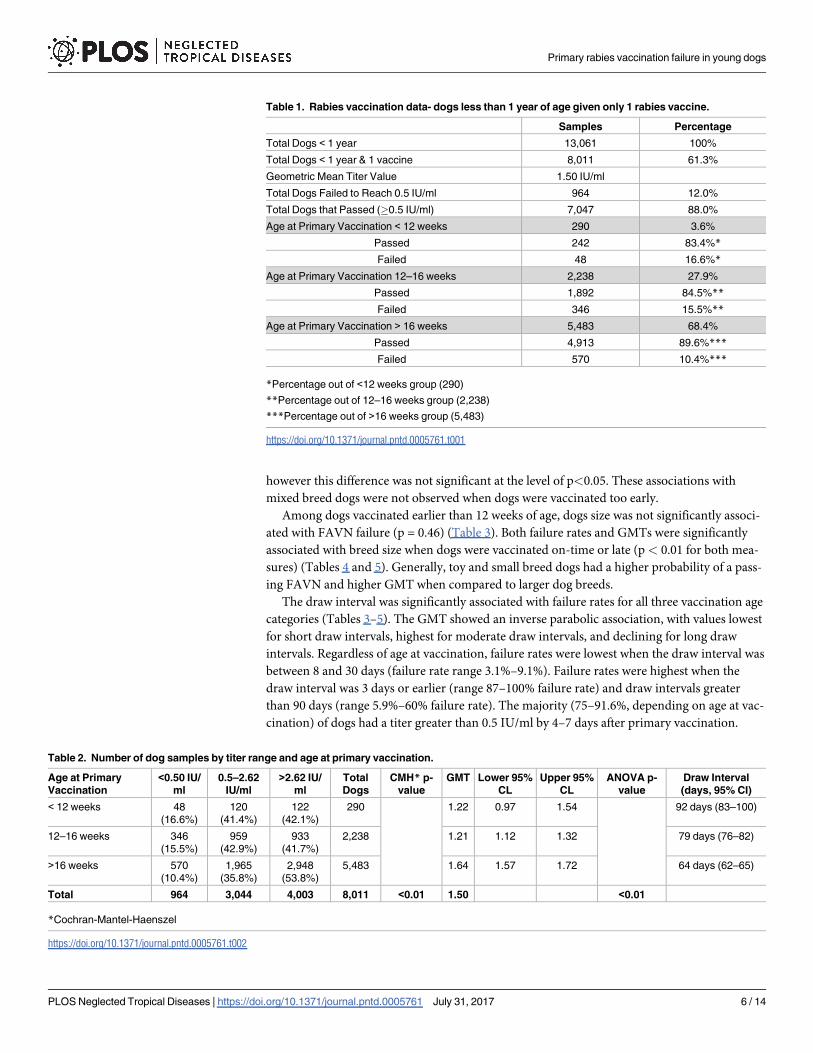
data in the laboratory form, for a final study sample size of 8,011 dogs (Table 1). The number
of dogs that failed the FAVN test (<0.5 IU/ml) included 964 (12.0%) samples and the number
of dogs that passed the FAVN test (>0.5 IU/ml) included 7,047 (88.0%) samples. A higher pro-
portion of dogs had greater than the minimum titer required when they were vaccinated at an
age greater than 16 weeks compared to dogs vaccinated early or on-time (89.6% compared to
83.4% and 84.5%, respectively) (Table 1).
The geometric mean titer (GMT) for all dogs sampled was 1.50 IU/ml, irrespective of the
draw interval (Table 1). Further delineation of the sample numbers into three age groups at
which the primary vaccination was received is displayed in Table 2. Age at vaccination had a
significant impact on antibody titer response; dogs vaccinated at>16 weeks of age had a sig-
nificantly higher GMT (1.64 IU/ml, 1.57–1.72, ANOVA p< 0.01) (Table 2). There was no sta-
tistical difference in GMT between dogs vaccinated early and dogs vaccinated on-time (1.22
IU/ml compared to 1.21 IU/ml) (Table 2).
The sex of the dog did not significantly impact failure rates for any of the three vaccination
age categories (p = 0.51, 0.28, 0.12 for early, on-time, and late ages of vaccination) and was not
a significant variable in the full model (Tables 3–6). Similarly, the GMT for males and females
in all three age categories was non-significant, indicating that the primary immune response is
not associated with sex. High responders (titers greater than 1.5 IU/ml) were more commonly
seen when the titer was drawn between 8 and 30 days after vaccination, and among toy and
small breed dogs (Tables 3–5).
Mixed breed dogs with primary vaccination on time and late were more likely to pass the
FAVN compared to pure breed dogs (12.5% vs 16.2% [p = 0.09] and 8.3% vs 11.0% [p = 0.03],
respectively). Mean GMTs were higher for mixed breed dogs when vaccinated on-time or late,
Primary rabies vaccination failure in young dogs
PLOS Neglected Tropical Diseases | https://doi.org/10.1371/journal.pntd.0005761 July 31, 2017 4 / 14
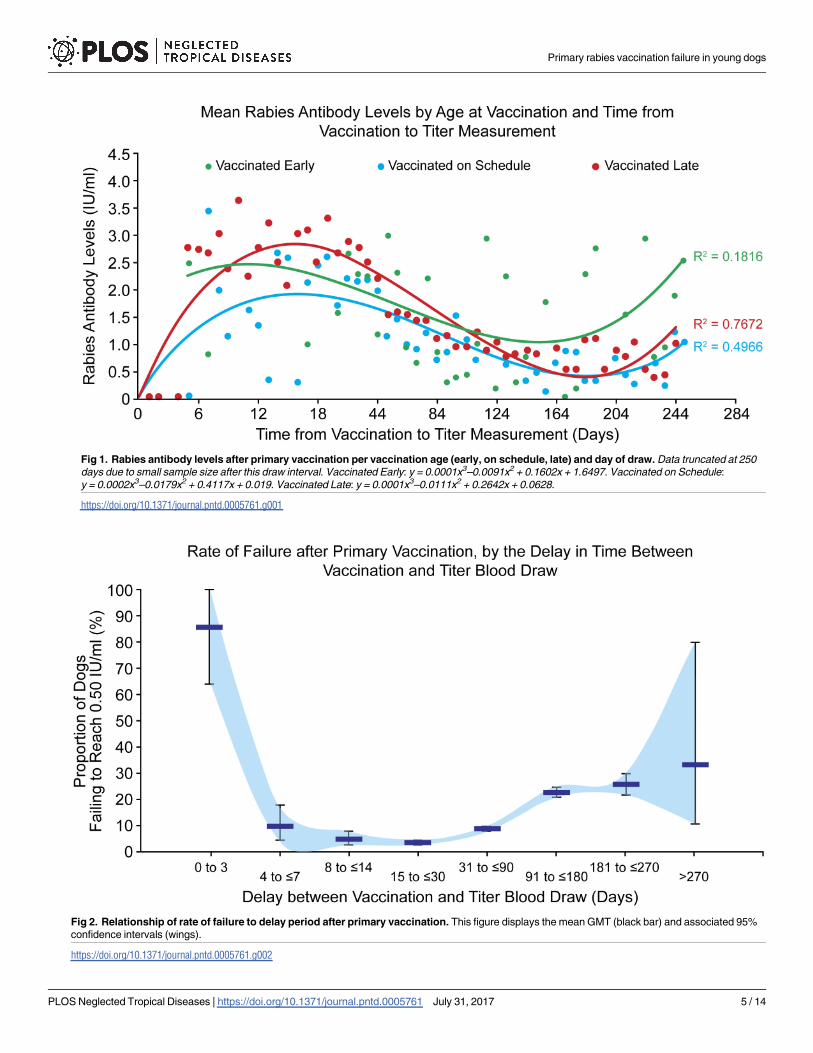
Fig 1. Rabies antibody levels after primary vaccination per vaccination age (early, on schedule, late) and day of draw. Data truncated at 250
days due to small sample size after this draw interval. Vaccinated Early: y = 0.0001x3–0.0091x2 + 0.1602x + 1.6497. Vaccinated on Schedule:
y = 0.0002x3–0.0179x2 + 0.4117x + 0.019. Vaccinated Late: y = 0.0001x3–0.0111x2 + 0.2642x + 0.0628.
https://doi.org/10.1371/journal.pntd.0005761.g001
Fig 2. Relationship of rate of failure to delay period after primary vaccination. This figure displays the mean GMT (black bar) and associated 95%
confidence intervals (wings).
https://doi.org/10.1371/journal.pntd.0005761.g002
Primary rabies vaccination failure in young dogs
PLOS Neglected Tropical Diseases | https://doi.org/10.1371/journal.pntd.0005761 July 31, 2017 5 / 14
however this difference was not significant at the level of p<0.05. These associations with
mixed breed dogs were not observed when dogs were vaccinated too early.
Among dogs vaccinated earlier than 12 weeks of age, dogs size was not significantly associ-
ated with FAVN failure (p = 0.46) (Table 3). Both failure rates and GMTs were significantly
associated with breed size when dogs were vaccinated on-time or late (p< 0.01 for both mea-
sures) (Tables 4 and 5). Generally, toy and small breed dogs had a higher probability of a pass-
ing FAVN and higher GMT when compared to larger dog breeds.
The draw interval was significantly associated with failure rates for all three vaccination age
categories (Tables 3–5). The GMT showed an inverse parabolic association, with values lowest
for short draw intervals, highest for moderate draw intervals, and declining for long draw
intervals. Regardless of age at vaccination, failure rates were lowest when the draw interval was
between 8 and 30 days (failure rate range 3.1%–9.1%). Failure rates were highest when the
draw interval was 3 days or earlier (range 87–100% failure rate) and draw intervals greater
than 90 days (range 5.9%–60% failure rate). The majority (75–91.6%, depending on age at vac-
cination) of dogs had a titer greater than 0.5 IU/ml by 4–7 days after primary vaccination.
Table 1. Rabies vaccination data- dogs less than 1 year of age given only 1 rabies vaccine.
Samples Percentage
Total Dogs < 1 year 13,061 100%
Total Dogs < 1 year & 1 vaccine 8,011 61.3%
Geometric Mean Titer Value 1.50 IU/ml
Total Dogs Failed to Reach 0.5 IU/ml 964 12.0%
Total Dogs that Passed (�0.5 IU/ml) 7,047 88.0%
Age at Primary Vaccination < 12 weeks 290 3.6%
Passed 242 83.4%*
Failed 48 16.6%*
Age at Primary Vaccination 12–16 weeks 2,238 27.9%
Passed 1,892 84.5%**
Failed 346 15.5%**
Age at Primary Vaccination > 16 weeks 5,483 68.4%
Passed 4,913 89.6%***
Failed 570 10.4%***
*Percentage out of <12 weeks group (290)
**Percentage out of 12–16 weeks group (2,238)
***Percentage out of >16 weeks group (5,483)
https://doi.org/10.1371/journal.pntd.0005761.t001
Table 2. Number of dog samples by titer range and age at primary vaccination.
Age at Primary
Vaccination
<0.50 IU/
ml
0.5–2.62
IU/ml
>2.62 IU/
ml
Total
Dogs
CMH* p-
value
GMT Lower 95%
CL
Upper 95%
CL
ANOVA p-
value
Draw Interval
(days, 95% CI)
< 12 weeks 48
(16.6%)
120
(41.4%)
122
(42.1%)
290 1.22 0.97 1.54 92 days (83–100)
12–16 weeks 346
(15.5%)
959
(42.9%)
933
(41.7%)
2,238 1.21 1.12 1.32 79 days (76–82)
>16 weeks 570
(10.4%)
1,965
(35.8%)
2,948
(53.8%)
5,483 1.64 1.57 1.72 64 days (62–65)
Total 964 3,044 4,003 8,011 <0.01 1.50 <0.01
*Cochran-Mantel-Haenszel
https://doi.org/10.1371/journal.pntd.0005761.t002
Primary rabies vaccination failure in young dogs
PLOS Neglected Tropical Diseases | https://doi.org/10.1371/journal.pntd.0005761 July 31, 2017 6 / 14
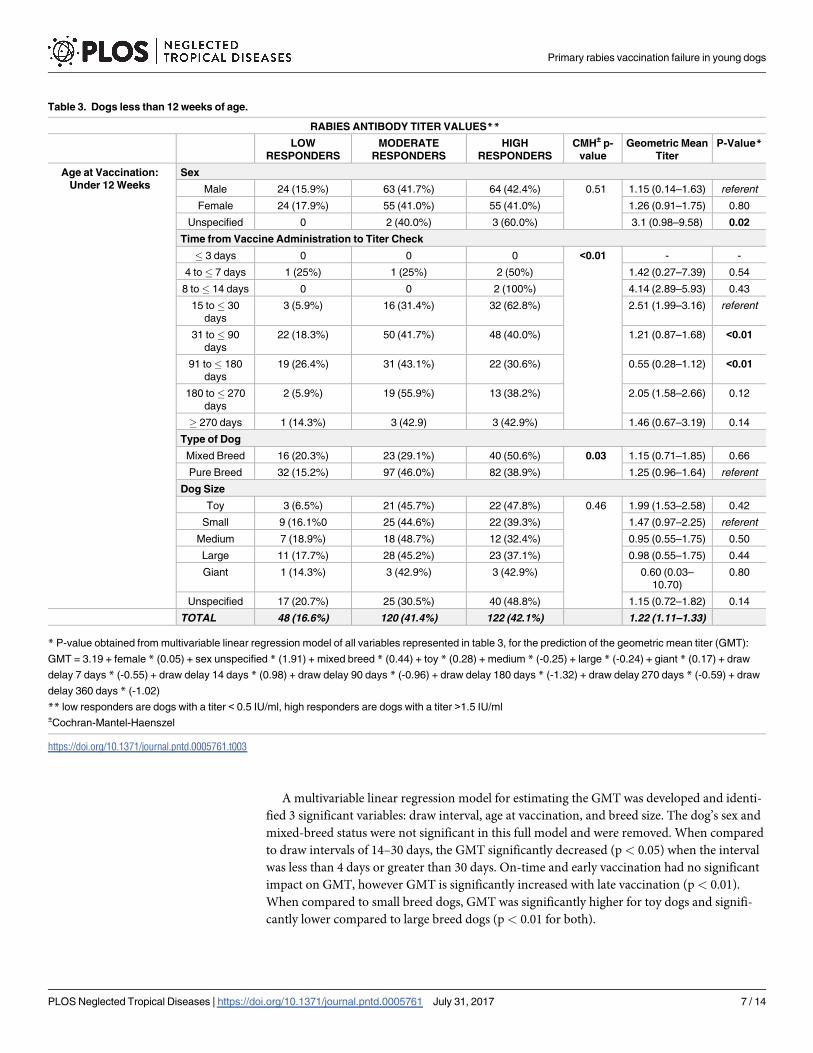
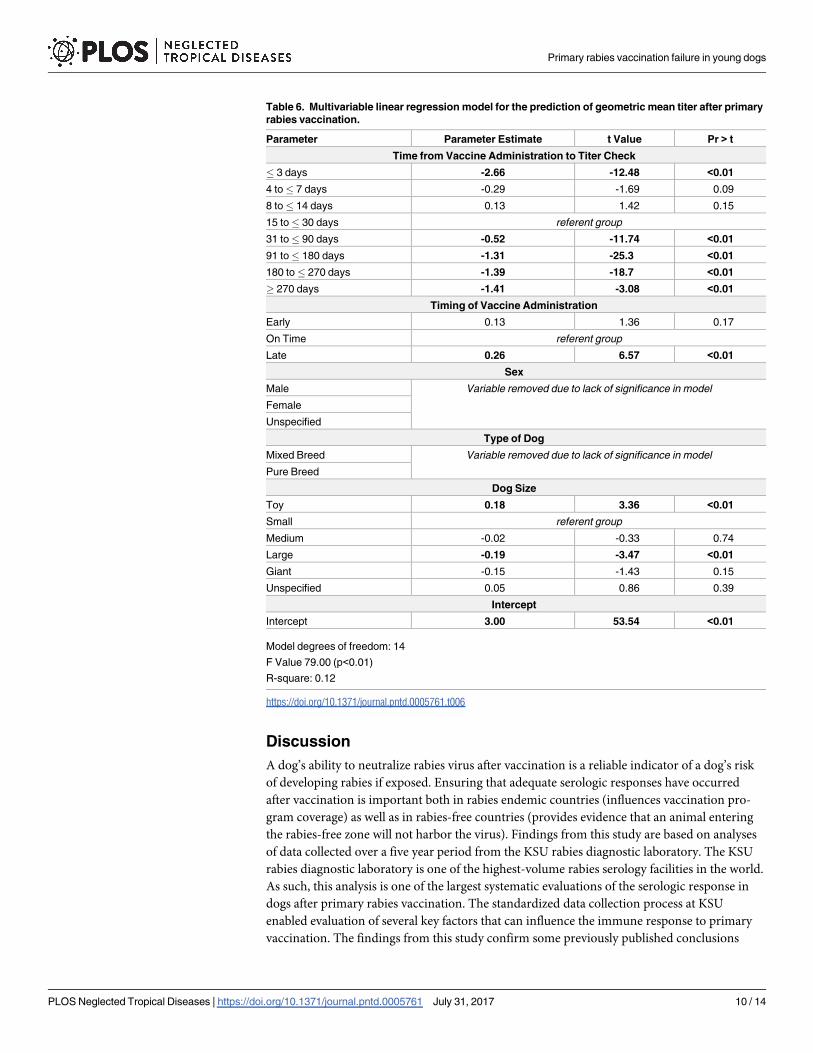
A multivariable linear regression model for estimating the GMT was developed and identi-
fied 3 significant variables: draw interval, age at vaccination, and breed size. The dog’s sex and
mixed-breed status were not significant in this full model and were removed. When compared
to draw intervals of 14–30 days, the GMT significantly decreased (p< 0.05) when the interval
was less than 4 days or greater than 30 days. On-time and early vaccination had no significant
impact on GMT, however GMT is significantly increased with late vaccination (p< 0.01).
When compared to small breed dogs, GMT was significantly higher for toy dogs and signifi-
cantly lower compared to large breed dogs (p< 0.01 for both).
Table 3. Dogs less than 12 weeks of age.
RABIES ANTIBODY TITER VALUES**
LOW
RESPONDERS
MODERATE
RESPONDERS
HIGH
RESPONDERS
CMH± p-
value
Geometric Mean
Titer
P-Value*
Age at Vaccination:
Under 12 Weeks
Sex
Male 24 (15.9%) 63 (41.7%) 64 (42.4%) 0.51 1.15 (0.14–1.63) referent
Female 24 (17.9%) 55 (41.0%) 55 (41.0%) 1.26 (0.91–1.75) 0.80
Unspecified 0 2 (40.0%) 3 (60.0%) 3.1 (0.98–9.58) 0.02
Time from Vaccine Administration to Titer Check
� 3 days 0 0 0 <0.01 - -
4 to� 7 days 1 (25%) 1 (25%) 2 (50%) 1.42 (0.27–7.39) 0.54
8 to� 14 days 0 0 2 (100%) 4.14 (2.89–5.93) 0.43
15 to� 30
days
3 (5.9%) 16 (31.4%) 32 (62.8%) 2.51 (1.99–3.16) referent
31 to� 90
days
22 (18.3%) 50 (41.7%) 48 (40.0%) 1.21 (0.87–1.68) <0.01
91 to� 180
days
19 (26.4%) 31 (43.1%) 22 (30.6%) 0.55 (0.28–1.12) <0.01
180 to� 270
days
2 (5.9%) 19 (55.9%) 13 (38.2%) 2.05 (1.58–2.66) 0.12
� 270 days 1 (14.3%) 3 (42.9) 3 (42.9%) 1.46 (0.67–3.19) 0.14
Type of Dog
Mixed Breed 16 (20.3%) 23 (29.1%) 40 (50.6%) 0.03 1.15 (0.71–1.85) 0.66
Pure Breed 32 (15.2%) 97 (46.0%) 82 (38.9%) 1.25 (0.96–1.64) referent
Dog Size
Toy 3 (6.5%) 21 (45.7%) 22 (47.8%) 0.46 1.99 (1.53–2.58) 0.42
Small 9 (16.1%0 25 (44.6%) 22 (39.3%) 1.47 (0.97–2.25) referent
Medium 7 (18.9%) 18 (48.7%) 12 (32.4%) 0.95 (0.55–1.75) 0.50
Large 11 (17.7%) 28 (45.2%) 23 (37.1%) 0.98 (0.55–1.75) 0.44
Giant 1 (14.3%) 3 (42.9%) 3 (42.9%) 0.60 (0.03–
10.70)
0.80
Unspecified 17 (20.7%) 25 (30.5%) 40 (48.8%) 1.15 (0.72–1.82) 0.14
TOTAL 48 (16.6%) 120 (41.4%) 122 (42.1%) 1.22 (1.11–1.33)
* P-value obtained from multivariable linear regression model of all variables represented in table 3, for the prediction of the geometric mean titer (GMT):
GMT = 3.19 + female * (0.05) + sex unspecified * (1.91) + mixed breed * (0.44) + toy * (0.28) + medium * (-0.25) + large * (-0.24) + giant * (0.17) + draw
delay 7 days * (-0.55) + draw delay 14 days * (0.98) + draw delay 90 days * (-0.96) + draw delay 180 days * (-1.32) + draw delay 270 days * (-0.59) + draw
delay 360 days * (-1.02)
** low responders are dogs with a titer < 0.5 IU/ml, high responders are dogs with a titer >1.5 IU/ml±Cochran-Mantel-Haenszel
https://doi.org/10.1371/journal.pntd.0005761.t003
Primary rabies vaccination failure in young dogs
PLOS Neglected Tropical Diseases | https://doi.org/10.1371/journal.pntd.0005761 July 31, 2017 7 / 14

The relationship between primary vaccination and antibody titer was best fit by a 3-tier
polynomial model. Two models had generally good fit when considering that only draw-inter-
val was considered in the regression analysis: on-time, and late (r2 = 0.50, and 0.77, respec-
tively) (Fig 1). For animals with primary vaccination after 12 weeks of age, the polynomial
model predicted that an adequate FAVN titer would be reached around day 3 post-vaccina-
tion. For all three vaccination age categories, the peak titer was expected to occur around 12–
18 days post-vaccination, and drop below 0.5 IU/ml at 160 days after vaccination.
When failure rate was analyzed without regard to age at vaccination, the rate of failure to
reach 0.5 IU/ml was greatest when titers were drawn within three days of primary vaccination
Table 4. Dogs 12–16 weeks of age.
RABIES ANTIBODY TITER VALUES**
LOW
RESPONDERS
MODERATE
RESPONDERS
HIGH
RESPONDERS
CMH± p-
value
Geometric Mean
Titer
P-value*
Age at Vaccination: 12–
16 Weeks
Sex
Male 185 (16.8%) 472 (42.8%) 445 (40.4%) 0.28 1.17 (1.04–1.32) referent
Female 159 (14.2%) 480 (42.7%) 485 (43.2%) 1.27 (1.13–1.42) 0.15
Unspecified 2 (16.7%) 7 (58.3%) 3 (25.0%) 0.53 (0.10–2.62) 0.14
Time from Vaccine Administration to Titer Check
� 3 days 7 (100.0%) 0 (0.0%) 0 (0.0%) <0.01 0.01 (0.00–0.15) <0.01
4 to� 7 days 1 (25.0%) 2 (50.0%) 1 (25.0%) 0.23 (0.00–
35.52)
0.43
8 to� 14 days 4 (9.1%) 17 (38.6%) 23 (52.3%) 1.68 (1.00–2.81) 0.72
15 to� 30
days
28 (5.4%) 212 (40.6%) 282 (54.0%) 2.13 (1.92–2.37) referent
31 to� 90
days
97 (10.9%) 384 (43.1%) 411 (46.1%) 1.56 (1.40–1.73) <0.01
91 to� 180
days
131 (25.1%) 237 (45.2%) 155 (29.6%) 0.74 (0.60–0.90) <0.01
180 to� 270
days
75 (31.3%) 104 (43.3%) 61 (25.4%) 0.51 (0.36–0.73) <0.01
� 270 days 3 (60.0%) 2 (40.0%) 0 (0.0%) 0.03 (0.00–2.44) <0.01
Type of Dog
Mixed Breed 55 (12.5%) 204 (46.5%) 180 (41.0%) 0.09 1.44 (1.25–1.65) 0.07
referentPure Breed 291 (16.2%) 755 (42.0%) 753 (41.9%) 1.17 (1.06–1.28)
Dog Size
Toy 51 (12.2%) 160 (38.2%) 208 (49.6%) <0.01 1.51 (1.27–1.79) 0.09
Small 74 (14.8%) 221 (44.3%) 204 (40.9%) 1.36 (1.16–1.59) referent
Medium 43 (16.9%) 97 (38.0%) 115 (45.1%) 0.99 (0.73–1.34) 0.76
Large 108 (20.6%) 229 (43.7%) 187 (35.7%) 0.91 (0.74–1.11) <0.01
Giant 10 (11.1%) 45 (50.0%) 35 (38.9%) 1.43 (1.01–2.04) 0.39
Unspecified 60 (13.3%) 207 (45.9%) 184 (40.8%) 1.34 (1.15–1.56) 0.05
TOTAL 346 (15.5%) 959 (42.9%) 933 (41.7%) 1.21 (1.12–1.32)
* P-value obtained from multivariable linear regression model of all variables represented in table 4, for the prediction of the geometric mean titer (GMT):
GMT = 2.87 + female * (0.10) + sex unspecified * (-0.68) + mixed breed * (0.84) + toy * (0.18) + medium * (-0.04) + large * (-0.29) + giant * (-0.15) + draw
delay 3 days * (-2.74) + draw delay 7 days * (-0.63) + draw delay 14 days * (-0.09) + draw delay 90 days * (-0.38) + draw delay 180 days * (-1.04) + draw
delay 270 days * (-1.21) + draw delay 360 days * (-1.94)
** low responders are dogs with a titer < 0.5 IU/ml, high responders are dogs with a titer >1.5 IU/ml±Cochran-Mantel-Haenszel
https://doi.org/10.1371/journal.pntd.0005761.t004
Primary rabies vaccination failure in young dogs
PLOS Neglected Tropical Diseases | https://doi.org/10.1371/journal.pntd.0005761 July 31, 2017 8 / 14
(85.7%, 95% CI 64.0%–100%) (Fig 2). Failure rate was lowest when blood was drawn 15–30
days after vaccination (3.7%, 95% CI 2.9%–4.6%). Larger confidence intervals around the fail-
ure rate were noted for very short and very long draw intervals.
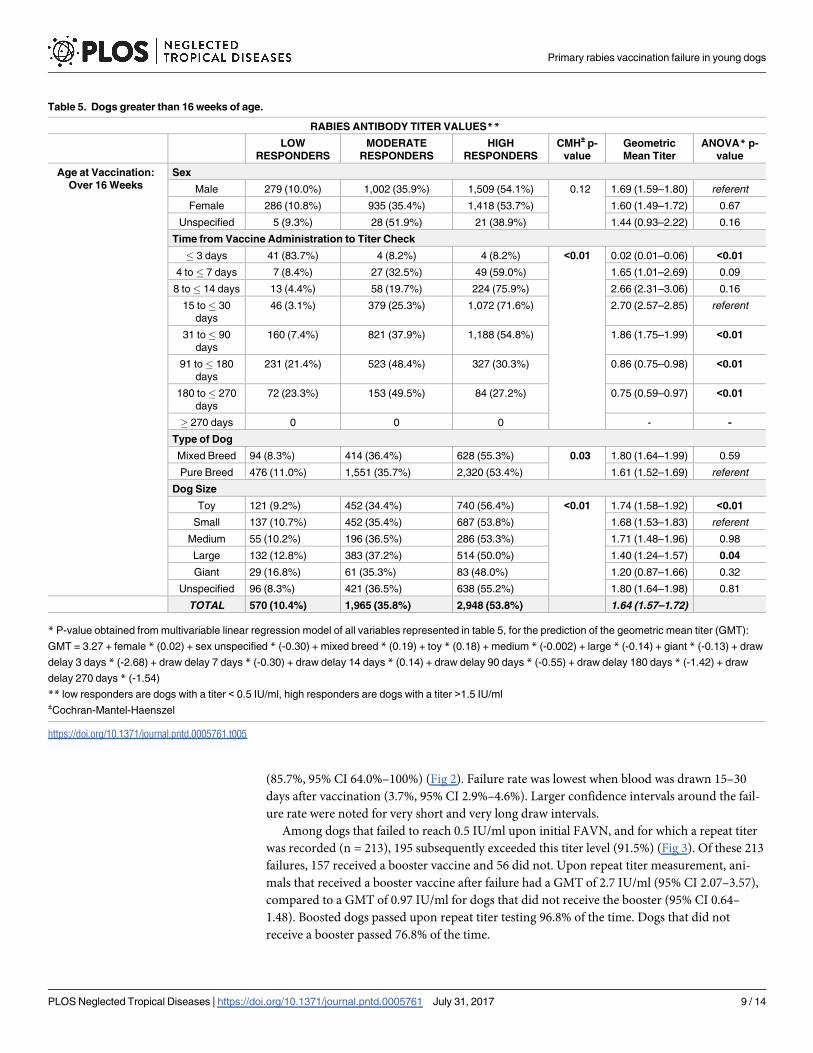
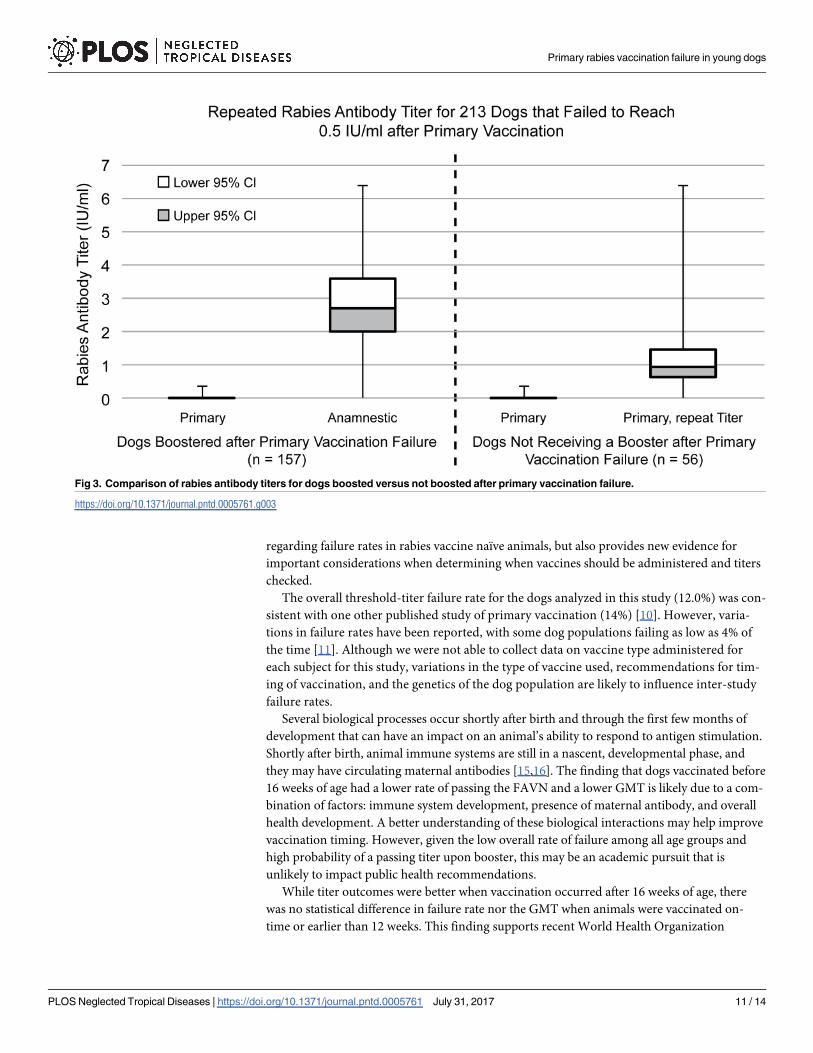
Among dogs that failed to reach 0.5 IU/ml upon initial FAVN, and for which a repeat titer
was recorded (n = 213), 195 subsequently exceeded this titer level (91.5%) (Fig 3). Of these 213
failures, 157 received a booster vaccine and 56 did not. Upon repeat titer measurement, ani-
mals that received a booster vaccine after failure had a GMT of 2.7 IU/ml (95% CI 2.07–3.57),
compared to a GMT of 0.97 IU/ml for dogs that did not receive the booster (95% CI 0.64–
1.48). Boosted dogs passed upon repeat titer testing 96.8% of the time. Dogs that did not
receive a booster passed 76.8% of the time.
Table 5. Dogs greater than 16 weeks of age.
RABIES ANTIBODY TITER VALUES**
LOW
RESPONDERS
MODERATE
RESPONDERS
HIGH
RESPONDERS
CMH± p-
value
Geometric
Mean Titer
ANOVA* p-
value
Age at Vaccination:
Over 16 Weeks
Sex
Male 279 (10.0%) 1,002 (35.9%) 1,509 (54.1%) 0.12 1.69 (1.59–1.80) referent
Female 286 (10.8%) 935 (35.4%) 1,418 (53.7%) 1.60 (1.49–1.72) 0.67
Unspecified 5 (9.3%) 28 (51.9%) 21 (38.9%) 1.44 (0.93–2.22) 0.16
Time from Vaccine Administration to Titer Check
� 3 days 41 (83.7%) 4 (8.2%) 4 (8.2%) <0.01 0.02 (0.01–0.06) <0.01
4 to� 7 days 7 (8.4%) 27 (32.5%) 49 (59.0%) 1.65 (1.01–2.69) 0.09
8 to� 14 days 13 (4.4%) 58 (19.7%) 224 (75.9%) 2.66 (2.31–3.06) 0.16
15 to� 30
days
46 (3.1%) 379 (25.3%) 1,072 (71.6%) 2.70 (2.57–2.85) referent
31 to� 90
days
160 (7.4%) 821 (37.9%) 1,188 (54.8%) 1.86 (1.75–1.99) <0.01
91 to� 180
days
231 (21.4%) 523 (48.4%) 327 (30.3%) 0.86 (0.75–0.98) <0.01
180 to� 270
days
72 (23.3%) 153 (49.5%) 84 (27.2%) 0.75 (0.59–0.97) <0.01
� 270 days 0 0 0 - -
Type of Dog
Mixed Breed 94 (8.3%) 414 (36.4%) 628 (55.3%) 0.03 1.80 (1.64–1.99) 0.59
Pure Breed 476 (11.0%) 1,551 (35.7%) 2,320 (53.4%) 1.61 (1.52–1.69) referent
Dog Size
Toy 121 (9.2%) 452 (34.4%) 740 (56.4%) <0.01 1.74 (1.58–1.92) <0.01
Small 137 (10.7%) 452 (35.4%) 687 (53.8%) 1.68 (1.53–1.83) referent
Medium 55 (10.2%) 196 (36.5%) 286 (53.3%) 1.71 (1.48–1.96) 0.98
Large 132 (12.8%) 383 (37.2%) 514 (50.0%) 1.40 (1.24–1.57) 0.04
Giant 29 (16.8%) 61 (35.3%) 83 (48.0%) 1.20 (0.87–1.66) 0.32
Unspecified 96 (8.3%) 421 (36.5%) 638 (55.2%) 1.80 (1.64–1.98) 0.81
TOTAL 570 (10.4%) 1,965 (35.8%) 2,948 (53.8%) 1.64 (1.57–1.72)
* P-value obtained from multivariable linear regression model of all variables represented in table 5, for the prediction of the geometric mean titer (GMT):
GMT = 3.27 + female * (0.02) + sex unspecified * (-0.30) + mixed breed * (0.19) + toy * (0.18) + medium * (-0.002) + large * (-0.14) + giant * (-0.13) + draw
delay 3 days * (-2.68) + draw delay 7 days * (-0.30) + draw delay 14 days * (0.14) + draw delay 90 days * (-0.55) + draw delay 180 days * (-1.42) + draw
delay 270 days * (-1.54)
** low responders are dogs with a titer < 0.5 IU/ml, high responders are dogs with a titer >1.5 IU/ml±Cochran-Mantel-Haenszel
https://doi.org/10.1371/journal.pntd.0005761.t005
Primary rabies vaccination failure in young dogs
PLOS Neglected Tropical Diseases | https://doi.org/10.1371/journal.pntd.0005761 July 31, 2017 9 / 14
Discussion
A dog’s ability to neutralize rabies virus after vaccination is a reliable indicator of a dog’s risk
of developing rabies if exposed. Ensuring that adequate serologic responses have occurred
after vaccination is important both in rabies endemic countries (influences vaccination pro-
gram coverage) as well as in rabies-free countries (provides evidence that an animal entering
the rabies-free zone will not harbor the virus). Findings from this study are based on analyses
of data collected over a five year period from the KSU rabies diagnostic laboratory. The KSU
rabies diagnostic laboratory is one of the highest-volume rabies serology facilities in the world.
As such, this analysis is one of the largest systematic evaluations of the serologic response in
dogs after primary rabies vaccination. The standardized data collection process at KSU
enabled evaluation of several key factors that can influence the immune response to primary
vaccination. The findings from this study confirm some previously published conclusions
Table 6. Multivariable linear regression model for the prediction of geometric mean titer after primary
rabies vaccination.
Parameter Parameter Estimate t Value Pr > t
Time from Vaccine Administration to Titer Check
� 3 days -2.66 -12.48 <0.01
4 to� 7 days -0.29 -1.69 0.09
8 to� 14 days 0.13 1.42 0.15
15 to� 30 days referent group
31 to� 90 days -0.52 -11.74 <0.01
91 to� 180 days -1.31 -25.3 <0.01
180 to� 270 days -1.39 -18.7 <0.01
� 270 days -1.41 -3.08 <0.01
Timing of Vaccine Administration
Early 0.13 1.36 0.17
On Time referent group
Late 0.26 6.57 <0.01
Sex
Male Variable removed due to lack of significance in model
Female
Unspecified
Type of Dog
Mixed Breed Variable removed due to lack of significance in model
Pure Breed
Dog Size
Toy 0.18 3.36 <0.01
Small referent group
Medium -0.02 -0.33 0.74
Large -0.19 -3.47 <0.01
Giant -0.15 -1.43 0.15
Unspecified 0.05 0.86 0.39
Intercept
Intercept 3.00 53.54 <0.01
Model degrees of freedom: 14
F Value 79.00 (p<0.01)
R-square: 0.12
https://doi.org/10.1371/journal.pntd.0005761.t006
Primary rabies vaccination failure in young dogs
PLOS Neglected Tropical Diseases | https://doi.org/10.1371/journal.pntd.0005761 July 31, 2017 10 / 14
regarding failure rates in rabies vaccine naïve animals, but also provides new evidence for
important considerations when determining when vaccines should be administered and titers
checked.
The overall threshold-titer failure rate for the dogs analyzed in this study (12.0%) was con-
sistent with one other published study of primary vaccination (14%) [10]. However, varia-
tions in failure rates have been reported, with some dog populations failing as low as 4% of
the time [11]. Although we were not able to collect data on vaccine type administered for
each subject for this study, variations in the type of vaccine used, recommendations for tim-
ing of vaccination, and the genetics of the dog population are likely to influence inter-study
failure rates.
Several biological processes occur shortly after birth and through the first few months of
development that can have an impact on an animal’s ability to respond to antigen stimulation.
Shortly after birth, animal immune systems are still in a nascent, developmental phase, and
they may have circulating maternal antibodies [15,16]. The finding that dogs vaccinated before
16 weeks of age had a lower rate of passing the FAVN and a lower GMT is likely due to a com-
bination of factors: immune system development, presence of maternal antibody, and overall
health development. A better understanding of these biological interactions may help improve
vaccination timing. However, given the low overall rate of failure among all age groups and
high probability of a passing titer upon booster, this may be an academic pursuit that is
unlikely to impact public health recommendations.
While titer outcomes were better when vaccination occurred after 16 weeks of age, there
was no statistical difference in failure rate nor the GMT when animals were vaccinated on-
time or earlier than 12 weeks. This finding supports recent World Health Organization
Fig 3. Comparison of rabies antibody titers for dogs boosted versus not boosted after primary vaccination failure.
https://doi.org/10.1371/journal.pntd.0005761.g003
Primary rabies vaccination failure in young dogs
PLOS Neglected Tropical Diseases | https://doi.org/10.1371/journal.pntd.0005761 July 31, 2017 11 / 14
recommendations that mass rabies vaccination campaigns should vaccinate all dogs that pres-
ent to a vaccination team, regardless of age [1]. In the United States most rabies vaccines are
licensed for dogs older than 12 weeks of age, and most regulations require dogs to be vacci-
nated by 16 weeks of age. In the United States and other rabies-free countries, policy makers
should balance the risk of rabies exposure to dogs to the expected immune response at the age
of vaccination. Delaying the required vaccination age beyond 16 weeks increases the time in
which that dog is susceptible to rabies while only improving the failure rate by 5%. Given the
grave consequences of rabies infection, current licensure and vaccination recommendations
appear adequate for countries with rabies epidemiology similar to the United States [17].
Mixed breed dogs had an improved titer response and failure rate when compared to pure
breed dogs in this study (Tables 3 and 4). There are reports that mixed breed dogs are geneti-
cally more robust and less prone to inherited disorders and disease [18,19]. There are likely
exceptions to this simplistic generalization as some breeds were developed through rapid
inbreeding and the genetic ‘health’ of those dogs may be questionable. Conversely, some pure
breeds (Anatolian) were bred over thousands of years, and are not predisposed to as many
genetic disorders. Since antigenic recognition and antibody production are tied to genetics,
this is an association that should be considered. Further distinction of breed influence on
immunologic response to rabies vaccination may help identify specific breed or breed-catego-
ries that are at higher risk of titer failure.
Smaller dog size was associated with more favorable titer outcomes. As mentioned earlier,
specific breed genetics may influence this finding. Another likely factor in this reported obser-
vation is the role of dose-response to the rabies vaccine. All dogs, regardless of size, receive the
same dose of rabies vaccine (1 ml per US licensed products). The concentration of antigen can
vary between products and batches [20]. However, assuming no bias in vaccine products in
the study population and an antigenic load of 1 IU per vaccine, the dosage of antigen dogs
receive varies greatly between toy breeds and giant breeds; a 1.5 kg Chihuahua puppy receives
a rabies dosage of 0.7 IU/kg, while a 25 kg Saint Bernard puppy receives a rabies dosage of 0.04
IU//kg. This dose response effect has been noted in other publications [11]. In humans the
dose response was clearly demonstrated by administration of serial dilutions of rabies vaccine
in a study by Berens et al., supporting the minimum antigen dosage for human rabies vaccine
[21]. Use of the minimum dose designated in vaccine approval studies is clearly required. Pro-
viding a larger antigenic load or 2 site vaccination for larger breed dogs may help decrease the
failure rate after primary vaccination.
The most significant factor related to having an adequate titer was the time between vacci-
nation and when blood was drawn. Among the population of dogs in this study, the probabil-
ity of a passing titer was greatest when taken between 8 and 30 days after vaccination. It is
notable, that though it is commonly thought only an anamnestic response is characterized by a
rapid, robust immune response, a large proportion of rabies vaccine-naïve dogs demonstrated
just the same rapid rise in titer within seven days; 61% with a documented serological response
above 0.5 IU/ml. The majority of dogs failed to reach an adequate titer within the first 3 days
of primary vaccination, and failure rates increased if the draw interval was greater than 90
days. These findings are consistent with other published literature, and reinforce the ideal tim-
ing that should be considered for blood draws when they are taken for documentation of a
titer>0.5 IU/ml.
When a dog fails a titer check, owners have two options: 1) booster the dog and re-check
the titer or 2) wait for the immune system to produce more antibody and re-check the titer at a
later date. Booster vaccination comes at an added expense and exposes the dog to potentially
unnecessary vaccine biologics that hold a small risk of adverse reaction. This study shows that
three-quarters of dogs will pass a titer response simply by increasing the draw interval, in the
Primary rabies vaccination failure in young dogs
PLOS Neglected Tropical Diseases | https://doi.org/10.1371/journal.pntd.0005761 July 31, 2017 12 / 14
absence of a booster dose. However, the highest probability of achieving an adequate immune
response after a failure is a booster vaccine dose. Owners should consider the cost of repeat
vaccination, time constraints, and potential (low risk) for an adverse reaction when deciding
how to respond to a dog that has failed primary vaccination. This study provides some quanti-
tative values for which these decisions can be based.
In today’s interconnected world, people and their pets can now traverse continents in a
matter of hours. While this progress has eased international trade and communications, a
pathway for infectious diseases to travel rapidly across vast distances has emerged. Countries
that have undergone the financial and physical responsibility to eliminate canine rabies virus
have financial and health incentives to protect that status. Thus, most canine rabies-free coun-
tries require evidence of vaccination for dogs entering their country. Findings here support
previous studies, with a larger dataset, that the majority of U.S. dogs will respond favorably to
primary vaccination and the appropriate time to draw a titer is 8–30 days after vaccination. A
dose-response effect was noted in this analysis, and may suggest that higher doses of vaccine
may be necessary for larger breed dogs to decrease the risk of vaccine failure. In the event of a
failure, most dogs will achieve an adequate serologic response if the draw interval is extended
(even in the absence of booster vaccination). However, booster vaccination after failure is the
best way to ensure an animal passes a repeat titer test. Several variables analyzed in this study
show strong correlation with the GMT and failure rates; development of predictive tools for
veterinarians may help tailor vaccination and titer recommendations to help improve failure
rates and reduce costs for dog owners.
Supporting information
S1 Dataset. A listing of all dog serum samples included in the analysis described in the
paper with the following associated information per sample. Case number, name, breed
abbreviation (breed1), breed (breed2), unique ID, Blood draw date (DRAWdate), gender
(M = male, F = female), id, date of birth (DOB), rabies vaccination date (vax1date), dog size,
FAN result in IU/mL) (TITER), PASS/FAIL (1 = Pass,�0.5 IU/mL; 0 = Fail, <0.5 IU/mL),
consecutive number order of the sample in the dataset (#order original).
(XLSX)
Author Contributions
Conceptualization: Ryan M. Wallace, Anna Pees, Susan M. Moore.
Data curation: Ryan M. Wallace, Anna Pees, Susan M. Moore.
Formal analysis: Ryan M. Wallace, Anna Pees, Jesse B. Blanton.
Investigation: Anna Pees, Susan M. Moore.
Methodology: Ryan M. Wallace, Jesse B. Blanton.
Project administration: Susan M. Moore.
Resources: Ryan M. Wallace, Susan M. Moore.
Supervision: Ryan M. Wallace, Susan M. Moore.
Visualization: Ryan M. Wallace.
Writing – original draft: Ryan M. Wallace, Anna Pees.
Writing – review & editing: Ryan M. Wallace, Anna Pees, Jesse B. Blanton, Susan M. Moore.
Primary rabies vaccination failure in young dogs
PLOS Neglected Tropical Diseases | https://doi.org/10.1371/journal.pntd.0005761 July 31, 2017 13 / 14
References1. Organization WH. WHO Expert Consultation Rabies. TRS 982 ed. Geneva: World Health Organization;
2012.
2. Brown CM, Slavinski S, Ettestad P, Sidwa TJ, Sorhage FE. Compendium of Animal Rabies Prevention
and Control, 2016. J Am Vet Med Assoc. 2016; 248(5):505–17. https://doi.org/10.2460/javma.248.5.
505 PMID: 26885593
3. Industries NZGMfP. Import Health Standard. Cats and Dogs. Wellington, New Zealand: Ministry for
Primary Industries; 2014. p. 1–19.
4. Sinclair JR, Washburn F, Fox S, Lankau EW. Dogs Entering the United States from Rabies-Endemic
Countries, 2011–2012. Zoonoses Public Health. 2015; 62(5):393–400. Epub 2014/09/23. https://doi.
org/10.1111/zph.12160 PMID: 25244531.
5. Sinclair JR, Wallace RM, Gruszynski K, Freeman MB, Campbell C, Semple S, et al. Rabies in a Dog
Imported from Egypt with a Falsified Rabies Vaccination Certificate—Virginia, 2015. MMWR Morb Mor-
tal Wkly Rep. 2015; 64(49):1359–62. PMID: 26678293
6. Klevar S, Hogasen HR, Davidson RK, Hamnes IS, Treiberg BL, Lund A. Cross-border transport of res-
cue dogs may spread rabies in Europe. Vet Rec. 2015; 176(26):672. https://doi.org/10.1136/vr.102909
PMID: 26113337
7. Fooks A, Horton D, Muller T, Freuling C, Rupprecht C. Rabies. Manual of Diagnostic Tests and Vac-
cines for Terrestrial Animals (mammals, birds, bees). 7th ed. Paris: Office International Des Epizoo-
ties; 2012. p. 263–82.
8. Moore SM, Hanlon CA. Rabies-specific antibodies: measuring surrogates of protection against a fatal
disease. PLoS Negl Trop Dis. 2010; 4(3):e595. https://doi.org/10.1371/journal.pntd.0000595 PMID:
20231877
9. Aubert MF. Practical significance of rabies antibodies in cats and dogs. Rev Sci Tech. 1992; 11(3):735–
60. PMID: 1472723
10. Cliquet F, Verdier Y, Sagne L, Aubert M, Schereffer JL, Selve M, et al. Neutralising antibody titration in
25,000 sera of dogs and cats vaccinated against rabies in France, in the framework of the new regula-
tions that offer an alternative to quarantine. Rev Sci Tech. 2003; 22(3):857–66. PMID: 15005543
11. Kennedy LJ, Lunt M, Barnes A, McElhinney L, Fooks AR, Baxter DN, et al. Factors influencing the anti-
body response of dogs vaccinated against rabies. Vaccine. 2007; 25(51):8500–7. https://doi.org/10.
1016/j.vaccine.2007.10.015 PMID: 18006120
12. Jakel V, Konig M, Cussler K, Hanschmann K, Thiel HJ. Factors influencing the antibody response to
vaccination against rabies. Dev Biol (Basel). 2008; 131:431–7.
13. Cliquet F, Aubert M, Sagne L. Development of a fluorescent antibody virus neutralisation test (FAVN
test) for the quantitation of rabies-neutralising antibody. J Immunol Methods. 1998; 212(1):79–87.
PMID: 9671155
14. Thiermann AB. International standards: the World Organisation for Animal Health Terrestrial Animal
Health Code. Scientific and Technical Review. 2015; 34(1):277–81. PMID: 26470463
15. Pollock RV, Carmichael LE. Maternally derived immunity to canine parvovirus infection: transfer,
decline, and interference with vaccination. J Am Vet Med Assoc. 1982; 180(1):37–42. Epub 1982/01/
01. PMID: 7056660.
16. Nishiura H, Mizumoto K. Epidemiological determinants of successful vaccine development. Int J Med
Sci. 2013; 10(4):382–4. Epub 2013/03/09. https://doi.org/10.7150/ijms.5689 PMID: 23471119.
17. Monroe BP, Yager P, Blanton J, Birhane MG, Wadhwa A, Orciari L, et al. Rabies surveillance in the
United States during 2014. J Am Vet Med Assoc. 2016; 248(7):777–88. Epub 2016/03/24. https://doi.
org/10.2460/javma.248.7.777 PMID: 27003019.
18. Milne KL, Hayes HM Jr.. Epidemiologic features of canine hypothyroidism. Cornell Vet. 1981; 71(1):3–
14. Epub 1981/01/01. PMID: 7226844.
19. Mori N, Lee P, Muranaka S, Sagara F, Takemitsu H, Nishiyama Y, et al. Predisposition for primary hyper-
lipidemia in Miniature Schnauzers and Shetland sheepdogs as compared to other canine breeds. Res Vet
Sci. 2010; 88(3):394–9. Epub 2010/01/12. https://doi.org/10.1016/j.rvsc.2009.12.003 PMID: 20060988.
20. Hermann J, Fry A, Reising M, Patterson P, Siev D, Gatewood D. Rabies vaccine standards: comparison
of the 5th and 6th WHO international reference standards to the USDA veterinary reference standard.
Vaccine. 2012; 30(48):6892–6. https://doi.org/10.1016/j.vaccine.2012.09.002 PMID: 22981761
21. Beran J, Honegr K, Banzhoff A, Malerczyk C. Potency requirements of rabies vaccines administered
intradermally using the Thai Red Cross regimen: investigation of the immunogenicity of serially diluted
purified chick embryo cell rabies vaccine. Vaccine. 2005; 23(30):3902–7. https://doi.org/10.1016/j.
vaccine.2005.03.007 PMID: 15917111.
Primary rabies vaccination failure in young dogs
PLOS Neglected Tropical Diseases | https://doi.org/10.1371/journal.pntd.0005761 July 31, 2017 14 / 14