risky banks and macro-prudential policy for emerging economies
TRANSCRIPT

Risky Banks and Macro-Prudential Policy forEmerging Economies
Gabriel Cuadra Victoria Nuguer
Bank of Mexico
Inter-American Development Bank1
XV Meeting of Monetary Policy Managers CEMLA
Republica Dominicana - September 27, 2019
1The views expressed herein are those of the authors and do not necessarily reflectthose of Bank of Mexico, the Inter-American Development Bank, or their boardmembers or managers.
Cuadra and Nuguer (Banco de Mexico) - Risky Banks and Macro-Prudential Policy for Emerging Economies

Motivation
Degree of interconnectedness among financial institutions ↑ ⇒ exposure ofEMEs to AE financial shocks ↑, global banks played a key role
Portfolio capital flows and cross-border banking flows (non-core
liabilities) create challenges for EMEs financial stability
volatile, short-term, and pro-cyclical
important channel of international transmission of foreign shocks
What can EMEs do to mitigate the effects of volatile portfolio capitalflows and cross-border banking flows, i.e. non-core liabilities? Implementmacro-prudential measures
Cuadra and Nuguer (Banco de Mexico) - Risky Banks and Macro-Prudential Policy for Emerging Economies

This paperDo cross-border banking flows play a role on propagating AE
financial shocks to EMEs?
What are the financial stability consequences in EMEs?
What can EMEs do to mitigate these effects?
1 Empirical Evidence + new VAR evidence on the transmission offinancial shocks from the U.S. to Mexico and Turkey (risky banks)
2 Two-country DSGE model
I financial intermediaries face an endogenous credit constraint a laGertler and Kiyotaki, 2010
I banks in the AE lend to banks in the EME, cross-border bankingflows or non-core liabilties
I banks in the EME might be constrained on how much they borrowfrom the AE, risky EME banks
3 Macro-prudential policy in the EME to mitigate the effects of thevolatility of banks’ non-core liabilities, a la Korea
Cuadra and Nuguer (Banco de Mexico) - Risky Banks and Macro-Prudential Policy for Emerging Economies

Results
1 VAR, a negative quality of capital shock in the U.S. prompts anegative impact in the EME
I loans from U.S. banks to EME ↓I financial instability in the EME, credit ↓, GDP ↓I asset price co-movement across countriesI when EME banks are risky for U.S. banks, macro variables fall more in
the EME
2 Model replicates the facts from the VAR and matches the impulseresponse functions
3 Macro-prudential policy in the EME by ↓ the volatility of cross-borderbanking flows
I ↓ sources of financial instabilityI EME consumers are better off
Cuadra and Nuguer (Banco de Mexico) - Risky Banks and Macro-Prudential Policy for Emerging Economies

Mechanism
tightening of borrowing constraint
↓ net worth ↓ credit↓ quality of K
↓ asset price
↓ investment
↓ output↓ global lending
↓ net worth ↓ credit
↓ asset price↓ investment↓ output
Risky Banks: ↓↓ global lending ⇒ ↓↓ credit
U.S. (AE)
EME
Cuadra and Nuguer (Banco de Mexico) - Risky Banks and Macro-Prudential Policy for Emerging Economies

Empirical Evidence
In the last few years, cross-border banking flows have been very volatile
financial crisis ⇒ ↓ of how much the U.S. lent to EMEs
UMP, ZLB interest rate ⇒ ↑ of capital flows to EMEs
normalization of MP ⇒ a new reverse of the capital flows?
Non-core liabilities have been financing the increase in credit with respectto deposits in EMEs (Lane and McQuade, 2014)
How much are cross-border banking flows with respect to households’deposits for Turkish and for Mexican commercial banks?
Turkey: 6.5%
Mexico: 1.9%
⇒ not big numbers but they can create lots of noise in the EME
Cuadra and Nuguer (Banco de Mexico) - Risky Banks and Macro-Prudential Policy for Emerging Economies

Empirical Evidence Foreign Claims of U.S. ReportingBanks
2002 2004 2006 2008 2010 2012 20140
0.5
1
1.5
2
2.5
3TrillionU.S.Dollar
2002 2004 2006 2008 2010 2012 20140
20
40
60
80
100
120
140
BillionU.S.Dollar
Offshore centersDeveloping countries
Developed countries
Mexico (right axis)
Turkey (right axis)
Korea (right axis)
Source: BIS Consolidated Bank Statistics, Immediate Borrower Basis
Cuadra and Nuguer (Banco de Mexico) - Risky Banks and Macro-Prudential Policy for Emerging Economies

Empirical Evidence
In the last few years, cross-border banking flows have been very volatile
financial crisis ⇒ ↓ of how much the U.S. lent to EMEs
UMP, ZLB interest rate ⇒ ↑ of capital flows to EMEs
normalization of MP ⇒ a new reverse of the capital flows
Non-core liabilities have been financing the increase in credit with respectto deposits in EMEs (Lane and McQuade, 2014)
How much are cross-border banking flows with respect to households’deposits for Turkish and for Mexican commercial banks? Graph
Turkey: 6.5%
Mexico: 1.9%
⇒ not big numbers but they can create lots of noise in the EME
Cuadra and Nuguer (Banco de Mexico) - Risky Banks and Macro-Prudential Policy for Emerging Economies

Empirical Evidence Credit to Deposits Ratio
1994 1996 1998 2000 2002 2004 2006 2008 2010 2012 2014
40
60
80
100
120
140
160Percent
Mexico Turkey Korea
Source: Fred, Federal Reserve Bank of St. Louis
Cuadra and Nuguer (Banco de Mexico) - Risky Banks and Macro-Prudential Policy for Emerging Economies

Empirical Evidence
In the last few years, cross-border banking flows have been very volatile
financial crisis ⇒ ↓ of how much the U.S. lent to EMEs
UMP, ZLB interest rate ⇒ ↑ of capital flows to EMEs
normalization of MP ⇒ a new reverse of the capital flows
Non-core liabilities have been financing the increase in credit with respectto deposits in EMEs (Lane and McQuade, 2014)
How much are cross-border banking flows with respect to households’deposits for Turkish and for Mexican commercial banks? Graph
Turkey: 6.5%
Mexico: 1.9%
⇒ not big numbers but they can create a lot of noise in the EME
Cuadra and Nuguer (Banco de Mexico) - Risky Banks and Macro-Prudential Policy for Emerging Economies

Empirical Evidence VAR for Mexico
0 10
-0.05
0
0.05
0.1
0.15
U.S. Net Charge-Offs
0 10
-0.04
-0.03
-0.02
-0.01
0
0.01
S&P 500
0 10
-20
-15
-10
-5
0
5
×10-3Foreign Claims on U.S. Banks
0 10
-4
-2
0
2
×10-3EME GDP
0 10
-15
-10
-5
0
5
×10-3EME Dom. Bank Credit
0 10
-5
0
5
10
15×10
-3EME Exchange Rate
0 10
-0.04
-0.03
-0.02
-0.01
0
0.01
EME Stock Mkt Index
Mexico
Note: Impulse Responses to Cholesky One-Std-Dev. Innovation to NCO on U.S. CommercialBanks. Mexican VAR estimated from 2002Q1 to 2015Q1. The shaded areas represent onestandard confidence intervals and the lines represent the mean. The vertical axis shows thepercent deviation from the trend, while the horizontal axis corresponds to quarters.
Cuadra and Nuguer (Banco de Mexico) - Risky Banks and Macro-Prudential Policy for Emerging Economies

Empirical Evidence VAR for Mexico and Turkey
0 10
0
0.05
0.1
0.15
U.S. Net Charge-Offs
0 10
-0.03
-0.02
-0.01
0
S&P 500
0 10
-0.06
-0.04
-0.02
0
Foreign Claims on U.S. Banks
0 10
-10
-8
-6
-4
-2
0
×10-3EME GDP
0 10
-0.02
-0.01
0
EME Dom. Bank Credit
0 10
-5
0
5
10
15
20×10
-3EME Exchange Rate
0 10
-0.05
-0.04
-0.03
-0.02
-0.01
0
EME Stock Mkt Index
Turkey
Mexico
Note: Impulse Responses to Cholesky One-Std-Dev. Innovation to NCO on U.S. CommercialBanks. Mexican VAR estimated from 2002Q1 to 2015Q1. Turkish VAR estimated from 2000Q2to 2015Q1. The shaded areas represent one standard confidence intervals for Turkey and thelines represent the mean. The vertical axis shows the percent deviation from the trend, while thehorizontal axis corresponds to quarters.
Cuadra and Nuguer (Banco de Mexico) - Risky Banks and Macro-Prudential Policy for Emerging Economies

Empirical Evidence VAR Results
The VAR evidence shows
1 An ↑ in the U.S. net charge-offs
I ↓ in the price of capital
I ↓ in bank lending to the EME
I financial instability in the EME, ↓ in credit and in GDP
2 Asset price co-movement across countries
3 When EME banks are risky for U.S. banks, credit and GDP fall more
in the EME
⇒ We build a model that replicates these facts from the VAR
A model without global banks cannot replicate the VAR evidence
Global banks explain the mechanism
I safe vs. risky banks
Cuadra and Nuguer (Banco de Mexico) - Risky Banks and Macro-Prudential Policy for Emerging Economies
The Model
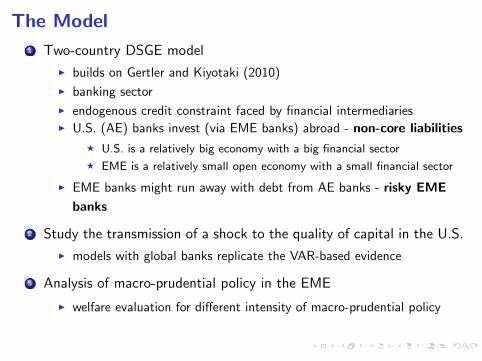
1 Two-country DSGE model
I builds on Gertler and Kiyotaki (2010)
I banking sector
I endogenous credit constraint faced by financial intermediariesI U.S. (AE) banks invest (via EME banks) abroad - non-core liabilities
F U.S. is a relatively big economy with a big financial sector
F EME is a relatively small open economy with a small financial sector
I EME banks might run away with debt from AE banks - risky EME
banks
2 Study the transmission of a shock to the quality of capital in the U.S.
I models with global banks replicate the VAR-based evidence
3 Analysis of macro-prudential policy in the EME
I welfare evaluation for different intensity of macro-prudential policy
Cuadra and Nuguer (Banco de Mexico) - Risky Banks and Macro-Prudential Policy for Emerging Economies

The Model 2-country DSGE
Households
Banks
Non-financial firms
Banks*
Non-financial firms*
Households*
U.S. (AE)
EME
CB*
deposits loans
cross-border banking flows
loans
deposits
levy
Cuadra and Nuguer (Banco de Mexico) - Risky Banks and Macro-Prudential Policy for Emerging Economies

AE Banks Financial FrictionsGertler and Kiyotaki (2010) with international flows
raise deposits from AE households, dt
lend
I to AE non-financial firms, stI to EME banks, bt
Assets Liabilities
Qtst dt
Qbtbt nt
Incentive compatibility constraint
Vt(st , bt , dt) ≥ θ (Qtst + Qbtbt)
Aggregate net worth of AE banks
Nt = (ξ + σ) Rk,tQt−1St−1Ψt + Rb,tQb,t−1Bt−1 − σRtDt−1
At the end of the period t − 1 the value of the banks satisfies
V (st−1, bt−1, dt−1) = Et−1Λt−1,t
(1− σ)nt + σ
[maxst ,bt ,dt
V (st , bt , dt)
]Problem of AE banks
Cuadra and Nuguer (Banco de Mexico) - Risky Banks and Macro-Prudential Policy for Emerging Economies

EME Banks Financial Frictions
raise funds from
I EME households, d∗tI AE banks, b∗t
make loans to EME non-financial firms, s∗t
Assets Liabilities
Q∗t s∗t d∗t
Q∗btb∗t
n∗t
Incentive compatibility constraint
ω = 1, safe EME banks
Vt(s∗t , b∗t , d∗t ) ≥ θ∗(Q∗t s∗t − Q∗btb
∗t )
0 < ω < 1, risky EME banks
Vt(s∗t , b∗t , d∗t ) ≥ θ∗(Q∗t s∗t − ωQ∗btb∗t )
Aggregate net worth of EME banks
N∗t = (σ∗ + ξ∗)[Z ∗t + (1− δ)Q∗t ]S∗t−1 − σ∗(R∗t D∗t−1 + R∗btQ∗b,t−1B
∗t−1)
Problem of EME banks
Cuadra and Nuguer (Banco de Mexico) - Risky Banks and Macro-Prudential Policy for Emerging Economies

Risky EME Banks
The parameter ω introduces a level of riskiness in the EME’ cross-borderbanking flows. EME banks can run away with a fraction θ∗(1− ω) ofinternational flows. ⇒ risky EME banks
For ω = 1
EtΛ∗t,t+1Ω∗t+1R
∗kt+1 = EtΛ
∗t,t+1Ω∗t+1R
∗bt+1 > EtΛ
∗t,t+1Ω∗t+1R
∗t+1
For 0 < ω < 1
EtΛ∗t,t+1Ω∗t+1R
∗kt+1 > EtΛ
∗t,t+1Ω∗t+1R
∗bt+1 > EtΛ
∗t,t+1Ω∗t+1R
∗t+1
When EME banks can run away with a fraction of cross-border bankingflows, EME banks are more exposed to events in the AE.
Cuadra and Nuguer (Banco de Mexico) - Risky Banks and Macro-Prudential Policy for Emerging Economies

Experiments and Evaluation of the Model
1 Calibration and steady state comparison
2 Response of the model to a quality of capital shock in the AEI Model with safe global banks ω = 1
F transmission across countries with asset price co-movement
F cross-border banking flows fall
F collapse of EME’s credit, financial instability
I Safe vs. risky EME banks 0 < ω < 1
F cross-border banking flows fall more
F deeper transmission of the financial instability
3 VAR-base evidence vs. model simulation
I Relevance of modeling global banks
I Difference between safe and risky banks
4 Macro-prudential policy carried out by the EME authority
Cuadra and Nuguer (Banco de Mexico) - Risky Banks and Macro-Prudential Policy for Emerging Economies
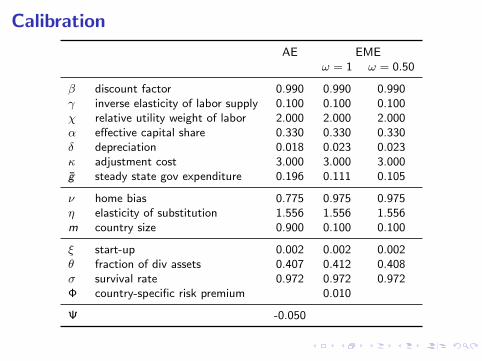
Calibration
AE EMEω = 1 ω = 0.50
β discount factor 0.990 0.990 0.990γ inverse elasticity of labor supply 0.100 0.100 0.100χ relative utility weight of labor 2.000 2.000 2.000α effective capital share 0.330 0.330 0.330δ depreciation 0.018 0.023 0.023κ adjustment cost 3.000 3.000 3.000g steady state gov expenditure 0.196 0.111 0.105
ν home bias 0.775 0.975 0.975η elasticity of substitution 1.556 1.556 1.556m country size 0.900 0.100 0.100
ξ start-up 0.002 0.002 0.002θ fraction of div assets 0.407 0.412 0.408σ survival rate 0.972 0.972 0.972Φ country-specific risk premium 0.010
Ψ -0.050
Cuadra and Nuguer (Banco de Mexico) - Risky Banks and Macro-Prudential Policy for Emerging Economies

Calibration
Table: Deterministic Steady State, Model and Data
Safe EME Banks ω = 1 Risky EME Banks ω = 0.5
Model Data CI 2sd Model Data CI 2sd
Advanced Economy: United StatesConsumption/GDP 0.6115 0.6753 0.6820 0.6728 0.6753 0.6820Investment/GDP 0.1924 0.1558 0.1774 0.1980 0.1558 0.1774Government spending /GDP 0.1961 0.1909 0.2013 0.1961 0.1909 0.2013
Emerging Market Economy: Mexico TurkeyConsumption/GDP 0.6771 0.6576 0.6682 0.6817 0.6782 0.6969Investment/GDP 0.2120 0.2083 0.2193 0.2128 0.2158 0.2453Government spending /GDP 0.1109 0.1094 0.1124 0.1055 0.1022 0.1087Exports/GDP 0.2465 0.2749 0.3008 0.2479 0.2436 0.2570Imports/GDP 0.2301 0.2722 0.3025 0.2339 0.2573 0.2852Cross-border bnk fl/Deposits 0.0196 0.0105 0.0273 0.0670 0.0082 0.0793
Source: own calculations with data from FRED 2002Q1 - 2014Q4. For Mexico, the cross-borderbank flows to deposits ratio is the ratio between deposits from financial institutions from abroadand deposits from households for the period 2004Q2-2015Q2, CF445, Bank of Mexico. ForTurkey, it is the ratio between total deposits from financial foreign institutions and total depositsfrom households in TRY for the same time period, Central Bank of Turkey.
Cuadra and Nuguer (Banco de Mexico) - Risky Banks and Macro-Prudential Policy for Emerging Economies

IRF to a Neg. Quality of K Shock - Global Banks
0 10 20 30
-5
-4
-3
AE Capital K
Global Banks ω = 1
0 10 20 30
-2
-1
0
AE Asset Price Q
0 10 20 30
-30
-20
-10
AE Net Worth N
0 10 20 30
-1
-0.5
0
AE Investment I
0 10 20 30
-1.6
-1.4
-1.2
AE Consumption C
0 10 20 30
0.1
0.2
0.3
0.4
AE Premium E(Rk)−R
0 10 20 30
-2.5
-2
-1.5
-1
-0.5
EME Terms of Trade
0 10 20 30
-6
-4
-2
Global Asset B∗
0 10 20 30
-2
-1
0
Global Asset Price Q∗
b
0 10 20 30
-8
-6
-4
-2
0
EME Net Worth N ∗
0 10 20 30
-0.4
-0.2
0
EME Capital K∗
0 10 20 30
-2
-1
0
EME Asset Price Q∗
0 10 20 30
-0.8
-0.6
-0.4
-0.2
EME Investment I∗
0 10 20 30
-1
-0.5
0
EME Consumption C∗
0 10 20 30
0
0.1
0.2
0.3
EME Premium E(R∗
k)−R∗
Cuadra and Nuguer (Banco de Mexico) - Risky Banks and Macro-Prudential Policy for Emerging Economies

IRF to a Neg. Quality of K Shock - Risky Banks
0 10 20 30
-5
-4
-3
AE Capital K
Global Banks ω < 1
Global Banks ω = 1
0 10 20 30
-2
-1
0
AE Asset Price Q
0 10 20 30
-30
-20
-10
AE Net Worth N
0 10 20 30
-1
-0.5
0
AE Investment I
0 10 20 30
-1.6
-1.4
-1.2
AE Consumption C
0 10 20 30
0.1
0.2
0.3
0.4
AE Premium E(Rk)−R
0 10 20 30
-3
-2
-1
EME Terms of Trade
0 10 20 30
-15
-10
-5
Global Asset B∗
0 10 20 30
-2
-1
0
Global Asset Price Q∗
b
0 10 20 30
-10
-5
0
EME Net Worth N ∗
0 10 20 30
-0.4
-0.2
0
EME Capital K∗
0 10 20 30
-2
-1
0
EME Asset Price Q∗
0 10 20 30
-0.8
-0.6
-0.4
-0.2
EME Investment I∗
0 10 20 30
-1
-0.5
0
EME Consumption C∗
0 10 20 30
0
0.2
0.4
EME Premium E(R∗
k)−R∗
Cuadra and Nuguer (Banco de Mexico) - Risky Banks and Macro-Prudential Policy for Emerging Economies

IRF to a Neg. Quality of K Shock - No Global Banks
0 10 20 30
-5
-4
-3
AE Capital K
Global Banks ω < 1
Global Banks ω = 1
Financial Autarky
0 10 20 30
-3
-2
-1
0
AE Asset Price Q
0 10 20 30
-30
-20
-10
AE Net Worth N
0 10 20 30
-1
-0.5
0
AE Investment I
0 10 20 30
-1.6
-1.4
-1.2
AE Consumption C
0 10 20 30
0.2
0.4
0.6
AE Premium E(Rk)−R
0 10 20 30
-3
-2
-1
EME Terms of Trade
0 10 20 30
-15
-10
-5
0
Global Asset B∗
0 10 20 30
-2
-1
0
Global Asset Price Q∗
b
0 10 20 30
-10
-5
0
EME Net Worth N ∗
0 10 20 30
-0.4
-0.2
0
EME Capital K∗
0 10 20 30
-2
-1
0
EME Asset Price Q∗
0 10 20 30
-0.8
-0.6
-0.4
-0.2
EME Investment I∗
0 10 20 30
-1
-0.5
0
EME Consumption C∗
0 10 20 30
0
0.2
0.4
EME Premium E(R∗
k)−R∗
Cuadra and Nuguer (Banco de Mexico) - Risky Banks and Macro-Prudential Policy for Emerging Economies

IRF to a Neg. Quality of K Shock in the AE
1 Model with safe global banks ω = 1
I transmission across countries with asset price co-movement
I cross-border banking flows fall
I collapse of EME’s credit, financial instability
I global financial crisis
2 Safe vs. risky EME banks 0 < ω < 1
I cross-border banking flows fall more
I deeper transmission of the financial crisis
Cuadra and Nuguer (Banco de Mexico) - Risky Banks and Macro-Prudential Policy for Emerging Economies

VAR Evidence vs. the Model Mexico
0 5 10 15−5
0
5
10
15
U.S. Net Charge-Offs
0 5 10 15
−4
−3
−2
−1
0
1
S&P 500
0 5 10 15
−2
−1.5
−1
−0.5
0
0.5
Foreign Claims on U.S. Banks
0 5 10 15
−0.4
−0.2
0
0.2
EME GDP
0 5 10 15
−1.5
−1
−0.5
0
0.5
EME Dom. Bank Credit
0 5 10 15
−0.5
0
0.5
1
1.5
EME Exchange Rate
0 5 10 15
−4
−3
−2
−1
0
1
EME Stock Mkt Index
Data: VAR for Mexico
Note: Impulse Responses to Cholesky One-Std-Dev. Innovation to NCO on U.S. CommercialBanks. Mexican VAR estimated from 2002Q1 to 2015Q1. The shaded areas represent onestandard confidence intervals and the lines represent the mean. The vertical axis shows thepercent deviation from the trend, while the horizontal axis corresponds to quarters.
Cuadra and Nuguer (Banco de Mexico) - Risky Banks and Macro-Prudential Policy for Emerging Economies

VAR Evidence vs. the Model Mexico
0 5 10 15
0
10
U.S. Net Charge-Offs
0 5 10 15
0
1
0 5 10 15
−4
−3
−2
−1
0
1
S&P 500
0 5 10 15
−2
−1.5
−1
−0.5
0
0.5
Foreign Claims on U.S. Banks
0 5 10 15
−0.4
−0.2
0
0.2
EME GDP
0 5 10 15
−1.5
−1
−0.5
0
0.5
EME Dom. Bank Credit
0 5 10 15
−0.5
0
0.5
1
1.5
EME Exchange Rate
0 5 10 15
−4
−3
−2
−1
0
1
EME Stock Mkt Index
Data: VAR for Mexico Model: Safe Banks ω = 1
Note: Impulse Responses to Cholesky One-Std-Dev. Innovation to NCO on U.S. CommercialBanks. Mexican VAR estimated from 2002Q1 to 2015Q1. The shaded areas represent onestandard confidence intervals and the lines represent the mean. The vertical axis shows thepercent deviation from the trend, while the horizontal axis corresponds to quarters.
Cuadra and Nuguer (Banco de Mexico) - Risky Banks and Macro-Prudential Policy for Emerging Economies

VAR Evidence vs. the Model Mexico
0 5 10 15
0
10
U.S. Net Charge-Offs
0 5 10 15
0
1
0 5 10 15
−4
−3
−2
−1
0
1
S&P 500
0 5 10 15
−2
−1.5
−1
−0.5
0
0.5
Foreign Claims on U.S. Banks
0 5 10 15
−0.4
−0.2
0
0.2
EME GDP
0 5 10 15
−1.5
−1
−0.5
0
0.5
EME Dom. Bank Credit
0 5 10 15
−0.5
0
0.5
1
1.5
EME Exchange Rate
0 5 10 15
−4
−3
−2
−1
0
1
EME Stock Mkt Index
Data: VAR for Mexico Model: Safe Banks ω = 1 Model: No interbank market
Note: Impulse Responses to Cholesky One-Std-Dev. Innovation to NCO on U.S. CommercialBanks. Mexican VAR estimated from 2002Q1 to 2015Q1. The shaded areas represent onestandard confidence intervals and the lines represent the mean. The vertical axis shows thepercent deviation from the trend, while the horizontal axis corresponds to quarters.
Cuadra and Nuguer (Banco de Mexico) - Risky Banks and Macro-Prudential Policy for Emerging Economies

VAR Evidence vs. the Model Turkey
0 5 10 15
0
5
10
15
U.S. Net Charge-Offs
0 5 10 15
-3
-2
-1
0
S&P 500
0 5 10 15
-6
-4
-2
0
Foreign Claims on U.S. Banks
0 5 10 15
-1
-0.8
-0.6
-0.4
-0.2
0
EME GDP
0 5 10 15
-2
-1
0
EME Dom. Bank Credit
0 5 10 15
-0.5
0
0.5
1
1.5
2
EME Exchange Rate
0 5 10 15
-5
-4
-3
-2
-1
0
EME Stock Mkt Index
Data: VAR for Turkey
Note: Impulse Responses to Cholesky One-Std-Dev. Innovation to NCO on U.S. CommercialBanks. Turkish VAR estimated from 2000Q2 to 2015Q1. The shaded areas represent one standardconfidence intervals and the lines represent the mean. The vertical axis shows the percent deviationfrom the trend, while the horizontal axis corresponds to quarters.
Cuadra and Nuguer (Banco de Mexico) - Risky Banks and Macro-Prudential Policy for Emerging Economies

VAR Evidence vs. the Model Turkey
0 5 10 15
0
10
U.S. Net Charge-Offs
0
1
0 5 10 15
-3
-2
-1
0
S&P 500
0 5 10 15
-6
-4
-2
0
Foreign Claims on U.S. Banks
0 5 10 15
-1
-0.8
-0.6
-0.4
-0.2
0
EME GDP
0 5 10 15
-2
-1
0
EME Dom. Bank Credit
0 5 10 15
-0.5
0
0.5
1
1.5
2
EME Exchange Rate
0 5 10 15
-5
-4
-3
-2
-1
0
EME Stock Mkt Index
Data: VAR for Turkey Model: Risky Banks ω < 1
Note: Impulse Responses to Cholesky One-Std-Dev. Innovation to NCO on U.S. CommercialBanks. Turkish VAR estimated from 2000Q2 to 2015Q1. The shaded areas represent one standardconfidence intervals and the lines represent the mean. The vertical axis shows the percent deviationfrom the trend, while the horizontal axis corresponds to quarters.
Cuadra and Nuguer (Banco de Mexico) - Risky Banks and Macro-Prudential Policy for Emerging Economies
VAR Evidence vs. the Model Turkey
0 5 10 15
0
10
U.S. Net Charge-Offs
0
1
0 5 10 15
-3
-2
-1
0
S&P 500
0 5 10 15
-6
-4
-2
0
Foreign Claims on U.S. Banks
0 5 10 15
-1
-0.8
-0.6
-0.4
-0.2
0
EME GDP
0 5 10 15
-2
-1
0
EME Dom. Bank Credit
0 5 10 15
-0.5
0
0.5
1
1.5
2
EME Exchange Rate
0 5 10 15
-5
-4
-3
-2
-1
0
EME Stock Mkt Index
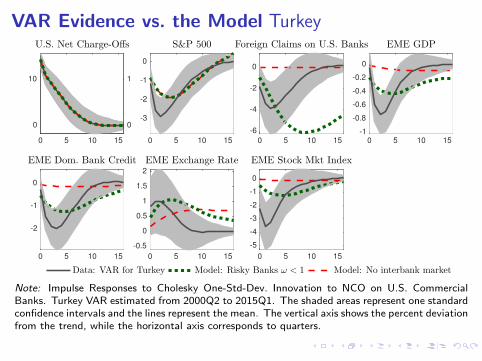
Data: VAR for Turkey Model: Risky Banks ω < 1 Model: No interbank market
Note: Impulse Responses to Cholesky One-Std-Dev. Innovation to NCO on U.S. CommercialBanks. Turkey VAR estimated from 2000Q2 to 2015Q1. The shaded areas represent one standardconfidence intervals and the lines represent the mean. The vertical axis shows the percent deviationfrom the trend, while the horizontal axis corresponds to quarters.
Cuadra and Nuguer (Banco de Mexico) - Risky Banks and Macro-Prudential Policy for Emerging Economies
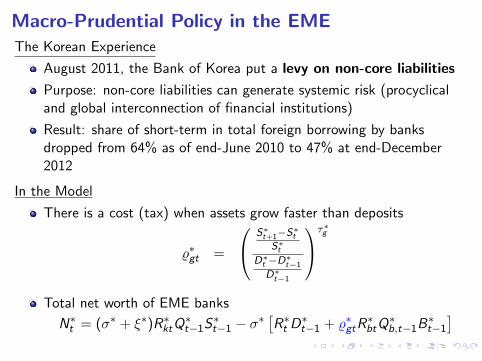
Macro-Prudential Policy in the EMEThe Korean Experience
August 2011, the Bank of Korea put a levy on non-core liabilities
Purpose: non-core liabilities can generate systemic risk (procyclicaland global interconnection of financial institutions)
Result: share of short-term in total foreign borrowing by banksdropped from 64% as of end-June 2010 to 47% at end-December2012
In the Model
There is a cost (tax) when assets grow faster than deposits
%∗gt =
S∗t+1−S∗tS∗t
D∗t −D∗t−1
D∗t−1
τ∗g
Total net worth of EME banks
N∗t = (σ∗ + ξ∗)R∗ktQ∗t−1S
∗t−1 − σ∗
[R∗t D
∗t−1 + %∗gtR
∗btQ
∗b,t−1B
∗t−1
]Cuadra and Nuguer (Banco de Mexico) - Risky Banks and Macro-Prudential Policy for Emerging Economies

IRF to a Neg. Quality of K Shock - Macro-Prudential Pol.
0 10 20 30-5
-4
-3
0 10 20 30
-2
-1
0
0 10 20 30-30
-20
-10
0 10 20 30
-2
-1
0
1
0 10 20 30
-1.6
-1.4
0 10 20 30
0.2
0.4
0 10 20 30
-2
-1.5
-1
-0.5
0 10 20 30
-4
-2
0 10 20 30
-1
-0.5
0
0.5
0 10 20 30
-6
-4
-2
0 10 20 30
-0.5
0
0 10 20 30
-1.5
-1
-0.5
0
0 10 20 30-1.5
-1
-0.5
0 10 20 30
-0.8
-0.6
-0.4
-0.2
0
0 10 20 30
0
0.1
0.2
0.3
0 10 20 30
-0.2
-0.1
0
Cuadra and Nuguer (Banco de Mexico) - Risky Banks and Macro-Prudential Policy for Emerging Economies

Welfare analysis Consumption EquivalentMoments of the second order approximation of the model
Consumption Equivalent: fraction of households’ consumption that would beneeded to equate the welfare under no policy to the welfare under policy;τ∗g = 23.9 and %∗gt = 0.0284%
Welft = U(Ct , Lt) + βEtWelft+1 %∗gt =
(asset growth
deposits growth
)τ∗g
0 5 10 15 20 25 30 35 40
0
0.01
0.02
0.03
0.04
0.05
0.06
0.07
0.08
Cuadra and Nuguer (Banco de Mexico) - Risky Banks and Macro-Prudential Policy for Emerging Economies

Conclusions
1 Do cross-border banking flows (non-core liabilities) play a role
on propagating AE financial shocks to EMEs? Yes!
2 What are the financial stability consequences in EMEs of these
AE shocks?
I prompt instability for EMEs, credit and GDP fall
I specially when EME banks are risky for the AE
I models with global banks match qualitative evidence from the VAR
3 What can EMEs do to mitigate these effects?
I Macro-prudential policy: levy on non-core liabilities, i.e. foreign debt,
cross-border banking flows
I EME shows a smoother reaction with the intervention
I EME households are better off with the policy
Cuadra and Nuguer (Banco de Mexico) - Risky Banks and Macro-Prudential Policy for Emerging Economies


Related LiteratureEmpirical Evidence
Cross-border banking flows channel Cetorelli and Goldberg (2011) and Morais,
Peydro, and Ruiz (2016)
Large capital inflows increase the probability of credit booms Mendoza and
Terrones (2008), Avdjiev, McCauley, and McGuire (2012), and Magud, Reinhart,
and Vesperoni (2014)
Credit growth linked to banks’ net debt flows Lane and McQuade (2014)
Theoretical Analysis
Relevance of non-core liabilities Shin (2010), Shin and Shin (2010)
2-country model with global banks Dedola, Karadi, and Lombardo (2013) and
Nuguer (2016)
This Paper’s Contribution
VAR evidence: EMEs response to a U.S. net charge-off shock, differencebetween safe and risky banks
Theoretical model for EMEs with global banks and the cross-border bankingflow channel and macro-prudential policy
Cuadra and Nuguer (Banco de Mexico) - Risky Banks and Macro-Prudential Policy for Emerging Economies

Empirical Evidence: Funding of Commercial Banks
2005 2006 2007 2008 2009 2010 2011 2012 2013 2014 20150
0.5
1Turkey: Deposit Money Banks Liabilities, Annual
Fra
ctio
n of
Tot
al D
epos
its
2005 2010 20150
1000
2000
Bill
ion
TR
Y
Households (left axis)
Foreign Agents (left axis)
Total Deposits (right axis)
Loans to the Private NF Sector (right axis)
2005 2006 2007 2008 2009 2010 2011 2012 2013 2014 20150
0.5
1Mexico: Deposit Money Banks Liabilities, Annual
Fra
ctio
n of
Tot
al D
epos
its2005 2010 2015
0
5000
10000
Bill
ion
MX
N
Source: Turkish Central Bank and Bank of Mexico.
Go back
Cuadra and Nuguer (Banco de Mexico) - Risky Banks and Macro-Prudential Policy for Emerging Economies

Empirical Evidence: Funding of Non-Financial Firms
1998 2000 2002 2004 2006 2008 2010 2012 20140
0.5
1Mexico: Non-Financial Private Firms Liabilities
Fra
ctio
n of
Tot
al L
oans
1998 2000 2002 2004 2006 2008 2010 2012 20140
2000
4000
Bill
ion
MX
N
Ohter Domestic Loans (left axis)
Domestic Bank Loans (left axis)
Direct Foreign Credit (left axis)
Total Loans (right axis)
Source: Bank of Mexico.
Go back
Cuadra and Nuguer (Banco de Mexico) - Risky Banks and Macro-Prudential Policy for Emerging Economies

Households
Each household consists of a continuum of members
1 Worker
I supplies labor
2 Banker
I with prob. σ continues being a banker
I with prob. 1− σ exits the banking business
Perfect consumption insurance within the household.Problem
maxCt ,Lt ,Dt E0∑∞
t=0 βt[
lnCt − χ1+γL
1+γt
]s.t. Ct + Dt = WtLt + Πt + RtDt−1 + Tt
Cuadra and Nuguer (Banco de Mexico) - Risky Banks and Macro-Prudential Policy for Emerging Economies

Non-Financial Firms
1 Good producers
Xt = AtKαt L
1−αt = XH
t + X ∗Ht1−m
m
In order to finance new investment, they sell state-contingent claims,St , to banks.
St = It + (1− δ)Kt
Kt+1 = StΨt+1
Firms
2 Capital good producersThey choose investment to maximize profit
Qt = 1 + f
(ItIt−1
)+
ItIt−1
f ′(
ItIt−1
)− EtΛt,t+1
[It+1
It
]2
f ′(It+1
It
)Adj Costs
Cuadra and Nuguer (Banco de Mexico) - Risky Banks and Macro-Prudential Policy for Emerging Economies

Equilibrium
Resource constraint
Yt =
[ν
1ηX
H η−1η
t + (1− ν)1ηX
F η−1η
t
] ηη−1
Yt = Ct +[1 + f
( ItIt−1
)]It + Gt
Current Account
CAt = Qb,tBt − RbtQb,t−1Bt−1 = X ∗Ht1−m
m
PHt
Pt− X F
t τtPHt
Pt
Cuadra and Nuguer (Banco de Mexico) - Risky Banks and Macro-Prudential Policy for Emerging Economies

Benchmark: The RBC Model in Financial AutarkyAdvanced Economy (AE)
E0
∑∞t=0 βt
[lnCt −
χ
1 + γL1+γt
]Xt = AtK
αt L
1−αt = XH
t + X ∗Ht
1−m
m
Yt =
[ν
1η X
H η−1η
t + (1− ν)1η X
F η−1η
t
] ηη−1
Yt = Ct +[1 + f
( ItIt−1
)]It + Gt
St = It + (1− δ)Kt
Kt+1 = St Ψt+1︸ ︷︷ ︸quality of capital shock
Financial autarky case: CAt =1−m
mXH∗t − X F
t τt = 0
EME is similar with variables with *.Ψt and Ψ∗t are i.i.d. and mutually independent. We study a shock in Ψt .
Cuadra and Nuguer (Banco de Mexico) - Risky Banks and Macro-Prudential Policy for Emerging Economies

Non-financial firmsNo-cost technology for the final good production, problem:
maxXHt ,X
FtYt =
[ν
1η X
H η−1η
t + (1− ν)1η X
F η−1η
t
] ηη−1
s.t. PtYt ≡ Zt = PHt X
Ht + PF
t XFt
The optimization problem yields
Pt =[ν(PH
t )1−η + (1− ν)(PFt )1−η] 1
1−η .
We can define everything in terms of TOT (τ = PF
PH ),
Pt
PHt
=[ν + (1− ν)τ 1−η
t
] 11−η .
The demands are defined by
XHt = νYt
[PHtPt
]−ηand X F
t = (1− ν)Yt
[PFt
Pt
]−ηLaw of one price + home bias, the real exchange rate is
εt =StP
∗t
Pt=
[ν∗ + (1− ν∗)τ 1−η
t
ν + (1− ν)τ 1−ηt
] 11−η
Go back
Cuadra and Nuguer (Banco de Mexico) - Risky Banks and Macro-Prudential Policy for Emerging Economies
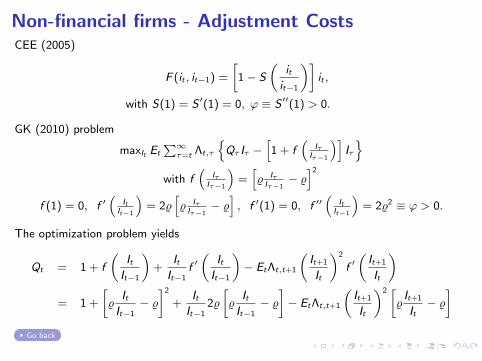
Non-financial firms - Adjustment CostsCEE (2005)
F (it , it−1) =
[1− S
(itit−1
)]it ,
with S(1) = S ′(1) = 0, ϕ ≡ S ′′(1) > 0.
GK (2010) problem
maxIt Et
∑∞τ=t Λt,τ
Qτ Iτ −
[1 + f
(Iτ
Iτ−1
)]Iτ
with f(
IτIτ−1
)=[% IτIτ−1− %]2
f (1) = 0, f ′(
ItIt−1
)= 2%
[% IτIτ−1− %], f ′(1) = 0, f ′′
(It
It−1
)= 2%2 ≡ ϕ > 0.
The optimization problem yields
Qt = 1 + f
(ItIt−1
)+
ItIt−1
f ′(
ItIt−1
)− EtΛt,t+1
(It+1
It
)2
f ′(It+1
It
)= 1 +
[%
ItIt−1− %]2
+ItIt−1
2%
[%
ItIt−1− %]− EtΛt,t+1
(It+1
It
)2 [%It+1
It− %]
Go back
Cuadra and Nuguer (Banco de Mexico) - Risky Banks and Macro-Prudential Policy for Emerging Economies

AE Banks OptimizationBellman equation
V (st , bt , dt) = νstst + νbtbt − νtdt
= EtΛt,t+1
(1− σ) nt+1 + σ
[max
dt+1,st+1,bt+1
V (st+1, bt+1, dt+1)
]The optimization implies
νt = Et [Λt,t+1Ωt+1Rt+1]
µt = Et [Λt,t+1Ωt+1(Rkt+1 − Rt+1)]
φt =νt
θ − µt
µt =νstQt− νt
νstQt
=νbtQbt⇒ EtΛt,t+1Ωt+1Rkt+1 = EtΛt,t+1Ωt+1Rbt+1
where
Ωt+1 = 1− σ + σ(νt+1 + µt+1φt+1)
Rkt+1 = Ψt+1Zt+1 + (1− δ)Qt+1
Qt
Go backCuadra and Nuguer (Banco de Mexico) - Risky Banks and Macro-Prudential Policy for Emerging Economies

EME Banks OptimizationBellman equation
V (s∗t , b∗t , d∗t ) = ν∗sts
∗t − ν∗btb∗t − ν∗t d∗t
= EtΛ∗t,t+1
(1− σ∗)n∗t+1 + σ∗
[max
d∗t+1,s
∗t+1,b
∗t+1
V (s∗t+1, b∗t+1, d
∗t+1)
]The optimization implies
ν∗t = Et [Λ∗t,t+1Ω∗t+1R
∗t+1]
µ∗t = Et [Λ∗t,t+1Ω∗t+1(R∗kt+1 − R∗t+1)] =
ν∗st
Q∗t− ν∗t
φ∗t =ν∗t
θ∗−µ∗t
µ∗bt = Et [Λ∗t,t+1Ω∗t+1(R∗bt+1 − R∗t+1)] =
ν∗bt
Q∗t− ν∗t
φ∗bt =ν∗t
θ∗ω−µ∗bt
ω = 1ν∗st
Q∗t
=ν∗bt
Q∗bt⇒ EtΛ
∗t,t+1Ω∗t+1R
∗kt+1 = EtΛ
∗t,t+1Ω∗t+1R
∗bt+1
ω < 1ν∗st
Q∗t
=[ν∗bt
Q∗bt− (1− ω)νt
]1ω ⇒ µ∗bt = ωµ∗t
whereΩ∗t+1 = 1− σ∗ + σ∗(ν∗t+1 + µ∗t+1φ
∗t+1)
R∗kt+1 = Ψ∗t+1Z∗t+1 + (1− δ∗)Q∗t+1
Q∗tGo back
Cuadra and Nuguer (Banco de Mexico) - Risky Banks and Macro-Prudential Policy for Emerging Economies