river flood risk in jakarta under scenarios of future...
TRANSCRIPT

NHESSD3, 4435–4478, 2015
River flood risk inJakarta under
scenarios of futurechange
Y. Budiyono et al.
Title Page
Abstract Introduction
Conclusions References
Tables Figures
J I
J I
Back Close
Full Screen / Esc
Printer-friendly Version
Interactive Discussion
Discussion
Paper
|D
iscussionP
aper|
Discussion
Paper
|D
iscussionP
aper|
Nat. Hazards Earth Syst. Sci. Discuss., 3, 4435–4478, 2015www.nat-hazards-earth-syst-sci-discuss.net/3/4435/2015/doi:10.5194/nhessd-3-4435-2015© Author(s) 2015. CC Attribution 3.0 License.
This discussion paper is/has been under review for the journal Natural Hazards and EarthSystem Sciences (NHESS). Please refer to the corresponding final paper in NHESS if available.
River flood risk in Jakarta underscenarios of future change
Y. Budiyono1,2, J. C. J. H. Aerts1, D. Tollenaar3, and P. Ward1
1Institute for Environmental Studies (IVM), VU University Amsterdam, Amsterdam,the Netherlands2Agency for the Assessment and Application of Technology (BPPT), Jakarta, Indonesia3Deltares, Delft, the Netherlands
Received: 29 May 2015 – Accepted: 21 June 2015 – Published: 30 July 2015
Correspondence to: Y. Budiyono ([email protected])
Published by Copernicus Publications on behalf of the European Geosciences Union.
4435

NHESSD3, 4435–4478, 2015
River flood risk inJakarta under
scenarios of futurechange
Y. Budiyono et al.
Title Page
Abstract Introduction
Conclusions References
Tables Figures
J I
J I
Back Close
Full Screen / Esc
Printer-friendly Version
Interactive Discussion
Discussion
Paper
|D
iscussionP
aper|
Discussion
Paper
|D
iscussionP
aper|
Abstract
Given the increasing impacts of flooding in Jakarta, methods for assessing current andfuture flood risk are required. In this paper, we use the Damagescanner-Jakarta riskmodel to project changes in future river flood risk under scenarios of climate change,land subsidence, and land use change. We estimate current flood risk at USD 1435
million p.a. Combining all future scenarios, we simulate a median increase in risk of+263 % by 2030. The single driver with the largest contribution to that increase is landsubsidence (+173 %). We simulated the impacts of climate change by combining twoscenario of sea level rise with simulations of changes in 1 day extreme precipitationtotals from 5 Global Climate Models (GCMs) forced by 4 Representative Concentration10
Pathways (RCPs). The results are highly uncertain; the median change in risk due toclimate change alone by 2030 is a decrease by −4 %, but we simulate an increase inrisk under 21 of the 40 GCM-RCP-sea level rise combinations. Hence, we developedprobabilistic risk scenarios to account for this uncertainty. Finally, we discuss therelevance of the results for flood risk management in Jakarta.15
1 Introduction
Jakarta, the capital city of Indonesia, suffers from regular floods that cause significanteconomic damage. For example, the major floods in 2002, 2007, 2013, and 2014have caused billions of dollars of direct and indirect economic damage (Bappenas,2007; Ward et al., 2013a; Sagala et al., 2013). Whilst flooding in Jakarta is not a new20
problem per se (Noorduyn and Verstappen, 1972), the scale of the flood impacts hasincreased greatly in the last few decades. This increase is related to a large numberof drivers, both physical and socioeconomic. Physical drivers include land subsidence,low drainage or storage capacity in Jakarta’s rivers and canals as a result of beingclogged by waste and sediments eroded from upstream, and possibly climate change.25
Socioeconomic drivers include a rapidly growing population, and land use change
4436

NHESSD3, 4435–4478, 2015
River flood risk inJakarta under
scenarios of futurechange
Y. Budiyono et al.
Title Page
Abstract Introduction
Conclusions References
Tables Figures
J I
J I
Back Close
Full Screen / Esc
Printer-friendly Version
Interactive Discussion
Discussion
Paper
|D
iscussionP
aper|
Discussion
Paper
|D
iscussionP
aper|
causing a growth in economic assets located in potentially flood-prone areas. Extensiveoverviews of the drivers of increasing flood risk can be found elsewhere (e.g. Budiyonoet al., 2014; Caljouw et al., 2005; Steinberg, 2007; Ward et al., 2011b).
As in most parts of the world, flood management in Jakarta has focused on technicalprotection measures, in order to lower the probability of the flood hazard through dikes5
and levees (Texier, 2008). However, given the increasing impacts of flooding, and theimportance of both physical and socioeconomic drivers on risk, recent years have seena shift towards a more flood risk management-based approach in Jakarta (Ward et al.,2013). Hereby, risk is defined as a function of hazard, exposure, and vulnerability,as per the definitions in UNISDR (2011). This can be seen in ongoing and planned10
flood risk management activities, such as the planned Garuda Project (KementerianKoordinator Bidang Perekonomian, 2014), as part of the National Capital IntegratedCoastal Development project, as well as the Jakarta Spatial Plan 2030 (Pemda DKIJakarta, 2012), which specifically mentions the integration of flood control and zoningwith spatial planning measures. Flood risk is also identified in the Law No. 24/2007 as15
well as its description in Government Regulation No. 21/2008. The implementation ofthe latter is documented in the National Action Plan for Disaster Risk Reduction (NAP-DRR) 2010–2012 at country scale by the National Development Planning Agency(Bappenas) and the United Nations Development Programme (UNDP).
The flood risk approach can also be seen in scientific developments related to20
flooding in Jakarta. For example, using global models, Hanson et al. (2011) examinedthe exposure of people and assets to coastal flooding in 136 port cities worldwide,including Jakarta, and using a similar approach, Hallegatte et al. (2013) estimated floodrisk in terms of annual expected damages in those cities. More specifically for Jakarta,Ward et al. (2011b) assessed the potential exposure of assets to coastal flooding in25
Jakarta, but did not carry out a full flood risk analysis.The first city scale quantitative flood risk assessment in Jakarta was that of Budiyono
et al. (2014), who developed a river flood risk assessment model (Damagescanner-Jakarta) to assess current river flood risk in Jakarta. However, when planning
4437

NHESSD3, 4435–4478, 2015
River flood risk inJakarta under
scenarios of futurechange
Y. Budiyono et al.
Title Page
Abstract Introduction
Conclusions References
Tables Figures
J I
J I
Back Close
Full Screen / Esc
Printer-friendly Version
Interactive Discussion
Discussion
Paper
|D
iscussionP
aper|
Discussion
Paper
|D
iscussionP
aper|
adaptation measures and strategies, it is also vital to know how risk will develop in thefuture. Future flood risk in Jakarta is complicated, since it will depend on the interplayof the myriad of physical and socioeconomic drivers of risk. For coastal flooding, theglobal scale studies of Hanson et al. (2011) and Hallegatte et al. (2013) examined thepotential influence of changes in climate, land subsidence, and population growth on5
flood exposure and risk. However, they focus only on coastal flooding, using roughestimates from global models, and not on (future-) river floods.
The aim of this paper, therefore, is to further apply and develop the Damagescanner-Jakarta risk model from Budiyono et al. (2014) to project possible future changes inriver flood risk in Jakarta as a result of climate change, land subsidence, and land use10
change. Using these simulations, we can examine the individual attributions of theserisk drivers to overall changes in flood risk.
2 Method
In this study, we use Damagescanner-Jakarta, a flood risk model for Jakarta developedby Budiyono et al. (2014) in Python. Damagescanner-Jakarta estimates flood risk15
as a function of hazard, exposure, and vulnerability. First, the model is used toestimate the direct economic damage as a result of river floods for different returnperiods (2–100 years). Then, flood risk is calculated in terms of expected annualdamage, by plotting these damages and their associated exceedance probabilitieson an exceedance probability-loss (risk) curve. Expected annual damage is the20
approximation of the trapezoidal area under the risk curve (Meyer et al., 2009).In Budiyono et al. (2014), the model was set up to simulate risk under current
conditions. Here, we further improve the model to simulate future flood risk, by includingprojections of physical and socio-economic change. These are incorporated in themodel by changing the input data representing the three elements of flood risk, as25
presented in the framework of analysis in Fig. 1. In the following sections, the dataused to represent hazard, exposure, and vulnerability are described.
4438

NHESSD3, 4435–4478, 2015
River flood risk inJakarta under
scenarios of futurechange
Y. Budiyono et al.
Title Page
Abstract Introduction
Conclusions References
Tables Figures
J I
J I
Back Close
Full Screen / Esc
Printer-friendly Version
Interactive Discussion
Discussion
Paper
|D
iscussionP
aper|
Discussion
Paper
|D
iscussionP
aper|
2.1 Hazard
In the modelling approach, hazard is represented by inundation maps showing floodextent and depth for different return periods (1, 2, 5, 10, 25, 50 and 100 years).These hazard maps are developed using the SOBEK Hydrology Suite, whichemploys a Sacramento rainfall/runoff and a 1-D/2-D hydraulics model (Deltares,5
2014). For current conditions, the input data and hydraulics schematisation use2012 measurements gathered by the Flood Hazard Mapping (FHM) project and theFlood Management Information System (FMIS) project (Deltares et al., 2012), andprecipitation data from the National Bureau for Meteorology (BMKG).
In this study, we also simulated inundation maps (for each return period) for different10
future scenarios of climate change and land subsidence. To simulate impacts fromclimate change, we forced the model with changes in two factors: sea-level rise andprecipitation intensity.
Changes in precipitation intensity were simulated using bias-corrected daily dataon precipitation for 5 General Circulation Models (GCMs), obtained from the ISI-MIP15
project (Inter-Sectoral Impact Model Intercomparison Project) (Hempel et al., 2013).These data are available at a horizontal resolution of 0.5◦ ×0.5◦, and have been biascorrected against the EU-WATCH baseline reanalysis dataset (Weedon et al., 2011) forthe period 1960–1999. Future climate data were used for five GCMs, namely: GFDL-ESM2M, HadGEM2-ES, IPSL-CM5A-LR, MIROC-ESM-CHEM, and NorESM1-M, and20
for the following Representative Concentration Pathway (RCP) scenarios: RCP2.6,RCP4.5, RCP6.0, and RCP8.5. Thus, we used 20 GCM-RCP combinations in total. Wecalculated change factors in daily precipitation volume between the baseline climatedataset and each GCM-RCP combination, for each of the return periods used in thisstudy. The extrapolation to the different return periods is carried out by fitting the25
Gumbel distribution to the time-series of annual maximum precipitation, whereby theLangbein correction (Langbein, 1949) is applied for return periods lower than 10 years.We carried out this statistical process for each of the GCM-RCP combinations for two
4439

NHESSD3, 4435–4478, 2015
River flood risk inJakarta under
scenarios of futurechange
Y. Budiyono et al.
Title Page
Abstract Introduction
Conclusions References
Tables Figures
J I
J I
Back Close
Full Screen / Esc
Printer-friendly Version
Interactive Discussion
Discussion
Paper
|D
iscussionP
aper|
Discussion
Paper
|D
iscussionP
aper|
time-periods, namely 2010–2049 and 2040–2079. These time-periods are used in thepaper to represent climate conditions in 2030 and 2050, respectively. Finally, thesechange factors were applied to the standard input of the SOBEK model under currentconditions, which is based on gauged precipitation data at 29 stations.
In the SOBEK model, sea-level is used as a boundary condition at the river–sea5
interface. Therefore, we used two simple scenarios of sea-level rise between 2010–2030 and 2010–2050, and added these to the SOBEK input baseline sea-level for2010. These low and high scenarios represent the 5th and 95th percentiles of theglobal sea level rise projections of the IPCCs Fourth Assessment Report (AR4) (IPCC,2007), using the method of Meehl et al. (2007). The scenarios represent increases10
in sea-level of 3 and 11 cm respectively for the period 2010–2030; and 6 and 21 cmrespectively for the period 2010–2050.
Finally, we also produced hazard maps showing the magnitude of continued landsubsidence. This was done by subtracting projections of future subsidence from theDigital Elevation Model (DEM) used in SOBEK (Deltares et al., 2012; Tollenaar et al.,15
2013). The DEM has a horizontal resolution of 50m×50m. In SOBEK, the original DEMis replaced by the new DEM (with future subsidence), and the hydrological-hydraulicsimulations are repeated. This results in new flood hazard maps showing the floodinundation and extent under the land subsidence scenario, which are then used asinput to the Damagescanner-Jakarta model. A map showing the spatial distribution20
of the projected land subsidence between 2012 and 2025 used in our model setupis shown in Fig. 2. We used a hypothetical scenario of land subsidence, in whichthe current rate of subsidence (Abidin et al., 2011) continues at the same rate, andultimately stops in the year 2025. The latter is due to the large uncertainty of predictingthe displacement and rebuilding of weirs, dikes, and bridges in the hydraulic model25
input, rather than a theoretical ultimate level of land subsidence. The current rate ofsubsidence ranges from 1–15 cmyear−1 across different parts of the city (see Fig. 2).This simple approach is used in the absence of more detailed scenarios of future land
4440

NHESSD3, 4435–4478, 2015
River flood risk inJakarta under
scenarios of futurechange
Y. Budiyono et al.
Title Page
Abstract Introduction
Conclusions References
Tables Figures
J I
J I
Back Close
Full Screen / Esc
Printer-friendly Version
Interactive Discussion
Discussion
Paper
|D
iscussionP
aper|
Discussion
Paper
|D
iscussionP
aper|
subsidence in Jakarta, in order to provide indicative results of the potential influence ofthis important factor on changes in future flood risk.
As was the case in Budiyono et al. (2014), we assume that no flood damage occursat a return period of 1 year. Hence, simulated flood depths at 1-year return period aresubtracted from simulated flood depths for higher return periods. This was carried out5
in order to represent an assumption of zero damage at bankfull discharge (e.g. Wardet al., 2011a; Winsemius et al., 2013). The flood hazard maps generated by SOBEKrepresent a situation in which the flood management system in place is operating undernormal conditions, and cannot account for system failures or those caused by a lack ofmaintenance.10
2.2 Exposure
We use a land use map to estimate economic exposure per grid cell. For this study,we used the 2002 land use maps issued by the Office of City Planning, Jakarta (seeBudiyono et al., 2014; DTR-DKI, 2007). For the future land use scenario, we used theJakarta land use plan 2030 (Pemda DKI Jakarta, 2012), which was recently approved15
by the lower house of representatives, Jakarta. Both the land use map 2002 and landuse map plan 2030 contain twelve land use classes. However, three of the land useclasses in the land use plan 2030 pertain to the planned new reclamation islands, whichshould not be affected by river flooding. Hence, three of the land use classes presentin the 2002 map are not used in the 2030 plan. Note, however, the plan represents an20
idealised situation, and as a result the land use plan shows much more homogenouspatterns of land use than the 2002 map. Therefore, we represented the future changein risk due to land use change as follows. Firstly, we re-classed several land use classesto derive similarities of land use classes between the 2002 and 2030 maps (see notesaccompanying Table 1). Then, using GIS analysis we calculated the total area of each25
land use class in 2002 and 2030, as shown in Table 1. From this, we were able to derivefactors showing the change in the area of each land use category. This was used in thedamage calculations to estimate the change in risk per land use category between the
4441

NHESSD3, 4435–4478, 2015
River flood risk inJakarta under
scenarios of futurechange
Y. Budiyono et al.
Title Page
Abstract Introduction
Conclusions References
Tables Figures
J I
J I
Back Close
Full Screen / Esc
Printer-friendly Version
Interactive Discussion
Discussion
Paper
|D
iscussionP
aper|
Discussion
Paper
|D
iscussionP
aper|
current and future scenarios. For example, the total area of land use class “Industryand Warehouse” increases from 7.06 to 8.87 % (an increase of ca. 26 %). Hence, theannual expected damage associated with this land use class was increased by 26 % inthe future scenario compared to the baseline scenario.
Each land use class is assigned a value of economic exposure per hectare (Table 2).5
These values were derived via a series of expert meetings and a workshop, asdescribed in detail in Budiyono et al. (2014). For land use classes that are consistent forboth land use maps, values are taken directly from Budiyono et al. (2014). For land useclasses where reclassifications were required as described above, exposure valueswere derived by area-weighted averaging. For example, the maximum value of land10
use class “Residential” in land use plan 2030 results from the average of two classes,weighted by spatial percentage of land use classes “High density urban kampung” and“Low density urban kampung” in land use map 2002 (detail in Table 2).
2.3 Vulnerability
In the final model, the Damagescanner, vulnerability is represented by depth-damage15
functions, hereafter referred to as vulnerability curves. Vulnerability curves for Jakartahave already been derived for each of the land use classes in the land use map of 2002by Budiyono et al. (2014). These synthetic vulnerability curves were also developedthrough the series of expert meetings and a workshop, following the Fuzzy CognitiveMappings (FCM) method. For this study, the vulnerability curves were adapted, so as20
to be usable with the reclassed land use classes shown in Table 1. As was the casefor the economic exposure values, this was carried out using area-weighted averaging.The same vulnerability curves were used for the baseline scenario and 2030, since nodata were available on potential changes in vulnerability over that time. The resultingvulnerability curves are shown in Fig. 3.25
4442

NHESSD3, 4435–4478, 2015
River flood risk inJakarta under
scenarios of futurechange
Y. Budiyono et al.
Title Page
Abstract Introduction
Conclusions References
Tables Figures
J I
J I
Back Close
Full Screen / Esc
Printer-friendly Version
Interactive Discussion
Discussion
Paper
|D
iscussionP
aper|
Discussion
Paper
|D
iscussionP
aper|
3 Results
This section is split into three subsections. Firstly, we describe the flood riskresults under current conditions in comparison to past results reported in Budiyonoet al. (2014) to show the change resulting from the new model schematisation and thenewly operational flood protection measures. Secondly, we show the potential impacts5
of climate change on extreme precipitation, one of the drivers of risk change discussedin this paper. Thirdly, we show the potential changes in flood risk between the currentsituation and the future, based on the various future scenarios. We examine both theindividual and combined influence of the different drivers on flood risk.
3.1 Flood risk under current conditions10
In this study, we ran Damagescanner as described in Sect. 2. The resulting flood riskunder current conditions is USD 143 million p.a. This is significantly lower than our pastresult as presented in Budiyono et al. (2014), in which flood risk was estimated to beUSD 321 million p.a. The differences are due to changes that have been carried out inthe hydraulic system in Jakarta, which have been included in a revised schematisation15
of the hydrology model. The main changes are now discussed, and it appears thatthat flood protection actions taken since 2007 have led to reduced flood hazard, andconsequently flood risk, as reflected in the lower current risk estimate in this study.
The version of the hazard model used in Budiyono et al. (2014) used a hydraulicschematisation based on the situation in 2007. In the current paper, we used an20
updated version of the model in which the schematisation has been updated to includeflood protection measures, including flood gates and weirs that have been implementedbetween 2007 and 2013. Moreover, the revised version of the model has a moreaccurate representation of those flood protection measures that were already in placein 2007. The most important single change in the hydrological and hydraulic situation25
that has taken place since 2007, and is now implemented in SOBEK, is the newly builtEastern Flood Canal (Banjir Kanal Timur, BKT), which diverts flood waters away from
4443

NHESSD3, 4435–4478, 2015
River flood risk inJakarta under
scenarios of futurechange
Y. Budiyono et al.
Title Page
Abstract Introduction
Conclusions References
Tables Figures
J I
J I
Back Close
Full Screen / Esc
Printer-friendly Version
Interactive Discussion
Discussion
Paper
|D
iscussionP
aper|
Discussion
Paper
|D
iscussionP
aper|
the eastern side of the city via the canal. Comparing the flood hazard maps for a givenreturn period based on the 2007 and 2013 schematisations shows that the simulatedflood extent in the eastern half of the city has indeed decreased. For example, in Fig. 4we show the differences in inundation depth between 2007 and 2013; in the easternhalf of the city, the flood extent has decreased by 27 % by width or by 34 % by volume.5
The reliability of the new 2013 flood maps has been compared with empirical floodmaps produced by the National Disaster Management Office (BNPB). These mapsshow which village administration (Kelurahan) units in Jakarta actually suffered frominundation during the 2007 and 2013 flood events (Fig. 5). We can see that thespatial pattern in the western half remains fairly similar, whilst far fewer Kelurahan10
were reported as suffering from inundation during the 2013 flood in the eastern part. Itshould be noted that the return periods of the floods in 2007 and 2013 are not exactlythe same; the former is estimated to have a return period of ca. 50 years, comparedto 30 years in the latter. Hence, the figure is only intended to demonstrate the fact thatthere appears to be an overall agreement between the 2013 modelling results and the15
Government flooding maps showing smaller inundation areas in the eastern parts ascompared to previous research. This explains our lower risk estimates compared toBudiyono et al. (2014).
Finally the changes in the inundation depths are also partly due to furthermodifications of the SOBEK schematisation in terms of its hydraulics. Namely, the20
Saint–Venant equations have been implemented on more detailed dimensions ofstream fractions, which produces finer 1-D overtopping and a more disperse butshallower 2-D floodplain.
3.2 Potential impacts of climate change on extreme precipitation
As described in Sect. 2.1, we estimated changes in the magnitude of 1 day precipitation25
sums for the different return periods used in this study, based on data from 5 GCMsand 4 RCPs, i.e. 20 GCM-RCP combinations. In Fig. 6, we present precipitation factorsthat show changes in extreme 1 day precipitation for different return periods, whereby
4444

NHESSD3, 4435–4478, 2015
River flood risk inJakarta under
scenarios of futurechange
Y. Budiyono et al.
Title Page
Abstract Introduction
Conclusions References
Tables Figures
J I
J I
Back Close
Full Screen / Esc
Printer-friendly Version
Interactive Discussion
Discussion
Paper
|D
iscussionP
aper|
Discussion
Paper
|D
iscussionP
aper|
a factor “1” represents the extreme 1 day precipitation under current conditions. Theresults for 2030 and 2050 are shown in Fig. 6.
The results show that the impacts of climate change on extreme 1 day precipitationin 2030 and 2050 are highly uncertain. The median values of both 2030 and 2050show lower 1 day precipitation sums by ca. 20 % (2030) and 19 % (2050) compared5
to baseline, with very little variation between the different return periods (standarddeviations 0.8 and 1.2 % in the sequential years). However, whilst the median valuesindicate a decrease, the uncertainty is extremely large, as reflected by the large rangein values, and the large range between the 25th and 75th percentiles. Even the signof the change is highly uncertain. Moreover, Fig. 6 also shows that this spread in10
the distributions of change in 1 day precipitation sums increases as the return periodincreases, reflecting even greater uncertainty in changes in the precipitation eventswith a longer return period.
In terms of the median values, we found little difference in the precipitation changefactors between the different RCPs (Table 3). For 2030 these ranged from 0.76 for15
RCP4.5 to 0.85 for RCP8.5, and for 2050 they ranged from 0.79 for RCP2.6 to 0.96 forRCP8.5. Across the five different GCMs, the standard deviation in these precipitationchange factors is large (Table 3), showing the large uncertainty of how this variablemay change in the future.
3.3 Impacts of future changes in individual risk drivers on flood risk20
In this section, we describe the potential changes in flood risk between the baselineestimate of USD 143 million p.a., and the future, for each of the risk drivers separately.
3.3.1 Climate change
Firstly, we show the potential influence of climate change only on future flood riskcompared to current flood risk. The results are shown in Table 4. Here, we show the25
future risk (in 2030 and 2050) for each of the different combinations of precipitation
4445

NHESSD3, 4435–4478, 2015
River flood risk inJakarta under
scenarios of futurechange
Y. Budiyono et al.
Title Page
Abstract Introduction
Conclusions References
Tables Figures
J I
J I
Back Close
Full Screen / Esc
Printer-friendly Version
Interactive Discussion
Discussion
Paper
|D
iscussionP
aper|
Discussion
Paper
|D
iscussionP
aper|
intensity (represented by the RCP scenarios) and sea level rise (low and highscenarios). The median and standard deviation of the results across the five GCMs areshown for each combination of RCP and sea level rise scenario. From these results, itis clear that there is no clear signal of change in future flood risk as a result of climatechange alone.5
For 2030, under the low sea level rise scenario, the median risk is in fact lower thanfor the baseline (USD 143 million p.a.) for all RCPs. However, the standard deviationis large, with increases when some GCMs are used, and decreases when others areused. Under the high sea level rise scenario, the median risk increases for all RCPs,although again the standard deviation between GCMs is large. For 2050, the results10
show slightly higher risk compared to 2030, under both sea level rise scenarios.Across all 40 combinations of GCMs, RCPs, and sea level rise scenarios (5
GCMs×4 RCPs×2 sea level rise scenarios), the risk estimates range from USD 64million p.a. to USD 438 million p.a. for 2030, and USD 64 million p.a. to USD 511 millionp.a. for 2050. For 2030, a decrease in risk compared to baseline was simulated in 1915
of these combinations, with an increase under the other 21 combinations. For 2050,a decrease was simulated in 18 of the combinations, with an increase in the other 22combinations.
In 2030, the highest risk values are simulated under RCP8.5, whilst there are onlysmall differences between the other RCPs. According to IPCC (2014), the global20
radiative forcing by 2030 is the highest under RCP8.5, whilst the radiative forcing levelsunder the other RCPs are similar to each other. By 2080, we see an increase in thedifference between the risk estimates under RCP8.5 and those under the other RCPs.
3.3.2 Land use change
As stated earlier, the land use map used to represent 2030 is that of the official25
Spatial Plan 2030. As such, it represents an idealised situation, in the case that theland use planning envisioned for the coming decades is successfully implemented,rather than a scenario of unplanned development. Assuming this land use plan 2030,
4446

NHESSD3, 4435–4478, 2015
River flood risk inJakarta under
scenarios of futurechange
Y. Budiyono et al.
Title Page
Abstract Introduction
Conclusions References
Tables Figures
J I
J I
Back Close
Full Screen / Esc
Printer-friendly Version
Interactive Discussion
Discussion
Paper
|D
iscussionP
aper|
Discussion
Paper
|D
iscussionP
aper|
and assuming no other changes in physical or socioeconomic factors, flood risk wouldincrease between the current situation and 2030 by a factor of 1.1. More detailed resultsare presented in Table 5, which shows the percentage of both the total inundated areaand damage (here shown from the map of a 5-year return period, which is the returnperiod for which the damage is closest to the annual expected damage) associated5
with each land use class. Similar distributions of damage between the different land useclasses are also found for the other return periods. The results show that the majority ofthe inundated areas are found in locations with residential land use classes. This is boththe case under current land use (60 %; summation of “high density urban kampung”,“low density urban kampung”, and “planned house”) and under 2030 land use (60 %;10
summation of “residentials” and “residentials with greenery”). However, the largestshare of total damages are found in the land use classes related to commercial areas,i.e. “Industry and warehouse” followed by “Commercial and business”. Combined,these two land use classes account for ca. 72 % of total damages under current landuse, and 77 % under future land use.15
3.3.3 Land subsidence
Assuming only an increase in land subsidence for 2030, we found an increase in annualexpected damage of 173 % between the current situation and 2030, i.e. an increasefrom USD 143 million p.a. to USD 391 million p.a.
The increase in risk resulting from projected subsidence, however, is not uniform20
across the city. In Fig. 7, we see the percentage increase in flood damage per grid cellover the period 2010–2030 due to subsidence alone, following the rates of subsidenceshown in Fig. 2. Note also that the actual influence of subsidence will strongly dependon the changes in other environmental and socioeconomic drivers (as discussed inSect. 4.3).25
4447

NHESSD3, 4435–4478, 2015
River flood risk inJakarta under
scenarios of futurechange
Y. Budiyono et al.
Title Page
Abstract Introduction
Conclusions References
Tables Figures
J I
J I
Back Close
Full Screen / Esc
Printer-friendly Version
Interactive Discussion
Discussion
Paper
|D
iscussionP
aper|
Discussion
Paper
|D
iscussionP
aper|
3.4 Impacts of future changes in combined risk drivers on flood risk
In the previous subsections, the change in risk between the current situation and thefuture scenarios has been shown for each risk driver separately. In reality, the futuresituation will depend on the combined change of all the drivers. Hence, in this sectionwe show the impacts of combinations of different risk drivers on future risk.5
In Fig. 8, we show probability density functions (PDFs) of the simulated annualexpected damage, whereby each PDF is derived from a 2-parameter Gammadistribution fit to the 20 GCM/RCP combinations. A similar approach was followed byWard et al. (2014b) for including climate change in probabilistic projections of flood riskalong the Rhine in Europe. The dotted black vertical line represents current flood risk,10
i.e. USD 143 million p.a.Figure 8 clearly shows the strong influence of projected subsidence on the overall
change in risk. All of the PDFs representing scenarios with subsidence (shown in red)show much higher annual expected damage than those without subsidence (shown inblue). The PDFs also clearly show the large uncertainty associated with the projected15
changes in precipitation from the different GCMs and RCPs, which is large under all ofthe PDFs. However, the results show that if we include land subsidence in the futureprojections, the probability of future flood risk exceeding current day flood risk exceeds99.999 % (when accounting for changes in precipitation).
The results also show the importance of the interaction between different drivers.20
For example, if we examine the difference between the PDFs for low and high sealevel rise, we see a small difference under the scenarios with no subsidence and landuse 2030. In this case, the median risk value (across the PDF of different GCM/RCPcombinations) is 22 % greater under the high sea level rise scenario (USD 174 millionp.a.), while under the low sea level rise scenario decrease to be USD 138 million p.a.25
However, if we make a similar comparison using the scenarios that include subsidence,the median risk value is 34 % greater under the high sea level rise scenario (USD 519million p.a.) than under the low sea level rise scenario (USD 388 million p.a.). Similar
4448

NHESSD3, 4435–4478, 2015
River flood risk inJakarta under
scenarios of futurechange
Y. Budiyono et al.
Title Page
Abstract Introduction
Conclusions References
Tables Figures
J I
J I
Back Close
Full Screen / Esc
Printer-friendly Version
Interactive Discussion
Discussion
Paper
|D
iscussionP
aper|
Discussion
Paper
|D
iscussionP
aper|
differences can be found when comparing the scenarios with and without projectedland use change. The differences between the two scenarios are amplified with higherrates of subsidence and/or sea level rise.
From Table 6, we summarize the results of the influence on risk of the individualdrivers and the combined scenarios for 2030. For scenarios with climate change,5
we show both the median and 5th–95th percentile values based on the Gammadistributions. From the Table, it is clear that land subsidence has the largest influenceon future risk, followed by land use change and sea level rise.
4 Discussion
4.1 Uncertainty in projections of change in precipitation intensity10
In Sect. 3, we showed the impacts of climate change on flood risk, whereby the impactsof climate change are expressed through both sea level rise and changes in themagnitude of extreme 1 day precipitation totals. In terms of the latter, our analysesshow this variable to be highly uncertain. Whilst the median projections (Table 3) showa decrease compared to baseline – which results in lower median flood risk in the future15
when combined with the low sea level rise scenario (Table 4) – the PDFs in Fig. 8 showthat there is deep uncertainty attached to the impacts of changes in precipitation onthe risk. Nevertheless, this does not mean that it is not an important factor to consider.In fact, some of the GCM-RCP combinations indicate an increase in risk of a factorgreater than 2.7 as a result of climate change alone.20
The uncertainty in future risk projections is confirmed by other research in the region.For example, rainfall observations across Indonesia as a whole for the second half ofthe 20th century suggest that mean annual rainfall may have decreased by ca. 2–3 %, mainly in the wet season from December to February (Boer and Faqih, 2004).Earlier projections of mean annual rainfall over the 21st century taken from several25
climate models suggest that mean annual rainfall may increase in the future across
4449

NHESSD3, 4435–4478, 2015
River flood risk inJakarta under
scenarios of futurechange
Y. Budiyono et al.
Title Page
Abstract Introduction
Conclusions References
Tables Figures
J I
J I
Back Close
Full Screen / Esc
Printer-friendly Version
Interactive Discussion
Discussion
Paper
|D
iscussionP
aper|
Discussion
Paper
|D
iscussionP
aper|
most of Indonesia, although in Java it may decrease (Hulme and Sheard, 1999). Nayloret al. (2007) downscaled output from the Intergovernmental Panel on Climate ChangeAR4 suite of climate models for the 21st century, to the regional level, and found a largeuncertainty on the monsoon onset in West Java/Central Java region. Moreover, theyfound that precipitation totals may decrease (by up to 75 % in the tails) during the5
dry season, although this research did not address the wet season, when floodinggenerally occurs in Jakarta. Scoccimarro et al. (2013) investigated potential changesin extreme precipitation events by 2100 using RCP8.5 and several CMIP5 models.They found that the 90th and 99th percentiles of heavy rainfall may increase during themonths June–August in Indonesia. However, this is the dry season, whilst flooding in10
Jakarta usually occurs during the wet months of December–February.Recently, Chadwick et al. (2013) carried out climate model experiments to assess
the potential changes in regional patterns of precipitation and atmospheric circulationresulting from a “ramp-up” of CO2 levels from pre-industrial levels (280 ppm) untilquadrupling (1120 ppm) after 70 years (and scenarios of 3×CO2, 2×CO2, and15
1.5×CO2), followed by 10 years of stabilisation, and then a 70-year ramp-down to pre-industrial levels. During the ramp-up phase, they found decreased precipitation in thepart of the tropical western Pacific where Indonesia is located. Chadwick et al. (2013)suggest that this regional redistribution of rainfall is caused by circulation changesassociated with changing gradients of sea-surface temperatures (SSTs) in the tropical20
Pacific.Further uncertainties in the future response of precipitation to climate change in
the region result from potential changes in the frequency and/or magnitude of El NiñoSouthern Oscillation (ENSO). ENSO shows strong linkages with precipitation in partsof the Indonesian archipelago (Aldrian and Susanto, 2003; Aldrian et al., 2007; Hendon,25
2003; Qian et al., 2010), and is linked to anomalies in both discharge (Poerbandonoet al., 2014) and flood volumes (Ward et al., 2014a). The current generation of climatemodels shows little agreement on whether (and if so how) the frequency of ENSOcould change due to climate change (Guilyardi et al., 2009; Paeth et al., 2008; Van
4450

NHESSD3, 4435–4478, 2015
River flood risk inJakarta under
scenarios of futurechange
Y. Budiyono et al.
Title Page
Abstract Introduction
Conclusions References
Tables Figures
J I
J I
Back Close
Full Screen / Esc
Printer-friendly Version
Interactive Discussion
Discussion
Paper
|D
iscussionP
aper|
Discussion
Paper
|D
iscussionP
aper|
Oldenborgh et al., 2005). However, a recent study suggests that extreme El Niño events(which are associated with negative flood anomalies in the western Java; Ward et al.,2014a) may become more frequent (Cai et al., 2014).
To account for this large uncertainty, we developed the probabilistic projections offlood risk under climate change shown in Fig. 8. Instead of only describing potential5
changes in the median flood risk under climate change (a decrease with a low sealevel rise scenario and a slight increase with a high sea level rise scenario), theseprovide much more information, by describing the change in flood risk across the entiredistribution of the 20 GCM-RCP combinations (5 GCMs×4 RCPs).
4.2 Relative influence of different drivers on flood risk10
From Table 6, we see that land subsidence is the single driver with the greatestcontribution to increased flood risk compared to the baseline. If we consider a linearincrease from 2013 to 2030, it equals an annual rate of USD 14.6 million (10.24 %) p.a.Given an assumption of a 2.5 cm rate of subsidence p.a. (on average over the wholecity), this would mean an increase in risk of USD 5.8 million per cm subsidence. In15
reality, the rate of land subsidence is geographically heterogeneous, with higher ratesin the north of the city. However, the number gives a powerful indication of the order ofmagnitude of the problem in terms of its impacts on risk.
The problem of land subsidence appears to be the most influential forcing for futureflood risk, followed by sea level rise, and is a serious issue in many other low lying20
coastal and delta cities (Erkens et al., 2014). Ward et al. (2011b) also showed thisdriver to be the main factor contributing to projected increases in future coastal floodrisk in Jakarta. The annual rate of increase in flood risk due to subsidence calculatedfor Jakarta is similar to that for Bangkok during the 1990s, which was USD 12 millionp.a. (DMR, 2000 in Phien-wej et al., 2006). In Taiwan, the Yunlin area has similar25
subsidence rates to northern Jakarta, ranging from 3.5 to 14.3 cmyear−1 (Tung andHu, 2012). In this area, high flood damages have also been simulated, for exampleUSD 171 million for a 200-year return period flood.
4451

NHESSD3, 4435–4478, 2015
River flood risk inJakarta under
scenarios of futurechange
Y. Budiyono et al.
Title Page
Abstract Introduction
Conclusions References
Tables Figures
J I
J I
Back Close
Full Screen / Esc
Printer-friendly Version
Interactive Discussion
Discussion
Paper
|D
iscussionP
aper|
Discussion
Paper
|D
iscussionP
aper|
Using the scenarios in this study, we found similar increases in flood risk resultingfrom sea level rise and land use change, with increases in risk by 13 and 15 %respectively. However, the mechanisms behind these forcings are different, as is thegeographical distribution in the change in risk.
Since sea level rise affects river flooding by making discharge of excess waters to5
the sea more difficult, most of the increase in risk simulated under the sea level risescenarios is concentrated towards the coastal area. Using the average values acrossthe different sea level rise scenarios, the increase translates to an increase in risk ofca. USD 1.2 million p.a., or USD 3.0 million per cm sea level rise.
On the other hand, the change in risk associated with land use change is distributed10
more evenly across the city. Finally, Table 6 also shows that the combined impact of alldrivers on risk (+263 % under the median scenario of precipitation change), is muchgreater than the summation of the impacts of the individual flood drivers.
4.3 Implications for risk management
The flood risk problem in Jakarta results from the interplay of a large number of15
drivers, both physical and socioeconomic in nature. Hence, measures and strategiesto reduce that risk must be taken in an integrated way (e.g. Jha et al., 2012). Thedevelopment of such strategies is indeed taking place in Jakarta, a good examplebeing the National Coastal Integrated Coastal Development program (NCICD). Whilstthe most well-known aspect of this program is the planned “giant sea wall” (over 35 km20
long), it also integrates plans to construct and strengthen other defences in the short-term, as well as address pressing issues such as land subsidence, water supply, andwater sanitation. The program builds on initial findings of the Jakarta Coastal DefenceStrategy (JCDS, 2011; Jeuken et al., 2014).
Clearly, concerted efforts to address the land subsidence issue are paramount to25
reducing the increasing flood risk in Jakarta as we show that land subsidence is thedriver with largest impact on river flood risk. It has been suggested to target measuresto reducing soil water extraction, which is the main cause of land subsidence in
4452

NHESSD3, 4435–4478, 2015
River flood risk inJakarta under
scenarios of futurechange
Y. Budiyono et al.
Title Page
Abstract Introduction
Conclusions References
Tables Figures
J I
J I
Back Close
Full Screen / Esc
Printer-friendly Version
Interactive Discussion
Discussion
Paper
|D
iscussionP
aper|
Discussion
Paper
|D
iscussionP
aper|
Jakarta is (Abidin et al., 2011). Soil water extraction takes place both for supplyingwater for drinking and industry, as well as in the construction of high-rise buildings.PDAM Provinsi DKI Jakarta (2012), the water industry board of Jakarta, supplieswater to 61.1 % of consumers in Jakarta. They report that an additional 8–10 m3 s−1
would be needed to erase the need for all deep wells while sufficing the needs of5
the rest presently not sufficed. According to a synthesis of results in reports by PAMLyonaise Jaya (2012) and Aetra Air Jakarta (2013) this would require an investmentof ca. USD 389 million. Whilst this is a large investment, it is of the same order ofmagnitude as our projected increase in risk per annum resulting from land subsidence,land use change, and climate change. Hence, whilst this is a very simplistic example,10
it shows that measures to increase and improve water supply appear to be small inrelation to the damages that they could help to avoid, even without factoring in theother benefits. Indeed, strict regulations on groundwater pumping (accompanied bythe supply of alternative water sources) have been shown to be effective in reducingland subsidence. For example, the rate of subsidence in Bangkok was ca.12 cm15
year−1 during the 1980s, but was reduced to 2 cm year−1 after strict regulations ondeep well pumping (Phien-wej et al., 2006). A nested modelling approach by Aichi(2008) has shown that the groundwater regulations in Tokyo have led to decreasedsubsidence since the mid-1970s. The groundwater regulation was effective for Tokyoand the surrounding three prefectures for 14 years from January 1961 until April 197420
(Tokunaga, 2008). As mentioned earlier, high-rise building construction also extractswater from the soil (dewatering) during the process. This intensive extraction of soilwater in the short term has been reported to result in severe localised land subsidence(Zhang et al., 2013). Hence, it may also be useful to consider other piling processes,such as auger piling (Abdrabbo and Gaaver, 2012). If dewatering is unavoidable for25
Jakarta, it may be useful to focus such high-rise development in those parts of the citywhere the lithology is more compacted, such as in the southern part (Bakr, 2015).
In this study, we represent changes in land use by using a single scenario, whichrefers to an idealised plan of the city in 2030, assuming that the land use planning
4453

NHESSD3, 4435–4478, 2015
River flood risk inJakarta under
scenarios of futurechange
Y. Budiyono et al.
Title Page
Abstract Introduction
Conclusions References
Tables Figures
J I
J I
Back Close
Full Screen / Esc
Printer-friendly Version
Interactive Discussion
Discussion
Paper
|D
iscussionP
aper|
Discussion
Paper
|D
iscussionP
aper|
for 2030 is implemented. Our results show that under this scenario (land use changealone), risk would increase by 15 %. Given the fact that changes in exposure throughurban development are seen as one of the main drivers of risk in developing countries(Jongman et al., 2012; UNISDR, 2013), such a relatively low increase in risk attributableto land use change would be encouraging. Moreover, the scenario does not include5
assumptions on potential measures or strategies that could be taken to further reduceflood risk. For example, in Indonesia as a whole, Muis et al. (2015) simulated increasesin both river and coastal flood risk by 2030 assuming a scenario where building isallowed in flood-prone areas, and several scenarios where new buildings are prohibited(with different levels of enforcement) in the 100-year flood zone. They found that river10
flood risk could be reduced by about 30–60 %, and costal flood risk by about 65–80 %,compared to the scenario in 2030 with no building restrictions in the flood-prone zone.Also, measures could also be taken that allow for building in flood-prone areas, butonly if certain building codes are used. For example, dry-proofing and wet-proofing ofhouses have been found to have a large potential to decrease flood risk (e.g. Kreibich15
et al., 2005, 2011; Kreibich and Thieken, 2009; Poussin et al., 2012; Thurston et al.,2008). In Jakarta, measures are already taken at the household level, such as thebuilding of second stories on houses so that valuable possessions can be movedupwards away from flood waters in the event of a flood, and using traditional buildingmethods such as rumah panggung (elevated wooden house that stands on piles) in20
ways that are more commensurate with flooding (e.g. Marfai et al., 2015; Wijayantiet al., 2015). It would be of interest to assess the risk that could be achieved throughoutthe city if such measures were to be implemented on a larger scale, for examplethrough the use of building codes. However, it should be noted that achieving all ofthe developments named above, including the situation depicted by the land use plan25
2030 would entail very strong governance structures, strong spatial planning laws, andthorough implementation.
4454

NHESSD3, 4435–4478, 2015
River flood risk inJakarta under
scenarios of futurechange
Y. Budiyono et al.
Title Page
Abstract Introduction
Conclusions References
Tables Figures
J I
J I
Back Close
Full Screen / Esc
Printer-friendly Version
Interactive Discussion
Discussion
Paper
|D
iscussionP
aper|
Discussion
Paper
|D
iscussionP
aper|
5 Concluding remarks and future research developments
In this paper, we have extended the river flood risk model for Jakarta, developed byBudiyono et al. (2014), to include projections of flood risk under future scenarios ofland subsidence, climate change (sea-level risk and changes in extreme precipitation),and land use change. Combining all of these scenarios, we find a median increase5
in flood risk of 263 % in 2030 compared to baseline. This value is based on ourmedian projection for the influence of changes in extreme precipitation on flood risk.However, since we found the influence of climate change on extreme precipitation to behighly uncertain, we also developed probabilistic projections of flood risk by developingPDFs based on 20 GCM-RCP combinations. The resulting increases in risk for the10
5th and 95th percentiles are 189 and 336 % respectively (when combined with theother drivers). This shows that whilst the influence of climate change on precipitationintensity in the region may be uncertain, when combined with the other drivers of risk,the increase is always large, and hence adaptation is imperative irrespective of thechosen climate scenario or projection.15
The single driver with the largest influence on future flood risk is land subsidence(+173 %). Clearly, addressing this driver could potentially have a large influence onreducing future flood risk. Land use change (+15 %) and sea-level rise (+13 %) leadto an increase in risk of the same order of magnitude as each other. We show thatthe largest share of total damages are found in land use classes related to commercial20
areas; these account for ca. 72 % of total damages under current land use and 77 %under future land use. However, in terms of area affected by flooding, residential areashave a great share. Hence, future efforts to reduce risk must focus on optimal land useplanning for both classes (Aerts et al., 2005).
Whilst we have only examined river flood risk, Jakarta also experiences regular25
flooding due to coastal and flash flooding. The former has been assessed for Jakartain Ward et al. (2011b), and Muis et al. (2015) have assessed both river and coastalflood risk at the scale of Indonesia using globally available datasets and models.
4455

NHESSD3, 4435–4478, 2015
River flood risk inJakarta under
scenarios of futurechange
Y. Budiyono et al.
Title Page
Abstract Introduction
Conclusions References
Tables Figures
J I
J I
Back Close
Full Screen / Esc
Printer-friendly Version
Interactive Discussion
Discussion
Paper
|D
iscussionP
aper|
Discussion
Paper
|D
iscussionP
aper|
Nevertheless, the impacts of river and coastal flooding can interact with each other– for example when high tides occur at the same time as extreme discharges – andthis interaction should be a priority for future flood risk research, not just in Jakarta, butelsewhere (see, for example, Keef et al., 2009; Klerk et al., 2015; Svensson and Jones,2001). To enable an assessment of these interactions, one would need to develop5
time-series of both high river discharge and high sea-levels, in order to examine thetemporal interactions and joint probabilities between these two variables. However, atpresent long time-series of simulated sea levels are only available for limited regions(e.g. Haigh et al., 2013), although global modelling efforts may open this opportunity inthe future.10
Given the uncertainty in climate change projections, future development of officialtailored climate scenarios for Jakarta (or indeed Indonesia) should be a researchpriority. Such a set of scenarios would allow for a more consistent modelling of climateimpacts, not only in terms of flood risk analysis, but indeed in terms of climate impactsacross a full range of hazards and sectors (e.g. Aerts et al., 2014).15
Whilst we have simulated changes in hazard and exposure in the future, we haveassumed that vulnerability remains constant over time. Recently, Jongman et al. (2015)showed that vulnerability to flooding has been reducing over the last 20–30 years inmany developing countries. Hence, it would be useful to try to develop scenarios ofpotential vulnerability change in the future, and assess how this may affect the overall20
risk. Moreover, in the future projections we do not include adaptation measures thatcould be taken to reduce future risk (other than those measures that are already inplace). Research by Muis et al. (2015) at the national scale for Indonesia has shownthat the growth in future river and coastal flood risk could be contained to a large degreeby increasing protection levels through the building of structural measures such as25
dikes, and by spatial zoning to limit developments in the most flood-prone locations, orat least to make future developments in those zones more commensurate with flooding.In our future work, we will use the model developed here to assess how the futureincrease in risk could potentially be decreased by: (1) the development of early warning
4456

NHESSD3, 4435–4478, 2015
River flood risk inJakarta under
scenarios of futurechange
Y. Budiyono et al.
Title Page
Abstract Introduction
Conclusions References
Tables Figures
J I
J I
Back Close
Full Screen / Esc
Printer-friendly Version
Interactive Discussion
Discussion
Paper
|D
iscussionP
aper|
Discussion
Paper
|D
iscussionP
aper|
systems, and (2) the restoration of 42 existing polder and the creation of 23 new poldersin northern Jakarta.
Acknowledgements. This research was funded by the Dutch research programme Knowledgefor Climate and Delta Alliance research project HSINT02a (Jakarta Climate Adaptation Tools),and the Connecting Delta Cities initiative (www.deltacities.com).5
References
Abdrabbo, F. M. and Gaaver, K. E.: Installation effects of auger cast-in-place piles, AlexandriaEngineering Journal, 51, 281–292, doi:10.1016/j.aej.2012.08.001, 2012.
Abidin, H. Z., Andreas, H., Gumilar, I., Fukuda, Y., Pohan, Y. E., and Deguchi, T.: Landsubsidence of Jakarta (Indonesia) and its relation with urban development, Nat. Hazards,10
59, 1753–1771, doi:10.1007/s11069-011-9866-9, 2011.Aerts, J., Herwijnen, M. V., Janssen, R., and Stewart, T.: Evaluating spatial design
techniques for solving land-use allocation problems, J. Environ. Plann. Man., 48, 121–142,doi:10.1080/0964056042000308184, 2005.
Aerts, J. C. J. H., Botzen, W. J. W., Emanuel, K., Lin, N., de Moel, H., and Michel-15
Kerjan, E. O.: Evaluating flood resilience strategies for coastal megacities, Science, 344,473–475, doi:10.1126/science.1248222, 2014.
Aetra Air Jakarta, PT: Laporan Tahunan 2013: Konservasi Air Selamatkan Lingkungan, PTAetra Air Jakarta, Jakarta, 2014.
Aichi, M.: Coupled groundwater flow/deformation modelling for predicting land subsidence, in:20
Groundwater Management in Asian Cities, edited by: Takizawa, S., Springer Japan, Tokyo,105–124, available at: http://link.springer.com/chapter/10.1007/978-4-431-78399-2_6, lastaccess: 23 April 2015, 2008.
Aldrian, E. and Dwi Susanto, R.: Identification of three dominant rainfall regions withinIndonesia and their relationship to sea surface temperature, Int. J. Climatol., 23, 1435–1452,25
doi:10.1002/joc.950, 2003.Aldrian, E., Gates, L. D., and Widodo, F. H.: Seasonal variability of Indonesian rainfall in
ECHAM4 simulations and in the reanalyses: the role of ENSO, Theor. Appl. Climatol., 87,41–59, doi:10.1007/s00704-006-0218-8, 2006.
4457

NHESSD3, 4435–4478, 2015
River flood risk inJakarta under
scenarios of futurechange
Y. Budiyono et al.
Title Page
Abstract Introduction
Conclusions References
Tables Figures
J I
J I
Back Close
Full Screen / Esc
Printer-friendly Version
Interactive Discussion
Discussion
Paper
|D
iscussionP
aper|
Discussion
Paper
|D
iscussionP
aper|
Bakr, M.: Influence of groundwater management on land subsidence in deltas, Springer, WaterResour. Manag., 29, 1541–1555, doi:10.1007/s11269-014-0893-7, 2015.
Bappenas: Laporan Perkiraan Kerusakan dan Kerugian Pasca Bencana Banjir Awal Februari2007 di Wilayah JABODETABEK (Jakarta, Bogor, Depok, Tangerang, dan Bekasi),Kementrian Negara Perencanaan Pembangunan Nasional (Bappenas), Jakarta, 2007.5
Bappenas: National Action Plan for Disaster Risk Reduction 2010–2012, State Ministry forNational Development Planning (Bappenas), National Board for Disaster Management(BNPB), Jakarta, 2010.
Boer, R. and Faqih, A.: Current and Future Rainfall Variability in Indonesia, AIACC technicalreport 021, available at: http://sedac.ciesin.columbia.edu/aiacc/progress/AS21_Jan04.pdf,10
last access: 29 April 2015, 2004.Bubeck, P., de Moel, H., Bouwer, L. M., and Aerts, J. C. J. H.: How reliable are projections of
future flood damage?, Nat. Hazards Earth Syst. Sci., 11, 3293–3306, doi:10.5194/nhess-11-3293-2011, 2011.
Budiyono, Y., Aerts, J., Brinkman, J., Marfai, M. A., and Ward, P.: Flood risk assessment for15
delta mega-cities: a case study of Jakarta, Nat. Hazards, 75, 389–413, doi:10.1007/s11069-014-1327-9, 2014.
Cai, W., Borlace, S., Lengaigne, M., van Rensch, P., Collins, M., Vecchi, G., Timmermann, A.,Santoso, A., McPhaden, M. J., Wu, L., England, M. H., Wang, G., Guilyardi, E., and Jin, F.-F.:Increasing frequency of extreme El Nino events due to greenhouse warming, Nature Climate20
Change, 4, 111–116, doi:10.1038/nclimate2100, 2014.Caljouw, M., Nas, P. J. M., and Pratiwo, M.: Flooding in Jakarta?: Towards a blue city with
improved water management, Bijdr. Taal-Land-V., 161, 454–484, doi:10.1163/22134379-90003704, 2005.
Chadwick, R., Wu, P., Good, P., and Andrews, T.: Asymmetries in tropical rainfall and25
circulation patterns in idealised CO2 removal experiments, Clim. Dynam., 40, 295–316,doi:10.1007/s00382-012-1287-2, 2012.
Deltares: Hydrodynamics, Rainfall Runoff and Real Time Control: User Manual, Deltares, Delft,2014.
Deltares, HKV, Puslitbang Sumberdaya Air, Institut Teknologi Bandung, Royal HaskoningDHV,30
Dinas Pekerjaan Umum Provinsi DKI Jakarta and Balai Besar Wilaya Sungai CiliwungCisadane: FMIS: Flood Management Information System: Main Report, Ministry of Public
4458

NHESSD3, 4435–4478, 2015
River flood risk inJakarta under
scenarios of futurechange
Y. Budiyono et al.
Title Page
Abstract Introduction
Conclusions References
Tables Figures
J I
J I
Back Close
Full Screen / Esc
Printer-friendly Version
Interactive Discussion
Discussion
Paper
|D
iscussionP
aper|
Discussion
Paper
|D
iscussionP
aper|
Works, Directorate General of Water Resources, Directorate of Rivers and Coastals, Jakarta,2012.
DTR DKI: Peta tata guna lahan provinsi, DKI, Jakarta, 2007.Erkens, G., Bucx, T., Dam, R., De Lange, G., and Lambert, J.: Sinking Coastal Cities, vol. 16,
p. 14606, available at: http://adsabs.harvard.edu/abs/2014EGUGA..1614606E, last access:5
22 April 2015, 2014.Guilyardi, E., Wittenberg, A., Fedorov, A., Collins, M., Wang, C., Capotondi, A., van
Oldenborgh, G. J., and Stockdale, T.: Understanding El Niño in ocean–atmospheregeneral circulation models: progress and challenges, B. Am. Meteorol. Soc., 90, 325–340,doi:10.1175/2008BAMS2387.1, 2009.10
Haigh, I. D., Wijeratne, E. M. S., MacPherson, L. R., Pattiaratchi, C. B., Mason, M. S.,Crompton, R. P., and George, S.: Estimating present day extreme water level exceedanceprobabilities around the coastline of Australia: tides, extra-tropical storm surges and meansea level, Clim. Dynam., 42, 121–138, doi:10.1007/s00382-012-1652-1, 2013.
Hallegatte, S., Green, C., Nicholls, R. J., and Corfee-Morlot, J.: Future flood losses in major15
coastal cities, Nature Climate Change, 3, 802–806, doi:10.1038/nclimate1979, 2013.Hanson, S., Nicholls, R., Ranger, N., Hallegatte, S., Corfee-Morlot, J., Herweijer, C., and
Chateau, J.: A global ranking of port cities with high exposure to climate extremes, ClimaticChange, 104, 89–111, doi:10.1007/s10584-010-9977-4, 2010.
Hempel, S., Frieler, K., Warszawski, L., Schewe, J., and Piontek, F.: A trend-preserving bias20
correction – the ISI-MIP approach, Earth Syst. Dynam., 4, 219–236, doi:10.5194/esd-4-219-2013, 2013.
Hendon, H. H.: Indonesian rainfall variability: impacts of ENSO and local air–sea interaction, J.Climate, 16, 1775–1790, doi:10.1175/1520-0442(2003)016<1775:IRVIOE>2.0.CO;2, 2003.
Hulme, M. and Sheard, N.: Climate Change Scenarios for Indonesia, Climatic Research Unit,25
Norwich, UK, 1999.IPCC: Summary for policymakers, in: Climate Change 2007: the Physical Science Basis,
contribution of Working Group I to the Fourth Assessment Report of the IntergovernmentalPanel on Climate Change, edited by: Solomon, S., Qin, D., Manning, M., Chen, Z.,Marquis, M., Averyt, K. B., Tignor, M., and Miller, H. L., Cambridge University Press,30
Cambridge, UK and New York, NY, USA, p. 13, 2007.IPCC: Summary for policymakers, in: Climate Change 2014: Mitigation of Climate Change,
contribution of Working Group III to the Fifth Assessment Report of the Intergovernmental
4459
NHESSD3, 4435–4478, 2015
River flood risk inJakarta under
scenarios of futurechange
Y. Budiyono et al.
Title Page
Abstract Introduction
Conclusions References
Tables Figures
J I
J I
Back Close
Full Screen / Esc
Printer-friendly Version
Interactive Discussion
Discussion
Paper
|D
iscussionP
aper|
Discussion
Paper
|D
iscussionP
aper|
Panel on Climate Change, edited by: Edenhofer, O., Pichs-Madruga, R., Sokona, Y.,Farahani, E., Kadner, S., Seyboth, K., Adler, A., Baum, I., Brunner, S., Eickemeier, P.,Kriemann, B., Savolainen, J., Schlömer, S., von Stechow, C., Zwickel, T., and Minx, J. C.,Cambridge University Press, Cambridge, UK and New York, NY, USA, p. 21, 2014.
JCDS: Jakarta Coastal Defence Strategy: Agenda, JCDS, Jakarta, Indonesia, 2011.5
Jeuken, A., Haasnoot, M., Reeder, T., and Ward, P. J.: Lessons learnt from adaptationplanning in four deltas and coastal cities, Journal of Water and Climate Change,doi:doi:10.2166/wcc.2014.141, online first, 2014.
Jha, A., Bloch, R., and Lamond, J.: Cities and Flooding: a Guide to Integrated Flood RiskManagement for the 21st Century, World Bank, Washington, DC, 2012.10
Jongman, B., Ward, P. J., and Aerts, J. C. J. H.: Global exposure to river andcoastal flooding: long term trends and changes, Global Environ. Chang., 22, 823–835,doi:10.1016/j.gloenvcha.2012.07.004, 2012.
Jongman, B., Winsemius, H. C., Aerts, J. C. J. H., de Perez, E. C., van Aalst, M. K., Kron, W.,and Ward, P. J.: Declining vulnerability to river floods and the global benefits of adaptation,15
P. Natl. Acad. Sci. USA, 112, E2271–E2280, doi:10.1073/pnas.1414439112, 2015.Keef, C., Svensson, C., and Tawn, J. A.: Spatial dependence in extreme river flows and
precipitation for Great Britain, J. Hydrol., 378, 240–252, doi:10.1016/j.jhydrol.2009.09.026,2009.
Kementerian Koordinator Bidang Perekonomian: Draft Master Plan Pengembangan Terpadu20
Pesisir Ibukota Negara (PTPIN), Jakarta, 1 April 2014.Klerk, W. J., Winsemius, H. C., van Verseveld, W. J., Bakker, A. M. R., and Diermanse, F. L. M.:
The co-incidence of storm surges and extreme discharges within the Rhine? Meuse Delta,Environ. Res. Lett., 10, 035005, doi:10.1088/1748-9326/10/3/035005, 2015.
Kreibich, H. and Thieken, A. H.: Coping with floods in the city of Dresden, Germany, Nat.25
Hazards, 51, 423–436, 2009.Kreibich, H., Thieken, A. H., Petrow, Th., Müller, M., and Merz, B.: Flood loss reduction of private
households due to building precautionary measures – lessons learned from the Elbe floodin August 2002, Nat. Hazards Earth Syst. Sci., 5, 117–126, doi:10.5194/nhess-5-117-2005,2005.30
Kreibich, H., Christenberger, S., and Schwarze, R.: Economic motivation of households toundertake private precautionary measures against floods, Nat. Hazards Earth Syst. Sci.,11, 309–321, doi:10.5194/nhess-11-309-2011, 2011.
4460

NHESSD3, 4435–4478, 2015
River flood risk inJakarta under
scenarios of futurechange
Y. Budiyono et al.
Title Page
Abstract Introduction
Conclusions References
Tables Figures
J I
J I
Back Close
Full Screen / Esc
Printer-friendly Version
Interactive Discussion
Discussion
Paper
|D
iscussionP
aper|
Discussion
Paper
|D
iscussionP
aper|
Langbein, W. B.: Annual floods and the partial-duration flood series, EOS Trans. AGU, 30,879–881, doi:10.1029/TR030i006p00879, 1949.
Marfai, M. A., Sekaranom, A. B., and Ward, P.: Community responses and adaptationstrategies toward flood hazard in Jakarta, Indonesia, Nat. Hazards, 75, 1127–1144,doi:10.1007/s11069-014-1365-3, 2014.5
Meehl, G. A., Stocker, T. F., Collins, W. D., Friedlingstein, P., Gaye, A. T., Gregory, J. M.,Kitoh, A., Knutti, R., Murphy, J. M., Noda, A., Raper, S. C. B., Watterson, I. G., Weaver A. J.,and Zhao, Z.-C.: Global climate projections, in: Climate Change 2007: the PhysicalScience Basis, contribution of Working Group I to the Fourth Assessment Report of theIntergovernmental Panel on Climate Change, edited by: Solomon, S., Qin, D., Manning, M.,10
Chen, Z., Marquis, M., Averyt, K. B., Tignor, M., and Miller, H. L., Cambridge University Press,Cambridge, UK and New York, NY, USA, 2007.
Meyer, V., Haase, D., and Scheuer, S.: Flood risk assessment in european river basins –concept, methods, and challenges exemplified at the Mulde River, Integrated EnvironmentalAssessment and Management, 5, 17–26, doi:10.1897/IEAM_2008-031.1, 2008.15
Muis, S., Güneralp, B., Jongman, B., Aerts, J. C. J. H., and Ward, P. J.: Flood risk and adaptationstrategies in Indonesia: a probabilistic analysis using global data, EGU General Assembly2015, Vienna, Austria, 12–17 April 2015, EGU2015-1349, 2015.
Naylor, R. L., Battisti, D. S., Vimont, D. J., Falcon, W. P., and Burke, M. B.: Assessing risks ofclimate variability and climate change for Indonesian rice agriculture, P. Natl. Acad. Sci. USA,20
104, 7752–7757, doi:10.1073/pnas.0701825104, 2007.Noorduyn, J. and Verstappen, H. T.: Purnavarman’s River-Works Near Tugu, Bijdr. Taal-Land-
V., 128, 298–307, 1972.Paeth, H., Scholten, A., Friederichs, P., and Hense, A.: Uncertainties in climate change
prediction: El Niño–Southern Oscillation and monsoons, Global Planet. Change, 60, 265–25
288, doi:10.1016/j.gloplacha.2007.03.002, 2008.PAM Lyonaise Jaya: Annual Report 2011, PAM Lyonaise Jaya, Jakarta, 2012.PDAM Provinsi DKI Jakarta: Pemenuhan Kebutuhan Air Perpipaan Masyarakat
Jakarta, available at: http://bplhd.jakarta.go.id/filing/seminarsdperkotaan2012/PaparanPAMJAYASeminarBPLHD20November2012-kirim.pdf, last access: 4 May 2015,30
2012.Pemda DKI Jakarta: Peraturan Daerah Provinsi Daerah Khusus Ibukota Jakarta Nomor 1 Tahun
2012 tentang Rencana Tata Ruang Wilayah 2030, Jakarta, 2012.
4461

NHESSD3, 4435–4478, 2015
River flood risk inJakarta under
scenarios of futurechange
Y. Budiyono et al.
Title Page
Abstract Introduction
Conclusions References
Tables Figures
J I
J I
Back Close
Full Screen / Esc
Printer-friendly Version
Interactive Discussion
Discussion
Paper
|D
iscussionP
aper|
Discussion
Paper
|D
iscussionP
aper|
Phien-wej, N., Giao, P. H., and Nutalaya, P.: Land subsidence in Bangkok, Thailand, Eng. Geol.,82, 187–201, doi:10.1016/j.enggeo.2005.10.004, 2006.
Poerbandono, P., Julian, M. M., and Ward, P. J.: Assessment of the effects of climate and landcover changes on river discharge and sediment yield, and an adaptive spatial planning in theJakarta region, Nat. Hazards, 73, 507–530, doi:10.1007/s11069-014-1083-x, 2014.5
Poussin, J. K., Bubeck, P., Aerts, J. C. J. H., and Ward, P. J.: Potential of semi-structural andnon-structural adaptation strategies to reduce future flood risk: case study for the Meuse,Nat. Hazards Earth Syst. Sci., 12, 3455–3471, doi:10.5194/nhess-12-3455-2012, 2012.
Qian, J.-H., Robertson, A. W., and Moron, V.: Interactions among ENSO, the monsoon, anddiurnal cycle in rainfall variability over Java, Indonesia, J. Atmos. Sci., 67, 3509–3524,10
doi:10.1175/2010JAS3348.1, 2010.Sagala, S., Lassa, J., Yasaditama, H., and Hudalah, D.: The Evolution of Risk and Vulnerability
in Greater Jakarta: Contesting Government Policy in Dealing with a Megacity’s Exposure toFlooding. An Academic Response to Jakarta Floods in January 2013, IRGSC Working PaperNo. 2, January 2013, Kupang, 2013.15
Scoccimarro, E., Gualdi, S., Bellucci, A., Zampieri, M., and Navarra, A.: Heavy precipitationevents in a warmer climate: results from CMIP5 models, J. Climate, 26, 7902–7911,doi:10.1175/JCLI-D-12-00850.1, 2013.
Steinberg, F.: Jakarta: environmental problems and sustainability, Habitat Int., 31, 354–365,doi:10.1016/j.habitatint.2007.06.002, 2007.20
Svensson, C. and Jones, D. A.: Dependence between sea surge, river flow and precipitation insouth and west Britain, Hydrol. Earth Syst. Sci., 8, 973–992, doi:10.5194/hess-8-973-2004,2004.
Texier, P.: Floods in Jakarta: when the extreme reveals daily structural constraintsand mismanagement, Disaster Prevention and Management, 17, 358–372,25
doi:10.1108/09653560810887284, 2008.Thurston, N., Finlinson, B., Breakspear, R., Williams, N., Shaw, J., and Chatterton, J.:
Developing the Evidence Base for Flood Resistance and Resilience, R&D Summary Report,Joint Defra/EA Flood and Coastal Erosion, London, 2008.
Tokunaga, T.: Groundwater potential in the central district of Tokyo, in: Groundwater30
Management in Asian Cities, edited by: Takizawa, S., Springer Japan, Tokyo, 61–78,available at: http://link.springer.com/chapter/10.1007/978-4-431-78399-2_4, last access: 23April 2015, 2008.
4462

NHESSD3, 4435–4478, 2015
River flood risk inJakarta under
scenarios of futurechange
Y. Budiyono et al.
Title Page
Abstract Introduction
Conclusions References
Tables Figures
J I
J I
Back Close
Full Screen / Esc
Printer-friendly Version
Interactive Discussion
Discussion
Paper
|D
iscussionP
aper|
Discussion
Paper
|D
iscussionP
aper|
Tollenaar, D., Vatvani, D., Brinkman, J. J., and Bons, K.: NCICD – MP: behoeftespecificatieFHM and JCDS basics and specifications, Deltares, Jakarta, 2013.
Tung, H. and Hu, J.-C.: Assessments of serious anthropogenic land subsidence in YunlinCounty of central Taiwan from 1996 to 1999 by Persistent Scatterers InSAR, Tectonophysics,578, 126–135, doi:10.1016/j.tecto.2012.08.009, 2012.5
UNISDR: Global Assessment Report on Disaster Risk Reduction 2011: Revealing Risk,Redefining Development, United Nations International Strategy for Disaster ReductionSecretariat, Geneva, 2011.
UNISDR: Global Assessment Report 2013, UNISDR, Geneva, 2013.van Oldenborgh, G. J., Philip, S. Y., and Collins, M: El Niño in a changing climate: a multi-model10
study, Ocean Sci., 1, 81–95, doi:10.5194/os-1-81-2005, 2005.Ward, P. J., de Moel, H., and Aerts, J. C. J. H.: How are flood risk estimates affected by the
choice of return-periods?, Nat. Hazards Earth Syst. Sci., 11, 3181–3195, doi:10.5194/nhess-11-3181-2011, 2011a.
Ward, P. J., Marfai, M. A., Yulianto, F., Hizbaron, D. R., and Aerts, J. C. J. H.: Coastal inundation15
and damage exposure estimation: a case study for Jakarta, Nat. Hazards, 56, 899–916,doi:10.1007/s11069-010-9599-1, 2011b.
Ward, P. J., Budiyono, Y., and Marfai, M. A.: Flood risk in Jakarta, in: Severe Weather in EasternAsia. Perils, Risks, Insurance, Munich Re Knowledge Series Natural Hazards, edited by:Munich Re, Munich Re, Munich, Germany, 106–107, 2013a.20
Ward, P. J., Pauw, W. P., van Buuren, M. W., and Marfai, M. A.: Governance of flood riskmanagement in a time of climate change: the cases of Jakarta and Rotterdam, Environ.Polit., 22, 518–536, doi:10.1080/09644016.2012.683155, 2013b.
Ward, P. J., Jongman, B., Kummu, M., Dettinger, M. D., Weiland, F. C. S., and Winsemius, H. C.:Strong influence of El Niño Southern Oscillation on flood risk around the world, P. Natl. Acad.25
Sci. USA, 111, 15659–15664, doi:10.1073/pnas.1409822111, 2014a.Ward, P. J., van Pelt, S. C., de Keizer, O., Aerts, J. C. J. H., Beersma, J. J., van
den Hurk, B. J. J. M., and te Linde, A. H.: Including climate change projections inprobabilistic flood risk assessment, Journal of Flood Risk Management, 7, 141–151,doi:10.1111/jfr3.12029, 2014b.30
Weedon, G. P., Gomes, S., Viterbo, P., Shuttleworth, W. J., Blyth, E., Österle, H., Adam, J. C.,Bellouin, N., Boucher, O., and Best, M.: Creation of the WATCH forcing data and its use
4463

NHESSD3, 4435–4478, 2015
River flood risk inJakarta under
scenarios of futurechange
Y. Budiyono et al.
Title Page
Abstract Introduction
Conclusions References
Tables Figures
J I
J I
Back Close
Full Screen / Esc
Printer-friendly Version
Interactive Discussion
Discussion
Paper
|D
iscussionP
aper|
Discussion
Paper
|D
iscussionP
aper|
to assess global and regional reference crop evaporation over land during the twentiethcentury, J. Hydrometeorol., 12, 823–848, doi:10.1175/2011JHM1369.1, 2011.
Wijayanti, P., Tono, T., Hastuti, H., and Pramudita, D.: Estimation of River Flood Damagein Jakarta: the Case of Pesanggrahan River, Economy and Environment Program forSoutheast Asia (EEPSEA), Penang, available at: http://www.eepsea.org/o-k2/view-item/5
id-493/Itemid-192/ (last access: 13 May 2015), 2015.Winsemius, H. C., Van Beek, L. P. H., Jongman, B., Ward, P. J., and Bouwman, A.: A
framework for global river flood risk assessments, Hydrol. Earth Syst. Sci., 17, 1871–1892,doi:10.5194/hess-17-1871-2013, 2013.
Zhang, D., Song, C., and Chen, L.: Numerical evaluation of land subsidence induced by10
dewatering in deep foundation pit, Journal of Shanghai Jiaotong University (Science), 18,278–283, doi:10.1007/s12204-013-1394-1, 2013.
4464

NHESSD3, 4435–4478, 2015
River flood risk inJakarta under
scenarios of futurechange
Y. Budiyono et al.
Title Page
Abstract Introduction
Conclusions References
Tables Figures
J I
J I
Back Close
Full Screen / Esc
Printer-friendly Version
Interactive Discussion
Discussion
Paper
|D
iscussionP
aper|
Discussion
Paper
|D
iscussionP
aper|
Table 1. Area per land use class compared to total area of Jakarta (%) for the land use map2002 and the land use plan 2030. Several of the original land use classes were reclassed asper the notes under the table.
No Land use class name 2002 2030
1 Agriculture and open spacea 18.65 14.172 Residentialb 57.85 57.613 Swamp river and pond 3.61 1.004 Industry and warehouse 7.06 8.875 Commercial and business 8.28 16.466 Government facilityc 4.53 1.987 Forestry 0.01 0.33
Total 100.00 100.00
a Merge of “Agriculture” and “Agriculture and open space” in both theland use map 2002 and 2030.b Merge of “High density urban kampong”, “Low density urbankampong” and “Planned house” in land use 2002; and merge of“Residential” and “Residential with greenery” in land use plan 2030.c Merge of “Government facility”, “Education and public facility”, and“Transportation facility” in Landuse 2002; merge of “Governmentfacility”, and “Transportation facility in Landuse plan 2030, while landuse class “Education and public facility” does not exist.
4465

NHESSD3, 4435–4478, 2015
River flood risk inJakarta under
scenarios of futurechange
Y. Budiyono et al.
Title Page
Abstract Introduction
Conclusions References
Tables Figures
J I
J I
Back Close
Full Screen / Esc
Printer-friendly Version
Interactive Discussion
Discussion
Paper
|D
iscussionP
aper|
Discussion
Paper
|D
iscussionP
aper|
Table 2. Maximum economic exposure values per land use class, using an exchange rate ofUSD 1= IDR 9654.
No Land use class name New maximum economic exposure value(thousand USD per hectare)a
1 Government facilitya 301.02 Forestry 10.43 Industry and warehouse 517.94 Commercial and business 517.95 Residentialb 150.66 Residential with greeneryc 341.87 Agriculture 1.68 Swamp river and pond 3.89 Agriculture and open space 3.1
a Area-weighted average of land use classes “Education and public facility” and “Governmentfacility” in land use map 2002.b Area-weighted average of land use classes “High density urban kampung” and “Low density urbankampung” in land use map 2002.c Land use class “Planned house” in land use map 2002.
4466

NHESSD3, 4435–4478, 2015
River flood risk inJakarta under
scenarios of futurechange
Y. Budiyono et al.
Title Page
Abstract Introduction
Conclusions References
Tables Figures
J I
J I
Back Close
Full Screen / Esc
Printer-friendly Version
Interactive Discussion
Discussion
Paper
|D
iscussionP
aper|
Discussion
Paper
|D
iscussionP
aper|
Table 3. Median and standard deviation of precipitation multiplication between the 5 GCMs foreach RCP scenario in 2030 and 2050.
Median Standard deviation
2030RCP 2.6 0.79 0.33RCP 4.5 0.76 0.47RCP 6.0 0.79 0.51RCP 8.5 0.85 0.49
2050RCP 2.6 0.79 0.32RCP 4.5 0.82 0.48RCP 6.0 0.79 0.56RCP 8.5 0.96 0.58
4467

NHESSD3, 4435–4478, 2015
River flood risk inJakarta under
scenarios of futurechange
Y. Budiyono et al.
Title Page
Abstract Introduction
Conclusions References
Tables Figures
J I
J I
Back Close
Full Screen / Esc
Printer-friendly Version
Interactive Discussion
Discussion
Paper
|D
iscussionP
aper|
Discussion
Paper
|D
iscussionP
aper|
Table 4. Median and standard deviation of flood risk (million USD) between the 5 GCMs, foreach RCP in 2030 and 2050.
Low SLR High SLR
Median Standard deviation Median Standard deviation
2030RCP 2.6 118.0 51.8 152.4 47.1RCP 4.5 112.0 80.6 147.1 75.5RCP 6.0 118.3 85.1 152.6 79.1RCP 8.5 127.0 82.6 160.4 77.7
2050RCP 2.6 118.1 48.5 152.5 43.9RCP 4.5 121.8 83.5 155.7 78.6RCP 6.0 118.6 97.8 152.9 93.7RCP 8.5 148.0 102.2 179.1 98.5
4468

NHESSD3, 4435–4478, 2015
River flood risk inJakarta under
scenarios of futurechange
Y. Budiyono et al.
Title Page
Abstract Introduction
Conclusions References
Tables Figures
J I
J I
Back Close
Full Screen / Esc
Printer-friendly Version
Interactive Discussion
Discussion
Paper
|D
iscussionP
aper|
Discussion
Paper
|D
iscussionP
aper|
Table 5. Percentage of total inundated area and total flood damage found in each land usecategory. Results are shown here for a 5 year flood return period and for current land use andland use in 2030.
Current land use 2030 land use
Land use class Inundated area Flood damage Inundated area Flood damage(% of total) (% of total) (% of total) (% of total)
Government facility 3.0 4.9 0.0 0.1Forestry 0.0 0.0 0.0 0.0Industry and warehouse 16.8 52.2 17.3 46.6Commercial and business 6.1 19.5 10.6 30.8Residentials 30.0 11.4 58.0 19.1Residentials with greenery 30.2 9.3 1.6 1.2Agriculture 10.4 1.9 0.0 0.0Swamp river and pond 2.4 0.5 0.5 0.1Agriculture and open space 1.2 0.4 12.0 2.2
4469

NHESSD3, 4435–4478, 2015
River flood risk inJakarta under
scenarios of futurechange
Y. Budiyono et al.
Title Page
Abstract Introduction
Conclusions References
Tables Figures
J I
J I
Back Close
Full Screen / Esc
Printer-friendly Version
Interactive Discussion
Discussion
Paper
|D
iscussionP
aper|
Discussion
Paper
|D
iscussionP
aper|
Table 6. Flood risk (annual expected damage) in 2030 for different risk drivers, and percentagechange in risk compared to baseline.
Scenarios Flood risk (million USD) Percent change
Baseline 143 N.A.Baseline + change of precipitation 138 (median) −4 %
88–302 (5th–95th percentiles) −38 to +197 %Baseline + sea level rise 162 (mean) +13
151–172 +6 to +21 %Baseline + change of land use 163 +15%Baseline + land subsidence 391 +173%Baseline + all future changes combined 519 (median) +263%
426–624 (5th–95th percentiles) +189 to +336 %
4470

NHESSD3, 4435–4478, 2015
River flood risk inJakarta under
scenarios of futurechange
Y. Budiyono et al.
Title Page
Abstract Introduction
Conclusions References
Tables Figures
J I
J I
Back Close
Full Screen / Esc
Printer-friendly Version
Interactive Discussion
Discussion
Paper
|D
iscussionP
aper|
Discussion
Paper
|D
iscussionP
aper|
Figure 1. Framework of analysis.
4471

NHESSD3, 4435–4478, 2015
River flood risk inJakarta under
scenarios of futurechange
Y. Budiyono et al.
Title Page
Abstract Introduction
Conclusions References
Tables Figures
J I
J I
Back Close
Full Screen / Esc
Printer-friendly Version
Interactive Discussion
Discussion
Paper
|D
iscussionP
aper|
Discussion
Paper
|D
iscussionP
aper|
Figure 2. Spatial distribution of projected total land subsidence over the period 2012–2025.
4472

NHESSD3, 4435–4478, 2015
River flood risk inJakarta under
scenarios of futurechange
Y. Budiyono et al.
Title Page
Abstract Introduction
Conclusions References
Tables Figures
J I
J I
Back Close
Full Screen / Esc
Printer-friendly Version
Interactive Discussion
Discussion
Paper
|D
iscussionP
aper|
Discussion
Paper
|D
iscussionP
aper|
Figure 3. Vulnerability curves used in this study for each land use map plan 2030.
4473
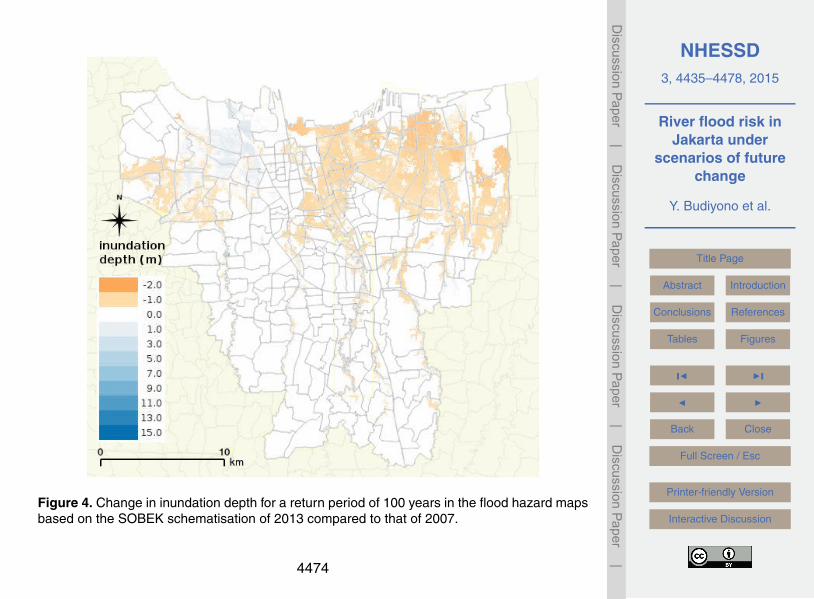
NHESSD3, 4435–4478, 2015
River flood risk inJakarta under
scenarios of futurechange
Y. Budiyono et al.
Title Page
Abstract Introduction
Conclusions References
Tables Figures
J I
J I
Back Close
Full Screen / Esc
Printer-friendly Version
Interactive Discussion
Discussion
Paper
|D
iscussionP
aper|
Discussion
Paper
|D
iscussionP
aper|
Figure 4. Change in inundation depth for a return period of 100 years in the flood hazard mapsbased on the SOBEK schematisation of 2013 compared to that of 2007.
4474

NHESSD3, 4435–4478, 2015
River flood risk inJakarta under
scenarios of futurechange
Y. Budiyono et al.
Title Page
Abstract Introduction
Conclusions References
Tables Figures
J I
J I
Back Close
Full Screen / Esc
Printer-friendly Version
Interactive Discussion
Discussion
Paper
|D
iscussionP
aper|
Discussion
Paper
|D
iscussionP
aper|
Figure 5. Maps showing Kelurahan (village administration units) in which part of the villageadministration unit was reported to be inundated in the (a) 2007 and (b) 2013 floods.These maps are reported to the National Disaster Management Office (BNPB) by the villageadministrator. The estimated return periods of the flood events in 2007 and 2013 are 50 and30 respectively. Underneath, the inundation maps from the SOBEK model are shown basedon: (c) 2007 schematisation and a return period of 50 years; and (d) 2013 schematisation anda return period of 25 years.
4475

NHESSD3, 4435–4478, 2015
River flood risk inJakarta under
scenarios of futurechange
Y. Budiyono et al.
Title Page
Abstract Introduction
Conclusions References
Tables Figures
J I
J I
Back Close
Full Screen / Esc
Printer-friendly Version
Interactive Discussion
Discussion
Paper
|D
iscussionP
aper|
Discussion
Paper
|D
iscussionP
aper|
Figure 6. Box and whisker plots showing the distributions of precipitation factors (where a factorof “1” equals baseline conditions) for extreme 1 day precipitation for several return periods,ranging from 1 to 100 years. The results are shown for 2030 and 2050. The results are based on5 GCMs and 4 RCPs. The boxplots show the median values for the 20 GCM-RCP combinations(red lines); the 25th and 75th percentiles (top and bottom of boxes); and the range (whiskers).Outliers as shown as “+”.
4476

NHESSD3, 4435–4478, 2015
River flood risk inJakarta under
scenarios of futurechange
Y. Budiyono et al.
Title Page
Abstract Introduction
Conclusions References
Tables Figures
J I
J I
Back Close
Full Screen / Esc
Printer-friendly Version
Interactive Discussion
Discussion
Paper
|D
iscussionP
aper|
Discussion
Paper
|D
iscussionP
aper|
Figure 7. Increase of damage per grid cell at return period 100 between current and 2007 mapdue to land subsidence alone.
4477

NHESSD3, 4435–4478, 2015
River flood risk inJakarta under
scenarios of futurechange
Y. Budiyono et al.
Title Page
Abstract Introduction
Conclusions References
Tables Figures
J I
J I
Back Close
Full Screen / Esc
Printer-friendly Version
Interactive Discussion
Discussion
Paper
|D
iscussionP
aper|
Discussion
Paper
|D
iscussionP
aper|
Figure 8. Probability distribution function (PDFs) of future flood risk in Jakarta under differentscenarios. The black vertical dashed line shows risk associated with current conditions (USD143 million p.a.). The PDFs are obtained by applying a two-parameter gamma distributionto simulated risk values from 5 GCMs and 4 RCP emission scenarios. PDFs are shown fordifferent combinations of the following scenarios: (a) subsidence and no subsidence; (b) landuse under baseline conditions (LU2002) and under the land use plan for 2030 (LU2030); and(c) high or low sea level rise (SLR).
4478