riverside: a private equity acquisition
TRANSCRIPT

RIVERSIDE: A PRIVATE EQUITY
ACQUISITION
Authors: Vanessa Cardona and Jascha Siemering
Master’s Thesis tutor: Martí Sagarra
Date: 05.07.2020

1
ABSTRACT
Private equity (PE) boomed in the 2000’s, aligned with an increase in their debt levels.
Traditionally, PE firms bought target companies using mostly debt to create short term growth
and sell profitably. Nowadays, some PE firms transform their targets to create sustainable value.
Yet, little work is published on leveraged buyouts (LBO) in the middle market with sustainable
value creation for the target. The objective of this work is therefore to develop a real-world case
study analyzing if a PE acquisition with LBO in the middle market fits the fund’s strategy for
sustainable growth. This single case study was developed in Spain using qualitative and
quantitative research conducted in 2020. The case studies the successful 2015 investment of the
American PE firm Riverside in Euromed, a Spanish herbal extracts manufacturer. It shows that
PE can benefit from sustainable improvement of a target company if all steps of an investment
decision-making process are executed rigorously.
Keywords: Private equity, Leveraged buyout, Middle market, Growth, Business valuation
PLAGERISM STATEMENT
The content of this document is the sole responsibility of the authors, who declare that they
have not committed plagiarism and that all references to the work of other authors have been
correctly cited in the text.
2
INDEX
INTRODUCTION .............................................................................................................. 4
PRESENTATION OF THE CONTEXT ............................................................................ 6
METHODOLOGY ............................................................................................................. 7
Qualitative Methods ................................................................................................... 8
Quantitative Methods ................................................................................................. 9
Data Analysis and Interpretation .............................................................................. 11
PRESENTATION OF THE CASE ................................................................................... 11
Background .............................................................................................................. 12
Sectoral Information ................................................................................................. 13
4.2.1. Market Definition & Application ..................................................................... 13
4.2.2. Market Size ...................................................................................................... 14
4.2.3. Market Drivers ................................................................................................. 15
4.2.4. Market Opportunities ....................................................................................... 15
4.2.5. Key Market Challenges & Risks ...................................................................... 15
4.2.6. Competitive Landscape .................................................................................... 16
4.2.7. Target Market: Herbal / Traditional Products .................................................. 18
The Target Company: Euromed in 2015 .................................................................. 19
4.3.1. The Business: Products, Sales & Customers .................................................... 19
4.3.2. Production and Operation................................................................................. 20
4.3.3. Management and Personnel ............................................................................. 22
4.3.4. Strategy............................................................................................................. 22
The Seller: Meda in 2015 ......................................................................................... 25
4.4.1. Ownership History ........................................................................................... 25
4.4.2. Current Owner & Reason for Divestment ........................................................ 25
The Buyer: Riverside in 2015 .................................................................................. 26
4.5.1. General Overview of Riverside in 2015 ........................................................... 26
4.5.2. Risks of the Acquisition ................................................................................... 27
4.5.3. Riverside’s Plans for Acquisition ..................................................................... 28
4.5.4. Valuation Process ............................................................................................. 29
4.5.5. Funding............................................................................................................. 30
RESULTS ......................................................................................................................... 31
3
Strategic Fit .............................................................................................................. 31
Historic P&L and Balance Sheet Analysis ............................................................... 32
5.2.1. P&L Analysis ................................................................................................... 33
5.2.2. Balance Sheet Analysis .................................................................................... 34
5.2.3. Business Analysis and Risks ............................................................................ 36
Forecast Analysis ..................................................................................................... 37
5.3.1. P&L Forecast Analysis..................................................................................... 37
5.3.2. Balance Sheet Forecast Analysis...................................................................... 39
Profitability Analysis................................................................................................ 40
5.4.1. Valuation with EBITDA multiple .................................................................... 40
5.4.2. DCF Valuation and expected IRR .................................................................... 41
5.4.3. Value for the Seller .......................................................................................... 42
Negotiation ............................................................................................................... 42
Risk Analysis............................................................................................................ 43
CONCLUSION ................................................................................................................. 45
REFERENCES ......................................................................................................................... 48
ANNEXES ............................................................................................................................... 53
Annex A: In-Depth Interview with Rafael Álvarez-Nóvoa Moderation Guide Topics ....... 53
Annex B: In-Depth Interview with Xavier Roig Moderation Guide Topics ........................ 54
Annex C: P&L from 2011-2015 ........................................................................................... 55
Annex D: Balance Sheet from 2011-2015 ............................................................................ 56
Annex E: Short Balance Sheet from 2011-2015 .................................................................. 56
Annex F: P&L Main Items Definition .................................................................................. 56
Annex G: Balance Sheet Main Items Definition .................................................................. 57
Annex H: Main Assumptions for P&L Forecast .................................................................. 58
Annex I: Main Assumptions for Balance Sheet Forecast ..................................................... 60
Annex J: P&L Forecast......................................................................................................... 62
Annex K: Balance Sheet Forecast ........................................................................................ 63
Annex L: Multiples of Euromed’s comparable companies .................................................. 64
Annex M: DCF Valuation of Euromed Buyer’s Perspective ............................................... 64
Annex N: DCF Valuation of Euromed Seller’s Perspective ................................................ 64
4
INTRODUCTION
The private equity industry received a lot of attention starting in the 1980’s due to its high level
of success, attaining its boom just before the 2008 financial crisis. Between 2006 and 2008,
global private equity firms raised about €2 trillion of capital. Private equity (PE) is an alternate
source of investment capital that is not listed in a public exchange (Segal, 2020). A PE firm is
an organization that raises funds from high-net-worth individuals and institutions to finance
transactions of buying and selling companies in a preset amount of years at a target profit
through an exit strategy (Barber & Goold, 2007). PE executions vary from leveraged buyouts
(LBO), using a combination of debt and equity to fund a transaction, to venture capital (VC),
investing equity in a young company (Chen, 2020b). Nonetheless, the boom years of PE firms
aligned with increase in their debt levels (Chen, 2020b), showing the contribution of LBO for
PE success. However, PE success is not just about using debt in acquisitions in order to
maximize returns. Consequently, it is important to understand how PE works and makes profit.
There are two ways PE firms make their money. First, a PE firm usually charges investors a
2% annual management fee of assets managed. Second, PE firms require approximately 20%
of all the fund’s profits from selling companies in their portfolio (Chen, 2020b). Most of such
transactions happen in the middle ($50 million-$500 million) to lower-middle market ($10
million-$50 million). A common exit strategy is to sustainably improve a middle market
company in order to sell it at a large profit to a large corporation. Given that the middle market
has more sellers than buyers, a PE can acquire a target company at optimum price for a higher
return (Segal, 2020). Finally, each fund will have specific criteria required for the investment,
such as investment amount, which the PE firm must follow for its success (Barber & Goold,
2007). Even with funds of trillions of euro under PE management (Segal, 2020), there are
debates on the advantages and disadvantages of PE.
The concept of PE offers several advantages for both target companies and investors. First, one
of the greatest advantages for target companies is the access to liquidity as alternative to high
interest bank loans. Liquidity and know-how for fast development and high growth is an
advantage for every company receiving PE investments (GoCardless, n.d.). Second, good PE
firms add sustainable value by executing excellent financial controls and enhancing
performance including revenue, margin and cash flow. Furthermore, they improve governance
structures by undertaking the roles of corporate managers and boards of directors to allow fast
decision making. Additionally, PE firms generally have more freedom on how to use investor’s
money than regulated public companies due to their structure as private partnership (Barber &
Goold, 2007). Third, by asking top managers of the target company to personally invest in their
portfolios, PE firms assure the management’s commitment. Possible large rewards due to a
profitable sale at the end of the ownership make top management work more motivated. Finally,
the business model of PE with use of debt and flexible exit strategies gives the investing
company financing and tax advantages (Barber & Goold, 2007).

5
The following disadvantages can be considered criticisms of PE. First, it can be difficult to
liquidate an investment increasing the risk on returns for investors (Chen, 2020b). PE firms
often face the difficulty to find a buyer after the time of investment. Since the value has already
been increased there is often little potential for further growth of the target company, making it
less attractive to buyers (GoCardless, n.d.). Moreover, there is no “ready-made order book”
matching buyers with sellers. So, the PE firm must search actively for a buyer to sell the target
company (Chen, 2020b). Second, critics claim that PE is just about asset stripping and seeking
profit for the PE firm (Barber & Goold, 2007) even if the target company continues to struggle
financially when a LBO has left a heavy debt burden (Segal, 2020). Third, in order to execute
a successful investment, a PE firm must have the following skills identified by Barber and
Goold (2007) which are hard to find and replicate in every transaction. To start, PE firms must
dedicate enough capacity to proactively search for a good target with improvement
opportunities. Additionally, the success of PE is very limited if it is not able to put together a
professional, highly motivated executive team inside the target company and identify few
strategic levers to improve the company’s performance. Last, managing a good balance between
acquisitions and disposals is required. PE firms should already develop a profitable exit strategy
during the acquisition process, which then gets adapted during the time of the project.
The arguments against PE are rooted in lack of research, plan for sustainable operation
improvement and profitable exit strategy during the investment decision-making process for
value creation. We believe that PE can generate and benefit from sustainable improvement of
target companies if the main steps for a PE investment decision-making process are executed
rigorously and with professionalism. Due to the great supply and little demand for good middle
market companies to buy, we see further potential for PE to create sustainable growth in the
middle market. Case studies that improve business judgement for investment decision-making
processes generating sustainable growth can better prepare future fund managers for successful
investments. The objective of this work is therefore to develop a real-world case study that
analyzes in-depth if a private equity acquisition in the middle market fits the fund’s strategy for
sustainable growth, applying an LBO model with returns and risks. To develop this case, we
analyzed Riverside’s investment in Euromed, a producer of herbal extracts in Spain. Riverside,
an American PE, created sustainable growth by improving R&D, enhancing management and
international sales team and by completing an add-on acquisition. These actions resulted in
doubled earnings and about 30% increase in production capacity. Two years ahead of schedule,
Riverside sold Euromed in a trade sale exit strategy to Dermapharma at a great return for
investors (The Riverside Company, 2019). Riverside was selected as a single case study
because it is a success story of how a PE using LBO in the middle market can create sustainable
growth for a target company at a high return for investors. The case study guides the reader
through the context and analysis of a real-life situation so that he or she can comprehend the
reasons under the decisions made. Thus, it will serve as a learning tool to hone the business
skills needed to successfully execute the decision-making process of a PE investment using
LBO for sustainable growth.
6
PRESENTATION OF THE CONTEXT
As pioneers of teaching with case studies, Harvard Business School Publishing (HBSP)
provides over 20.000 business cases from more than 50 prominent institutes around the world
(Harvard Business School Publishing, n.d.). Emerald Case Studies is another source for case
studies that has over 1.000 teaching cases across different business and management subjects
(Emerald Insights, 2020). Even though most private equity transactions occur in the middle
market (Segal, 2020), most case studies found in both HBSP and Emerald Insights Case Studies
focus on large buyouts (Chaplinsky, Oppenheimer, & Patra, 2017; Raviv, Feuer, Mehrotra, &
Rossman, 2017; Smith, Halperin, & Friedman, 2017; Stowell & Rainor, 2017). Large buyouts
constitute transactions larger than $500 million (Segal, 2020). Furthermore, private equity’s
new phase is to create sustainable value rather than just create short-term value (Ulrich & Allen,
2016). Yet, most of the identified LBO cases focus on short-term value creation and heavy use
of debt transferred to the target company as exemplified in the Stowell & Rainor (2017) and
Smith, Halperin, & Friedman (2017) cases. The heavy use of debt on target company’s in these
cases led to financial distress of the target company after the PE firm exits the investment. The
few cases in the middle market use alternate forms of financing or focus in emerging markets
(Ruback & Yudkoff, 2011; Quian Peng & Chow, 2013; Palepu, Khanna, & Bullock, 2007;
Harris & Gaede, 2009; Rhodes-Kropf & Burbank, 2013; Loutskina, Sinha, & Ransler, 2010).
The literature review on published teaching case studies shows that little work has been
published on LBO transaction at the middle market with sustainable value creation for the target
company.
The cases retrieved from Emerald Insights (2020), generally from the United States of America
(USA), provided evidence that existing works focus on large buyouts (Chaplinsky,
Oppenheimer, & Patra, 2017; Raviv, Feuer, Mehrotra, & Rossman, 2017; Smith, Halperin, &
Friedman, 2017; Stowell & Rainor, 2017). The cases “Toys “R” Us LBO” and “The
Restructuring of Danfurn LLC” are examples of LBOs ending in financial distress due to the
large amount of debt transferred to the target company and lack of long-term value creation
(Smith, Halperin, & Friedman, 2017; Stowell & Rainor, 2017). The purpose of the cases
developed by Raviv, A., Feuer, R.N., Mehrotra, P. and Rossmann, P. (2017) and Stowell &
Rainor, (2017) is to illustrate and practice valuation methods used in an LBO which include
risk and return analysis such as the ones presented in this case using IRR and multiples.
While over 600 case studies focusing on private equity can be found in HBSP, only six focus
on investments in the middle market. These analyzed cases take place in the USA and in
emerging economies (Ruback & Yudkoff, 2011; Quian Peng & Chow, 2013; Palepu, Khanna,
& Bullock, 2007; Harris & Gaede, 2009; Rhodes-Kropf & Burbank, 2013; Loutskina, Sinha, &
Ransler, 2010). The case studies “Gemini Investors”, “Cathay Capital: An Entrepreneurial
Private Equity Fund with a Cross-Border Investment Model” and “Blue River Capital” focus
on the analysis of successful business strategies of PE firms, rather than sustainable
improvement of target companies’ businesses (Ruback & Yudkoff, 2011; Quian Peng & Chow,
2013; Palepu, Khanna, & Bullock, 2007). Both “Cathay Capital” and “Blue River Capital”
additionally analyze unique challenges faced by PE firms working in emerging markets.

7
“Lonestar Graphite” sets its focus on the introduction of PE to students to develop a business
valuation for the first time (Harris & Gaede, 2009). But the large use of debt mentioned in the
case to finance possible investments indicates no sustainable growth strategy for the target
company. Although the case “Brazos Partners and the Tri-Northern Exit” analyzes a middle-
market leveraged buyout group, it’s purpose is the development of a successful exit strategy
and to take a decision on when to exit from an investment (Rhodes-Kropf & Burbank, 2013).
The most suitable case found in HBSP to learn how to develop a sustainable growth strategy
for a target company is “Husk Power Systems: Financing Expansion”. The objective is to
“evaluate how and why the proposed financing structure fits the current stage of the company’s
development” (Loutskina, Sinha, & Ransler, 2010). However, taking into consideration the
small investment size needed by the target company the case focuses on the development of a
start-up in an emerging economy. Moreover, the financing structure offered by the PE firm in
this case is not a leveraged buyout, but a short-term debt in form of a convertible note
(Loutskina, Sinha, & Ransler, 2010).
Thus, there is a need for case studies that focus on the development of business skills and
judgements for an investment decision in the middle market, using LBO with the purpose to
create sustainable growth. The original contribution of this work is a case study of sustainable
value creation measures successfully implemented by a private equity firm for an investment
decision in the middle market. Moreover, the investment is between USA and Spain in an
established industry. The information presented in this case allows to answer the key questions
for a private equity investment decision (Martínez, 2012):
• What is the PE investing in?
• Why should the PE make the investment?
• What does the PE intend to do with the target company to obtain a return on investment?
• What is the expected return and price to get that return?
• What are the quantified risks in the investment?
METHODOLOGY
This work uses a single case study design as a research method. A single case study is suitable
when the research explains a current event and traces a process over time (Ying, 2017). The
case study describes the business situation set in 2015 of a private equity’s decision-making
process to acquire a target company. The companies analyzed for this case study were
Riverside, the PE firm, and Euromed, the target company. Riverside’s investment in Euromed
was selected as a single case study because it is a success story of how a PE using LBO in the
middle market can create sustainable growth for a target company at a high return for investors.
The aim of the case study is to perform an in-depth analysis of a real-world situation and identify
the problem in order to serve as a learning tool on private equity investment decisions.
Subsequently, different valuation scenarios are evaluated, and a viable action plan is proposed
from this analysis. Different methods were used to develop the case study, described as follows.
8
Qualitative Methods
Qualitative research was conducted to understand and obtain the necessary information to
present the context, business situation, problem and the decision that had to be made in the case.
Both primary and secondary sources were used. Primary research consisted of two face-to-face
in-depth interviews via a video conference platform. Both interviews were conducted separately
to avoid bias in the answers of each respondent; the presence of the other interviewee could
influence their openness. Eduardo Martínez Abascal, professor of Financial Management at
IESE Business School, served as moderator for the first interview. Martínez Abascal has
developed over 90 different publications of teaching material including case studies, teaching
notes and technical notes. Given his vast expertise, he contributed to this case study as a
consultant for its development. The second interview was moderated by Martí Sagarra,
professor of Multinational Finance at the University of Barcelona (UB). He served as supervisor
for this case study. In both interviews, with top management of Riverside and Euromed,
seniority was considered for selection of the moderator. Both authors of this paper assisted the
video conferences and took turns asking questions to probe main topics. An in-depth interview
guideline with main topics of discussions was elaborated before each interview and shared with
each respective respondent to help them prepare for the interview (see Annex A and Annex B).
Each interview lasted about two hours. Video was enabled through an online platform to build
rapport with the respondents. Due to confidentiality issues, recording these sessions was not
authorized by the respondents. However, minutes of the interviews were taken by the two
authors of this paper using the interview guide form, which were later compared to validate
information and consolidated. The minutes were used as reference in the development of the
case study to ensure the accuracy of the information presented.
The first interview was conducted April 13th, 2020 with Rafael Álvarez-Nóvoa, a Riverside
Partner in the transacting team based in Spain. He executed the transaction process of acquiring
Euromed for the private equity firm. Álvarez-Nóvoa found Euromed in Spain when looking for
new investments in the ingredients industry, two years before the acquisition process began. He
was a key player in identifying investment opportunity and determining if the investment was
aligned with the fund’s strategy. The second interview took place on April 28th, 2020 with
Xavier Roig, CEO of Euromed, the target company. Although Roig was not directly involved
in the transaction, given that the seller was Meda AB, Euromed’s parent company at the time,
he was influential in the success of the transaction. Top management is directly accountable for
the implementation of the private equity’s sustainable growth plan and influential in the seller’s
decision. Additionally, as CEO of Euromed, he was able to provide in-depth insight of
Euromed’s business model, crucial to determine compliance with the fund’s investment criteria
and financial analysis.
Secondary research consisted of gathering published material on the internet of both companies
and the acquisition to validate and complement the information provided during the interviews.
Information validated and complimented with further detail from public sources included
product lists, product usage and benefits, production process and sales growth. Published

9
material included the company’s websites, articles and databases with descriptions of the
companies and the acquisition.
Quantitative Methods
Quantitative research allowed for an in-depth financial analysis of the valuation, price proposal
and acquisition of the target company. In general, a company’s value can be different for
different buyers or even between buyer and seller. The value of a company is not the same as
the price, which is the amount agreed between buyer and seller. There are different methods for
valuating a company (Martínez, 2012). According to Álvarez-Nóvoa (2020), discounted cash
flow (DCF) and earnings before interest, taxes, depreciation and amortization (EBITDA)
multiple were the two main valuation methods used by Riverside for the acquisition of
Euromed. These two methods were recreated and executed for this case study. Secondary
sources (Sabi database and Mercantile Registry) were used to retrieve financial data of the target
company including historic Balance Sheet and Profit and Loss Statements (P&L) (see Annex
C and Annex D). Data analysis up to the date of the acquisition in December 2015 was
completed. P&L data analysis included:
• Size of sales, growth and evolution: Used to determine if they were positive, negative or
stagnant. The size of sales also indicated the size of the business. Sales growth was
indicative of the business’s potential.
• Gross margin as percentage of sales, evolution and analysis: Margin size can bring insight
on market competition (e.g. large margin can indicate that there is little competition
(Martínez, 2012)).
• Operation expenses (Opex) and its evolution analysis: A comparison of Opex with gross
margin gives insights on lack of profitability (if that were the case) (Martínez, 2012).
• Profitability analysis: Used to identify net income amount and evolution of other indicators
such as return on sales (ROS), return on equity (ROE) and debt. This provided
understanding on whether Euromed made enough money to cover its debt and make new
investments (Martínez, 2012).
The P&L analysis answered if the target company made money and was profitable.
Analysis of the Balance Sheet included:
• Evaluation of need of funds for operation (NFO): These are the funds required to finance
the operations of a company. It gave insights on the company’s strategy and were it is
investing its funds (Martínez, 2012).
• Analysis of investment in fixed assets and impact in sales: It provided insights on the
company’s strategy and were it is investing its funds in the long term (Martínez, 2012).
• Debt analysis: Indicated inflow or outflow of funds.
• Evolution of working capital (WC): An assessment of NFO with regards to WC indicated
if NFO had increased, WC had decreased or both (Martínez, 2012).
Analysis of the Balance Sheet provided diagnosis of any problems in the company.

10
Financial statements analysis was then combined with Riverside’s investment plan to formulate
assumptions (see Annex H and Annex I) used to create a Balance Sheet and P&L forecast for
the 5-year duration of the investment. This is what we called our base scenario. Based on the
elaborated P&L and Balance Sheet forecasts, a DCF valuation analysis of Euromed, using cash
flow for the shareholder, was carried out. DCF are generally the most suitable method to valuate
a company because it determines the investments rate of return at a given initial price paid for
the target company. It consists of discounting the future cash flows given that the value of a
company comes from its capacity to generate cash (Martínez, 2012). Thus, the DCF analysis
tries to determine the value of an investment today based on the forecast of how much money
it is expected to make in the future (Chen, 2020a). In an investment project, such as the one
presented in this case, the acquirer needs to know how much money they get to keep. The cash
flow for the shareholder is the cash surplus after everything, including investments, taxes and
debt, has been paid. So, cash flow for shareholder is used to calculate the return an investor can
expect (Martínez, 2012). Cash flow for shareholder was calculated using the following method:
± Variation of net assets (NA): NA of last year – NA of this year
± Variation of debt: Debt of last year – debt of this year
+ Net income of current year
The calculation was applied to each year of forecast, starting from year of transaction (2015),
up to the year of exit (2020).
We also calculated risk using the DCF method. Risk is the variability in expected profits due to
changes in cash flow (Martínez, 2012). For this, we made hypothesis on variations that can
occur in our assumptions to simulate a worst-case scenario, in which all the negative variations
occur at once, and a best-case scenario, in which all the positive variations occur at once. We
repeated the DCF analysis for each scenario to quantify risk. Finally, the DCF analysis also
allows to determine the success of the exit strategy (selling Euromed for a profit after the 5-
year investment) under all three scenarios (best, base and worst) by measuring the return of the
investment project. This internal rate of return (IRR) is measured in Excel using the function
“IRR ()”. A second valuation analysis was made using industry multiples of EBITDA. A
valuation with multiples tries to determine the value of a company based on the size of an
indicator from the company’s income statement, such as EBITDA. The steps used for the
valuation using EBITDA multiple is detailed below (Martínez, 2012):
• Determined comparable companies based on industry, size, profitability and that have been
recently purchased (we considered last 10 years).
• Identified EBITDA multiple at which comparable companies were purchased and
calculated average and median. We increased and decreased multiple based on negotiation
range required detailed in results section 5.4.1.
• Multiplied EBITA multiples average by Euromed’s EBITDA in 2015 to obtain enterprise
value (EV).
• Subtracted debt and added cash surplus of that year to EV.

11
Since valuation with multiples requires acquisitions of comparable companies, they are used
when a buyer wants a valuation based on market behavior. Comparable companies were
determined from the interview with Rafael Álvarez-Nóvoa. Criteria for comparable companies
are detailed in the Valuation Process section 4.5.4. The multiple provides the price that should
be paid for the company and should be compared with results from DCF method (Martínez,
2012). In summary, the two valuation methods chosen, DCF and EBITDA multiple, allow to
valuate a company based on two perspectives: company’s performance using DCF and market
behavior using multiples to determine an initial price proposal.
Data Analysis and Interpretation
The results of the case study present the necessary analyses (steps) for a successful private
equity acquisition as a learning tool to enhance the skills and business judgment in similar
business situation. The analysis includes the target company’s compliance with Riverside’s
investment criteria. The criteria were provided by Rafael Álvarez-Nóvoa in the interview.
Additionally, the data interpretation from the valuation analysis of the target company includes
the following: DCF analysis with IRR and sensitivity analysis to determine profitability and
risk of the 5-year investment and EBITDA multiples to determine appropriate price to ensure
profitability. Both the compliance of the criteria and the valuation data interpretation leads to
the appropriate proposal for the transaction including bidding price and return for the fund.
PRESENTATION OF THE CASE
The information presented in this case allows to answer the key questions for Riverside’s
investment decision (Martínez, 2012):
• What is Riverside investing in? This requires a deep understanding of Euromed’s business
and historic financial performance.
• Why should Riverside make the investment? To answer this, an analysis of strategic fit
should be made.
• What does Riverside intend to do with Euromed to obtain a return on investment?
• What is the expected return and price to get that return?
• What are the quantified risks in the investment?
Although the investment decision is based on profitability and risk, it is important to first look
at the background information, what the investment entails and why Riverside wants to invest.

12
Background
Riverside, an American private equity firm, had successfully invested in the ingredient’s
companies Capol in 2009 and Mec 3 in 2014. They wanted to continue to invest in the
ingredient’s category. Through Riverside's partner in Spain, Rafael Álvarez-Nóvoa, in 2013
they found Euromed, a leading B2B herbal extracts manufacturer. Although at this moment
Euromed was not for sale by its parent company, Meda AB, it allowed Riverside to build a
relationship with Euromed and get to know the company well. By the time Euromed was for
sale in 2015, Riverside had a head start in knowledge of the business and relationship with
management (The Riverside Company, 2019).
In spring 2015 the teaser from Meda AB for the sale of Euromed arrived. This is “an anonymous
document that provides just enough nonconfidential information to pique the interest of
[possible] buyer” (Snow, 2018, p. 47). After executing a confidentiality agreement, in which
buyers assure not to share any confidential information with third parties, Riverside received
Euromed’s information memorandum, often referred to as deal book. This deal book contains
detailed information about financials, customers, products, operations, personnel, legal, etc. of
the target company (Snow, 2018). Riverside immediately started elaborating a letter of intent
(LOI), also known as a non-binding offer; the first offer made in a sales process. A LOI helps
identify similarities and differences between the opinions of both seller and buyer on specific
topics of the transaction. It normally consists of an indicative price and its clarification (in the
presented case the indicative offer was legally not binding), the conditions of each party, timing
issues, a definitive agreement, the confidentiality of the offer and an explanation of the terms
of payment (Corporate Finance Institute, 2019a).Due to the former contact between Riverside
and Euromed, the private equity firm already knew its target company and was – compared to
other possible buyers – able to prepare a more detailed and closer oriented to the target’s
business LOI. Other investors, such as private equity firms or Euromed’s competitors, were
interested in buying Euromed as well. Moreover, the mergers and acquisition (M&A) process
was characterized by a lot of advisors and consultancies in legal, tax, etc.
After the given period of three weeks, in which all possible buyers could submit their LOI, the
phase of negotiation started (Álvarez-Nóvoa, 2020). This phase is intended for the in-detail
discussion of concrete terms for the possible contract (Corporate Finance Institute, 2019a).
During this time only four to five offerors with the best indicative prices were involved in
negotiations with the seller, including Riverside (Álvarez-Nóvoa, 2020). Since both Riverside
and Meda AB had set target prices, they collaborated on different issues other than price, such
as strategic supply arrangements, to include in the negotiation. In order to reach an agreement
on a specific contract, they adapted the zone of possible agreements (ZOPA), the “area where
two or more negotiating parties may find common ground” (Halton, 2019).
Following the usual M&A procedure, a due diligence (DD) was exercised from Rothschild,
Meda’s financial assessor for the transaction, to Riverside (Álvarez-Nóvoa, 2020). In this
process “a detailed examination and analysis of every aspect of the target company’s operations
– its financial metrics, assets and liabilities, customers, human resources, etc.” (Corporate
Finance Institute, 2019a) is completed. Riverside, on the other hand, contracted an advisor to

13
review the seller’s DD and established an additional DD based on factors like products, markets,
insurance, management, personnel, legal and fiscal aspects (Álvarez-Nóvoa, 2020).
Now, Riverside had to decide whether investing in Euromed aligned with the fund’s strategy.
If so, the private equity firm also had to decide the correct price for a successful investment.
After the final agreement, both firms would have to sign the purchase and sale contract, often
referred to as sales and purchase agreement (SPA). Additionally to the SPA, as agreed in the
negotiations, a supply contract with the company currently owning Euromed was needed.
Sectoral Information
The first step in an investment decision is to understand the business (Martínez, 2012). From
an industry-based view, insight on the industries competitive environment will provide
understanding of Euromed’s financial performance in 2015. As a producer of herbal extracts,
Euromed operated in the botanical extract market, which is a segment of the global
biotechnology market (Technavio, 2018). Based on this fact, biotechnology, as parent industry
of the botanical extract market, is presented in this section. Market size and segmentation get
analyzed, before main drivers, opportunities, key challenges and risks are described. Moreover,
paragraph 4.2.6 gives insight in the competitive landscape. An analysis of the market for herbal
and traditional products as Euromed’s target market follows afterwards.
4.2.1. Market Definition & Application
The biotechnology industry included the development, manufacturing and commercialization
of products with the support of advanced biotechnology research. Main activities of
participating companies in this sector were product research and development (R&D),
technology licensing, product sales as well as research funding (MarketLine, 2019).
Biotechnology used technology “to modify and use biological systems for industrial purposes
and human welfare” (Technavio, 2018). More accurately, it designed new products or
technologies for food, energy, rare diseases or the environment by improvingly changing the
structure of plants and animals (Technavio, 2018).
The market could be divided into five different category segments, namely
‘Medical/Healthcare’, ‘Food & Agriculture’, ‘Environment & Industrial Processing’, ‘Service
Provider’ and ‘Technology Service’. The most important segment was ‘Medical/Healthcare’
with a global market share of 58,4% by 2018 (see Table 1). This segment represented over 75%
of the market share in Spain in 2014, at the time Riverside was looking for an investment.

14
Table 1: Biotechnology industry market share of category segmentation
Category Global market
share in 2018 [%]
Market share in
Spain in 2014 [%]
Medical/Healthcare 58,4% 75,3%
Food & Agriculture 11,9% 9,6%
Environment &
Industrial Processing
11,3% 3,8%
Service Provider 9,9% 9,7%
Technology Service 8,5% 1,7%
Total 100% 100%
Source: MarketLine (2019); MarketLine (2015)
4.2.2. Market Size
The year 2015 was marked by double digit growth of 10,3% down from a growth of 15,1% in
2014 for the biotechnology industry. This growth was expected to decelerate but remain strong.
The global biotechnology industry value reached €282,7 billion in 2015 (MarketLine, 2019).
By 2018, the biotechnology industry was expected to grow a 9% versus the previous year and
reach a value of €350,5 billion (see
Table 2) which represents a compound annual growth rate (CAGR) of 8,1% between the years
of 2014-2018 (MarketLine, 2019).
Table 2: Global biotechnology industry value: € billion
Year € billion % Growth
2014 256,2 15,1%
2015 282,7 10,3%
2016 299,3 5,9%
2017 321,6 7,5%
2018 350,5 9,0%
Source: MarketLine (2019)
The USA represented the greatest share by value (48,2%), followed by Asia-Pacific (24,0%)
and Europe (18,1%) (MarketLine, 2019). In 2014, Spain accounted for 33,5% of the European
biotechnology industry value reaching €23,6 billion. By 2015 it was projected to grow 9,8% at
€23,6 billion. Forecast of Spain biotech industry value for 2018 was €32,6 billion with an
annual growth rate of 7,0% between 2017 and 2018 (MarketLine, 2015).
15
4.2.3. Market Drivers
Main drivers of the biotechnology industry were increasing consumer spending, governmental
initiatives to support technological development, new technology, accessible raw materials as
well as funding budgets for R&D opportunities. A change in the consumers behavior and
therefore consumer spending effected the whole value chain up to the research and production
of biotechnological products. Moreover, planned governmental initiatives for the near future
supporting technological innovations defined a chance for doing business in this sector in
Germany. However, government regulations were very strict in most countries (MarketLine,
2019). Due to the importance of automated and semi-automated manufacturing and packaging
equipment, as well as efficient and sustainable information technology systems like databases
or enterprise resource planning (ERP) systems, technology was one of the most important
market drivers. A distribution network of reliable suppliers and the importance of high-quality
products let raw materials be an additional driver. The gained funding options from companies
determined their financial resources for the R&D of new products (MarketLine, 2019).
4.2.4. Market Opportunities
First Research (2019) states four different opportunities for companies operating in the industry.
The first market opportunity was ‘ingredient awareness’. In 2015, many people were more
conscious about ingredients in the food they bought than in previous years. This awareness of
healthy ingredients “could drive growth among consumers who [wanted] to know the quality
of ingredients used in food and other consumable goods” (First Research, 2019). By offering
products from natural botanicals, companies could attract more customers and thus, increase
their sales. The second prospect for companies in this industry was ‘sports performance
supplements’. With more consumers engaged in athletic activities, the interest in maintaining
health and fitness concerns increased, which led to more people seeking nutritional food
supplements. The ‘weight loss market’ as a third opportunity focused on the obesity epidemic
in several countries around the world, mainly the USA. The awareness of this issue, awoken by
governments and health organizations, increased the demand for healthy food alternatives.
Lastly, the ‘growth in e-commerce’ gave companies the possibility to use the increasing demand
of consumers via internet. Online education and targeted marketing could help promote a
specific demographic market and increase not only the company’s revenue, but also its
reputation.
4.2.5. Key Market Challenges & Risks
Although the industry was growing both at a global and local level in Spain, there were several
challenges and risks that had to be taken into consideration. First, government requirements for
ingredients quality were high. Officials in Europe scrutinized the use of unapproved or
prohibited ingredients. Keeping up with requirements and guidelines faced a threat to disrupt
some of the industries supply chain. Second, the biotechnology industry had a high liability
risk. Claims that resulted from contaminated or tampered products led to costly litigation
procedures. Third, negative claims also caused the risk of negative publicity, especially if there
was noncompliance with regulation standards. Finally, many manufacturers produced products
16
with similar ingredients that could not always be protected with patents (First Research, 2019).
Even if they had some protection of intellectual property, “bio-generics” were a growing
concern (MarketLine, 2015) since they are similar or comparable to the original in composition
(Merriam-Webster, n.d.).
4.2.6. Competitive Landscape
The global competitive landscape of biotechnology was dominated by firms that operated in
the medical and healthcare segment. Particularly in economies where the biotechnology
industry was more mature such as Europe, Japan and the United States, there was rivalry among
several start-ups, SMEs together with a small number of large companies. The large revenues
of these companies allowed them to invest strongly in R&D in order to create new and
innovative products (MarketLine, 2019).
The Spanish competitive market by the end of 2014 is described below based on the Five Forces
Analysis. Overall, it was an attractive industry for firms with high R&D capacities and
intellectual property due to high entry barriers and moderate competition. Players taken into
consideration are companies that had R&D related to biotech as well as offering products using
biotech techniques. The buyers of the industry are identified as healthcare providers and B2B
end users. On the other hand, suppliers are considered producers of biotech consumables,
software and lab equipment (MarketLine, 2015).
• The level of rivalry among competitors was increased in Spain’s mature market due to the
existence of several start-ups and SMEs competing next to a few large companies such as
Astra Zeneca. Many firms looked to differentiate by finding a niche market in which to
focus. Regardless of the target company, competitors were on a race to discover new
product solutions. Thus, constant, high-risk investments in R&D and clinical trials
increased rivalry. However, as the industry was growing, the level of competition also
diminished, allowing competitors to increase revenues without cutting into their
competitors market shares. A race for innovation in a growing industry created a moderate
level of competition (MarketLine, 2015).
• The buyers bargaining power was increased by the presence of large sized buyers ranging
from healthcare providers to the agriculture market. Nonetheless, players in the biotech
industry had specialized and differentiated products to offer to buyers. Specifically, for
ingredients of prescription medicine, there was a possibility that prices were regulated by
the government (MarketLine, 2015). Buyers, precisely pharmaceutical companies, had to
register ingredients of their medicines in a Drug Master File, used to submit to government
agencies for approval. The process for approval took between 2-3 years. Therefore,
pharmaceutical companies only had 1 or 2 suppliers for each type of ingredient. The cost
of changing suppliers from the biotech industry due to quality requirements and approvals
was high for buyers. Finally, ingredients represented a small percentage of the cost of final
products, so buyers rarely changed suppliers (Álvarez-Nóvoa, 2020). Considering the size
of buyers was offset by the rigorous certification process requiring high quality biotech
products, specifically in the pharmaceutical industry, the buyers bargaining power was
moderate (MarketLine, 2015).

17
• Most importantly, the value of a biotech firm came from its intellectual property, thus they
were not very dependent on suppliers. Furthermore, there was little differentiation amongst
suppliers for the Spanish biotech market. Manufacturers of lab equipment and software
were major suppliers for the biotech industry of which biotech firms had vast choices for
quality and cost relationship. Nonetheless, quality raw materials were essentials for players
in the biotech market and depended highly on lab equipment. The suppliers of both raw
material and lab equipment also served clients in other industries and there was a low
probability that biotech firms would vertically integrate to either markets. All things
considered, the bargaining power of suppliers was also moderate (MarketLine, 2015).
• Although the growth of the industry was attractive for new entrants, proprietary knowledge
in biotech was very high and critical for success. Thus, a lot of investment in R&D was
required. Investment in R&D could be a challenge for start-ups as there were high fixed
cost and profits were initially low given the long discovery and innovation period to bring
a new product to market. Additionally, government regulations were strict and incurred in
additional costs. These regulations took time (increasing time to market) and were costly
as they required clinical trials and safety testing. Furthermore, these clinical tests had
compulsory processes and standards for quality and safety established by different
regulators. High entry barriers made the threat of new entrants weak (MarketLine, 2015).
• The main substitutes for the medical biotech industry were therapeutic drugs using
chemical synthesis (MarketLine, 2015). However, the effectiveness of synthetics drugs had
come into question (Gale, 2018) and therefore contributed to the growth of biotechnology.
Patent protection slowed down the threat of alternative chemicals but over time other firms
could produce similar products at a lower cost making the threat of substitutes moderate
(MarketLine, 2015).
Leading companies in the Spanish biotech industry included AstraZeneca PLC, Esteve Group,
Grifols, S.A. and Zeltia, S.A. The first company, AstraZeneca PLC, recorded revenues of
$25.711 million in 2013, representing an 8,1% decrease compared to the previous year. Its only
business segment was pharmaceuticals. On the other hand, Esteve Group operated in both
pharmaceutical and chemical products but did not disclose its financial data. Grifols, S.A.
recorded revenues of €1.417,9 million in 2013 with a 6,6% growth. The company had four
divisions which included bioscience, diagnostic, hospital and raw materials. Finally, Zeltia,
S.A. reported revenue growth of 5,6% in 2013, reaching €103,9 million in revenues. The group
focuses in biopharmaceuticals and consumer chemicals (MarketLine, 2015). Euromed had
revenues of about €37 million in 2013 with a 9% growth (Sabi, 2020).
Global competitors of natural extracts that had recently been acquired by Naturex, an American
manufacturer of natural ingredients, included Berkem from France, Chart Corporation from the
United States of America and Hammer Pharma from United Kingdom. The latter, Hammer
Pharma, had the most amount of revenue with sales of €7,7 million. The American company
Charter Corporation followed with sales of €5,7 million. Berkem was the smallest of the three
with €4 million in sales (Álvarez-Nóvoa, 2020).
18
4.2.7. Target Market: Herbal / Traditional Products
Closely tied to the biotechnology industry, herbal/traditional medicine was making a strong
comeback as consumers were looking for “safer and natural” alternatives (Euromonitor
International, 2011). Natural health products analyzed in this section include the categories of
‘OTC’, ‘Sports Nutrition’, ‘Vitamins and Dietary Supplements’ and ‘Weight Management and
Wellbeing’ (Euromonitor International, 2019). Pharmaceutical companies also returned to
sources of herbal medicine since most synthetic drugs did not have the expected health impact
(Gale, 2018). Nonetheless, increasing regulations in Western Europe, North America and Asia-
Pacific constrained sales (Euromonitor International, 2011). By 2015, the total market size of
natural consumer health products reached $40.000 million, representing a 4% global growth.
Asia Pacific represented nearly 60% of the market size, followed by Western Europe with 16%
and North America with 15% (Euromonitor International, 2019). Spain’s herbal product sales
increased 2,37%, reaching €302 million (Euromotinor International, 2020b). Although the
Spanish growth rate was lower than the global growth rate, Spanish consumers showed a
growing trend of going back to traditional products which resulted in a greater demand for
herbal products. This trend of going back to traditional products was forecasted to continue as
far as 2024 (Euromonitor International, 2020a).
Dietary supplements, substances intended to fill a nutritional or wellness gap, drove the sales
in herbal products, followed by cough, cold and allergy remedies as the second largest global
category. At a global level, ginseng led the market in natural supplements reaching a market
size of $2,1 billion in 2014. Other supplements such as ginkgo, biloba and echinacea also had
high levels of consumer awareness. However, ginseng’s lead in the market could be explained
by consumer perceptions of a ‘cure all’ product, which contributed to its global popularity
(Euromonitor International, 2019).
The growth of natural supplements was driven by new ingredients and new demands. The best-
known ingredients such as ginseng and ginkgo dominated the market. However, consumers
were looking to expand benefits and functionality either through newer supplements or a
combination of supplements to satisfy a new need such as immune response and brain function
(Euromonitor International, 2019).
19
The Target Company: Euromed in 2015
The target company is the acquired entity in an investment. To further the understanding of the
business from a resource-based view (focused on how individual firms differ from each other
(Peng, 2013)), this section introduces Euromed as the target company and gives insight on its
core business. First, main products, the sales structure and customers get analyzed. Then,
paragraph 4.3.2 explains the production process and operations. The management, personnel
and business climate are described afterwards. Finally, Euromed’s strategy analysis closes this
section.
4.3.1. The Business: Products, Sales & Customers
The Spanish company Euromed sold herbal extracts and natural active substances used as
components for the final products of the pharmaceuticals, nutraceuticals, functional foods and
cosmetic industries (Euromed S.A., n.d.). The company was global leader in two types of
extracts due to their proven track record. The first types of extracts were taken from the Milk
Thistle seed and were used as ingredients to treat liver failure. The second extracts came from
the fruit of the Saw Palmetto plant growing in the Everglades, Florida. This last extract
ingredient was used primarily to treat prostate cancer, but it was also used to treat hair loss
(Álvarez-Nóvoa, 2020). Nonetheless, in 2015 Euromed had an extensive product list of over 20
different botanical species extracts including gingko biloba dry extract intended to treat
memory loss due to aging, ginseng dry extract used to fight fatigue and echinacea angustifolia
root dry extract used to promote and support the immune system (Euromed S.A., 2015b).
Traditional products included St. John’s Wort extract to treat depression and Horse Chestnut
(The Riverside Company, 2019) for chronic venous insufficiency (National Center for
Complementary and Integrative Health, 2016). Most of their products were free of additives
and genetically modified organisms known as GMOs (The Riverside Company, 2019),
enhancing Euromed’s natural image. GMOs are life forms whose genetic makeup has been
modified in a laboratory to obtain a desired trait (Fridovich-Keil & Diaz, 2020). Euromed’s
manufacturing plant in Mollet del Valles, Spain extracted more than 4.000 tons of biomass a
year to produce about 600 tons of extracts to meet their customer’s needs (Euromed S.A.,
2015a). Revenue reached about €42,6 million in 2015 with 7% growth (see Annex C and Annex
D for financial data).
Pharmaceuticals were Euromed’s main customers, accounting for up to 65% of their sales (The
Riverside Company, 2019). Euromed’s herbal extracts and natural active substances were the
Active Pharmaceutical Ingredient (API) for pharmaceutical products. API suppliers needed to
be in a Drug Master File submitted to obtain approvals and certifications (Álvarez-Nóvoa,
2020) such as approvals from the Food and Drug Administration (FDA). The Drug Master File
contains product traceability and analysis of impurities in the product (Roig, 2020). As part of
their services, Euromed gave clients the option of providing documentation required for Drug
Master File and other certifications (Álvarez-Nóvoa, 2020). Clients in this industry included
global companies such as Pfizer and Merck. However, 30% of their total sales came from its
parent company, Meda AB.

20
The nutraceuticals industry accounted for about 30% of Euromed’s sales (The Riverside
Company, 2019). Nutraceuticals are substances that provide a physiological benefit or protect
against chronic diseases (Nasri, Baradaran, Shirzad, & Rafieian-Kopaei, 2014). This industry
included clients like Herbalife that developed and sold dietary supplements (Roig, 2020) such
as products for healthy aging or digestive health (Herbalife International of America, Inc.,
2020). Although both nutraceuticals and pharmaceuticals had ingredients that cure or prevent
diseases, only pharmaceuticals had governmental sanctions and therefore were much more
regulated (Nasri, Baradaran, Shirzad, & Rafieian-Kopaei, 2014). Because nutraceuticals were
less regulated, there was more competition for ingredients suppliers. Nonetheless, Euromed
guaranteed its clients quality and traceability as well as clinical studies as a competitive
advantage. Natural supplements, growing at close to 10% annually in the USA, presented a
huge growth opportunity (Álvarez-Nóvoa, 2020).
Finally, only about 5% of their sales went to the functional foods and cosmetic industry (The
Riverside Company, 2019). Herbal ingredients, such as aloe vera or olive oil, represent a very
small percentage of the components of cosmetics. On the other hand, with the growing trends
in health and fitness, herbal ingredients with physiological benefits represented an opportunity
for sales growth in the functional foods industry. Nonetheless, this industry was not a mayor
target for Euromed at the time (Álvarez-Nóvoa, 2020).
Through their products and services, Euromed supplied more than 350 customers located in 35
countries around the world (Euromed S.A., 2015a). Due to the strength of the
phytopharmaceutical (herbal medicines) industry in Germany, the country represented almost
50% of its sales. With the growth of nutritional supplements, the USA became the second most
important market. Asia, as a new market with high growth potential, was also important (Roig,
2020).
4.3.2. Production and Operation
All of Euromed’s extracts complied with the global Good Manufacturing Practices (GMP)
norms, international pharmacopoeias (this is a legally binding collection, elaborated by a
governmental authority, with quality standards and specification for medicines in that
jurisdiction (World Health Organization, 2020)), and international regulations. Furthermore,
Euromed had validated and implemented mandatory methods for manufacture that included
inspections to guarantee analytical, chemical and therapeutic (i.e. healing) quality standards.
The company also applied their many years of expertise to establish R&D, laboratory analyses,
processes and technologies. The main concern during production was the safety and
effectiveness of the product (Euromed S.A., n.d.).
So, Euromed controlled the supply chain, from the farmers to the final product, in order to
ensure traceability of their products (The Riverside Company, 2019). For starters, Euromed had
rigorous procedures in place for botanical sourcing. The company made a strict selection of
plant products that complied with the guidelines of Good Agricultural and Collection Practices
(GACP) (Euromed S.A., n.d.). In some cases, Euromed sold their own seeds to farmers and
oversaw cultivation process. For the cultivation of Saw Palmetto, in which the process of drying

21
the fruit was critical to guarantee product quality, Euromed installed their own drying plant near
the supplier in Florida to control the process (Roig, 2020). Once Euromed received the raw
material in their factories, it was conserved in optimum conditions to preserve freshness and
integrity. The raw material was also tested in compliance with international regulations and
pharmacopoeias. These tests included identification of species, control of active principles and
possible impurities such as heavy metals and pesticides (Euromed S.A., n.d.).
Up-to-date technologies were applied for the extraction process. These technologies ranged
from multiple extraction methods to specific drying procedures. Additionally, further steps of
purification such as liquid-liquid extraction and crystallization were required for highly
concentrated botanical derivatives (Euromed S.A., n.d.). The challenge Euromed faced was the
drying capacity of an old piece of equipment to produce powder extracts that required a big
investment to replace (The Riverside Company, 2019). Furthermore, the current plant in Mollet
del Valle already operated at almost maximum of its capacity, limiting ability of significant
growth (Álvarez-Nóvoa, 2020). It was also very difficult to increase production capacity of new
and existing extracts at their current plant given the available space and machinery (Roig, 2020).
Quality was essential throughout the entire production process in Euromed. Thus, they were
committed to continuous improvement of processes and quality control in all the supply chain.
Euromed implemented and certified a Quality Assurance System that complied with the ISO
9001 standards, as the basis of their Total Quality Management System (Euromed S.A., n.d.).
ISO 9001 is a standard that provides the criteria for a quality management system based on a
number of quality management principles that include strong customer focus, involvement of
top management, process approach and continuous improvement (ISO, 2020). A third-party
verification of the quality system gave clients a guarantee of traceability and compliance of
requirements made by the clients. The quality assurance system included raw material testing,
during production controls and final extracts analyses. Cutting-edge laboratory instruments
were used for identification and quantification of raw materials, extracts and natural active
principles (Euromed S.A., n.d.).
In 2015, Euromed had inventory of about €26 million which represented almost 62% of its
operating revenue (Sabi, 2020). Euromed stocked up when harvest was high and prices low for
two main reasons. First, crop harvest volatility (supply can vary due to weather and
geographical factors) made prices fluctuate. Second, some crops’ harvests were seasonal. For
example, Saw Palmetto only had one harvest a year. By stocking up, Euromed made sure they
had enough inventory to meet their clients’ demands (Álvarez-Nóvoa, 2020).

22
4.3.3. Management and Personnel
Euromed had around 165 employees worldwide, of which the majority worked in production.
Some of the employees had been working over 30 years in the company, forming a reliable and
well-rehearsed team of experts. Xavier Roig, CEO of Euromed, oversaw the company. As a
trained pharmacist, he was a very professional and experienced CEO, with specialized
knowledge of the production process. He was down-to-earth and passionate about his work.
Together with the CFO and COO of the company he formed Euromed’s senior management
team. Since this team founded the company, they had profound industry expertise and know
how (The Riverside Company, 2019). With structural independence from the existing
organizational matrix and excellent management of quality, traceability and clinical studies, top
management led Euromed as a pioneer in the pharmaceutical industry of Spain and leader in
the European herbal extract sector. Moreover, due to the complex production process and
required knowledge, Euromed’s top management had a major influence on the decision of the
company’s ownership (Roig, 2020).
The entire management team was formed by the three senior managers and six heads of
department including quality control, purchasing, documentation & services, quality assurance,
legal department and IT (Euromed S.A., 2015a). The relationship between management and
employees could be described as very trust-based, robust and open. Due to top management’s
transparent and communicative leadership style, the business climate was very good, and
employees could enjoy working in the team. Highly motivated workers helped the company
achieve its goals and continue its growth plan (Roig, 2020).
4.3.4. Strategy
With the development of new extracts just two years after the company’s foundation, Euromed
focused from the beginning on growth and customer expansion. Due to the early entrance into
the Spanish market, the company excelled its production process and gained worldwide market
leadership in the Milk Thistle plant and the Saw Palmetto palm tree extracts, mentioned in
section 4.3.1. The combination of focus on market leadership in these two extracts and further
development of new products led to Euromed’s rapid ascend as key player in the
phytopharmaceutical industry. The expansion to the natural supplement market of the USA in
1995 helped the company grow further. This market grew around 7-8% annually, while the
phytopharmaceutical sector grew only around 2-3% (Roig, 2020). Additionally, the expansion
helped stabilize the fluctuation of seasonal sales caused by the European climate. Moreover,
expanding to another market decreased the dependence on just one market. The following
SWOT analysis helps identify internal key strengths (S) and weaknesses (W) of the company
in 2015, while opportunities (O) and threats (T) analyze external market influences on the
company.
First, Euromed’s resources and capabilities must be identified to establish the company’s
strengths. Afterwards, with help of a VRIO framework (Peng, 2013) we analyze the value (V),
rarity (R), inimitability (I), and organization (O) of Euromed’s business model. Table 3 gives
an overview of the most important resources and capabilities.

23
Table 3: Euromed's Resources and Capabilities
Euromed’s Tangible Resources and Capabilities
Financial • Increasing sales and net income in recent years
Physical • Saw Palmetto drying plants located close to supplier’s farms
• Commercial offices all around the world
Technological • Up-to-date technologies applied for the production process
• Several patent ownerships
Organizational • Implemented and certified Quality Assurance System
Euromed’s Intangible Resources and Capabilities
Human • Highly experienced management team
• Over the years developed know-how (about production process)
• Open communication and enjoyable business climate
Innovation • Competitive R&D capabilities and product innovation
Reputation • High customer satisfaction due to high quality standards and
traceability
• Strong partnerships within its supply chain network
Source: adapted from Peng (2013)
a. Euromed’s Strengths: With the resources and capabilities listed in Table 3, Euromed was
able to gain competitive advantage and an important position in the market. Through the
close management of quality, traceability and clinical studies, the company was able to
create value. The company perfected the quality of its products due to the production
process know-how developed over the years. They could guarantee traceability by
controlling the process from seed selection and plant cultivation up to the final extract.
There were only about five competitors worldwide that had the same quality standards as
Euromed (Álvarez-Nóvoa, 2020), indicative of the rarity of Euromed’s competitive
advantage. Close ties to its original mother company, Madaus in Germany, gave Euromed
access to important clinical studies. Another key strength of the company was continuous
product differentiation. Working together with business partners in several countries and
hemispheres and offering a wide range of products for different types of markets
guaranteed sales stabilization over the whole year. Euromed’s supply chain network built
over the years, its close relationship with suppliers and clients and strict procedures was
something its competitors were unable to imitate. Lastly, the flexibility of the
organizational matrix structure, the know-how of highly experienced employees and the
good business climate were indicators of proper organization. These factors increased both
employee satisfaction and motivation and resulted in improvement of the service level and
thus customer satisfaction and loyalty (Roig, 2020).
24
b. Euromed’s Weaknesses: Main weakness of Euromed’s strategy in 2015 was the lack of
financial investment. The company worked at near maximum level of its production
capacity (Álvarez-Nóvoa, 2020). By procuring new machinery the company could have
eliminated this bottleneck. Additionally, an investment in R&D could lead to the
development of new extracts or further improvement of existing products. Furthermore,
most of Euromed’s products were oriented to pharmaceuticals, neglecting growth
opportunities with other industries such as nutraceutical and food. Furthermore, about 30%
of their sales were concentrated in one company, Meda AB. Not only was Euromed
dependent on one industry, but on one client as well. A focus on pharmaceutical industry
also limited innovation and product launches, since the certification process of a new
pharmaceutical ingredient could last up to three years. To overcome dependence of the
pharma industry and increase production, heavy investment in R&D and machinery was
required. But without asking lenders for more debt the company was not able to spend such
sums of money.
c. Opportunities for Euromed: Further expansion into the natural supplement market with an
annual growth rate of 7-8% was a big opportunity for Euromed to increase the number of
clients and growth. Since Euromed had vast experience in applying quality standards that
went above and beyond current regulations, it was one step ahead of its competitors in the
compliance of upcoming regulations (Roig, 2020). Even so, the natural supplements
market allowed for a shorter time to market by eliminating the years of certification
required in the pharma industry. Thus, innovation driven by consumer trends could
increase sales for Euromed with more frequent product innovations. Greater focus on the
natural supplements market also gave Euromed the opportunity to boost sales in territories
where this market was growing, such as the USA and Asia.
d. Threats for Euromed: Although the natural supplement market promised a high growth
rate, competition was also great. The industry attracted a lot of low-cost competitors, which
increased the dynamics of the market. Low-cost products from competition was the biggest
threat for Euromed back then. Euromed’s high-quality standards and clinical studies were
very expensive and increased the final price of the product. Slow industry growth and high
exit costs were the only things to consider in the phytopharmaceutical market. The last
threat was the great dependence on strategic business partners. Since Euromed sold its
products business-to-business, a sustainable client network was key factor to consider.
While changing their supplier was difficult for clients, losing them could be considered as
even higher risk for Euromed (Roig, 2020).
Euromed’s strategy leveraged its strengths for differentiation in high-quality, traceability, and
credibility through clinical trials. These competitive advantages were especially valuable for
the phytopharmaceutical industry. Thus, of the 35 countries Euromed exported to in 2015, the
most strategically important hereby was Germany, as main region for phytopharmaceuticals.
Given the growth opportunity in the natural supplements market, the USA, a flourishing center
of the natural supplements market, was the second most important region. Even though 95% of
the products were sold to customers outside of Spain, keeping the production in Spain and the

25
USA was cheaper and easier to control. Therefore, Euromed only set up commercial offices in
the rest of the countries and exported their products from their production centers in Europe
and North America (Roig, 2020).
The Seller: Meda in 2015
The value of a company can be different to the seller and to the buyer, and therefore so is the
price (Martínez, 2012). To prepare a proper investment offer, it was important to understand
the value of the company from the seller’s perspective to have an idea of how much the seller
expects to receive. Additionally, there might be provisions, other than price, that the seller
requires. This section sheds light on the ownership history, current owner and reasons for
divestment.
4.4.1. Ownership History
Euromed was founded by the corporate parent Madaus in 1971. Madaus led the
phytopharmaceutical market in Germany. The company was the first to isolate silymarin from
the Milk Thistle seed used to treat hepatic insufficiency (liver failure). Euromed was created as
a production center in Barcelona, with lower overhead costs than Germany, to vertically
integrate the cultivation of silymarin, the API of Madaus’ key products. By 1973 Euromed
supplied other types of extracts, such as Saw Palmetto extracts. The main client was Madaus,
but Euromed kept looking for more clients, particularly in Germany, Switzerland and France
where the phytopharmaceuticals industry was strong. In the 70’s and 80’s Euromed focused on
exports to European pharmaceuticals. However, in the 90’s there was a boom in the natural
supplements market, specifically in the USA. Therefore, in 1995 Euromed opened a subsidiary
in Pittsburgh, USA to manage the natural supplements industry. After this, Euromed exported
to Asia, Australia and South America. In 2007 the Italian firm Rottapharm, leader in
glucosamine products (Roig, 2020) used to treat conditions caused by the inflammation,
breakdown and loss of cartilage in the joints (Mayo Clinic Staff, 2017), acquired Madaus.
Euromed continued as a satellite under Rottapharm Madaus with growing sales. The new parent
company invested up to €20 million in Euromed between 2007-2014. Finally, an IPO of
Rottapharm Madaus failed in 2014 due to unfavorable market conditions leading to “a rapid
change in the expectations of investors on European assets” (Bray, 2014). Sweden’s Meda AB
stepped in and bought Rottapharm Madaus above market price (Roig, 2020) after the pulled
IPO, as part of its strategy to create cost synergies (Griffin, 2014).
4.4.2. Current Owner & Reason for Divestment
Meda AB, a publicly listed company, operated as a specialty pharmaceutical firm with revenues
of €2.140 million and over 4.000 employees in 2015 (Amadeus, 2020). The company
manufactured and marketed pharmaceuticals, nutritional and health products (Bloomberg, n.d.).
The products covered different therapeutic areas including dermatology, respiratory,
gastroenterology, metabolism, pain and inflammation, among others (S&P Capital IQ, 2020b).
Meda AB also offered services such as clinical research, registration and logistics (Bloomberg,
n.d.). The divestment of Euromed aligned with Meda’s strategy to focus on its core business of
26
selling and marketing prescription and over the counter pharmaceuticals. At the same time, it
would increase their cash flow (Roig, 2020). Nonetheless, there were two key points that Meda
AB required from the divestment. First, the company needed to secure Euromed as a long-term
supplier for the API of their products with fixed prices. Second, as a publicly listed company,
Meda AB required an attractive price offer to maintain their share value (Álvarez-Nóvoa, 2020).
The company was clear that they did not want a manager buyout (MBO) (Roig, 2020). An MBO
consists of the management team buying the assets and operations of the business (Hargrave,
2019). Thus, the company used Rothschild, an independent financial advisory group, as their
assessor for the transaction (Álvarez-Nóvoa, 2020).
The Buyer: Riverside in 2015
To determine if the project (of investing in Euromed) fits Riverside’s strategy, the private equity
firm’s operation, mission, structure and investment criteria are presented in this section.
Furthermore, an analysis of the risks of the operation, plan for acquisition, and funding is
detailed. Both risks analysis and plans for acquisition need to be quantified when making
assumptions for financial forecast and valuation of the target company (Martínez, 2012). The
type of funding presented in paragraph 4.5.5 also has an impact on the valuation analysis of the
company.
4.5.1. General Overview of Riverside in 2015
The Riverside Company was founded in USA in 1988 with headquarters New York City. It
operated as a private equity firm specializing in a wide range of investment strategies at the
smaller end of the middle market companies in North America, Europe and Australasia (S&P
Capital IQ, 2020c). Riverside stimulated sustainable growth through new products, expanding
markets, operating improvements and add-on acquisitions. Areas in which Riverside invested
ranged from technology, computer soft- & hardware, energy, telecommunication, industrial &
consumer products, health & medical, up to consumer & industrial service and banking &
finance (Capital-Riesgo.es, n.d.). The company preferred to work with sellers that would still
be involved in the company to push growth. Riverside delivered a fair and fast process with
successful results. Its mission was to create value (The Riverside Company, 2020b). Thus, they
used as little leverage as possible to avoid creating financial distress on the target company.
When they did use leverage, they did not pass the debt on to the target company (Álvarez-
Nóvoa, 2020). This is further explained in the funding section 4.5.5.
The company had over 300 employees in 15 offices throughout North America, Europe, Asia
and Australasia. Riverside Europe had one office in Madrid with five employees (The Riverside
Company, 2020a). The Partner in the Madrid office, Rafael Álvarez-Nóvoa, was responsible
for the deal flow origination in Spain. He was experienced in identifying new investment
opportunities (Álvarez-Nóvoa, 2020). The investment criteria required by the fund were as
follows.

27
Table 4: Fund’s Investment Criteria
1. Target company value should be around €50-€250 million with EBITDA of €5-€25
million.
2. The target company must be a market leader.
3. The target company must have a solid business model. A solid business model includes
a good margin and competitive advantage.
4. The target company must have a clear business development plan and growth potential.
5. The target company must be international, with more that 60% of their sales on exports.
6. The management team of the target company must be excellent.
7. Exit option with at least 20-25% return.
Source: Álvarez-Nóvoa (2020)
Riverside’s objective was to invest in a company for 5 years to add value and make it grow in
order to have a profitable exit (The Riverside Company, 2019).
4.5.2. Risks of the Acquisition
Considering the common objective to increase Euromed’s EBITDA, both companies faced
three major risks in the upcoming shared time of the operation. First, accounting for 30% of
total sales not only gave Meda AB strong bargaining power but made Euromed vulnerable if it
lost Meda AB as a client. Furthermore, focus on the European market made Euromed highly
dependent on few clients for growth and diversification. Second, the company’s focus on a
mature pharma industry gave little room for growth. Limited product innovation in the pharma
industry due to the long time to market stunted development. Third, Euromed was working at
near maximum production capacity. This earlier mentioned bottleneck was a risk for
spontaneous peaks in demand and could cause supply shortages. Lower service levels due to
shortages could negatively influence customer satisfaction and lead to customer loss. Restricted
production capabilities did not only limit increase of existing herbal extract, but also
development of new herbal extracts to expand product portfolio for new markets (Álvarez-
Nóvoa, 2020).
Both companies, Riverside as investor and Euromed as target, faced several risks when going
into the agreement. Although the odds so far were high, it was still not confirmed that Riverside
would win the bidding process. Resources invested in the elaboration of the letter of intent had
to generally be considered as sunk costs (“money that has already been spent and which cannot
be recovered” (Tuovila, 2019)) in the private equity business. Additionally, Riverside didn’t
have complete knowledge of the production process of the target company. So, they had to trust
in the employee’s know-how and operational recommendations. Another risk for Riverside was
not achieving its goals in five years. The market could develop differently than expected and
the desired growth not be achieved. However, the possibility for a bad development of the
market was low due to the earlier mentioned market trends like increase in health awareness or
demand for natural products (Álvarez-Nóvoa, 2020). Euromed, on the other hand, had to trust
28
in the private equity firm. It generally happened that new owners of a company want to dictate
the operating business or even plan strategic changes like selling whole business units. But
Riverside made clear in the negotiation process that they would not impose decisions on the
core business and aim towards a sustainable growth of the company (Roig, 2020).
4.5.3. Riverside’s Plans for Acquisition
Riverside wanted to obtain sustainable sales growth of over 50% in five years (The Riverside
Company, 2019) by focusing on the mayor risks of Euromed’s operation (Álvarez-Nóvoa,
2020). In order to address these risks, Riverside planned to take the following actions:
• Reduce the reliance on Meda AB sales by 50%, without reducing total sales (Álvarez-
Nóvoa, 2020): The purpose was not to sell less to Meda AB, but to accelerate the increase
of sales with other pharmaceuticals and increase sales to the natural supplement industry
globally. This would create customer diversification for Euromed. In order to accelerate
sales with other clients, Riverside planned on hiring a Scientific Marketing Manager. This
new role would add credibility to their sales team by focusing on clinical trials as proof of
concept to differentiate Euromed from its competitors. Furthermore, they would push new
sales in the USA to grow the share of natural supplements industry clients. Since this
industry was less regulated, it would be easier to accelerate growth by reducing time to
market of new products. Although nutraceuticals and natural supplements were less
regulated, Euromed could capitalize on their product quality by branding their ingredients
to create awareness, credibility and differentiation. The branding, such as a certified logo
(indicating adherence to quality standards), would be provided to Euromed’s clients so that
they could use it on their final product. They would also push sales to other clients in Asia
and Australasia, especially in Japan, Korea and Australia (Álvarez-Nóvoa, 2020). These
actions would increase the size of the sale’s “pie” and consequently the dependence of sales
to Meda AB would decrease.
• Grow innovation for nutraceutical and natural supplements clients: Most of Euromed’s
sales were focused on the mature and highly regulated pharmaceuticals industry. Thus, an
opportunity to launch new products at a faster rate for nutraceutical clients could be
exploited. This implied a change in work culture within Euromed. In 2015 the company’s
work culture had a pharma-oriented mentality, only focusing on product improvement and
developing at most one new product in two years. Riverside wanted to shift Euromed’s
work culture to an innovative “scientific marketing” perspective (Álvarez-Nóvoa, 2020) of
understanding how consumers spend their money on natural supplements, anticipate trends
and provide a new solution. To keep up with consumer trends, an increase of up to three
product launches a year was projected. Consequently, Riverside planned to create a new
Product Development Committee, led by Carten Smith as chairman. Smith would bring
over 25 years of experience to the team. Riverside also planned to build an innovation
center for R&D with an estimated investment of €2,5 million. The “scientific marketing”
perspective would promote R&D (usually an activity done only by Euromed’s clients). For
example, Euromed would now participate in trade shows to promote their product

29
innovations and planned agreements with universities would give access to clinical studies
(Álvarez-Nóvoa, 2020).
• Increase production capacity: Riverside intended to incorporate an additional working shift
in the production plant and replace an old drying machine that limited production with an
investment of €2,3 million. (Álvarez-Nóvoa, 2020). The new dryer would double the
capacity to produce powder extracts (The Riverside Company, 2019). Riverside also
planned to invest in an add-on acquisition of Probelte Biotecnología (Álvarez-Nóvoa,
2020), a developer and manufacturer of ingredients used in natural supplements based in
Murcia, Spain (S&P Capital IQ, 2020a). The add-on of Probelte would increase production
of water-extracted products (an eco-friendly production method) and allow to produce new
extracts. In total, it was expected to increase production by 25% (The Riverside Company,
2019).
4.5.4. Valuation Process
As stated before, Rafael Álvarez-Nóvoa’s first contact with Euromed took place in 2013, two
years before the actual acquisition process. Although Euromed was not for sale at the time, the
first contact was worthwhile since understanding the business is the first step before analyzing
financial statements. Financial data reflects how the company operates (Martínez, 2012). This
gave Riverside an advantage to really get to know Euromed’s operation in order to properly
interpret financial data in time to present a well-rounded offer, if they decided to invest. The
private equity firm used the DCF method with IRR and EBITDA multiples for business
valuation.
Being the most suitable method to valuate a company (Martínez, 2012), the DCF method gave
Riverside valuable information about a possible price range for the target company and
profitability. Using DCF, Riverside could quantify their restructuring plan (previously detailed
in section 4.5.3) and the return on the investment by calculating internal rate of return (IRR).
Calculating the IRR gives information about the profitability of a potential investment. The IRR
is “the discount rate that makes the net present value (NPV) of all cash flows from a particular
project equal to zero” (Hayes, 2020a). The NPV is the “difference between the present value of
cash inflows and the present value of cash outflows over a period of time” (Kenton, 2020).
Since Riverside’s objective was a profitable exit strategy, DCF must provide an IRR of at least
25%. But, DCF required a lot of assumptions for accurate forecasting. Main drivers of
profitability that required accurate assumptions were initial price paid, sales growth and
increase margin/sales from restructuring plan and exit strategy (selling price in five years).
Consequently, to develop precise future assumptions and estimate different scenarios it was
essential to understand Euromed’s business and market dynamics well. Furthermore, even if
Riverside studied Euromed’s business for two years, uncertainties in combination of
assumptions, such as sales growth and operational expenses, to create a forecast could create
false expectations. Therefore, DCF was not Riverside’s preferred valuation method if used
alone (Álvarez-Nóvoa, 2020). Consequently, DCF was just one part of the valuation process. It
would serve to prepare a reasonable price range for a comprehensive offer.

30
Valuation based on multiples, on the other hand, is used to calculate a company’s value and
compare it with other companies (Corporate Finance Institute, 2019b). Riverside used EBITDA
multiples to value Euromed, which is the “most used enterprise value multiple; computed as
the proportion of Enterprise Value to [EBITDA]” (Corporate Finance Institute, 2019b). In
contrast to the DCF method, a business valuation based on EBITDA multiples uses only data
of a specific date (in this case Euromed’s EBITDA in 2015) and multiplies it with a reasonable
multiple calculated from available information about other market players. Generating a table
of comparable companies to calculate Euromed’s company value with the right EBITDA
multiple was quite challenging for Riverside. Euromed operated in a market niche. Thus, it was
hard to find accessible information about comparable firms. However, Riverside was able to
generate a table of comparable publicly listed competitors with their EV’s and EBITDA’s (see
Annex L). Comparable companies were located all around the world but worked in the same
industry as Euromed. Due to their publicly listed company status, all comparable competitors
were bigger than Riverside’s target company. By dividing the EV’s by each respective EBITDA
a multiple was calculated for each comparable firm. The average EBITDA multiple could have
been used as orientation for a reasonable multiple to compute Euromed’s value in 2015 but
publicly listed companies were too big in value to use as reference. Thus, information about
former market transactions (also see Annex L) gave insight about possible realistic values for
the multiple (Álvarez-Nóvoa, 2020).
4.5.5. Funding
The structure used by the private equity firm to fund this investment would be a simple
leveraged buyout using both equity and debt. It would be divided into 50% equity and 50% debt
(Álvarez-Nóvoa, 2020). Due to the costly planned investment in capital expenses (capex) and
required working capital (WC), Riverside could have used a bullet loan as debt fund. This type
of loan schedules a one-time payment of the lump sum agreed in the contract at the end of the
term. In such loans the borrowers often “have the option to make no payments over the life of
the loan or to make interest-only payments along the way” (Kagan, 2019). Bullet loans usually
have higher interest rates than other funding options due to less regular cash flow to the lender.
In exchange, banks allow borrowers to have more flexibility to begin expensive projects
immediately and adapt the duration of the loan based on the project time expectations (Kagan,
2019). Even though the company’s management team had participations in Euromed, Riverside
would buy 100% of the target in order to have total control for the restructuring plan. Payment
would be made in cash, as required by the seller (Álvarez-Nóvoa, 2020).
When buying the target company, Riverside would not pass the debt on directly to the target
company. A new company would be created as special purpose vehicle (SPV) to secure both
the buying as well as target company (Álvarez-Nóvoa, 2020). A SPV is a subsidiary of the
buyer to isolate assets, keep transactions structured and thus decrease the financial risk for all
parties involved. Due to its legal status as new company, this subsidiary can continue operating
despite bankruptcy of its parent company (Chen, 2019).

31
RESULTS
There are several steps that needed to be followed to determine if the target company in this
case should be acquired by Riverside. This case provides the opportunity to refine business
judgement for decision-making in private equity investment as a learning tool by developing
business skills used in the following steps adapted from Martínez Abascal (2012):
• Examination of strategic fit with Riverside’s criteria for investment,
• P&L and Balance Sheet analysis to determine if the company is profitable and identify
risks and problems (if any) to solve,
• Forecast analysis, including Riversides contribution, to determine if the investment would
be profitable,
• Calculation of profit at time of exit based on acquisition price using DCF and multiples,
• Risk analysis (sensitivity analysis) to quantify investment lost given a worst-case scenario.
This section covers all five steps adapted to the specific case of Riverside’s decision process to
invest in Euromed. The strategic fit and the historic P&L and Balance Sheet were analyzed
before defining assumptions about the future and analyzing the profitability as well as risk of
the investment. Finally, a reasonable decision about the investment was suggested.
Strategic Fit
This case shows that there is more to decision-making in private equity investment than just a
comparison of valuation of the company and the price paid for the company. The first thing that
the private equity must consider is if the acquisition meets the investment criteria. Table 5
provides Riverside’s investment criteria and justifies Euromed’s strategic fit.
Table 5: Investment Criteria Analysis
Criteria Analysis
Met
Criteria
1. Target company value should be
around €50-€250 million with
EBITDA of €5-€25 million.
The value of Euromed using
EBITDA multiple of 8 (base
scenario) was about €74 million
with EBITDA of €9 million.
Yes
2. The target company must be a market
leader.
Euromed was herbal ingredients
market leader. Yes
3. The target company must have a solid
business model. A solid business model
includes a good margin and
competitive advantage.
Given its high-quality product,
margin was at above 50%. The
combination of traceability,
quality and clinical studies for
proof of concept gave Euromed a
valuable, rare and hard to imitate
competitive advantage.
Yes
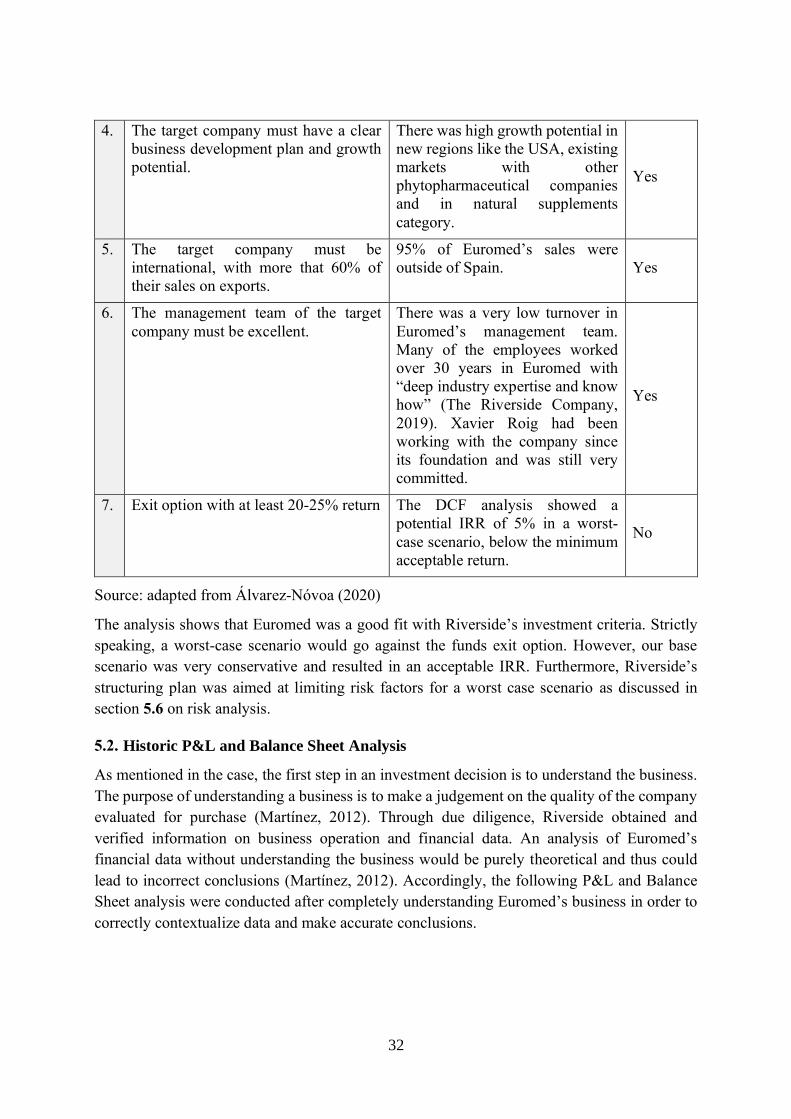
32
4. The target company must have a clear
business development plan and growth
potential.
There was high growth potential in
new regions like the USA, existing
markets with other
phytopharmaceutical companies
and in natural supplements
category.
Yes
5. The target company must be
international, with more that 60% of
their sales on exports.
95% of Euromed’s sales were
outside of Spain. Yes
6. The management team of the target
company must be excellent.
There was a very low turnover in
Euromed’s management team.
Many of the employees worked
over 30 years in Euromed with
“deep industry expertise and know
how” (The Riverside Company,
2019). Xavier Roig had been
working with the company since
its foundation and was still very
committed.
Yes
7. Exit option with at least 20-25% return The DCF analysis showed a
potential IRR of 5% in a worst-
case scenario, below the minimum
acceptable return.
No
Source: adapted from Álvarez-Nóvoa (2020)
The analysis shows that Euromed was a good fit with Riverside’s investment criteria. Strictly
speaking, a worst-case scenario would go against the funds exit option. However, our base
scenario was very conservative and resulted in an acceptable IRR. Furthermore, Riverside’s
structuring plan was aimed at limiting risk factors for a worst case scenario as discussed in
section 5.6 on risk analysis.
Historic P&L and Balance Sheet Analysis
As mentioned in the case, the first step in an investment decision is to understand the business.
The purpose of understanding a business is to make a judgement on the quality of the company
evaluated for purchase (Martínez, 2012). Through due diligence, Riverside obtained and
verified information on business operation and financial data. An analysis of Euromed’s
financial data without understanding the business would be purely theoretical and thus could
lead to incorrect conclusions (Martínez, 2012). Accordingly, the following P&L and Balance
Sheet analysis were conducted after completely understanding Euromed’s business in order to
correctly contextualize data and make accurate conclusions.

33
5.2.1. P&L Analysis
The objective of a P&L analysis was to determine if Euromed made money (i.e. if it generated
revenue) and if it was profitable. If the analysis was positive, then we could continue with the
valuation process. As a rule of thumb, the smaller number of items in a P&L, the easier the
analysis (Martínez, 2012). See Annex C for the “big” numbers considered for this analysis. The
“big” numbers are the items that allow to identify problems (if any) and solve them (Martínez,
2012). For definition of main items presented in Euromed’s P&L, please see Annex F. We
concentrated on relevant items to give a diagnostic on quality of the business and an action plan
for the forecast. The concept, value and trends were analyzed to draw up opinions and
conclusions where possible:
• Sales: Revenue closed at almost €43 million for 2015 with average growth of 7% in the
last five years. The sales growth decreased from 12% in 2011 to 7% in 2014 but stabilized
in the last two years, remaining constant at 7% growth in 2014 and 2015. The
biotechnology industry was projected to decline in growth as it matured after 2014. Thus,
Euromed followed the industry trend. The company did not exceed expectations in sales,
so sales growths were neutral (neither good nor bad). Nonetheless, there was high potential
to grow sales by exploiting nutraceutical and natural supplements market with new product
launches.
• Margin: The average margin in the last five years was 56%. The margin was very stable
and guaranteed by the pharma industry (buyers had high barriers to switch suppliers and
moderate bargaining power). It decreased mildly from 57% in 2011 to 55% in 2015.
Decrease in margin was due to increased changes of inventories of finished goods, which
impacts the cost of goods sold (COGS). This was expected given the seasonality of raw
material required for Euromed’s production. Increased sales with a moderate decrease in
margin gave a positive outlook. Price controls and checks on suppliers could help reduce
COGS.
• Operating costs (Opex): Euromed’s Opex represented 33% of sales, down from 37% in
2011. By 2015 it was around €14 million. A decrease in Opex while increasing sales is a
positive indicator. Increase in COGS was compensated by the reduction of Opex.
Operating income increased from €7 million in 2011 to €9 million in 2015. Over the last
five years it maintained a 20%-21% EBITDA over sales ratio. Also, a good indicator.
• Profitability: Net income duplicated from €4 million in 2011 to €8 million in 2015.
However, this was positively impacted by €4 million in extraordinary items from the sale
of patents to its previous owner, Meda AB (Sabi, 2020). Return on sales (ROS) is calculated
by dividing net income by sales of the same year. ROS increased significantly from 12%
in 2011 to 19% in 2015. An increase in ROS means that sales growth is managed
effectively to cover companies’ expenses (Hayes, 2020b). Thus, Euromed is growing
efficiently. Return on equity (ROE) on the other hand indicates how effectively
management uses assets to turn them into profit (Hargrave, 2020b). ROE is calculated by
dividing net income by equity of the same year. Euromed’s ROE of 20% for 2015 was very
34
high compared to the S&P 500 long-term average of 14% (Hargrave, 2020b). Thus,
Euromed’s profitability was very attractive.
• Risk sensitivity analysis: Net income represented 19% of sales in 2015. Calculating the
difference between gross margin as a percentage of sales in 2015 and net income over sales
of the same year, provided the threshold at which profit would disappear. This meant that
if margin reduced from 55% to 35%, there would be no profit for Euromed. A possible
situation under this scenario meant that sales reduced significantly, resulting in reduced
prices and at the same time increased COGS. Nonetheless, the risk that margin would be
reduced by 20% was limited, even in a worst-case scenario.
Euromed had growing sales, good margin, growing net income and excellent ROE. Good
margin is key for efficient growth. Even with growing profitability, Riverside’s intention was
to accelerate profitability during its 5-year investment. With Euromed’s positive performance
up to 2015 from the P&L analysis, in a maturing industry, an investment and strategic plan to
speed up growth looked promising. Next we analyzed the balance sheet.
5.2.2. Balance Sheet Analysis
The main reason behind a Balance Sheet analysis was to examine the financial evolution of the
company and determine its profitability, similar to the P&L analysis. But instead of comparing
revenue with expenses (as the P&L analysis does) the Balance Sheet analysis helps analyze the
assets and liabilities of the company (Martínez, 2012). Like the P&L analysis, we focused on
the “big” numbers on the Balance Sheet to identify its key items, identify problems (if any) and
solve them. While Annex D illustrates Euromed’s Balance Sheet from 2011 to 2015, Annex G
defines the main items to consider. For the detailed analysis we transformed all relevant data
into the short Balance Sheet, presented in Annex E. The short Balance Sheet consists of net
assets part, formed by the need of funds for operations of a company and fixed assets, and the
financing part, formed by equity, provisions and other liabilities and debt. The last item of the
short Balance Sheet is cash, which is produced (or needed) by the company over the analyzed
years (Martínez, 2012).
• Need of funds for operations (NFO): Almost all investment in needed fund for operations
was stock inventory with an average NFO share of 90% from 2011 to 2015. Such a high
amount of inventory lowered Euromed’s risk of shortages and customers got products
when required, which increased customer satisfaction. However, high inventory
automatically stands for high storage (and often insurance) costs and increased the risk of
loss of high amount of products during an incident such as fire or theft (Leonard, 2019).
The stable proportion of stock inventory in NFO over the last five years as well as
continuous low payables to suppliers and other current liabilities indicated a good
management of NFO. The only item with a high increase of 90% from 2011 to 2012 was
receivables. This was a sign of a change in Euromed’s payment terms with customers
(Sagarra, 2019). Receivables continued stable (with little variation) from 2012 to 2015 at
around €5,6 million. The NFO/sales ratio slightly increased in recent years due mainly to
35
a decrease of the payment period from 35 days in 2011 to 25 days in 2015. Average ratio
of the last five years was 64%.
• Fixed assets (FA): Fixed assets increased about 23% from 2011 to 2013. This increase in
FA represents the replacement of an extraction plant from 1979 to increase in-house
production instead of outsourcing. Afterwards, from 2013 to 2015, these fixed assets
decreased again about 20%.
• Net assets (NA): Since net assets are the sum of NFO and FA, they also increased from
2011 to 2013. Afterwards, they stayed relatively constant at around €40 million. NFO
accounted for a little less than two thirds of NA during the analyzed period. NFO
accounting for a bigger share of NA is common for most companies (Martínez, 2012).
While there is no financial mismanagement, an increase of NA usually stands for increasing
sales and a growing company (Sagarra, 2019), as in the case of Euromed.
• Equity (E): There was a logarithmic increase in equity during the last five years. Euromed’s
capital only made around 15% of the equity and stayed fixed at €5,4 million. Other
shareholders funds (accounting for 85% of equity) leveled off from a 9% increase from
2011 to 2012 to 1% increase from 2014 to 2015. Increasing equity was a good sign for the
company.
• Provisions & other liabilities: Provisions and other non-current liabilities amounted to no
more than €1,4 million (€1,1 million on average) in the analyzed time period. No
abnormalities were detected.
• Debt (D): Debt changed drastically from 0 in 2011 to its maximum value of almost €2,5
million in 2013. Subsequently, it slightly decreased to €1,8 million in 2015. This meant
that Euromed needed (apart from the increasing equity) more funds to finance the
increasing NA. However, the decrease in recent years (2014-2015) showed the company
could repay this debt.
• Financing: The three earlier mentioned elements (equity, provisions and other liabilities
and debt) form Euromed’s financing, the funding available to finance NFO and FA
(Sagarra, 2019). Due to the increasing equity from 2011 to 2014 and the sudden increase
of debt in 2013, Euromed’s financing grew rapidly in the beginning (10% in 2012 and 12%
in 2013) and stabilized at around €43 million from 2013 on.
• Cash: Since the value of Euromed’s financing side was greater than its asset side in all the
analyzed years, the company generated money. Euromed ended the year of 2011 with a
cash surplus of over €3 million. In both years 2012 and 2013 NA increased faster than
financing, resulting in a decrease of the cash generated in both years (compared to the
previous one respectively). Hardly any change of NA in 2014 and its decrease in 2015 as
well as little increase of financing in both years let the amount of cash generated increase
again. The average amount of cash during the last five years was €2,5 million, with an
estimated maximum value of €4,1 million for 2015.
36
• Risk sensitivity analysis: Comparing the last two years of Euromed’s short Balance Sheet
there was little decrease in the company’s net assets and increase in financing. This was a
sign for raising the sources of funds (Sagarra, 2019). Additionally, while there was only
little change in receivables and payables, inventory grew continuously. This was the only
risk detected in the Balance Sheet. The very high proportion of stocks in NFO (90%) were
risky because such an excess inventory ties up cash; its stable character stands for a long
inventory turnover. In 2015, inventory turnover accounted for 225 days of inventory. This
could be improved by a better inventory management. Collection period was 45 days,
payment period 25 days. Although it took Euromed more time to receive money from
customers than paying its suppliers, due to high liquidity both metrics can be considered
acceptable and don’t show signs for any risk. The leverage ratio (liabilities divided by
equity (Sagarra, 2019)) was with 21% in 2015 rather low.
Summing up, it can be said that Euromed’s Balance Sheet of the last five years also looked
promising. While both net assets as well as financing increased during the time from 2011 to
2015, Euromed managed to generate cash in each year. The only abnormality detected, which
could turn out risky for the future, was the high amount of inventory, resulting in a high
inventory turnover. This was considered when making the company’s forecast.
5.2.3. Business Analysis and Risks
Based on our analysis, the key of herbal extracts business was R&D investment, quality
assurance, and credibility (proof of concept). Euromed’s supply chain already guaranteed
traceability and high-quality standards. Its long trajectory and clinical studies gave it credibility.
Thus, there was no risk with quality assurance and credibility. Euromed’s R&D had been
successful with the pharma industry, but more R&D was needed to further penetrate the natural
supplements market.
Herbal ingredients were gaining more strength as both pharma clients and end consumers were
looking for more traditional products as detailed in section 4.2. So, synthetic substitutes were a
weak threat. Furthermore, given high barriers for pharma clients to change suppliers and
Euromed’s high quality, competitors were also a weak risk. Product prices and order quantities
were secured by Euromed’s high quality, required by their clients. Additionally, the ingredients
represented a small percentage of their client’s final product cost. Nonetheless, there was an
unexploited market in natural supplements that required higher investment in R&D and
production capacity. Finally, dependence on inventory to ensure supply could result in higher
risk of damages and loss.
To conclude, Euromed had a high-quality product with a low cost to their client but crucial for
the final product certification and success. The company was profitable with a strong
competitive advantage and had good margins. However, investment in R&D and increase
production capacity was required to maximize growth potential. So, through some
restructuring, Riverside expected to improve Euromed’s future cash flows and accelerate its
profitability growth.

37
Forecast Analysis
After the P&L and Balance Sheet analysis, we were able to understand what type of business
(including quality) was for purchase. We also concluded that the reason for purchase was to
improve future cash flows through the plan for acquisition detailed in section 4.5.3. The plan
for acquisition was reflected numerically on the main assumptions for the P&L and Balance
Sheet forecast (see Annex H and Annex I). To develop the forecast, we drew from the following
assumptions:
• Initial price paid: The hypothesis of €80 million as initial price paid was used to develop
the forecast. The price was determined using EV/EBITDA multiple between the ranges of
7,0x to 9,0x. Given the quality of the business as previously analyzed, we estimate that a
value between €70 million to €95 million was realistic. Further analysis on EBITDA
multiple valuation is presented in section 5.4.1.
• Equity invested: Equivalent to 50% of the amount paid (Álvarez-Nóvoa, 2020), as
described in section 4.5.5. The purpose was not to overload the target company with debt
and avoid financial strain after the exit strategy.
• Debt: As little burden as possible placed on Euromed was projected, using a bullet loan.
This would allow the use of cash for Capex, needed for Riverside’s acquisition plan
(Álvarez-Nóvoa, 2020).
The forecast analysis had three main purposes. First objective was to determine if the improved
company would make money at a profit for Riverside. Second objective was to define if there
was a manageable debt balance. Third, this analysis concluded if by the end of the investment
income and debt were similar to the values before the purchase (Martínez, 2012).
Under the assumption that the purchase was done using a new company as explained in section
4.5.5, the analysis was executed individually for Euromed (without considering combination
with the acquiring company). In the forecast analysis, we reviewed the company that Riverside
wanted to create with its investment.
5.3.1. P&L Forecast Analysis
It is better to be conservative, or even pessimist in the assumptions used for the forecast
(Martínez, 2012) due to uncertainty of expectations. With Euromed’s previous performance as
a starting point, assumptions based on Riverside’s investment plan and market trends were
applied to create the forecast (see Annex J). We followed the same steps used to analyze
Euromed’s P&L from 2011-2015. Below are our observations and opinions drawn from the
P&L forecast analysis:
• A 10% sales growth from 2015-2020 was estimated based on Riverside’s investments to
diversify and grow client portfolio. Yearly growth rate was projected 3% higher than if
Euromed continued to operate as it did in the past. Total assumed growth during the 5-year
investment was 61%. The assumption was not as optimistic as it would be only considering
Riverside’s improvement plan, because industry sales growth, projected to decrease (but
remain strong), was contemplated in the assumption.
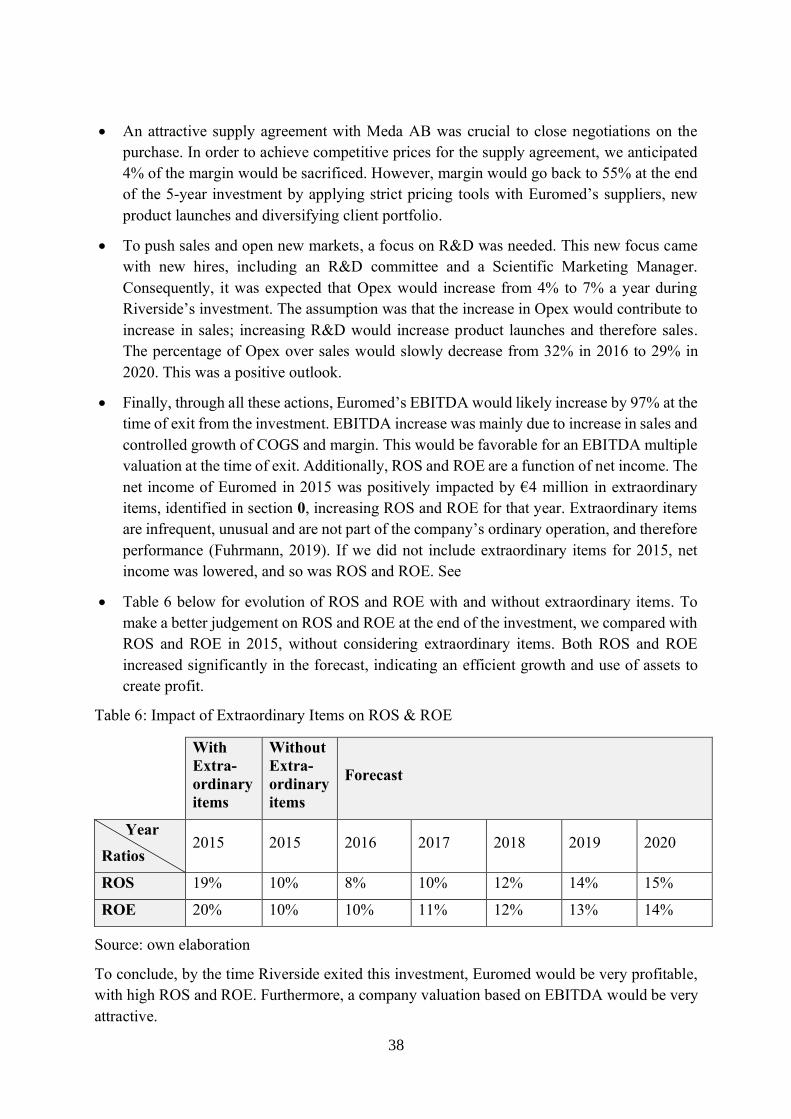
38
• An attractive supply agreement with Meda AB was crucial to close negotiations on the
purchase. In order to achieve competitive prices for the supply agreement, we anticipated
4% of the margin would be sacrificed. However, margin would go back to 55% at the end
of the 5-year investment by applying strict pricing tools with Euromed’s suppliers, new
product launches and diversifying client portfolio.
• To push sales and open new markets, a focus on R&D was needed. This new focus came
with new hires, including an R&D committee and a Scientific Marketing Manager.
Consequently, it was expected that Opex would increase from 4% to 7% a year during
Riverside’s investment. The assumption was that the increase in Opex would contribute to
increase in sales; increasing R&D would increase product launches and therefore sales.
The percentage of Opex over sales would slowly decrease from 32% in 2016 to 29% in
2020. This was a positive outlook.
• Finally, through all these actions, Euromed’s EBITDA would likely increase by 97% at the
time of exit from the investment. EBITDA increase was mainly due to increase in sales and
controlled growth of COGS and margin. This would be favorable for an EBITDA multiple
valuation at the time of exit. Additionally, ROS and ROE are a function of net income. The
net income of Euromed in 2015 was positively impacted by €4 million in extraordinary
items, identified in section 0, increasing ROS and ROE for that year. Extraordinary items
are infrequent, unusual and are not part of the company’s ordinary operation, and therefore
performance (Fuhrmann, 2019). If we did not include extraordinary items for 2015, net
income was lowered, and so was ROS and ROE. See
• Table 6 below for evolution of ROS and ROE with and without extraordinary items. To
make a better judgement on ROS and ROE at the end of the investment, we compared with
ROS and ROE in 2015, without considering extraordinary items. Both ROS and ROE
increased significantly in the forecast, indicating an efficient growth and use of assets to
create profit.
Table 6: Impact of Extraordinary Items on ROS & ROE
With
Extra-
ordinary
items
Without
Extra-
ordinary
items
Forecast
Year
Ratios 2015 2015 2016 2017 2018 2019 2020
ROS 19% 10% 8% 10% 12% 14% 15%
ROE 20% 10% 10% 11% 12% 13% 14%
Source: own elaboration
To conclude, by the time Riverside exited this investment, Euromed would be very profitable,
with high ROS and ROE. Furthermore, a company valuation based on EBITDA would be very
attractive.

39
5.3.2. Balance Sheet Forecast Analysis
To generate Euromed’s Balance Sheet forecast, the company’s historic Balance Sheet, as well
as Riverside’s plan for acquisition presented in section 4.5.3 were taken into account. Annex I
justifies all assumptions applied to the forecast illustrated in Annex K. To analyze the Balance
Sheet forecast from 2016 to 2020, the same “big” numbers from the short Balance Sheet in
section 5.2.2 have been studied. The following results were detected:
• Although Riverside planned to decrease Euromed’s inventory level, NFO was assumed to
stay fix at 64% of total sales. This was a conservative assumption and reflects a
compensation of the inventory improvement with the extension of the payment period. Due
to the sales growth assumption of 10%, NFO increases equal to sales, about 61% total in
the time of the investment. Although the ratio of NFO over sales is not expected to
decrease, considering the past five years, this is an acceptable outlook.
• Fixed assets were projected to increase about 44% from 2015 to 2020. With the objective
of increasing sales, the company had to make several investments. The plan of a new
innovation center as well as the purchase of new machinery explained the growth of fixed
assets. With an increase of only 44% in fixed assets in 5 years, a sales growth of 61% of
total sales within the same time period indicated an effective management strategy for that
line in the balance sheet.
• Goodwill represented 51% of NA at €40,3 million. This meant, price paid was more than
the adjusted book value of equity. Euromed’s market leadership, high-quality standards in
the production process and the industry EBITDA multiple justified the value of the target
company. Furthermore, with operational improvements during investment years, a high
return on investment was expected. As it is prohibited since 2001 by the Financial
Accounting Standards Board (FASB) to amortize goodwill, and only permitted in some
exceptional cases (Investopedia, 2019), we predicted it would stay fix over the years. This
was an acceptable conservative assumption.
• Due to a fast growth of net income between 2016 and 2020, Euromed’s equity was expected
to grow from €40 million in 2015 (post sale) to over €75 million in 2020, an increase of
88%. For the purpose of this forecast, equity only increased with the net income of each
current year respectively (shareholders were not expected to add capital). Thus, this high
growth was a very good sign and reflected the company’s ability to finance a high
proportion of net assets with its own capital.
• Short-term debt was assumed to cover 100% of NFO, in order to maximize cash flow for
shareholders and increase IRR So, it grew 61% in total, equal to NFO and sales. The great
increase of NFO to almost €44 million meant a great sum of assets needed to be financed
with short-term debt. However, with a share of 33% of the total financing part (compared
to 57% equity) this amount of STD placed less financial burden on Euromed.
Since we assumed to balance missing financing with long-term debt in form of a bullet
loan, this part of debt stayed constant at €11,8 million for all five years. With only 15% of
total financing in 2015, this LTD comprised a small proportion of funds in comparison to

40
STD with 34% or equity with 50%. Since both equity as well as STD increased, the
proportion of LTD in the total financing part decreased to 9% in 2020, which was a positive
outlook.
Total debt increased heavily in 2015 after the sale to finance the increase of net assets due
to goodwill. Over the time of the investment total debt was assumed to grow about 43%.
However, while total debt made almost 50% of financing in 2015, it was expected to only
account for 42% of financing in 2020. This decrease of the share of total debt in financing
was a positive sign for a manageable debt balance, reducing financial risk. It showed less
dependence of Euromed on external fund from banks or other lenders.
• We assumed financing equaled net assets in 2015 after the sale. So, the cash account at the
beginning of the project summed zero. NA were expected to grow about 28% from €80
million in 2015 (post sale) to €102,2 million in 2020. In contrast, financing would grow
65% total, from €80 million in 2015 to almost €132 million in 2020, based on forecast
assumptions. With financing growing faster than net assets, the company was expected to
generate cash in each year of the investment. Given the slightly exponential growth of
financing and the rather linear growth of net assets, the expected cash generated per year
increased from €2,8 million in 2016 to over €9,4 million in 2020.
Compared to the previous five years it was therefore estimated that Euromed’s operations
would be very profitable and that the company, with support from Riverside, would be able to
establish a sustainable growth.
Profitability Analysis
The forecast analyses gave insight on whether the restructured version of Euromed would be
profitable. The next step was to quantify how much money a five-year investment in Euromed
would make for Riverside at the time of exit. In order to analyze profitability, we had to
determine the price to pay for the required return on investment. This analysis included multiple
valuation, DCF valuation from the buyer and seller perspectives, IRR analysis and closing
negotiations.
5.4.1. Valuation with EBITDA multiple
There were no clear comparable companies, given the different operation combinations,
profitability and sizes of companies in the natural extracts business, but Álvarez-Nóvoa (2020)
had references based on recent acquisition transactions of natural extracts companies used to
determine a reasonable EBITDA multiple. A summary of comparable companies and multiples
is in Annex L. The total average for comparable companies EV/EBITDA multiple in 2015 was
8,2x. In order to have a price range for negotiation, price valuation was conducted with
multiples between 7,0x and 9,0x. Valuation using three multiple options was calculated as
indicated in methodology section 3.2. See Table 7 for outcomes.
Table 7: EBITDA Multiple Results
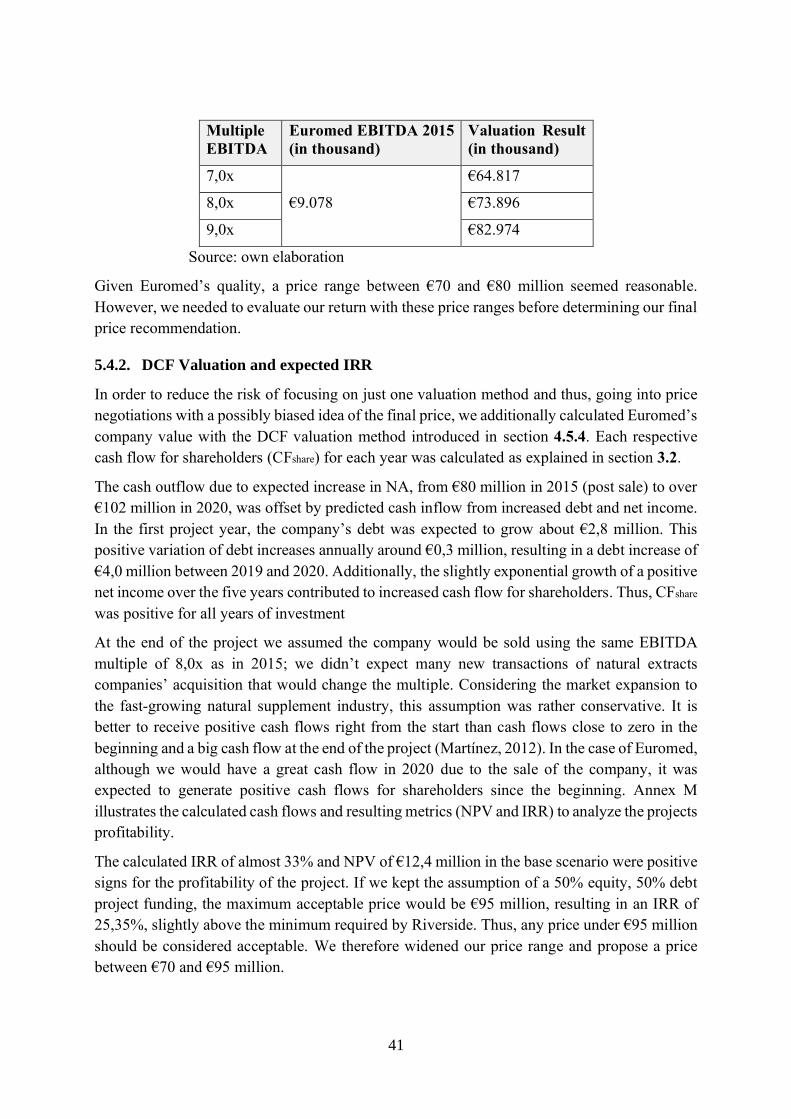
41
Multiple
EBITDA
Euromed EBITDA 2015
(in thousand)
Valuation Result
(in thousand)
7,0x
€9.078
€64.817
8,0x €73.896
9,0x €82.974
Source: own elaboration
Given Euromed’s quality, a price range between €70 and €80 million seemed reasonable.
However, we needed to evaluate our return with these price ranges before determining our final
price recommendation.
5.4.2. DCF Valuation and expected IRR
In order to reduce the risk of focusing on just one valuation method and thus, going into price
negotiations with a possibly biased idea of the final price, we additionally calculated Euromed’s
company value with the DCF valuation method introduced in section 4.5.4. Each respective
cash flow for shareholders (CFshare) for each year was calculated as explained in section 3.2.
The cash outflow due to expected increase in NA, from €80 million in 2015 (post sale) to over
€102 million in 2020, was offset by predicted cash inflow from increased debt and net income.
In the first project year, the company’s debt was expected to grow about €2,8 million. This
positive variation of debt increases annually around €0,3 million, resulting in a debt increase of
€4,0 million between 2019 and 2020. Additionally, the slightly exponential growth of a positive
net income over the five years contributed to increased cash flow for shareholders. Thus, CFshare
was positive for all years of investment
At the end of the project we assumed the company would be sold using the same EBITDA
multiple of 8,0x as in 2015; we didn’t expect many new transactions of natural extracts
companies’ acquisition that would change the multiple. Considering the market expansion to
the fast-growing natural supplement industry, this assumption was rather conservative. It is
better to receive positive cash flows right from the start than cash flows close to zero in the
beginning and a big cash flow at the end of the project (Martínez, 2012). In the case of Euromed,
although we would have a great cash flow in 2020 due to the sale of the company, it was
expected to generate positive cash flows for shareholders since the beginning. Annex M
illustrates the calculated cash flows and resulting metrics (NPV and IRR) to analyze the projects
profitability.
The calculated IRR of almost 33% and NPV of €12,4 million in the base scenario were positive
signs for the profitability of the project. If we kept the assumption of a 50% equity, 50% debt
project funding, the maximum acceptable price would be €95 million, resulting in an IRR of
25,35%, slightly above the minimum required by Riverside. Thus, any price under €95 million
should be considered acceptable. We therefore widened our price range and propose a price
between €70 and €95 million.
42
5.4.3. Value for the Seller
As part of preparation for the negotiation process, it was convenient to have an idea of the target
company’s value for the seller. Nonetheless, the value of the company might not be the same
as the asking price (Martínez, 2012). In order to calculate the value of the company for the
seller, we assumed that Euromed continued operating as it had in the past.
Based on financial statements up to 2015, we assumed that sales would continue to grow at 7%,
as it had for the last two years. We also assumed that the margin would remain unchanged and
Opex would continue as 4% of total sales. The valuation was under the assumption that the
seller would invest the same amount on fixed assets as the annual amount they depreciate. We
did not know the return required by the seller but expected it to be less than the 25% that
Riverside required. Thus, we worked with an assumption of a required 15% return. This is an
arbitrary number (it is whatever the investor finds reasonable (Martínez, 2012)). We used a
15% required return considering the following points of reference by Martínez Abascal (2012):
• Historic return of stock market (S&P500, DAX, IBEX) was around 10% in developed
countries.
• Usually private companies required a 5% higher return than publicly listed companies.
Based on these assumptions that the seller would not improve Euromed, we calculated CFshare
and present value (PV) of Euromed with a result for PV of €58,8 million (see Annex N).
However, it was likely that the seller perceived less risk in their own operation and had more
optimistic assumptions. Furthermore, it was also likely that their required return was less than
we assumed. Therefore, more optimistic assumptions and lower required return would mean a
higher value for the seller (Martínez, 2012). For example, a required return of 12% would result
in a €66 million value and a 10% return gave a €71,7 million value.
Negotiation
This case study provided little room for negotiation since it was a sealed bid auction.
Nonetheless, negotiations after the LOI can take place to determine final agreements in
contracts. To close the transaction, we determined our recommended negotiation for this case
study and the ZOPA based on seller’s valuation. Key aspects we defined for recommended
negation were:
• Buyer’s walk away point: As mentioned before, the maximum acceptable price suggested
for Riverside was €95 million, which resulted in an IRR of 25,35%. This can be considered
as the walkaway point. Anything above would be too costly and not bring the desired
return.
• Initial price (anchor): Based on the calculated price range between €70 and €95 million and
the calculated seller’s value of at least around €60 million, we would suggest a bid of €70
million as anchor price for Euromed in the first offer. While this offer would be above
seller’s value, it is the minimum reasonable price with a low EBITDA multiple. Riverside
would, however, have enough negotiation opportunities to adapt this initial price to

43
increase chances for winning the auction process. If Meda AB accepted the anchor price
of €70 million, it would result in a great return for Riverside (about 38,5% IRR).
• Seller’s walk away point: As described in the previous section 5.4.3, conservative
assumptions from seller’s side and the average required return of 15% would result in a PV
of almost €60 million. However, we assumed the seller’s minimum acceptable price to be
higher, between €65 and €70 million. The seller might not consider any buyer offering a
price below this walk away point.
• Aspiration value (our objective): Since our proposed price ranges from €70 to €95 million
and we assumed the seller would push the price higher in order to gain more money from
the transaction, our aspiration value was €80 million. With this price, both the seller and
the buyer would be satisfied. This value would be around €10 to €15 million higher than
the seller’s walk away point. So, this would be a good deal for the seller. On the other side,
Riverside would still pay €15 million less than its maximum acceptable price, generating
an expected IRR for the investment’s base scenario of 33%, eight percentage points above
the required IRR.
Risk Analysis
Risk is any variability in investor’s profit due to changes in expected cash flow (Martínez,
2012). To evaluate risk for the investor, we first identified risk factors and then we quantified
them. All our hypothesis for assumptions were risk factors. We focused on sales growth, margin
and Opex for the risk analysis, as they had direct impact on the company’s profitability. By
quantifying risk, we could determine how sensible IRR and NPV were to variations in these
risk factors. First, we determined ranges considering a worst-case scenario and a best-case
scenario for sales growth, margin and Opex, as detailed in Annex H. Then, we calculated the
IRR and NPV for each range individually. By only changing one variable at a time, and keeping
all others constant, we could determine which variable had the greatest impact on profitability
(Martínez, 2012). See Table 8 for results.

44
Table 8: Sensitivity Analysis (all other things equal)
IRR and NPV for different sales growth rates
Variable Worst Base Best Range
g Sales, annual 8% 10% 12%
IRR 25% 33% 40% 15%
NPV (thousands $) 46 12,389 25,535 25,489
IRR and NPV for different increases of gross margin
Variable Worst Base Best Range
g Margin 0% 1% 2%
IRR shareholder 26% 33% 38% 12%
NPV (thousands $) 1,726 12,389 23,053 21,327
IRR and NPV for different increases of Opex
Variable Worst Base Best Range
g Opex 9% 7% 5%
IRR shareholder 28% 33% 37% 9%
NPV (thousands $) 4,297 12,389 19,976 15,679
IRR and NPV for different EBITDA Multiples at exit
Variable Worst Base Best Range
Multiple 7 8 9
IRR shareholder 29% 33% 36% 7%
NPV (thousands $) 6,533 12,389 18,246 11,713
Source: own elaboration
The sensitivity analysis applied to each variable individually allowed us to measure the degree
of uncertainty and impact that each variable had on expected profitability (Martínez, 2012). The
greater the range between the worst-case and best-case scenario, the higher uncertainty of the
profitability that can be reached. Thus, the result of the sensitivity analysis showed that sales
growth created the greatest uncertainty on expected profitability, followed by growth in margin
and then by growth in Opex. The multiple used for the exit strategy generated the least
uncertainty on potential profitability. On the other hand, value added or reduced with a
percentage point increase showed the impact of the variable on profitability. One percentage
point (pp) increase of sales growth per year added €6,3 million of value. Margin growth had
the greatest impact per pp change, with an added €10,6 million of value for each pp increase.
On the other hand, one pp increase of Opex decreased value by €3,9 million. Finally, an increase
of one digit in the selling multiple added €5,86 million of value. Thus, results showed that to
increase the profitability of Euromed, increasing margin growth was key to achieving the most
effect.
45
We cannot assure that everything will not go wrong in the future. So, as investors, we should
always prepare for the worst. In order to prepare for the worst, we performed a worst-case
scenario sensitivity analysis. Our worst-case analysis assumed that everything went wrong with
sales growth, margin and Opex at the same time (see Table 8 for worst case scenario of each
variable). In a worst-case scenario, Riverside could get an IRR of almost 5%. Yet, Riverside’s
restructuring plan limited the risks for a pessimistic outcome in sales, margin and Opex growth.
Given the controlled risk, we would recommend the acquisition of Euromed.
CONCLUSION
The objective of this work was to develop a real-world case study that analyzed if a private
equity acquisition in the middle market fit the strategy of the fund to create sustainable growth.
We therefore developed and analyzed the case of Riverside’s investment in Euromed using both
qualitative as well as quantitative methods. During the qualitative phase we conducted primary
research by interviewing the CEO of the target company, Xavier Roig and the acquiring
company’s transaction team leader in Spain, Rafael Álvarez-Nóvoa. Secondary research on the
internet was done to complement information obtained from the interview. The quantitative
phase consisted in analyzing financial statements of the five years prior to the case to create a
P&L and Balance Sheet forecast for the five-year investment period. We then used two
valuation methods, DCF using CFshare and EBITDA multiple, to determine the price range for
the desired return of investment and measure risk. The case study will serve as a learning tool
to improve business judgement and skills required for a private equity investment decision
making process in the middle market using LBO for sustainable growth. Through the
development of this case study we drew three main conclusions that will serve as learning
points, discussed in the following paragraphs.
First, based on our analyses results of Euromed’s strategic fit with Riverside’s criteria for
investment, Euromed’s profitability and risk prior and post investment, we would invest in
Euromed if we were Riverside. The investment decision process is not just about profitability.
Euromed met most of Riverside’s criteria for an investment which included company value,
international presence, strong business model, market leadership and strong management team.
Financial statement analysis of the five years prior to the investment showed strong
performance with constant sales growth and profitability. With Riverside’s restructuring plan,
our base scenario showed an IRR of 33% under initial price assumption of €80 million, well
within our ZOPA. Risks of a worst-case scenario of 5% IRR are limited with Riverside’s
restructuring plan. Furthermore, under the industry-based point of view, Euromed’s growth
potential was strong given a moderate competition level overall with weak supplier bargaining
power and high entry barriers. From the resource-based point of view, Euromed’s competitive
advantage in quality, traceability and clinical trials for credibility was extremely valuable for
its clients, with less than five firms worldwide with these abilities (Álvarez-Nóvoa, 2020).
Achieving these competitive advantages took many years and investment in R&D making it
hard to imitate by competitors and integrate in the organization. Euromed’s hard to imitate
competitive advantage ensured the company’s success.

46
Second, the decision-making process and valuation methods used to analyze this case gave a
reasonable approximation to reality, which resulted in an exemplary investment for sustainable
growth and high returns for investors. Furthermore, real results exemplify that sustainable
growth can be obtained from an LBO. After negotiations and the due diligence in summer 2015
both parties agreed on the price of $87,05 million (S&P Capital IQ, 2020a), converted to a little
over €80 million. Riverside complied all variables required by Meda AB and had two additional
important advantages over the competition: The prior contact with the target company and high
liquidity, which could serve Euromed for its future investments (Roig, 2020). After this
agreement both firms signed the sales and purchase agreement and as agreed in the negotiations,
a supply contract for over 10 years between Euromed and Meda AB was finalized. With this
contract, Meda secured Euromed as their ingredient’s provider for key products. The sale was
closed on December 2015 (Álvarez-Nóvoa, 2020).
After the transaction, Euromed reached goals sooner than expected. With an average sales
growth of 14% from 2015 to 2018 (Sabi, 2020), higher than expected by this time, the company
was able to grow sales about 53% in just three years (The Riverside Company, 2019). COGS
increased similar to sales. But since the company managed to control the growth of Opex, which
only increased about 39%, Euromed’s EBITDA was almost doubled from €9 million in 2015
to €17,6 million in 2018 (Sabi, 2020). The cooperation between Euromed and Riverside seemed
like a dream team, reaching their objectives in just three years (The Riverside Company, 2019).
Net income was improved from €8,2 million to €12,7 million, a significant increase of almost
55% (Sabi, 2020).
The positive transformation of Euromed was also rapidly notable in its Balance Sheet. NFO
increased about 39%. And while the payment period was increased from 25 to 37 days, both
the collection period (from 45 to 40 days) as well as days of inventory (from 225 to 190 days)
decreased significantly. This resulted in a decrease of the NFO/sales ratio from 64% to 56%.
FA increased about 32%, faster than we expected it to grow, but due to the faster sales growth,
it is understandable. Equity increased as expected about 39%. Since goodwill is not accounted
for in Sabi database, debt accounted for significantly less than expected and decreased about
24%. Cash surplus increased from €4,1 million in 2015 to over €5 million in 2018 (Sabi, 2020).
Although we expected a faster growth of cash in our forecast, the company generated positive
cash flow for shareholders from the beginning of the project on. This shows that, more cash
was used to finance operations rather than investing this cash flow in equity.
Third, knowing Euromed’s business well and the early timing of exit were two key factors for
the successful outcome of Riverside’s investment. The rapid achievement of goals, possibly
reached so fast due to previously getting to know Euromed’s business, let Riverside start an
exit process earlier than planned. According to Álvarez-Nóvoa (2020) timing the right moment
to sell was an important factor for a positive project outcome. On one hand, since all objectives
had already been reached, the private equity firm and its investments were no longer necessary
for the target company’s success. It was time for an industry player to use the created assets and
work with the established capital. As suggested by McKinsey & Company (2018) further
growth potential of the target company makes it more attractive for possible new owners, as it
47
was the case of Euromed. On the other hand, the market offered attractive sale conditions with
higher EBITDA multiples than the one used in its previous purchase. In 2017, M&A multiples
“remained at their highest levels on more than a decade” (Green, Hayes, Seghers, & Zaets,
2018). So, Riverside decided to sell Euromed for over $220 million to Dermapharm AG (S&P
Capital IQ, 2020a), a leading pharmaceutical company from Germany (Dermapharm AG, n.d.).
The early exit brought Riverside an even higher IRR than planned. Xavier Roig is convinced
that “after having enjoyed a fantastic experience with Riverside, [Euromed] continues to pursue
the initiated course” (Roig, 2020).
Although this case study provides empirically rich contribution to the theory and application of
decision-making process, it has limitations. A forecast is an educated approximation of the
future. However, given the variability of critical factors that determine an investment’s success
such as sales growth, gross margin and Opex, a forecast cannot be 100% accurate. While risk
can be limited, it cannot be eliminated. Furthermore, the generalization of a single case study
must be done carefully, adapting to each situation as it is not a robust sample.
This case study provides evidence that a PE firm can create sustainable value in the middle
market using an LBO. However, we are far from having diminishing marginal returns on case
studies that improve skills for LBOs in middle market with value creation as very few case
studies on this topic exist in published sources. Thus, there is room for further research on the
subject for a more robust sample of successful PE invesments in this area of research.
48
REFERENCES
Álvarez-Nóvoa, R. (2020, April 13). Riverside Partner in Spain. (V. Cardona, J. Siemering, M.
Sagarra, & E. Martínez, Interviewers) Barcelona, Spain.
Amadeus. (2020). MEDA AKTIEBOLAG Key Financials & Employees. Brussels: Bureau van
Dijk Electronic Publisher. Retrieved from Amadeus database
Barber, F., & Goold, M. (2007, September 1). The Strategic Secret of Private Equity. Retrieved
May 29, 2020, from Harvard Business Review: https://hbr.org/2007/09/the-strategic-
secret-of-private-equity
Bloomberg. (n.d.). Meda AB - Company Profile and News. Retrieved April 29, 2020, from
Bloomberg: https://www.bloomberg.com/profile/company/MEDAA:SS
Bray, C. (2014, July 10). Italian Drug Maker Rottapharm Pulls Planned I.P.O. Retrieved from
The New York Times Deal Book: https://dealbook.nytimes.com/2014/07/10/italian-
drug-maker-rottapharm-pulls-planned-i-p-o/
Capital-Riesgo.es. (n.d.). The Riverside Company. Retrieved April 28, 2020, from Capital-
Riesgo.es: http://capital-riesgo.es/en/directory/the+riverside+company+/
Chaplinsky, S., Oppenheimer, S., & Patra, V. (2017, January 20). The Buyout of AMC
Entertainment. Darden Business Publishing Cases, 1-10.
doi:10.1108/case.darden.2016.000293
Chen, J. (2019, August 28). Special Purpose Vehicle (SPV) Definition. Retrieved May 10, 2020,
from Investopedia: https://www.investopedia.com/terms/s/spv.asp
Chen, J. (2020a, April 27). Discounted Cash Flow (DCF) Definition. Retrieved May 5, 2020,
from Investopedia: https://www.investopedia.com/terms/d/dcf.asp
Chen, J. (2020b, April 30). Private Equity Definition. (S. Gordon, Editor) Retrieved June 2,
2020, from Investopedia: https://www.investopedia.com/terms/p/privateequity.asp
Corporate Finance Institute. (2019a, October 30). M&A Process - Steps in the Mergers &
Acquisitions Process. Retrieved May 9, 2020, from Corporate Finance Institute:
https://corporatefinanceinstitute.com/resources/knowledge/deals/mergers-acquisitions-
ma-process/
Corporate Finance Institute. (2019b, December 6). Types of Valuation Multiples - Equity &
Enterprise Value Multiples. Retrieved May 17, 2020, from Corporate Finance Institute:
https://corporatefinanceinstitute.com/resources/knowledge/valuation/types-of-
valuation-multiples/
Dermapharm AG. (n.d.). Unternehmensstandorte - Dermapharm. Retrieved May 29, 2020,
from Dermapharm AG: https://www.dermapharm.de/unternehmensstandorte.html
Emerald Insights. (2020). Case Studies | Emerald Insight. Retrieved from Emerald Insight:
https://www-emerald-com.sire.ub.edu/insight/content/case-studies

49
Euromed S.A. (2015a, December 30). News: Riverside Supplements Growth With Euromed
Acquisition. Retrieved May 3, 2020, from Euromed S.A.: http://www.euromed.eu/#
Euromed S.A. (2015b, n.d.). Product List. Retrieved April 29, 2020, from Euromed S.A.:
http://www.euromed.eu/pdfs/product-list.pdf
Euromed S.A. (n.d.). Company Overview: Euromed S.A. Retrieved April 4, 2020, from
Euromed S.A.: http://www.euromed.es/company/#overview
Euromonitor International. (2011). A Global Overview of Herbal/Traditional Products.
London: Euromonitor International. Retrieved April 06, 2020, from Passport Database
Euromonitor International. (2019). Herbal/Traditional Products in Consumer Health. London:
Euromonitor International. Retrieved April 06, 2020, from Passport database
Euromonitor International. (2020a). Herbal/Traditional Products in Spain- Analysis. London:
Euromonitor International. Retrieved from Passport database
Euromotinor International. (2020b). Market Sizes | Historical. Consumer Health: Euromonitor
from trade sources/national statistics. London: Euromonitor International. Retrieved
April 06, 2020, from Passport database
First Research. (2019). Vitamin, Nutritional Supplement. Fort Mill, SC: Mergent, Inc.
Recuperado el 06 de April de 2020
Fridovich-Keil, J., & Diaz, J. (2020, April 10). Genetically modified organism. Retrieved May
4, 2020, from Encyclopedia Britannica:
https://www.britannica.com/science/genetically-modified-organism
Fuhrmann, R. (2019, April 19). Extraordinary Items vs. Nonrecurring Items: What's the
Difference? Retrieved from Investopedia:
https://www.investopedia.com/articles/investing/042413/financial-statement-
extraordinary-vs-nonrecurring-items.asp
Gale. (2018). Medicinal and Botanical Products. Encyclopedia of Global Industries.
Farmington Hills, MI: Business Insights: Essentials.
GoCardless. (n.d.). Private Equity Definition, Companies, Pros & Cons. Retrieved June 2,
2020, from GoCardless: https://gocardless.com/en-us/guides/posts/what-is-private-
equity/
Green, A., Hayes, W., Seghers, L., & Zaets, E. (2018, July 25). Private equity exit strategies to
create value. Retrieved May 29, 2020, from McKinsey:
https://www.mckinsey.com/industries/private-equity-and-principal-investors/our-
insights/private-equity-exits-enabling-the-exit-process-to-create-significant-value#
Griffin, A. (2014, July 31). Rottapharm bought by Meda, beating valuation in pulled IPO.
Retrieved 6 22, 2020, from Global Capital:
https://www.globalcapital.com/article/mgsrbldsfjzf/rottapharm-bought-by-meda-
beating-valuation-in-pulled-ipo
50
Halton, C. (2019, June 14). Zone Of Possible Agreement (ZOPA) Definition. Retrieved May 9,
2020, from Investopedia:
https://www.investopedia.com/terms/z/zoneofpossibleagreement.asp
Hargrave, M. (2019, April 26). Management Buyout (MBO) Definition. Retrieved May 5, 2020,
from Investopedia: https://www.investopedia.com/terms/m/mbo.asp
Hargrave, M. (2020a, April 30). Goodwill Definition. (A. Drury, Editor) Retrieved May 12,
2020, from Investopedia: https://www.investopedia.com/terms/g/goodwill.asp
Hargrave, M. (2020b, May 13). Return on Equity-ROE. (J. Mansa, Editor) Retrieved May 20,
2020, from Investopedia: https://www.investopedia.com/terms/r/returnonequity.asp
Harris, R. S., & Gaede, J. (2009, July 27). Lonestar Graphite. Darden Business Publishing
Cases, 1-19.
Harvard Business School Publishing. (n.d.). HBP Education Cases. Retrieved June 1, 2020,
from Harvard Business School Publishing:
https://hbsp.harvard.edu/cases/?ab=browse%7Ccases
Hayes, A. (2020a, April 27). Internal Rate of Return - IRR Definition. (J. Mansa, Editor)
Retrieved May 17, 2020, from Investopedia:
https://www.investopedia.com/terms/i/irr.asp
Hayes, A. (2020b, May 31). Return on Sales (ROS) Definition. (J. Mansa, Editor) Retrieved
June 22, 2020, from Investopedia: https://www.investopedia.com/terms/r/ros.asp
Herbalife International of America, Inc. (2020, n.d.). Product Catalog: Herbalife. Retrieved
May 4, 2020, from Herbalife Nutrition: https://catalog.herbalife.com/Catalog/en-US/
Investopedia. (2019, January 10). How Does Goodwill Amortize? Retrieved May 24, 2020,
from Investopedia: https://www.investopedia.com/ask/answers/010815/how-does-
goodwill-amortize.asp
ISO. (2020, March 11). Standards: ISO 9000 Family- Quality Management. Retrieved May 1,
2020, from ISO: https://www.iso.org/iso-9001-quality-management.html
Kagan, J. (2019, April 18). Bullet Loan Definition. Retrieved May 10, 2020, from Investopedia:
https://www.investopedia.com/terms/b/bulletloan.asp
Kenton, W. (2019, July 10). Inventory Definition. Retrieved June 19, 2020, from Investopedia:
https://www.investopedia.com/terms/i/inventory.asp
Kenton, W. (2020, April 27). Net Present Value (NPV). (J. Mansa, Editor) Retrieved May 17,
2020, from Investopedia: https://www.investopedia.com/terms/n/npv.asp
Leonard, K. (2019, March 5). Advantages & Disadvantages of Excess Inventory. Retrieved May
21, 2020, from Chron.com: https://smallbusiness.chron.com/advantages-disadvantages-
excess-inventory-21908.html
Loutskina, E., Sinha, M., & Ransler, C. (2010, October 28). Husk Power Systems: Financing
Expansion. Darden Business Publishing Cases, 1-20.
doi:10.1108/case.darden.2016.000159
51
MarketLine. (2015). Biotechnology in Spain. MarketLine Industry Profile. MarketLine.
Retrieved April 06, 2020, from MarketLine Advantage database
MarketLine. (2019). Global Biotechnology. MarketLine. Retrieved from MarketLine
Advantage database
Martínez, E. (2012). Finanzas para Directivos (2da ed.). Madrid, Spain: McGraw Hill/
Interamericana de España, S.L.
Mayo Clinic Staff. (2017, October 14). Glucosamine. Retrieved May 4, 2020, from Mayo
Clinic: https://www.mayoclinic.org/drugs-supplements-glucosamine/art-20362874
Merriam-Webster. (n.d.). Biogeneric Medical Definition. Retrieved June 22, 2020, from
Merriam-Webster Medical Dictionary: https://www.merriam-
webster.com/medical/biogeneric
Nasri, H., Baradaran, A., Shirzad, H., & Rafieian-Kopaei, M. (2014). New concepts in
nutraceuticals as alternative for pharmaceuticals. International journal of preventive
medicine, 5(12), 1487-1499.
National Center for Complementary and Integrative Health. (2016, September n.d.). Health:
Horse-Chestnut. Retrieved April 29, 2020, from National Center for Complementary
and Integrative Health: https://www.nccih.nih.gov/health/horse-chestnut
Palepu, K. G., Khanna, T., & Bullock, R. J. (2007, October 4). Blue River Capital. Harvard
Business School, Case 708-448, 1-19.
Peng, M. W. (2013). Global Strategy. Mason, OH: South-Western Cengage Learning.
Quian Peng, W., & Chow, V. (2013, October 28). Cathay Capital: An Entrepreneurial Private
Equity Fund with a Cross-Border Investment Model. The Hong Kong University of
Science and Technology, 1-23.
Raviv, A., Feuer, R., Mehrotra, P., & Rossman, P. (2017, January 20). Maytag: Takeover
Strategies. Kellogg School of Management Cases, 1-18.
doi:10.1108/case.kellogg.2016.000196
Rhodes-Kropf, M., & Burbank, N. (2013, March 5). Brazos Partners and the Tri-Northern Exit.
Harvard Business School, Case 813-157, 1-26.
Roig, X. (2020, April 28). CEO Euromed. (V. Cardona, J. Siemering, M. Sagarra, & E.
Martínez, Interviewers) Barcelona, Spain.
Ruback, R. S., & Yudkoff, R. (2011, February 15). Gemini Investors. Harvard Business School,
Case 211-066,, 1-8.
S&P Capital IQ. (2020a). Company Profile: Euromed SA. New York: S&P Capital IQ.
Retrieved from S&P Capital IQ database
S&P Capital IQ. (2020b). Company Profile: Meda AB. New York: S&P Capital IQ. Retrieved
from S&P Capital IQ database

52
S&P Capital IQ. (2020c). Company Profile: The Riverside Company. New York: S&P Capital
IQ. Retrieved from S&P Capital IQ database
Sabi. (2020). Euromed S.A. Financial & Ratios Global Format. Brussels: Bureau Van Dijk
Electronic Publishing. Retrieved from Sabi database
Sagarra, M. (2019). Economic and financial analysis. Multinational Financial Management
(pp. 1-13). Barcelona: University of Barcelona.
Segal, T. (2020, April 15). Understanding Private Equity (PE). Retrieved June 1, 2020, from
Investopedia: https://www.investopedia.com/articles/financial-careers/09/private-
equity.asp
Smith, D., Halperin, L., & Friedman, M. (2017). The Restructuring of Danfurn LLC1. Darden
Business Publishing Cases, 1-10. doi:10.1108/case.darden.2016.000316
Snow, B. (2018). Mergers & Acquisitions For Dummies. Hoboken, NJ, United States of
America: John Wiley & Sons.
Stowell, D., & Rainor, M. (2017, 1 20). The Toys “R” Us LBO. Kellogg School of Management
Cases, 1-23. doi:10.1108/case.kellogg.2016.000366
Technavio. (2018, December). Global Botanical Extracts Market. London: Technavio.
Retrieved April 6, 2020, from https://www.technavio.com/report/global-botanical-
extracts-market-industry-analysis
The Riverside Company. (2019, January 7). The Riverside Company - Euromed case study
2018. Retrieved April 5, 2020, from Vimeo: https://vimeo.com/309956035
The Riverside Company. (2020a, n.d.). Team: The Riverside Company. Retrieved May 5, 2020,
from The Riverside Company: https://www.riversidecompany.com/team/
The Riverside Company. (2020b, n.d.). Who we are: The Riverside Company. Retrieved May
5, 2020, from The Riverside Company: https://www.riversidecompany.com/who-we-
are/
Tuovila, A. (2019, September 30). Sunk Cost Definition. Retrieved May 16, 2020, from
Investopedia: https://www.investopedia.com/terms/s/sunkcost.asp
Ulrich, D., & Allen, J. (2016, September 8). Private Equity’s New Phase. Retrieved June 1,
2020, from Harvard Business Review: https://hbr.org/2016/08/private-equitys-new-
phase
World Health Organization. (2020, February n.d.). International Meetings of World
Pharmacopoeias. Retrieved April 30, 2020, from World Health Organozation:
https://www.who.int/medicines/areas/quality_safety/quality_assurance/resources/qas_
worldpharmmeetings/en/
Ying, R. K. (2017). Case Study Research and Applications: Design and Methods (6th ed.).
London: SAGE Publications.

53
ANNEXES
Annex A: In-Depth Interview with Rafael Álvarez-Nóvoa Moderation Guide Topics
Topic Justification
1. Understanding
Euromed’s business
a. Product
b. Clients
c. Competitive
advantage
The first step when investing in a company is to understand the
business (Martínez, 2012). Understanding a business from the
buyers perspective includes understanding what Euromed sold,
their clients and their competitive advantage. This provides
context to determine growth potential, problems that need to be
solved (if any) and strategic fit with the fund’s criteria. If the
business fits with the fund’s startegy (investment criteria),
understanding the business also allows for more accurate
assumptions for the financial forecasts used to valuate the
company.
2. Identification of
investment
opportunity
It is important to comprehend what Riverside identified in
Euromed that resulted attractive for them to invest in the
company.
3. Investment criteria The investment criteria provides the 3-5 main standards to
determine if the target company fits the fund’s strategy.
4. Acquisition process Once the private equity knows why they are buying (strategic
fit), it’s important to understand all the steps the private equity
made to make their final decision.
5. Valuation methods Understating the valuation method a firm uses teaches us how
the company determines how much it expects to make and how
much it can pay. Thus, Riversides perspective provides insight
on how Rivierside determined what Euromed was worth to them
in 2015 and profitability of the investment at a given bid price.
6. Negotiation process Insight on the negotiation process provides information on any
significant detail to highlight, such as who they negotiated with
and what information was used as leverage to determine price
and other conditions.
7. Financing of the
operation
A big part of the investment process is determening how the
operation will be financed. This decision determines the debt
burden placed on the target company. For example, a target will
have a higher debt burden if levarage was used for the operation
and debt was transferred to the target company. Financing of the
operation impacts the forecast of future performance of the
company used in DCF valuation menthod as it is related with the
different elements used to determine internal rate of return (IRR)
(Martínez, 2012).

54
8. Final agreements for
acquisition
The final agreement serves as a point of reference for the
decision making process that is being simulated in this case
study as a teaching tool. Thus, by the end of the case study, we
can conclude if we agree with the decision Riverside made and
identify if anything could have been done differently.
9. Exit Strategy A goal must be established to determine if an investment will be
successful or not. Along with initial price paid and growth from
restructuring plan, the exit strategy is one of the main drivers of
profitability, which is a key determinant on whether to invest or
not in the target company (Martínez, 2012).
10. About Riverside Knowing about Riverside shed’s light on their intentions with
Euromed, track record, way of operation and gives context to
their decision making process. Furthermore, it exemplifies the
theoretical framework of how a private equity operates in a real
case scenario.
11. Riverside’s
contribution to
Euromed
Riverside’s contribution to Euromed reflects the firms plans for
acquisition (what Riverside intends to do with Euromed in order
to get a return on their investment; this is their restructuring plan)
and real outcome of the case as point of reference. Based on
Riverside’s restructuring plan, assumptions for P&L and
Balance Sheet forecast can be fine tuned.
Source: adapted from Martínez Abascal, (2012)
Annex B: In-Depth Interview with Xavier Roig Moderation Guide Topics
Topic Justification
1. Euromed’s History Euromed’s history provides context to properly analyze
evolution of financial statements. Looking at the past helps
predict the future, which is needed to create assumptions for
P&L and Balance Sheet forecasts for profitability and valuation
analysis.
2. Understanding
Euromed’s business
a. Product
(including details
of number of
product families
or types)
b. Clients
(markets,
location,
quantity)
c. Competitive
advantage
Obtaining business information directly from the source
(Euromed) will provide context on Riverside’s interpratation of
the business. It also provides a deeper, more detailed,
explanation of Euromed’s operation to fine tune and critic
Riverside’s decision making process analysis.

55
3. Negotation Process This will allow us to get Euromed’s perspective of the
negotiation, keeping in mind that the seller is Meda (Euromed’s
parent company at the time). It will give us insight on how top
management felt about the acquisition. We can expect good
performance from a content management team and visa versa.
4. Final agreements for
acquisition
This information is used to complement and validate data
provided from Riverside’s perspective. It also allows to probe if
management received any compensation in shares (a common
practice in PE (Barber & Goold, 2007)).
5. Exit Strategy Provides complementary information to data provided by
Riverside.
Source: adapted from Martínez Abascal, (2012)
Annex C: P&L from 2011-2015
P&L (Thousand euros) 2011 2012 2013 2014 2015
Operating revenue / turnover 34.124 34.027 37.115 39.872 42.592
COGS 14.741 14.233 16.643 18.245 19.357
Gross profit 19.383 19.794 20.472 21.627 23.235
Cost of employees 5.310 5.458 5.630 5.946 6.477
Other operating items 6.788 7.027 7.251 7.627 7.680
Opex 12.098 12.485 12.881 13.573 14.156
EBITDA 7.285 7.309 7.591 8.054 9.078
Depreciation 1.589 1.535 1.595 1.962 2.047
EBIT Operating P/L 5.696 5.774 5.996 6.092 7.031
Financial revenue 21 74 108 67 24
Extraordinary P/L 47 428 87 125 4.008
P/L before tax 5.428 6.349 5.845 6.950 11.433
Taxation 1.489 1.353 1.499 2.158 3.198
P/L for period 3.938 4.996 4.347 4.792 8.234
P/L for period 3.938 4.996 4.347 4.792 8.234
P&L ratios 2011 2012 2013 2014 2015
Growth of sales 12% 0% 9% 7% 7%
Gross Margin / Sales 57% 58% 55% 54% 55%
Growth of opex 8% 3% 3% 5% 4%
Opex / Sales 35% 37% 35% 34% 33%
EBITDA / Sales 21% 21% 20% 20% 21%
ROS (Net income / Sales) 12% 15% 12% 12% 19%
RONA (EBIT / Net assets) 18% 16% 15% 15% 18%
ROE (Net income / Equity) 12% 14% 11% 12% 20%
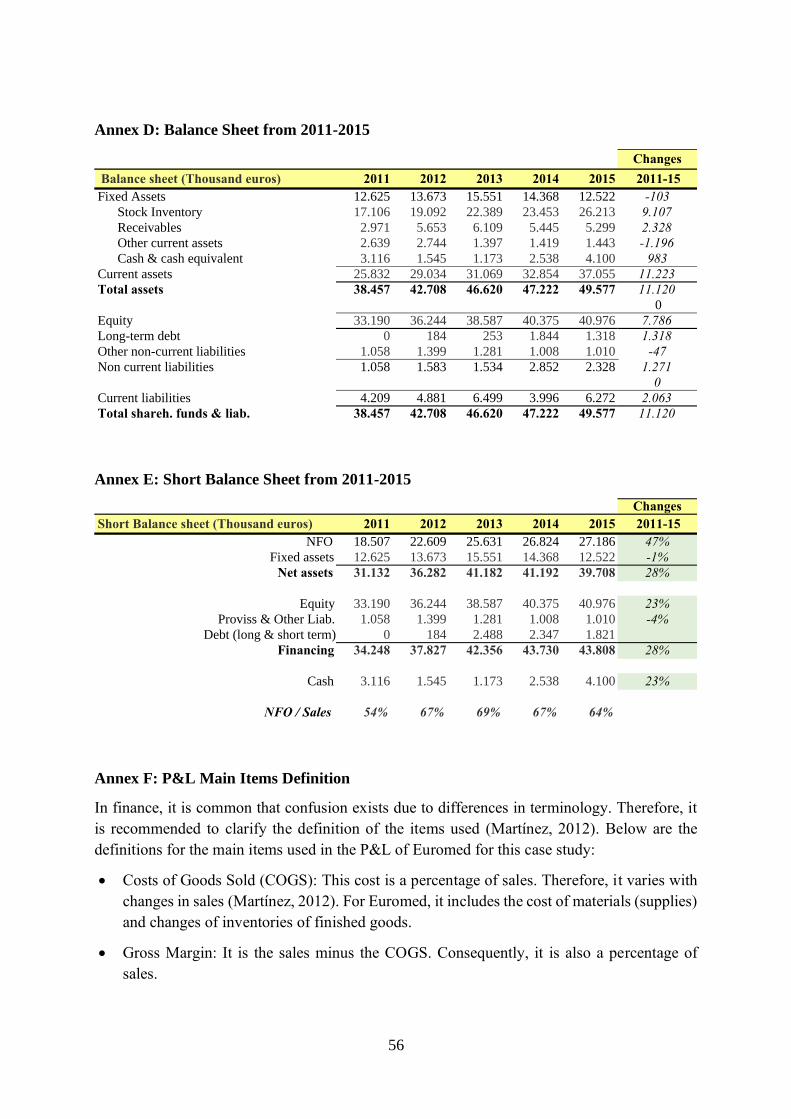
56
Annex D: Balance Sheet from 2011-2015
Annex E: Short Balance Sheet from 2011-2015
Annex F: P&L Main Items Definition
In finance, it is common that confusion exists due to differences in terminology. Therefore, it
is recommended to clarify the definition of the items used (Martínez, 2012). Below are the
definitions for the main items used in the P&L of Euromed for this case study:
• Costs of Goods Sold (COGS): This cost is a percentage of sales. Therefore, it varies with
changes in sales (Martínez, 2012). For Euromed, it includes the cost of materials (supplies)
and changes of inventories of finished goods.
• Gross Margin: It is the sales minus the COGS. Consequently, it is also a percentage of
sales.
Changes
Balance sheet (Thousand euros) 2011 2012 2013 2014 2015 2011-15
Fixed Assets 12.625 13.673 15.551 14.368 12.522 -103
Stock Inventory 17.106 19.092 22.389 23.453 26.213 9.107
Receivables 2.971 5.653 6.109 5.445 5.299 2.328
Other current assets 2.639 2.744 1.397 1.419 1.443 -1.196
Cash & cash equivalent 3.116 1.545 1.173 2.538 4.100 983
Current assets 25.832 29.034 31.069 32.854 37.055 11.223
Total assets 38.457 42.708 46.620 47.222 49.577 11.120
0
Equity 33.190 36.244 38.587 40.375 40.976 7.786
Long-term debt 0 184 253 1.844 1.318 1.318
Other non-current liabilities 1.058 1.399 1.281 1.008 1.010 -47
Non current liabilities 1.058 1.583 1.534 2.852 2.328 1.271
0
Current liabilities 4.209 4.881 6.499 3.996 6.272 2.063
Total shareh. funds & liab. 38.457 42.708 46.620 47.222 49.577 11.120
Changes
Short Balance sheet (Thousand euros) 2011 2012 2013 2014 2015 2011-15
NFO 18.507 22.609 25.631 26.824 27.186 47%
Fixed assets 12.625 13.673 15.551 14.368 12.522 -1%
Net assets 31.132 36.282 41.182 41.192 39.708 28%
Equity 33.190 36.244 38.587 40.375 40.976 23%
Proviss & Other Liab. 1.058 1.399 1.281 1.008 1.010 -4%
Debt (long & short term) 0 184 2.488 2.347 1.821
Financing 34.248 37.827 42.356 43.730 43.808 28%
Cash 3.116 1.545 1.173 2.538 4.100 23%
NFO / Sales 54% 67% 69% 67% 64%

57
• Operating expenses (Opex): These expenses are salaries and other fixed costs such as
utilities. Theoretically it is a fixed expense but in practice it varies with sales (Martínez,
2012).
• Earnings before interest, taxes, depreciation and amortization (EBITDA): Also known as
operating income. The operating income is calculated by subtracting Opex from the gross
margin (Martínez, 2012).
Annex G: Balance Sheet Main Items Definition
In finance, it is common that confusion exists due to differences in terminology. Therefore, it
is recommended to clarify the definition of the items used (Martínez, 2012). Below are the
definitions for the main items used in Euromed’s Balance Sheet for this case study:
• Cash: In form of liquid money (cash), this represents current accounts and temporary
financial investments (Martínez, 2012).
• Receivables: Invoices representing the money that customer owe the company (Martínez,
2012).
• Stock inventory: Stock necessary for operations (Martínez, 2012). This inventory
accumulation can be raw materials, work-in progress and/or finished goods (Kenton,
2019).
• Fixed assets (FA): Long-term assets minus accumulated depreciation. Usually they are
assets like buildings, offices, plants, machinery, etc. Thus, they barely change over time,
reason why they are called “fixed” (Martínez, 2012).
• Payables: Money that the company owes to its suppliers due to a purchase on credit
(Martínez, 2012).
• Short-term debt (STD): Usually a credit line or other form of debt for a short period of
time. Mostly given by banks or other institutions of the capital market. Therefore, the
company pays interest to the lenders (Martínez, 2012).
• Long-term debt (LTD): A financing item negotiated usually with banks for a long period
of time. The company pays interest to the lenders. Often in form of loans, mortgages or
others (Martínez, 2012).
• Debt (D): The sum of STD and LTD.
• Equity (E): Money invested by the shareholders plus previous net income (Martínez, 2012).

58
The Balance Sheet can be transformed into the short Balance Sheet presented below. The
following items must be defined for the short Balance Sheet:
Source: Sagarra (2019)
• Need of funds for operations (NFO): Martínez Abascal (2012) defines it as funds required
to finance daily operations of a company. It is calculated by the following formula:
NFO = cash necessary + receivables + stock inventory - payables - other liabilities
If we assume zero cash necessary and a small amount of other liabilities, then the formula
is reduced to:
NFO = receivables + stock inventory - payables
• Net assets (NA): The sum of NFO and FA.
• Financing: Consists of the company’s equity, debt and provisions and other liabilities.
Annex H: Main Assumptions for P&L Forecast
Below are assumptions used for P&L forecast. These assumptions are hypothesis of how
Riverside’s restructuring plan will impact financial data. Thus, we analyzed how Euromed
would perform if it continued to operate as it did in the past, considering industry data and then
quantified the impact of Riverside’s investment.
• Sales growth of 10% annually from 2016-2020. Total sales growth during Riverside’s 5-
year hold on Euromed was projected at around 60%. Pessimist scenario is 8% growth a
year and the optimistic scenario is 12% annual sales growth from 2016-2020.
Justification: Total sales growth provided by Rafael Álvarez-Nóvoa was spread out evenly
amongst the last 5-year investment plan for organic growth. A 2% difference was
considered to evaluate a worse and best-case scenario. In a best-case scenario specific
actions that would be taken by Riverside to push sales growth were considered for the 2%
sales growth increase assumption. In the worst-case scenario, sales growth would be
59
aligned with the CAGR of 8.1% between 2014-2018 projected for the biotechnology
industry (MarketLine, 2019).
• Margin/Sales ratio are expected to increase by 1% every year, starting in 2016. For the
pessimistic scenario the Margin/Sales ratio was assumed to increase 0%, and 2% increase
was assumed for the optimistic scenario.
Justification: Due to the competitive supply agreement with Meda AB to close the
negotiations, it was expected that Margin/Sales ratio would decrease by 4% the first year
of the operation. Riverside’s plan to introduce new product launches every year and regular
price controls was intended to increase margin by 1% a year starting 2016. Worst case, the
new product launches would have no effect on the margin/sales ratio and in the best case
an additional 2% increase would be expected.
• A new systematic approach to R&D would require incorporating a new Scientific
Marketing Director and creating an R&D committee with industry experts from around the
world. Investments in R&D would represent 7% increase in Opex starting 2016. In a worst-
case scenario Opex would increase 9% and in the best-case scenario the increase would be
5%.
Justification: Data in Mercantile Registry of Spain indicates Opex growth of 38,6%, in
accordance with investments made to increase product development and production. By
2018 Euromed reached investment forecast, thus final numbers in 2018 are taken as
reference for investment goals and budget.
• For depreciation, we assumed 1,9 million euros a year.
Justification: This is based on average depreciation of Euromed’s financial data in Sabi
database for 2016-2018. The assumption is revalidated with average depreciation for the
years 2013-2015, which have the same average for this account as in years 2016-2018.
• Interest rate at 2,5% for STD and 7,5% for LTD.
Justification: Fixed interest rates were considered for both STD and LTD. Interest rates
assumptions for debt were estimated based on criteria by Martínez Abascal (2012) for
common bank commissions. Criteria included Euromed’s operational risk, Riverside’s
profitability and economic environment (i.e. profitability of short-term treasury bills and
the profitability of 5-year bonds). The final values were defined by Martínez Abascal, as
consultant for this case study.

60
Annex I: Main Assumptions for Balance Sheet Forecast
The following assumptions for the forecast of Euromed’s Balance Sheet have been made based
on historical data and the planned actions during the company’s ownership by Riverside.
• Need of funds for operations (NFO) from 2016-2020 make 64% of total sales of each
respective year.
Justification: Historical data from Sabi database from the past five years shows that the
NFO made around 64% of total sales on average. Due to no further planned changes of the
payment terms by Riverside, this share is assumed to stay fix over the time of the
investment project. However, it is notable that Euromed should lower the relative share of
its inventory of NFO, resulting in a decrease of the days of inventory and a decrease of
NFO. Due to a low payment period, Euromed had more flexibility on this factor and could
increase the payment period, increasing the proportion of payables of NFO. We assumed
that this adjustment of the shares of inventory and payables of the NFO balance out. As
result, NFO continues stable at 64% of sales.
• Fixed assets (FA) grow annually around €3 million from 2016 to 2020.
Justification: Reason behind this assumption is the purchase of the new innovation center
for €2,5 million and new machinery for the drying process for around €2,3 million
(Álvarez-Nóvoa, 2020). Both investments are assumed to get depreciated over the time of
the project. For simplicity, the total sum of almost €5 million is spread over the five years
of the project. Assuming to invest the same amount of €1,9 million of annual fix
depreciation in fixed assets explains the annual growth of €3 million.
• Goodwill was calculated to be €40,3 million, which was added to the net assets (NA).
Justification: The goodwill is the intangible asset, “the portion of the purchase price that is
higher than the sum of the net fair value of all of the assets purchased in the acquisition and
the liabilities assumed in the process” (Hargrave, 2020a). It this case it can be calculated
as the difference between the initial price paid and the net assets in 2015 before the sale of
the company.
• The equity invested in 2015 (post sale) was estimated at €40 million. This equity grows
every year about the difference between the net income of the respective year and the
dividends paid in this year.
Justification: The equity invested in 2015 can be calculated with the information from
section 4.5.5. With the initial price of €80 million, funded with 50% equity and 50% debt
(Álvarez-Nóvoa, 2020), the equity for 2015 after the sale would be €40 million. It is
assumed that the net income got invested into the equity of the company.

61
• Provisions and other liabilities (Proviss & Other Liab.) stay fix at €1 million annually from
2016-2020.
Justification: Historical data from Sabi database proves that provisions and other liabilities
didn’t change dramatically during recent years before the sale and have been around €1
million per year. So, we expect them to continue stable at this value.
• Short-term debt finances 100% of NFO from 2016 to 2020.
Justification: In order to maximize the cash flow for shareholders we assume short-term
debt to cover 100% of NFO. Furthermore, this simplifies the calculations of forecast
volatility.
• Long-term debt stays fix at €11,8 million for the entire project duration.
Justification: We assume the needed source of fund to finance all net assets at the beginning
of the project to be a bullet loan. The value of the bullet loan was calculated as difference
between net assets and the sum of equity, short-term debt and provisions and other
liabilities. As typical for a bullet loan this amount stays fix over the time of the project and
gets paid back when the project ends.
• Cash flow for the shareholders can be calculated as generated cash per year. The generated
cash per year is the difference of cash surplus in this year and the cash surplus of the
previous year.
Justification: We assume the cash surplus to be zero after the sale in year 2015. Thus, we
don’t have any cash in the balance sheet when the project starts. This cash account changes
with the cash surplus generated (or cash needed) every year. The cash surplus (or cash
needed in form of credit) is calculated as difference between financing and net assets. When
financing is bigger than net assets, meaning the company has more funds than needed, it
generates additional money in the cash account. On the other side, when net assets are
bigger than the financing part, the company needs more credit to finance its assets
(Martínez, 2012, p. 37).

62
Annex J: P&L Forecast
Guidelines for P&L forecast:
(1) Sales growth from 2016 on, see assumptions “Growth of sales”
(2) Gross margin 2015 post sale: Gross margin pre-sale. From 2016 on: see annual increase
assumptions in “Margin / Sales”
(3) Opex 2015: Increase due to investment in R&D and Equipment (see assumptions in
“Change in opex”).
(4) Depreciation from 2016 on: see assumptions in line “Depreciation”.
(5) Goodwill Depreciation assumption 0%.
(6) Interests for the short-term debt: 2,5% of total debt of previous year.
(7) Interests for the long-term debt: 7,5% of total debt of previous year.
(8) Taxation: see assumptions in line “Taxes”.
ForecastP&L in 000€ Assumptions 2015 2016 2017 2018 2019 2020Sales (turnover) 42.592 46.851 51.536 56.690 62.359 68.595COGS 19.357 22.957 24.737 26.644 28.685 30.868Gross margin 23.235 23.894 26.799 30.046 33.674 37.727Opex / Overhead 14.156 15.147 16.208 17.342 18.556 19.855EBITDA 9.078 8.747 10.591 12.704 15.118 17.872Depreciation 1.900 2.047 1.900 1.900 1.900 1.900 1.900Goodwill Depreciation 0% n.a. 0 0 0 0 0EBIT 7.031 6.847 8.691 10.804 13.218 15.972Interests (S/T debt) 2,5% n.a. -680 -750 -825 -907 -998Interests (L/T debt) 7,5% -393 -886 -886 -886 -886 -886 Extraordinary P/L 4.008EBT 11.433 5.281 7.056 9.093 11.425 14.088Taxes 25% 3.198 1.320 1.764 2.273 2.856 3.522Net Income 8.234 3.961 5.292 6.820 8.568 10.566
P&L ratios Assumptions (in bold and green)Growth of sales 7% 10% 10% 10% 10% 10%Margin / Sales 1% 55% 51% 52% 53% 54% 55%Opex / Sales 33% 32% 31% 31% 30% 29%Change in opex 4% 7% 7% 7% 7% 7%EBITDA / Sales 21% 19% 21% 22% 24% 26%ROS (Net income / Sales) 19% 8% 10% 12% 14% 15%ROE (Net income / Equity) 20% 10% 11% 12% 13% 14%RONA (EBIT / Net assets) 18% 8% 10% 12% 14% 16%

63
Annex K: Balance Sheet Forecast
Guidelines for Balance Sheet forecast:
(1) NFO 2015 Post Sale: NFO pre-sale. From 2016 on, see NFO/sales ratio assumptions.
(2) FA in 2015 Post Sale: FA pre-sale. From 2016 on, see FA annual growth assumptions.
(3) Equity 2015 Post Sale: Initial equity invested. From 2016 on: Equity = previous one +
net income of current year.
(4) Proviss & Other Liab. stay fix over the time of the project, as assumptions suggest.
(5) Short-term debt to finance 100% of NFO.
(6) Long-term debt as bullet loan for the time of the project. Stays fix at the value from
2015 Post Sale.
(7) We will have cash in the Balance Sheet. The difference of cash from one year to other
is the cash flow for the shareholders.
(8) Goodwill in 2015 Post Sale can be calculated as: Goodwill = Initial Price – Net assets
Pre Sale.
(9) Long-term debt in 2015 Post Sale can be calculated as: L/T debt = NA – (Equity +
Proviss & Other Liab. + S/T debt). If the result is negative, no L/T debt is needed.
PreSale PostSale ForecastBalance (000€) Assumptions 2015 2015 2016 2017 2018 2019 2020NFO 64% 27.186 27.186 29.985 32.983 36.281 39.910 43.901FA, Fixed assets net 3.000 12.522 12.522 13.622 14.722 15.822 16.922 18.022Goodwill 40.292 40.292 40.292 40.292 40.292 40.292NA, Net assets 39.708 80.000 83.899 87.997 92.395 97.123 102.214
E, Equity 40.976 40.000 43.961 49.253 56.072 64.641 75.207Proviss & Other Liab. 1.000 1.010 1.000 1.000 1.000 1.000 1.000 1.000 D-S, S/T debt n.a. 27.186 29.985 32.983 36.281 39.910 43.901 D-L, L/T debt 1.000.000 n.a. 11.814 11.814 11.814 11.814 11.814 11.814D, Debt total 1.821 39.000 41.799 44.797 48.095 51.723 55.714Financing 43.808 80.000 86.759 95.050 105.167 117.364 131.921
Cash surplus (+) 4.100 0 2.861 7.053 12.772 20.241 29.707Cash generated per year 1.562 n.a. 2.861 4.192 5.720 7.468 9.466
NFO vs. WCNFO 29.985 32.983 36.281 39.910 43.901
WC 42.153 46.344 52.064 59.533 68.999Cash (+) or credit (-) net 12.168 13.361 15.783 19.623 25.098

64
Annex L: Multiples of Euromed’s comparable companies
Annex M: DCF Valuation of Euromed Buyer’s Perspective
Annex N: DCF Valuation of Euromed Seller’s Perspective
Listed companies
Company Country Market EV EBITDA Sales Growth
Cap. (€ Mn) (€ Mn) 2014A 2015E 2016E 2014A 2015E 2016E margin 2015 (14A-15E)
Kerry Group Ireland 11.851 13.133 2,3 2,2 2,2 18,2 16,3 15,2 13,6% 2,4%
Royal DSM Netherlands 9.465 11.978 1,3 1,4 1,5 14,8 10,5 10,2 13,7% -8,8%
Symrise Germany 7.795 8.997 4,2 3,4 3,2 n.m. 15,2 14,3 22,4% 24,4%
Sensient United States 2.879 3.386 2,6 2,7 2,6 n.m. 14,2 12,6 19,1% -5,5%
Frutarom Israel 2.282 2.454 3,5 3,1 2,8 19,1 16,1 14,5 19,0% 13,6%
Naturex France 640 801 2,4 2,1 2,0 n.m. 15,7 13,0 13,4% 15,6%
Average 2,7 2,5 2,4 17,4 14,7 13,3 16,9% 7,0%
Median 2,5 2,5 2,4 18,2 15,5 13,7 16,4% 8,0%
EV/Sales (x) EV/EBITDA (x)
Transactions. Natural extracts EV / EBITDA
Date Target Country Bidder EV (€ Mn) EV/Sales (x) EBITDA (x) margin (%)
Feb 15 Ingrenat Spain Frutarom 8 1,0 n.a. n.a.
Okt 11 Burgundy Botanical ExtractsFrance Naturex 13 1,3 n.a. n.a.
Jan 08 Berkem France Naturex 10 2,5 7,3 n.a.
Dez 07 Chart Corporation USA Naturex 12 2,1 6,8 31%
Jan 07 Hammer Pharma UK Naturex 10 1,3 10,5 12%
Average 1,6 8,2 22%
Median 1,3 7,3 22%
CF Calculation 2015 2016 2017 2018 2019 2020± Variation of NA -3.899 -4.098 -4.398 -4.728 -5.091± Variation of Debt 2.799 2.998 3.298 3.628 3.991± Net Income 3.961 5.292 6.820 8.568 10.566Final sale at multiple = 8 116.969Initial equity invested -40.000CF shareholder/ Equity CF -40.000 2.861 4.192 5.720 7.468 126.436
PV with a K = 25% PV = 52.389 IRR = 32,79% NPV = 12.389
Assumptions to change => Initial price = 80.000 Equity invested= 40.000
CF Calculation 2015 2016 2017 2018 2019 2020± Variation of NA -1.981 -2.042 -2.185 -2.338 -2.501± Variation of Debt 1.981 2.042 2.185 2.338 2.501± Net Income 3.807 4.548 5.356 6.235 7.189Final sale at multiple = 8 83.324
Initial equity invested 0CF shareholder/ Equity CF 0 3.807 4.548 5.356 6.235 90.513
PV with a K = 15% PV = 58.837 IRR = n.a. NPV = n.a.