road equivalent tariff pilot extension to islay, colonsay ... · transport.gov.scot evaluation...
TRANSCRIPT

transport.gov.scot
Evaluation Report
Road Equivalent Tariff Pilot Extension to Islay, Colonsay & Gigha

Road Equivalent Tariff Pilot Extension to Islay, Colonsay & Gigha Evaluation Report

Road Equivalent Tariff Pilot Extension to Islay, Colonsay & Gigha Evaluation Report TRANSPORT SCOTLAND
2
CONTENTS
Executive Summary 5
1 Introduction 11
1.1 Overview 11
1.2 Structure of this report 11
2 Background 12
2.1 Road Equivalent Tariff 12
2.2 Pilot area 12
2.2.1 Demographic context 14
2.2.2 Economic context 15
2.2.3 Ferry service profile 16
2.3 Change in fares 17
3 Key research findings 18
3.1 Method 18
3.2 Patronage 19
3.2.1 Is there additional patronage on the routes? 19
3.2.2 Has RET had an impact on the number of trips made by residents and visitors (Islay only)? 22
3.2.3 Is the additional patronage a consequence of existing or new users or both? 24
3.2.4 Has RET had an impact on the frequency of usage of existing users? 25
3.2.5 How sensitive is patronage to the reduction in fares? 25
3.2.6 Has RET had an impact on the decision of existing and new users to use the ferry services? 28
3.3 Displacement 29
3.3.1 Have RET fares had an impact on displacement from other routes? 29
3.3.2 Have RET fares displaced traffic/patronage from other modes? 30
3.4 Purpose of travel 31
3.4.1 For what purpose are people travelling on services to Islay, Colonsay and Gigha? 31
3.4.2 Has the introduction of RET affected the purposes for which people travel? 33 3.5 Average expenditure by residents and visitors 35
3.5.1 What type of accommodation were island visitors using? 36
3.5.2 Has the introduction of RET resulted in an increase in spending by visitors? 36
3.5.3 Has the introduction of RET resulted in island residents spending more on the mainland? 37
4 Capacity of the ferries 39
4.1 Current capacity 39
4.1.1 Vessels 39
4.1.2 Capacity utilisation 40
4.2 Ferry users’ views on capacity utilisation 42
4.2.1 Booking ahead 42
4.2.2 Travelling on preferred time and day 43
Road Equivalent Tariff Pilot Extension to Islay, Colonsay & Gigha Evaluation Report TRANSPORT SCOTLAND
3
4.3 Future capacity 44
4.3.1 Overview 44
4.3.2 Increasing capacity utilisation 44
5 ANNEX A: Secondary data analysis 45
Economic data 45
Highlands and Islands Enterprise fragile areas 45
Scottish Index of Multiple Deprivation 45
Gross Value Added 46
Labour market 48
Tourism data 51
Annual events 52
Whisky tourism 52
Housing market data 53
Residential property values 53
Second or holiday residence 54
Table of Figures
Figure 2.1: Map of the pilot area ferry routes 13 Figure 2.2: Population figures in the pilot area 15 Figure 3.1: Impact of RET reduced fares on using the ferry on last trip 29 Figure 3.2: Purpose of trip among survey respondents in 2014 32 Figure 3.3: Purpose of trip for visitors, 2012-2014, summer only 33 Figure 3.4: Purpose of trip for Islay residents, 2012-2014, summer only 34 Figure 3.5: Purpose of trip for Colonsay, Gigha and Jura residents, 2012-2014, summer only 35 Figure 3.6: Type of Accommodation for 2014 visitors 36 Figure 4.1: Ferry users’ perceptions of how booking ahead has changed since the introduction of RET 42 Figure 4.2: Ferry users’ perception of how travelling on preferred day and time has changed since the introduction of RET 43

Road Equivalent Tariff Pilot Extension to Islay, Colonsay & Gigha Evaluation Report TRANSPORT SCOTLAND
4
List of Tables
Table 2.1: Population figures and trends in the pilot area 14 Table 2.2: Ferry Routes and Operators – 2015 16 Table 2.3: Service Characteristics – Summer 2015 17 Table 2.4: Published RET fares and absolute and percentage change following the introduction of RET 18 Table 3.1: Survey sample distribution 19 Table 3.2: Full year passengers on ferry services to Colonsay, Gigha and Islay, November 2011 – October 2012 (pre-RET) and November 2012-October 2014 (during-RET) 21 Table 3.3: Full year cars on ferry services to Colonsay, Gigha and Islay, November 2011 – October 2012 (pre-RET) and November 2012-October 2014 (during-RET) 21 Table 3.4: Carryings percentage change, winter and summer, services to Colonsay, Gigha and Islay 22 Table 3.5: Total patronage for winter and summer period – visitor and resident estimated share 23 Table 3.6: Additional trips by Islay visitors and residents (Summer only) 23 Table 3.7: Price elasticity of demand, winter and summer periods 26 Table 3.8: Change in fares, patronage and price elasticity of demand following the introduction of RET 28 Table 3.9: Expenditure by visitors to the islands 37 Table 3.10: Expenditure of island residents to the Scottish mainland economy 38 Table 4.1: Routes Vessel Characteristics and Capacity 39 Table 4.2: Capacity Utilisation Banding in the first two years of the pilot operation 41

Road Equivalent Tariff Pilot Extension to Islay, Colonsay & Gigha Evaluation Report TRANSPORT SCOTLAND
5
Executive Summary
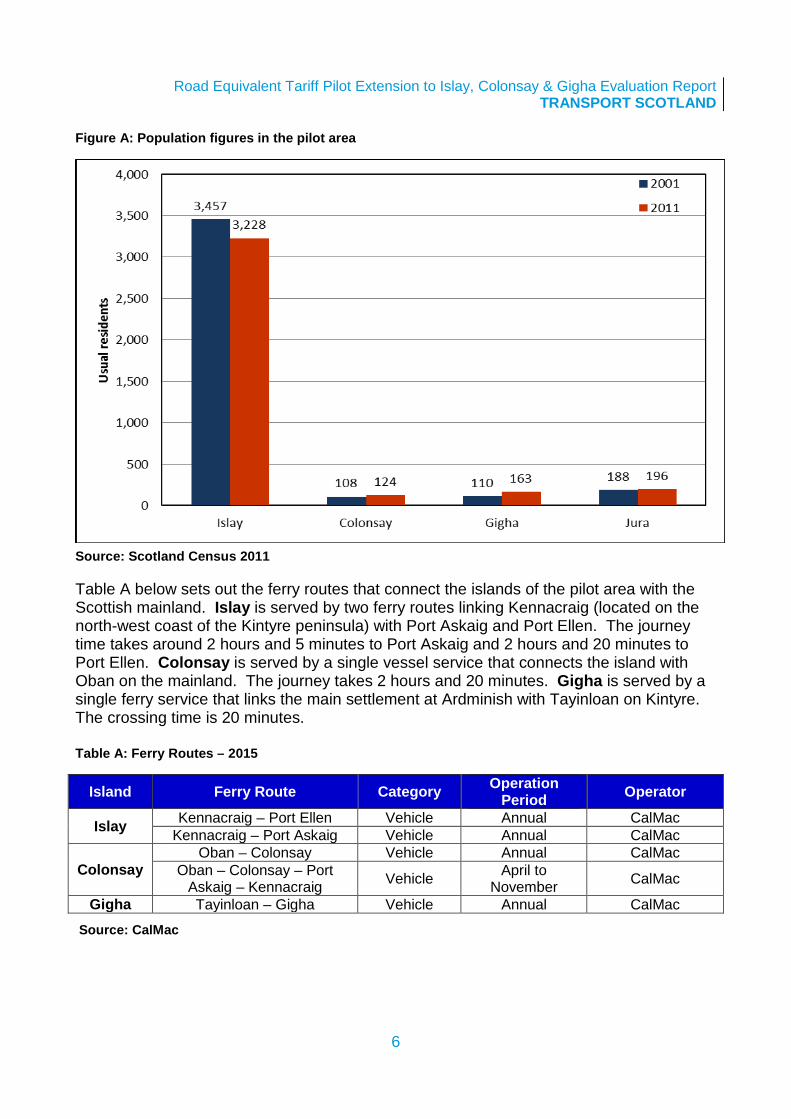
Background This report analyses the findings from surveys conducted to inform the evaluation of the introduction of Road Equivalent Tariff (RET) pilot scheme for ferry services to Islay, Colonsay and Gigha. It also provides additional information on patronage levels and trends and analyses the economic, tourism and housing baseline of the pilot area. The RET fares scheme involves setting ferry fares on the basis of the cost of travelling an equivalent distance by road with the intention to promote remote island economies by reducing the cost of ferry travel. In 2008, a pilot RET scheme was introduced for the Western Isles, Coll and Tiree (WICT)1. In 2011, the Scottish Government announced the continuation of RET as a permanent feature on the WICT for passengers and cars and a phased roll-out of pilot RET fares to other West Coast and Clyde islands, commencing with Islay, Colonsay and Gigha (ICG) on 21 October 2012. Description of pilot area The pilot area comprises the islands of Islay, Colonsay and Gigha in the Argyll and Bute Council area. Figure A below provides information on the population of the pilot area. Jura is considered as part of the pilot area since Jura residents can travel to the mainland via the Islay ferry service2.The island of Islay is the largest and most populated in the pilot area. According to the 2011 Census results3 Islay has 3,228 usual residents. The island of Colonsay is located north of Islay and Jura and south of Mull. The island's population is 124 as recorded by the 2011 Census. The island of Gigha is located west of the Kintyre peninsula and east of Colonsay and Islay. The Census 2011 recorded a population of 163 on the island. The island of Jura lies north-east of Islay and has 196 usual residents according to the 2011 Census.
1 The WICT ferry routes are: Oban – Castlebay / Lochboisdale; Uig – Tarbert / Lochmaddy; Ullapool – Stornoway; and Oban – Coll / Tiree. 2 Car access to Jura during the entire year and passenger access to Jura outside the summer season is only possible by using the ferry between Islay and Jura. 3 http://www.scotlandscensus.gov.uk/documents/censusresults/release1c/rel1c2sb.pdf
Road Equivalent Tariff Pilot Extension to Islay, Colonsay & Gigha Evaluation Report TRANSPORT SCOTLAND
6
Figure A: Population figures in the pilot area
Source: Scotland Census 2011
Table A below sets out the ferry routes that connect the islands of the pilot area with the Scottish mainland. Islay is served by two ferry routes linking Kennacraig (located on the north-west coast of the Kintyre peninsula) with Port Askaig and Port Ellen. The journey time takes around 2 hours and 5 minutes to Port Askaig and 2 hours and 20 minutes to Port Ellen. Colonsay is served by a single vessel service that connects the island with Oban on the mainland. The journey takes 2 hours and 20 minutes. Gigha is served by a single ferry service that links the main settlement at Ardminish with Tayinloan on Kintyre. The crossing time is 20 minutes. Table A: Ferry Routes – 2015
Island Ferry Route Category Operation Period Operator
Islay Kennacraig – Port Ellen Vehicle Annual CalMac Kennacraig – Port Askaig Vehicle Annual CalMac
Colonsay Oban – Colonsay Vehicle Annual CalMac
Oban – Colonsay – Port Askaig – Kennacraig Vehicle April to
November CalMac
Gigha Tayinloan – Gigha Vehicle Annual CalMac Source: CalMac

Road Equivalent Tariff Pilot Extension to Islay, Colonsay & Gigha Evaluation Report TRANSPORT SCOTLAND
7
Method In 2012, Transport Scotland commissioned Vector Research to conduct on-board surveys on the Islay, Colonsay and Gigha ferry services and household surveys on Colonsay, Gigha and Jura to inform the evaluation of the RET pilot. The aim of the surveys was to provide information from service users (both residents of the islands and visitors) on their use of the ferry services before and during the pilot. The surveys were carried out over a three year period, which commenced in June 2012 (prior to the introduction of RET) and ran until October 2014. Each round of on-board surveys was executed in two waves, summer (August) and winter (October). Household surveys were not undertaken in separate waves and no strict monthly quotas were used4. Table B below shows the distribution of sample sizes among the surveys and the execution waves. Table B: Survey sample distribution
Islay, Colonsay and Gigha visitors on-board survey
Islay residents on-board survey
Colonsay, Gigha and Jura household survey
Summer Winter Summer Winter 2012 1,154 525 161 134 107 2013 1,246 515 130 108 110 2014 1,158 568 150 90 112
Findings Patronage
Fare and patronage changes per route in the first year of the RET pilot operation are shown at Table C below5. Table C: Summary of fare changes and patronage per route during the first year of the RET pilot
Route
FARE PATRONAGE Passengers Cars Passengers Cars
Absolute change
% change
Absolute change
% change
Absolute change
% change
Absolute change
% change
Islay-Kennacraig -£3.90 -38% -£24.00 -44% 3,742 2% 5,163 9% Colonsay-Oban -£7.45 -52% -£38.00 -52% 1,267 9% 502 12% Gigha-Tayinloan -£1.10 -32% -£5.75 -45% 2,272 4% 1,568 12% Average (3 routes) -44% -48% 3% 10%
Source: TS calculations
4 Depending on the interview date the household survey data may be considered as part of the summer or winter wave. 5 Note that a comparison is made between first year RET fares and summer 2012 (pre-RET) fares. The comparison in patronage data is made between patronage in the first year of RET (November 2012 to October 2013) and pre-RET year (November 2011 to October 2012).

Road Equivalent Tariff Pilot Extension to Islay, Colonsay & Gigha Evaluation Report TRANSPORT SCOTLAND
8
For the first year of RET:
• Fares fell by an average 44% and 48% for passengers and cars respectively. The Oban to Colonsay route saw the greatest decrease in fares with the passenger fare falling 52% and the car fare falling 52%
• The average increase in patronage across all three routes was 3% for passengers and 10% for cars
• For all three islands, there was a greater percentage increase in the number of cars carried than in the number of passengers
During the second year of the pilot:
• The average increase in patronage across all three routes was 5% for passengers and 7% for cars.
Tourism Analysis has been undertaken of the visitor share on the on-board surveys across the period of the RET pilot operation. The analysis considers only Islay visitors (excluding Colonsay, Gigha and Jura) and findings from the summer on-board surveys. For the second year of RET:
• An additional 12,888 passenger trips and 7,526 car trips were undertaken by visitors to Islay.
Findings from the 2014 on-board visitors surveys suggest:
• 48% of visitors used the ferry route for the first time
• Lower fares has influenced 17% of visitors to use the ferry service for their trip
• 77% of visitors paid for accommodation. Over a third (35%) stayed at a hotel or guest house with a further 21% staying at a B&B whilst 18% chose self-catering accommodation.

Road Equivalent Tariff Pilot Extension to Islay, Colonsay & Gigha Evaluation Report TRANSPORT SCOTLAND
9
Residents Findings from the 2014 residents surveys suggest:
• The increase in patronage is mainly due to existing service users using the ferry route more frequently
• Changes to ferry fares were an important or very important factor for over half of existing service users who had used the ferry more since the introduction of RET with 16% of Islay residents and 23% of Colonsay, Gigha and Jura residents influenced by fares to use the ferry for their trip
• The most common purpose of travelling has remained unchanged since the introduction of RET. For Islay residents holiday or short-break was the most common purpose of travel and shopping was most common for Colonsay, Gigha and Jura residents
Capacity Table D below sets out the main characteristics of the vessels on the routes. Capacity levels for passengers range from 200 (MV Loch Ranza) to 951 (MV Isle of Mull) and for cars range from 12 (MV Loch Ranza) to 98 (MV Hebrides). Table D: Routes Vessel Characteristics and Capacity
Route Vessel(s) Year of Build Length (m) Passengers Cars
Islay-Kennacraig
MV Finlaggan 2011 89.9 550 85 MV Hebridean Isles 1985 85.15 494 62 MV Isle of Arran 1983 84.92 448 76 MV Lord of the Isles6 1989 84.6 506 54
Colonsay-Oban
MV Lord of the Isles 1986 84.6 506 54 MV Isle of Mull 1988 90.03 951 70 MV Hebridean Isles 1985 85.15 494 62 MV Hebrides7 2000 99.0 612 98
Gigha-Tayinloan
MV Loch Ranza 1986 30.2 200 12 MV Loch Linnhe8 1986 30.2 200 12
Source: CalMac Capacity data is commercial in confidence, therefore, it is not presented in this report. Nevertheless, whilst some routes may not have maximum capacity utilisation, particular sailing times or sailing legs may be more affected than others and in excess of their capacity utilisation.
6 Supported the service in winter 2012/13, between 5th December and 28th March as winter relief vessel 7 Supported the service in winter 2012, between 3rd and 21st December as winter relief vessel 8 Supported the service in winter 2013/14, between 29th December and 3rd March as winter relief vessel

Road Equivalent Tariff Pilot Extension to Islay, Colonsay & Gigha Evaluation Report TRANSPORT SCOTLAND
10
Over the period of RET: • Capacity on the Islay routes has become more constrained. For the Gigha and
Colonsay routes the increase in demand does not appear to have led to capacity issues
• Some island residents have found that booking ahead has become more difficult.
• Findings from the on-board Islay residents surveys suggest that whilst 44% of islanders found booking ahead about the same, 33% indicated that booking ahead has become more difficult since the introduction of RET.
• Findings from the household surveys suggest that whilst 25% of islanders found booking ahead about the same 38% of the Colonsay, Gigha and Jura residents find booking ahead more difficult since the introduction of RET.
• For Islay residents, travelling on preferred day and time has become more difficult whilst for the majority of visitors and Colonsay, Gigha and Jura residents it has remained the same.

Road Equivalent Tariff Pilot Extension to Islay, Colonsay & Gigha Evaluation Report TRANSPORT SCOTLAND
11
Introduction
Overview 1.1
This report analyses the findings from surveys conducted to inform the evaluation of the introduction of Road Equivalent Tariff (RET) pilot scheme for ferry services to Islay, Colonsay and Gigha. On-board and household surveys were conducted in summer and winter waves between 2012 and 2014. It also provides additional information on patronage levels and trends and analyses the economic, tourism and housing baseline of the pilot area. The report aims to examine the key research questions as outlined below: • is there additional patronage on the routes and, if so, is this a consequence of existing
or new users or both?
• how sensitive is patronage to the reduction in fares and how does it compare to the Western Isles, Coll and Tiree pilot?
• is there any evidence that any additional patronage is the result of displacement?
• for what purpose are people travelling and has the introduction of RET affected this?
• is there an impact on ‘leakages’ and ‘injections’ from the island economies?
An additional scope of this research is to investigate any capacity issues brought about by the introduction of RET and propose possible demand management options.
Structure of this report 1.2
Following this introductory chapter this report continues with the following structure: Chapter 2 provides background information on the RET, the phased roll out to the CHFS network and the basic characteristics of the pilot area of this study. Chapter 3 looks into the key findings of the primary research combining the on-board and household survey results and CalMac data on patronage and trends to examine the three key research questions. Chapter 4 discusses the characteristics and capacity utilisation of vessels serving the routes of the pilot area. Finally, a high level analysis of secondary data to provide sufficient backdrop on the impact of RET on economy, tourism and housing of the pilot area is provided on Annex A.

Road Equivalent Tariff Pilot Extension to Islay, Colonsay & Gigha Evaluation Report TRANSPORT SCOTLAND
12
Background
Road Equivalent Tariff 1.3
The ‘Ferries Plan 2013-2022’9, published in December 2012, committed to rolling out the RET fares scheme across the ferries network. The RET fares scheme involves setting ferry fares on the basis of the cost of travelling an equivalent distance by road. The rationale behind the scheme is to reduce the economic disadvantage suffered by remote island communities and to secure ferry travel, with the intention of promoting the local economies as well as the wider national economy. The RET formula for calculating fares is a combination of a fixed element10 and a variable element11 – a rate per mile so that fares are a function of the length of ferry route. In 2008, a pilot RET scheme was introduced for the Western Isles, Coll and Tiree (WICT)12. In 2011, the Scottish Government announced the continuation of RET as a permanent feature on the WICT for passengers and cars and a phased roll-out of pilot RET fares to other West Coast and Clyde islands, commencing with Islay, Colonsay and Gigha (ICG) on 21 October 2012, in time for the CalMac winter timetable13.
Pilot area 1.4
The pilot area comprises the islands of Islay, Colonsay and Gigha in the Argyll and Bute Council area. According to 2011 Scotland’s Census, the Argyll and Bute council area has 23 inhabited islands14 and covers 6,909 square kilometres of mainland. Jura is considered part of the pilot area since Jura residents can travel to the mainland via the Islay ferry service. RET was not introduced on the Jura ferry service since this is run by the Local Authority, however, car access to Jura during the entire year and passenger access to Jura outside the summer season is only possible using the ferry between Islay and Jura. Figure 2.1 illustrates the geographic location of the islands and the ferry routes being considered in this study.
9 Transport Scotland, December 2012, ‘Ferries Plan 2013-2022’ http://www.transportscotland.gov.uk/sites/default/files/documents/rrd_reports/uploaded_reports/j254579/j254579.pdf 10 The fixed element is to ensure services remain sustainable by ensuring adequate revenue to cover fixed costs such as maintaining harbour infrastructure and vessels. 11 The variable element was calculated based on data by independent research by RAC on illustrative cost of running a car by fuel type and engine size. 12 The WICT ferry routes are: Oban – Castlebay / Lochboisdale; Uig – Tarbert / Lochmaddy; Ullapool – Stornoway; and Oban – Coll / Tiree. 13 The CalMac winter timetable runs from the end of October to the end of March and the summer period runs from the start of April to the end of October. 14 The Argyll and Bute islands are the following 23 inhabited islands: Bute, Coll, Colonsay, Danna, Easdale, Elean da Mheinn, Erraid, Gigha, Gometra, Inchtavannach, Innis Chonain, Iona, Islay, Jura, Kerrera, Lismore, Luing, Mull, Oronsay, Seil, Shuna, Tiree, Ulva.

Road Equivalent Tariff Pilot Extension to Islay, Colonsay & Gigha Evaluation Report TRANSPORT SCOTLAND
13
Figure 2.1: Map of the pilot area ferry routes
Source: The Scottish Government - Geographic Information Science

Road Equivalent Tariff Pilot Extension to Islay, Colonsay & Gigha Evaluation Report TRANSPORT SCOTLAND
14
1.4.1 Demographic context Table 2.1 and figure 2.2 below provide information on the population of the pilot area. The island of Islay is the largest and most populated in the pilot area. According to the 2011 Census15 results Islay has 3,228 usual residents. The population of Islay saw a decrease of 7 per cent since the previous census in 2001. Islay residents account for 21% of the total population of Argyll and Bute islands. The island of Colonsay is located north of Islay and Jura and south of Mull. The island's population is 124 as recorded by the 2011 Census and has increased by 15% since the last Census in 2001. The population of Colonsay accounts for less than 1% of the island population of Argyll and Bute. The island of Gigha is located west of the Kintyre peninsula and east of Colonsay and Islay. The Census 2011 recorded a population of 163 on the island. Compared to the 2001 Census results the population of Gigha increased by 48% and now accounts for 1.1% of the total population of the Argyll and Bute islands. The island of Jura lies north-east of Islay. Despite its large geographic area, Jura has much fewer residents than Islay and is one of the least densely populated islands of Scotland. Jura’s population is 196 residents and has decreased by 4% since 2001. Jura residents account for 1.3% of all residents of the Argyll and Bute islands. Table 2.1: Population figures and trends in the pilot area
Island and Council Area 2001 2011 % change
% share of the
Argyll & Bute
islands
% share of Argyll & Bute Council
% share of all
inhabited Scottish islands
Islay 3,457 3,228 -6.6% 21.4% 3.1% 3.7% Colonsay 108 124 14.8% 0.8% 0.1% 0.1% Gigha 110 163 48.2% 1.1% 0.2% 0.2% Jura 188 196 4.3% 1.3% 0.2% 0.2% Argyll & Bute islands 15,889 15,105 -4.9% Argyll & Bute Council 91,306 88,166 -3.4% All Inhabited Scottish islands 99,739 103,702 3.9% Source: Scotland Census 2011
15 http://www.scotlandscensus.gov.uk/documents/censusresults/release1c/rel1c2sb.pdf

Road Equivalent Tariff Pilot Extension to Islay, Colonsay & Gigha Evaluation Report TRANSPORT SCOTLAND
15
Figure 2.2: Population figures in the pilot area
Source: Scotland Census 2011
1.4.2 Economic context The islands economies largely depend on the primary and secondary sector. Islay’s economy is the largest within the pilot area. The strongest areas of the island’s economic activity are agriculture and fishing, distilling and tourism. The island has eight whisky distilleries which attract thousands of tourists per year. The island also has a wave power station, becoming the world's first commercial wave power station in 2000. The key export products of the island are whisky and livestock (cattle and lamb) whilst the key imports are agricultural supplies, retail, barley and fuels. Colonsay locally produces honey from the black bees population on the island. It also has a micro-brewery producing three different beer products. Tourism and fishing have some fair share of the island’s economy. The key export products of the island are honey and livestock whilst the key import products are agricultural supplies, retail and fuels. Gigha’s economy relies on livestock and fish farming as well as tourism. The island also has a creamery producing goat cheese. The key export products of the island are fish (farmed halibut) and livestock whilst the key import products are agricultural supplies, halibut feed, retail and fuels. The most significant area of economic activity in Jura is the Jura whisky distillery. Tourism also plays important role on economy together with forestry and agriculture. The key export products of the island are whisky and livestock whilst the key imports are agricultural supplies, retail, barley and fuels.

Road Equivalent Tariff Pilot Extension to Islay, Colonsay & Gigha Evaluation Report TRANSPORT SCOTLAND
16
1.4.3 Ferry service profile Table 2.2 below sets out the ferry routes that connect the islands of the pilot area with the Scottish mainland. The main service characteristics are presented on table 2.3. Islay is served by two ferry routes linking Kennacraig (located on the north-west coast of the Kintyre peninsula) with Port Askaig and Port Ellen. The journey time takes around 2 hours and 5 minutes to Port Askaig and 2 hours and 20 minutes to Port Ellen. Services operate seven days per week from either Port Askaig or Port Ellen, with the majority of services, around three in every four, arriving and departing from Port Ellen. Colonsay is served by a single vessel service that connects the island with Oban on the mainland. The journey takes 2 hours and 20 minutes, which makes Colonsay to Oban the longest route in the pilot area. The ferry service runs four times a week during winter and six times a week during the summer season. There is also an additional summer service from Kennacraig via Islay. Gigha is served by a single ferry service that links the main settlement at Ardminish with Tayinloan on Kintyre. The crossing time is 20 minutes and a frequent service operates seven days per week. A vehicle ferry service to Islay which is run by ASP Ships on behalf of Argyll and Bute Council serves Jura residents. The crossing time is 5 minutes and the service runs every day. There are frequent crossings linking Jura residents to the mainland via the Islay services. An alternative travel option for accessing the Scottish mainland is via the passenger only service between Craighouse on Jura and Tayvallich on Kintyre. The service is run by Jura Development Trust and is available only on the summer period. Table 2.2: Ferry Routes and Operators – 2015
Island Ferry Route Category Operation Period Operator
Islay Kennacraig – Port Ellen Vehicle Annual CalMac Kennacraig – Port Askaig Vehicle Annual CalMac
Colonsay Oban – Colonsay Vehicle Annual CalMac
Oban – Colonsay – Port Askaig – Kennacraig Vehicle April to
November CalMac
Gigha Tayinloan – Gigha Vehicle Annual CalMac
Jura
Port Askaig – Feolin Vehicle Annual ASP on behalf of A&BC
Kennacraig – Port Askaig – Feolin Vehicle Annual CalMac
Tayvallich – Craighouse Passenger April to September
Jura Development Trust
Source: CalMac

Road Equivalent Tariff Pilot Extension to Islay, Colonsay & Gigha Evaluation Report TRANSPORT SCOTLAND
17
Table 2.3: Service Characteristics – Summer 2015
Kennacraig – Islay
First sailing of the day 0700 0700 0700 0700 0700 0700 0945
Last sailing of the day 1800 1800 1800 1800 1800 1800 1800
Number of crossings 5 5 3 5 5 4 3
Crossing time (minutes) 115-130 115-130 115-130 115-130 115-130 115-130 115-130
Oban - Colonsay Monday Tuesday Wednesday Thursday Friday Saturday Sunday
First sailing of the day 1700 - 1530 0900 1500 1630 1730
Last sailing of the day 1700 - 1530 0900 1500 1630 1730
Number of crossings16 1 - 1 1 1 1 1
Crossing time (minutes) 140 - 150 160 140 150 140
Tayinloan - Gigha
First sailing of the day 0800 0800 0800 0800 0800 0800 1000
Last sailing of the day 1800 1800 1800 1800 1900 1800 1700
Number of crossings 10 10 10 10 11 10 7
Crossing time (minutes) 20 20 20 20 20 20 20
Jura - Islay
First sailing of the day 0735 0600 0735 0735 0735 0735 0830
Last sailing of the day 2300 2300 2300 2300 2300 2300 1830
Number of crossings 17 18 18 17 17 17 7
Crossing time (minutes) 5 5 5 5 5 5 5
Source: CalMac
Change in fares 1.5
Table 2.4 shows how fares on services to Islay, Colonsay and Gigha changed with the introduction of RET in October 201217. All fares data18 used for comparisons prior and during RET are standard single fares. As summer and winter fares differed prior to the introduction of the year-round RET fare, the change in fares differs when comparing between winter and summer fares. The greatest absolute and percentage decreases in fares are seen in summer as pre-RET fares were higher in summer than in winter. Comparing the three islands, Colonsay saw the greatest fares decrease across patronage type in both summer and winter. For each island, the absolute and percentage decrease in fares was generally greater for cars than for passengers. The average change in passenger fares across all three routes was -29%, when comparing with pre-RET winter fares, and -44%, when comparing with pre-RET summer fares. The average change in car fares across all three routes was -35%, when comparing with pre-RET winter fares, and -48%, when comparing with pre-RET summer fares.
16 This is for a one-way sailing 17 The absolute and percentage change for winter fares is calculated by comparing RET fares for winter 2012/13 (the first winter RET was in operation on the routes) with winter 2011/12 (pre-RET). The absolute and percentage change for summer fares is calculated by comparing RET fares for summer 2013 (the first summer RET was in operation on the routes) with summer 2012 (pre-RET). 18 The fares for this analysis are published fares on CalMac’s website and they are expressed in nominal terms.

Road Equivalent Tariff Pilot Extension to Islay, Colonsay & Gigha Evaluation Report TRANSPORT SCOTLAND
18
Table 2.4: Published RET fares and absolute and percentage change following the introduction of RET19
Passengers Cars Winter Summer Winter Summer
Route RET fare
Abs change
% change
Abs change
% change
RET fare
Abs change
% change
Abs change
% change
Islay-Kennacraig £6.30 -£1.35 -18% -£3.90 -38% £31.00 -£12.50 -29% -£24.00 44% Colonsay-Oban £6.90 -£4.25 -38% -£7.45 -52% £35.00 -£23.00 -40% -£38.00 52% Gigha-Tayinloan £2.35 -£0.60 -20% -£1.10 -32% £7.00 -£3.25 -32% -£5.75 45% Average across all 3 routes -29% -44% -35% -48%
Source: CalMac
Key research findings
Method 1.6
In 2012, Transport Scotland commissioned Vector Research to conduct on-board surveys on the Islay, Colonsay and Gigha ferry services and household surveys on Colonsay, Gigha and Jura to inform the evaluation of the RET pilot. Since Jura residents use the Islay ferry service to travel to the mainland20 they were also surveyed. The aim of the surveys was to provide information from service users (both residents of the islands and visitors) on their use of the ferries before and during the pilot, in particular, to explore the key research questions outlined in Section 1. The survey data were supplemented by carryings data from CalMac. The surveys were carried out over a three year period, which commenced in June 2012 (prior to the introduction of RET) and ran until October 2014. Each round was executed in two waves, summer (August) and winter (October). Household surveys were not undertaken in separate waves and no strict monthly quotas were used21. Table 3.1 below shows the distribution of sample sizes among the surveys and the execution waves. This report provides an overview of the key findings of the summer and winter 2014 surveys22 and draws comparisons with previous years.
19 Note that the comparison in fares is between winter 2012/13 (the first winter RET was in operation on the routes) and winter 2011/12 (pre-RET) and between summer 2013 (the first summer RET was in operation on the routes) and summer 2012 (pre-RET). 20 Car access to Jura during the entire year and passenger access to Jura outside the summer season is only possible by using the ferry between Islay and Jura. 21 For the purpose of the analysis household survey data may be considered in summer and winter waves based on the date the interviews were carried out. 22 After the first year of surveys (2012), the data gathered were examined and used to review the questionnaires. Some amendments were made in an attempt to improve the quality of the data collected and the robustness of results. This means that for some questions, the results may not be directly comparable with the previous survey round. Where this is the case, this is highlighted.

Road Equivalent Tariff Pilot Extension to Islay, Colonsay & Gigha Evaluation Report TRANSPORT SCOTLAND
19
Table 3.1: Survey sample distribution
Islay, Colonsay and Gigha visitors on-board survey
Islay residents on-board survey
Colonsay, Gigha and Jura household survey
Summer Winter Summer Winter 2012 1,154 525 161 134 107 2013 1,246 515 130 108 110 2014 1,158 568 150 90 112 This section draws on the findings from the on-board and household surveys and CalMac patronage data to examine the key research questions:
• is there additional patronage on the routes and, if so, is this a consequence of existing or new users or both?
• how sensitive is patronage to the reduction in fares and how does it compare to the Western Isles, Coll and Tiree pilot?
• is there any evidence that any additional patronage is the result of displacement?
• for what purpose are people travelling and has the introduction of RET affected this?
• is there an impact on ‘leakages’ and ‘injections’ from the island economies?
Patronage 1.7
1.7.1 Research question: Is there additional patronage on the routes? To determine whether there is additional patronage on the routes, we examine CalMac data on the number of passengers and cars carried on services to and from Islay, Colonsay and Gigha over the pre-RET period and the RET period. The pre-RET period covers the 12 months prior to the introduction of RET23, November 2011 – October 2012. The RET period is defined as the 2 years of the RET pilot in operation. The months November 2012 – October 2013 (the first 12 months of RET) cover the first RET pilot year and the months November 2013 – October 2014 cover the second RET pilot year. Full year Breakdown Tables 3.2 and 3.3 below demonstrate respectively passenger and car carryings data for the pre-RET year and the two consecutive pilot years of RET. They also present percentage changes by comparing pre-RET with first year of RET pilot carryings, first year with second year of RET pilot carryings and pre-RET with second year of RET pilot carryings.
23 It should be noted that RET was introduced on the routes on 21 October 2012. This period will therefore comprise several days where RET was in operation.
Road Equivalent Tariff Pilot Extension to Islay, Colonsay & Gigha Evaluation Report TRANSPORT SCOTLAND
20
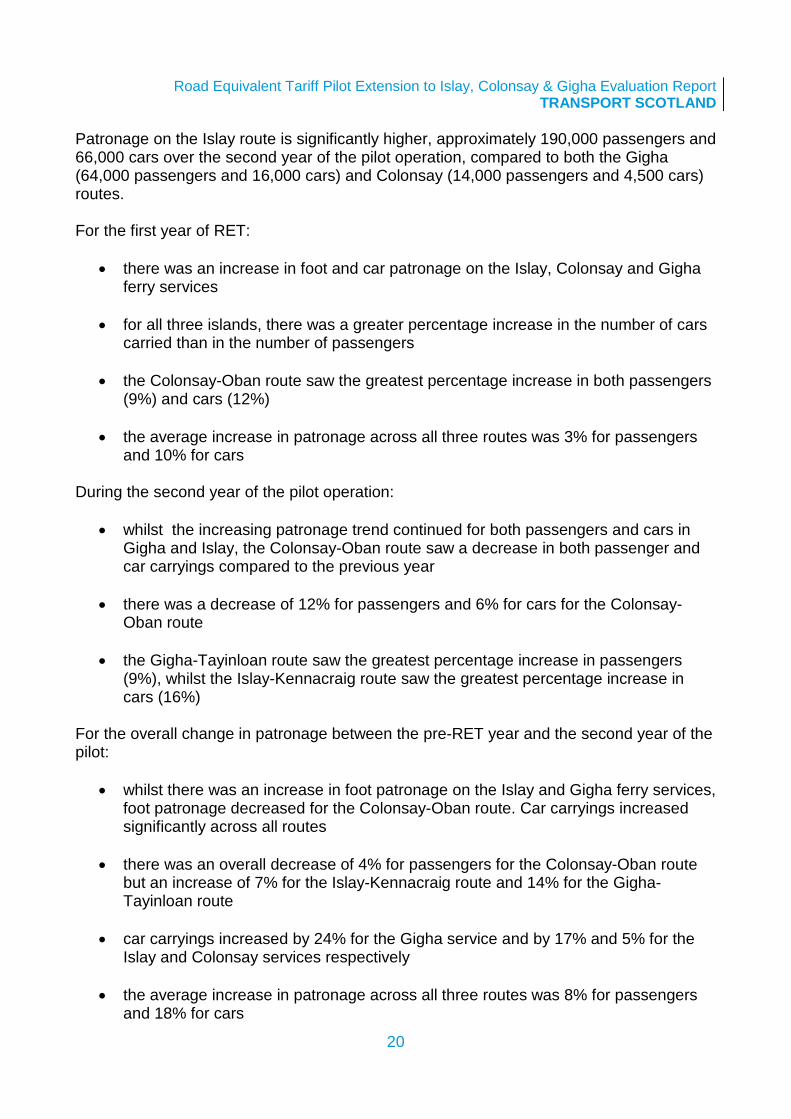
Patronage on the Islay route is significantly higher, approximately 190,000 passengers and 66,000 cars over the second year of the pilot operation, compared to both the Gigha (64,000 passengers and 16,000 cars) and Colonsay (14,000 passengers and 4,500 cars) routes. For the first year of RET:
• there was an increase in foot and car patronage on the Islay, Colonsay and Gigha ferry services
• for all three islands, there was a greater percentage increase in the number of cars carried than in the number of passengers
• the Colonsay-Oban route saw the greatest percentage increase in both passengers (9%) and cars (12%)
• the average increase in patronage across all three routes was 3% for passengers and 10% for cars
During the second year of the pilot operation:
• whilst the increasing patronage trend continued for both passengers and cars in Gigha and Islay, the Colonsay-Oban route saw a decrease in both passenger and car carryings compared to the previous year
• there was a decrease of 12% for passengers and 6% for cars for the Colonsay-Oban route
• the Gigha-Tayinloan route saw the greatest percentage increase in passengers (9%), whilst the Islay-Kennacraig route saw the greatest percentage increase in cars (16%)
For the overall change in patronage between the pre-RET year and the second year of the pilot:
• whilst there was an increase in foot patronage on the Islay and Gigha ferry services, foot patronage decreased for the Colonsay-Oban route. Car carryings increased significantly across all routes
• there was an overall decrease of 4% for passengers for the Colonsay-Oban route but an increase of 7% for the Islay-Kennacraig route and 14% for the Gigha-Tayinloan route
• car carryings increased by 24% for the Gigha service and by 17% and 5% for the Islay and Colonsay services respectively
• the average increase in patronage across all three routes was 8% for passengers and 18% for cars

Road Equivalent Tariff Pilot Extension to Islay, Colonsay & Gigha Evaluation Report TRANSPORT SCOTLAND
21
Table 3.2: Full year passengers on ferry services to Colonsay, Gigha and Islay, November 2011 – October 2012 (pre-RET) and November 2012-October 2014 (during-RET)
Passengers
Route pre-RET RET pilot year 1
RET pilot year 2
% change (pre-RET and RET
pilot year 1)
% change (RET pilot
years 1 and 2)
% change (pre-RET and RET
pilot year 2) Islay-Kennacraig 176,889 180,631 189,912 2% 5% 7% Colonsay-Oban 14,237 15,504 13,603 9% -12% -4% Gigha-Tayinloan 56,090 58,362 63,753 4% 9% 14% Total across all 3 routes 247,216 254,497 267,268 3% 5% 8%
Source: CalMac
Table 3.3: Full year cars on ferry services to Colonsay, Gigha and Islay, November 2011 – October 2012 (pre-RET) and November 2012-October 2014 (during-RET)
Cars
Route pre-RET RET pilot year 1
RET pilot year 2
% change (pre-RET and RET
pilot year 1)
% change (RET pilot
years 1 and 2)
% change (pre-RET and
RET pilot year 2)
Islay-Kennacraig 56,328 61,491 66,132 9% 8% 17% Colonsay-Oban 4,266 4,768 4,491 12% -6% 5% Gigha-Tayinloan 12,625 14,193 15,713 12% 11% 24% Total across all 3 routes 73,219 80,452 86,336 10% 7% 18%
Source: CalMac
Seasonal Breakdown Table 3.4 below shows the percentage change in passenger and car patronage for each of the three routes (and the average across the three routes) for the CalMac winter (November – March) and summer (April – October) periods separately during the two years of the RET pilot operation24. In the first year of the pilot operation, for all routes, there was a greater percentage change in car and passenger patronage over the summer period than over the winter period. The greatest percentage increase in car carryings over the summer period was seen on the Gigha route (19%) whilst the smallest increase (10%) was seen on the Islay route. Conversely, in terms of the change in winter patronage, the greatest percentage change was seen on the Islay route (7%) whilst a percentage decrease (-3%) was recorded on the Gigha route. During the second year of the pilot operation, for the Islay route, there was a greater percentage change in car and passenger patronage over the summer period than over the winter period, with an increase of 7% for passengers and 9% for cars over summer. However, for the Gigha route there was a greater percentage increase in both foot and car 24 Full data for the third year of the RET pilot are not yet available.

Road Equivalent Tariff Pilot Extension to Islay, Colonsay & Gigha Evaluation Report TRANSPORT SCOTLAND
22
patronage over the winter period than over the summer period. Passengers increased by 11% and cars increased by 13% over the winter while the respective figures over the summer period are 9% and 10%. Finally for the Colonsay route there was a decrease in passenger patronage over both winter and summer periods of 6% and 13% respectively. Whilst car patronage saw a decrease of 8% over the summer, it increased by 2% over winter. Table 3.4: Carryings percentage change, winter and summer, services to Colonsay, Gigha and Islay
Year 1 % change (winter 2011/12 - winter 2012/13)
% change (summer 2012 - summer 2013)
Route Passengers Cars Passengers Cars
Islay-Kennacraig 0.2% 7.0% 2.7% 10.0%
Colonsay-Oban 5.2% 3.2% 9.5% 14.0%
Gigha-Tayinloan -12.3% -3.4% 9.3% 19.4%
Average across all 3 routes -2.5% 4.8% 4.6% 11.8%
Year 2 % change (winter 2012/13 - winter 2013/14)
% change (summer 2013 - summer 2014)
Route Passengers Cars Passengers Cars
Islay-Kennacraig -0.1% 3.9% 6.8% 8.9%
Colonsay-Oban -6.0% 2.1% -13.3% -7.7%
Gigha-Tayinloan 11.4% 13.4% 8.7% 9.7%
Average across all 3 routes 2.1% 5.5% 5.9% 8.0%
Source: CalMac
1.7.2 Research question: Has RET had an impact on the number of trips made by residents and visitors (Islay only)? Analysis has been undertaken of the visitor and resident split from the Islay on-board surveys across the period of the RET pilot operation. This analysis only considers Islay since the on-board residents survey was carried out for Islay residents only. It should be highlighted that Islay forms the biggest island of the pilot area in terms of population and ferry carryings. Another limitation is that only the surveys carried out in summer 2012 can be treated as baseline for this exercise. The on-board surveys provide a limited sample from which the approximate numbers of trips by visitors can be estimated. However, given the very small sample these figures should be taken only as a broad indication of trends. From the summer 2012 pre-RET survey it is estimated that around 86% of trips were generated by visitors to Islay and around 14% by Islay residents. Similarly estimates from the on-board survey for summer 2013 indicate that 89% of trips were made by Islay visitors and 11% by Islay residents with 87% of trips were made by Islay visitors and 13% by Islay residents for summer 2014. Applying these ratios to the overall ferry traffic, the change in Islay visitor travel is shown in table 3.5 along with the total patronage for the winter and summer periods.

Road Equivalent Tariff Pilot Extension to Islay, Colonsay & Gigha Evaluation Report TRANSPORT SCOTLAND
23
Table 3.5: Total patronage for winter and summer period – visitor and resident estimated share
Year / period
Total patronage
(Winter and Summer)
Winter only patronage (residents
and visitors)
Summer only patronage (residents
and visitors)
Summer only visitors Number % Share of
summer total
Passengers 2012 176,889 42,969 133,920 114,551 86% 2013 180,631 43,066 137,565 121,836 89% 2014 189,912 43,027 146,885 127,439 87% Cars 2012 56,328 15,358 40,970 35,044 86% 2013 61,491 16,431 45,060 39,908 89% 2014 66,132 17,066 49,066 42,570 87% Source: TS calculations
Table 3.6 shows the number of additional trips made by Islay visitors during summer as well as the percentage change during the operation of the RET pilot. Using the carryings data it is estimated that in the first year of RET a total of 121,836 passenger trips and 39,908 car trips were undertaken by visitors to Islay. This provides an estimate of an additional 7,285 passenger and 4,864 car trips compared to summer 2012. It is estimated that in the second summer of RET (2014) 127,439 passenger trips and 42,570 car trips were undertaken by Islay visitors, this represents an additional 12,888 passenger trips and 7,526 car trips compared to summer 2012. Table 3.6: Additional trips by Islay visitors (Summer only)
Total Islay patronage - Summer Islay visitors Number of
additional trips % change Number of additional
trips % change
Summer 2013 (RET year 1) compared to summer 2012 pre-RET Passengers 3,645 3% 7,285 6%
Cars 4,090 10% 4,864 14%
Summer 2014 (RET year 2) compared to summer 2012 pre-RET Passengers 12,965 10% 12,888 11%
Cars 8,096 20% 7,526 21%
Source: TS calculations

Road Equivalent Tariff Pilot Extension to Islay, Colonsay & Gigha Evaluation Report TRANSPORT SCOTLAND
24
1.7.3 Research question: Is the additional patronage a consequence of existing or new users or both? To determine whether the increase in patronage is a consequence of new users or of existing users using the service more frequently, we draw on survey results from the combined summer and winter 2014 survey waves. The findings suggest that the increase in patronage is, at least in part, due to new visitor users and does not appear to be due to new Colonsay, Gigha and Jura residents using the service. Information is not available for Islay residents on this question. • Findings from the 2014 on-board visitors surveys suggest that almost half of visitors
(48%) used the ferry route for the first time. This suggests that the increase in patronage is, in part, a consequence of new service users.
• Findings from the 2014 household survey suggest that 5% of Colonsay, Gigha and Jura residents used the route for the first time over the last twelve months25. This suggests that the increase in patronage was mainly a consequence of existing service users.
Findings from the 2014 surveys suggest that the increase in patronage is also, at least in part, due to existing users using the services more frequently. • Findings from the 2014 on-board visitors survey suggest that, following the introduction
of RET, the majority of existing users (77%) used the ferry service at the same frequency as before. Of the existing visitor users, 19% stated that they used the service more often since October 2012, indicating that the introduction of RET has brought some additional patronage from existing visitor service users.
• Findings from the 2014 on-board Islay residents survey suggest that, following the introduction of RET, two thirds (67%) of existing users used the ferry service at the same frequency as before RET. The introduction of RET may have brought some additional patronage from existing Islay resident service users since 26% of existing users stated that they used the service more often over the last two years.
• Findings from the 2014 household survey suggest that, following the introduction of RET, 60% of existing users in Colonsay, Gigha and Jura used the ferry service at the same frequency as before RET and 24% used the ferry more often. This indicates that the introduction of RET may have brought some additional patronage from existing Colonsay, Gigha and Jura resident service users.
25 As discussed on chapter 2 of this report there is an alternative service to the mainland during the summer period.

Road Equivalent Tariff Pilot Extension to Islay, Colonsay & Gigha Evaluation Report TRANSPORT SCOTLAND
25
1.7.4 Research question: Has RET had an impact on the frequency of usage of existing users? To determine the importance of fare changes on how frequently existing users use the ferry services, we examine findings from the combined summer and winter 2014 surveys. The findings suggest that reductions in fares brought about by RET were an important or very important factor in the decision of most existing users to use the ferry services more. It should be noted that, in all three surveys, findings indicate an increase in the impact of RET on the frequency of ferry usage when compared to 2013 results.
• Findings from the 2014 on-board visitors survey show that for 59% of existing service users who stated that they had used the ferry more over the past year, changes to fares were an important or very important factor in their decision to use the ferry service more frequently.
• Findings from the 2014 on-board Islay residents survey suggest that changes to
ferry fares were an important or very important factor for over half (59%) of existing service users who stated that they had used the ferry more since October 2012.
• Findings from the 2014 household survey suggest that changes to ferry fares were
an important or very important factor for 54% of existing service users residents in Colonsay, Gigha and Jura who stated that they had used the ferry more over the past two years.
1.7.5 Research question: How sensitive is patronage to the reduction in fares? To determine how responsive patronage is to the reduction in fares brought about by RET, we measure the price elasticity of demand by comparing the percentage change in patronage with the percentage change in fares for both the summer and winter periods. RET was introduced to the winter timetable in late October 2012, and RET fares were then uprated after 18 months rather than 12 months. This means that the percentage change in fares cannot be captured on an annual basis and measuring elasticities for the second and third year of the pilot is challenging. Defining the period before the introduction of RET (November 2011-October 2012) as the base year, the change in fares and patronage can be measured against this base year. Table 3.7 below demonstrates the price elasticity of demand for passengers and cars on each of the three routes and shows the average figure for the three routes for both winter (November to March) and summer (April to September) periods26. It should be noted that an elasticity higher than 1 indicates that patronage is more sensitive to price changes whilst an elasticity lower than 1 indicates than patronage is less sensitive to fare changes.
26 The winter period consists of 5 months (November to March) whilst the summer period accounts for 7 months (April to October). The reason for this is that RET was introduced near the end of October and CalMac's winter timetable commences after the 20th October each year running up to the end of March.

Road Equivalent Tariff Pilot Extension to Islay, Colonsay & Gigha Evaluation Report TRANSPORT SCOTLAND
26
Table 3.7: Price elasticity of demand, winter and summer periods
WINTER Base period 0 = Nov’ 11 - Mar’ 12 Price
Elasticity of Demand
periods 0-1
Price Elasticity of
Demand periods 0-2
Price Elasticity of
Demand periods 0-3
Period 1 = Nov’ 12 – Mar ‘13 Period 2 = Nov’ 13 – Mar’ 14 Period 3 = Nov’ 14 - Mar’ 15 ISLAY (Kennacraig - Port Ellen/Port Askaig) Passengers 0.01 0.01 0.11 Cars 0.24 0.39 0.04 GIGHA (Tayinloan - Gigha) Passengers 0.60 0.11 0.41 Cars 0.11 0.30 0.22 COLONSAY (Oban - Colonsay) Passengers 0.14 0.03 0.40 Cars 0.08 0.13 0.13 Average Passengers 0.15 0.04 0.31 Cars 0.07 0.27 0.05 SUMMER Base period 0 = Apr ’12 – Oct’ 12
Price Elasticity of Demand 0-1
Price Elasticity of Demand 0-2
Price Elasticity of
Demand 0-327 Period 1 = Apr ’13 – Oct ’13 Period 2 = April ’14 – Oct ’14 Period 3 = April ’15 – Oct ‘15 ISLAY (Kennacraig - Port Ellen/Port Askaig) Passengers 0.07 0.26 n/a Cars 0.23 0.47 n/a GIGHA (Tayinloan - Gigha) Passengers 0.29 0.62 n/a Cars 0.43 0.70 n/a COLONSAY (Oban - Colonsay) Passengers 0.18 0.10 n/a Cars 0.27 0.10 n/a Average Passengers 0.18 0.26 n/a Cars 0.31 0.43 n/a
Source: TS Calculations
As shown in Table 3.6, the price elasticity of demand for both cars and passengers in both the summer and winter periods on all three routes is less than 1.0. This is because, for both passengers and cars in summer and winter on all three routes, the percentage increase in patronage was lower than the percentage decrease in fares. This implies that demand is inelastic, suggesting that patronage on these routes is not very sensitive to the change in fares. For the winter period, in the first year of the pilot operation, the average price elasticity of demand across all three routes is 0.15 for passengers and 0.07 for cars. The figures change in the second year of the RET pilot where the average price elasticity across the routes during the winter period is 0.04 for passengers and 0.27 for cars. In the third year
27 Patronage data not yet available

Road Equivalent Tariff Pilot Extension to Islay, Colonsay & Gigha Evaluation Report TRANSPORT SCOTLAND
27
of the RET pilot data report a higher price elasticity for passengers during the winter period (0.31) whilst a lower elasticity for cars (0.05) across the three routes of the pilot area. During the summer period the average price elasticity across all three routes is 0.18 for passengers and 0.31 for cars in the first year of the pilot operation. In the second year of the RET pilot the average price elasticity across the three routes is 0.26 for passengers and 0.43 for cars during summer. The higher average elasticities calculated for cars relative to passengers indicate that ferry users travelling with cars are more sensitive to changes in fares. Looking into both winter and summer periods, the higher average elasticities calculated for the summer period compared to the winter period suggest that ferry users, in particular those travelling with cars, are more sensitive to fare changes in the summer period than the winter period. It is worth highlighting that, for the most part, the highest elasticities are seen in the shortest route, Gigha – Tayinloan. Comparison with Western Isles, Coll and Tiree This section assesses the impact of the introduction of RET fares for Islay, Colonsay and Gigha (where RET was introduced in 2012) compared to the impact of the introduction of RET fares for the Western Isles, Coll and Tiree (WICT) 28 (where RET was introduced in 2008) in terms of changes in fares and patronage. The purpose of this comparison is to better assess the relative scale of the impact that RET has had on Islay, Colonsay and Gigha (ICG) in the first year of RET. Table 3.8 provides an overview of the average percentage change in fares for the first year following the introduction of RET in the two areas; the average percentage change in patronage and the resulting average price elasticities of demand. In the WICT report29, the change in fares, patronage and the elasticity of demand are presented for the year as a whole. Whereas, in this report, we present the corresponding information for ICG for the summer (April – October) and winter (November to March) periods separately. It is therefore important to note that when we draw comparisons between results for WICT and ICG, we are not comparing like with like. As can be seen from the table, the introduction of RET on services to ICG resulted in significantly smaller percentage changes in passenger and car patronage (in both summer and winter) and significantly lower elasticities for passengers and cars (in both summer and winter) when compared to the changes for WICT.
28 WICT RET routes: Ullapool-Stornoway, Uig-Tarbert/Lochmaddy, Oban-Castlebay/Lochboisdale and Oban-Coll/Tiree. 29http://www.google.co.uk/url?sa=t&rct=j&q=&esrc=s&source=web&cd=1&cad=rja&uact=8&ved=0CCEQFjAAahUKEwiQ_bjdzuTHAhUGq9sKHTQpB3k&url=http%3A%2F%2Fwww.gov.scot%2Fresource%2Fdoc%2F935%2F0115577.doc&usg=AFQjCNHhIHVCbcN7q0n6E8l58MHNnnEIDw

Road Equivalent Tariff Pilot Extension to Islay, Colonsay & Gigha Evaluation Report TRANSPORT SCOTLAND
28
Table 3.8: Change in fares, patronage and price elasticity of demand following the introduction of RET
Average percentage
change in single fares Average percentage change in patronage
Average price elasticity of demand
Passengers Cars Passengers Cars Passengers Cars Colonsay, Gigha, Islay (summer) -44% -48% 5% 12% 0.10 0.25
Colonsay, Gigha, Islay (winter) -29% -35% -3% 5% 0.09 0.14
Western Isles, Coll and Tiree -36% -32% 19% 30% 0.56 0.96
Source: CalMac Changes in Fares: For cars, average ferry fares decreased more in the ICG routes in both winter (-35%) and summer (-48%) compared to the WICT routes (-32%). For passengers, the average decline in fares on ICG routes in summer (-44%) was greater than the decline in the year-round average WICT fare (-36%) whilst the decline in ICG winter fares was smaller (29%). Changes in Patronage: The introduction of RET brought about a clear increase in patronage on WICT routes, with passenger patronage increasing by 19% and car patronage increasing by 30%. When compared to these figures, the impact of RET on patronage on ICG routes is significantly lower, with car patronage increasing by 12% in the summer period and 5% in the winter period. The impact of passenger numbers was even less positive, with patronage increasing by 5% in summer and patronage actually falling by 3% in winter. Elasticities: The price elasticity of demand (the responsiveness of demand for ferry services to the fare change) is relatively low for the ICG routes in both summer (0.10 for passengers and 0.25 for cars) and winter (0.09 for passengers and 0.14 for cars). Figures for WICT ferry services report a higher price elasticity (0.56 for passengers and 0.96 for cars). These results indicate that ferry users in the WICT area are more sensitive to fare reductions than ferry users in the ICG area. For both the ICG and WICT areas, the elasticities for cars are higher than those for passengers indicating that demand for ferry use by car is more sensitive to fare changes. 1.7.6 Research question: Has RET had an impact on the decision of existing and new users to use the ferry services? To determine whether the increase in patronage is a consequence of new users or of existing users using the service due to the introduction of lower fares, we draw on survey results from the combined summer and winter 2014 survey waves. Figure 3.1 below shows how much RET reduced fares have influenced ferry users to use the ferry on their last trip. The findings suggest that the increase in patronage is, at least in part, due to the introduction of RET. However, it is important to note that in the visitor and household surveys a significant proportion of participants, 36% and 27% respectively, were not aware of fare changes.

Road Equivalent Tariff Pilot Extension to Islay, Colonsay & Gigha Evaluation Report TRANSPORT SCOTLAND
29
• Findings from the 2014 on-board visitors surveys suggest that the introduction of lower fares has influenced 17% of visitors to use the ferry service for their trip. Of this proportion 10% suggested that RET had a lot influence on their decision.
• Findings from the 2014 on-board Islay residents surveys suggest that the introduction of RET influenced 16% of Islay residents to use the ferry for their trip. However, for the vast majority of participants (79%) the introduction of RET had no impact.
• Findings from the 2014 household survey suggest that the introduction of RET had influenced the decision of 23% of Colonsay, Gigha and Jura residents to use the ferry service.
Figure 3.1: Impact of RET reduced fares on using the ferry on last trip
Source: on-board and household surveys Displacement 1.8
1.8.1 Research question: Have RET fares had an impact on displacement from other routes? To determine whether the reduced ferry fares had an impact on new or existing users switching from another route we look into the combined summer and winter 2014 surveys. The findings suggest that a small percentage of ferry users, mainly visitors, have been displaced from other routes due to introduction of RET. • Findings from the 2014 on-board visitors survey suggest that if fares had not been
reduced, nearly 1% of visitors would have made a trip by ferry to another Scottish island with Mull and the Northern Isles among the destinations cited. Almost 2% of visitors would have gone somewhere else in Scotland had ferry fares not been

Road Equivalent Tariff Pilot Extension to Islay, Colonsay & Gigha Evaluation Report TRANSPORT SCOTLAND
30
reduced. Among the alternative destinations, driving to Skye and the Highlands were cited.
• Findings from the 2014 on-board Islay residents survey suggest that had ferry fares not been reduced the vast majority of Islay residents would still have made the same trip. However, 5% of the participants would not have made the journey at all had it not been for lower fares.
• Findings from the 2014 household survey show no displacement from other ferry routes because of the introduction of RET. However, 4.5% of the Colonsay, Jura and Gigha residents would not have made the trip at all had RET fares not been introduced and 1% would have travelled to another destination on the mainland.
1.8.2 Research question: Have RET fares displaced traffic/patronage from other modes? To determine whether the reduced ferry fares had an impact on new or existing users switching from another mode we look into the combined summer and winter 2014 surveys. However, due to limitations of the questionnaires it is not possible to determine whether any additional patronage was due to new users switching from another mode. We therefore focus on whether ferry users overall would have made the same trip by another transport mode. The alternative transport option for Islay and Colonsay is flying whilst for all islands of the pilot area the ferry user also has the option of switching to a foot passenger and travel by ferry without a car. • Findings from the 2014 on-board visitors survey suggest that had lower ferry fares not
been introduced 2% of visitors would have made the same trip by another mode of transport. Of those using another transport mode to travel, 28% would have flown whilst 32% would have travelled without a car.
• Findings from the 2014 on-board Islay residents survey suggest that 2% of participants would have travelled by another mode of transport had lower ferry fares not been in place. From the total number of islanders (5) who would have switched to another mode, 80% would have travelled without car and 20% would have travelled by plane.
• Findings from the 2014 household survey show no displacement from other modes of transport. However, this may be a reflection of the limited alternative transport options for the residents of Gigha and Jura who can only travel by ferry.
We also look into whether users of the Islay and Colonsay ferry services30 switched from flying following the introduction of RET. To do this we examine the findings from the combined summer and winter 2014 surveys. • Findings from the 2014 on-board visitors survey suggest that 13% chose not to fly and
use the ferry instead due to the reduced RET fares.
• Findings from the 2014 on-board Islay residents survey suggest that the reduced RET fares were a reason for 15% of those choosing not to fly.
30 Islay and Colonsay both have air services as an alternative means of travel whilst Gigha and Jura do not.

Road Equivalent Tariff Pilot Extension to Islay, Colonsay & Gigha Evaluation Report TRANSPORT SCOTLAND
31
• Findings from the 2014 household survey suggest that 10% of Colonsay and Jura
residents chose not to fly and use the ferry instead due to the reduced RET fares. To determine whether switching mode from flying affected the frequency with which existing ferry users use the service, we draw on survey results from the combined summer and winter 2014 survey findings. Overall, existing Islay and Colonsay ferry users have rated ‘switching from flying’ as less important factor for increasing the frequency of ferry usage in the years following the introduction of RET. However, looking into the 2013 and 2014 survey findings respectively, there is an increase in the numbers of Islay and Colonsay ferry users in 2014 who state that switching from flying may increase the frequency of their ferry usage. This suggests that the additional patronage resulting from existing users using the service more could be to some extent, a consequence of those users switching from air services. • Findings from the 2014 on-board visitors survey indicate that 7% of existing Islay and
Colonsay ferry service users considered switching from flying, an important or very important factor in their decision to change how frequently they used the ferry service since the introduction of RET in October 2012.
• Findings from the 2014 on-board Islay residents survey suggest that for 10% of Islay residents who were existing Islay ferry service users, switching from flying was an important or very important factor in their decision to change the frequency with which they used ferry service since the introduction of RET two years ago.
• Findings from the 2014 household survey show that 8% of Colonsay residents, who were existing Colonsay ferry service users, rated switching from flying as an important or very important factor in their decision to change the frequency with which they used ferry service over the last two years.
Purpose of travel 1.9
1.9.1 Research question: For what purpose are people travelling on services to Islay, Colonsay and Gigha? To determine the purposes for which people are travelling on the ferry services, we draw on survey results from the combined summer and winter 2014 surveys. Findings from the 2014 surveys suggest that the purpose of travel differs significantly depending on whether the person travelling is a visitor to the island or a resident. The most common purpose of travelling for visitors was for a holiday or short-break and it was also the most common purpose of travelling for Islay residents. For Colonsay, Gigha and Jura residents, shopping was the most common purpose of travel. Figure 3.2 compares purpose of travel among survey participants for 2014.

Road Equivalent Tariff Pilot Extension to Islay, Colonsay & Gigha Evaluation Report TRANSPORT SCOTLAND
32
Figure 3.2: Purpose of trip among survey respondents in 2014
Source: on-board and household surveys
• Findings from the 2014 on-board visitors survey suggest that the most common reason for travelling is a holiday or short break (75%) followed by visiting friends or relatives (18%) and leisure activities (16%).
• Findings from the 2014 on-board Islay residents survey suggest that for Islay residents, the three most common reasons for travelling on the ferry are a holiday or short break (37%), visiting friend or relatives (29%) and leisure activities (25%). Other common journey purposes include shopping (18%) and employer’s business (12%). The two least favourable options appear to be, commuting to place of work/education (7%) and health-related reasons, such as doctor or hospital appointments (6%).
• Findings from the household survey found that for residents of Colonsay, Gigha and Jura, the most common reason for travelling by ferry is shopping (31%) followed by visiting friends and relatives with 25% of responses. Other popular journey purposes include travelling for health-related reasons (16%), holiday or short break (16%) and commuting to place of work/education (13.5%). The least popular purposes of travel are employer’s business and leisure activities each with 4.5% of responses.

Road Equivalent Tariff Pilot Extension to Islay, Colonsay & Gigha Evaluation Report TRANSPORT SCOTLAND
33
1.9.2 Research question: Has the introduction of RET affected the purposes for which people travel? To determine whether the introduction of RET has affected journey purpose, we compare survey results from summer 2012, prior to the introduction of RET, with survey results from the summer 2014 wave, when RET was in place31. Overall, the survey results suggest that the most common trip purpose for visitors and residents (both of Islay and Colonsay, Gigha and Jura) did not change when RET was introduced. Figure 3.3 below presents the on-board survey results for Visitors’ purpose of travel over the three year evaluation period. Figure 3.3: Purpose of trip for visitors, 2012-2014, summer only
Source: on-board surveys, sample size=1,158
• Findings from the on-board visitors surveys suggest that the most common trip purpose for visitors was the same in both summer 2012 and 2014 - a holiday or short break. The proportion choosing this option is higher in 2014 (76%) than in 2012 (67%). In fact it follows an increasing trend since the introduction of RET as the respective proportion in 2013 was 73%. In 2014, 17% of individuals travelled for leisure purposes, an increase of 1.6 percentage points on the 2013 survey32.
Figure 3.4 overleaf sets out the on-board survey results for Islay residents’ purpose of travel over the three year evaluation period.
31 We do not include data from the winter (October) waves as RET was introduced part the way through the October 2012 surveys. 32 This option was only introduced in the 2013 surveys, therefore no comparison can be made with 2012.

Road Equivalent Tariff Pilot Extension to Islay, Colonsay & Gigha Evaluation Report TRANSPORT SCOTLAND
34
Figure 3.4: Purpose of trip for Islay residents, 2012-2014, summer only
Source: on-board surveys, sample size=150
• Findings from the on-board Islay residents surveys suggest that the most common trip purposes for Islay residents were the same in both summer 2012 and 2014, with the purposes being a holiday/short-break and visiting friends/relatives. The proportion travelling for a holiday/short break decreased from 42% in 2012 to 35% in 2013 whilst the proportion travelling to visit friends or family fell by 11 percentage points to 28% in 2014. The proportion commuting to their place of work/education decreased by 3.5 percentage points to 5.5% in 2014. Conversely, the proportion travelling on employer’s business increased by 5 percentage points to 14% in 2014.
Figure 3.5 demonstrates the respective figures and changes for Colonsay, Gigha and Jura residents’ purpose of travel and the percentage point changes over the three year evaluation period.

Road Equivalent Tariff Pilot Extension to Islay, Colonsay & Gigha Evaluation Report TRANSPORT SCOTLAND
35
Figure 3.5: Purpose of trip for Colonsay, Gigha and Jura residents, 2012-2014, summer only
Source: household surveys, sample size=50
• Findings from the household surveys suggest that the most common trip purpose for residents of Colonsay, Gigha and Jura in both summer 2012 and 2014 was shopping33. However the proportion choosing this option was lower in 2014 (35%) than in 2012 (41%). The proportion travelling for a holiday/short break increased by 5 percentage points to 16% in 2014 whilst the proportion travelling to commute to their place of work/education increased by 10 percentage points to 16%. The proportion of Colonsay, Gigha and Jura residents travelling for health related purposes fell by 12 percentage points to 14% in 2014.
Average expenditure by residents and visitors 1.10
This section sets out the accommodation arrangements and expenditure of island residents when they travel out with the islands and also the accommodation arrangements and expenditure of visitors to the islands. It is important to note that the spending figures represent the reported average spending of residents and visitors, at the individual level, following the introduction of RET. It does not consider how the overall level of spending of visitors and residents as a whole (taking into account changes in patronage as well as changes in average spending) has changed.
33 It should be noted that in the summer 2014 household survey the share of Colonsay residents was 14% of the total sample, the share of Gigha residents was 46% of the total sample whilst the Jura residents share was 40%.
Road Equivalent Tariff Pilot Extension to Islay, Colonsay & Gigha Evaluation Report TRANSPORT SCOTLAND
36
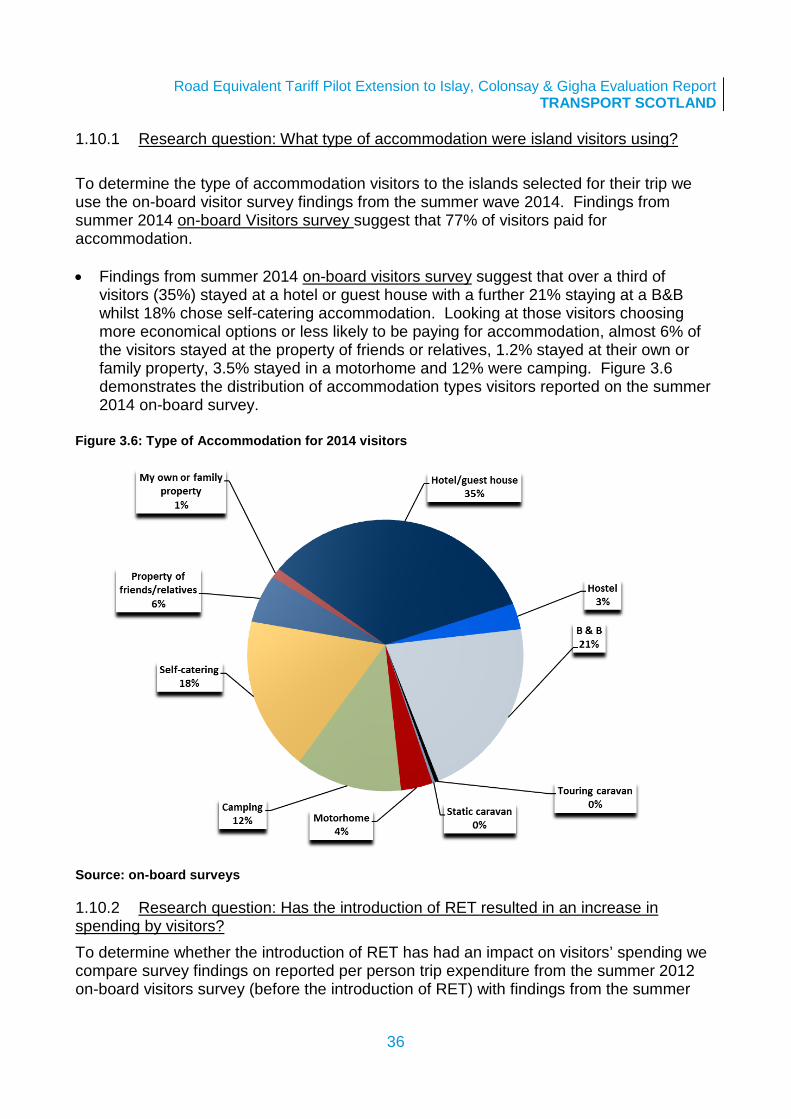
1.10.1 Research question: What type of accommodation were island visitors using? To determine the type of accommodation visitors to the islands selected for their trip we use the on-board visitor survey findings from the summer wave 2014. Findings from summer 2014 on-board Visitors survey suggest that 77% of visitors paid for accommodation. • Findings from summer 2014 on-board visitors survey suggest that over a third of
visitors (35%) stayed at a hotel or guest house with a further 21% staying at a B&B whilst 18% chose self-catering accommodation. Looking at those visitors choosing more economical options or less likely to be paying for accommodation, almost 6% of the visitors stayed at the property of friends or relatives, 1.2% stayed at their own or family property, 3.5% stayed in a motorhome and 12% were camping. Figure 3.6 demonstrates the distribution of accommodation types visitors reported on the summer 2014 on-board survey.
Figure 3.6: Type of Accommodation for 2014 visitors
Source: on-board surveys
1.10.2 Research question: Has the introduction of RET resulted in an increase in spending by visitors? To determine whether the introduction of RET has had an impact on visitors’ spending we compare survey findings on reported per person trip expenditure from the summer 2012 on-board visitors survey (before the introduction of RET) with findings from the summer

Road Equivalent Tariff Pilot Extension to Islay, Colonsay & Gigha Evaluation Report TRANSPORT SCOTLAND
37
2014 wave (two years of RET pilot operation)34. Spending on accommodation and other goods/services on the islands during their trip is reported at an individual level. We also compare survey findings on reported per person trip expenditure from the summer 2013 on-board visitors surveys with findings from the summer 2014 wave to capture any changes in visitors spending behaviour over the two years of the RET operation. Table 3.9 below provides the detailed data for visitor spending to the islands for the three year evaluation period. Table 3.9: Expenditure by visitors to the islands
Expenditure per person Survey Summer Wave Accommodation Other Costs Total
Visi
tors
2012 £479 £291 £770
2013 £384 £298 £682
2014 £368 £292 £661
% change 2014-2013 -4.2% -1.8% -3.1%
% change 2014-2012 -23.2% 0.6% -14.2%
Source: on-board surveys
• In 2014, the average spending of visitors on accommodation during their last ferry trip was £368, a fall from £384 in 2013.
1.10.3 Research question: Has the introduction of RET resulted in island residents spending more on the mainland? To determine whether the introduction of RET has had an impact on island residents’ spending on the mainland at an individual level, we compare survey findings on reported trip expenditure from the summer 2012 on-board Islay residents survey and household Colonsay, Gigha and Jura residents survey (before the introduction of RET) with findings from the summer 2014 waves (the second pilot year of RET)35. We also compare reported trip expenditure per person between the two years of the pilot, i.e. summer 2013 waves and summer 2014 waves. Expenditure figures were collected for spending on accommodation and ‘other costs’ which may include food, shopping, leisure etc. It should be noted the accommodation spending for the island residents should be treated in effect as ‘opportunity cost’ as it is the money that could have been spent by residents on the island instead. The data is set out at Table 3.10 overleaf.
34 We do not include data from the winter (October) survey waves as RET was introduced part the way through the October 2012 surveys. 35 We do not include data from the winter (October) survey waves as RET was introduced part the way through the October 2012 surveys.

Road Equivalent Tariff Pilot Extension to Islay, Colonsay & Gigha Evaluation Report TRANSPORT SCOTLAND
38
Table 3.10: Expenditure of island residents to the Scottish mainland economy
Expenditure per person Survey Summer Wave Accommodation Other Costs Total
Isla
y R
esid
ents
2012 £362 £478 £840
2013 £358 £436 £795
2014 £251 £719 £970
% change 2014-2013 -29.9% 64.7% 22.1%
% change 2014-2012 -30.6% 50.5% 15.5%
Col
onsa
y,
Gig
ha a
nd J
ura
Res
iden
ts
2012 £94 £295 £389
2013 £70 £367 £437
2014 £194 £372 £566
% change 2014-2013 176.9% 1.4% 29.5%
% change 2014-2012 107.2% 26.2% 45.7%
Source: on-board and household surveys
• Findings from the summer 2014 on-board Islay residents survey suggest that: average spending of Islay residents on accommodation during their trip to the
mainland was £251 a decrease from £358 in 2013
average spending on other goods and services was £719, an increase from £436 in 2013
• Findings from the summer 2014 household survey suggest that: average spending of the Colonsay, Gigha and Jura residents who required
accommodation was £194 an increase from £70 in 2013
average spending on other goods and services during their last trip to the mainland was £372 an increase from £372 in 2013
It is important to note that this analysis uses only one indicator (spending) to identify potential ‘leakages’ and ‘injections’ and that is the average spending per person of the survey samples. Other aspects of spending such as business investment and turnover which would have economic impacts have not been considered in this analysis. It should also be noted that there will be considerable variation around the average spending figure if, for example, on individual purchases a ‘big ticket’ item when on the mainland.

Road Equivalent Tariff Pilot Extension to Islay, Colonsay & Gigha Evaluation Report TRANSPORT SCOTLAND
39
Capacity of the ferries
Current capacity 1.11 Whilst the analysis so far has focused on the demand-side, how ferry users have reacted to the introduction of RET on the pilot area, it is also important to consider the supply-side, whether current capacity on the routes has supressed the reported increase in demand. This section considers the vessel deck utilisation for each route in the pilot area and considers potential capacity constraints as a result of RET. 1.11.1 Vessels Table 4.1 below sets out the characteristics of the vessels that serve the ferry routes of the pilot area. The Islay – Kennacraig route is primarily serviced by the MV Finlaggan and MV Hebridean Isles. MV Finlaggan was launched in 2011 and can carry up to 550 passengers and 85 cars. MV Hebridean Isles built in 1985 accommodates up to 494 passengers and 62 cars. MV Isle of Arran and MV Lord of the Isles serve the route as winter relief vessels. The Colonsay – Oban route does not have a dedicated vessel. Based on sailings figures for financial years 2013 and 2014 the vessel operating most of the sailings is the Lord of the Isles. She was built in 1986 with capacity for 506 passengers and 54 cars and serves the route throughout the year. The route is also served by three additional vessels, the MV Isle of Mull, the MV Hebrides and the MV Hebridean Isles. The MV Isle of Mull with capacity for up to 951 passengers and 70 cars runs the service in the summer timetable. The primary vessel on the Gigha – Tayinloan route is the MV Loch Ranza built in 1986 with capacity for 200 passengers and 12 cars. MV Loch Linnhe serves the route as winter relief vessel and has the same specifications as MV Loch Ranza. Table 4.1: Routes Vessel Characteristics and Capacity
Route Vessel(s) Year of Build Length (m) Passengers Cars
Islay-Kennacraig
MV Finlaggan 2011 89.9 550 85 MV Hebridean Isles 1985 85.15 494 62 MV Isle of Arran 1983 84.92 448 76 MV Lord of the Isles36 1989 84.6 506 54
Colonsay-Oban
MV Lord of the Isles 1986 84.6 506 54 MV Isle of Mull 1988 90.03 951 70 MV Hebridean Isles 1985 85.15 494 62 MV Hebrides37 2000 99.0 612 98
Gigha-Tayinloan
MV Loch Ranza 1986 30.2 200 12 MV Loch Linnhe38 1986 30.2 200 12
Source: CalMac
36 Supported the service in winter 2012/13, between 5th December and 28th March as winter relief vessel 37 Supported the service in winter 2012, between 3rd and 21st December as winter relief vessel 38 Supported the service in winter 2013/14, between 29th December and 3rd March as winter relief vessel

Road Equivalent Tariff Pilot Extension to Islay, Colonsay & Gigha Evaluation Report TRANSPORT SCOTLAND
40
1.11.2 Capacity utilisation Capacity utilisation is a measure of carryings capacity supplied and the volume of passengers and vehicles utilising it. Vessel capacities are expressed in terms of Passenger Car equivalent Units (PCUs)39. According to CalMac, the generally accepted (and quoted) PCU capacity of the vessel is defined as the number of cars which can be loaded on to the car deck within the confines of the vessel turn-round time in port. It should be noted that since PCUs involve an average car size and depend on the mix of traffic and the use of mezzanine decks, the actual vessel capacity on a particular sailing may vary by 15% from the quoted capacity. Data on route by route sailings and capacity of operating vessels have been collated for the period between October 2012 and September 2014. Based on these data it is possible to estimate the maximum capacity, in terms of numbers of passengers and cars that have been shipped on the ferry routes of the pilot area. Data on capacity utilisation are commercial in confidence and are not reproduced in full detail here. Anecdotal evidence suggests that, for the CalMac ferries network, 70% capacity utilisation is around the point at which capacity starts to become constrained. We therefore apply a factor of 70% to the maximum capacity figures to estimate the ‘effective capacity’. One impact of RET fares may be to increase demand so that capacity becomes constrained on a particular route on specific sailings, days, weeks etc. To assess whether the introduction of RET has resulted in constrained capacity we categorised the sailings into three bandings. The first banding is for sailings where utilised capacity is below 15%, the second banding is for capacity utilisation between 16% and 69% and the third banding is for sailings exceeding 70% of car deck utilisation. Table 4.2 overleaf sets out the number and proportion of sailings on each route for each of the capacity utilisation bandings and outlines the change between the first two years of the pilot operation.
39 1 PCU is presently defined as the space which a car of length 4.25m and width of 1.94m occupies - allowing space around the car for access to both interior and exterior compartments.

Road Equivalent Tariff Pilot Extension to Islay, Colonsay & Gigha Evaluation Report TRANSPORT SCOTLAND
41
Table 4.2: Capacity Utilisation Banding in the first two years of the pilot operation
Capacity Utilisation <=15%
Capacity Utilisation 16%-69%
Capacity Utilisation >=70%
Island Period Number of Sailings % Share Number of
Sailings % Share Number of Sailings % Share
Islay
Oct 2012-Sep 2013 91 3% 1428 54% 1135 43% Oct 2013-Sep 2014 207 8% 1470 53% 1075 39% % change 127 % 4% 3% 0% -5% -4%
Colonsay
Oct 2012-Sep 2013 107 30% 237 67% 8 2% Oct 2013-Sep 2014 118 32% 245 66% 8 2% % change 10% 1% 3 % -1% 0.0% 0%
Gigha
Oct 2012-Sep 2013 2,251 35% 3,751 59% 362 6% Oct 2013-Sep 2014 2,217 33% 4,078 62% 332 5% % change -2% -2% 9% 3% -8% -1%
Source: CalMac As can be seen from the table, the majority of sailings on the Islay-Kennacraig route lie within the 16%-69% banding in both operating periods with 54% and 53% respectively. It is important to note that the number of sailings where over 70% of the vessel car deck has been utilised is considerably high with 43% in the first year of operation of RET and 39% in the second year of operation of RET. On the Oban-Colonsay route, most sailings have a capacity utilisation of between 16% and 69%. The sailings where more than 70% of vessel car deck has been utilised account for only 2% in both years of the RET operation. Of the total sailings, 30% fall under the 15% banding in the first year of RET operation whilst this proportion slightly increases in the second year to 32%. On the Tayinloan-Gigha route, 59% of sailings account for 16% to 69% of deck utilisation during the first year of the RET operation whilst this figure increases to 62% in the second year of the RET operation. In the second year of RET operation a small proportion of sailings (5%) have maximum capacity utilisation exceeding 70% decreasing slightly by 1% since the first year. Within the 15% capacity utilisation banding lie 35% of sailings in the first year of operation of RET and 33% in the second year. Overall, it would appear that although the introduction of RET fare has generally led to an increase in demand there does not appear to be a particular constraint on capacity on the Gigha and Colonsay routes, however, capacity is now more constrained on the Islay route. Capacity utilisation can be interpreted on the grounds of sailing time, sailing leg, day of the week and month of the year. Whilst some routes may not have maximum capacity utilisation, particular sailing times or sailing legs may be more affected than others and in excess of their capacity utilisation.

Road Equivalent Tariff Pilot Extension to Islay, Colonsay & Gigha Evaluation Report TRANSPORT SCOTLAND
42
Ferry users’ views on capacity utilisation 1.121.12.1 Booking ahead To assess whether the introduction of RET has brought about changes in ferry users’ ability to book their tickets ahead of their travel we look into survey results from the combined summer and winter 2014 waves. Overall, the survey results suggest that for most island residents booking ahead has become more difficult since the introduction of RET whilst for over a third of visitors (38%) it has remained the same. Figure 4.1 below sets out the ferry users’ perceptions of how booking ahead for their trip has changed since October 2012 where RET was introduced to the routes. Figure 4.1: Ferry users’ perceptions of how booking ahead has changed since the introduction of RET
Source: on-board and household surveys • Findings from the on-board visitors surveys indicate that for 27% of visitors booking
ahead has become easier whilst for 9% it has become more difficult. For 36% of the visitors booking their ticket in advance of their trip has remained the same.
• Findings from the on-board Islay residents surveys suggest that whilst 44% of islanders found booking ahead about the same, 33% indicated that booking ahead has become more difficult since the introduction of RET.
• Findings from the household surveys suggest that 38% of the Colonsay, Gigha and Jura residents find booking ahead more difficult since the introduction of RET. For

Road Equivalent Tariff Pilot Extension to Islay, Colonsay & Gigha Evaluation Report TRANSPORT SCOTLAND
43
25% of the participants booking ahead has remained the same and for 9% has become easier.
1.12.2 Travelling on preferred time and day To determine whether the introduction of RET has made travelling on preferred day and time easier or more difficult we look into survey results from the combined summer and winter 2014 waves. Overall, the survey results suggest that for the 43% of Islay residents travelling on preferred day and time has become more difficult since the introduction of RET whilst for the 50% of visitors and Colonsay, Gigha and Jura residents it has remained the same. Figure 4.2 below sets out the ferry users’ perceptions of how travelling on their preferred day and time has changed since October 2012 where RET was introduced to the routes. Figure 4.2: Ferry users’ perception of how travelling on preferred day and time has changed since the introduction of RET
Source: on-board and household surveys • Findings from the on-board visitors surveys indicate that for 49% of visitors travelling
on the time and day of their choice has remained the same whilst for 9% it has become more difficult since the introduction of RET fares. For 19% of visitors travelling on the preferred sailing has become easier.
• Findings from the on-board Islay residents surveys suggest that whilst 43% found travelling on sailings of their choice about the same, 38% indicated that it has become more difficult since the introduction of RET.

Road Equivalent Tariff Pilot Extension to Islay, Colonsay & Gigha Evaluation Report TRANSPORT SCOTLAND
44
• Findings from the household surveys suggest that 22% of the Colonsay, Gigha and Jura residents find travelling on the time and day of their choice has become more difficult since the introduction of RET. For 50% of the participants it has remained the same and for 10% it has become easier.
Future capacity 1.13
1.13.1 Overview Analysis of the collated data at the previous section shows that the route with most constrained capacity is the Kennacraig to Islay route. For nearly half of the sailings over 70% of the vessel car deck has been utilised. These figures suggest that with a continued increasing trend in demand, as reported on patronage and survey data, introducing demand management techniques might be required in the near future. Whilst for the other two routes of the pilot area, Oban-Colonsay and Tayinloan-Gigha, a small proportion of sailings fall into the over 70% capacity utilisation banding, it is worth noting that for both routes the majority of sailings fall under the 16% to 69% capacity utilisation banding. 1.13.2 Increasing capacity utilisation As capacity constraints can be a barrier to ferry travel and the desired positive impacts brought about by the cheaper RET fares, it is useful to look into possible ways of increasing capacity utilisation. • Increasing turn-round times. This would allow vessels a greater time in port between
sailings resulting in a more efficient loading of the car deck when the ferry is very full. • Introducing variable pricing depending on the time of day, day of week or month of
year. For example, increasing the ferry fare during peak times in summer seasons would potentially provide an incentive for travellers (especially those travelling with a car) to choose another less busy sailing.
• Increasing capacity by providing more frequent sailings or bigger vessels.

Road Equivalent Tariff Pilot Extension to Islay, Colonsay & Gigha Evaluation Report TRANSPORT SCOTLAND
45
ANNEX A: Secondary data analysis
This section provides high level analysis of secondary data that could provide complementary backdrop to the evaluation of the impacts of RET on Islay, Colonsay and Gigha. It looks into economic, transport and tourism data. It should be highlighted that information provided in this section is a result of desk research and neither consultations nor surveys have been undertaken to inform the analysis40. Economic data Highlands and Islands Enterprise fragile areas The Scottish islands are considered rural areas of Scotland. Highlands and Islands Enterprise have undertaken a Review41 of fragile areas to assess the characteristics of rural communities in Scotland. To measure fragility and categorise communities four indicators were used: • Population decline (2001-2005) • Population density (2005) • Drive time to a mid-sized service centre • Income per household (2006)
According to this methodology, all four islands of the pilot area are characterised as fragile areas. ‘Fragile areas are characterised by weakening of communities through population loss, low incomes, limited employment opportunities, poor infrastructure and remoteness.’ Scottish Index of Multiple Deprivation The Scottish Index of Multiple Deprivation (SIMD) is the Scottish Government's official tool for identifying those places in Scotland suffering from deprivation. It incorporates several different aspects of deprivation, combining them into a single index. In this context, deprivation is defined more widely as the range of problems that arise due to lack of resources or opportunities, covering health, safety, education, employment, housing and access to services, as well as financial aspects. To measure the multiple aspects of deprivation seven indicators are used, these are:
• Employment • Income • Health • Education, Skills, and Training • Geographic Access to Services • Crime • Housing
The SIMD is available at the Datazone level42, although the Datazones reflect local authority boundaries they do not fit neatly into island boundaries. For example, the Gigha
40 The collection of data was undertaken in summer 2015 41 Highlands and Islands Enterprise Fragile Areas Review, 2007 http://www.gov.scot/Publications/2010/07/30101940/4 42 Datazones were developed as a common, stable and consistent small area geography. There are 6,505 datazones covering the whole of Scotland. Datazones are groups of 2001 Census output areas and have, on average, populations of between 500 and 1,000 household residents and nest within local authority boundaries.

Road Equivalent Tariff Pilot Extension to Islay, Colonsay & Gigha Evaluation Report TRANSPORT SCOTLAND
46
Datazone also includes an area of the Kintyre peninsula and the Datazone for Jura also includes the island of Colonsay and some of Islay. Table A-1 below presents data for all of the relevant datazones covering the geographic area of Islay, Colonsay, Gigha and Jura. Table A-1: Pilot area datazones and SIMD ranking
Datazone Name Island SIMD Domain Rank S01000755 Jura, Colonsay, part
of Islay Geographic Access – 15% most deprived All other domains least 85% deprived
S01000722 Islay Least 85% deprived for all domains S01000724 Islay Least 85% deprived for all domains S01000726 Islay Geographic Access – 15% most deprived
All other domains least 85% deprived S01000726 Islay Geographic Access – 15% most deprived
All other domains least 85% deprived S01000721 Gigha, part of Kintyre Geographic Access – 15% most deprived
All other domains least 85% deprived Source: Scottish Index of Multiple Deprivation 2012
According to 2012 SIMD results43 Argyll and Bute has 1% of Scotland’s 15% most deprived. Within Argyll and Bute 8.2% of datazones are in the 15% most deprived. Where an area does not have a datazone classified in the 15% most deprived it does not mean that it has no deprivation but that the deprivation is not concentrated in a geographical area. Gross Value Added Data on Gross Value Added (GVA) are not available at individual island level. However, data are available for Nomenclature of Units for Territorial Statistics (NUTS) areas in Scotland. Figure A-1 below presents GVA per head in the period between 2005 and 201344 for the NUTS area of Lochaber, Skye & Lochalsh, Arran & Cumbrae and Argyll & Bute and it compares it against the Western Isles (Eilean Siar) and Scotland as a whole. The RET was introduced to the pilot area of Islay, Colonsay and Gigha in 2012. As the chart shows GVA per head is below the level for Scotland but higher than that of the Western Isles. Figure A-2 presents the percentage change in GVA per head over the same period and shows a clear increase between 2012 and 2013. However, considering that the islands of the pilot area have a very small share in the NUTS area presented here, it is not possible to attribute any change in GVA to RET.
43 http://simd.scotland.gov.uk/publication-2012/simd-2012-results/ 44 Estimates of workplace based GVA allocate income to the region in which the economic activity takes place. Figures provided for 2013 are provisional.

Road Equivalent Tariff Pilot Extension to Islay, Colonsay & Gigha Evaluation Report TRANSPORT SCOTLAND
47
Figure A-1: GVA per head between 2005 and 2013
Source: Office of National Statistics Figure A-2: GVA per head percentage change between 2005 and 2013
Source: Office of National Statistics / National Records of Scotland
RET pilot
RET pilot

Road Equivalent Tariff Pilot Extension to Islay, Colonsay & Gigha Evaluation Report TRANSPORT SCOTLAND
48
Labour market To assess the economic shape of island communities in the pilot area we look into unemployment figures and enterprises profile. Economic data for each individual island are not available at such a low geographic area. Scottish Neighbourhood statistics provides data at the Datazone level but as discussed above the Datazones boundaries to not fit perfectly with the island boundaries. Most data discussed in this section are provided on Local Authority level and compared against the overall Scotland and Great Britain level. Whilst data on employment deprivation as reported by SIMD is presented below this is only currently available for the period prior to the introduction of RET. Unemployment and Job Seekers Allowance The overall number of economically active Argyll and Bute residents unemployed in 2014 was 2,100. This corresponds to a 5% unemployment rate, well below that for Scotland and Great Britain, with an overall unemployment rate of 6.2% for the same year. Historic data on unemployment rates are plotted in Figure A-3 and suggest that unemployment levels in Argyll and Bute council area are below the Scottish trend fluctuating between 3.7 and 7.1 per cent. Similar findings are presented in Figure A-4 where the change in Job Seekers Allowance (JSA) claimants for Argyll and Bute is lower than for Scotland and Great Britain. In May 2015 861 people sought JSA suggesting a decrease of 50% since the introduction of RET in October 2012. However due to the very small share of the pilot area population (less than 1%) of the overall Local Authority it is not possible to determine whether RET has any influence on this.
Figure A-3: Unemployment rate of economically active population in Argyll and Bute Council area
Source: Nomis
RET pilot

Road Equivalent Tariff Pilot Extension to Islay, Colonsay & Gigha Evaluation Report TRANSPORT SCOTLAND
49
Figure A-4: Job Seekers Allowance Claimants as percentage of economically active population
Source: Nomis
RET pilot

Road Equivalent Tariff Pilot Extension to Islay, Colonsay & Gigha Evaluation Report TRANSPORT SCOTLAND
50
Employment deprivation Figure A-5 shows the percentage of the working age employment deprived45 for each of the Datazones covering the pilot area. For the Argyll and Bute local authority, as a whole, the percentage of people employment deprived in 2011 was 11%. For most of the pilot area Datazones employment deprivation is lower than the Scottish average of 13% although the two less rural Datazones on Islay (Port Ellen and Bowmore) have a higher proportion than the other Datazones over the 3 years of data presented. Figure A-5: Percentage of working age population employment deprived, 2009-2011
Source: Scottish Neighbourhood Statistics
Enterprises Enterprises are categorised into micro, small and medium enterprises. There are no large enterprises in the Argyll and Bute Council area46. According to data presented at Figure A-6 the Argyll and Bute Council area had 3,680 enterprises in 2014 of which the majority were micro-enterprises (3,295) whilst 350 were small and 35 were medium enterprises. Looking at the chart an increase in small and medium enterprises is evident since 2012 (of around 7%) whilst the level of micro enterprises has shrunk since 2012 with a small rise starting in 2014.
45 This proportion of people defined as employment deprived is a combined count of claimants on the following benefits: working Age Unemployment Claimant Count averaged over 12 months; Working Age Incapacity Benefit claimants, or Employment and Support Allowance recipients; and Working Age Severe Disablement Allowance claimants. Each person is only counted once.
46 Micro-enterprises occupy staff between 0 to 9, small enterprises occupy staff between 10 to 49, medium enterprises occupy staff between 50 to 249 and large enterprises have a workforce exceeding 250 people.
9 10
11 12 12
13
8 7
5
12 12 11
9 8 8
7 7 7
0
2
4
6
8
10
12
14
2009 2010 2011
Perc
enta
ge e
mpl
oym
ent d
epriv
ed, %
Gigha (S01000721)
Islay Port Ellen(S01000722)
Islay South(S01000723)
Islay Bowmore (S01000724)
Islay West (S01000726)
Colonsay, Jura, Islay North(S01000755)

Road Equivalent Tariff Pilot Extension to Islay, Colonsay & Gigha Evaluation Report TRANSPORT SCOTLAND
51
Figure A-6: Micro-, small- and medium enterprises in Argyll and Bute Council
Source: NOMIS Tourism data Findings form the primary research undertaken for this study suggest that tourism plays a central role in the island communities with the number of visitors increasing each year. This section provides an insight into the accommodation categories as listed by Visit Scotland at summer 2015. Accommodation profile As table A-2 sets out Islay has the largest variety of accommodation options for visitors with 41 B&Bs, 58 self-catering spaces and 8 hotels. Colonsay mainly provides self-catering accommodation and has two B&Bs, one hotel and one hostel. Gigha and Jura offer fewer accommodation alternatives with more options for self-catering and B&Bs. It is important to highlight that only Islay and Gigha offer the opportunity for camping with two and one caravan and camping parks respectively. Table A-2: Visit Scotland Listed Accommodation
Accommodation as listed by Visit Scotland (Summer 2015) Islay Colonsay Gigha Jura B&B/Guesthouse 41 2 2 3 Hotel 8 1 1 1 Hostel 1 1 0 0 Self-Catering 58 36 5 16 Caravan Parks and Camping 2 0 1 0 Inns and Restaurants with Rooms 2 0 0 1 Total 112 40 9 21

Road Equivalent Tariff Pilot Extension to Islay, Colonsay & Gigha Evaluation Report TRANSPORT SCOTLAND
52
Annual events Table A-3 below provides an overview of annual events in Islay, Colonsay, Gigha and Jura. Some of these events are particularly popular and may increase the number of visitors to the islands over specific periods. Considering the proximity of the islands in the pilot area many tourists combine their visit to events with round trips, e.g. the whisky festival in Jura and the Islay Festival of Malt and Music both taking place in May. Table A-3: Annual Events on Islay, Colonsay, Gigha and Jura
Event Frequency Month Islay Feis Ile – Islay Festival of Malt and Music Annual May Islay Beach Rugby Tournament Annual June Islay Country Dancing Weekend Annual May Cantilena Festival Annual July Islay Book Festival Annual September Islay Festival of the Sea Annual August Walk Islay Annual April Ride of the Falling Rain Annual August Islay Half Marathon Annual August Islay Jazz Festival Annual September Islay Tope Fishing Festival Annual September Colonsay Ceòl Cholasa - Colonsay Folk Festival Annual September Colonsay Book Festival Annual April Festival of Spring Annual April-May Colonsay Rugby Festival Annual July Gigha Gigha Music Festival Annual June Jura Isle of Jura Fell Race Annual May Whisky Festival Annual May Isle of Jura Musical Festival Annual September Whisky tourism Islay with eight whisky distilleries has been characterised as the greatest of whisky-producing islands. Jura also has one of the biggest whisky distilleries in Scotland. Whisky accounts for 80% of Scottish food and drink exports and generates £3.3 billion directly to the UK economy. An important aspect of whisky production is how popular it has become among tourists both British and International. Visiting a whisky distillery is now one of the top twenty activities a visitor in Scotland will do according to the ‘Scotland Visitor Survey 2011 & 2012’. Of the survey participants 20% reported that they visited a whisky distillery on their visit to Scotland. According to Visit Scotland figures47 there was 1.1 million visits 47 http://www.visitscotland.org/pdf/Whisky%20Tourism%20%20Facts%20and%20Insights.pdf

Road Equivalent Tariff Pilot Extension to Islay, Colonsay & Gigha Evaluation Report TRANSPORT SCOTLAND
53
recorded to distilleries in Scotland during 2013, suggesting a 10.5% increase on 2012 figures. Figures from the Visitor Attractions Barometer48 indicate that distilleries, breweries, and wineries also generate the highest average spend per trip by visitors at £12.60, significantly higher than other visitor attraction types. Whisky tourism is growing significantly on Islay and Jura, with Ardbeg distillery on Port Ellen ranked within the top 20 distilleries by number of visits in Scotland for 2012-2013. Between 2012 and 2013 visits to the distillery increased by 22% from 8,619 to 10,500. Housing market data This section looks at the housing market in the pilot area and examines whether it has changed since the introduction of RET fares on Islay, Colonsay and Gigha. Statistics on second home ownership in the pilot area are also discussed. Residential property values To assess whether cheaper ferry fares have brought about an increase in residential property values we look into the average house prices in the pilot area between 2012 and 2014 as provided on the Right Move webpage. As RET was introduced in late October 2012 the average house prices in 2012 at table A-4 below can be interpreted as pre-RET residential values whilst the average house prices in 2013 and 2014 account for the RET pilot period. According to Right Move, average house prices on Gigha and Jura increased significantly by 86% and 84% respectively within the RET pilot period whilst average house prices on Colonsay and Islay decreased by 18% and 0.5% respectively. • Colonsay had the highest average house price in 2012 (£216,000) in the pilot area
whilst Gigha had the highest average house price in 2014. The average house price on Gigha was at £193,333 in 2012 rising to £360,000 in 2014.
• Looking at the main settlements of Islay, Port Charlotte had the highest average house price in the pilot period of RET. Whilst the average house price on Port Charlotte (£209,000) was significantly higher than Bowmore (£139,250) in 2012, in 2014 Port Charlotte had an average house price of £148,929, very similar to the average house price in Bowmore of £147,140. In effect, between 2012 and 2014 average house price fell by 29% on Port Charlotte whilst it rose by 6% in Bowmore.
• In 2014, average house prices on Colonsay, Gigha and Jura were in excess of the average for Islay’s main settlements.
• Whilst average house prices of the main settlements on Islay are well below the average of Argyll and Bute Council (£153,236 in 2013), the average house prices for Colonsay, Gigha and Jura are in excess of those for Argyll and Bute.
48 http://www.moffatcentre.com/whatwedo/ourprojects/visitorattractionmonitorandbarometer/
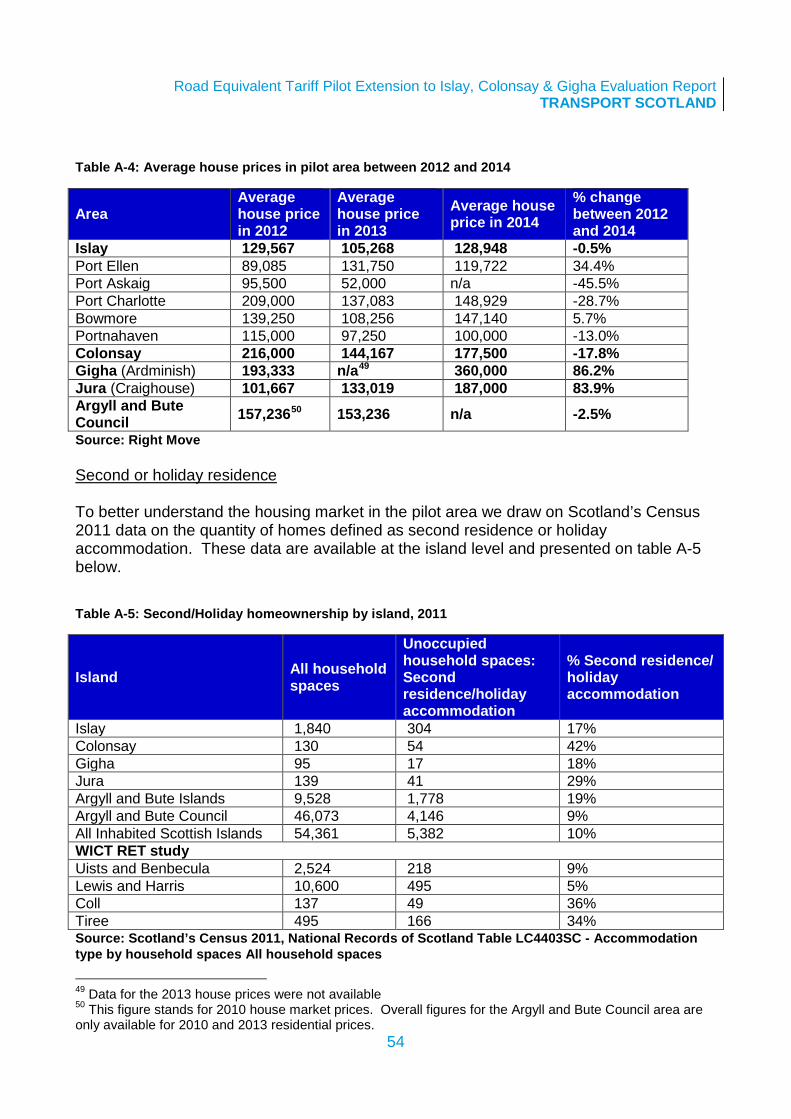
Road Equivalent Tariff Pilot Extension to Islay, Colonsay & Gigha Evaluation Report TRANSPORT SCOTLAND
54
Table A-4: Average house prices in pilot area between 2012 and 2014
Area Average house price in 2012
Average house price in 2013
Average house price in 2014
% change between 2012 and 2014
Islay 129,567 105,268 128,948 -0.5% Port Ellen 89,085 131,750 119,722 34.4% Port Askaig 95,500 52,000 n/a -45.5% Port Charlotte 209,000 137,083 148,929 -28.7% Bowmore 139,250 108,256 147,140 5.7% Portnahaven 115,000 97,250 100,000 -13.0% Colonsay 216,000 144,167 177,500 -17.8% Gigha (Ardminish) 193,333 n/a49 360,000 86.2% Jura (Craighouse) 101,667 133,019 187,000 83.9% Argyll and Bute Council 157,23650 153,236 n/a -2.5% Source: Right Move Second or holiday residence To better understand the housing market in the pilot area we draw on Scotland’s Census 2011 data on the quantity of homes defined as second residence or holiday accommodation. These data are available at the island level and presented on table A-5 below.
Table A-5: Second/Holiday homeownership by island, 2011
Island All household spaces
Unoccupied household spaces: Second residence/holiday accommodation
% Second residence/ holiday accommodation
Islay 1,840 304 17% Colonsay 130 54 42% Gigha 95 17 18% Jura 139 41 29% Argyll and Bute Islands 9,528 1,778 19% Argyll and Bute Council 46,073 4,146 9% All Inhabited Scottish Islands 54,361 5,382 10% WICT RET study Uists and Benbecula 2,524 218 9% Lewis and Harris 10,600 495 5% Coll 137 49 36% Tiree 495 166 34% Source: Scotland’s Census 2011, National Records of Scotland Table LC4403SC - Accommodation type by household spaces All household spaces
49 Data for the 2013 house prices were not available 50 This figure stands for 2010 house market prices. Overall figures for the Argyll and Bute Council area are only available for 2010 and 2013 residential prices.

Road Equivalent Tariff Pilot Extension to Islay, Colonsay & Gigha Evaluation Report TRANSPORT SCOTLAND
55
Of the four islands in the pilot area, Colonsay has the greatest proportion of second /holiday home ownership (42%). Jura follows with 29% whilst for Islay and Gigha the proportions are 17% and 18% respectively. Islay as the largest island in the pilot area has the most second/holiday homes in absolute terms (304). Data are also presented for the Argyll and Bute Islands, the Argyll and Bute Council area and all inhabited islands in Scotland. The proportion of second/holiday accommodation on the Argyll and Bute islands is 19%, a figure similar to the one for Gigha and Islay. The proportion of second/holiday homes in all islands of the pilot is well above the proportion of all inhabited islands across Scotland (10%). The share of second/holiday residence in the pilot area is well above the equivalent figure, when comparing with the Uists, Benbecula, Lewis and Harris of the first RET study (9% and 5% respectively). However, Coll and Tiree appear to have a high proportion of second/holiday homes (36% and 34%) comparable to the figures for Colonsay and Jura. Overall, the islands with low levels of population and household spaces appear to have a greater share of second/holiday accommodation than the islands with large populations and more household spaces.

transportscotland.gov.uk
Transport Scotland Buchanan House, 58 Port Dundas Road, Glasgow, G4 0HF0141 272 [email protected]
transport.gov.scot
© Crown copyright 2016
You may re-use this information (excluding logos and images) free of charge in any format or medium, under the terms of the Open Government Licence. To view this licence, visit http://www.nationalarchives.gov.uk/doc/open-government-licence or e-mail: [email protected] we have identified any third party copyright information you will need to obtain permission from the copyright holders concerned.
Further copies of this document are available, on request, in audio and visual formats and in community languages. Any enquiries regarding this document / publication should be sent to us at [email protected]
This document is also available on the Transport Scotland website: www.transport.gov.scotPublished by Transport Scotland, February 2016
Follow us:
@transcotlandtranscotland
An agency ofBuidheann le