robotics and automation in the food industry || intelligent quality control systems in food...
TRANSCRIPT

© Woodhead Publishing Limited, 2013
9
Intelligent quality control systems in food processing based on fuzzy logic N. Perrot and C. Baudrit , INRA, France
DOI: 10.1533/9780857095763.1.200
Abstract : In the food industry, end-products must achieve a compromise between several properties, including sensory (texture or color for example), sanitary, and technological properties (dimensions of a biscuit or mass loss of a cheese for example). Managing these properties right from the fabrication stage with the aim of controlling them is no easy task. At present, many production processes are largely reliant on the skill and experience of the operator, something that no system will be capable of replacing in the foreseeable future. The upshot is that the quality of a food product cannot be described exclusively through strict transitions between the crisp qualifiers ‘good’ or ‘bad’, but instead requires an infinite series of potentially vague grades to be properly defined and, ultimately, controlled. This chapter outlines the key functions of fuzzy sets and proposes possibility theories to integrate skill and experience for control purposes within the food industry.
Key words : fuzzy logic, possibility theory, uncertainty, food control systems, expert knowledge.
9.1 Introduction In the food industry, end-products must achieve a compromise between several properties, including sensory, sanitary, and technological properties. Sensory and sanitary properties are essential as they influence consumer choice and prefer-ence. However, managing these properties right from the fabrication stage for subsequent control is no easy task, for several reasons (see Mittal, 1997 ):
1. The food industry works within many parameters that must be taken into account in parallel. A single sensory property, such as color or texture, can be linked individually to several dimensions registered by the human brain. For example the color of a biscuit evaluated on line by operators using their senses is the synthesis of three instrumental measurements represented as L , a , b .
Cop
yrig
hted
Mat
eria
l dow
nloa
ded
from
Woo
dhea
d Pu
blis
hing
Onl
ine
D
eliv
ered
by
http
://w
ww
.woo
dhea
dpub
lishi
ngon
line.
com
U
nive
rsity
of
Sask
atch
ewan
(12
9-24
-192
)
Tue
sday
, Mar
ch 1
2, 2
013
3:46
:27
PM
IP A
ddre
ss: 1
28.2
33.2
10.9
7

Intelligent quality control systems based on fuzzy logic 201
© Woodhead Publishing Limited, 2013
2. The food industry works with non-uniform variable raw materials that, when processed, need to lead to a product that satisfies a fixed standard.
3. The phenomena involved in food processing are highly non-linear, and vari-ables are coupled. For example, the texture evolution of a milk gel, such as cream cheese during processing, is a non-linear and indirect result of the struc-ture evolution of the gel at a nanoscopic scale.
4. The food industry operates with a diverse set of products and processes and has requirements in terms of the portability and adaptability of the systems developed.
5. Little data is available in traditional manufacturing plants producing, for exam-ple, sausage or cheese, and this situation is mirrored throughout the food indus-try. Furthermore, even when databases do exist, it is not always possible to use them for controlling food product quality.
In this context, despite the fact that the design of standards and reliable pro-cedures for controlling product quality is a major objective for the food industry, automation is limited:
Few sensors are available to carry out the measurements needed like sensory tex-• ture or odor. Although new sensors such as artificial noses have been developed (Ruan and Zeng, 2004 ), the road is long, difficult, and unfeasible for SMEs. For several processes, it is difficult to establish models that are sufficiently • representative of the phenomena involved, even for control purposes. Classical automated approaches remain limited, for the reasons mentioned above. •
At present, many production processes are largely reliant on the skill and expe-rience of the operator, something that no system will be capable of replacing in the foreseeable future (Perrot et al ., 2006 ). Consequently, in practice, operators often play an important role and cooperate with automation so as to: (1) make on-line evaluations of the sensory properties of the product, and/or (2) adjust the on-line process accordingly. Moreover, experienced operators make macroscopic inter-pretations of physicochemical phenomena occurring during processing, which can act in synergy with classical engineering knowledge on the process.
Integrating operator and expert skill in a control framework is a relevant direc-tion, especially for traditional processes. Nevertheless, it leads to designing math-ematical tools that have to integrate: (1) reasoning based on the use of linguistic symbols such as ‘over-coated,’ ‘good color,’ etc., which are expressed not on a numerical scale but on a discontinuous graduated scale referring to an evalua-tion of a deviation in comparison to a setpoint; (2) uncertainty on these symbols, which is translated after fusion in a specific action; and (3) an action that is the result of an implicit or explicit interpolation between two specific states recorded by the operator over time.
Decisions related to the management of food processes increasingly rely on math-ematical models that (1) represent the available state-of-the-art knowledge about the phenomena involved, and (2) are able to simulate the different transient and
Cop
yrig
hted
Mat
eria
l dow
nloa
ded
from
Woo
dhea
d Pu
blis
hing
Onl
ine
D
eliv
ered
by
http
://w
ww
.woo
dhea
dpub
lishi
ngon
line.
com
U
nive
rsity
of
Sask
atch
ewan
(12
9-24
-192
)
Tue
sday
, Mar
ch 1
2, 2
013
3:46
:27
PM
IP A
ddre
ss: 1
28.2
33.2
10.9
7

© Woodhead Publishing Limited, 2013
202 Robotics and automation in the food industry
equilibrium states over time. However, due to time limits, financial constraints, and scientific and technological obstacles, information for model parameters is often incomplete and imprecise. This leads to uncertainty, which needs to be accounted for in the decision-making process. Integrating the uncertainties inherent to real levels of knowledge available on the food processes is a crucial step in the devel-opment of process representation models. Given that experts have to contend with a lack of useful data for building such models, they may sometimes opt to make their own estimates of poorly-known quantities given in confidence interval format by applying their own experience and intuition. Available knowledge about food processing may display (1) randomness (also known as ‘stochastic uncertainty’) due to the natural variability of observations, or (2) imprecision (also known as ‘epistemic uncertainty’) due to a lack of information (Ferson and Ginzburg, 1996). Randomness and imprecision may coexist, especially in a background of several heterogeneous knowledge sources, such as statistical data and expert opinions. As a rule, partial ignorance is represented by a uniform distribution based on what is known as the ‘indifference principle’ (all that is equally possible is equally prob-able). This choice, even though guided by principles, remains highly debatable, since the analyst is bringing further information (equiprobability) to knowledge that was not sourced from experts or data and does not, therefore, present any cognitive value. In practice, the choice is dictated by the fact that the only viable option is a classical probabilistic model such as uniform, normal, Beta or log-normal prob-ability distributions for example, which can be argued (Walley, 1991 ) incapable of accounting for epistemological uncertainty and imprecision in general. While information regarding variability is best conveyed using probability distributions, information tied to imprecision may be more accurately conveyed using families of probability distributions encoded by possibility distributions (also known as ‘fuzzy intervals,’ see Section 9.2.2 , second subheading, for details) (Dubois et al ., 2000).
Fuzzy sets and possibility theories were introduced by Zadeh in 1965 and fur-ther in 1978 as an extension of the set theory by replacing the characteristic func-tion of a set by a membership function whose values range from 0 to 1 (Zadeh, 1965 , 1978). Possibility theory equips fuzzy sets with the full settings required for a sound comparison with probability, and is relevant for representing consonant imprecise knowledge, such as confidence intervals given by experts pertaining to ill-known quantities. A possibility distribution can model imprecise information regarding a fixed unknown parameter, but can also serve as an approximate rep-resentation of incomplete observations of a random variable. The core concept is the possibility distribution describing the more or less plausible values of some uncertain variable. Possibility theory is now a wide field of study that, over the last 20 years, has seen the development of a range of tools. Applied to food engi-neering, it has been considered as pertinent by several authors for different appli-cations (see Perrot et al ., 2006 ), especially for taking into account the reasoning process, expressed in linguistic terms, of operators and experts where its focuses include: (1) representation of the descriptive sensory evaluation performed by a quality team, an operator, or a consumer; (2) indirect measurement of the proper-ties of a food product, such as the modeling of the expert sensory sausage quality
Cop
yrig
hted
Mat
eria
l dow
nloa
ded
from
Woo
dhea
d Pu
blis
hing
Onl
ine
D
eliv
ered
by
http
://w
ww
.woo
dhea
dpub
lishi
ngon
line.
com
U
nive
rsity
of
Sask
atch
ewan
(12
9-24
-192
)
Tue
sday
, Mar
ch 1
2, 2
013
3:46
:27
PM
IP A
ddre
ss: 1
28.2
33.2
10.9
7

Intelligent quality control systems based on fuzzy logic 203
© Woodhead Publishing Limited, 2013
evaluation; (3) diagnosis, supervision, and control of food quality, such as the control of processes, for example roasting peanuts, the building of decision-sup-port systems in browning processes, or cheese ripening processes. Examples will be described in this chapter.
9.2 Principles of intelligent control systems using fuzzy logic
Although Boolean logic found widespread applications in the twentieth century (from binary logic to logic integrated circuits), it remains underequipped to model or employ human reasoning in situations of uncertainty or imprecision, since it only deals in binary information that cannot translate the symbol language or the complexity of our perceptions (Dubois et al ., 1980 ). Mathematical tools, such as fuzzy logic and possibility theory, appear better adapted to dealing with or employing human reasoning, alongside other candidate approaches such as qual-itative physics (Price et al ., 2006 ).
In traditional logic, the ‘universe of discourse’ ( U ) is formed of elements ( u ) characterized by total membership (characteristic function: μ E ( u ), equal to 1) or total exclusion (characteristic function: μ E ( u ), equal to 0) of a given set E . This leads to strict between-set transitions imposing a framework that can prove too brittle to capture the complexity of different event processes (Dubois et al ., 1999 ). The upshot is that the quality of a food product cannot be described exclusively through strict transitions between the crisp qualifiers ‘good’ or ‘bad’, but instead requires an infinite series of potentially vague grades to be properly defined and, ultimately, controlled. Fuzzy logic theory and possibility theory take a different stance grounded in progressive continuous between-set transitions. The member-ship function in fuzzy logic is a good illustration of these transitions, as it extends to the conventional characteristic function. Any element u found in the universe of discourse U can be characterized by its degree of membership of a set E ( μ E ( u )), valued in the real continuous interval [0,1]. A fuzzy set E in the universe of dis-course U can be defined by:
E
UE : →Uμ{ }u Eu( )u, Eu,μ ( )uu
[ ] [9.1]
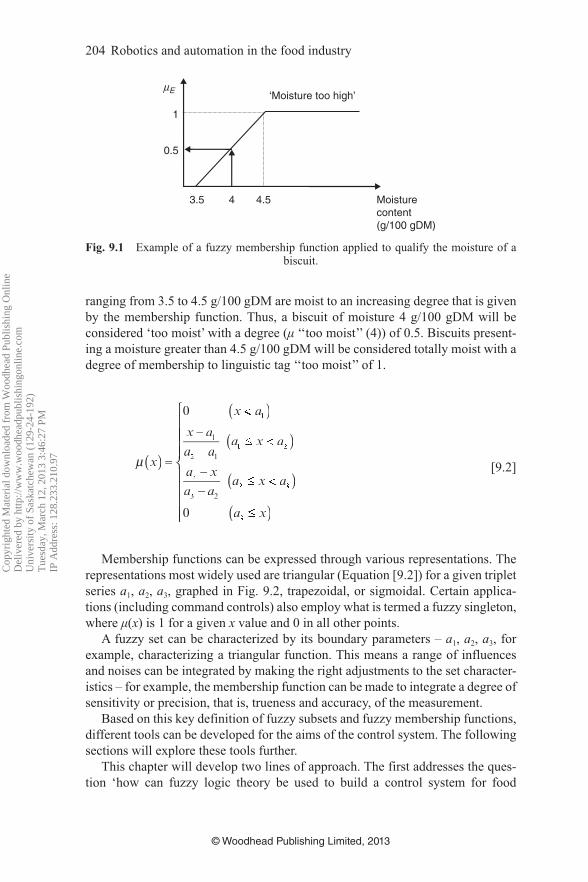
μ E is thus the membership function of set E . It represents the set of membership degrees ( μ E ( u )) of a variable u mapped to fuzzy set E . To illustrate, a membership function can be used to describe the relationship between the numerical variable moistness and the linguistic tag employed by an operator for a biscuit that is ‘too moist’ ( Fig. 9.1 ).
In practice, biscuits of measured moistness (×) lower than 3.5 g/100 g of dry matter (gDM) are not considered moist, whereas biscuits with a moisture content
Cop
yrig
hted
Mat
eria
l dow
nloa
ded
from
Woo
dhea
d Pu
blis
hing
Onl
ine
D
eliv
ered
by
http
://w
ww
.woo
dhea
dpub
lishi
ngon
line.
com
U
nive
rsity
of
Sask
atch
ewan
(12
9-24
-192
)
Tue
sday
, Mar
ch 1
2, 2
013
3:46
:27
PM
IP A
ddre
ss: 1
28.2
33.2
10.9
7
© Woodhead Publishing Limited, 2013
204 Robotics and automation in the food industry
ranging from 3.5 to 4.5 g/100 gDM are moist to an increasing degree that is given by the membership function. Thus, a biscuit of moisture 4 g/100 gDM will be considered ‘too moist’ with a degree ( μ ‘‘too moist’’ (4)) of 0.5. Biscuits present-ing a moisture greater than 4.5 g/100 gDM will be considered totally moist with a degree of membership to linguistic tag ‘‘too moist’’ of 1.
μ
x a
a a
a x
a a
( )x
( )x a
( )a a
( )a a
( )a x
⎧
⎨
⎪⎧⎧
=x
x
0
0
1
2 1ax ax
3
3 2ax ax
⎪⎪⎪⎪⎪⎪
⎪⎪⎪⎪⎪⎪⎨⎨⎪⎪
⎩
⎪⎨⎨
⎪⎪⎪
⎪⎪⎪
⎪⎩⎩⎪⎪
[9.2]
Membership functions can be expressed through various representations. The representations most widely used are triangular (Equation [9.2]) for a given triplet series a 1 , a 2 , a 3 , graphed in Fig. 9.2 , trapezoidal, or sigmoidal. Certain applica-tions (including command controls) also employ what is termed a fuzzy singleton, where μ ( x ) is 1 for a given x value and 0 in all other points.
A fuzzy set can be characterized by its boundary parameters – a 1 , a 2 , a 3 , for example, characterizing a triangular function. This means a range of influences and noises can be integrated by making the right adjustments to the set character-istics – for example, the membership function can be made to integrate a degree of sensitivity or precision, that is, trueness and accuracy, of the measurement.
Based on this key definition of fuzzy subsets and fuzzy membership functions, different tools can be developed for the aims of the control system. The following sections will explore these tools further.
This chapter will develop two lines of approach. The first addresses the ques-tion ‘how can fuzzy logic theory be used to build a control system for food
1
μE
Moisture content (g/100 gDM)
‘Moisture too high’
3.5 4 4.5
0.5
Fig. 9.1 Example of a fuzzy membership function applied to qualify the moisture of a biscuit.
Cop
yrig
hted
Mat
eria
l dow
nloa
ded
from
Woo
dhea
d Pu
blis
hing
Onl
ine
D
eliv
ered
by
http
://w
ww
.woo
dhea
dpub
lishi
ngon
line.
com
U
nive
rsity
of
Sask
atch
ewan
(12
9-24
-192
)
Tue
sday
, Mar
ch 1
2, 2
013
3:46
:27
PM
IP A
ddre
ss: 1
28.2
33.2
10.9
7

Intelligent quality control systems based on fuzzy logic 205
© Woodhead Publishing Limited, 2013
engineering?’ while the second addresses the question ‘how can probability and possibility theory be used to represent and jointly propagate uncertainties rela-tive to the knowledge about the processes managed?’ The aim is to estimate the uncertainty in model results and highlight that a joint treatment of uncertainties can be useful for controlling the process, even with few instruments and/or little information available.
9.2.1 Building a control system using fuzzy logic Different steps are necessary in order to build an intelligent control system using fuzzy logic ( Fig. 9.3 ). A first level, dubbed ‘ adapted systemic analysis ’ is a key issue in fuzzy intelligent control systems. It is a knowledge extraction step, car-ried out based on a systemic analysis of the strategies implemented by experts to resolve a process control problem. A second level, dubbed mathematical knowl-edge formalization ,’ represents the mathematical formalization of the human knowledge handled in the first step. The result reached is an algorithm that mim-ics the expert tackling a process, that is, a numeric model of the expert strategies for solving control problems. It is built according to the goal of the study: indirect measurement, state diagnosis, or process control. The strategies employed are highly dependent on whether the process type involved is a batch process or a continuous process. Knowledge is then organized in space or in time. The third and last level, dubbed ‘‘ validation tools ,’’ represents selected ways of validating these approaches and processing symbolic data.
Adapted systemic analysis (level 1) The aim is to define the limits of the system to be represented and the hypoth-esis, to define and formalize in a unified way the variables of interest and the type of interactions between the process studied and the variables manipulated, and to identify and formalize in a unified way the strategies experts employ to solve the control problem. It integrates the non-linear and coupled links in certain fixed organized clusters. Figure 9.4 depicts the methodology for handling expert knowledge. After interviewing the selected experts (as a rule, there will not be too many), a first step is the formalization of the measurements and the associated
1
a1 a2 a3 x
μ
Fig. 9.2 Parametric representation of a membership function.
Cop
yrig
hted
Mat
eria
l dow
nloa
ded
from
Woo
dhea
d Pu
blis
hing
Onl
ine
D
eliv
ered
by
http
://w
ww
.woo
dhea
dpub
lishi
ngon
line.
com
U
nive
rsity
of
Sask
atch
ewan
(12
9-24
-192
)
Tue
sday
, Mar
ch 1
2, 2
013
3:46
:27
PM
IP A
ddre
ss: 1
28.2
33.2
10.9
7

© Woodhead Publishing Limited, 2013
206 Robotics and automation in the food industry
measurement granularity. If it is validated, then the second step, formalizing and structuring the clusters experts have in mind is carried out, and should explain the non-linear links between the inputs and outputs.
A case study
Adapted systemic analysis
Indirectmeasurement
Control ordecision help
State diagnosis
Explicitexpertise
Implicit ondata basis
Batchprocess
Continuousprocess
Algorithm Algorithm Algorithm
Ready to use tool
Mathematical knowledge formalization
Qualitative with the experts
Quantitative on a data basis
Validation at line
Validation tools
Level 1
Level 2
Level 3
Fig. 9.3 Steps to build a control system using fuzzy logic.
Interviews of the selected experts
Validation of themeasurements
ConfrontationIf several experts,
are theyin accordance?
Formalization of themeasurements
No
Yes
No
YesOral validation
No
Yes
First symbolicalgorithm
Formalization andstructuring of the links
Fig. 9.4 Methodology for expert knowledge handling.
Cop
yrig
hted
Mat
eria
l dow
nloa
ded
from
Woo
dhea
d Pu
blis
hing
Onl
ine
D
eliv
ered
by
http
://w
ww
.woo
dhea
dpub
lishi
ngon
line.
com
U
nive
rsity
of
Sask
atch
ewan
(12
9-24
-192
)
Tue
sday
, Mar
ch 1
2, 2
013
3:46
:27
PM
IP A
ddre
ss: 1
28.2
33.2
10.9
7
Intelligent quality control systems based on fuzzy logic 207
© Woodhead Publishing Limited, 2013
The groundwork to this step involves defining and choosing experts. The experts chosen will largely shape (1) the results obtained, (2) the proportion of empiricism versus knowledge injected in the models, and (3) the generalizability of the models built, whose properties are themselves tied to ‘(2)’. Although exper-tise has been extensively analyzed in psychology and in artificial intelligence, there is still no operational and universally-accepted definition of expertise per se (Shanteau, 1992 ). In this study, experts were chosen on the basis of consistent practice, high performance levels and peer recognition.
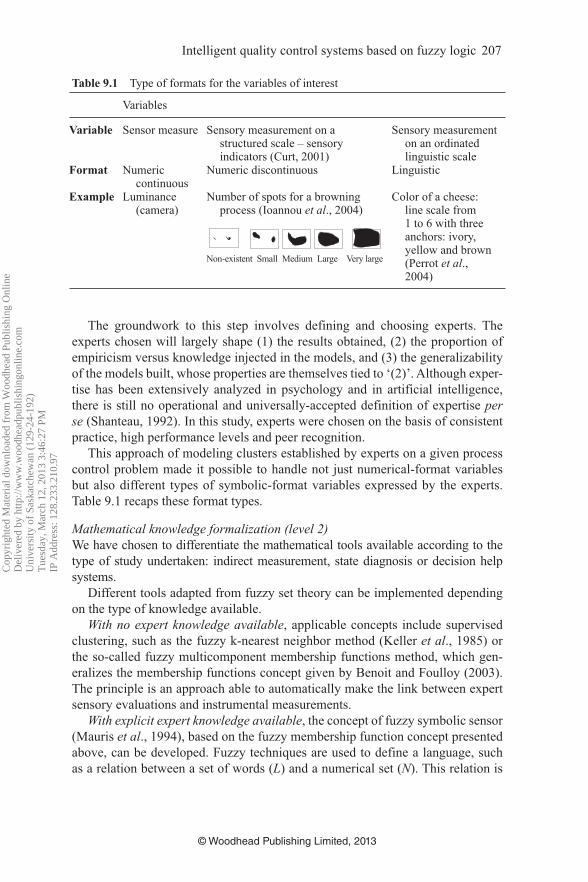
This approach of modeling clusters established by experts on a given process control problem made it possible to handle not just numerical-format variables but also different types of symbolic-format variables expressed by the experts. Table 9.1 recaps these format types.
Mathematical knowledge formalization (level 2) We have chosen to differentiate the mathematical tools available according to the type of study undertaken: indirect measurement, state diagnosis or decision help systems.
Different tools adapted from fuzzy set theory can be implemented depending on the type of knowledge available.
With no expert knowledge available , applicable concepts include supervised clustering, such as the fuzzy k-nearest neighbor method (Keller et al ., 1985 ) or the so-called fuzzy multicomponent membership functions method, which gen-eralizes the membership functions concept given by Benoit and Foulloy ( 2003 ). The principle is an approach able to automatically make the link between expert sensory evaluations and instrumental measurements.
With explicit expert knowledge available , the concept of fuzzy symbolic sensor (Mauris et al ., 1994 ), based on the fuzzy membership function concept presented above, can be developed. Fuzzy techniques are used to define a language, such as a relation between a set of words ( L ) and a numerical set ( N ). This relation is
Table 9.1 Type of formats for the variables of interest
Variables
Variable Sensor measure Sensory measurement on a structured scale – sensory indicators (Curt, 2001)
Sensory measurement on an ordinated linguistic scale
Format Numeric continuous
Numeric discontinuous Linguistic
Example Luminance (camera)
Number of spots for a browning process (Ioannou et al ., 2004 )
Non-existent Small Medium Large Very large
Color of a cheese: line scale from 1 to 6 with three anchors: ivory, yellow and brown (Perrot et al ., 2004 )
Cop
yrig
hted
Mat
eria
l dow
nloa
ded
from
Woo
dhea
d Pu
blis
hing
Onl
ine
D
eliv
ered
by
http
://w
ww
.woo
dhea
dpub
lishi
ngon
line.
com
U
nive
rsity
of
Sask
atch
ewan
(12
9-24
-192
)
Tue
sday
, Mar
ch 1
2, 2
013
3:46
:27
PM
IP A
ddre
ss: 1
28.2
33.2
10.9
7

© Woodhead Publishing Limited, 2013
208 Robotics and automation in the food industry
characterized by a membership function, µ RF, which represents the degree or the strength of the link between symbols and numbers. This fuzzy relation can be described by two projections that take their values from the set of fuzzy numeri-cal subsets F ( N ) and from the set of the fuzzy symbolic subsets F ( L ): Meanings and Descriptions.
Fuzzy meaning represents the symbols employed by operators in word format. To illustrate, fuzzy meaning can be used, after analysis of expert handling, to represent a projection in numeric space of the symbolic way operators qualify a cheese in terms of product moisture content: ‘low, middle, high’ ( Fig. 9.5 ). It means for example, that between 0 and 1.5 g/100 gDM we are sure that the prod-uct is low in term of expert evaluation. Between 1.5 and 2.5 g/100 gDM, the product is between low and middle with a given linear law.
Fuzzy description is a simple way of describing a measurement with words. For example, in Fig. 9.5 a moisture content of 4 g/100 gDM can be described as µ D(4) (‘dry’) = 0; µ D(4) (‘normal’) = 0.5; µ D(4) (‘moist’) = 0.5. We can also notate the concept as D(4) = 0/dry + 0.5/normal + 0.5/moist.
To complete this tool, it is necessary to build approaches able to aggregate several symbols together. This is the case in a control framework where decisions for actions are based on a diagnosis of the combined deviations of the different dimensions of product quality and the state of the process. For example, the at-line operator needs four main sensory characteristics to evaluate the trajectory of a cheese during ripening and to anticipate his control actions (Perrot et al ., 2004 ): color, coat, consistency, moisture content. The fuzzy function used for merging is created on the basis of an expert explanation of the logical links between sym-bols. This system, tested in the industry, was used to predict the quality evolution of the cheese production with a good accuracy and robustness by comparison to an expert evaluation (around 85% of similar answer). This system is used as a support decision system when the expert is not available. These between-symbol links incorporate the global aim of the merging. The inference is made by Zadeh’s compositional rule of inference (Zadeh, 1965 ), applied to the fuzzy symbolic descriptions of the inputs, as explained below.
Process control or decision-aid systems For process control or decision-aid system purposes, the output of the fuzzy con-troller should generally be a numerical output, the setpoint of a physical regulator.
1
Low Middle High1
0IS
3: H
umid
ity2 3 4 5 6
(g/100 gDM)
Fig. 9.5 Example of a fuzzy meaning describing the moisture content of a cheese.
Cop
yrig
hted
Mat
eria
l dow
nloa
ded
from
Woo
dhea
d Pu
blis
hing
Onl
ine
D
eliv
ered
by
http
://w
ww
.woo
dhea
dpub
lishi
ngon
line.
com
U
nive
rsity
of
Sask
atch
ewan
(12
9-24
-192
)
Tue
sday
, Mar
ch 1
2, 2
013
3:46
:27
PM
IP A
ddre
ss: 1
28.2
33.2
10.9
7

Intelligent quality control systems based on fuzzy logic 209
© Woodhead Publishing Limited, 2013
The most widely used fuzzy controller is a constant-type Takagi–Sugeno fuzzy controller (Takagi and Sugeno, 1985 ), where the output g i , j of each rule is assim-ilated to a constant (e.g. a temperature setpoint of a ripening chamber for a given rule). Numerical outputs are directly calculated using the result of Equation [9.3], membership grade µ ExF( A i , B j ) for each rule l annotate α l, and the associated con-stant output annotated P lk , for each rule 1 and each constant K.
D
Plk
l*
lkPPl
ll
=α
α∑∑
[9.3]
Validation tools (level 3) The third and last level is dedicated to validating the tools that could viably be used for the algorithms developed (see Fig. 9.3 ). A first step involves work-ing with experts to secure the qualitative validation. This first step requires an expert–observer feedback exchange to verify that the knowledge expressed by the expert matches the knowledge implemented in the algorithm. In this step, the only possible validation is qualitative. Quantitative validation has to be achieved on test points of a custom-compiled database. This quantitative val-idation is the minimum baseline validation required to be able to consider the tool as compatible with the objective targeted, which is either (1) to achieve an indirect measure or state diagnosis matching the operator’s responses, or (2) to achieve a level of process control that is at least as good as the operator’s and just as robust, reliable, and stable. In case (1), the cogency of the approach is checked based on test points that give the best possible representativity of the range of different system states. The model’s output is compared with the oper-ator’s response. The number of compatible responses (C) is given by Equation [9.4], where Rm is the model response corresponding to the input measure-ments logged in the validation database, Ro is the response of the corresponding expert operator, and d is incremented by 1 when D is less than or equal to the tolerance threshold (St). A percent compatibility value is produced by calculat-ing the ratio of number of compatible responses to number of products making up the validation database.
C d
d D
d D
i
n
i i
i
=1,2,3
if SDi ≤DiD t with RDiD = m R− o
if SDiD >DiD t
∑
[9.4]
A key variable in this step is the tolerance threshold. It is generally specified in tandem with the experts for sensory measurements (Ioannou et al ., 2002 ). In cases where the outputs are expressed in the form of linguistic values, the validation indicators are based on equations developed in Bouchon-Meunier et al . ( 1996 ).
Cop
yrig
hted
Mat
eria
l dow
nloa
ded
from
Woo
dhea
d Pu
blis
hing
Onl
ine
D
eliv
ered
by
http
://w
ww
.woo
dhea
dpub
lishi
ngon
line.
com
U
nive
rsity
of
Sask
atch
ewan
(12
9-24
-192
)
Tue
sday
, Mar
ch 1
2, 2
013
3:46
:27
PM
IP A
ddre
ss: 1
28.2
33.2
10.9
7

© Woodhead Publishing Limited, 2013
210 Robotics and automation in the food industry
If the model is validated based on recorded data, the validation phase contin-ues under real conditions; otherwise, the only solution is to go back to the model design drawing board: either the knowledge was badly formulated or the inter-viewer missed some important information. Every step in this phase will need to be repeated start-to-finish. For validation of a process control, the criteria used are the same as those employed under classic automated processing. Underpinning this step is the need to compile a salient database. This database needs to be as representative as possible of the full set of potential system states and the most common system disturbances. If the variables integrated in the database are assessed by experts, it is important to control the quality of these measurements. This can be achieved using methodologies adapted from standard NF X 07-001 to test the reproducibility and repeatability of human measurements expressed on a symbolic scale (numeric discontinuous or linguistic), thus generalizing earlier works led by Curt et al . ( 2004 ) on sensory indicators.
9.2.2 Representation and propagation of uncertain and imprecise knowledge
Let T be a mathematical model representing a phenomenon that occurs during food processing whose arguments are represented by the appropriate formalism (probability–possibility) according to the character of available knowledge (vari-ability, imprecision, incompleteness, etc.).
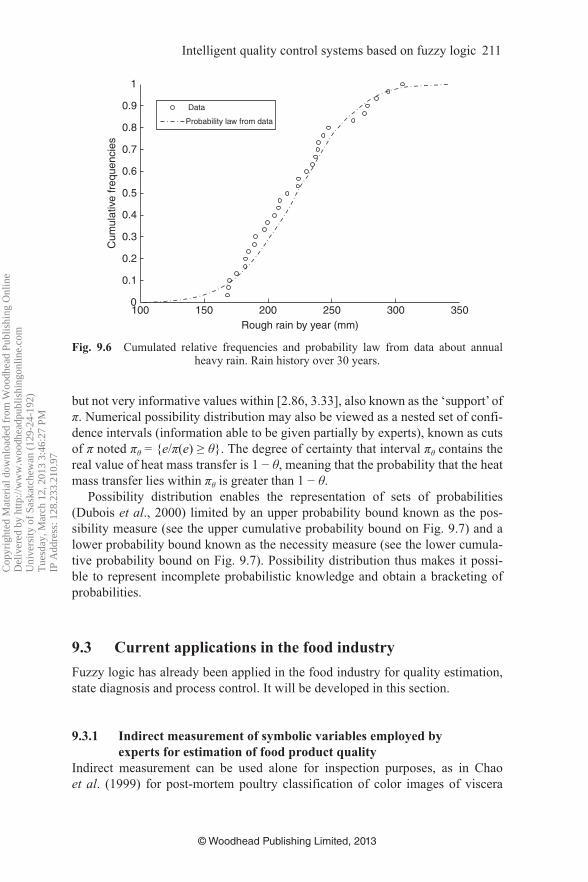
Knowledge representation by means of probability distributions Faced with substantial data, it may be possible to identify a probability distribu-tion describing the variability. For example, Fig. 9.6 shows the distribution of the cumulated relative frequencies of heavy rain (describing the probability that the real value of heavy rain is lower than a certain threshold) estimated from 30 years of data collected from a weather station. This distribution shows, for exam-ple, that there is 95% of chance that the heavy rain does not exceed 300 mm but exceeds 150 mm. In a risk assessment setting, the risk manager could use the probability law fitted from data (see the example in Fig. 9.6 showing the cumu-lative normal distribution with mean 222.2 mm and standard deviation 39.5 mm fitted from raw frequencies).
Probability distributions can be also used for theoretical reasons, or where there is a priori knowledge on the variability involved.
Knowledge representation by means of possibility distributions Faced with information along the lines of ‘I am sure that quantity x lies within an interval [ a , b ] but values located within the interval [ c , d ] (included inside [ a , b ]) are more likely,’ it is coherent to propose a trapezoidal possibility distribution (formally equivalent to a fuzzy interval – see Fig. 9.7 ). For example, the possibil-ity distribution π defined in Fig. 9.7 means that the most likely (risky but informa-tive) heat mass transfer values are located within the interval [3, 3.2] (referred to as the ‘core’ of π ) with no preference inside this interval. We find the conservative
Cop
yrig
hted
Mat
eria
l dow
nloa
ded
from
Woo
dhea
d Pu
blis
hing
Onl
ine
D
eliv
ered
by
http
://w
ww
.woo
dhea
dpub
lishi
ngon
line.
com
U
nive
rsity
of
Sask
atch
ewan
(12
9-24
-192
)
Tue
sday
, Mar
ch 1
2, 2
013
3:46
:27
PM
IP A
ddre
ss: 1
28.2
33.2
10.9
7
Intelligent quality control systems based on fuzzy logic 211
© Woodhead Publishing Limited, 2013
but not very informative values within [2.86, 3.33], also known as the ‘support’ of π . Numerical possibility distribution may also be viewed as a nested set of confi-dence intervals (information able to be given partially by experts), known as cuts of π noted π θ = { e / π ( e ) ≥ θ }. The degree of certainty that interval π θ contains the real value of heat mass transfer is 1 − θ , meaning that the probability that the heat mass transfer lies within π θ is greater than 1 − θ .
Possibility distribution enables the representation of sets of probabilities (Dubois et al ., 2000) limited by an upper probability bound known as the pos-sibility measure (see the upper cumulative probability bound on Fig. 9.7 ) and a lower probability bound known as the necessity measure (see the lower cumula-tive probability bound on Fig. 9.7 ). Possibility distribution thus makes it possi-ble to represent incomplete probabilistic knowledge and obtain a bracketing of probabilities.
9.3 Current applications in the food industry Fuzzy logic has already been applied in the food industry for quality estimation, state diagnosis and process control. It will be developed in this section.
9.3.1 Indirect measurement of symbolic variables employed by experts for estimation of food product quality
Indirect measurement can be used alone for inspection purposes, as in Chao et al . ( 1999 ) for post-mortem poultry classification of color images of viscera
1000
0.1
0.2
0.3
0.4
0.5
0.6
0.7
0.8
0.9
1
150 200Rough rain by year (mm)
Cum
ulat
ive
freq
uenc
ies
250 300 350
Data
Probability law from data
Fig. 9.6 Cumulated relative frequencies and probability law from data about annual heavy rain. Rain history over 30 years.
Cop
yrig
hted
Mat
eria
l dow
nloa
ded
from
Woo
dhea
d Pu
blis
hing
Onl
ine
D
eliv
ered
by
http
://w
ww
.woo
dhea
dpub
lishi
ngon
line.
com
U
nive
rsity
of
Sask
atch
ewan
(12
9-24
-192
)
Tue
sday
, Mar
ch 1
2, 2
013
3:46
:27
PM
IP A
ddre
ss: 1
28.2
33.2
10.9
7

© Woodhead Publishing Limited, 2013
212 Robotics and automation in the food industry
to distinguish air sacculitis livers from normal livers, or as in Nielsen and Paul ( 1997 ) for tomato quality grading. It can also be coupled with a controller or embedded in a decision-aid system to control food product quality, as in Perrot et al . ( 1996 ) to control the quality of biscuits in an industrial tunnel oven. The requirements in terms of measurement precision and reliability will therefore dif-fer. In both cases, it is most often a ‘feature level fusion’ as defined in Valet et al . ( 2000 ). The fusion is performed on specific features extracted from raw informa-tion that is generally provided by sensors such as cameras, electronic noses, NMR sensors, etc. For example Yea et al. ( 1994 ) used three commercial gas sensors to detect four kinds of fragrant smells with a discrimination rate of 99.2%. In the first step, fuzzy reasoning detects the fragrant smells, then in the second step, odor is discriminated by a neural network. De Silva et al . ( 1996 ) used PCA-extracted features from acoustic video images to determine the firmness of herring roe. A fuzzy decision-making system tested on 160 samples gave about 84% good discrimination. Sundic et al . ( 2000 ) used features extracted from an electronic tongue coupled with an electronic nose to mimic human sensory perception of potato chips and cream.
An illustration of such an approach based on the concepts presented in Section 9.2 is developed in the example below applied to the evaluation of the sensory properties of a crusting sausage. It is a sausage defect that appears under spe-cific conditions of drying. The defect of crusting is one of the two important defects that can appear on the product and should be avoided. The evaluation of this defect in the industry is made close to the manufacturing line (Mauris et al ., 2000 ). The degree of sausage crusting evaluated by the operators is then repro-duced using fuzzy meanings ( Section 9.2.1 ) based on adapted image processing
2.8 3
Heat transfer coefficient h (W.m–2.K–1)
Values considered certain
πθ: θ – cut of π
P(h∈πθ) ≥ 1– θ
Values considerednot possible
Cer
tain
ty
Values considerednot possible
3.2 3.4
1.0 0
0.2
0.4
0.6
0.8
1.0
0.8
0.6
0.4
Like
lihoo
d, θ
0.2
0
Values consideredmost likely
Possibilitydistribution π
Upper probabilitybound
Lower probabilitybound
Fig. 9.7 Example of a possibility distribution induced from a knowledge expert on a heat transfer coefficient used as a parameter in a cheese ripening model. (Source: Baudrit
et al. , 2009.)
Cop
yrig
hted
Mat
eria
l dow
nloa
ded
from
Woo
dhea
d Pu
blis
hing
Onl
ine
D
eliv
ered
by
http
://w
ww
.woo
dhea
dpub
lishi
ngon
line.
com
U
nive
rsity
of
Sask
atch
ewan
(12
9-24
-192
)
Tue
sday
, Mar
ch 1
2, 2
013
3:46
:27
PM
IP A
ddre
ss: 1
28.2
33.2
10.9
7

Intelligent quality control systems based on fuzzy logic 213
© Woodhead Publishing Limited, 2013
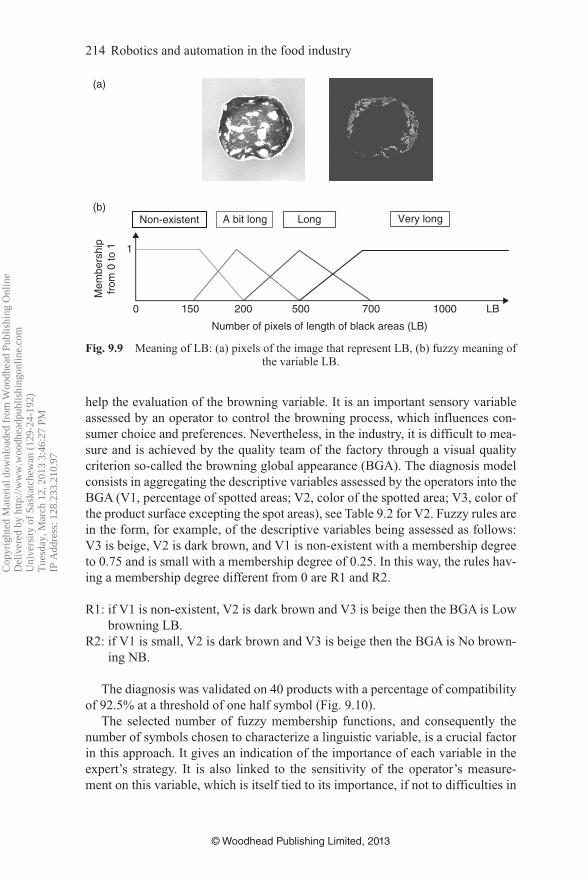
and explicit expert rules about crusting ( Fig. 9.8 ). Crusting is evaluated from the human visual perception of the color of the center of the slice, length of black areas (LB), and length of dark red areas (LD) on sausage slices. Figure 9.9 gives an example of fuzzy meaning for LB. Crusting classes are defined according to expert knowledge by a set of fuzzy symbolic rules linking the terms of black lengths and dark red lengths, and classes of crusting, together with expert rules such as ‘if LB is non-existent and LD is non-existent, crusting degree is non- existent, class 1.’ The approach was implemented with a very limited number of rules: 16 rules processed in this application. It takes 2 months to handle those rules. The result is symbolic information in the form of a degree of membership to crusting classes 1 to 4. The result for a threshold of tolerance (see Section 9.2.1 ) bounded in a first approximation by the value 0.5 is 88% for compatible answers tested on two databases. This system is useful as regards to the sau-sage crusting evaluation that is difficult to achieve for the operators. This tool is used as a decision-support system in the industry to help to achieve the right evaluations.
In applications where technical or economic reasons dictate that no sensors are available, the only inputs to the indirect measurement module are human opera-tors. In this case, the symbolic space employed by the operators to evaluate the product is used directly by the system, as in Ioannou et al . ( 2004 ) for overall browning appearance during a heating process. This application is representative of situations commonly encountered in the food industry, where it is important to propose mathematical approaches capable of directly coping with the sym-bolic data handled by the operators. The browning of food products is obtained through heating the product surface, which leads to biochemical reactions called Maillard reactions. In this application, we have developed a diagnosis model to
Each pixel isassociated with
a luminance
Threshold
Center colorin pixel
LB and LD inlinguistic term
Symbolicinformation
Crustingdegree
Aggregation
by fuzzy rules
Defuzzification
Meanings of LB and LD
SausageCamera Processing image
LB and LDin pixel
Center color inlinguistic term
Meaning of
center color
Threshold
Fig. 9.8 Evaluation of the crusting degree of a sausage using the fuzzy meaning concept and an adapted image analysis.
Cop
yrig
hted
Mat
eria
l dow
nloa
ded
from
Woo
dhea
d Pu
blis
hing
Onl
ine
D
eliv
ered
by
http
://w
ww
.woo
dhea
dpub
lishi
ngon
line.
com
U
nive
rsity
of
Sask
atch
ewan
(12
9-24
-192
)
Tue
sday
, Mar
ch 1
2, 2
013
3:46
:27
PM
IP A
ddre
ss: 1
28.2
33.2
10.9
7
© Woodhead Publishing Limited, 2013
214 Robotics and automation in the food industry
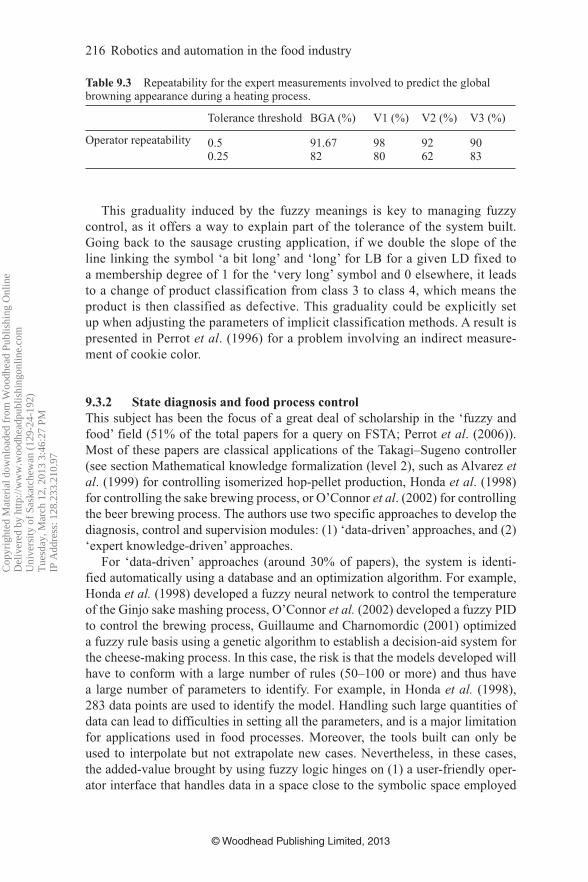
help the evaluation of the browning variable. It is an important sensory variable assessed by an operator to control the browning process, which influences con-sumer choice and preferences. Nevertheless, in the industry, it is difficult to mea-sure and is achieved by the quality team of the factory through a visual quality criterion so-called the browning global appearance (BGA). The diagnosis model consists in aggregating the descriptive variables assessed by the operators into the BGA (V1, percentage of spotted areas; V2, color of the spotted area; V3, color of the product surface excepting the spot areas), see Table 9.2 for V2. Fuzzy rules are in the form, for example, of the descriptive variables being assessed as follows: V3 is beige, V2 is dark brown, and V1 is non-existent with a membership degree to 0.75 and is small with a membership degree of 0.25. In this way, the rules hav-ing a membership degree different from 0 are R1 and R2.
R1: if V1 is non-existent, V2 is dark brown and V3 is beige then the BGA is Low browning LB.
R2: if V1 is small, V2 is dark brown and V3 is beige then the BGA is No brown-ing NB.
The diagnosis was validated on 40 products with a percentage of compatibility of 92.5% at a threshold of one half symbol ( Fig. 9.10 ).
The selected number of fuzzy membership functions, and consequently the number of symbols chosen to characterize a linguistic variable, is a crucial factor in this approach. It gives an indication of the importance of each variable in the expert’s strategy. It is also linked to the sensitivity of the operator’s measure-ment on this variable, which is itself tied to its importance, if not to difficulties in
(b)
(a)
Very longLong
0 1000150 200 500
Number of pixels of length of black areas (LB)
700
Non-existent
1
LB
A bit long
Mem
bers
hip
from
0 to
1
Fig. 9.9 Meaning of LB: (a) pixels of the image that represent LB, (b) fuzzy meaning of the variable LB.
Cop
yrig
hted
Mat
eria
l dow
nloa
ded
from
Woo
dhea
d Pu
blis
hing
Onl
ine
D
eliv
ered
by
http
://w
ww
.woo
dhea
dpub
lishi
ngon
line.
com
U
nive
rsity
of
Sask
atch
ewan
(12
9-24
-192
)
Tue
sday
, Mar
ch 1
2, 2
013
3:46
:27
PM
IP A
ddre
ss: 1
28.2
33.2
10.9
7
Intelligent quality control systems based on fuzzy logic 215
© Woodhead Publishing Limited, 2013
performing the measurement. This is what can be termed the ‘granularity’ of the measurement, which is linked to the graduality selected for the fuzzy meanings and descriptions. For example, in the application developed below on the global appearance of browning (BGA). A test was run on the repeatability of the expert measurements for these three variables ( Table 9.3 ), revealing that repeatability can be linked to the number of symbols associated to each of these variables (V1 and V3 were explained by 5 symbols, and V2 by 4 symbols).
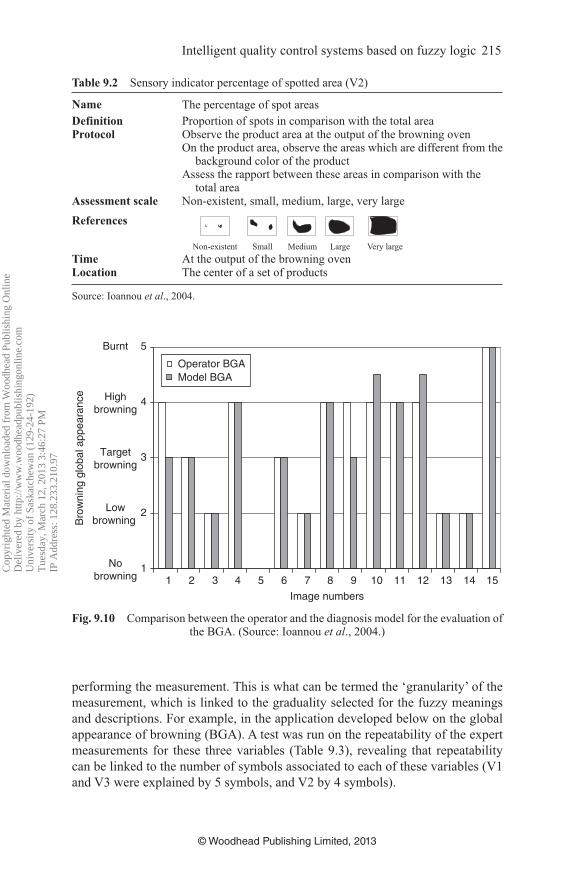
Table 9.2 Sensory indicator percentage of spotted area (V2)
Name The percentage of spot areas Definition Proportion of spots in comparison with the total area Protocol Observe the product area at the output of the browning oven
On the product area, observe the areas which are different from the background color of the product
Assess the rapport between these areas in comparison with the total area
Assessment scale Non-existent, small, medium, large, very large References
Non-existent Small Medium Large Very large
Time At the output of the browning oven Location The center of a set of products
Source: Ioannou et al ., 2004.
1
2
3
4
5
1 2 3 4 5 6 7 8 9 10 11 12 13 14 15
Image numbers
Bro
wni
ng g
loba
l app
eara
nce
Operator BGAModel BGA
Targetbrowning
Highbrowning
Nobrowning
Lowbrowning
Burnt
Fig. 9.10 Comparison between the operator and the diagnosis model for the evaluation of the BGA. (Source: Ioannou et al ., 2004 .)
Cop
yrig
hted
Mat
eria
l dow
nloa
ded
from
Woo
dhea
d Pu
blis
hing
Onl
ine
D
eliv
ered
by
http
://w
ww
.woo
dhea
dpub
lishi
ngon
line.
com
U
nive
rsity
of
Sask
atch
ewan
(12
9-24
-192
)
Tue
sday
, Mar
ch 1
2, 2
013
3:46
:27
PM
IP A
ddre
ss: 1
28.2
33.2
10.9
7
© Woodhead Publishing Limited, 2013
216 Robotics and automation in the food industry
This graduality induced by the fuzzy meanings is key to managing fuzzy control, as it offers a way to explain part of the tolerance of the system built. Going back to the sausage crusting application, if we double the slope of the line linking the symbol ‘a bit long’ and ‘long’ for LB for a given LD fixed to a membership degree of 1 for the ‘very long’ symbol and 0 elsewhere, it leads to a change of product classification from class 3 to class 4, which means the product is then classified as defective. This graduality could be explicitly set up when adjusting the parameters of implicit classification methods. A result is presented in Perrot et al . ( 1996 ) for a problem involving an indirect measure-ment of cookie color.
9.3.2 State diagnosis and food process control This subject has been the focus of a great deal of scholarship in the ‘fuzzy and food’ field (51% of the total papers for a query on FSTA; Perrot et al . (2006)). Most of these papers are classical applications of the Takagi–Sugeno controller (see section Mathematical knowledge formalization (level 2), such as Alvarez et al . ( 1999 ) for controlling isomerized hop-pellet production, Honda et al . ( 1998 ) for controlling the sake brewing process, or O’Connor et al . ( 2002 ) for controlling the beer brewing process. The authors use two specific approaches to develop the diagnosis, control and supervision modules: (1) ‘data-driven’ approaches, and (2) ‘expert knowledge-driven’ approaches.
For ‘data-driven’ approaches (around 30% of papers), the system is identi-fied automatically using a database and an optimization algorithm. For example, Honda et al. ( 1998 ) developed a fuzzy neural network to control the temperature of the Ginjo sake mashing process, O’Connor et al. ( 2002 ) developed a fuzzy PID to control the brewing process, Guillaume and Charnomordic ( 2001 ) optimized a fuzzy rule basis using a genetic algorithm to establish a decision-aid system for the cheese-making process. In this case, the risk is that the models developed will have to conform with a large number of rules (50–100 or more) and thus have a large number of parameters to identify. For example, in Honda et al. ( 1998 ), 283 data points are used to identify the model. Handling such large quantities of data can lead to difficulties in setting all the parameters, and is a major limitation for applications used in food processes. Moreover, the tools built can only be used to interpolate but not extrapolate new cases. Nevertheless, in these cases, the added-value brought by using fuzzy logic hinges on (1) a user-friendly oper-ator interface that handles data in a space close to the symbolic space employed
Table 9.3 Repeatability for the expert measurements involved to predict the global browning appearance during a heating process.
Tolerance threshold BGA (%) V1 (%) V2 (%) V3 (%)
Operator repeatability 0.5 91.67 98 92 900.25 82 80 62 83
Cop
yrig
hted
Mat
eria
l dow
nloa
ded
from
Woo
dhea
d Pu
blis
hing
Onl
ine
D
eliv
ered
by
http
://w
ww
.woo
dhea
dpub
lishi
ngon
line.
com
U
nive
rsity
of
Sask
atch
ewan
(12
9-24
-192
)
Tue
sday
, Mar
ch 1
2, 2
013
3:46
:27
PM
IP A
ddre
ss: 1
28.2
33.2
10.9
7

Intelligent quality control systems based on fuzzy logic 217
© Woodhead Publishing Limited, 2013
by the operators; (2) the possibility of automatically adapting the module to new processing conditions (such as a new formula for a biscuit) if a model or a set with enough data to characterize the process become available.
For ‘expert-knowledge-driven’ approaches, fuzzy logic is used as a way of providing a mathematical formalization of expert knowledge and embedding it in decision-aid algorithms and controllers. For example, Ioannou et al. ( 2004 ) proposed a fuzzy logic approach to control the browning process during indus-trial heating, Curt et al . ( 2002 ) developed five Takagi–Sugeno modules to control sausage quality during ripening. Fuzzy logic is also used for supervisory tasks, as in Acosta-Lazo et al . ( 2001 ) for the supervision of a sugar factory, or Goelzera et al . ( 2009 ) for decision-support software including a physiological model of yeast activity and fuzzy logic to provide fast and efficient solutions to facilitate win-ery management on an industrial scale in various winemaking conditions. In this case, the modules are used directly, without database adaptation, and the datasets are only used to validate the approaches. The rule bases are generally compact, featuring only a limited number of rules (around 20 on average). It is very inter-esting for two reasons: firstly, the building of such a fuzzy expert system is less time-consuming than for classical expert systems building; secondly, it is very easy to correct and adapt from one process to another on the same product.
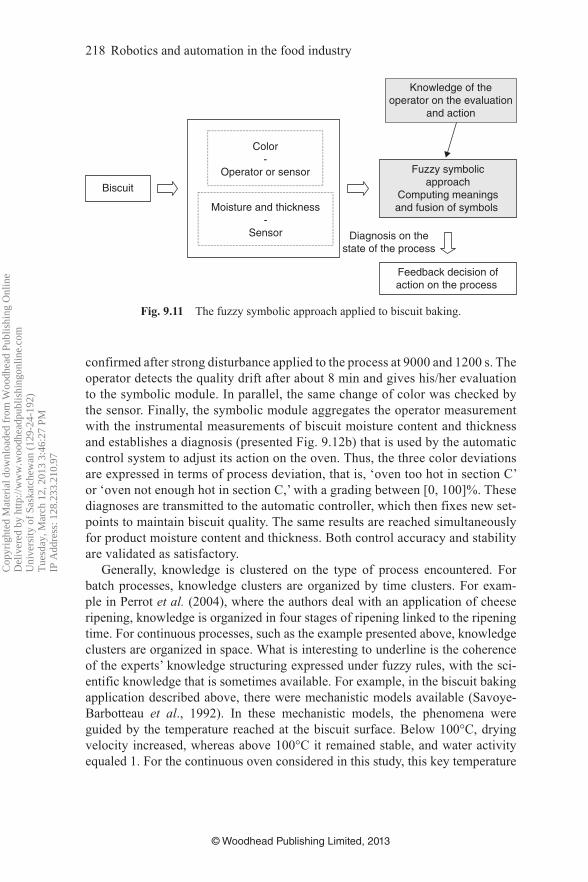
We shall illustrate this chapter using the results developed in Perrot et al . ( 2000 ). The principle was to develop a decision-aid system for the baking process. The entire process was non-linear and time-variant (the operating conditions of an oven change after it has been used for extended periods), with strong interactions between variables, such as the impact of the temperature all along an industrial tunnel oven on the moisture content, color and thickness of the biscuit. The oper-ator plays an important role in this process, and the quality of the biscuits baked hinges on the operator’s measurements and actions. Working in this application, we built and validated a closed-loop quality control feedback system on an indi-rect continuous pilot tunnel oven ( Fig. 9.11 ).
Numerical inputs for moisture and thickness are formatted in a linguistic space using the fuzzy meanings described in Section 9.2.1 . The space format-ted in this way can be aggregated at the same level as the operators’ symbolic description of the color. The second step is to compute the fusion between the symbols expressed by the operators according to the fuzzy formalism. For example: ‘oven too hot in section c of the oven = (moisture normal OR moisture dry) AND color over-cooked’ or ‘oven not hot enough in section c of the oven = (moisture normal OR too much moisture) AND color slightly under-cooked.’ Finally, a constant-type Takagi–Sugeno fuzzy controller is implemented to aid decisions on action on the output variables, that is, temperature setpoints for the air in the different chambers of a continuous oven. This controller is based on the membership grades calculated for system diagnosis. Figure 9.12 illustrates an example of an experiment on an indirect continuous pilot oven, giving the response of the feedback controller using the outputs of the support system and the process state diagnosis. Good regulation performances were achieved for all biscuit quality characteristics during baking, despite the disturbances as
Cop
yrig
hted
Mat
eria
l dow
nloa
ded
from
Woo
dhea
d Pu
blis
hing
Onl
ine
D
eliv
ered
by
http
://w
ww
.woo
dhea
dpub
lishi
ngon
line.
com
U
nive
rsity
of
Sask
atch
ewan
(12
9-24
-192
)
Tue
sday
, Mar
ch 1
2, 2
013
3:46
:27
PM
IP A
ddre
ss: 1
28.2
33.2
10.9
7
© Woodhead Publishing Limited, 2013
218 Robotics and automation in the food industry
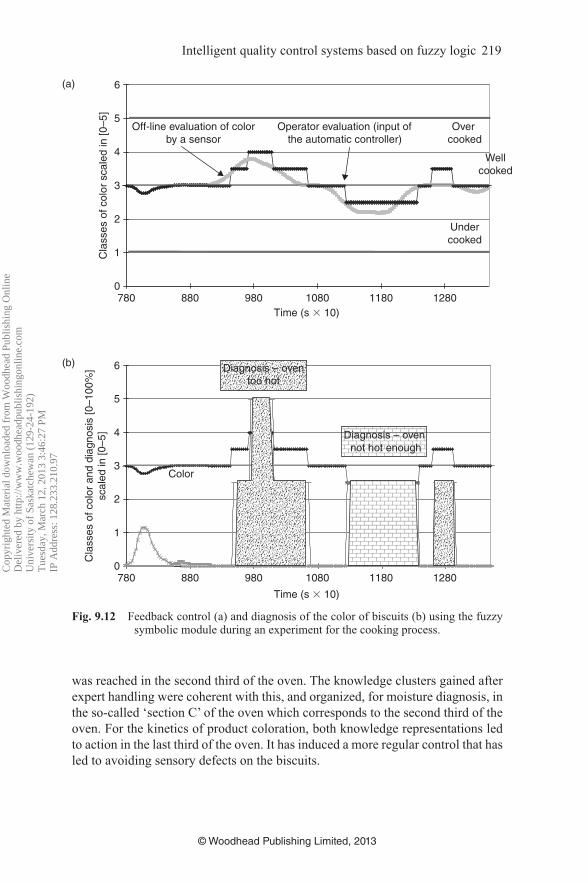
confirmed after strong disturbance applied to the process at 9000 and 1200 s. The operator detects the quality drift after about 8 min and gives his/her evaluation to the symbolic module. In parallel, the same change of color was checked by the sensor. Finally, the symbolic module aggregates the operator measurement with the instrumental measurements of biscuit moisture content and thickness and establishes a diagnosis (presented Fig. 9.12b ) that is used by the automatic control system to adjust its action on the oven. Thus, the three color deviations are expressed in terms of process deviation, that is, ‘oven too hot in section C’ or ‘oven not enough hot in section C,’ with a grading between [0, 100]%. These diagnoses are transmitted to the automatic controller, which then fixes new set-points to maintain biscuit quality. The same results are reached simultaneously for product moisture content and thickness. Both control accuracy and stability are validated as satisfactory.
Generally, knowledge is clustered on the type of process encountered. For batch processes, knowledge clusters are organized by time clusters. For exam-ple in Perrot et al. ( 2004 ), where the authors deal with an application of cheese ripening, knowledge is organized in four stages of ripening linked to the ripening time. For continuous processes, such as the example presented above, knowledge clusters are organized in space. What is interesting to underline is the coherence of the experts’ knowledge structuring expressed under fuzzy rules, with the sci-entific knowledge that is sometimes available. For example, in the biscuit baking application described above, there were mechanistic models available (Savoye-Barbotteau et al ., 1992 ). In these mechanistic models, the phenomena were guided by the temperature reached at the biscuit surface. Below 100°C, drying velocity increased, whereas above 100°C it remained stable, and water activity equaled 1. For the continuous oven considered in this study, this key temperature
Knowledge of theoperator on the evaluation
and action
Biscuit
Color-
Operator or sensor
Moisture and thickness-
Sensor
Fuzzy symbolicapproach
Computing meaningsand fusion of symbols
Diagnosis on thestate of the process
Feedback decision ofaction on the process
Fig. 9.11 The fuzzy symbolic approach applied to biscuit baking.
Cop
yrig
hted
Mat
eria
l dow
nloa
ded
from
Woo
dhea
d Pu
blis
hing
Onl
ine
D
eliv
ered
by
http
://w
ww
.woo
dhea
dpub
lishi
ngon
line.
com
U
nive
rsity
of
Sask
atch
ewan
(12
9-24
-192
)
Tue
sday
, Mar
ch 1
2, 2
013
3:46
:27
PM
IP A
ddre
ss: 1
28.2
33.2
10.9
7
Intelligent quality control systems based on fuzzy logic 219
© Woodhead Publishing Limited, 2013
was reached in the second third of the oven. The knowledge clusters gained after expert handling were coherent with this, and organized, for moisture diagnosis, in the so-called ‘section C’ of the oven which corresponds to the second third of the oven. For the kinetics of product coloration, both knowledge representations led to action in the last third of the oven. It has induced a more regular control that has led to avoiding sensory defects on the biscuits.
0
1
2
3
4
5
6
780 880 980 1080 1180 1280
780 880 980 1080 1180 1280
Time (s � 10)
(a)
(b)
Cla
sses
of c
olor
sca
led
in [0
–5]
Off-line evaluation of colorby a sensor
Operator evaluation (input ofthe automatic controller)
Over cooked
Undercooked
Wellcooked
0
1
2
3
4
5
6
Time (s � 10)
Cla
sses
of c
olor
and
dia
gnos
is [0
–100
%]
scal
ed in
[0–5
] Diagnosis – oven not hot enough
Color
Diagnosis – oventoo hot
Fig. 9.12 Feedback control (a) and diagnosis of the color of biscuits (b) using the fuzzy symbolic module during an experiment for the cooking process.
Cop
yrig
hted
Mat
eria
l dow
nloa
ded
from
Woo
dhea
d Pu
blis
hing
Onl
ine
D
eliv
ered
by
http
://w
ww
.woo
dhea
dpub
lishi
ngon
line.
com
U
nive
rsity
of
Sask
atch
ewan
(12
9-24
-192
)
Tue
sday
, Mar
ch 1
2, 2
013
3:46
:27
PM
IP A
ddre
ss: 1
28.2
33.2
10.9
7

© Woodhead Publishing Limited, 2013
220 Robotics and automation in the food industry
9.3.3 Joint processing of imprecision and variability in the modeling of cheese mass loss during ripening
The dynamics of cheese mass loss is a key factor in the ripening process, with consequences for productivity and a risk that the resulting product may be dropped in status. These dynamics are dependent on climatic conditions in the ripening chambers where ventilation is used to evacuate heat and humidity gen-erated by cheeses. In an industrial context, it is not feasible to install sensors at every point in the ripening chamber in order to control atmospheric conditions. Due to confidentiality issues, the literature contains few studies on the interac-tion between climatic conditions and airflow. Heat and mass transfers have been extensively studied in relation to cooking and drying processes, but few data have been published in the field of cheese ripening, and transfer coefficients between cheeses and the atmosphere are not precisely described. The aim here is to take into account the imprecise and incomplete knowledge of ripening cham-ber characteristics in the cheese mass loss model (Baudrit et al ., 2009). Each input variable and model parameter is represented by means of probability and possibility distributions according to the nature of the available knowledge, and we implemented the joint propagation scheme for each time-step. Figure 9.13 (left) shows the lower and upper cumulative probability bounds at day 14 before wrapping for an initial mass of 0.33 kg resulting from uncertainty propagation. The gap between these two limits is due primarily to the imprecise nature of available information.
We can thus summarize the total uncertainty on cheese weight before the wrap-ping step, using the interval [0.260, 0.284]. That means we are 95% sure that cheeses will exceed 0.26 kg at day 14. Figure 9.13 (right) presents the evolutions of uncertainty margins of 5% and 95% percentiles for the mass loss at each time-step during the two ripening processes. On the one hand, we are 95% certain that the mass loss of cheeses throughout the ripening room will not exceed 70 g for the first trial at day 14 of ripening. On the other hand, we are 95% sure that cheeses have lost at least 46 g before they are wrapped. On the basis of a model calibrated to pilot scale, our approach could provide key information to improve the control of cheese mass losses in industrial conditions.
9.4 Advances in research and future trends As we have seen, fuzzy logic could have a promising future in food applications to (1) capture and formalize the descriptive sensory evaluation performed by a quality team, an operator or a consumer, (2) deliver a state diagnosis, and (3) con-trol or aid decisions in food engineering.
The state of the art of knowledge available for modeling food processes induces uncertainty on certain phenomena and, consequently, on certain model input variables and parameters. Possibility distributions are well-geared to rep-resentations of expert knowledge as the experts can be expected to be consistent
Cop
yrig
hted
Mat
eria
l dow
nloa
ded
from
Woo
dhea
d Pu
blis
hing
Onl
ine
D
eliv
ered
by
http
://w
ww
.woo
dhea
dpub
lishi
ngon
line.
com
U
nive
rsity
of
Sask
atch
ewan
(12
9-24
-192
)
Tue
sday
, Mar
ch 1
2, 2
013
3:46
:27
PM
IP A
ddre
ss: 1
28.2
33.2
10.9
7

Intelligent quality control systems based on fuzzy logic 221
© Woodhead Publishing Limited, 2013
with their own decisions: the interval of values that they consider most likely is necessarily included in the interval outside which they consider values are not possible. Integrating partial ignorance in the mathematical model established at pilot scale can help transpose this knowledge to an industrial scale. Propagating imprecision can help improve the control process. To round up, it will become possible to analyze the contribution of imprecision and/or incompleteness to mod-eled response-outputs in order to elucidate whether an ambiguous response is due to a lack of information or to a source of unpredictable variability, and thus determine the key variables and/or effect events where further insights are criti-cally needed.
Several questions arise when building a control system using expert knowl-edge translated into fuzzy functions.
Question 1 centers on expert knowledge and the difficulties in handling it, even though cognitive science has developed some useful tools for this purposes. One point to underline is the importance of choosing ‘good’ experts, which will
1
0.9
0.8
0.7
0.6
0.5
0.4
0.3
0.2
0.1
00.255 0.26 0.265 0.27
Cheese mass (kg)
Pro
babi
lity
(che
ese
mas
s≤ th
resh
old)
at d
ay 1
4
0.275 0.28 0.285 0.29
Imprecision + dependence
Measurement at day 14Lower probabilityUpper probabilityLower 5% percentileUpper 95% percentile
Upper 95% percentileLower 5% percentileOnline measurement
Variability + imprecision+ dependence
Gap due to variability + imprecision+ dependencies
46g
70g
0.33
0.32
0.31
0.3
0.29
0.28
0.27
0.260 2 4 6
Time (days)
Che
ese
mas
s (k
g)
8 10 12 14
(a)
(b)
Fig. 9.13 (a) Lower and upper probabilities that cheese mass is lower than a certain weight at day 14. (b) Uncertainty margins of the 5th and 95th percentiles pertaining to the
cheese mass loss through the ripening process from an initial mass of 0.33 kg.
Cop
yrig
hted
Mat
eria
l dow
nloa
ded
from
Woo
dhea
d Pu
blis
hing
Onl
ine
D
eliv
ered
by
http
://w
ww
.woo
dhea
dpub
lishi
ngon
line.
com
U
nive
rsity
of
Sask
atch
ewan
(12
9-24
-192
)
Tue
sday
, Mar
ch 1
2, 2
013
3:46
:27
PM
IP A
ddre
ss: 1
28.2
33.2
10.9
7
© Woodhead Publishing Limited, 2013
222 Robotics and automation in the food industry
largely shape the results obtained. More in-depth work with the cognitive science community could prove valuable in progressing this question.
Question 2 raises a series of questions centered on the choice of graduality for fuzzy functions and fuzzy meanings. How should the right graduality be chosen according to objectives targeted? How should this graduality be vali-dated? What is the best comparative method according to objective targeted? How is it possible to validate model results that go beyond human perception of graduality but are still relevant when used for process control purposes? Which mathematical tools need to be deployed so as to implement a theoret-ical approach on a given indirect measurements model in order to assess the graduality achieved on the output variable according to curves established on input variables?
Question 3 is centered on the optimality of the models built and their capacity for optimization through structural change without destroying the model-embedded semantics. Linked to this question is the issue of the generalizability of the models built.
Question 4 concerns the dynamic properties of the models based on the exper-tise handled. The cognitive nature of the experts’ resources (Wickens, 1991 ) makes it extremely difficult to extract mental representations of the dynamics of a system. This is a significant bottleneck for the purposes of controlling complex systems.
Nevertheless, it is essential to understand the dynamics of the complex sys-tems involved in food processes. The development structure, as demonstrated by Datta ( 2008 ), is not just a function of temperature and moisture but also a func-tion of their history, where the complex physical structure that develops changes attributes such as porosity and transport properties. It is true for all the structured food produced by the industry like cream cheese, milk gels, etc. One of the major interests stems from the development of confident and reliable models integrating different knowledge sources and formats. The guiding principle is to deal with the different pieces of the puzzle of knowledge represented under different formal-isms, that is, data, models, expertise. In this sense, the ability to model expert knowledge using fuzzy functions is valuable progress and should be coupled to other forms of modeling.
To conclude, the benefits that fuzzy logic can provide to the food industry are:
An easy way to formalize and capitalize on the expert knowledge that repre-• sents the memory of the factory. Improvements in the management and traceability of the quality of production • with systems that help the operators in their measurement or control tasks. Management of the uncertainty with tools that can help to cope with this • uncertainty and propose process management improvements.
Cop
yrig
hted
Mat
eria
l dow
nloa
ded
from
Woo
dhea
d Pu
blis
hing
Onl
ine
D
eliv
ered
by
http
://w
ww
.woo
dhea
dpub
lishi
ngon
line.
com
U
nive
rsity
of
Sask
atch
ewan
(12
9-24
-192
)
Tue
sday
, Mar
ch 1
2, 2
013
3:46
:27
PM
IP A
ddre
ss: 1
28.2
33.2
10.9
7

Intelligent quality control systems based on fuzzy logic 223
© Woodhead Publishing Limited, 2013
9.5 References Acosta-Lazo , G. G. , Alonso-Gonzales , C. J. and Pulido-Junquera , B. ( 2001 ).
‘ Knowledge based diagnosis of a sugar process with teknolid .’ International Sugar Journal 103 (1225), 44 –51.
Alvarez , E. , Cancela , M. A. , Correa , J. M. , Navaza , J. M. and Riverol , C. ( 1999 ). ‘ Fuzzy logic control for the isomerized hop pellets production .’ Journal of Food Engineering 39 , 145 –150.
Baudrit, C. Hélias, A. Perrot, N. ( 2009 ). ‘Joint treatment of imprecision and variability in food engineering: application to cheese mass loss during ripening.’ Journal of Food Engineering , 93(3), 284–292.
Benoit , E. and Foulloy , L. ( 2003 ). ‘ Towards fuzzy nominal scales .’ Measurement 34 (1), 49 –55.
Bouchon-Meunier , B. , Rifqi , M. and Bothorel , S. ( 1996 ). ‘ Towards general measures of comparison of objects .’ Fuzzy Sets and Systems 84 , 143 –153.
Chao , K. , Chen , Y. R. , Early , H. and Park , B. ( 1999 ). ‘ Color image classification systems for poultry viscera inspection .’ Applied Engineering in Agriculture 15 (4), 363 –369.
Curt , C. , Hossenlopp , J. , Perrot , N. and Trystram , G. ( 2002 ). ‘ Dry sausage ripening con-trol. Integration of sensory related properties .’ Food Control 13 (3), 151 –159.
Curt , C. , Perrot , N. , Allais , I. , Agioux , L. , Ioannou , I. , Edoura-Gaena , B. , Trystram , G. and Hossenlopp , J. ( 2004 ). ‘Formalization of at-line human evaluations to monitor product changes during processing: the concept of sensory indicator,’ in D. Ruan and X. Zeng , Intelligent Sensory Evaluation , Springer Verlag , 157–174.
Datta , A. K. ( 2008 ). ‘ Status of physics-based models in the design of food products, pro-cesses, and equipment .’ Comprehensive Reviews in Food Science and Food Safety 7 (1), 121 –129.
De Silva , C. W. , Gamage , L. B. and Gosine , R. G. ( 1996 ). ‘ An intelligent firmness sensor for an automated herring roe grader .’ Intelligent Automation and Soft Computing 1 (1), 99 –114.
Dubois, , D. and Prade, , H. (1980). Fuzzy Sets and Systems: Theory and Applications, Academic Press, Inc
Dubois , D. , Foulloy , L. , Galichet , S. and Prade , H. ( 1999 ). ‘Performing approximate reasoning with words,’ in Computing with Words in Information/Intelligent Systems 1 , Springer Verlag , 24–29.
Dubois, D., Nguyen, H.T. and Prade, H. (2000). ‘Possibility theory, probability and fuzzy sets: misunderstandings, bridges and gaps.’ Fundamentals of Fuzzy Sets , Dubois, D. Prade, H., Eds: Kluwer, Boston, Mass, 343–438.
FERSON, S. and GINZBURG, L. R. (1996) ‘Different methods are needed to propagate igno-rance and variability.’ Reliability Engineering and Systems Safety 54, 133–144.
Goelzera , A. , Charnomordica , B. , Colombiéa , S. , Fromiona , V. and Sablayrolles , J. M. ( 2009 ). ‘ Simulation and optimization software for alcoholic fermentation in wine-making conditions .’ Food Control 20 (7), 635 –642.
Guillaume , S. and Charnomordic , B. ( 2001 ). ‘ Knowledge discovery for control purposes in food industry databases .’ Fuzzy Sets and Systems 122 (3), 487 –497.
Honda , H. , Hanai , T. , Katayama , A. , Tohyama , H. and Kobayashi , T. ( 1998 ). ‘ Temperature control of Ginjo sake mashing process by automatic fuzzy modeling using fuzzy neural networks.’ Journal of Fermentation and Bioengineering 85(1), 107 –112.
Ioannou , I. , Perrot , N. , Curt , C. , Mauris , G. and Trystram , G. ( 2004 ). ‘ Development of a control system using the fuzzy set theory applied to a browning process – a fuzzy sym-bolic approach for the measurement of product browning: Development of a diagnosis model – part I .’ Journal of Food Engineering 64 , 497 –506.
Cop
yrig
hted
Mat
eria
l dow
nloa
ded
from
Woo
dhea
d Pu
blis
hing
Onl
ine
D
eliv
ered
by
http
://w
ww
.woo
dhea
dpub
lishi
ngon
line.
com
U
nive
rsity
of
Sask
atch
ewan
(12
9-24
-192
)
Tue
sday
, Mar
ch 1
2, 2
013
3:46
:27
PM
IP A
ddre
ss: 1
28.2
33.2
10.9
7

© Woodhead Publishing Limited, 2013
224 Robotics and automation in the food industry
Ioannou , I. , Perrot , N. , Hossenlopp , J. , Mauris , G. and Trystram , G. ( 2002 ). ‘ The fuzzy set theory: A helpful tool for the estimation of sensory properties of crusting sausage appearance by a single expert .’ Food Quality and Preference 13 (7–8), 589 –595.
Ioannou , I. , Perrot , N. , Mauris , G. and Trystram , G. ( 2004 ). ‘ Development of a control system using the fuzzy set theory applied to a browning process – towards a control sys-tem of the browning process combining a diagnosis model and a decision model – part II .’ Journal of Food Engineering 64 , 507 –514.
Keller , J. , Gray , M. and Givens , J. ( 1985 ). ‘ A fuzzy k-nearest neighbor algorithm .’ IEEE Transactions on Systems, Man and Cybernetics 15 (4), 580 –585.
Mauris , G. , Benoit , E. and Foulloy , L. ( 1994 ). ‘ Fuzzy symbolic sensors – from concept to applications .’ Measurement 12 , 357 –384.
Mauris , G. , Perrot , N. , Lambert , P. and Philippe , J. ( 2000 ). ‘ Fuzzy techniques evaluate sausage quality .’ IEEE Instrumentation and Measurement 3 (4), 14 –17.
Mittal , G.S. ( 1997 ). Computerized Control Systems in the Food Industry . Marcel Dekker , New York , 597 pp.
Nielsen , H. M. and Paul , W. ( 1997 ). ‘Modelling image processing parameters and con-sumer aspects for tomato quality grading’. IFAC Mathematical and Control Applications in Agriculture and Horticulture , Hannover , Germany .
O’Connor , B. , Riverol , C. , Kelleher , P. , Plant , N. , Bevan , R. , Hinchy , E. and D’Arcy , J. ( 2002 ). ‘ Integration of fuzzy logic based control procedures in brewing .’ Food Control 13 , 23 –31.
Perrot , N. , Agioux , L. , Ioannou , I. , Mauris , G. , Corrieu , G. and Trystram , G. ( 2004 ). ‘ Decision support system design using the operator skill to control cheese ripen-ing – application of the fuzzy symbolic approach .’ Journal of Food Engineering 64 , 321 –333.
Perrot , N. , Ioannou , I. , Allais , I. , Curt , C. , Hossenlopp , J. and Trystram , G. ( 2006 ). ‘ Fuzzy concepts applied to food product quality control: A review .’ Fuzzy Sets and Systems 157 , 1145 –1154.
Perrot , N. , Trystram , G. , Guely , F. , Chevrie , F. , Schoesetters , N. and Dugre , E. ( 2000 ). ‘ Feed-back quality control in the baking industry using fuzzy sets .’ Journal of Food Process Engineering 23 , 249 –279.
Perrot , N. , Trystram , G. , LeGennec , D. and Guely , F. ( 1996 ). ‘ Sensor fusion for real time quality evaluation of biscuit during baking. Comparison between Bayesian and Fuzzy approaches .’ Journal of Food Engineering 29 , 301 –315.
Price , C. J. , Trave-Massuyes , L. , Milne , R. , Ironi , L. , Forbus , K. , Bredeweg , B. , Lee , M. H. , Struss , P. , Snooke , N. , Lucas , P. , Cavazza , M. and Coghill , G. M. ( 2006 ). ‘ Qualitative futures .’ Knowledge Engineering Review 21 (4), 317 –334.
Ruan , D. and Zeng , X. ( 2004 ). Intelligent sensory evaluation. In D. Ruan and X. Zeng, Eds., Methodologies and Applications . Springer , Berlin , 443 pp.
Savoye-Barbotteau , I. , Trystram , G. , Duquenoy , A. and Brunet , P. ( 1992 ). ‘ Heat and mass transfer dynamic modelling of an indirect biscuit baking tunnel oven .’ Journal of Food Engineering 16 , 173 –196.
Shanteau , J. ( 1992 ). ‘ Competence in experts: the role of task characteristics .’ Organizational Behavior and Human Decision Processes 53 , 252 –266.
Sundic , T. , Marco , S. , Samitier , J. and Wide , P. ( 2000 ). ‘Electronic tongue and elec-tronic nose data fusion in classification with neural networks and fuzzy logic based models’. Proceedings of the 17th IEEE Instrumentation and Measurement Technology Conference .
Takagi , T. and Sugeno , M. ( 1985 ). ‘ Fuzzy identification of systems and its applica-tion to modelling and control .’ IEEE Trans. on Systems, Man and Cybernetics 15 (1), 116 –132.
Valet , L. , Mauris , G. and Bolon , P. ( 2000 ). A statistical overview of recent literature in information fusion. ISIF , Paris .
Cop
yrig
hted
Mat
eria
l dow
nloa
ded
from
Woo
dhea
d Pu
blis
hing
Onl
ine
D
eliv
ered
by
http
://w
ww
.woo
dhea
dpub
lishi
ngon
line.
com
U
nive
rsity
of
Sask
atch
ewan
(12
9-24
-192
)
Tue
sday
, Mar
ch 1
2, 2
013
3:46
:27
PM
IP A
ddre
ss: 1
28.2
33.2
10.9
7

Intelligent quality control systems based on fuzzy logic 225
© Woodhead Publishing Limited, 2013
Walley , P. ( 1991 ). Statistical Reasoning with Imprecise Probabilities . Chapman and Hall , London .
Wickens , C. ( 1991 ). ‘Processing resources and attention,’ in T. A. Francis , ed., Multiple Task Performance . London .
Yea , B. , Konishi , R. , Osaki , T. and Sugahara , K. ( 1994 ). ‘ The discrimination of many kinds of odor species using fuzzy reasoning and neural networks .’ Sensors and Actuators 45 , 159 –165.
Zadeh , L. ( 1965 ). ‘ Fuzzy Sets .’ Information and Control 8 , 338 –353.
Cop
yrig
hted
Mat
eria
l dow
nloa
ded
from
Woo
dhea
d Pu
blis
hing
Onl
ine
D
eliv
ered
by
http
://w
ww
.woo
dhea
dpub
lishi
ngon
line.
com
U
nive
rsity
of
Sask
atch
ewan
(12
9-24
-192
)
Tue
sday
, Mar
ch 1
2, 2
013
3:46
:27
PM
IP A
ddre
ss: 1
28.2
33.2
10.9
7