roche reports solid sales growth in the first quarter of 2016 · f. hoffmann -la roche ltd 4070...
TRANSCRIPT

Investor Update
F. Hoffmann-La Roche Ltd 4070 Basel
Switzerland
Investor Relations
email:
Tel. +41 61 68-88880
Fax +41 61 69-10014
www.roche.com
Basel, 19 April 2016
Roche reports solid sales growth in the first quarter of 2016
Group sales up 4%1 at constant exchange rates, 5% in Swiss francs
Pharmaceuticals Division sales increase 4%, driven by oncology and immunology medicines
Diagnostics Division sales grow 5%, led by immunodiagnostic product demand
US FDA grants priority review for investigational cancer immunotherapy medicine atezolizumab in
bladder and lung cancer and breakthrough therapy designation for ocrelizumab in multiple sclerosis
Outlook for 2016 confirmed
Key figures In millions of CHF As % of sales % change
January – March 2016 2015 2016 2015 At CER In CHF
Group sales 12,414 11,833 100 100 +4 +5
Pharmaceuticals Division 9,800 9,322 79 79 +4 +5
United States 4,716 4,392 38 37 +3 +7
Europe 2,319 2,178 19 18 +5 +6
Japan 853 763 7 6 +4 +12
International* 1,912 1,989 15 18 +4 -4
Diagnostics Division 2,614 2,511 21 21 +5 +4
*Asia–Pacific, EEMEA (Eastern Europe, Middle East and Africa), Latin America, Canada, Others
Roche CEO Severin Schwan said: “We have started the year with solid growth in both our Pharmaceuticals and
Diagnostics Divisions. The marketing applications of important investigational medicines are well underway.
The FDA granted priority review for atezolizumab in two indications and breakthrough therapy designation for
ocrelizumab in primary progressive multiple sclerosis. Overall, we are on track to meet our full-year targets for
2016.”
1 Unless otherwise stated, all growth rates in this document are at constant exchange rates (CER: average 2015).

2/18
Group
In the first quarter of 2016, Group sales rose 4% to CHF 12.4 billion. Sales in the Pharmaceuticals Division were
up 4% to CHF 9.8 billion with Europe growing 5%, driven by Perjeta, MabThera and RoActemra.
Pharmaceuticals sales in the US increased 3%, led by Esbriet, Xolair and HER2-positive breast cancer medicines.
The recently launched medicines Cotellic in skin cancer and Alecensa in lung cancer have had a good start. In
the US, sales of Tamiflu and Lucentis declined. The main growth contributors in the International region (+4%)
were Avastin, MabThera and Herceptin; this growth was partly offset by lower Pegasys sales due to competition
from a new generation of treatments. In Japan, sales rose 4% driven by Avastin, HER2 medicines and Alecensa.
In Diagnostics, sales grew 5% to CHF 2.6 billion, driven primarily by strong growth in Asia-Pacific (+16%) and
Latin America (+21%). In Europe, the Middle East, and Africa (EMEA) sales increased 1% while they remained
stable in North America and declined by 3% in Japan. Strong growth was recorded for the immunodiagnostic,
molecular and tissue diagnostics businesses. Diabetes Care sales were impacted by challenging market
conditions, especially in North America.
Portfolio progress
In March and April respectively, Roche's lead investigational cancer immunotherapy medicine atezolizumab
was granted priority review by the FDA for marketing applications in two indications, advanced bladder cancer
and non-small cell lung cancer (NSCLC). Both filings were submitted under FDA breakthrough therapy
designations and are based on pivotal phase II data. Atezolizumab is being investigated in a broad phase III
clinical programme in solid and hematologic cancers.
The FDA granted breakthrough therapy designation (BTD) for ocrelizumab in primary progressive multiple
sclerosis in February. Ocrelizumab is the first investigational medicine to receive BTD in multiple sclerosis.
Since 2013, the FDA has granted BTDs for 12 indications of Roche medicines. Roche plans to file ocrelizumab
for both relapsing and primary progressive multiple sclerosis in the first half of 2016.
In March, Roche provided an update on two identical phase III studies of lebrikizumab in people with severe
asthma. While one study met its primary clinical endpoint, the second did not achieve statistical significance.
Roche is analysing the data to help determine next steps in the asthma programme.
In April, the FDA granted Venclexta (venetoclax) accelerated approval for people with a hard-to-treat type of
chronic lymphocytic leukemia. Venclexta is the first approved medicine designed to help restore a process in
which cells self-destruct by selectively blocking a protein called BCL-2. Venclexta is being jointly developed with
AbbVie.

3/18
In February, Roche received US approval for Gazyva for the treatment of people with relapsed or rituximab-
refractory follicular lymphoma, the most common type of indolent non-Hodgkin lymphoma (NHL), based on
phase III results. European approvals are expected later this year. Gazyva is being studied in a large clinical
programme in NHL, and phase III data in diffuse large B cell lymphoma, an aggressive type of NHL, are
expected later this year.
Outlook for 2016
In 2016, Roche expects sales to grow low- to mid-single digit at constant exchange rates. Core earnings per share
are targeted to grow ahead of sales at constant exchange rates. Roche expects to further increase its dividend in
Swiss francs.
Pharmaceuticals
Herceptin, Perjeta and Kadcyla (combined +9%), for HER2-positive breast cancer and HER2-positive
metastatic gastric cancer (Herceptin only), drove overall sales growth. Herceptin sales grew 4%, driven by
demand in the International region and the US due to longer duration of treatment in combination with Perjeta.
The subcutaneous (SC) formulation of Herceptin is being increasingly adopted across Europe. Perjeta (+33%)
also performed well, particularly in Europe and the US. Perjeta in combination with Herceptin and
chemotherapy is approved in 95 countries as first-line treatment for HER2-positive advanced breast cancer
(aBC) and in 60 countries as a neoadjuvant treatment in the HER2-positive early breast cancer setting. Kadcyla
sales (+11%) were driven primarily by demand in Europe, particularly in Germany and Spain, and in the
International region. Kadcyla is approved as a single agent in more than 80 countries worldwide for the second-
line treatment of people with HER2-positive aBC.
Avastin (+4%), for advanced colorectal, breast, lung, kidney, cervical and ovarian cancer and glioblastoma (a
type of brain tumour), continued to show good sales growth across tumour types. In Latin America, there was a
strong sales performance, led by Avastin’s growth in the public market. Additionally, this medicine was
approved for use in second-line ovarian cancer in Brazil. Growth was also supported by high demand in Asia
(+29%), especially China where growth resulted from improved access in the lung and colorectal cancer setting.
MabThera/Rituxan (+3%), for common forms of blood cancer, rheumatoid arthritis and certain types of
vasculitis, continued to grow. Growth was driven primarily by significant demand in the International region,
particularly in China (+14%), and in Europe.
Gazyva/Gazyvaro (+67%), for the treatment of chronic lymphocytic leukemia (CLL) and follicular lymphoma,
delivered a solid sales performance. In CLL, there was good uptake in the US and major European markets.

4/18
Gazyva/Gazyvaro is now approved for CLL in more than 70 countries. In the US, Gazyva was approved for use
in follicular lymphoma in February.
Alecensa (CHF 29 million) received FDA approval in the US in December 2015 for the treatment of people with
ALK-positive advanced NSCLC. Since launch, strong uptake in the US is being driven by use in the second and
third-line treatment settings. In Japan, where Alecensa was first launched in 2014, sales continued to grow
strongly as the medicine has been increasingly used in patients who have not been previously treated with, have
progressed on, or are intolerant to crizotinib.
Esbriet (+96%), for idiopathic pulmonary fibrosis (IPF), saw strong sales growth. Sales reached CHF 127 million
in the US and CHF 45 million in Europe, with increasing demand thanks to strong clinical data and expanding
patient access. Roche strengthened its leading position in the treatment of IPF in the US and EU.
Actemra/RoActemra (+14%), for rheumatoid arthritis and forms of juvenile idiopathic arthritis, recorded
strong growth. Increasing use of Actemra/RoActemra as a single agent and of the SC formulation remained key
growth drivers in Europe and the US.
Top-selling Total United States Europe Japan International*
pharmaceuticals CHFm % CHFm % CHFm % CHFm % CHFm %
MabThera/Rituxan 1,825 3 978 0 479 5 62 12 306 11
Herceptin 1,725 4 651 4 525 2 67 5 482 7
Avastin 1,706 4 775 -2 471 2 192 7 268 27
Perjeta 439 33 224 15 149 65 23 18 43 65
Actemra/RoActemra 386 14 145 12 131 17 60 14 50 10
Tamiflu 367 -6 251 -15 20 78 60 4 36 35
Xolair 356 22 356 22 - - - - - -
Lucentis 355 -13 355 -13 - - - - - -
Activase/TNKase 276 21 265 21 - - - - 11 13
Tarceva 258 -14 136 -15 48 -18 22 0 52 -14
* Asia–Pacific, EEMEA (Eastern Europe, Middle East and Africa), Latin America, Canada, Others

5/18
Diagnostics Division
Diagnostics Division In millions
of CHF
% change As % of
sales January - March At CER In CHF
Sales - Diagnostics Division 2,614 +5 +4 100
Business
Areas
Professional Diagnostics 1,519 +7 +7 58
Molecular Diagnostics 446 +11 +11 17
Diabetes Care 443 -11 -13 17
Tissue Diagnostics 206 +13 +16 8
Regions
Europe, Middle East, Africa 1,130 +1 +1 43
North America 703 0 +3 27
Asia–Pacific 529 +16 +14 20
Latin America 157 +21 -1 6
Japan 95 -3 +3 4
Professional Diagnostics (+7%) was a major contributor to the Division’s performance, led by Asia-Pacific,
with continued strong growth in China (+24%). The immunodiagnostics business performed strongly, growing
12%, while sales of the clinical chemistry business increased 6%.
In January, the New England Journal of Medicine published a study confirming the prognostic value of Roche’s
Elecsys sFlt-1/PlGF immunoassay ratio test in predicting which pregnant women are at high risk of developing
preeclampsia, one of the leading causes of death and complications for mothers and their babies. Also in
January, data on the cardiac troponin T test from Roche were published by the Annals of Emergency Medicine
highlighting a novel approach for a more rapid diagnosis of heart attack in patients with acute chest pain. It
reduces the observation time needed to rule in or rule out a heart attack to one hour.
In Molecular Diagnostics, sales increased by 11%, led by North America and Asia-Pacific. The growth
contributors were the sequencing and molecular (+4%) businesses. The molecular business growth was driven
by virology (+16%) including the diagnosis and monitoring of hepatitis and HIV viral load as well as HPV
screening (+16%). This development was supported by new instruments and tests launched in 2015 as well as a
number of tender contracts won last year. In March, the FDA announced that it would allow the use of an
investigational Roche test to screen blood donations for the Zika virus. This test can be used under an
investigational new drug application for screening donated blood in areas with active mosquito-borne
transmission of the Zika virus.

6/18
Tissue Diagnostics sales increased 13%, driven by North America. The advanced staining portfolio grew 10%
and sales in primary staining increased 24%. This strong increase was supported by the new, fully automated
Ventana HE 600 system for hematoxylin and eosin tissue staining, launched in late 2015. Revenues from
external personalised healthcare partnerships showed continued strong growth.
Diabetes Care sales decreased 11%, predominantly due to a continued spillover of Medicare prices to
commercial plans for the blood glucose monitoring portfolio in the US, leading to a decline in North America of
49%. While EMEA showed a decrease of 6%, strong sales growth was recorded in all other regions (+11%
combined).
First Quarter Sales 2016 Conference Call
There will be a conference call for investors and analysts today, Tuesday 19 April at 2:00 pm CEST.
Please dial in to the conference call 10-15 min. prior to the scheduled start , using the following numbers:
+41 (0) 58 310 5000 (Europe and ROW)
+44 (0) 203 059 5862 (UK)
+1 (1) 631 570 5613 (USA)
Alternatively a live audio webcast can be accessed via http://ir.roche.com.
About Roche
Roche is a global pioneer in pharmaceuticals and diagnostics focused on advancing science to improve people’s
lives.
Roche is the world’s largest biotech company, with truly differentiated medicines in oncology, immunology,
infectious diseases, ophthalmology and diseases of the central nervous system. Roche is also the world leader in
in vitro diagnostics and tissue-based cancer diagnostics, and a frontrunner in diabetes management. The
combined strengths of pharmaceuticals and diagnostics under one roof have made Roche the leader in
personalised healthcare – a strategy that aims to fit the right treatment to each patient in the best way possible.
Founded in 1896, Roche continues to search for better ways to prevent, diagnose and treat diseases and make a
sustainable contribution to society. Twenty-nine medicines developed by Roche are included in the World
Health Organization Model Lists of Essential Medicines, among them life-saving antibiotics, antimalarials and
cancer medicines. Roche has been recognised as the Group Leader in sustainability within the Pharmaceuticals,
Biotechnology & Life Sciences Industry seven years in a row by the Dow Jones Sustainability Indices.
The Roche Group, headquartered in Basel, Switzerland, is active in over 100 countries and in 2015 employed
more than 91,700 people worldwide. In 2015, Roche invested CHF 9.3 billion in R&D and posted sales of CHF
48.1 billion. Genentech, in the United States, is a wholly owned member of the Roche Group. Roche is the

7/18
majority shareholder in Chugai Pharmaceutical, Japan. For more information, please visit www.roche.com.
All trademarks used or mentioned in this release are protected by law.
Additional information
– Investor Update including a full set of tables: http://www.roche.com/med-cor-2016-04-19.htm
– Q1 2016 Sales Presentation with appendix: http://www.roche.com/irp1q16e.pdf
– Q1 2016 Sales Presentation: http://www.roche.com/irp1q16e-a.pdf
– Pharmaceuticals: major clinical and regulatory news flow in 2016:
http://www.roche.com/pharmaAR16e.pdf
– Diagnostics: key diagnostics product launches in 2016: http://www.roche.com/diaAR16e.pdf
– Roche Annual Report 2015 (includes corporate responsibility report): www.roche.com/annual_reports
– Dow Jones Sustainability Indices: www.sustainability-indexes.com
Roche Investor Relations
Dr. Karl Mahler Dr. Sabine Borngräber
Phone: +41 61 68-78503 Phone: +41 61 68-88027
e-mail: [email protected] e-mail: [email protected]
Dr. Bruno Eschli Dr. Tamer Farhan
Phone: +41 61 68-75284 Phone: +41 61 68-82552
e-mail: [email protected] e-mail: [email protected]
Dr. Birgit Masjost
Phone: +41 61 68-84814
e-mail: [email protected]
Investor Relations North America
Nina Goworek Ekaterine Kortkhonjia Ph.D.
Phone: +1 650 467 8737 Phone: +1 650 467 5873
e-mail: [email protected] e-mail: [email protected]
Disclaimer: Cautionary statement regarding forward-looking statements
This document contains certain forward-looking statements. These forward-looking statements may be identified by words such as
‘believes’, ‘expects’, ‘anticipates’, ‘projects’, ‘intends’, ‘should’, ‘seeks’, ‘estimates’, ‘future’ or similar expressions or by discussion of,
among other things, strategy, goals, plans or intentions. Various factors may cause actual results to differ materially in the future from
those reflected in forward-looking statements contained in this document, among others: (1) pricing and product initiatives of
competitors; (2) legislative and regulatory developments and economic conditions; (3) delay or inability in obtaining regulatory
approvals or bringing products to market; (4) fluctuations in currency exchange rates and general financial market conditions; (5)
uncertainties in the discovery, development or marketing of new products or new uses of existing products, including without limitation
negative results of clinical trials or research projects, unexpected side effects of pipeline or marketed products; (6) increased government
pricing pressures; (7) interruptions in production; (8) loss of or inability to obtain adequate protection for intellectual property rights; (9)
litigation; (10) loss of key executives or other employees; and (11) adverse publicity and news coverage. The statement regarding earnings

8/18
per share growth is not a profit forecast and should not be interpreted to mean that Roche’s earnings or earnings per share for 2016 or
any subsequent period will necessarily match or exceed the historical published earnings or earnings per share of Roche

9/18
Appendix: Tables
1. Sales January to March 2016 and 2015 .............................................................................................................................................................................. 10
2. Quarterly sales and constant exchange rate sales growth by Division in 2016 and 2015 ............................................................................................ 11
3. Pharmaceuticals Division .................................................................................................................................................................................................... 12
4. Top 20 Pharmaceuticals Division product sales and constant exchange rate growth Q1 2016 vs. Q1 2015 ............................................................ 13
5. Top 20 Pharmaceuticals Division quarterly product sales and quarterly constant exchange rate sales growth ...................................................... 14
6. Top 20 Pharmaceuticals Division quarterly product sales and quarterly constant exchange rate sales growth United States .............................. 15
7. Top 20 Pharmaceuticals Division quarterly product sales and quarterly constant exchange rate sales growth Europe ........................................ 16
8. Top 20 Pharmaceuticals Division quarterly product sales and quarterly constant exchange rate sales growth Japan ........................................... 17
9. Top 20 Pharmaceuticals Division quarterly product sales and quarterly constant exchange rate sales growth International* ............................ 18

10/18
1. Sales January to March 2016 and 2015
Three months ended % change
CHF millions 31 March
2016 2015 At CER In CHF
Pharmaceuticals Division 9,800 9,322 4 5
United States 4,716 4,392 3 7
Europe 2,319 2,178 5 6
Japan 853 763 4 12
International* 1,912 1,989 4 -4
Diagnostics Division 2,614 2,511 5 4
Roche Group 12,414 11,833 4 5
* Asia–Pacific, EEMEA (Eastern Europe, Middle East and Africa), Latin America, Canada, Others

11/18
2. Quarterly sales and constant exchange rate sales growth by Division in 2016 and 2015
CHF millions
% change % change % change % change % change
Q1 2015 vs. Q2 2015 vs. Q3 2015 vs. Q4 2015 vs. Q1 2016 vs.
Q1 2014 Q2 2014 Q3 2014 Q4 2014 Q1 2015
Pharmaceuticals Division 9,322 4 9,028 7 9,340 6 9,641 3 9,800 4
United States 4,392 6 4,194 7 4,461 7 4,569 3 4,716 3
Europe 2,178 1 2,113 3 2,185 6 2,258 5 2,319 5
Japan 763 -2 777 18 801 8 883 2 853 4
International* 1,989 9 1,944 5 1,893 4 1,931 2 1,912 4
Diagnostics Division 2,511 6 2,724 7 2,600 4 2,979 7 2,614 5
Roche Group 11,833 5 11,752 7 11,940 6 12,620 4 12,414 4
*Asia–Pacific, EEMEA (Eastern Europe, Middle East and Africa), Latin America, Canada, Others

12/18
3. Pharmaceuticals Division
Top-selling pharmaceuticals
and recent new launches Total United States Europe Japan International*
January - March 2016 CHF m % CHF m % CHF m % CHF m % CHF m %
MabThera/Rituxan 1,825 3 978 0 479 5 62 12 306 11
Herceptin 1,725 4 651 4 525 2 67 5 482 7
Avastin 1,706 4 775 -2 471 2 192 7 268 27
Perjeta 439 33 224 15 149 65 23 18 43 65
Actemra/RoActemra 386 14 145 12 131 17 60 14 50 10
Tamiflu 367 -6 251 -15 20 78 60 4 36 35
Xolair 356 22 356 22 - - - - - -
Lucentis 355 -13 355 -13 - - - - - -
Activase/TNKase 276 21 265 21 - - - - 11 13
Tarceva 258 -14 136 -15 48 -18 22 0 52 -14
Recent new launches
Kadcyla 201 11 79 -2 83 13 17 27 22 56
Esbriet 178 96 127 145 45 36 - - 6 4
Zelboraf 53 -1 12 -2 32 -6 1 146 8 9
Erivedge 49 46 33 37 12 54 - - 4 104
Gazyva/Gazyvaro 45 67 29 67 11 162 - - 5 -7
Alecensa 29 161 10 ** - - 19 66 - -
Cotellic 11 ** 2 ** 9 ** - - - -
* Asia–Pacific, EEMEA (Eastern Europe, Middle East and Africa), Latin America, Canada, Others
** Over 500%

13/18
4. Top 20 Pharmaceuticals Division product sales and constant exchange rate growth Q1 2016 vs. Q1 2015
CHF millions Total United States Europe Japan International*
CHF m % CHF m % CHF m % CHF m % CHF m %
MabThera/Rituxan 1,825 3 978 0 479 5 62 12 306 11
Herceptin 1,725 4 651 4 525 2 67 5 482 7
Avastin 1,706 4 775 -2 471 2 192 7 268 27
Perjeta 439 33 224 15 149 65 23 18 43 65
Actemra/RoActemra 386 14 145 12 131 17 60 14 50 10
Tamiflu 367 -6 251 -15 20 78 60 4 36 35
Xolair 356 22 356 22 - - - - - -
Lucentis 355 -13 355 -13 - - - - - -
Activase/TNKase 276 21 265 21 - - - - 11 13
Tarceva 258 -14 136 -15 48 -18 22 0 52 -14
Kadcyla 201 11 79 -2 83 13 17 27 22 56
CellCept 189 -4 45 0 43 -3 15 11 86 -8
Esbriet 178 96 127 145 45 36 - - 6 4
Pulmozyme 160 7 112 6 31 6 - - 17 22
Mircera 118 0 - - 21 -7 45 4 52 0
Xeloda 111 -17 5 -71 9 -31 25 12 72 -13
Rocephin 82 5 - - 13 -13 6 -10 63 12
Pegasys 82 -50 11 -16 19 -40 1 -83 51 -55
NeoRecormon/Epogin 79 -14 - - 36 -10 10 -12 33 -18
Valcyte/Cymevene 78 -21 19 -25 30 -26 - - 29 -14
* Asia–Pacific, EEMEA (Eastern Europe, Middle East and Africa), Latin America, Canada, Others

14/18
5. Top 20 Pharmaceuticals Division quarterly product sales and quarterly constant exchange rate sales growth
CHF millions
% change % change % change % change % change
Q1 2015 vs. Q2 2015 vs. Q3 2015 vs. Q4 2015 vs. Q1 2016 vs.
Q1 2014 Q2 2014 Q3 2014 Q4 2014 Q1 2015
MabThera/Rituxan 1,744 5 1,752 6 1,772 4 1,777 4 1,825 3
Herceptin 1,652 12 1,613 10 1,614 7 1,659 10 1,725 4
Avastin 1,619 6 1,644 13 1,705 8 1,716 9 1,706 4
Perjeta 322 82 337 64 376 57 410 50 439 33
Actemra/RoActemra 334 27 341 23 367 18 390 25 386 14
Tamiflu 376 6 41 61 118 46 170 -67 367 -6
Xolair 281 28 312 27 339 21 345 22 356 22
Lucentis 394 -9 375 -16 373 -18 378 -17 355 -13
Activase/TNKase 221 15 216 16 239 14 259 36 276 21
Tarceva 295 -3 307 -10 292 -7 287 -9 258 -14
Kadcyla 179 80 183 54 196 44 211 36 201 11
CellCept 197 -7 191 -1 194 -4 203 13 189 -4
Esbriet 88 - 141 - 157 - 177 296 178 96
Pulmozyme 146 4 160 15 166 14 180 8 160 7
Mircera 114 17 108 17 147 55 106 -1 118 0
Xeloda 136 -53 124 -29 124 -11 129 -9 111 -17
Rocephin 79 18 63 0 64 -8 73 -1 82 5
Pegasys 168 -39 117 -58 120 -45 133 -32 82 -50
NeoRecormon/Epogin 93 -10 89 -19 90 -8 94 -6 79 -14
Valcyte/Cymevene 100 -41 87 -47 83 -52 99 -41 78 -21
15/18
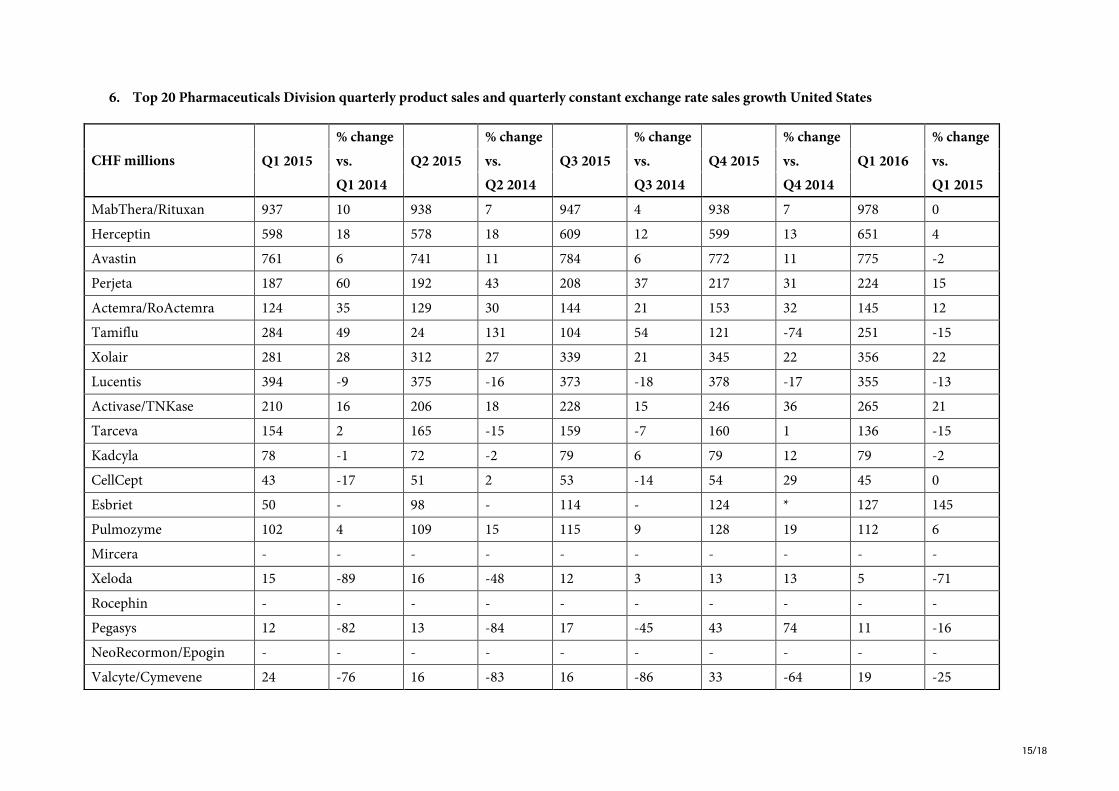
6. Top 20 Pharmaceuticals Division quarterly product sales and quarterly constant exchange rate sales growth United States
CHF millions
% change % change % change % change % change
Q1 2015 vs. Q2 2015 vs. Q3 2015 vs. Q4 2015 vs. Q1 2016 vs.
Q1 2014 Q2 2014 Q3 2014 Q4 2014 Q1 2015
MabThera/Rituxan 937 10 938 7 947 4 938 7 978 0
Herceptin 598 18 578 18 609 12 599 13 651 4
Avastin 761 6 741 11 784 6 772 11 775 -2
Perjeta 187 60 192 43 208 37 217 31 224 15
Actemra/RoActemra 124 35 129 30 144 21 153 32 145 12
Tamiflu 284 49 24 131 104 54 121 -74 251 -15
Xolair 281 28 312 27 339 21 345 22 356 22
Lucentis 394 -9 375 -16 373 -18 378 -17 355 -13
Activase/TNKase 210 16 206 18 228 15 246 36 265 21
Tarceva 154 2 165 -15 159 -7 160 1 136 -15
Kadcyla 78 -1 72 -2 79 6 79 12 79 -2
CellCept 43 -17 51 2 53 -14 54 29 45 0
Esbriet 50 - 98 - 114 - 124 * 127 145
Pulmozyme 102 4 109 15 115 9 128 19 112 6
Mircera - - - - - - - - - -
Xeloda 15 -89 16 -48 12 3 13 13 5 -71
Rocephin - - - - - - - - - -
Pegasys 12 -82 13 -84 17 -45 43 74 11 -16
NeoRecormon/Epogin - - - - - - - - - -
Valcyte/Cymevene 24 -76 16 -83 16 -86 33 -64 19 -25

16/18
7. Top 20 Pharmaceuticals Division quarterly product sales and quarterly constant exchange rate sales growth Europe
CHF millions
% change % change % change % change % change
Q1 2015 vs. Q2 2015 vs. Q3 2015 vs. Q4 2015 vs. Q1 2016 vs.
Q1 2014 Q2 2014 Q3 2014 Q4 2014 Q1 2015
MabThera/Rituxan 452 1 443 -1 455 1 468 3 479 5
Herceptin 508 0 490 -1 502 0 510 4 525 2
Avastin 456 3 435 4 457 5 465 5 471 2
Perjeta 89 140 99 125 114 96 130 74 149 65
Actemra/RoActemra 110 24 114 21 120 19 129 23 131 17
Tamiflu 11 -83 1 478 1 -65 3 455 20 78
Xolair - - - - - - - - - -
Lucentis - - - - - - - - - -
Activase/TNKase - - - - - - - - - -
Tarceva 58 -15 56 -16 54 -20 52 -23 48 -18
Kadcyla 73 229 79 135 83 92 88 49 83 13
CellCept 44 -10 43 -9 44 -10 47 -1 43 -3
Esbriet 32 - 37 - 37 - 46 44 45 36
Pulmozyme 29 2 28 2 29 8 30 8 31 6
Mircera 22 -3 22 -3 21 -1 22 -4 21 -7
Xeloda 13 -59 9 -53 10 -41 10 -30 9 -31
Rocephin 15 14 8 -8 5 -15 9 -27 13 -13
Pegasys 31 -55 24 -58 24 -45 22 -45 19 -40
NeoRecormon/Epogin 39 -10 38 -11 38 -9 38 -6 36 -10
Valcyte/Cymevene 40 -2 37 -8 39 -1 36 -16 30 -26

17/18
8. Top 20 Pharmaceuticals Division quarterly product sales and quarterly constant exchange rate sales growth Japan
CHF millions
% change % change % change % change % change
Q1 2015 vs. Q2 2015 vs. Q3 2015 vs. Q4 2015 vs. Q1 2016 vs.
Q1 2014 Q2 2014 Q3 2014 Q4 2014 Q1 2015
MabThera/Rituxan 52 1 55 28 59 7 64 9 62 12
Herceptin 60 -7 65 22 65 3 70 3 67 5
Avastin 167 4 182 29 189 13 208 12 192 7
Perjeta 18 12 21 21 22 18 23 14 23 18
Actemra/RoActemra 49 1 54 28 57 13 61 10 60 14
Tamiflu 54 -2 -1 -97 - - 12 -75 60 4
Xolair - - - - - - - - - -
Lucentis - - - - - - - - - -
Activase/TNKase - - - - - - - - - -
Tarceva 20 -12 23 8 25 12 24 -1 22 0
Kadcyla 12 - 15 81 15 39 16 23 17 27
CellCept 12 -3 14 8 14 11 16 11 15 11
Esbriet - - - - - - - - - -
Pulmozyme - - - - - - - - - -
Mircera 40 -14 47 23 48 6 54 9 45 4
Xeloda 20 -8 22 22 22 8 25 10 25 12
Rocephin 7 -9 7 1 8 -2 7 -5 6 -10
Pegasys 6 -50 5 -73 2 -82 2 -84 1 -83
NeoRecormon/Epogin 11 -24 12 0 12 -7 12 -9 10 -12
Valcyte/Cymevene - - - - - - - - - -
18/18
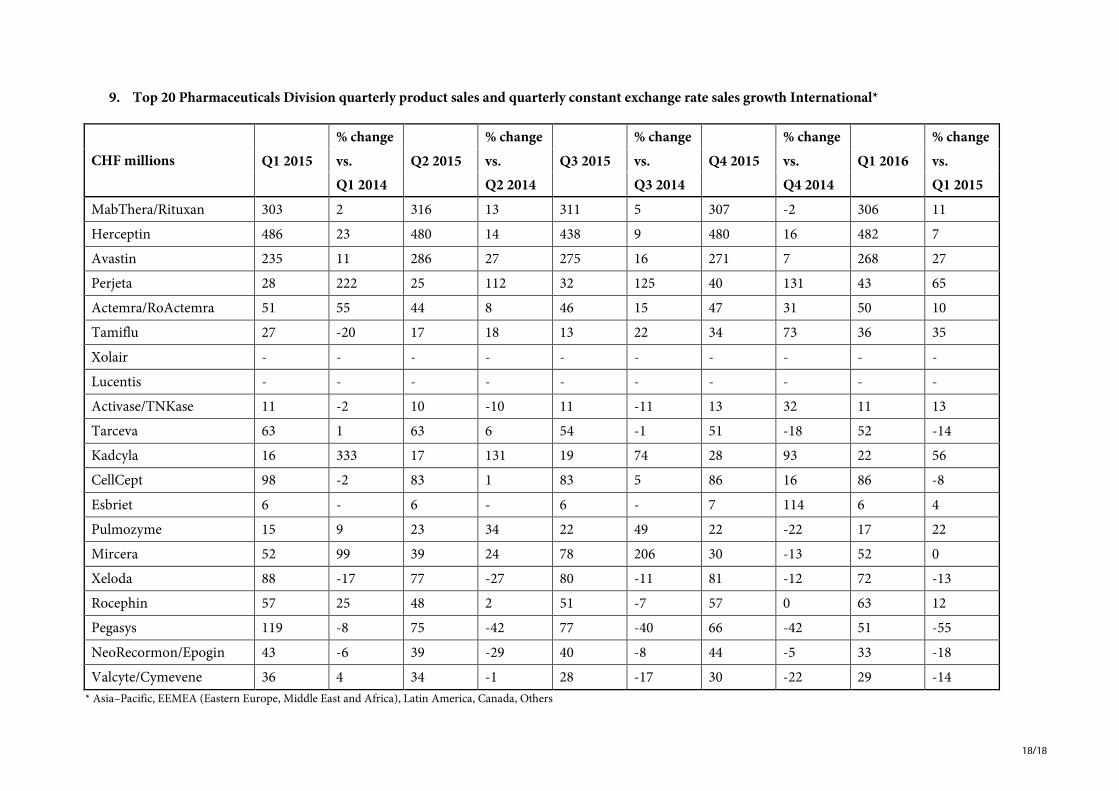
9. Top 20 Pharmaceuticals Division quarterly product sales and quarterly constant exchange rate sales growth International*
CHF millions
% change % change % change % change % change
Q1 2015 vs. Q2 2015 vs. Q3 2015 vs. Q4 2015 vs. Q1 2016 vs.
Q1 2014 Q2 2014 Q3 2014 Q4 2014 Q1 2015
MabThera/Rituxan 303 2 316 13 311 5 307 -2 306 11
Herceptin 486 23 480 14 438 9 480 16 482 7
Avastin 235 11 286 27 275 16 271 7 268 27
Perjeta 28 222 25 112 32 125 40 131 43 65
Actemra/RoActemra 51 55 44 8 46 15 47 31 50 10
Tamiflu 27 -20 17 18 13 22 34 73 36 35
Xolair - - - - - - - - - -
Lucentis - - - - - - - - - -
Activase/TNKase 11 -2 10 -10 11 -11 13 32 11 13
Tarceva 63 1 63 6 54 -1 51 -18 52 -14
Kadcyla 16 333 17 131 19 74 28 93 22 56
CellCept 98 -2 83 1 83 5 86 16 86 -8
Esbriet 6 - 6 - 6 - 7 114 6 4
Pulmozyme 15 9 23 34 22 49 22 -22 17 22
Mircera 52 99 39 24 78 206 30 -13 52 0
Xeloda 88 -17 77 -27 80 -11 81 -12 72 -13
Rocephin 57 25 48 2 51 -7 57 0 63 12
Pegasys 119 -8 75 -42 77 -40 66 -42 51 -55
NeoRecormon/Epogin 43 -6 39 -29 40 -8 44 -5 33 -18
Valcyte/Cymevene 36 4 34 -1 28 -17 30 -22 29 -14
* Asia–Pacific, EEMEA (Eastern Europe, Middle East and Africa), Latin America, Canada, Others