rochester downtown casino
TRANSCRIPT
ROCHESTER DOWNTOWN CASINO
AN ECONOMIC & SOCIAL IMPACT ASSESSMENT
Prepared for: Wilmorite
Kent Gardner, PhD
Project Director
One South Washington Street Suite 400
Rochester, NY 14614 Phone: (585) 325-6360
Fax: (585) 325-2612
100 State Street Suite 930
Albany, NY 12207 Phone: (518) 432-9428
Fax: (518) 432-9489 www.cgr.org
June 2004, rev July 2004
© Copyright CGR Inc. 2004 All Rights Reserved
Research to drive informed decisions.Expertise to create effective solutions.
i
ROCHESTER DOWNTOWN CASINO AN ECONOMIC & SOCIAL IMPACT ASSESSMENT
The possibility of placing casino gambling in Rochester has stimulated heated conversation among residents and community leaders. CGR’s task was to review national research, assess the revenue forecast provided by Wilmorite and objectively discuss the ramifications of locating a casino in Rochester’s downtown. The topic is complex and deserves the kind of serious study enabled by Wilmorite through this study.
CGR concludes that the net economic impact of the casino would be positive for Rochester. Net new job creation, both primary and secondary, could total 1,300 and aggregate payroll could exceed $45 million. The fiscal impacts are also substantial: New York State could earn an additional $23 million per year and the City of Rochester about $11 million. This conforms to national studies documenting positive outcomes for local economies after the arrival of casinos.
The story is not all positive, of course. While many studies purport to link nearly every social ill with gambling, more recent research points out that it is easy to confuse causation with historical trends. Still, several reputable reports demonstrate that problem and pathological gambling does increase with proximity to casino gambling. Furthermore, problem gambling is costly—not only for individuals and families, but for society as well. While most social impacts are difficult to measure monetarily, CGR analysis suggests that the social cost burden consequent on a local casino may reach $10 million annually.
One further question is the impact on the City of Rochester’s tax base. If the Seneca-Cayuga tribe is able to purchase additional city properties and remove them from the tax rolls, any stabilization in property value from the casino may be undone. In 2001 the Sibley
SUMMARY
ii
and Midtown properties themselves were assessed at $29 million and incurred tax and payment-in-lieu-of-tax liabilities of $1.3 million.
Finally, the conduct of the proposed casino will alter its impact on existing businesses. If all services required by casino patrons are provided within the casino facility, the spillover impact on downtown will be negligible. Moreover, if facilities within the casino compete for existing downtown trade, the viability of local food, beverage and lodging business could be threatened.
Contributing Staff
Rebecca Sumner, Research Associate
Marilyn Klotz, Research Associate
iii
Summary..................................................................................................i Table of Contents................................................................................... iii Introduction............................................................................................1
Casino Gaming in Central & Western New York ...................................................... 1 The Rochester Proposal ....................................................................................... 2
Economic Impact on Rochester Metro Economy ....................................2 Economic Benefit Comes From Net Increase in Jobs & Income................................ 2 Sizing the Rochester Market ................................................................................. 3
Primary Impact ................................................................................................ 3 Secondary Impacts........................................................................................... 5 Public Sector Payments..................................................................................... 5 Other Economic Effects..................................................................................... 7
Positive Impacts ........................................................................................... 7 Negative Impacts.......................................................................................... 7
Forecast Risk ...................................................................................................... 9 Economic Impact Findings From Research Outside Rochester...............9
Analysis of 100 Communities With and Without Casino Gaming ............................. 10 Case Studies of Ten Communities With Recent Casino Siting................................. 12
Social Impacts ......................................................................................13 Association Between Problem Gambling & Casino Proximity .................................. 13 Applying Research Findings to Rochester............................................................. 16 Consequences of Problem Gambling ................................................................... 16
Physical and Mental Health ............................................................................. 16 Impact on Families ......................................................................................... 17
Crime ............................................................................................................... 18 Calculating Crime Rates .................................................................................. 18 Prostitution.................................................................................................... 18 Drug Arrests .................................................................................................. 19 Organized Crime ............................................................................................ 19
Casino Gaming in the United States .....................................................20
Conclusion ............................................................................................22 Benefits ............................................................................................................ 22 Costs................................................................................................................ 23
TABLE OF CONTENTS

iv
1
The Seneca-Cayuga Nation of Oklahoma has successfully pursued its claim to a substantial quantity of land on Cayuga Lake. The validity of the claim has been upheld in court although the value of the settlement is currently pending with the federal appellate court. One settlement option being proposed would exchange the land in dispute for the Midtown Plaza site in downtown Rochester on which the tribe will build and operate a Class III casino. Working with the Nation has been Rochester developer Wilmorite.
The scale and configuration considered in this report includes slot or video lottery terminal (VLT) devices, table games, a bingo hall plus ancillary dining, entertainment and retail facilities. The proposal envisions integrating performing arts space into the facility, but this component does not enter into the social and economic impact analysis.
Employment and payroll estimates for the planned casino are based on a CGR analysis of a market study conducted for Wilmorite by Gaming & Resort Development, Inc.
Rochester is a relative latecomer to casino gaming in New York State. Turning Stone, a facility 35 miles east of Syracuse and run by the Oneida Indian Nation, opened in 1993 and has estimated annual revenue of $180 million. Last year the casino began a $308 million expansion that will include a 70,000 square foot expansion to the main building plus ancillary structures. Seneca Niagara, operated by the Seneca Indian Nation, opened on New Year’s Eve 2002. Based on a recent report in the Buffalo News, total annual revenue at Seneca Niagara is about $245 million.
Just over the Canadian border in Ontario are Casino Niagara and slot machines at the Fort Erie Race Track. Opened in 1996, Casino Niagara’s gaming volume exceeds $400 million. Fort Erie Race Track added 1,200 slots in 1999 and has estimated volume of over $100 million.
Two additional Seneca properties in Western New York are located in Irving and Salamanca, both focused on table games. The Salamanca facility was just expanded as a Class III facility
INTRODUCTION
Casino Gaming in Central & Western New York
2
called Seneca Allegany with 1,700 video and reel slots and table games.
Only this year the Finger Lakes Race Track and Buffalo Raceway added video lottery terminals (VLTs). Batavia Downs was scheduled to open its VLT facility later this year, although it has yet to find financing. Fallsview, a larger companion facility to Casino Niagara in Niagara Falls, Ontario, opened June 8. A second Seneca Class III casino is planned for the Buffalo area with Cheektowaga as the most likely site at the time of this writing.
The revenue estimates used for this analysis are based on a Palermo Gaming configuration consisting of 2,800 slot machines/VLTs, 150 positions at gaming tables and 1,000 seats for bingo/pull tabs/keno. Deliberations among the Seneca-Cayuga Nation, New York State and Wilmorite will certainly influence the final configuration. As currently proposed, the casino would be located in a combination of the Midtown Plaza site and the existing Sibley Building with a connecting walkway. An on-site performing arts facility—with a connection to the proposed Renaissance Center—is also being considered.
A net economic benefit is only achieved if a given project expands the size of the economy by increasing the total output of goods and services and the aggregate payroll of the residents. If a new business sells none of its output to local residents, then its entire output and payroll can be considered an economic benefit. At the other extreme, a new business that sells all of its production to local residents is probably displacing much or all the output of some other business firm already in the community.
It is common to illustrate the difference as a “factory v. restaurant” impact. Manufacturers typically sell the bulk of their produce outside the region, thus adding to regional income; restaurants typically sell the bulk of their produce within the region, thus redistributing regional income but not adding to the total. Good discussions of the challenge of assessing the economic
The Rochester Proposal
ECONOMIC IMPACT ON ROCHESTER METRO ECONOMY
Economic Benefit Comes From Net Increase in Jobs & Income
3
impact of gaming are found in National Academy of Sciences (p. 5-1) and Rose (p. 5).
A casino is a mix of the two types. The principal challenge of this study will be to develop soundly-based assumptions about the net effect of the proposed casino on the Rochester economy.
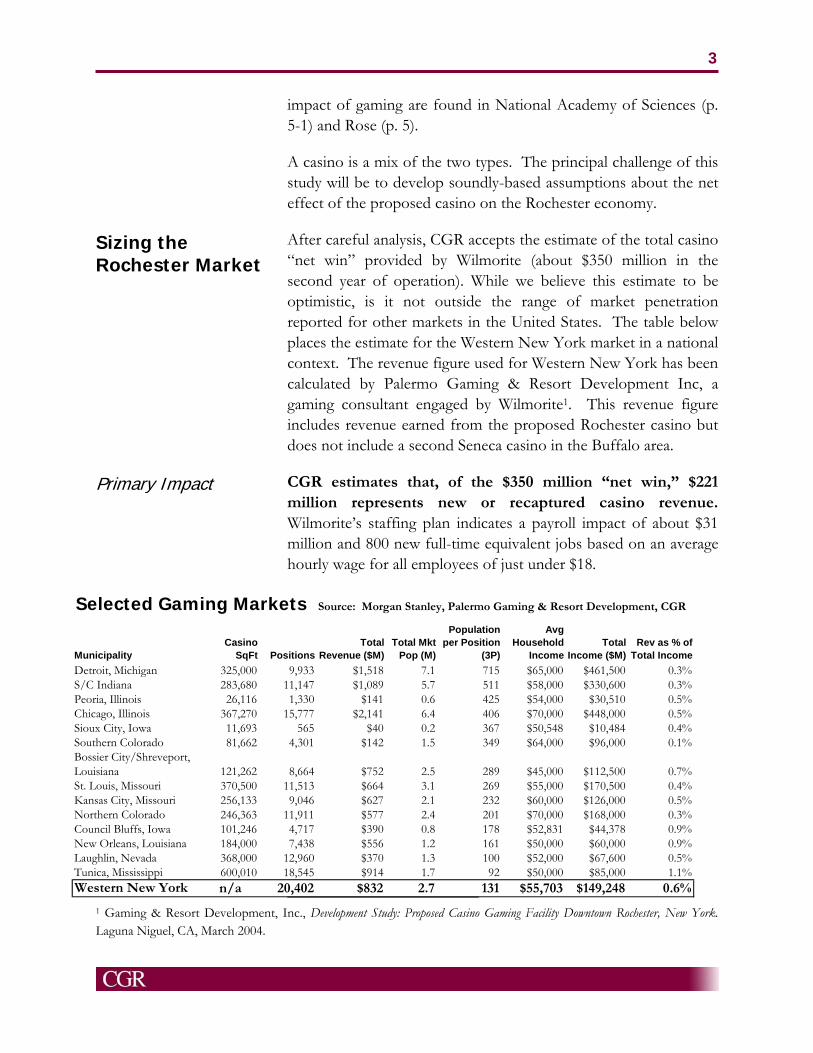
After careful analysis, CGR accepts the estimate of the total casino “net win” provided by Wilmorite (about $350 million in the second year of operation). While we believe this estimate to be optimistic, is it not outside the range of market penetration reported for other markets in the United States. The table below places the estimate for the Western New York market in a national context. The revenue figure used for Western New York has been calculated by Palermo Gaming & Resort Development Inc, a gaming consultant engaged by Wilmorite1. This revenue figure includes revenue earned from the proposed Rochester casino but does not include a second Seneca casino in the Buffalo area.
CGR estimates that, of the $350 million “net win,” $221 million represents new or recaptured casino revenue. Wilmorite’s staffing plan indicates a payroll impact of about $31 million and 800 new full-time equivalent jobs based on an average hourly wage for all employees of just under $18.
1 Gaming & Resort Development, Inc., Development Study: Proposed Casino Gaming Facility Downtown Rochester, New York. Laguna Niguel, CA, March 2004.
Sizing the Rochester Market
Primary Impact
Selected Gaming Markets Source: Morgan Stanley, Palermo Gaming & Resort Development, CGR
MunicipalityCasino
SqFt PositionsTotal
Revenue ($M)Total Mkt
Pop (M)
Population per Position
(3P)
Avg Household
IncomeTotal
Income ($M)Rev as % of
Total IncomeDetroit, Michigan 325,000 9,933 $1,518 7.1 715 $65,000 $461,500 0.3%S/C Indiana 283,680 11,147 $1,089 5.7 511 $58,000 $330,600 0.3%Peoria, Illinois 26,116 1,330 $141 0.6 425 $54,000 $30,510 0.5%Chicago, Illinois 367,270 15,777 $2,141 6.4 406 $70,000 $448,000 0.5%Sioux City, Iowa 11,693 565 $40 0.2 367 $50,548 $10,484 0.4%Southern Colorado 81,662 4,301 $142 1.5 349 $64,000 $96,000 0.1%Bossier City/Shreveport, Louisiana 121,262 8,664 $752 2.5 289 $45,000 $112,500 0.7%St. Louis, Missouri 370,500 11,513 $664 3.1 269 $55,000 $170,500 0.4%Kansas City, Missouri 256,133 9,046 $627 2.1 232 $60,000 $126,000 0.5%Northern Colorado 246,363 11,911 $577 2.4 201 $70,000 $168,000 0.3%Council Bluffs, Iowa 101,246 4,717 $390 0.8 178 $52,831 $44,378 0.9%New Orleans, Louisiana 184,000 7,438 $556 1.2 161 $50,000 $60,000 0.9%Laughlin, Nevada 368,000 12,960 $370 1.3 100 $52,000 $67,600 0.5%Tunica, Mississippi 600,010 18,545 $914 1.7 92 $50,000 $85,000 1.1%Western New York n/a 20,402 $832 2.7 131 $55,703 $149,248 0.6%
4
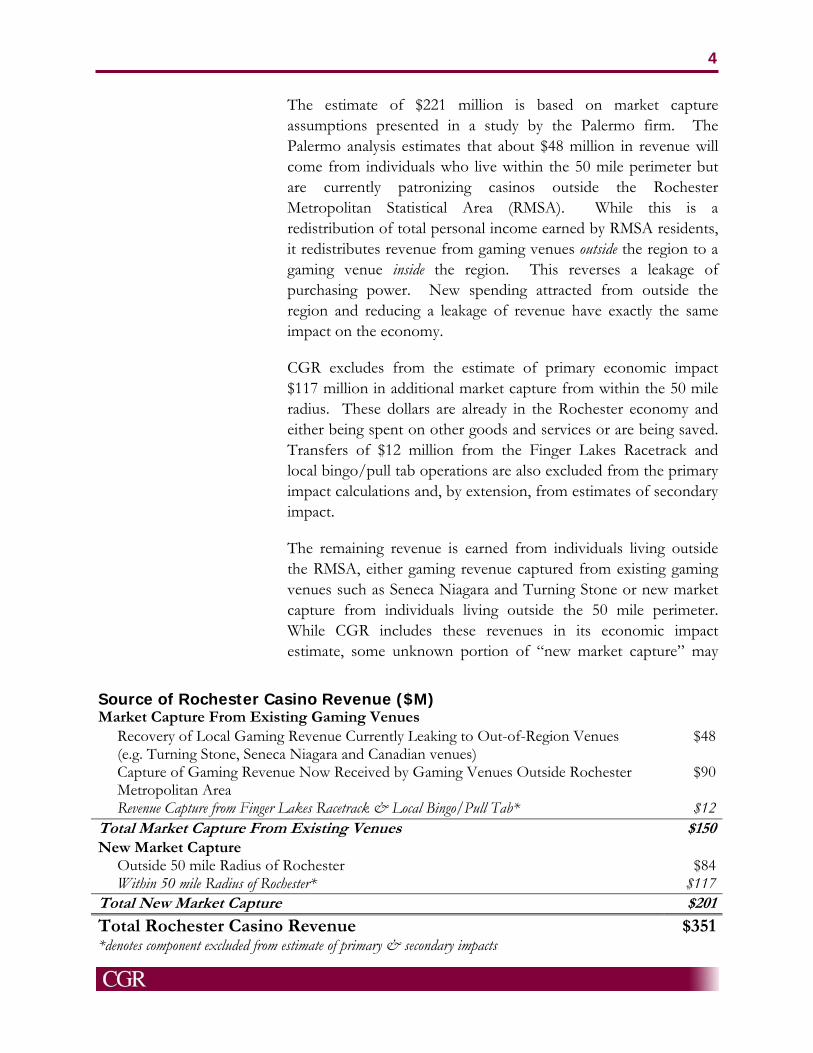
The estimate of $221 million is based on market capture assumptions presented in a study by the Palermo firm. The Palermo analysis estimates that about $48 million in revenue will come from individuals who live within the 50 mile perimeter but are currently patronizing casinos outside the Rochester Metropolitan Statistical Area (RMSA). While this is a redistribution of total personal income earned by RMSA residents, it redistributes revenue from gaming venues outside the region to a gaming venue inside the region. This reverses a leakage of purchasing power. New spending attracted from outside the region and reducing a leakage of revenue have exactly the same impact on the economy.
CGR excludes from the estimate of primary economic impact $117 million in additional market capture from within the 50 mile radius. These dollars are already in the Rochester economy and either being spent on other goods and services or are being saved. Transfers of $12 million from the Finger Lakes Racetrack and local bingo/pull tab operations are also excluded from the primary impact calculations and, by extension, from estimates of secondary impact.
The remaining revenue is earned from individuals living outside the RMSA, either gaming revenue captured from existing gaming venues such as Seneca Niagara and Turning Stone or new market capture from individuals living outside the 50 mile perimeter. While CGR includes these revenues in its economic impact estimate, some unknown portion of “new market capture” may
Source of Rochester Casino Revenue ($M) Market Capture From Existing Gaming Venues Recovery of Local Gaming Revenue Currently Leaking to Out-of-Region Venues
(e.g. Turning Stone, Seneca Niagara and Canadian venues) $48
Capture of Gaming Revenue Now Received by Gaming Venues Outside Rochester Metropolitan Area
$90
Revenue Capture from Finger Lakes Racetrack & Local Bingo/Pull Tab* $12 Total Market Capture From Existing Venues $150 New Market Capture Outside 50 mile Radius of Rochester $84 Within 50 mile Radius of Rochester* $117 Total New Market Capture $201
Total Rochester Casino Revenue $351 *denotes component excluded from estimate of primary & secondary impacts
5
displace revenue to other Rochester-area entertainment venues, e.g. restaurants or arts and cultural activities.
CGR relied solely on employment estimates provided by the developer to forecast direct labor income and indirect employment labor income. As 63% of the revenue to the casino is considered either new to the Rochester economy or the elimination of an existing leakage from the Rochester economy, CGR reduced estimated employment accordingly. Employment and payroll estimates were based on
Casino employment of 445
Food & beverage employment of 190
Other service employment of 165
Were RMSA average payroll for each category of employment used to estimate total new payroll, the total would be approximately $17.4 million, less than anticipated by the developer. The difference can be accounted for by gratuities unreported in the underlying data used by CGR plus differences in expected salaries. If actual wages paid to casino workers to fall short of the values proposed, the direct payroll impact would be less than the forecast $30.5 million.
As the $221 million in revenue would either be new to the Rochester economy or represent a reduction in the leakage presently occurring, it would stimulate additional employment and income. Indirect impacts are those stimulated by the spending of the casino itself; induced impacts are a consequence of the spending of employees.
New employment of about 800 jobs (in the categories indicated above) would stimulate secondary impacts of nearly 500 jobs plus labor income of about $15 million to the Rochester economy.
The compact between the State of New York and the Seneca-Cayuga Nation would specify how the State of New York would benefit monetarily from entering into the compact. At Seneca Niagara, the State of New York receives 18% of the revenue generated by the slot machines and distributes one quarter of its
Secondary Impacts
Public Sector Payments
6
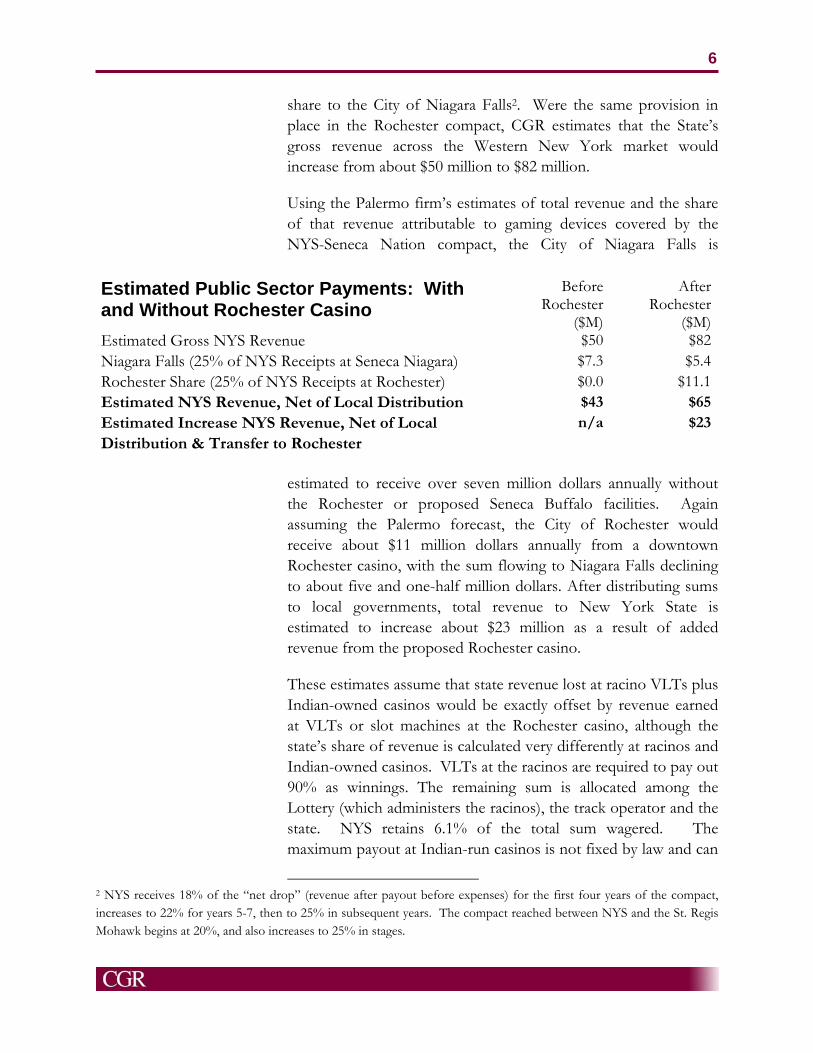
share to the City of Niagara Falls2. Were the same provision in place in the Rochester compact, CGR estimates that the State’s gross revenue across the Western New York market would increase from about $50 million to $82 million.
Using the Palermo firm’s estimates of total revenue and the share of that revenue attributable to gaming devices covered by the NYS-Seneca Nation compact, the City of Niagara Falls is
estimated to receive over seven million dollars annually without the Rochester or proposed Seneca Buffalo facilities. Again assuming the Palermo forecast, the City of Rochester would receive about $11 million dollars annually from a downtown Rochester casino, with the sum flowing to Niagara Falls declining to about five and one-half million dollars. After distributing sums to local governments, total revenue to New York State is estimated to increase about $23 million as a result of added revenue from the proposed Rochester casino.
These estimates assume that state revenue lost at racino VLTs plus Indian-owned casinos would be exactly offset by revenue earned at VLTs or slot machines at the Rochester casino, although the state’s share of revenue is calculated very differently at racinos and Indian-owned casinos. VLTs at the racinos are required to pay out 90% as winnings. The remaining sum is allocated among the Lottery (which administers the racinos), the track operator and the state. NYS retains 6.1% of the total sum wagered. The maximum payout at Indian-run casinos is not fixed by law and can
2 NYS receives 18% of the “net drop” (revenue after payout before expenses) for the first four years of the compact, increases to 22% for years 5-7, then to 25% in subsequent years. The compact reached between NYS and the St. Regis Mohawk begins at 20%, and also increases to 25% in stages.
Estimated Public Sector Payments: With and Without Rochester Casino
Before Rochester
($M)
After Rochester
($M)Estimated Gross NYS Revenue $50 $82 Niagara Falls (25% of NYS Receipts at Seneca Niagara) $7.3 $5.4 Rochester Share (25% of NYS Receipts at Rochester) $0.0 $11.1 Estimated NYS Revenue, Net of Local Distribution $43 $65 Estimated Increase NYS Revenue, Net of Local Distribution & Transfer to Rochester
n/a $23
7
exceed 90%. Some casinos promote so-called “high stakes” slot machines with payouts of 98%.
The Palermo firm assumes that about $65 million in revenue to the Rochester casino would come from a reduction in trade at Canadian gaming facilities, thus reducing revenue to the Province of Ontario.
In addition to the increase in aggregate personal income, there are both positive and negative distributional impacts from locating a casino in Rochester’s downtown. How a casino is structured and managed has a great deal to do with whether it has positive or negative neighborhood effects.
A portion of the casino’s revenue will come from a reallocation of current spending from other businesses in the metropolitan area to the casino site. This reallocation would, to a degree, reverse the flow of entry-level retail and service employment from the city center to suburban shopping districts.
The majority of the jobs at the casino would be entry level positions, ideal for “welfare to work” transitional employment. As the public transportation infrastructure of the community remains largely a “hub and spoke” design, adding entry level positions in the center city would improve job opportunities for those who need them the most.
National comparisons of communities with and without casinos have reported a reduction in the unemployment rate and reduced dependency on cash assistance in those communities with casinos.
New income generated by the casino both directly and indirectly will result in added sales and income tax revenue to state and local governments.
The proposed casino would address concentrated building vacancy in the vicinity of Main & Clinton. The Midtown complex of buildings is particularly difficult to redevelop.
Proprietors’ income would leak from the Rochester economy. Ordinarily, trade flowing from one business to another within an economy is considered to be simply a reallocation of trade from one group of business owners to another group of business owners, thus of no consequence for the size of the economy. This
Other Economic Effects
Positive Impacts
Negative Impacts
8
amount is estimated to be just under $130 million ($12 million captured from Finger Lakes Racetrack and $117 million in new market capture from Rochester area residents). Of this total, the developer estimates that $18 million will flow to Rochester residents in the form of wages and salaries. Additional sums will be spent by the casino on local goods and services.
Net revenue after expenses, however, will flow to the casino owners. In this instance, the owners of the casino are not resident in the community and the proprietors’ income would definitely flow out of Rochester. Although it is likely that this leakage would be greater in the case of a casino, the leakage from many other forms of spending is also substantial.3
Credible research has shown that there is a consistent pattern of economic loss for specific industries, particularly food and beverage establishments, as a consequence of the establishment of a casino.
It is common practice for casino properties to establish food, drink and retail facilities that are designed to attract patronage to the casino. If this strategy is pursued in Rochester, existing downtown food, drink and retail establishments are likely to suffer a loss of business, with a cascading impact on property values and property taxation. Economic benefits may be highly concentrated at the casino site.
Implications of the proposed Rochester casino for the lodging industry depend on whether new lodging is added as part of the casino complex or if additional visitation reduces the relatively high vacancy rate among Rochester’s downtown hotels. The market study conducted by Palermo Gaming & Resort Development, Inc. does not forecast a significant increase in overnight visitation as a result of the construction of the casino. Additional lodging capacity incorporated into the casino would very likely increase vacancy rates among existing facilities and reduce hotel and motel tax receipts.
Both the Sibley and Midtown structures would be removed from the tax rolls. It is possible that replacing vacant and deteriorating structures with a casino could stabilize the value of adjacent
3 Profit from purchases at national retailers flow to nonresident owners or geographically disbursed stockholders. Or consider the purchase of a new car—only a very small share of the purchase price is retained in the local economy.
9
properties, offsetting the loss of Sibley and Midtown partially or wholly. In 2001 the Sibley and Midtown properties themselves were assessed at $29 million and incurred tax and payment-in-lieu-of-tax liabilities of $1.3 million.
Were the Memorandum of Understanding between the State of New York and the Seneca-Cayuga Nation to permit the acquisition of additional lands within the City of Rochester, additional properties could leave the tax rolls.
The following caveats apply to this analysis:
The estimates of potential total market and Rochester casino market capture presented in the Palermo study are at the high end of the probable range. Secondary and fiscal impacts would be smaller in the face of lower primary revenue.
Wages and salaries forecast by the developer may be higher than actual wages and salaries paid by an operating casino.
Were the Seneca Nation to build an additional casino in western New York—particularly at the eastern edge of the Buffalo metropolitan area—total revenue to a Rochester casino would fall. The Seneca-Cayuga nation is also considering casino in the City of Auburn. This, too, would reduce revenue to the Rochester facility.
Recent and proposed additions to the western New York market (including Seneca Allegany, Niagara Fallsview and a possible Seneca Buffalo) will move the market toward saturation. As the market becomes more competitive, individual casino operators may choose to increase the payout on gaming devices as a way of preserving market share, thus reducing “net drop” and revenue to NYS and local governments.
Economic impact assessments of casinos generally conclude that the net effect is positive. Adam Rose, in his review of 100 economic impact studies on behalf of the National Gambling Impact Study Commission (NGISC) concludes,
Forecast Risk
ECONOMIC IMPACT FINDINGS FROM RESEARCH
OUTSIDE ROCHESTER
10
[T]he preponderance of evidence indicate that the aggregate direct and indirect impacts of the construction, operation and taxation of casinos are significantly positive. Broader economic costs relating to such factors as the use of government services and changes to property values are not insignificant, but they do not come close to canceling out the more conventional output, income, and employment gains (p.4)4.
Rose observes that many of the studies he examined exaggerate the benefits, however, principally by paying too little attention to the problem of substitution, the displacement of other spending for spending at the casino.
In another study commissioned by NGISC, the National Opinion Research Center (NORC) of the University of Chicago (along with the Lewin Group and Gemini Research) conducted a statistical analysis of 100 communities with and without casinos over the period 1980-1997. On average across the communities and this extended time frame, the presence of a casino increased net employment and reduced economic dependency. 5.
Five communities were within 50 miles of a casino at the beginning of the study period; a casino opened nearby during the study period in an additional 40 communities. The study communities had a combined population of 42 million persons, 46% of which were in the 45 communities in close proximity to a casino in 1997. The study examines selected economic and social indicators in communities within and without casino proximity and the set of casino-proximate communities before and after the casino began operation.
The statistical procedure was designed to determine whether differences among communities across set of social and economic indicators could be explained by the existence of the casino6. The
4 Rose, Adam, Regional Economic Impacts of Casino Gambling. NGISC, Nov. 1998. 5 Gerstein, D., Murphy, S., Toce, M., Hoffmann, J., Palmer, A., Johnson, R., Larison, C., Chuchro, L., Bard, A., Engelman, L., Hill, M. A., Buie, T., Volberg, R., Harwood, H., Tucker, A., Christiansen, E., Cummings, W., & Sinclair, S. (1999). Gambling Impact and Behavior Study: Report to the National Gambling Impact Study Commission. Chicago: National Opinion Research Center. 6 Outcome measures included three indicators of bankruptcy, seven crime indicators, five employment indicators, one health indicator and a number of income and earnings indicators.
Analysis of 100 Communities With and Without Casino Gaming
11
researchers conducted their analysis in two stages. Initially, they tested for a simple association between the presence of a casino and the outcomes measured in the study, finding that casinos and negative social and economic outcomes were indeed statistically associated. The NORC/Lewin/Gemini researchers acknowledged, however, that a simple association did not sufficiently control for general social trends over time. The second statistical test applied a procedure to control for changes over time that were common to communities with and without casinos (e.g. broad trends in the crime rate or bankruptcy filings).
They discovered that many of the differences between communities that had been attributed to the presence of the casinos were instead explained by the different years in which the casinos had opened. After adjusting for general social trends, a statistically significant association was present between communities with and without casinos for the following outcome measures:
Employment
The unemployment rate was 12% lower in communities with casinos.
The share of employment in local government and retail trade declined 2% and 3%, respectively, in communities with casinos.
The share of employment in construction was 1% higher in casino communities.
Income & earnings per capita
Income maintenance (welfare), unemployment insurance and transfer payments fell 13%, 3% and 17%, respectively, in casino communities (on a per capita basis).
Private earnings in construction, hotels and lodging, and recreation and amusement rose 18%, 43% and 22%, respectively, in casino communities.
Private earnings in restaurants and bars fell 19% in casino communities.
As the authors emphasize, there was no statistically significant association between the proximity of a casino and the remaining indicators does not mean that the relationship does not exist, but
12
that the change is not large enough to be distinguishable from changes in other measures or that negative effects have been mitigated by policy or program changes put in place at the time the casino opened. Other possible impacts were either unmeasurable for these communities or simply excluded by the decision of the researchers.
The NORC/Lewin/Gemini researchers identified ten communities in which a casino had opened within the previous nine years. Seven or eight informants from each community were selected (according to their longevity in the community and professional positions) and interviewed by NORC/Lewin/Gemini staff. The experience of the ten communities (names of which are kept confidential) varies widely. Themes highlighted in the report include:
Economic Outcomes
Five reported a significant increase in new employment opportunities for local people. Others reported that unemployment remained a problem.
Most reported some dissatisfaction with the quality of jobs. The majority new jobs were low paying, often part time and without benefits.
Six communities reported an increase in funds for local government. Five reported an increase in construction activity. Improvement in property values, the lodging industry, charitable contributions, and retail trade was reported in at least two communities.
Nine communities reported an increase in debt problems and/or bankruptcies, although some believed that the casino had attracted individuals to the community who were already financially troubled but hoped to improve their situation at the casino.
Some case study communities mentioned problems with low income housing, homelessness and a large number of working poor.
Six communities mentioned an increase in domestic violence and substance abuse, some suggesting that substance abuse and compulsive gambling were associated.
Case Studies of Ten Communities With Recent Casino Siting
13
The NORC/Lewin/Gemini researchers included more extensive case studies of two communities they found typical of the experience of study communities. These descriptions are instructive (NORC, p.73)
In the public mind, gaming has long been associated with a host of social ills including organized crime, prostitution, substance abuse, family dissolution, bankruptcy and others. The truth or falsity of these historic associations aside, the relevant question is whether casinos typically and inevitably bring with them other problems. Even if these problems prove to be modest, any costs associated with social impacts should be weighed against estimated benefits.
Many studies have explored whether social dysfunction has been caused by casinos or if the decision to welcome casino gaming was prompted by weak economic conditions and pre-existing strain on a community’s social fabric. Unfortunately, discerning causation is more difficult than measuring simple association. In 1998, the National Academy of Science, in its study of pathological gambling conducted at the behest of NGISC, stated “Overall…much of the available research on all aspects of pathological gambling is of limited scientific value.”7 (p. 7)
Much of the research solicited by the Commission and performed subsequent to 1998 has attempted to address this deficiency. As the gaming industry has matured and expanded, the diversity and longevity of casino gambling has provided researchers with more robust data. For the purposes of the present analysis, other components of the previously-cited NORC/Lewin/Gemini study are probably the most important8. This study identified a consistent and statistically valid association between the rates of
7Committee on the Social and Economic Impact of Pathological Gambling, Committee on Law and Justice, Commission on Behavioral and Social Sciences and Education, National Research Council. Pathological Gambling: A Critical Review. National Academy Press, Washington, D.C. 1999 8 Gerstein, D., Murphy, S., Toce, M., Hoffmann, J., Palmer, A., Johnson, R., Larison, C., Chuchro, L., Bard, A., Engelman, L., Hill, M. A., Buie, T., Volberg, R., Harwood, H., Tucker, A., Christiansen, E., Cummings, W., & Sinclair, S. (1999). Gambling Impact and Behavior Study: Report to the National Gambling Impact Study Commission. Chicago: National Opinion Research Center.
SOCIAL IMPACTS
Association Between Problem Gambling & Casino Proximity
14
problem and pathological gambling and the proximity of casino gambling.
Although the NORC/Lewin/Gemini study found a statistically valid association between proximity to a casino and the prevalence of problem and pathological gambling among individuals, the actual percentage of cases remains very small. In fact, NORC/Lewin/Gemini was unable to detect a statistically significant association between the presence of a casino and community-wide indicators of social dysfunction, e.g. divorce rates, health impacts, and others. Thus while these problems are real and costly for individuals, the number of problem and pathological gamblers is not large enough to be detectable at a community level of aggregation.
The NORC/Lewin/Gemini study of the social impacts on individual gamblers was based on the combination of a random telephone questionnaire and an in-person enumeration of casino patrons. The study estimated the prevalence of problem and pathological gambling based on proximity to a casino. According to the NORC/Lewin/Gemini report, approximately 2.5% of the U.S. population is classified as pathological gamblers or problem gamblers (i.e. people who gamble excessively, but whose behavior does not meet the definition of a mental illness.) Living within 50 miles of a casino increases the lifetime prevalence of problem gambling from 1.2% of the population to 2.3% and of pathological gambling from 0.9% to 2.1% (NORC, p.27). For the Rochester Metropolitan Statistical Area, this implies about 12,500 problem gamblers and 14,700 pathological gamblers. In addition, the same proximity to a casino is associated with a 40% rate of past year gaming among adults compared to a 23% rate of gaming among those living farther from the casino. (NORC, p. ix).
The same study estimated annual and lifetime costs associated with problem and pathological gambling. Society can expect annual costs of $715 per problem gambler and almost $1,200 per pathological gambler (NORC, p.52). The researchers estimate the total cost of other events found more likely to occur within the lifetime of the problem gambler, a sum totaling just over $5,000 for the problem gambler and twice this amount for the

15
pathological gambler. The researchers acknowledge that other costs are real but nonmonetary:
[M]any of the human burdens of pathological and problem gambling are not so readily quantifiable into dollars, for conceptual and practical reasons. For example, we calculated the cost of divorce in terms of the legal fees generated to complete divorce actions through the court system. The cost in legal fees hardly begins to capture all of the social and psychological meaning of divorce for the partners and families directly involved, and for society as a whole. The economic costs that we calculated are a lower bound. Without a substantially greater research base on the characteristics and consequences of pathological and problem gambling, it is impossible to say with precision where the upper bound or midpoint of economic impact would lie. (NORC, p.54-55).
More recently, the June 2004 issue of Psychology of Addictive Behaviors published a study that modeled addictive gambling much like contact with toxic substances in terms of dose, potency and exposure. The index they constructed showed that higher contact (in terms of the number of gambling establishments, types of legal gambling available and the length of time gambling has been available) is associated with higher rates of problem and pathological gambling9. A study conducted at Creighton University and also published in June 2004 identified a statistically significant association between an increase in personal bankruptcies and the existence of a casino.10
Similarly, the Creighton study observed that while personal bankruptcy rates doubled in counties with casinos, business bankruptcies actually fell by more than one third. Apparently casinos have an ambiguous impact on the economic landscape.
9 Shaffer, H. J., LaBrie, R. A., & LaPlante, D. (2004). Laying the foundation for quantifying regional exposure to social phenomena: considering the case of legalized gambling as a public health toxin. Psychology of Addictive Behaviors, 18(1), 40-48. 10 Goss, E.; Morse, E. (2004). The Impact of Casino Gambling on Bankruptcy Rates: A County Level Analysis, Creighton University.
16
A simplistic application of the NORC/Lewin/Gemini findings to Rochester would suggest a doubling of problem and pathological gambling incidence as a consequence of establishing the new casino, thus within the 50 mile perimeter identified in the study. CGR believes that such a direct application to Rochester would be inappropriate for the following reasons:
While Seneca Niagara and Turning Stone are clearly outside the 50 mile radius used by the NORC/Lewin/Gemini study, they are far closer to the 50 mile boundary than to the 250 mile outer boundary. The data presented in the study are not precise enough to allow finer distinctions.
The Finger Lakes Racetrack, while not a Class III facility, has already introduced legal gaming.
The NORC/Lewin/Gemini researchers did not adjust for the presence of a state lottery, another opportunity for potential problem or pathological gamblers to get into trouble.
Because of these concerns, CGR has cut the estimate of the cost of problem and pathological gambling in half relative to what would be estimated from a straightforward extrapolation of the NORC/Lewin/Gemini findings.
Even with this adjustment, the NORC/Lewin/Gemini findings suggest that the annual cost of problem and pathological gambling could rise as much as $10 million annually, although the costs would be disbursed across all levels of government and private social welfare agencies. This estimate does not include any estimates for “lifetime” costs, as described by the NORC/Lewin/Gemini study.
Problem gambling has been associated with a number of serious health effects. For example, problem gamblers are at greater risk for such mental health conditions as major depression, anti-social personality disorder and phobias. They are also more likely to abuse alcohol, nicotine, and other drugs. Pathological gamblers report ever having experienced a “depressive episode” at a rate of nearly 20 times that of their non-gaming counterparts (NORC, p.30). While gamblers are not any more likely than the general
Applying Research Findings to Rochester
Consequences of Problem Gambling
Physical and Mental Health

17
population to commit suicide, they face other physical health risks, including a greater risk for cardiac arrest due to higher levels of stress and high blood pressure. Problem gamblers were more likely to report financial and relationship problems. In addition, problem gamblers suffered higher levels of alcohol dependence, stress, emotional distress, past depression and suicide contemplation compared with non-gamblers and low-risk gamblers.
Problem and pathological gambling can have a negative effect on family and social relationships. Fifty-four percent of identified pathological gamblers report having been divorced compared with 18 percent of non-gamblers. Divorce has financial consequences for mothers and their children; by one estimate, women with minor children experience a 73% decline in their standard of living the first year after divorce (NORC, p.49). Other studies have found that children from divorced households have lower academic and occupational achievement. Such costs last a lifetime and yet no study has been able to quantify the expense relative to the divorce rate of gamblers. Children of problem gamblers report higher rates of certain negative behaviors11. These children were more likely than children of non-problem gamblers to report using tobacco, alcohol and other drugs, except marijuana. Children of problem gamblers are more likely to gamble than are children of non-problem gamblers. Problem and pathological gamblers are more likely than their non-gaming counterparts to have declared bankruptcy. (NORC, p.58)
The General Accounting Office (GAO) conducted a study of gambling outcomes in Atlantic City, New Jersey.12 Although Atlantic City, as a well-established destination gaming venue, is noncomparable to the proposed Rochester facility in many ways, the GAO report places in perspective many statistics that have been cited from Atlantic City and are presumed to apply to other gaming venues.
11 Jacobs, D.F., Marston, A.R, Singer, R.D., Widaman, K., Little, T., &Veizades, J. (1989). “Children of Problem Gamblers”, Journal of Gaming Behavior, 5, 261-267. as cited in The Wager 1(16), “Elevated Substance Use & Gaming Among Children of Problem Gamblers”, www.thewager.org accessed on February 10, 2004. 12 Ungar, Bernard & John Baldwin, Impact of Gambling: Economic Effects More Measurable Than Social Effects. United States General Accounting Office, April 2000.
Impact on Families
18
Although the GAO reports that incidents of domestic violence in Atlantic County (home to Atlantic City) have generally been higher than those for the rest of New Jersey, although data reporting incidents of domestic violence from pre-casino years (prior to 1978) are not available (GAO, p.28), making causation difficult to determine. Statistics that are available on domestic violence, child abuse, divorce and the frequency of single-parent households followed no consistent pattern after the introduction of casino gaming in Atlantic City. In some years, rates rose; in others, they fell. Reports of child abuse or neglect related to casino gaming are often linked to cases of children who have been left alone in cars while parents or guardians gamble. The GAO was unable to report on specific, substantiated cases of child abuse in Atlantic City because national reporting of child abuse commenced in 1990, is done on a voluntary basis, and data on Atlantic City was not “readily available” (GAO, p.30) Nevertheless, while reports of substantiated child abuse or neglect in Atlantic County reached a high of 47 in 1987, over the 14 years from 1982 to 1996, they went from 19 in 1982 to 18 in 1996. (GAO, p.30)
As Atlantic City is a destination-style gaming locality, the majority of gamblers live outside the area. Thus, the locality in question reaps most of the economic benefits while most of the social costs are exported to the home communities of the gamblers. Moreover, because of its status as a destination for gamblers, crime rates should account for the numerous daily visitors to the locality who are themselves potential victims or perpetrators of crime. The GAO analyzed data from the FBI’s Uniform Crime Report (UCR) and calculated changes in total crime rates based both on adjusted and unadjusted population since casinos began operating in Atlantic City. According to both measures, total crime rate increased initially once casinos opened for business. While the overall incidence of crime increased, there were also increases in the size of the police force, the average daily population and the national crime rate.
According to the GAO, Atlantic City and Atlantic County officials report that casinos had a significant impact on prostitution, which, by one report, is now decreasing. FBI UCR prostitution data over
Crime
Calculating Crime Rates
Prostitution
19
the 20 years from 1977 to 1997 demonstrates that the arrest rate for prostitution-related crimes for the unadjusted population increased in certain years during these two decades and continued to remain higher than rates for both New Jersey and the nation. Calculating the prostitution arrest rate for the adjusted population for Atlantic City, however, reveals that the rate more closely resembles state and national levels during the same twenty year time period (GAO, p.39-40).
Calculated with unadjusted population data, Atlantic City’s drug arrests per 10,000 increased overall and, when compared to state and national rates, was approximately five times greater in some years from 1980 to 1997. Yet using adjusted population data brings the drug arrest rate closer in line with state and national levels and, in some years, lower than the rates elsewhere. The GAO maintains that determining the drug arrest rate based on the adjusted population (and thus including visitors to casinos) is the more appropriate means of calculation (GAO, p.41).
The New Jersey Attorney General’s office states that they have had “no major scandal or organized crime influence in the casino industry.” They credit their success in this regard to stringent controls and regulations used by the state to control the casino industry and maintain that theirs is the best casino gaming regulatory system in the nation. (GAO, p.41)
Drug Arrests
Organized Crime
20
Don Phares provides a historic overview of gaming in his report on the economic impact of gaming in Missouri.13 According to Phares, until the 1930’s, the only legal gaming in the United States was wagering in person on horse and dog racing in certain states. Nevada legalized gaming in 1931, but only a decade later did Las Vegas begin to show its first promise with the advent of air-conditioning and significant financial investment resources. Las Vegas had a monopoly on legal casino gaming until New Jersey legalized casinos in 1978 as a way to revitalize Atlantic City. The early 1990’s saw a boom in riverboat-based casinos, especially along the Mississippi River. Currently, eleven states permit commercial (private, non-tribal) casinos. Native American-owned casinos sprouted up during this period also and now exist in 22 states. In general, Native American casinos tend to be less lucrative than non-reservation-based casinos, at least partly due to their more isolated location.
According to the previously-cited GAO report, “in 1996, the legalized gaming industry employed more than half a million people who earned more than $15 billion in salaries.” (p. 16). Casinos and pari-mutuel wagering are more labor-intensive than other forms of gaming and therefore tend to have the greatest employment concentrations. In 1995, casinos employed 300,000 people and pari-mutuel employment was 119,000 according to the NGISC. By 2001, according to the American Gaming Association, casino employment alone had reached 370,000 workers earning $11 billion in wages, tips and benefits. While casino jobs tend to be low-paying (approximately $22,000 annually), average salaries are higher than in other industries in the entertainment and recreation sector (approximately $21,000 annually).
According to Goss, U.S. gaming industry revenues were an estimated $64 billion in 200114. The growth in gaming earnings
13 Phares, Don. (2001). “Casino Gaming in Missouri: The Spending Displacement Effect and Gaming’s Net Economic Impact”, paper presented at the 2001 Missouri Economics Conference, Columbia, MO, May 4-5, 2001. 14 Goss, Ernest, The Economic Impact of an Omaha, Nebraska Casino. report prepared for the Greater Omaha Chamber of Commerce, December 4, 2002, p. 9.
CASINO GAMING IN THE UNITED STATES

21
over the past decade has been astronomical, with the most rapid revenue increases taking place in states that only recently legalized gaming. For example, Indiana and Illinois witnessed a growth rate of 63.6% from 1999-2001, while New Jersey’s established gaming venues grew at a slower rate of 7.5% over the same period.
Studies have found that Americans spend as much on legalized gaming as they do on movie tickets, amusement parks, sporting events and videogames combined. The illegal market is estimated to be equal to the legal market in spending.

22
CGR concludes that the economic impact of the casino, net of the estimated social costs, would be positive. Not only will the casino create net new employment in the Rochester metropolitan area, but it will have favorable locational impacts on the downtown.
The casino is likely to create jobs for Rochester residents, many of whom have become isolated from Downtown’s traditional entry-level job market by a shifting of retail and service employment to the suburbs. In its second year of operation at the casino, the developer estimates employment to be nearly 1,300 with payroll of $48 million. CGR calculates that about one-third of this total represents jobs and payroll displaced from other parts of the economy, leaving a net primary impact of about 800 jobs and payroll of almost $31 million.
Secondary economic impacts from the casino are also substantial, totaling an additional 500 jobs and $15 million in payroll.
Rochester’s downtown hotels have faced relatively low occupancy rates, which have contributed to frequent turnover in ownership and have threatened the viability of Rochester’s convention business. While a Rochester casino is likely to be patronized mostly by “day trippers,” a downtown casino will add to the appeal of downtown for travelers seeking Rochester lodging and will attract a limited number of overnight patrons.
A downtown casino will add to the appeal of Rochester’s already well-regarded convention amenities, supporting the Convention & Visitors Bureau’s attempts to expand the convention trade.
The casino proposal will address a critical vacancy problem in two key downtown buildings, Midtown Plaza & Tower and the Sibley Building. With 2.3 million square feet between them, the likelihood of normal demand growth filling them within any reasonable timeframe is low. Between the casino proposal and the Renaissance Square initiative, the center of the downtown will be vibrant again.
Payments from the casino both from the public share of slot machine/VLT revenue and payments for public services will improve the delicate fiscal position of the City of Rochester.
CONCLUSION
Benefits
23
Annual payments to the City of Rochester from the slot machine/VLT revenue could reach $11 million.
While the net economic benefits are considerable, there are also risks and costs to be explored and, to the greatest extent possible, mitigated in the compact forged between the Seneca-Cayuga of Oklahoma and the State of New York.
It has been widely observed in other communities with casinos, that the health of neighboring food, drink and retail is endangered by the facilities located within the casino. The NORC/Lewin/Gemini study reported a 19% decline in food and beverage employment in communities with casinos. This employment will not be lost, of course, but shifted from downtown businesses into the casino. Yet the consequences for downtown are broader if rental rates for first floor space and property values decline. Furthermore, the benefit of addressing blight at Sibley and Midtown would be partially undone by shifting the blight to business locations now viable.
Several studies have confirmed what common sense suggests, that problem and pathological gambling increases with proximity to casinos. CGR made an attempt to quantify the increased social cost of problem & pathological gambling stimulated by a Rochester casino through the extrapolation of research findings solicited by the National Gambling Impact Study Commission. CGR’s calculations suggest that the annual cost could reach $10 million.
Costs