rock failure
TRANSCRIPT

7/18/2019 Rock Failure
http://slidepdf.com/reader/full/rock-failure 1/21
Rock Failure
David A. Lockner
1. INTRODUCTION
1.1. Background
Analysis of a wide range of problems in the geo-
sciences requires knowledge of the failure process in
rock. This includes tunnel design and other engineer-
ing applications as well as geophysical problems such as
earthquake prediction. The empirical Coulomb failure
criterion
171 = c + pLi’on,
(1)
where C is cohesion, I- is shear strength and on is nor-
mal stress, was proposed in the late 18th century and
continues to be of great practica l use. In the 1920’s,
Griffith [48] demonstrated the importance of flawswhich
act as stress concentrators, in controlling the strength
of brittle materials. Using this approach, fracture me-
chanics (e.g. [5, 171) has been highly successfu l in re-
lating defect structures to fracture strength and related
properties. Through the 1960’s, many of the advances
in the theory of fracture and friction in rock have had
their origins in metallurgy; a fact that has mixed bless-
ings since plastic yielding, commonly involved in the
deformation of metals, may be completely absent in
room-temperature brittle deformation of common sil-
icates such as quartz [154]. Thus, in contrast to plastic
yielding which has little or no pressure sensitivity, a ma-
D. A. Lockner, United
States Geological Survey, 345 Middle-
field Road, Menlo Park, CA 94025
Rock Physics and Phase Relations
A Handbook of Physic al Constants
AGU Reference Shelf 3
This paper is not subject to U.S. copyright. Published
in 1995 by the American Geophys ical Union
127
terial obeying the Coulomb equation (1) shows signif i-
cant strengthening with pressure. Although a Coulom-
bit material may deform in a manner described as plas-
tic flow, the microscopic mechanisms of grain rolling
or crushing and associated dilatancy, are quite differ-
ent than those responsible for plasti city in metals. The
same processes are like ly to occur during shearing across
a fault surface.
Before proceeding, a point of nomenclature must
be clarified. Internal friction, as presented in (1)
and commonly used in rock mechanics texts (e.g.
[66]), refers to the local slope of a failure criterion in
shear/normal stress space: pi’ = a]~]/%,. The prime
symbol is used to denote this local derivative. I will
also make use of an alternate quantity, referred to as
coefficient of friction defined as the simple ratio of shear
to normal stress: pf = )~)/cr, . This parameter, written
without the prime symbol, is commonly used in the
analys is of stresses on preexisting faults and can also
be applied to internal friction of intact rocks (referred
to as pi). Due both to cohesion and to non-linearity in
the failure envelopes of true rocks, it is common to find
Pi’ < pi.
A number of comprehensive studies and reviews of
the general field of rock failure and rheology currently
exist [12, 38, 50, 66, 70, 71, 78, 120, 1381. By
contrast, the present chapter will be more limited in
scope and will be restricted to a discussion of brittle
failure mechanisms. It is intended to fulfil l three main
objectives: 1) an overview of recent progress in the
study of rock failure - an evaluation which, by necessity,
will be brief.
2) An extensive reference section i s
included to provide interested readers with an entry
point into the relevant literature. 3) The chapter
concludes with a number of summary plots and tables
to provide a quick reference to the range of mechanical

7/18/2019 Rock Failure
http://slidepdf.com/reader/full/rock-failure 2/21
128 ROCK FAILURE
properties that are observed for geologic materials.
Since I consider only brittle fracture, I will be
concerned primaril y with processes occurring in the mid
to upper c rust. For many silicate rocks under these
conditions, temperature is low enough for brittle crack
growth to compete and generally dominate thermally
activated dislocation flow mechanisms. Even so, over
geologic time scales, pressure solution and other fluid
assisted deformation mechanisms may prevent, or at
least subdue, brittle fracture. In general, brit tle failure
is enhanced by increasing strain rate and decreasing
temperature, although these effects are relativel y small
compared to the influence of mean stress and pore
pressure. In the following sections I discuss some of
the important factors that influence fracture strength,
although additional factors not addressed in detail
include: alteration and weathering; porosity [35, 43,
1251, fabric, minerology, and anisotropy [45, 62, 157,
1581; and intermediate stress [2, 1511.
1.2.
Conceptual Model of Brittl e Fracture
Process
The following descriptions are provided as a frame-
work for the discuss ion of brittle fracture. When a sam-
ple is loaded in tension, preexisting flaws act as stress
concentrators, intensifying the stress field at their tips.
Since the tensile stress intensity KI increases as the
square root of crack length [79], the largest favorably
oriented flaw generally experiences the greatest crack-
tip stress. If the remote stress is increased until stress
intensity on the crit ical flaw exceeds the fracture tough-
ness
KIC,
the flaw wil l grow in the plane perpendicular
to the maximum tensile stress direction. For constant
sample boundary conditions, each increment of crack
growth results in a further increase in stress intensity.
As a result, once crack growth is initiated, propagation
continues unstably until the sample is fractured.
A more complicated process is involved in compres-
sive brittle shear fracture. Open pores, contrasts in
elastic propert ies of adjacent minerals and weak grain
boundaries can all act as stress concentrators in com-
pression [121, 1521 and shearing along surfaces oblique
to 01 is likel y to play an important role in the develop-
ment of large local stresses [4, 60, 96, 121, 1341. The lo-
cal stresses induced near the crack tips contain a compo-
nent of tension which leads to local tensile failure before
the fracture toughness for failure in shear is achieved
[79]. As a result, tensile ‘wing’ cracks grow which align
themselves sub-parallel to the (~1 direction. Unlike the
case of remotely applied tensile stress, two important
stabiliz ing processes take place during the loading of
crack s in compression. First, as wing cracks extend,
stress intensity decreases, so that additional deviatoric
stress must be applied to cause further crack growth
[28, 30, 601. S
econd, diagonal flaws which are favor-
ably oriented to act as nucleation points for shear fail-
ure, propagate out-of-plane (parallel to err) and cannot
maintain the necessary shear geometry [79, 941. These
stabilizi ng effects account for the factor of ten or more
difference in compressive vs. tensile strength commonly
observed in rocks. Eventually, crack densities become
sufficien tly large for significant crack interaction to oc-
cur, leading to a cooperative failure mechanism involv -
ing en echelon arrays of cracks [4, 30, 34, 60, 69, 96,
121, 126, 1341. Finally, quasi-static fault growth exper-
iments [92, 93, 1061 have demonstrated that following
nucleation, shear fractures propagate in-plane due to
their own stress field. This observation is important
for laboratory scales since in past studies it was often
argued that the eventual fracture plane began form-
ing, as a region of high microcrack damage, well be-
fore peak strength occurred. While this interpretation
may hold for samples containing large preexisting flaws,
it appears that in homogeneous, isotropic rocks, there
is generally little warning regarding the location and
orientation of the eventual fracture plane. S imilar re -
sults were reported in recent fie ld studies [80] where
nucleation zones for moderate-sized earthquakes were
inferred to be less than 0.1% of the coseism ic rupture
surface area.
2. ROCK FAILURE ANALYSIS
2.1. Failure Criteria
One of the basic goals of rock mechanics has been to
provide useful methods for predicting failure strength
and associated parameters such as strain to failure and
the effects of porosity and elastic moduli. The large
number of competing effects that influence the fracture
process has precluded the development of a universal
law which can be used in any practical way to predict
fracture strength for an arbitrary rock. As a result,
a variety of classif ication systems have been developed
to be used as predictive tools in estimating the load
bearing capacity of various rock types. A number of
these classifi cation systems, using rock quality parame-
ters such as Deere’s RQD [31], the CSIR geomechanics
classif ication [lo], and the NGI quality index Q [7], are
described in [58]. These classification systems attempt
to take into account such factors as rock type, joint
spacing, joint orientation and strength of joint-fil ling
material. Many attempts at developing failure crite-
7/18/2019 Rock Failure
http://slidepdf.com/reader/full/rock-failure 3/21
LOCKNER 129
Uniaxial Compress ion Triaxial Compression
c-’
%
TENSION 1 COMPRESSION
MINIMUM PRINCIPAL STRESS
(or Confining Pressure)
NORMAL STRESS
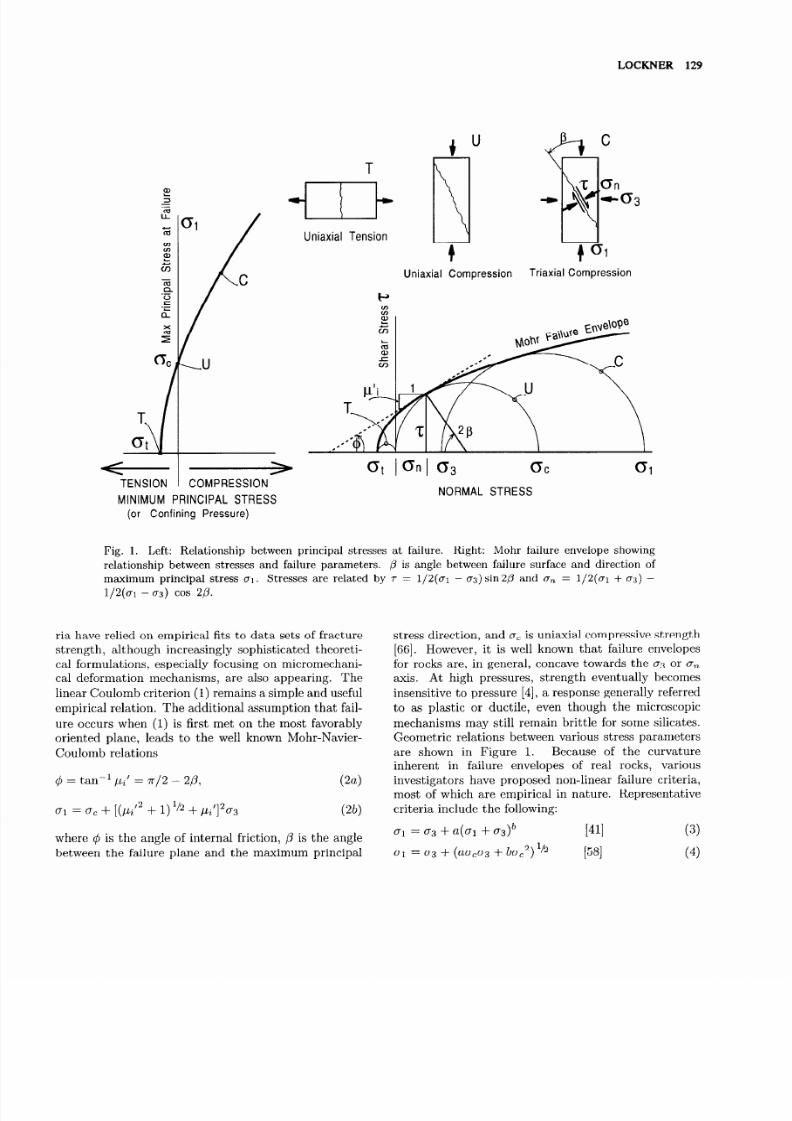
Fig. 1. Left: Rela tionship between principa l stresses at failure. Right: Mohr failure envelope showing
relationsh ip between stresses and faihne parameters. p is angle between failure surface and direction of
maximum principal stress ur. Stresses are related by r = 1/2(ar - (~3) sin 2/3 and on = 1/2(gr + g3) -
1/2(ar - 03) cos 2p
ris have relied on empiri cal fits to data sets of fracture
strength, although increasingly sophisticated theoreti-
cal formulations, espec ially focusing on micromechani-
cal deformation mechanisms, are also appearing. The
linear Coulomb criterion (1) remains a simple and useful
empirica l rela tion. The additional assumption that fail-
ure occurs when (1) is first met on the most favorably
oriented plane, leads to the well known Mohr-Navier -
Coulomb relations
q ~= tan-r p.i’ = 7r/2 - 2p,
Pa)
Ul = UC + [(Pi’” + 1) l/2 + &‘]%s
(2b)
where q5 is the angle of internal friction, /3 is the angle
between the failure plane and the maximum principal
stress direction, and gc is uniaxial compressive strength
[66]. However, it is well known that failure envelopes
for rocks are, in general, concave towards the 03 or on
axis. At high pressures , strength eventually becomes
insens itive to pressure [4],
a response generally referred
to as plasti c or ductile, even though the microscopic
mechanisms may stil l remain brittle for some silica tes.
Geometric relations between various stress parameters
are shown in Figure 1. Because of the curvature
inherent in failure envelopes of real rocks, various
investigators have proposed non-linear failure criteria,
most of which are empirica l in nature. Representative
criteria include the following:
u1 =
03
+ a(q + u3)b
WI
(3)
01 = ~7~+ (UCT~Q+ boc2) 1/z
[581 (4
7/18/2019 Rock Failure
http://slidepdf.com/reader/full/rock-failure 4/21
130 ROCK FAILURE
01/Q = 1 + a(a,/ay)b
[1661, I431
(5)
Ul = 0Jl - Crs/Q)b
[1401 (6)
where ut (negative in tension)is uniaxial tensile strength.
In these relations, the various a’s and b’s are constants
that represent material properties of the rock and
generally vary between rock types. Equations (3)
- (5) are designed to model confined strength data
and have varying degrees of difficulty with unconfined
or tensile conditions. For example, the unconfined
condition is described by (~a = 0; 01 = a,). In
this case, (3) reduces to oC = a~,b . Similarly, (4)
requires b = 1, which is overly restrictive. equation (5)
lacks real solutions for tensile conditions. Equation (6)
seems to provide a satisfactory compromise between
reasonable strength predictions near zero confinement
and observed non-linearity at higher confinement. The
interested reader is referred to the relevant articles cited
for additional details regarding these formulas. Other
empirical relations have been proposed to relate failure
strength to material properties; for example
u, = cL(E/u)b
uc = arjb
WI (7a)
[35,431
(76)
constraints in this section.
2.3. Damage Models
A different appr oach to brittle failure analysis, re-
ferred to as damage m echanics, has led to the develop-
ment of a distinct class of models. In this case , failure is
assumed to occur when a critical amount of damage has
accumulated in the rock. Then an internal state vari-
able D is developed that represents the degre e of dam-
age. The problem then becomes one of relating the mi-
crocrack damage in the rock to external variables such
as stress and strain [4, 28-30, 68, 98, 1481. The most
promising approach has been to use fracture mechanics
to relate local crack tip stress intensities to remotely ap-
plied stresses [4, 301. A similar approach [83], based on
the Ashby and Sammis formulation, has been used to
interpret time-dependent creep. Ashby and Sammis (4 1
have attempted to simplify the analysis to provide a uni-
versal form, based on a physical model of crack growth,
which allows the damage parameter to be expressed in
terms of macroscopic material properties and measur-
able microscopic quantities. As an example, they derive
an expression (for loading at constant ga) for the nor-
malized axial stress Sr in terms of normalized confining
pressure Sa and damage D:
where E is Young’s modulus, u is Poisson’s ratio and
n is porosity. Failure strength has also been related
S1 = Q[D:/~ - c5 ] 3’2
@a)
empirically to geophysical logging parame ters:
uc = aeebt
[loll
CT,= a + b(SNPU)
(84
@b)
where t is sonic interval travel time and SNPU is
neutron log response.
2.2. Continuum Models
The transition from uniformly distributed deform a-
tion to shear localization has been analyzed theoreti-
cally from a continuum point of view. One example
involves an instability, or bifurcation, that develops in
the strain field as the result of strain wea kening. Then,
when a small region yields, in response to the applied
boundary conditions, it becomes weaker than its sur-
roundings and tends to continue deforming. This pro-
cess tends to localize strain into a shear band [37, 39,
67, 77, 119, 130, 131, 150, 1561. In principal, the local-
ization p rocess does not require strain-weakening. This
is an area of active research both theoretically and ex-
perimentally [118, 1611. Bifurcation theory deserves a
much more thorough treatment than is allowed by space
where D, = D/Do, Do is initial damage, and cl through
c5 are constants. D is defined by
D =
4/3
TT (1 + CXC)~A$
WI
Here c is the half-length of the characteristic flaw pop-
ulation responsible for microcrack growth. 1 represents
the length of the ‘wing’ cracks that grow from the initial
flaws in response to the applied load. NV is the number
of flaws p er unit volume and CY s a geometric constant.
Do is defined by (9b) with 1 = 0. Equation (9a) gives,
to first approximation,
Ul = UC+
a03
.
(10)
The model provides a physical interpretation to a
and gCc,
relating them to DO, pf and the crack size.

7/18/2019 Rock Failure
http://slidepdf.com/reader/full/rock-failure 5/21
LOCKNER 131
Because the model is linearized, it cannot predict the
curvature inherent in true failure envelopes. However,
it is successful at predicting gC and the low-pressure
slope of the failure envelope for a wide range of
rock types. It is interesting to note that a multiple
crack numerical model [94], when restricted to a crack
growth criterion based strictly on Klc, also results in
a linear failure envelope (the Ashby and Sammis model
also considers only tensile crack growth). When the
numerical model is expanded to allow for a shear failure
mechanism (Kr rc = 15 K~c) , the transition to a shear
growth mechanism at high confining pressure produced
curvature of the failure envelope.
2.4. Acoustic Emission Applied to Fault Forma-
tion
The monitoring of acoustic emission (AE) has proven
to be one of the more powerful tools available in
analyzing brittle fracture (see [82] for a recent review).
This non-destructive technique records the acoustic
waves (generally in the 200 to 2000 kHz range) that
are spontaneously radiated during impulsive microcrack
growth or slip. The simplest procedure is to count
the number of AE pulses during deformation. There
is generally a good correlation between AE rate and
inelast ic strain rate so that the AE rate can be used
to quantify damage accumulation occurring in the
sample [30, 59, 84, 1421. Other studies have analyzed
full waveforms of AE signals and, in particular, first
motions in an attempt to infer source characterist ics
and focal mechanisms [13, 75, 115, 135, 146, 1471.
Numerous studies have also confirmed that AE event
amplitudes obey the power law frequency-magnitude
relation observed for earthquakes [27, 91, 99, 137, 162,
1671.
The other important aspect of AE studies is the de-
termination of the spatial and temporal variations in
microcracking during sample deformation. In this case,
an array of acoustic transducers, attached to the sam-
ple, serves as a miniature seismic a rray. Then, from
the arriva l times of acoustic signals, event hypocenters
can be determined. In some cases, AE locations have
been used to follow the development of hydraulic frac-
tures [86] and faults [25, 75, 85, 86, 1001 during pore
fluid injection. However, most AE event location stud-
ies have been devoted to the search for clustering pat-
terns which would indicate the onset of fault nucleation.
Many studies have shown microcrack clustering early
in the loading history of rock samples [56, 91, 93, 115,
135, 146, 153, 1651. However, much of this early clus ter-
ing appeared uncorrelated with the eventual fault plane
and disappeared or migrated at higher stress levels.
The early clustering is generally interpreted as repre-
senting preexisting strength heterogeneities in the sam-
ples. Yanagidani et al. [165] suggested that migration of
events to the sample surface during unconfined experi-
ments may be a stress corrosion effect in which atmo-
spheric water vapor attacks the sample surface. A gen-
eral consensus appears to be forming that for uniform
loading in the absence of preexisting strength hetero-
geneity, microcrack localization occurs late in the load-
ing cycle, e.g., near or after peak s tress in a constant
strain rate experiment and coincident with tertiary (ac-
celerating) creep in a constant stress experiment [56,
87, 1151. The abruptness of microcrack localizat ion is
demonstrated in Figure 2 in which A E activ ity is plot-
ted throughout the progressive stages from early load-
ing, through peak stress and fault nucleation, and fi-
nally fault propagation. In this case, the propagation
phase was slowed down by controlling differential stress
to maintain constant acoustic emission rate [92, 931.
2.5. Related Studies
To close this section I will mention a few related areas
of study. Ongoing investigat ions are being conducted
of a variety of physical properties related to rock
fracture and pore structure. In many cases, these
measurements are made to determine changes in pore
geometry during rock deformation. Some of the more
common measurements include acoustic veloc ity and
attenuation [18, 49, 84, 97, 145, 1491, permeability [8,
14, 40, 109-111, 113, 1141 and electr ical resi stivi ty [88,
89, 107, 1081.
3. FRICTION AND ROCK FAILURE
A discussion of rock failure must also consider rock
friction since these processes are so intimately connected.
For geologic materials, fracture and friction are macro-
scopic manifestations of the same processes : e.g., grain
crushing, crack growth and healing, plasti c yielding,
and chemical reactions such as dissolution, precipita-
tion and alteration. While faults often contain hydrated
alteration products of the host rock, many of the dif-
ferences between intact strength and frictional strength
are related more to geometry(interlocking,welded grains
versus cohesionless gouge) and possib ly scale effects
(highly cornminuted gouge can contain grains that are
reduced to colloidal size) . When viewed in this way,
it is not surprising that the difference between intact
and residual (or frictional) strength should vanish with
increasing confining pressure [20, 651. The open pore
structure representative of disaggregated gouge will be

7/18/2019 Rock Failure
http://slidepdf.com/reader/full/rock-failure 6/21
132 ROCK FAILURE
1 . so*. . .
i ..: . . :
I
. . 7::. . : .
. . .>. *
. ,f+.;::. . (
. .-“,*,
c.
I.‘,
>.:+ : $1,
, . “-~$: :
I.* .
i . . .
0.. .
.:.:. .
Z’. - ‘.1
* :. ; . : . *
. . / . ..I.
: .
1.: s; -o
to . ‘ : *
:.. L
1. . ..*.
. 1.. *.-.
,. . .
(a)
r
.
. .
..:0.
‘:
i-.
I
I. /
::
.z 4 ‘ ’ .
,.
;‘2*> i
- 7;.,
.3,‘, -:*’ .- . -I...
.
. .
ML
(b) (cl
.-
_ : . .
:. .- .
,. ..*
/ a.
c
*:
.-.:
a..
... .
.-*
1. .
. :*
(d)
1r
. I
I
i
I
..‘. .
--I
: *.
:.
: .
J
(e)
-r
SOO[ ’ ’ ’ ’ ’ ’ ’ ’ ’ ’
PC
= 50 MPa
AXIAL DISPLACEMENT, mm
Fig. 2. Acoust ic emission hypocentral locations during fault formation of initially intact Westerly granite.
Time progresses from left to right. Bottom figures view sample along strike of eventual fault plane (which
appears as diagonal feature in (e) and (f).
Upp
er views show same AE events viewed perpendicular to
strike. Accompanying stress-displacement curve indicates segments of the experiment from which acoustic
emission plots are made. Fault nucleation occurs in (d).

7/18/2019 Rock Failure
http://slidepdf.com/reader/full/rock-failure 7/21
LOCKNER 133
1
P
9
i
- -
I
200 400 600 800
1000
MEAN PRESSURE, MPa
0
Fig. 3. Internal friction , pz’, p lotted as a function of mean pressure (after [103]) for a representative range of
rock types. Mogi classified deformation mechanisms as brittle (closed circles) and ductile (open circles). The
general decrease in pi’ with increasing pressure reflects the curvature of the corresponding failure envelopes .
Since ductile deformation generally haa low pressure sensitiv ity, these values appear i n the lower portion of
the plot.
forced into a dense, interlocked structure by high con-
fining p ressure so that intact and fractured rock behave
more and more alike. Fault frictional strength pf is re-
ally a lower bound for internal friction pi since a fault
is a physically identifiable plane of weakness whereas
internal friction refers to an imaginary plane within the
bulk matrix. (Recall the distinction made in this chap-
ter between the simple stress ratio pi = ]~]/a~ and the
more conventional local derivative pi’ = a]r]/%,.) By-
erlee and Savage [23, 261 have recently provided an in-
teresting link betw een pi and j~f. In their analysis, they
show that fault gouge, comprised of a Coulomb mate-
rial that satisfies (l), will first deform alon g Coulomb
shears that are not coplanar with the fault surface s. As
the material strain hardens, it approaches a stress state
in which the plane of maximum shear stress is parallel to
the fault surfaces. Even though the average strain must
continue to be parallel to the fault to satisfy the simple
shear geometry, the microscopic deformation must sat-
isfy the Coulomb failure criterion which require s slip on
surfaces oblique to the maximum shear stress direction.
This basic incompatibility in strain orientations requires
cooperative slip on conjugate microscopic slip planes.
As a result, while the material locally satisfies (2a), on
a macroscopic scale, the fault obeys pappar ent = sin 4.
For the sake of argument, let us identify pi for the gouge
with the value determined for intact rock of the same
composition. Then, for typical confined intact rock val-
ues of 0.6 < pi, < 1.8 (see Figures 3 and 4), we o btain
0.5 I p apparent < 0.9 [go]. It is intriguing that the ap-
parent friction should fall so close to the observed range
of
values for natural materials (Figure 4). We expect
some differences between intact and crushed rock due to
packing (porosity) and the magnitude of the associated
stress concentrators. Thus, a porosity c orrection simi-
lar to equation (7b) would be required for a general ex-
pression relating friction parameters b etween intact and
crushed rock. Since the same processes of grain cr ush-
ing and crack growth must be occurring in both cases,
the close correspondence between pf and papparent sug-
gests that the boundary conditions imposed by rigid
fault surfaces are largely responsible for the difference
between pi and pf [go].
This section is ended with a brief technical comment
7/18/2019 Rock Failure
http://slidepdf.com/reader/full/rock-failure 8/21
134 ROCK FAILURE
2(““1”“1”“(
1 8
1
WESTERLY GRANITE 4
0 pi INTACT
0 pf PREDICTED
l pLt OBSERVED
- Byerlee’s law
0.6
0.4’ I 1 ” 1 1 ” ” ”
0
500
1000 1500
Normal Stress, MPa
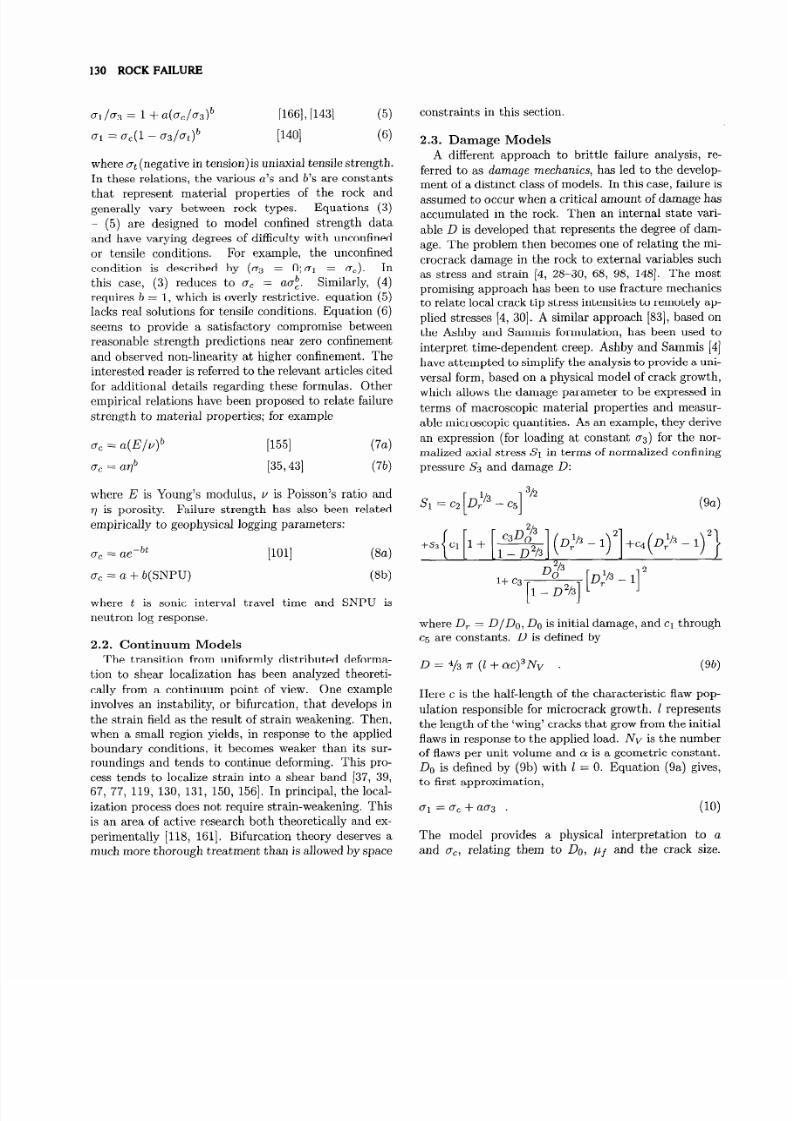
Fig. 4. Internal friction and sliding friction for Westerl y
granite. Internal and sliding friction can be related by
pf = sin(tan-i(p i)) (predicted values shown as open circle s;
see text for details). Byerlee ’s law is shown for comparison
(data from [20]). Convergence of internal and sliding fric tion
at high normal stress is commonly observed.
regard ing the coefficient of friction.
If we consider
uniaxial fracture strength, then the mapping of pi’ into
pi, according to our nomenclature, can be accomplished
by a simple construction on a Mohr diagram. The
definition of pi leads to
pi = & = sin
2p
(l-cm
20)
(uniaxial stress)
(11)
Similarly, pi’ is the tangent of the failure envelope:
pi’ = tan 4 = tan (: - 2p) (uniaxial stress) (12a)
or
20 = 7r/2 - taIC1(pi’)
.
(12b)
Equations (11) and (12b) provide an explicit expression
for pi in terms of pi’ under uniaxial loading conditions .
The typical range of 0.5 5 pi’ < 1.5 for unconfined
compressive tests (Figure 3) corresponds to the range
1.6 5 pi 5 3.3. The differences between the uniaxial
values of ,LL~’ nd p( a re due to cohesion and to curvature
of the failure envelope.
With increasing confining
pressure, pZ’
and pi tend to decrease and pi also
approaches pf (Figures 3 and 4).
3.1. Friction as a Lower Limit for Rock Strength
I have mentioned that some regions of the Earth’s
For brittle fracture in compression, experimen tally
crust a ppear to be fractured on all scales.
Under
determine d values of internal friction typically fall in
the range 0.5 < pi’ < 1.6. The corresponding angle
of internal friction 4 = tan-’ pZ’ range s from 26’ to
58”. As I have already discussed, frictional strength
often serves as a useful lower limit for rock strength;
especially for large rock masses that contain joints
and fractures . Analysis of room-tem perature frictional
strength data [22] revealed that a broad range of
common rock types could be adequately represented
by a simple empirical relation known as Byerle e’s law.
A non-linear normal stress dependen ce of friction was
observed which could be adequately fit by two linear
segments of the form of equation (1):
r = 0.85 a,
7 = 50 MPa+0.6 cr’n
on < 200 MPa
(134
200 < o, < 1700 MPa .(13b)
If we assume that the rock matrix is sufficiently frac-
tured so that the most favorably oriented faults are
present,
this result can be expressed in terms of princi-
pal stresses as
c71 = 4.7
03
03 < 114 MPa
(13c)
01 = 177 MPa + 3.1 ‘~3 114 < 03 < 1094 MPa . (13d)
Alternatively, a power law of the form
14 = un
o.g4 (MPa) on < 1700 MPa
(14
provides a good fit to the experimental data. Figure 4
shows the effect of normal stress on pf and pt for
Westerly granite. Equation (13) will be used as a
reference curve for the summary plots at the end of
this chapter. Notable exceptions to equations (13 ) and
(14) are a number of clays and other sheet silicates,
especially minerals containing interlayer water.
For
example, under low confining pressure, montmorillonite
obeys of
N 0.2 [112]. It is also important to note
that fluid pressure has a first order effect in equations
(13) and (14) by directly reducing normal stress (see
section on pore pressure). It should also be emphasized
that rock friction appears to be independent of scaling
from fractions of a millimeter to field scales on the
order of kilometers. This scale independence is not true
for fracture strength as I discuss in the next section.
The scale-independence of frictional strength as well as
the overall insensitivity of friction to rock type greatly
simplify the task of relating laborato ry measurem ents
to deformation in the crust.

7/18/2019 Rock Failure
http://slidepdf.com/reader/full/rock-failure 9/21
LOCKNER 135
this condition, the crust would act as a cohesionless
Coulomb material. Then, assuming an angle of internal
friction 4 = 30” (pi = pf = 0.58), a hydrostatic fluid
pressure due to a water column of density 1 Mg/m3, and
an average rock density of 2.7 Mg/m3, the maximum
and minimum effective stresses are constrained by
03
e* 2 aieff/3. Under these conditions, the stress state
3 03
eff = aleff
(15)
represents a condition for incipient failure. In a normal
faulting regime, where vertical stress, S, = 01, these
same conditions give the minimum horizontal stress,
Sh = 0.58’S,. This principal stress ratio is often ob-
served in normal faulting regimes. It has been explained
by assuming uniaxial strain (E, = sy = 0) and a Pois-
son ratio u N 0.25. The alternative explanation de-
scribed above depends on quite reasonable assumptions
of friction and hydrostatic fluid pressure gradient. The
same analysis applied to a thrust-faulting regime where
S, = g3, predicts incipient failure at a maximum hor-
izontal stress SH = 2.26s”. These relations, assuming
full fluid connectivity, are shown as approximate lower
bounds for crustal strength in Figure 5. Direct obser-
vations from deep bore holes indicate that fluid pres-
sure seals can form in the Earth’s crust and, combined
with porosity loss, heating or dewatering, can result in
fluid pressures that approach lithostatic. Under these
conditions, shear strength of the crust could approach
zero. At the other end of the spectrum, we use intact
strength of Westerly granite to represent unfractured,
crystall ine rock. Incipient failure is plotted in Figure 5
for two cases. The strongest condition assumes dry rock
with zero pore pressure, and the intermediate case rep-
resents wet, fully saturated rock with hydrostatic pore
pressure and a loss of 50 MPa strength due to stress
corrosion. This last effect represents static fatigue af-
ter approximately 100 years (see section on strain rate
effect).
3.2. Recent Developments in Friction
We may well be in the early stages of a revolution
in our understanding of fault systems and associated
crustal stresses. A long-standing debate has occurred
regarding the apparent weakness of mature faults such
as the San Andreas in California (reviewed in [53]).
The lack of a localized heat flow anomaly associated
with the San Andreas was interpreted as indicating
a low shear strength (<20 MPa averaged over the
upper 14 km of the fault) [76]. This impl ies pf <
0.2. Recent stress orientation measurements along
the San Andreas [139] suggest that it is also weak
relative to surrounding subsidiary faults. At the same
time, laboratory friction measurements [112] indicate
that even the weakest clays (which are unlike ly to be
chemical ly stable at seismogenic depths) cannot satisf y
this constraint. Elevated pore fluid pressure remains
a viable explanation. However, mechanical arguments
have suggested that the necessary fluid pressures could
not be sustained. A recent breakthrough occurred in
which it was recognized that a fluid pressure gradient
from the center of the fault zone to the walls of the
fault would al low high fluid pressure and vanishing
shear strength in the interior, and at the same time
not result in hydrofracture of the surrounding country
rock 119, 24, 1281. S
nce this type of model requires
a stable gradient in fluid pressure, it suggests that
mature faults with thick gouge zones are like ly to be
weaker than immature, narrow faults. This model may
also explain the apparent weakness of low-angle thrust
faults. Furthermore, reports of high fluid pressure
chambers in deep petroleum reservo irs [123] have led to
the suggestion that mature fault zones may be similarly
compartmentalized into chambers with varying degrees
of fluid overpressure [24].
Much attention has been devoted recently to a class
of slip rate- and history-dependent friction laws [33,
127, 1321. These laws characterize the fault as having
an intrinsic friction comparable to Byerlee ’s law, but
with second order variations, caused by velocit y V,
that decay with displacement.
Part of the appeal
of these constitutive relations is that their nonlinear
nature results in a complex and wide range of behaviors,
allowing them to replicate many of the phenomena
attributed to earthquakes. A general form of the
friction law can be expressed as
T = ~,[b + aln (V/V*) + C(b&)] @a)
d$i/dt = -(V/L,)[$, + In (V/V*)] (166)
where a and hi’s are constants, V* is an arbitrary refer-
ence velocity, and Li’s are character istic displacements
over which memory is lost. State variab les $Q are as-
sumed to evolve according to (16b). Stabili ty analy-
sis [129] indicates that for a < b (resulting in weaken-
ing with increasing velocity) , slip can become unstable,
leading to a stick-slip event in the laboratory or to an
earthquake. Increasing a - b tends to make the sys-
tem more stable. Laboratory measurements of artific ial
gouge and bare rock surfaces indicate that variations
in friction are typica lly *l% or less per decade change
in velocity. Bare surfaces tend to give more negative
values of
a
- b while clays seem to give consistently pos-

7/18/2019 Rock Failure
http://slidepdf.com/reader/full/rock-failure 10/21
136
ROCK FAILURE
A
Stress, MPa
0 0 0 0
00
z
7
Ei m z v)
0
S, (intact & saturated)
Stress, M Pa
0
Fig. 5. Theoretical bounds on crusta l st ress state using Wester ly granite to represent crystalline rock (data
from [20, ISO]). a) Normal faulting regime (S , = 01): i) Incipient failure will occur on existing, favorably-
oriented faults (assuming hydrostat ic fluid pressure and pf = 0.58). ii) Intact granite with hydrosta tic
pore pressure fails at St, slight ly above Pp. Due to uniaxial strength, rock will not fail in shear above
approximately 8 km. At shallower depths, Sh is limited to approximately Pr, by tensile failure of the rock.
iii ) Shear failure is limited to depths below 10 km for dry rock (Pp = 0). b) Reverse faulting regime
(S, = 03): The rock can theoretically support significantly higher deviatoric stresses in this case. The
potential strength of intact rock, whether saturated or dry, is more than twice the frictional strength for all
depths shown. Under these conditions, an increase in fluid pressure above hydrostat ic will tend to drive the
system towards failure along low-angle thrust faults. The three cases correspond to conditions described in
4.
itive values. At temperatures between 100 and 300°C
and high pore water pressure [ll], laboratory samples
of granite tend to exhibit greater in stabili ty than at
higher temperatures where a - b becomes strongly pos-
itive. This is an interesting observation since the 300’
isotherm corresponds approximately with the base of
the seismogen ic zone on the San Andreas fault. I note
in passing that all intact rocks exhibit a strong velocity-
strengthening effect (see section on rate dependence).
Just as I described a link between internal friction and
sliding strength in the beginning of this chapter , so too
can a link be made betwe en the rate dependen ce of in-
tact strength and frictional strength. A recent, concise
review of friction studies in rock has been presented by
Evans and Dresen [38].
4.FACTORS AFFECTING ROCK STRENGTH
In this section , we examine some of the variables
that affect rock strength. Their relative importance
can be summarized in the following way. If we consider
a ‘typical’ granitic rock saturated
with water at room
temperature and confining pressure of 100 MPa, the
following changes should e ach result in a reduction in
strength of approximately 10%: a decrease in confining
pressure of 24 MPa or an increase in pore pressure of
24 MPa, a decrease in strain rate of 3 f 0.5 orders of
7/18/2019 Rock Failure
http://slidepdf.com/reader/full/rock-failure 11/21
LOCKNER 137
magnitude, an increase in temperature of 190 f 40 “C,
or an increase in sample dimension of 50-110%. Each
of these effects is next considered separately.
4.1. Confining Pressure Effect
Confining pressure affects brittle fracture strength
by suppressing the growth of dilatant microc racks.
Microc racks tend to grow parallel to cri when a sample
is loaded in compression by iocal ly overcoming the
ambient compressive stress field near crack tips and
developing a localized region of tensile stress. This
process requires some speciali zed mechanism such as
slip along grain boundaries or bending of a rigid grain
that is adjacent to an open pore or more compliant
grain [121, 126, 134, 1521. Such mechanisms are
generally enhanced by deviatori c stress and suppressed
by mean stress. In addition, slip along grain boundaries
will not occur until frictiona l contact strength, which
increases with mean stress, is overcome. The overall
strengthening effect can be represented in a Mohr
diagram such as Figure 6 for Wester ly granite. A
generalized version of this diagram, shown in Figure 1,
demonstrates the well known relationsh ips between
7,~n,~1,~3,
and friction angle 4 = tan-’ p i’. In
general, the failure envelope is concave towards the
normal stress axis and the difference between intact
shear strength and frictiona l shear strength vanishes at
high pressure [65].
The majority of strength measurements have been
conducted under uniaxial or ‘triaxial’ stress conditions
in which g2 = 03. A limited number of true t riaxia l
measurements have been performed to explore the effect
of intermediate principal stress on failure mode. While
the most commonly used failure criter ia (e.g., Mohr-
Coulomb) assume that failure is independent of inter-
mediate stress,experimental evidence demonstrates that
this assumption is not strict ly true [3, 104, 1051.
4.2. Pore Fluid
Effective pressure law. Pore fluids can affect fracture
strength through a direct pressure effect as well as
through chemical interactions with the rock matrix.
Mechanicall y, pore pressure reduces the normal stress
throughout the rock mass according to the effective
pressure law [61]:
on
efr = g
n-
Q’G (17)
where Q is a constant related to pore geometry. While
variations in a have been measured for the effect of pore
pressure on transport properties [159], cr = 1 is appro-
priate for fracture strength of rock with well-connected
Westerly granite
,’
,
L
,
0 /’
Byerlee’s law
0 I” ’
i
0
500 1000 1500
Normal Stress, MPa
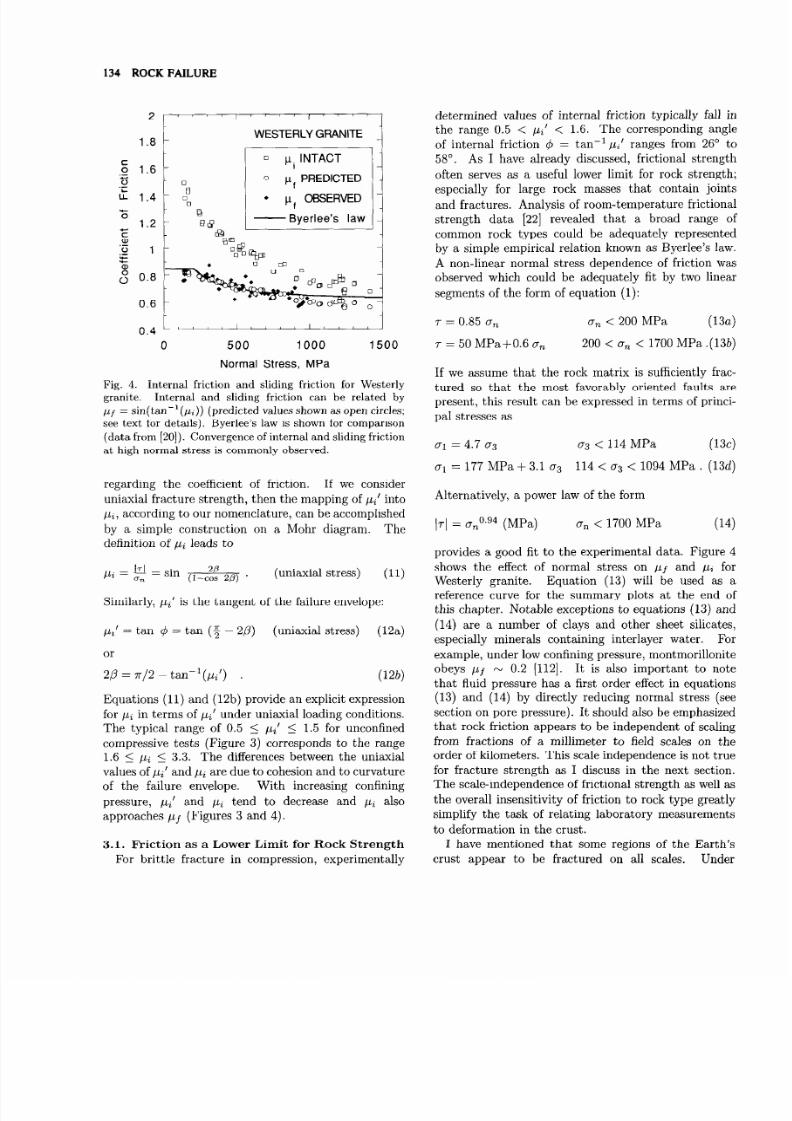
Fig. 6. Shear-normal stress plot for Wester ly granite. Mohr-
Coulomb failure envelope (solid line is concave towards
normal stress axis.
porosity. If fluid pressures in the crust were low, the
increase in mean st ress with depth, due to overburden
pressure, should result in large shear strength and the
gradual change from brittle to ductile deformation in
the mid to lower crust (as suggested by the convergence
of frictiona l and intact strength in Figure 6). The nor-
mal hydraul ic head for well-connected porous material
will offset the overburden pressure by over one-third.
However, for isolated porosity at depth, normal consol-
idation and dewatering processes can compress pore flu-
ids to well above hydrostatic pressures and under proper
circumstances may lead to repeated episodes in which
the rock is hydraulically fractured. There is currently
considerable interest in fluid overpressure phenomena
and their relation to oil reservo ir partitions [63, 1231 as
well as to larger-scale crustal processes such as earth-
quake cyc les and the reduction of strength of mature
faults [19, 23, 24, 116, 1281.
Chemical interactions. Since water reacts with sili-
cates to disrupt the Si-0 bond, pore fluids can have a
profound chemical effect on the physical properties of
crustal silicate rocks. CO2 concentration plays a similar
role in the diagenesis and metamorphism of carbonates.
Crack healing, cementation and densification all act to
strengthen rock with time [55]. By contrast, chemi-
call y assisted crack growth is the primary mechanism
for stress corrosion and static fatigue at temperatures
in the 0 to 200°C range [73, 74, 83, 1331, by providing
a mechanism for crack growth below the criti cal stress
intensity needed to split lattice bonds (KI < K~c) [6,

7/18/2019 Rock Failure
http://slidepdf.com/reader/full/rock-failure 12/21
138 ROCK FAILURE
301. Subcritical crack growth rate v is generally related
to
KI
through a power law
u = AlKIn
(18)
or exponential form
u = A2
exp(bzKr)
(19)
An alternative view relates velocity to energy release
rate Gl(o: Kr2) [83]:
u = A3
exp(baGI)
(20)
Experimental data are insufficient to identify which form
is correct.
However, there are theoretical arguments,
based on reaction rate theory, to prefer (19) or (20)
128, 831. Nominal values for n at room temperature
and in wet roc k [5] (Table 11.6) are 15 - 40 for quartz
and quartz rocks ; 10 - 30 for calcite rocks ; 30 - 70
for granitic rocks ; and 25 - 50 for gabbro and basalt.
A typical value for
b2
for room temperature granite is
0.04 (MPa.m ‘/2)-l . The corrosive effect of the pore
fluid can be altered significantly by varying the activity
of dissolved species as well as altering the electrochem-
ical potential [6, 36, 38, 54, 641. This is a rich and
promising area for future research.
4.3. Strain Rate
In the brittle deformation field, rocks typically exhi-
bit a pseudo-viscous effect which is reflected in a
strength increase with increasing strain rate. This effect
is best known in the mining industry as static fatigue in
which a pillar or other load-bearing structure will fail af-
ter some period of time under constant load. Subcr itica l
tensile crack growth has been identified as the principa l
mechanism responsible for static fatigue in rock [73, 74,
831 and has been studied in recent years [6]. A practical
lower limit for laboratory strain rates is lo-“’ s-l which
is sti ll much faster than geologic rates in even tectoni-
cally active regions. It does represent, however, a useful
limit for many engineering applications. Experimental
results covering a broad range of strain rates are shown
in Figure 7. Average strain rates have been obtained
from stat ic fatigue tests on Barre granite [73] by divid-
ing time-to-failure data by total inelastic strain. Vari-
ous
studies [28, 83, 951 have been successful in relating
this macroscopic relation between stress and strain rate
to subcritical microcrack growth rate and its sensitivity
to stress intensity at crack tips. They determined an
apparent activation volume of 0.43 * 0.04 kJ.MPa/mole
(4.3 x 1O-4 m3/mole) for crack growth in granite creep
10000
m
s
1000
z
0,
L
G
.I
E
ii
s
100
n
10
STRAIN RATE EFFECT
I ” 7 , ’ 1 ”
C concrete N novaculite
G granite S oil shale
L limestone T tuft
M qtz-monzonite
--p-p G. Pc=150 MPa
m p G. Pc=200
G, Pc=O
-10 -5 0
Log (Strain Rate), s - ’
5
Fig. 7. Effect of strain rate on brittle fracture strength.
Data
taken from [15, 44, 46, 73, 1171. For strain rates
below approximately 10/s, rate sensitivity is typically 5-10%
strength increase per decade increase in strain rate. This
effect is primarily due to the stress dependence of subcr itical
microcrack growth. Trend lines in lower-right quadrant
(from [46]) are from dynamic tensile fracture experiments.
experiments. This approach provides a link between en-
ergetics of microcrack extension and bulk pseudoviscous
response of rocks in creep. It may also prove useful as
a way to incorporate time-dependent effects in damage
mechanics applications [30]. This rate sensitivity is of-
ten expressed as a power law dependence of the form
CTmax = a i” .
(21)
Typical rate sensitivities in this regime are 0.02 < n 5
0.04.
By using shock and other impuls ive loading tech-
niques, strain rates in excess of lo4 s-l have been achiev-
ed for samples failing in tension [46]. While some ques-
tion remains as to the importance of machine and bound-
ary condition effects,numerous experiments show a tran-
sitiona l strain rate of approximately 10/s above which
signifi cantly larger rate dependence is observed. High-
rate tensile experiments, taken from Grady and Lipkin
[46], are summarized in the lower-right quadrant of Fig-
ure 7 as trend lines without accompanying data values.
An upper limit of
n
_< l/3 has been indicated by both
theory and experiment [15, 46, 47, 81, 1171 for rate sen-

7/18/2019 Rock Failure
http://slidepdf.com/reader/full/rock-failure 13/21
LOCKNER 139
sitivity under these conditions.
TEMPERATURE EFFECT
4.4. Temperature
Mechanisms of crystal plasticity involving dislocation
motion and twinning are thermally activated and will
dominate brittle cracking as temperature increases [38,
701. Some minerals, such as halite and calcite , will de-
form ductile ly at room temperature if sufficient confin-
ing pressure is present to suppress brittle crack growth
[42]. However, dry quartz appears to deform brittle ly
at room temperature even at confining pressures in ex-
cess of 1 GPa [154]. As previously mentioned, water has
a significant effect on pressure -assisted grain-boundary
deformation mechanisms such as pressure solution [ll,
541. These fluid-assisted mechanisms will often dom-
inate at intermediate temperatures and, over geologic
time scales, may play an important role in determining
rock strength at room temperature [133]. Thus, even
in the brittle regime, increasing temperature tends to
reduce fracture strength [16, 136, 1631. The effect of
temperature on fracture strength of Wester ly granite is
shown in Figure 8.
4.5. Sample Size and Scaling
The ability in laboratory studies to provide precise
control of pressure, temperature and other environmen-
tal conditions has resulted in a large volume of rock
strength data obtained from laboratory measurements.
However, there exist s a significant question concern-
ing the scaling rules appropriate for relating laboratory
measurements to field applications [122]. The lack of
adequate testing of these scaling rules may represent
a significant weakness in our ability to apply labora-
tory measurements to large-scale engineering and field
research problems. For example, the largest laboratory
fault models (approximately l-m2 surface) are many or-
ders of magnitude less than the fault area involved in a
moderate earthquake. A general result of fracture me-
chanics analysis is that stress intensity at the tip of a
flaw scales as the square root of the flaw size. Conse-
quently, larger samples, which can contain larger flaws,
are more like ly to be weak. This argument assumes,
of course, that small samples with visible flaws (and
certainly flaws that completely bisect the sample) w ill
be rejected and not included in the strength stati stics.
However, the degree of weakening has not been well de-
termined and should vary from rock to rock depending
on the flaw-s ize distribution . Scaling procedures have
been proposed [l, 94, 981 that address this problem. In
addition, both laboratory and field studies have been
Tullis & Yund 1977, Pc=lOOO MPa
500
0 200 400 600 800
Temperature, “C
Fig. 8. Effect of temperature on brittle fracture strength
of nominally dry Wester ly granite. Above approximately
300°C in laboratory experiments (strain rates > IO-’ s-l),
high pore fluid pressures can signifi cantly reduce strength
through a variety of thermally-ac tivated dissolut ion/precipi-
tation processes. A t temperatures below 300”. fluid-ass isted
reactions become more and more sluggish. Even so, subcr it-
ical crack growth can still play an important role in reducing
strength (see static fatigue and fluid effects).
conducted [9, 32, 51, 52, 57, 72, 102, 124, 1441 that
show a general weakening with increased sample size
(Figure 9). This effect can be large: as much as a 70%
strength loss per decade sample size for the weathered
diorite studied by Pratt et al. [124]. Available data
are insufficient to allow a clear understanding of this
effect. It is intriguing that the weak rock types show
the greatest size effect. Pratt et al. noted a decrease
in size sensi tivity for samples greater than lm length
for both diorite and coal and suggested that this may
represent an upper limit to the weakening region. Due
to the small amount of existing data, it is not yet clear
to what extent these tendencies can be generalized. If
flaw size is the correct explanation for the weakening
effect, then sample strength will depend as much on
crack-size distribution as on minerology. Furthermore,
the studies cited here are all unconfined. As already
mentioned, we may expect large rock masses, especiall y
in tectonically active regions, to support stresses that
are comparable to their frictional strength rather than

7/18/2019 Rock Failure
http://slidepdf.com/reader/full/rock-failure 14/21
140 ROCK FAILURE
SIZE EFFECT
& Cm Olorite
- Coal (Bleniaw.)
10
1
0.1 t.
0.01 0.1 1 10
Sample Leng th , m
Fig. 9. Effect of sample size on fracture strength. Observed
weakening is as much as 70% per decade increase in sample
length.
laboratory-measured intact strength.
5. COMPILED STRENGTH DATA
The plots in this section are intended mainly as a
quick reference to the range of typica l rock strengths.
The data presented are by no means exhaustive and
undoubtedly suffer to some degree from sampling bias
within the literature. For example, a preponderance
of ‘weak’ tuffs may have been studied and reported by
investigators for a period of time, giving a false impres-
sion that all tuffs are weak. Unconfined compressive
strength and tensile strength ranges are plotted in Fig-
ures 10a and lob. These are summaries of the data
presented in [78] (Appendix II). Next come a series of
plots (Figures lla-e) showing the dependence of frac-
ture strength on confining pressure. Data for these plots
have been compiled from [20, 50, 65, 103, 141, 142,
1601. Again, this is not meant to be an exhaustive com-
pilation of existing data, although approximately 1900
data pairs are represented in Figures 10 and 11. Indi-
vidual data values have been shown in Figures lla-e to
provide a sense of the variability within different rock
types. Other researchers have attempted to draw a sin-
gle curve to represent ‘characteristic’ rock strength for
different rock types. However, one of the long-standing
problems in analyzing rock strength data is the fact that
strength is quite variable; even within a given class of
rocks . I have also included a representative trend line
in the strength plots, although in some cases, there is
such variability in fracture strength that this trend line
has little significance. Granites and other low-poros ity
crystalline silica tes appear to be among the most well-
behaved classes. In this case, a characteristic strength
curve may be followed to within approximately 25%.
High-poros ity silicates are weaker and their range of
strengths show much more variability. In fact, it is not
surprising that a strong inverse correlation exists be-
tween fracture strength and porosity. However, this is
not a perfect correlation since such factors as grain size ,
grain shape, and cementation also affect strength.
For basalts and granites, the Byerlee friction law
provides a consistent lower bound for rock strength.
This result is in agreement with the earlier analysis in
this chapter and suggests that some samples plotted in
Figures lla-b contained significant pre-existing flaws
which, especially at higher confining pressures, result
in lowered strength. Many of the sandstones and tuffs
show fracture strengths significantly below Byerlee’s
law. This effect, which is closely correlated with
porosity [125], is of potential importance in engineering
applications. One explanation is that the failure
Compressive Strength (Unconfined)
100 200 300 400 500
Compressive Strength. MPa
B Tensile Strength
0
10 20 30 40 50 60 70 80
Tensile Strength. M Pa
Fig. 10.
a) Unconfined compressive strength at room
temperature for a variety of rock types (data from [78]
appendix II). Each box represents f25% of the data about
the median value (show as verti cal line).
Error bars
represent the full range of the data with the exception of
outliers which are plotted as individual circles. b) Tensile
strength at room temperature for a variety of rock types
(data from [78] appendix II). Explanation of symbols i s the
same as for (a).

7/18/2019 Rock Failure
http://slidepdf.com/reader/full/rock-failure 15/21
LOCKNER 141
m 2500
k
^ 2000
E
o 1500
z
-
‘E
L 1000
a
E
a
500
0
(4
I I I
2 800
I
? 600
G
0 200 400 600
A
Confining Pressure, MPa
(b)
0 200 400 600
B
1500
m
k
- 1000
E-i
E
z
m
-
E
?2 500
a
E
n
0
Confining Pressure, MPa
/z
0 200 400 600
C
Confining Pressure, MPa
000
500
0
Confining Pressure, MPa
0
200 400 600
E
Confining Pressure, MPa
Fig. 11. Compilation of room temperature fracture strength
data for representative rock types. Individual data points
are plotted to show variability for each rock type. Represen-
tative curves are also drawn; although in some cases strength
varies too much to be well represented by a ‘characteri stic’
curve. Much of the strength variability is inversely corre-
lated with sample porosity.
strength reported for these samples is related to the
collapse of the internal pore structure. With continued
deformation and the accompanying porosity loss, many
of these samples will gradually strain-harden and return
to a more typica l frictional strength. This effect was
pointed out by [21] and more recently by Wong [164].
A separate weakening effect is due to the presence of
sheet silicates, such as biotite, that contain a good

7/18/2019 Rock Failure
http://slidepdf.com/reader/full/rock-failure 16/21
142 ROCK FAILURE
cleavage plane. Many clays, especially expansive clays
such as montmorillonite that include interlayer water,
are unusually weak at room temp erature and will
deform at very low shear stresses [112]. Graphite also
exhibits this effect at room temperature. Finally, some
minerals are able to activate dislocation mechanisms
at room temperature (especially with increasing mean
stress) and exhibit a brittle-ductile transition in the
classical sense.
That is, at low confining pressure
they deform by pressure-sensitive microcrack growth,
then pass through a transition with increasing confining
pressure to a ductile flow regime in which strength ha
little pressure sensitivity; deformation at high confining
pressure involves, for example, dislocation glide and
twinning. Carbonate s and halite show this effect.
Acknowledgments. I thank R. Summers for his assistanc e
in conducting the literature search for this chapter. J
Byerlee has been a great help in identifying the more
important and useful concepts in this broad field of subject
matter. I also thank A. McGarr, W. Olsso n and an
anonymous reviewer for their thoughtful suggestions.
1.
2.
3.
4.
5.
6.
7.
8.
AllCgre, C., J. LeMouel, and A.
Provost, Scaling rules in rock frac-
ture and possible implication s for
earthquake prediction, Nature,
297, 47-49, 1982.
Amadei, B., and M. J. Robi-
son, Strength of rock in multiaxia l
loading conditions, in Proc. 27th
U.S. Symp. on Rock Mech., edited
by H. L. Hartman, pp. 47-55, Sot.
Mining Eng., Inc., Littleton, Co.,
1986.
Amadei, B., M. J. Robison, and
Y. Y. Yassi n, Rock strength and
the design
of underground ex-
cavations, in Large Rock Caverns.
edited by K. H. 0. Saari, pp. 1135-
1146, Pergamon Press, New York,
1987.
Ashby, M. F., and C. G. Sam-
mis, The damage mechanics of
brittle solid s in compression, Pure
& Appl. Geophys., 133, 489-521,
1990.
Atkinson, B. K. (Ed.), Fracture
Mechanics of Rock, 534 pp., Aca-
demic Pre ss, New York, 1987.
Atkinson, B. K., and P. G. Mere-
dith, Experimental fracture me-
chanics data for rocks and miner-
als, in Fracture Mechanics of Rock,
edited by B. K. Atkinson, pp. 477-
525, Academ ic Press , New York,
1987.
Barton, N., R. Lien, and J. Lunde,
Engineering classification of rock
masses for the design of tunnel
support, Rock Mechanics, 6, 189-
236, 1974.
Bernabe, Y., The effective pres-
REFERENCES
sure law for permeability in
Chelmsford granite and Barre gra-
nite, Int. J. Rock Mech. Min. Sci.
& Geomech. Abstr., 23, 267-275,
1986.
9. Bieniaw ski, Z. T., The effect of
specimen size on compressive
strength of coal, Int. J. Rock
Mech. Min. Sci. & Geomech.
Abstr., 5, 325-335, 1968.
10. Bieniawski, Z. T.. Rock mass clas-
sification in rock engineering, in
Proc. Symp. on Exploration for
Rock Engineering, edited by Z. T.
Bienia wski, pp. 97-106, Johannes-
burg, 1976.
11. Blanpied, M. L., D. A. Lockner,
and J. D. Byerlee, Fault stability
inferred from granite sl iding ex-
periments at hydrothermal condi-
tions, Geophys. Res. Lett., 18,
609-612, 1991.
12. Bock, H. (Ed.), An Introduction
to Rock Mec hanics, 342 pp., James
Cook Unive rsity of North Queens-
land, Townsvi lle, Australia , 1978.
13. Bohler,F. M.,and H. Spetzler, Ra-
diated seism ic energy and strain
energy release in laboratory dy-
namic tensile fracture, Pure Appl.
Geophys., 124, 759-772, 1986.
14. Brace, W. F.,Permeability of crys -
talline and argillaceous rocks, Znt.
J. Rock Mech. Min. Sci. & Ge-
omech. A bstr., 17, 241-251, 1980.
15. Brace, W. F., and A. H. Jones,
Comparison of uniaxial deforma-
tion in shock and static loading of
three rocks, J. Geophys. Res., 76,
4913-4921, 1971.
16. Bragg, R. A., and 0. B. Ander-
sland, Strain rate, temperature,
and sample size effects on com-
pression and tensile properties o
frozen sand, Eng. Geol., 18, 35-
46, 1981.
17. Broek, D., Elementary Engineer-
ing Fracture Mechanics, 469 pp.,
Martinus Nijhoff,The Hague,l982.
18. Budiansk y, B., and R. J. O’Con-
nel, Seismic velocities in dry and
saturated cracked solids, J. Geo-
phys. Res., 79, 5412-5426, 1974.
19. Byerlee, J. D., Friction, overpres-
sure and fault normal compres-
sion, Geophys. Res. Lett., 17,
2109-2112, 1990.
20. Byerlee, J. D., Frictiona l charac-
teristic s of granite under high con-
fining pressure, J. Geophys. Res.,
72, 3639-3648, 1967.
21. Byerlee, J. D., Brittle-du ctile tran-
sition in rocks, J. Geophys. Res.,
73, 4741-4750, 1968.
22. Byerlee, J. D., Friction of rocks,
Pure Appl. Geophys., 116, 615-
626, 1978.
23. Byerlee , J. D., The change in ori-
entation of subsid iary shears near
faults containing pore fluid un-
der high pressure, Tectonophys ics,
211, 295-303, 1992.
24. Byerlee, J. D., Model for episodic
flow of high pressu re water in fault
zones before earthquakes, Geology,
21, 303-306, 1993.
25. Byerlee, J. D., and D. A. Lock-
ner, Acou stic emission during fluid
injection in rock, in Proceedings,
First Conference on Acous -
7/18/2019 Rock Failure
http://slidepdf.com/reader/full/rock-failure 17/21
LOCKNER 143
tic Emission/Microseismic Actiu-
ity in Geological Structures and
Materials, edited by H. R. Hardy
and F. W. Leighton, pp, 87-98,
Trans. Tech. Publicatio ns, Claus-
thal-Zellerfeld, Germany, 1977.
26. Byerlee, J. D., and J . C. Sav-
age, Coulomb plasti city within the
fault zone, Geophys. Res. Lett.,
19, 2341-2344, 1992.
27. Cai, D., Y. Fang, W. Sui, L.
Zhang, J. Li, and N. Geng, The b-
value of acoustic emission during
the complete process of rock frac-
ture, Acta Seismologica Sinica, 2,
129-134, 1988.
28. Costin, L. S., A microc rack model
for the deformation and failure of
brittle rock, J. Geophys. Res., 88,
9485-9492, 1983.
29. Costin, L. S., Damage mechanics
in the post-failure regime,Mechan-
its of Materials, 4, 149-160, 1985.
30. Costin, L. S., Deformation and
failure, i n Fracture Mechanics of
Rock, edited by B. K. Atkinson,
pp. 167-215, Ac ademic Press , New
York, 1987.
31. Deere, D. U., Technic al descrip -
tion of rock cores for engineer-
ing purposes, Rock Mechanics and
Eng. Geol., 1, 17-22, 1964.
32. Dey, T., and P. Halleck , Some as-
pects of size-effect in rock failure,
Geophys. Res. Lett., 8, 691-694,
1981.
33. Dieterich, J. H., Constitutive prop-
erties of faults with simulated
gouge, in Mechanical Behavior of
Crustal Rocks, pp. 103-120, A mer.
Geophys. Union Monograph, Wash-
ington, 1981.
34. Du, Y., and A. Aydin, Interaction
of multiple crack s and formation
of echelon crack arrays, Int. J.
Numerical and Analy tical Methods
in Geomech., 15, 205-218, 1991.
35. Dunn, D. E., L. LaFountain, and
R. Jackson , Poros ity dependence
and mechanism of brittle fracture
in sandstones,. J. Geophys. Rex,
78, 2403-2417, 1973.
36. Dunning, J. D., W. L. Lewiqand D.
E. Dunn, Chemomechanical weak-
ening in the presence of surfac-
tants, J. Geophys. Res., 85, 5344-
5354, 1980.
37. Estrin, Y., and L. P. Kubin, Plas -
tic instabil ities: phenomenology
and theory, Materials Sci . and
Eng., A137, 125-134, 1991.
38. Evans, B., and G. Dresen, De-
formation of earth materials: six
easy pieces, Reviews of Geophys.,
IUGG Report, 823-843, 1991.
39. Evans, B., and T.-f. Wong, Shear
localization in rocks induced by
tectonic deformation, in Mechan-
ics of Geomaterials, edited by Z.
Bazant, pp. 189-210, John Wile y,
New York, 1985.
40. Fisc her, G. J., and M. S. Pater-
son, Measurement of permeability
and storage capacity in rocks dur-
ing deformation at high temper-
ature and pressure, in Fault Me-
chanic s and Transport Properties
of Rocks, edited by B. Evans and
T.-F. Wong, pp. 213-252, A ca-
demic Press, London, 1992.
41. Franklin, J. A., Triaxi al strength
of rock materials, Rock Mech., 3,
86-98, 1971.
42. Fredrich, J., B. Evans, and T.-
f. Wong, Micromec hanics of the
brittle to plastic transition in Car-
raramarble, J. Geophys. Res., 94,
4129-4145, 1989.
43. Friedman, M., Porosi ty, perme-
ability, and rock mechanics - a
review, in 17th U.S. Symp. on
Rock Mechanics, edited by W. S.
Brown, S. Green and W. Hus-
trulid, pp. 2Al.l-2A1.17, Univ. of
Utah, Salt Lake City, 1976.
44. G oldsmith, W., J. Sackman, and C.
Ewert, Static and dynamic frac-
ture strength of Barre granite, Znt.
J. Rock Mech. Min. Sci. & Ge-
omech. Abs., 13, 303-309, 1976.
45. Gottscha lk, R. R., A. K. Kronen-
berg, J. E. Russe ll, and J. Handin,
Mechanical anisotropy of gneiss:
failure criterion and textural
sources of directional behavior, J.
Geophys. Res., 95, 21613-21634,
1990.
46. Grady, D. E., and J. Lipkin, Cri-
teria for impulsi ve rock fracture,
Geophys. Res. Leit., 7, 255-258,
1980.
47. Green, S. J., J. Leasia, R. Perkins ,
and A. Jones, Triaxial stress be-
havior of Solenhofen limestone and
Weste rly granite at high strain
rates, J. Geophys. Res., 77, 1972.
48. Griffith, A. A., The phenomena of
rupture and Aow in solids , P hilos.
Trans. R. Sot. London Ser. A,
221, 163-198, 1920.
49. Hadley, K., Comparison of calcu-
lated and observed crack densi-
ties and seismic veloc ities in West-
erly granite, J. Geophys. Res., 81,
3484-3494, 1976.
50. Handin, J., Strength and ductil-
ity, in Handbook of Phys ical Con-
stants, edited by S. P. Clark, pp.
223-289, The Geologi cal Sot. of
Amer., Inc., New York, 1966.
51. Herget, G., and K. Unrug, In situ
rock strength from triaxia l testing,
Int. J. Rock Mech. Min. Sci . &
Geomech. Abstr., 13, 299-302,
1976.
52. Heuze,F. E.,Scal e effects in the de-
termination of rock mass strength
and deformability, Rock Mech., 12,
167-192, 1980.
53. Hickman, S. H., Stress in the litho-
sphere and the strength of active
faults, Reviews of Geophys., IUGG
Report, 759-775, 1991.
54. Hickman, S. H., and B. Evans, E x-
perimental pressure solution in ha-
lite: the effect of grain/interphase
boundary structure, J. Geol. Sot.,
148. 549-560, 1991.
55. Hickman, S. H., and B. Evans ,
Growth of grain contacts in halite
by solution-transfer: implicati ons
for diagenesis, lithifi cation, and
strength recovery, in Fault Me-
chanic s and Transport Properties
of Rocks, edited by B. Evans and
T.-f. Wong, pp. 253-280, Aca -
demic Press , London, 1992.
56. Hirata, T., T. Satoh, and K. Ito,
Fractal s tructure of spatial d istri-
bution of microfracturing in rock,
Geophys. J. R. Astr. Sot., 90,
369-374, 1987.
57. Hodgson, K., and N. G. W. Cook,
The effects of size and stress gra-
dient on the strength of rock, in
Proc. 2nd Congress Inter. Sot.
Rock Mech., pp. 31-34, Belgrad,
Yugoslavia, 1970.

7/18/2019 Rock Failure
http://slidepdf.com/reader/full/rock-failure 18/21
144 ROCK FAILURE
58. Hoek, E.,and E. T. Brown, Under-
ground Ex cavation s in Rock, 527
pp., The Inst.
of Mining and
Metallurgy, London, 1980.
59. Holcomb, D. J., and L. S. Costin,
Detecting damage surfaces in brit-
tle materials using acoustic emis-
sions, J. Appl. Mech., 108, 536-
544, 1986.
60. Horii, H., and S. Nemat-Nasser,
Brittle failure in compressio n:split-
ting, faulting and brittle-ductile
transition, Philos . Trans. R. Sot.
London, ser. A, 319, 337-374,
1986.
61. Hubbert,M. K.,and W. W. Rubey,
Role of fluid pressure in mechanics
of overthrust faulting, But Geol.
Sot. Amer., 70, 115-166, 1959.
62. Hugman, R. H. H., III, and M.
Friedman, Effects of texture and
composition on mechanical behav-
ior of experimentally deformed
carbonate rocks, Bul. Amer. As-
soc. Pet. Geol., 69, 1478-1489,
1979.
63. Hunt, J. M.,Generation and migra-
tion of petroleum from abnormally
pressured fluid compartments,
Am. Assoc. Petrol. Geol. Bull.,
74, l-12, 1990.
64. Ishido, T., and H. Mizutani, Rela-
tionship between fracture strength
of rocks and zeta-potential, Tec-
tonophysics, 67, 13-23, 1980.
65. Ismail, I. A. H., and S. A. F. Mur-
rell, The effect of confining pres-
sure on stress-drop in compres-
sive rock fracture, Tectonophysics ,
175, 237-248, 1990.
66. Jaeger, J. C., and N. G. W. Cook,
Fundamentals of Rock Mechanics,
593 pp., Chapman and Hall , New
York, 1984.
67. Ju, J. W., O n energy-based cou-
pled elastoplastic damage theories:
constitutive modeling and compu-
tational aspects,
ht.
J. Solids
Structures, 25, 803-833, 1989.
68. Ju, J. W., On two-dimensional self-
consistent micromechanical dam-
age models for brittle solids, 1nt.
J. Solid Structures, 27, 227-258,
1991.
69. Kemeny, J. M., and N. G. W.
Cook, Crack mode ls for the failure
of rocks in compression, in Con-
stitutive Laws for
Engineering
Ma-
terials: Theory and Applicatio ns,
edited by C. S. Desai, pp. 878-887,
Elsev ier Science Pub. Co., Inc.,
1987.
70. Kirby, S. H., and A. K. Kronen-
berg, Rheology of the lithoshpere:
selected topics, Rev. of Geophys.,
25, 1219-1244, 1987.
71. Kirby, S. H., and J. W. McCor-
mick, Inelastic properties of rocks
and minerals: strength and rheol-
ogy, in CRC Handbook of Phys ical
Properties of Rocks, edited by R.
S. Carmichael, pp. 139-280, CRC
Press, Inc., Boca Raton, Florida,
1984.
72. Koifman, M. I., The siz e factor
in rock-pressure investigations, in
Mechanical Properties of Rocks,ed-
ited pp. 109-117, Akademiya Nauk
SSSR (English translation), Mos-
cow, 1963.
73. Kranz, R. L., The effects of confin-
ing pressure and stress difference
on static fatigue of granite, J. Geo-
phys. Res., 85, 1854-1866, 1980.
74. Kranz. R. L., W. J. Harris, and N.
L. Carter, Static fatigue of granite
at 2OO”C, Geophys. Res. Lett., 9,
1-4, 1982.
75. Kranz, R. L., T. Satoh, 0. Nish -
izawa,K. Kusunose, M. Takahashi,
K. Masuda, and A. Hirata, Labo-
ratory study of fluid p ressure dif-
fusion in rock using acoustic emis-
sions, J. Geophys. Res., 95, 21593-
21607, 1990.
76. Lachenbruch, A. H., and J. H.
Sass, Heat flow and energetics of
the San Andreas fault zone, J.
Geophys.
Res., 85, 6185-6222,
1980.
77. Lade, P., R. B. Nelson, and Y. M.
Ito, Instability of granular mate-
rials with nonassociated flow, J.
Eng. Mechanics, 114, 2173-2191,
1988.
78. Lama, R. D., and V. S. Vutukuri,
Handbook on Mechanical Proper-
ties of Rocks, 481 pp., Trans Tech
Publications , Clausthal, Germany,
1978.
79. Lawn, B. R., and T. R. Wilshaw ,
Fracture of brittle solids, 204 pp.,
Cambridge Univ. Press, 1975.
80. Linde, A. T., and M. J. S. John-
ston, Source parameters of the Oc-
tober 1, 1987 Whittier Narrows
earthquake from crustal deforma-
tion data, J. Geophys. Res., 94
9633-9643, 1989.
81. Lipkin, J., and A. K. Jones, Dy-
namic fracture strength of oil shale
under torsional loading, in Proc.
20th U. S. Symposium on Rock
Mechanics, pp. 601-606, Austin,
Texas, 1979.
82. Lockner, D. A., The role of acous-
tic emission in the study of rock
fracture, Int. J. Rock Mech. Min.
Sci. & Geomech. Abstr., 90, 883-
899, 1993.
83. Lockner, D. A., Room tempera-
ture creep in saturated granite, J.
Geophys. Res., 98, 475-487, 1993.
84. Lockner, D. A., and J. D. Byerlee,
Acous tic emission and creep in
rock at high confining pressure and
differential stress, Bull. of the
Seismo logical Society of Amer., 67,
247-258, 1977.
85. Lockner, D. A., and J. D. Byerlee,
Acous tic emission and fault forma-
tion in rocks, in Proceedings, First
Conference on Acous tic Emis-
sion/ Microseismic Activity
in Ge-
ological
Structures
and Materials,
edited by H. R. Hardy and W. F.
Leighton, pp. 99-107, Trans Tech
Publications, Clausthal-Zellerfeld,
Germany, 1977.
86. Lockner, D. A., and J. D. Byerlee,
Hydrofracture in Weber sandstone
at high confining pressure and dif-
ferential stress, J. Geophys. Res.,
82, 2018-2026, 1977.
87. Lockner, D. A., and J. D. Byerlee,
Development of fracture planes
during creep in granite, in Proceed-
ings, Second Conference on Acous-
tic
Emission/Microseismic
Activ-
ity in Geological Structures and
Materials, edited by H. R. Hardy
and W. F. Leighton, pp. ll-
25, Trans-Tech Publications , Clau-
sthal-Zellerfeld, Germany, 1980.
88. Lockner, D. A., and J. D. Byer-
lee, Complex resis tivity measure-
ments of confined rocks, J. Geo-
phys. Res., 90, 7837-7847, 1985.
7/18/2019 Rock Failure
http://slidepdf.com/reader/full/rock-failure 19/21
LOCKNER 145
89. Lockner, D. A., and J. D. Byer -
lee, Changes in complex resistivity
during creep in granite, Pure Appl.
Geophys., 124, 659-676, 1986.
90. Lockner, D. A., and J. D. By-
erlee, How geometric constraints
contribute to the weakness of ma-
ture faults, Nature, 363, 250-252,
1993.
91. Lockner, D. A., and J. D. Byer-
lee, Precursory AE patterns lead-
ing to rock fracture, in Proceed-
ings, Fifth Conference on Acous -
tic Emission/Microseismic Activ-
ity in Geological Structures and
Materials, edited by H. R. Hardy,
pp. 14 (in press), Trans-Tec h Pub-
lications,Clausthal-Zellerfeld, Ger-
many, 1994.
92. Lockner, D. A., J. D. Byerlee, V.
Kuksenk o, A. Ponomarev, and A.
Sidorin, Quasi-st atic fault growth
and shear fracture energy in gran-
ite, Nature, 350, 39-42, 1991.
93. Lockner, D. A., J. D. Byerlee,
V. Kuksenk o, A. Ponomarev, and
A. Sidorin, Observatio ns of qua-
sistat ic fault growth from acous-
tic emissions,
in Fault Mechan-
ics and Transport Properties of
Rocks, edited by B. Evans and
T.-F. Wong, pp. 3-31, Academ ic
Press , London, 1992.
94. Lockne r, D. A.,and T. R. Madden,
A multiple crack model of brittle
fracture - 1. non-time-dependent
simulations , J. Geophys. Res., 96,
19623-19642, 1991.
95. Lockner, D. A., and T. R. Mad-
den, A multiple crack model of
brittle fracture - 2. time-dependent
simulations, J. Geophys. Res ., 96,
19643-19654, 1991.
96. Lockner, D. A., D. E. Moore, and
Z. Reches, Microcrack interaction
leading to shear fracture, in 33rd
U.S. Rock Mechanics Symposium,
edited by J. R. Tillerso n and W. R.
Wawers ik, pp. 807-816, Balkema,
A. A., Rotterdam, 1992.
97. Lockner, D. A., J. B. Walsh, and J.
D. Byerlee, Changes in seismic ve-
locit y and attenuation during de-
formation of granite, J. Geophys.
Res., 82, 5374-5378, 1977.
98. Madden, T. R., Microc rack con-
nectivity in rocks: a renormaliza-
tion group approach to the criti -
cal phenomena of conduction and
failure in crystalline rocks, J. Geo-
phys. R es., 88, 585-592, 1983.
99. Main, I. G., and P. G. Meredith,
Classifi cation of earthquake pre-
cursors from a fracture mechanics
model, Tectonophy sics, 167, 273-
283, 1989.
100. Masuda, K., 0. Nishizawa , K. Ku-
sunose, T. Satoh, M. Takahashi,
and R. Kranz, Posit ive feedback
fracture process induced by non-
uniform high-pressure water flow
in dilatant granite, J. Geophys.
Res., 95, 21583-21592. 1990.
101. McNally , G. H., Estimation of coal
measures rock strength using sonic
and neutron logs, Geoexploration,
24,
381-395, 1987.
102. Mogi, K., The influence of the
dimensions of specimens on the
fracture strength of rocks, Bu l.
Earthquake Res. Inst., 40, 175-
185, 1962.
103. Mogi, K., Pressu re dependence of
rock strength and transition from
brittle fracture to ductile flow, Bull.
Earthquake Research Inst.,44, 215-
232, 1966.
104. Mogi, K., E ffect of the intermedi-
ate principal stress on rock failure,
J. Geophys. Res., 72, 5117-5131,
1967.
105. Mogi, K., Effect of the triaxial
stress system on rock failure, in
Rock Mechanics in Japan, edited
by S. Okamoto, pp, 53-55, Japan
Society of Civil Engineers, Tokyo,
1970.
106. Moore, D. E., and D. A. Lockner,
The role of microcra cking in shear-
fracture propagation in granite, J.
Struct. Geol., in press, 1994.
107. Morgan,F. D.,E. R. Williams ,and
T. R. Madden, Streaming poten-
tial properties of Weste rly gran-
ite with applications, J. Geophys.
Res., 94, 12449-12461, 1989.
108. Morrow, C.,and W. F. Brace, Elec-
trical resistiv ity changes in tuffs
due to stress, J. Geophys. Res.,
86, 2929-2934, 1981.
109.Morrow, C., and J. Byerlee, Per-
meability of core samples from Ca-
jon Pass Scientific Drillhole: re-
sults from 2100 to 3500 m depth,
J. Geophys. Res., 97, 5145-5151,
1992.
110. Morrow,C.,D. A. Lockner,S. Hick -
man, M. Rusanov, and T. Rockel,
Effects of lithology and depth on
the permeability of core samples
from the Kola and KTB drill h oles,
J. Geophys. Res., 99, 7263-7274,
1994.
111. Morrow,C., D. Moore,and J. Byer-
lee, Permea bility and pore-Auid
chemistry of the Bullfrog tuff in a
temperature gradient,in Proc. 24th
U. S. Symp. on Rock Mech., pp.
819-828, 1983.
112. Morrow, C., B. Radney, and J. By-
erlee, Friction al strength and the
effective pressure law of montmo-
rillonite and illite clays, in Fault
Mechanics and Transport Proper-
ties of Rocks, edited by B. Evans
and T.-f. Wong, pp. 69-88, Aca-
demic Press , London, 1992.
113.Morrow, C. A., Z. Bo-Chong, and
J. D. Byerlee, Effective pressure
law for permeability of West erly
granite under cyc lic loading, J.
Geophys. Res., 91, 3870-3876,
1986.
114. Morrow,C. A.,L. Q. Shi,and J. D.
Byerlee, Permeability of fault
gouge under confining pressure and
shear stress, J. Geophys. Res., 89,
3193-, 1984.
115. Nishizawa , O., K. Onai, and K. Ku-
sunose, Hypocenter distribution
and focal mechanism of AE events
during two stress stage creep in
Yugawara andesite, Pure Appl.
Geophys., 122, 36-52, 1984.
116. Nur, A., and J . Walder, Time-de-
pendent hydrauli cs of the Earth’s
crust, in The Role of Fluids in
Crustal Proces ses, pp. 113-127,
National Academy Press , 1990.
117.Olsson, W. A., The compressive
strength of tuff as a function of
strain rate from 10-6 to 103/set,
Int. J. Rock Mech. Min. Sci . U
Geomech. Abs., 28, 115-118, 1991.
118. Ord, A., I. Vardoulak is, and R.
Kajew ski, Shear band formation in
Gosford s andstone, Znt. J. Rock
Mechanics Min. Sci. & Geomech.

7/18/2019 Rock Failure
http://slidepdf.com/reader/full/rock-failure 20/21
146 ROCK FAILURE
Abstr., 28, 397-409, 1991.
119. Palmer, A. C., and J. R. Rice, The
growth of slip surfaces in the pro-
gressive failure of over-consolidat-
ed clay, Proc. Roy. Sot. Lond.
A., 332, 527-548, 1973.
120. Paterson, M., Experimental Rock
Deformation, 254 pp., Springer,
New York, 1978.
121. Peng, S.,and A. M. Johnson,Crack
growth and faulting in cylindrica l
specimens of Chelmsford granite,
Int. .J. Rock Mech.
Min. Sci. &
Geomech. Abs., 9, 37-86,
1972.
122. Pinto da Cunha, A. (Ed.),
Scale
Effects in Rock Masses, 339 pp.,
A. A. Balkema, Rotterdam, 1990.
123. Powley, D. E., Pressures and hy-
drogeology in petroleum basins,
Earth-Sci.
Revs., 29, 215-226,
1990.
124. Pratt, H. R., A. D. Black , W. S.
Brown, and W. F. Brace, The ef-
fect of specimen size on the me-
chanical properties of unjointed di-
orite, Int.
J. Rock Mech. Min.
Scz. &
Geomech.
Abstr., 9,
513-
529, 1972.
125. Price, R. H., and S . J. Bauer, An-
alysi s of the elastic and strength
properties of Yucca Mountain tuff,
Nevada, in 26th U.S. Symp. of
Rock Mechantis, pp. 89-96, A. A.
Balkema, Rotterdam, 1985.
126. Reches, Z., and D. A. Lockner,
Nucleation and growth of faults in
brittle rocks,
J. Geophys. Rex,
in
press, 1994.
127. Rice, J. R., Constitutive relations
for fault slip and earthquake insta-
bilities, Pure Appl. Geophys., 121,
443-475, 1983.
128. Rice, J. R., Fault stress states, pore
pressure distributions, and the
weakness of the San Andreas fault,
in
Fault Mechanics and Transport
Properties of Rocks,
edited by B.
Evans and T.-f. Wong, pp. 475-
503, Academic Press,London, 1992.
129. Rice, J. R., and A. L. Ruina, Sta-
bility of steady frictional slipping,
J. Appl. Mech., 50, 343-349, 1983.
130. Rudnicki, J. W., Effects of dilatant
hardening on the development of
concentrated shear deformation in
fissured rock masses, J.
Geophys.
Res., 89, 9259-9270,
1984.
131. Rudnicki, J. W.. and J. R. Rice,
Conditions for the localization of
deformation in pressure-sensitive,
dilatant materials, J.
Mech. Phys.
Solids,
23, 371-394, 1975.
132,Ruina, A. L., Slip instab ility and
state variable fr iction laws, J. Geo-
phys. Res., 88, 10359-10370, 1983.
133. Rutter, E. H., and D. H. Main-
price, The effects of water on stress
relaxation of faulted and unfaulted
sandstone, Pure
Appl. Geophys.,
116, 634-654, 1978.
134. Sammis, C. G., and M. F. Ashby,
The failure of brittle porous solids
under compressive stress states,
Acta metall., 34, 511-526, 1986.
135. Satoh, T., 0. Nishizawa, and K.
Kusunose, Fault development in
Oshima granite under triaxial
compression inferred from hypo-
center distribution and focal mech-
anism of acoustic emission, Tohoku
Geophys. J., 33.
241-250, 1990.
136. Sayles , F. H., and D. L. Carbee,
Strength of frozen silt as a function
of ice content and dry unit weight,
Eng.
Geol., 18, 55-66,
1981.
137. Scholz , C. H., The frequency-mag-
nitude relation of microfracturing
in rock and its relation to earth-
quakes, Bul. Seismological Sot.
Amer., 58,
399-415, 1968.
138. Scholz,
C.
H.,
The mechanics of
earthquakes and faulting,
439 pp.,
Cambridge Univ. Press, New York,
1990.
139. Shamir, G., and M. D. Zoback,
The stress orientation profile in
the Cajon Pass, California, scien-
tific drillho le, based on detailed
analysis of stress induced borehole
breakouts, in
Rock at
Great
Depth,
edited by V. Maury and D. Four-
maintraux, pp. 1041-1048. A. A.
Balkema, Rotterdam, 1989.
140. Sheorey, P. R., A. K. Biswas, and
V. D. Choubey, An empirical fail-
ure criterion for rocks and jointed
rock masses,
Engineering Geol.,
26, 141-159, 1989.
141. Shimada, M., The method of com-
pression test under high pressures
in a cubic press and the strength of
granite,
Tectonophysics, 72, 343-
357, 1981.
142.Shimada, M., A. Cho, and H
Yukutake, Fracture strength of dry
silicate rocks at high confining
pressures and activit y of acoustic
emission, Tectonophysics, 96, 159-
172, 1983.
143. Singh, J., T. Ramamurthy, and G
Rao, Strength of rocks at depth,
in
Rock
at Great
Depth,
edited
by Maury and Fourmaintraux, pp.
37-44, Balkema, Rotterdam, 1989.
144. Singh, M. M., and P. J. Huck,
Large scale triaxial tests on rock,
in
Proc. 14th Symp.
on Rock
Mech., pp. 35-60, Amer. Sot. o
Civi l Engineers, New York, 1972.
145. Soga, N., H. Mizutani, H. Spetzler,
and R. J. Martin, The effect o
dilatancy on veloci ty anisotropy
in Westerl y granite, J. Geophys.
Res., 83, 4451-4458,
1978.
146. Sondergeld, C. H., and L. H. Estey,
Acoustic emission study of micro-
fracturing during the cyclic load-
ing of Wester ly granite, J. Geo
phys. Res., 86, 2915-2924,
1981.
147. Sondergeld, C. H., and L. H. Estey,
Source mechanisms and microfrac-
turing during uniaxial cycling o
rock, Pure
Appl. Geophys., 120
151-166, 1982.
148. Spetzler, H., H. Mitzutani, and F
Rummel, Fracture and flow, in
An
elasticity in the Earth, edited b
W. Schreyer, pp. 85-93, E . Schwei-
zerbartische Verlagsbuchhandlung,
Stuttgart, 1982.
149. Spetzler, H., G. Sobolev, C. Son
dergeld, B. Salov, I. Getting, and
A. Koltsov, Surface deformation,
crack formation, and acoustic ve
locity changes in pyrophyllite un
der polyaxia l loading, J. Geophys.
Res., 86,
1070-1080, 1981.
150. Sulem, J., and I. Vardoulakis, Sim-
plified bifurcation analysis of deep
boreholes in rocks with microstruc-
ture, in
Rock at Great Depth,
ed
ited by Maury and Fourmaintraux,
pp. 845-852, Balkema, Rotterdam,
1989.
151,Takahashi, M., and H. Koide, Ef
fect of the intermediate principal
stress on strength and deformation
behavior of sedimentary rocks a

7/18/2019 Rock Failure
http://slidepdf.com/reader/full/rock-failure 21/21
the depth shallower than 2000 m,
in
Rock at Great Depth,
edited by
V. Maury and D. Fourmaintraux,
pp. 19-26, A. A. Balkema, Rotter-
dam, 1989.
152.Tapponnier, P., and W. F. Brace,
Development of stress-induced mi-
crocracks in Westerly granite,
Int.
J.
Rock Mech.
Min. Sci. & Ge-
omech. Abstr., 13,
103-112, 1976.
153. Terada, M., T. Yanagidani, and S.
Ehara, A. E. rate controlled com-
pression test of rocks, in 3rd Conf.
on Acoustic Emission/Microseis-
mic Activity in Geol. Structures
and Mater&edited by H. R. Har-
dy and F. W. Leighton, pp. 159-
171, Trans-Tech Publications, Clau-
sthal-Zellerfe ld, Germany, 1984.
154. Tullis , J., and R. A. Yund, Exper-
imental deformation of dry West-
erly granite, J. Geophys. Res., 82,
5705-5718, 1977.
155.Tiirk, N., and W. R. Dearman,
A practical classification of rocks
for engineering purposes, Bzll . Int.
Assoc. Eng. Geology, 28,
161-167,
1983.
157. Vernik, L., D. A. Lockner, and M.
156. Vardoulak is, I., M. Goldscheider,
and G.Gudehus, Formation of shear
bands in sand bodies as a bifur-
cation problem,
Inter. J. for Nu-
merical and Analytical
Methods
in
Geomech., 2,
99-128, 1978.
D. Zoback, Anisotropic strength
of some typica l metamorphic rocks
from the KTB pilot hole, Ger-
many,
Scientijic Drilling, 3,
153-
160, 1992.
158. Vernik, L., and M. D. Zoback,
Strength anisotropy in crystalline
rock: implications for assessment
of in situ stresses from wellbore
breakouts, in
Proc., 31st U. S.
Rock Mechanics Symposium,
ed-
ited by W. A. Hustrulid and G. A.
Johnson, pp, 841-848, A. A. Bal-
kema, Rotterdam, 1990.
159. Walsh, J. B., Effect of pore p res-
sure and confining pressure on frac-
ture permeability, Int. J. Rock
Mech. Min. Sc i. & Geomech. Ab-
str.,
18, 429-435,
1981.
160. Wawersik , W. R., and W. F. Brace,
Post-fa ilure behavior of a granite
and a diabase, Rock Mech., 3, 61-
85, 1971.
161. Wawersik , W. R., J. W. Rudnick i,
W. A. O&on, D. J. Holcomb, and
K. T. Chau, Localization of defor-
mation in brittle rock: theoreti-
cal and laboratory investigations,
in Micromechanics
of Failure of
Quasi-brittle Materials,
edited by
S. P. Shah, S. E. Swartz and M. L.
Wang, pp. 115-124, Elsevier Sci-
ence Pub., London, 1990.
J. D. Byerlee, Changes in b-value
162. Weeks, J. D., D. A. Lockner, and
LOCKNER 147
during movement on cut surfaces
in granite,
Bull. of the Seismolo gi-
cal
Society
of Amer., 68, 333-341,
1978.
163. Wong, T.-f., Effects of tempera-
ture and pressure on failure and
post-failure behavior of Westerl y
granite,
Mechanics
of Materials,
1,
3-17, 1982.
164. Wong, T.-f., Mechanical compac-
tion and the brittle-duc tile transi-
tion in porous sandstones, in
De-
formation Mechanisms, Rheology
and Tectonics,
edited by R. J.
Knipe and E. H. Rutter, pp. Ill-
122, Geological Sot. Special Pub-
lication No. 54, 1990.
165. Yanagidani, T., S. Ehara, 0. Nish-
zawa, K. Kusunose, and M. Ter-
ada, Localization of dilatancy in
Ohshima granite under constant
uniaxial stress, J. Geophys. Res.,
90, 6840-6858, 1985.
166.Yudhbir, W. Lemanza, and F.
Prinzl, An empirical failure cri-
terion for rock masses, in Proc.
5th Int. Congress
on
Rock Mech.,
pp. Bl-B8, Int. Sot.
for
Rock
Mechanics, Balkema, Melbourne,
1983.
167.Zhaoyong, X., G. Naiguang, and
M. Shirong, Acoustic emission m-
values of rock failure and mechanic
properties of the rock,
J. Seismo-
logical Res., 13,
291-297, 1990.