romania – top destination for investments thessaloniki, june, 2007
Post on 19-Dec-2015
214 views
TRANSCRIPT
Romania – Top Romania – Top Destination for Destination for
InvestmentsInvestmentsThessaloniki, June, 2007
2
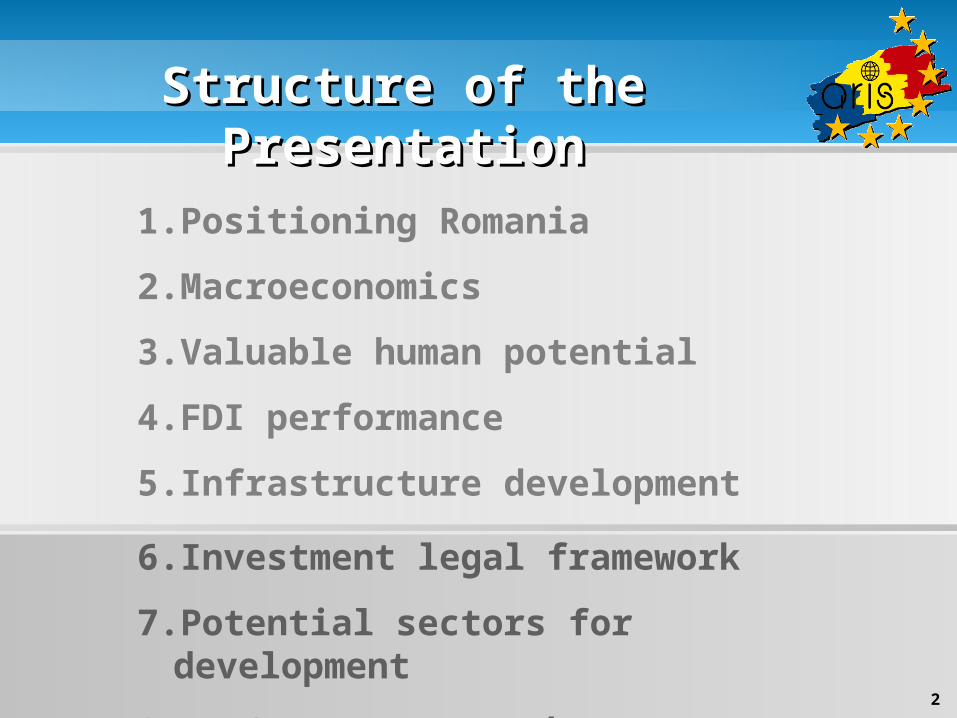
Structure of the Structure of the PresentationPresentation
1.Positioning Romania
2.Macroeconomics
3.Valuable human potential
4.FDI performance
5.Infrastructure development
6.Investment legal framework
7.Potential sectors for development
8.ARIS – one stop shop

1. Positioning Romania1. Positioning Romania

4
Romania the largest market in CE Romania the largest market in CE EuropeEurope
Our friend the wind
AreaArea238,391 km2
PopulatioPopulationn
21.6 mill inhabitants
Capital Capital citycity
Bucharest1.9 mill inh
Member Member ofof
EU, WTO, IMF, WB, EFTA, NATO
Major Major CitiesCities
Iasi, Timisoara, Cluj-Napoca,Brasov, Constanta
5
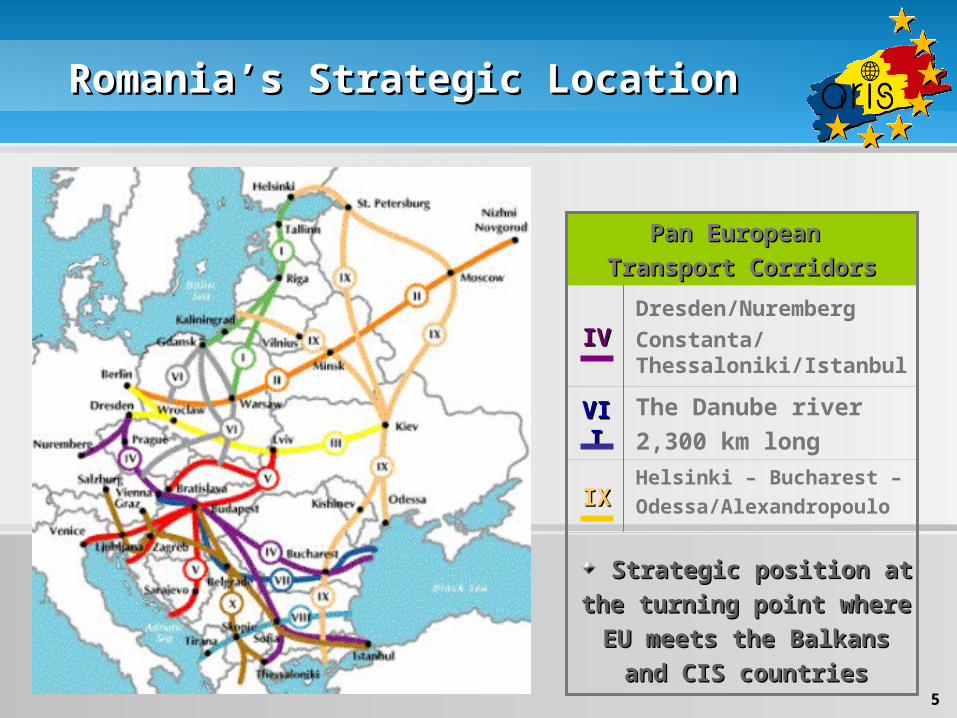
Romania’s Strategic LocationRomania’s Strategic Location
Helsinki – Bucharest –Odessa/AlexandropouloIXIX
The Danube river2,300 km long
VIIVII
Dresden/NurembergConstanta/Thessaloniki/Istanbul
IVIV
Pan European Pan European
Transport CorridorsTransport Corridors
Strategic position at Strategic position at
the turning point where the turning point where
EU meets the Balkans EU meets the Balkans
and CIS countriesand CIS countries

2. Macroeconomics2. Macroeconomics
7
4.1%
7.7%
6.5%
8.4%
5.2%5.1%5.7%
2.1%
2000 2001 2002 2003 2004 2005 2006 2007e
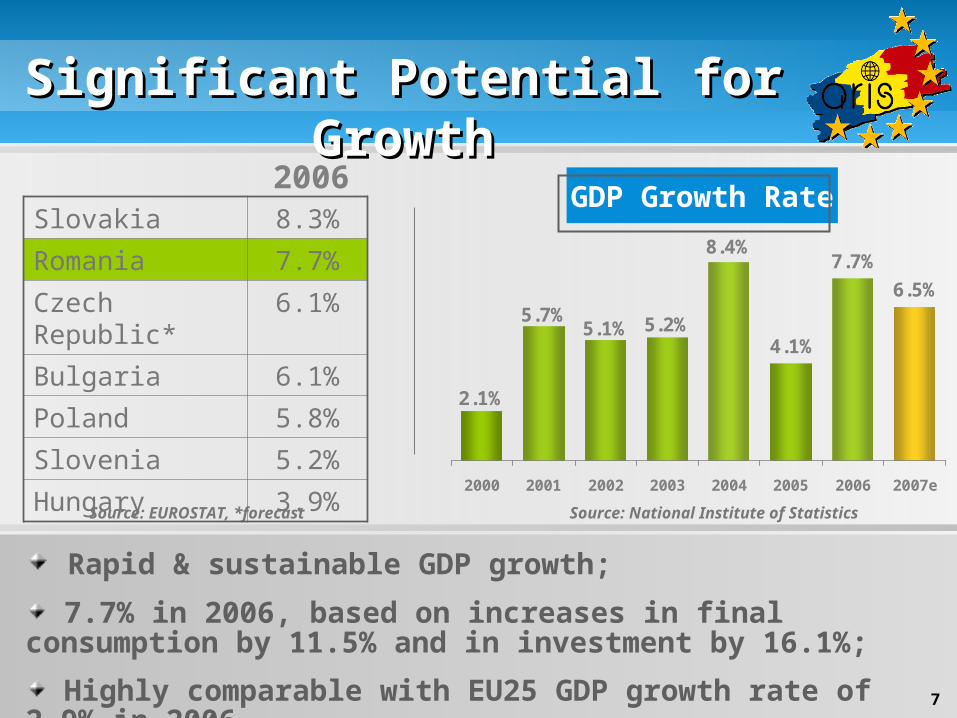
Significant Potential for Significant Potential for GrowthGrowth
2006
Rapid & sustainable GDP growth;
7.7% in 2006, based on increases in final consumption by 11.5% and in investment by 16.1%;
Highly comparable with EU25 GDP growth rate of 2.9% in 2006.
Source: EUROSTAT, *forecast Source: National Institute of Statistics
GDP Growth RateSlovakia 8.3%
Romania 7.7%
Czech Republic*
6.1%
Bulgaria 6.1%
Poland 5.8%
Slovenia 5.2%
Hungary 3.9%

8
Declining InflationDeclining Inflation
Consolidation of low inflation (sustainable disinflation);
3.66% (Mar'07/Mar'06), a record low for the post-1990 period;
Average annual rate - 6.56% in 2006.
Source: EUROSTAT Source: National Bank of Romania
Inflation Rate
4.0% 3.8%4.86%8.6%
40.7%
30.3%
17.8%14.1%
9.3%
2000 2001 2002 2003 2004 2005 2006 2007e 2008e
Annual Inflation Annual Inflation RateRate
Dec'06/Dec'05
HungaryHungary 6.6%6.6%
BulgariaBulgaria 6.1%6.1%
Romania Romania 4.9%4.9%
SlovakiaSlovakia 3.7%3.7%
SloveniaSlovenia 3.0%3.0%
Czech RepCzech Rep 1.5%1.5%
PolandPoland 1.4%1.4%

3. Valuable Human Potential3. Valuable Human Potential

10
Human CapitalHuman Capital
Young population (more than 50% under 40 years old)Almost 21.7 million people
Demographics
Talent pool160 higher education institutions109 thou university graduatesAvailability of technical engineersHigh industrial experienceFlexibilityIncreased labor productivity Low unionization
Cities with more than 100,000 inhabitants
more than 1,000,000 inhabitants
300,000 – 400,000 inhabitants
200,000 – 300,000 inhabitants
100,000 – 200,000 inhabitants
Source: National Institute of Statistics
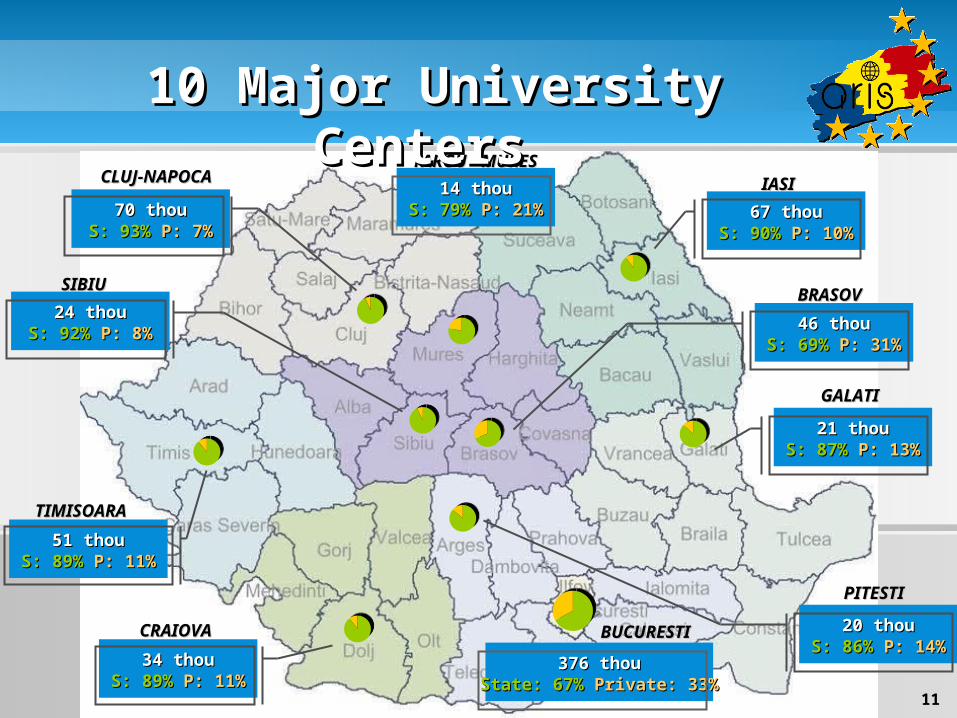
11
BUCURESTIBUCURESTI
376 thou376 thouState: 67%State: 67% Private: 33%Private: 33%
CLUJ-CLUJ-NAPOCANAPOCA
SIBIUSIBIU
TIMISOARATIMISOARA
BRASOVBRASOV
IASIIASI
CRAIOVACRAIOVA
GALATIGALATI
70 thou70 thouS: 93%S: 93% P: 7%P: 7%
67 thou67 thouS: 90%S: 90% P: 10%P: 10%
51 thou51 thouS: 89%S: 89% P: 11%P: 11%
46 thou46 thouS: 69%S: 69% P: 31%P: 31%
34 thou34 thouS: 89%S: 89% P: 11%P: 11%
24 thou24 thouS: 92%S: 92% P: 8%P: 8%
21 thou21 thouS: 87%S: 87% P: 13%P: 13%
20 thou20 thouS: 86%S: 86% P: 14%P: 14%
PITESTIPITESTI
14 thou14 thouS: 79%S: 79% P: 21%P: 21%
TARGU - TARGU - MURESMURES
BUCURESTIBUCURESTI
10 Major University 10 Major University CentersCenters
12
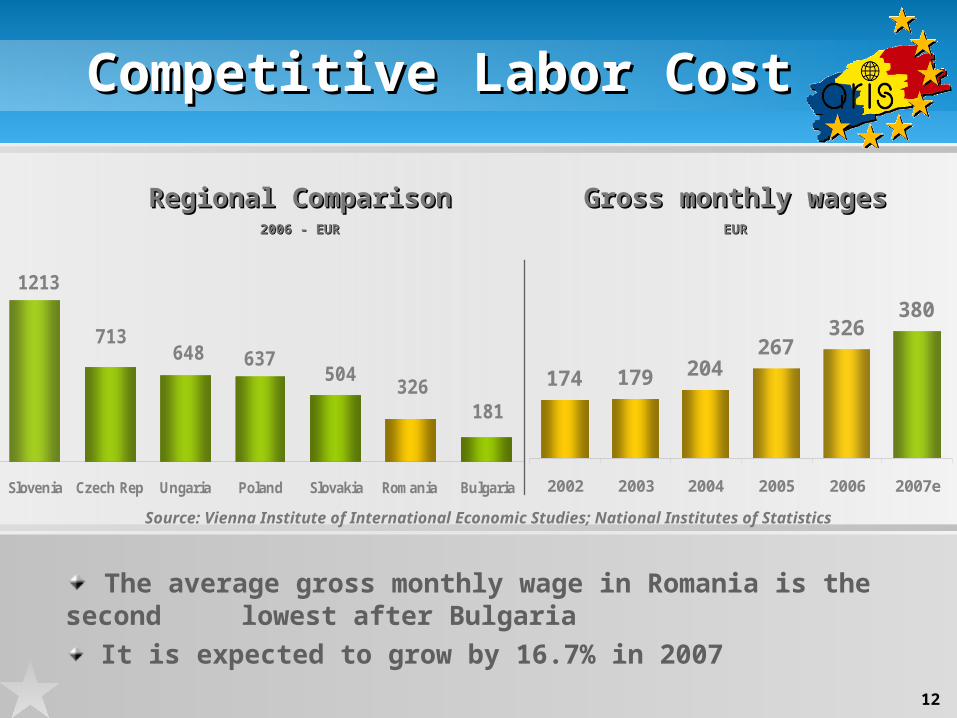
181326
504637648
713
1213
Slovenia Czech Rep Ungaria Poland Slovakia Romania Bulgaria
CompetitiveCompetitive Labor CostLabor Cost
174 179 204267
326380
2002 2003 2004 2005 2006 2007e
Regional ComparisonRegional Comparison2006 - EUR2006 - EUR
Gross monthly wagesGross monthly wagesEUREUR
Source: Vienna Institute of International Economic Studies; National Institutes of Statistics
The average gross monthly wage in Romania is the second lowest after Bulgaria
It is expected to grow by 16.7% in 2007

4. FDI Performance4. FDI Performance

14
1147 1294 1212
5183 5213
9082
1946
2000 2001 2002 2003 2004 2005 2006
Inward FDI FlowsInward FDI Flows
2006
Record value in 2006;
FDI Stock over EUR 30 bill (1990 –2006);
In February 2007 – EUR 870 mill
Source: Vienna Institute of International Economic Studies
Source: National Bank of Romania
Annual Inward FDI1 Poland 11093
2 Romania 9082
3 Hungary 4874
4 Czech Republic
4752
5 Bulgaria 4105
6 Slovakia 3324
7 Slovenia 303
EU
R
million

15
Subscribed Capital by Country Subscribed Capital by Country and by Field of Activityand by Field of Activity
- March 2007 –- March 2007 –
No CountryNo. of
companies
Subscribed
capital EURO mill
11 NetherlanNetherlandsds
27872787 32103210
22 AustriaAustria 43574357 21822182
33 FranceFrance 48774877 15741574
44 GermanyGermany 1456914569 15621562
55 ItalyItaly 2231422314 736736
66 USAUSA 50435043 674674
77 Great Great BritainBritain
29012901 630630
88 CyprusCyprus 26932693 617617
99 GreeceGreece 37123712 554554
1010 Dutch Dutch AntillesAntilles
1212 547547
Industry50.7%
Retailing5.3%
Wholesale6.4%
Transport6.2%
Construction1.3%
Tourism 1.4%
Agriculture0.9%
Services27.8%
Value of Subscribed Value of Subscribed Capital Capital
by Field of Activityby Field of Activity
Source: National Trade Register Office
16
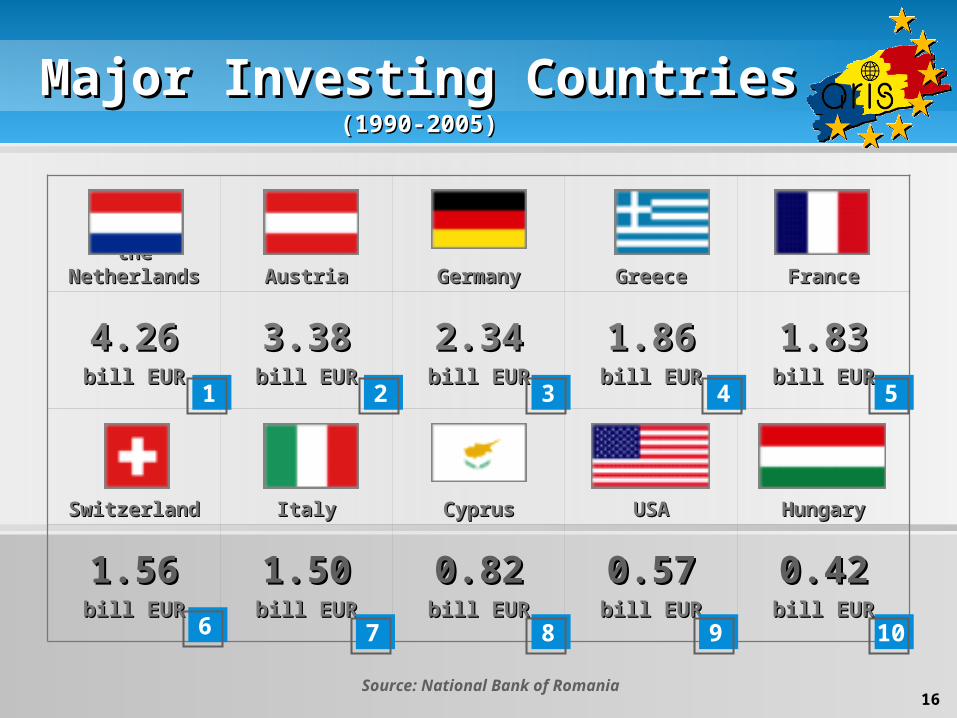
the the NetherlandsNetherlands AustriaAustria GermanyGermany GreeceGreece FranceFrance
4.264.26bill EURbill EUR
3.383.38bill EURbill EUR
2.342.34bill EURbill EUR
1.861.86bill EURbill EUR
1.831.83bill EURbill EUR
SwitzerlandSwitzerland ItalyItaly CyprusCyprus USAUSA HungaryHungary
1.561.56bill EURbill EUR
1.501.50bill EURbill EUR
0.820.82bill EURbill EUR
0.570.57bill EURbill EUR
0.420.42bill EURbill EUR
Major Investing CountriesMajor Investing Countries(1990-2005)(1990-2005)
1 2 3 4 5
6 7 8 9 10
Source: National Bank of Romania

17
14.5%
15.0%
37.3%
4.2%3.0%
7.7% 7.3%10.9%
Manufacturing Trade
Financial services Communication
Services Mining
Utilities Others
FDI by Field of ActivityFDI by Field of Activity(1990-2005)(1990-2005)
4.3%3.8%
11.0%
7.5%
8.6%
4.8%7.0%22.0%
17.4%
13.7%
Methalurgy Food processing
Transport means Chemicals
Construction materials Wood processing
Textile IT&C
Machinery Others
Manufacturing – 8.2 bill EUR
Main Activities – 21.9 bill EUR
Source: National Bank of Romania

18
North-West
5.8% 1.3 bill
CENTRU
7.4% 1.6 bill
West
6.8% 1.5 bill
Bucharest-Ilfov
60.6% 13.2 bill
South West
0.7 bill 3.4%
South Muntenia
1.4 bill 6.3%
South East
1.8 bill 8.4%
North East
0.2 bill 1.3%
FDI Regional Spreading FDI Regional Spreading (1990-2005)(1990-2005)
Source: National Bank of Romania
1
23
4 5
6
7
8

5. Infrastructure Development5. Infrastructure Development
20
BUCURESTIFETESTI
CERNAVODA
GIURGIU
ADUNATII COPACENI
GILAU
ARAD
TIMISOARA
DRAJNA
SUPLACU DE BARCAU
BORS
NADLAC
LUGOJ
DEVA
ORASTIE
SEBES
SIBIU
PITESTI
CONSTANTA
MIHAILESTI
CAMPIATURZII
TARGU MURES
SIGHISOARA
FAGARAS
BRASOV
PREDEAL
COMARNIC
PLOIESTI
BUZAU
FOCSANICRISTIAN GHIMBAV
BICAZ
PRAID
SOVATA
PIATRA NEAMT
GHEORGHIENI
SABAOANI
ALBITA
CRAIOVA
CALAFAT
IASI
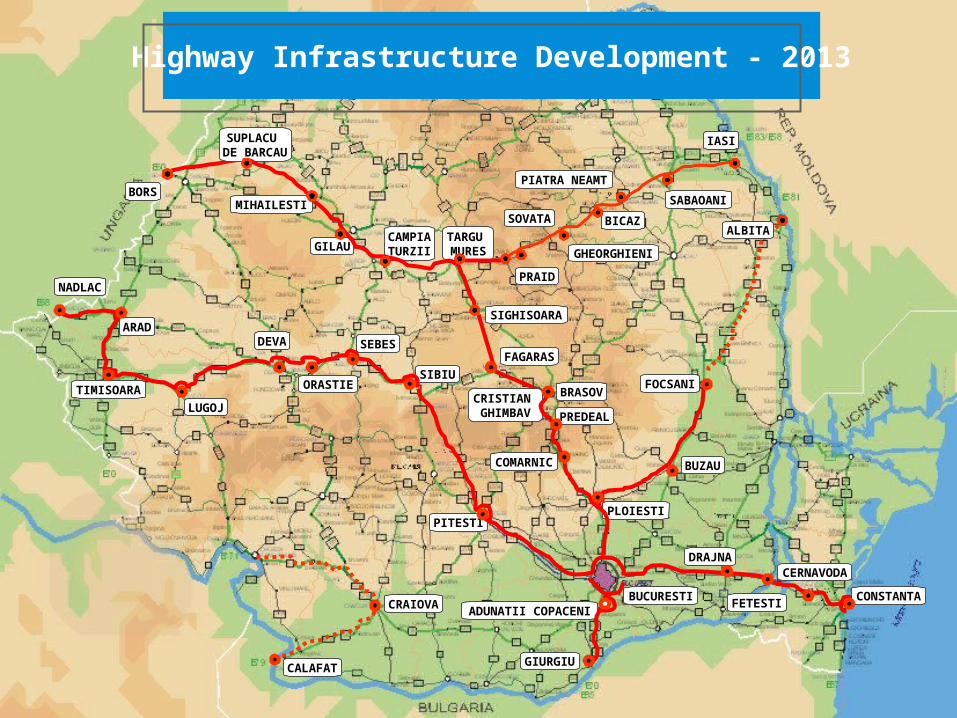
Highway Infrastructure Development - 2013

21
ARADARAD
CRAIOVCRAIOVAA
TIMISOATIMISOARARA
BAIA MAREBAIA MARESATU SATU MAREMARE
CLUJ CLUJ NAPOCANAPOCA
ORADEAORADEA
TARGU TARGU MURESMURES
SIBIUSIBIU
OTOPEOTOPENINI
IASIIASI
BACAUBACAU
SUCEAVSUCEAVAA
M. M. KOGALNICEANKOGALNICEAN
UU
BANEABANEASASA
MANGAMANGALIALIA
CONSTANCONSTANTATA
BRAILABRAILA
GALAGALATITI
OLTENIOLTENITATAGIURGIGIURGI
UU
SULINSULINAA
CORABICORABIAA
DROBETA TR. DROBETA TR. SEVERINSEVERIN
Ports and AirportsPorts and Airports
International flights
Domestic flights
TULCETULCEAA
22
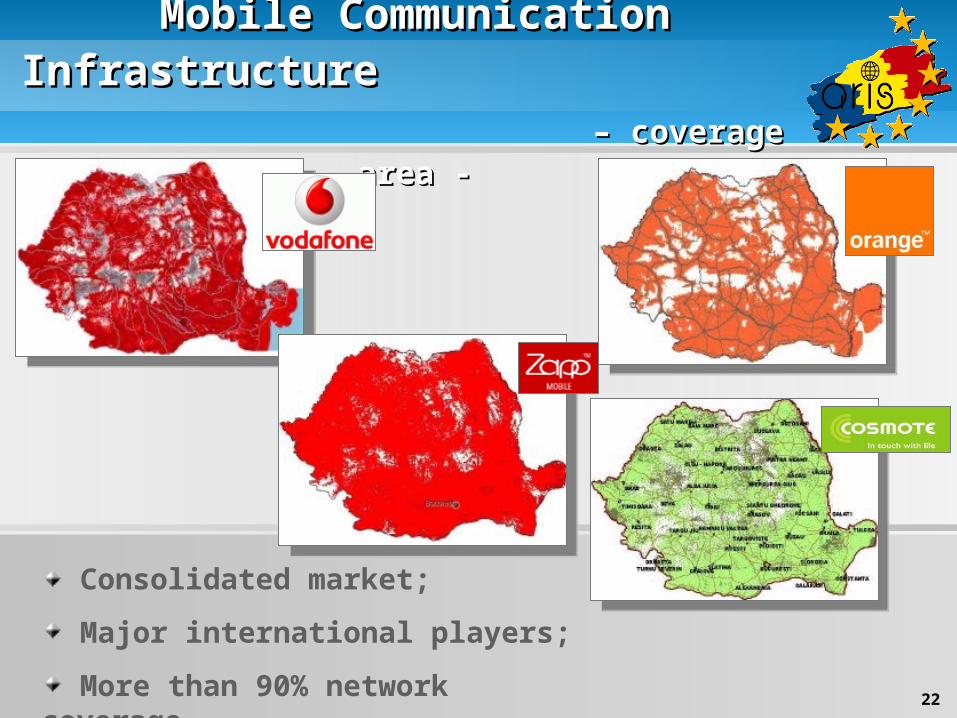
Mobile Communication Mobile Communication InfrastructureInfrastructure
– coverage area -– coverage area -
Consolidated market;
Major international players;
More than 90% network coverage.

23
Map of Industrial ParksMap of Industrial Parks
More than 40 Industrial Parks
Both private & public
Greenfield & Brownfield
Access to utilities
Package of services offered by the park administration
Wide variety of activities to be developed
Some created for high-tech activities

6. Investment Legal Framework6. Investment Legal Framework

25
CompetitiveCompetitive TaxationTaxation
Corporate Corporate TaxTax VATVAT
Social ContributionsSocial Contributions
EmployeeEmployee EmployerEmployer
BulgariaBulgaria 10% 20% 12.43% 24-24.7%
RomaniaRomania 16% 19% 17% 30.75-44.75%
HungaryHungary 16% 20% 13.5% 33.5%
PolandPoland 19% 22% 18.71% 17.23-20.12%
SlovakiaSlovakia 19% 19% 13.4% 34.4%
Czech Rep.Czech Rep. 24% 19% 12.5% 35%
SloveniaSlovenia 25% 20% 22.1% 16.10%Source: CEE-CIS Tax Notes - Source: CEE-CIS Tax Notes - PriceWaterhouseCoopersPriceWaterhouseCoopers
Many Central and Eastern European countries reduced Many Central and Eastern European countries reduced considerably their corporate tax in order to diminish the considerably their corporate tax in order to diminish the fiscal burdenfiscal burden

26
New Investment LawNew Investment Law
Incentives for investments in Romania in:
regional development (including infrastructure)
environment protection
research and development
human resources and social inclusion, including
training
Directed according to economic status of
each region
Law expected to be passed by Autumn 2007

7. Potential Sectors for 7. Potential Sectors for DevelopmentDevelopment
28
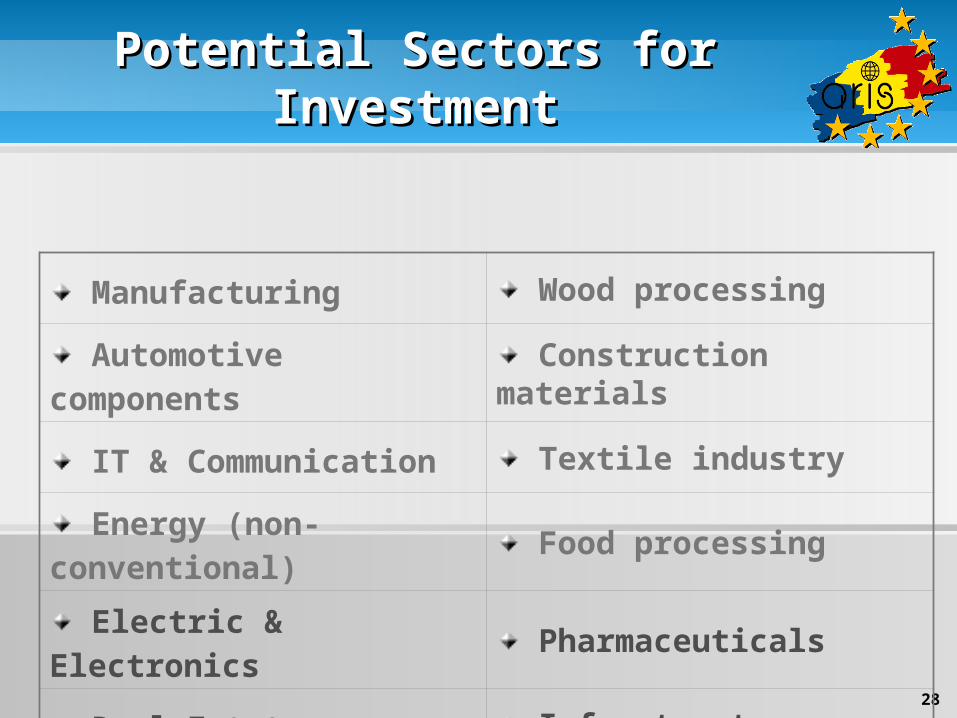
Potential Sectors for Potential Sectors for InvestmentInvestment
Manufacturing Wood processing
Automotive components
Construction materials
IT & Communication Textile industry
Energy (non-conventional)
Food processing
Electric & Electronics Pharmaceuticals
Real Estate Infrastructure

8. ARIS – one stop shop for 8. ARIS – one stop shop for foreign investorsforeign investors

30
WHO is A.R.I.S?WHO is A.R.I.S?
Governmental body under
the authority of Prime Minister
In charge with attracting and
retaining foreign direct investment
Interface between
investors and central & local
authorities
Providing free of charge
SERVICESSERVICES for foreign
investors in Romania
Search and advice on the best location in Romania to fulfill the company' needs
including site search, analysis &
touring around
Search for industrial
and service suppliers
Value added information on
incentives and other
administrative procedures
SERVICES

Thank you Thank you for your attention!for your attention!
tel: +40 21 233.91.03tel: +40 21 233.91.03
fax: +40 21 233.91.04fax: +40 21 233.91.04
email: [email protected]: [email protected]
website: www.arisinvest.rowebsite: www.arisinvest.ro